Article

Research on the Evaluation of Resilience and Influencing Factors of the Urban Network Structure in the Three Provinces of Northeast China Based on Multiple Flows

1
Geographical Sciences School, Liaoning Normal University, Dalian 116029, China
2
Human Settlements Research Center, Liaoning Normal University, Dalian 116029, China
*
Author to whom correspondence should be addressed.
Buildings 2022, 12(7), 945; https://doi.org/10.3390/buildings12070945
Submission received: 7 June 2022 / Revised: 30 June 2022 / Accepted: 30 June 2022 / Published: 2 July 2022

Abstract

:
An important indicator for measuring the resilience and ability of urban networks to recover under external environmental shock, which is essential for the healthy development of the region, is urban network structure resilience. Herein we analyzed the resilience of the urban network structure and explored the influencing factors of resilience in the three provinces of Northeast China. We accomplished this by utilizing the Gephi profiling social network analysis tools based on the Baidu Index, road mileage, statistical data, other multi-source data, construction information, and the transportation, innovation, and economic multiple linkage network. This analysis enabled us to propose relevant suggestions and strategies to optimize urban network structure resilience. Our results indicate that (1) in 2019, the multi-city network structure in the three provinces of Northeast China contains both commonalities and characteristics. Overall, each network demonstrates a spatial distribution pattern of “dense in the north and sparse in the south.” (2) There exist evident hierarchical differences in the resilience characteristics of the multi-city network structure in the three provinces; each provincial capital city and sub-provincial city possesses greater advantages, the innovation network exhibits the most evident hierarchy, the mismatch of the information network is the highest, and the transmission and agglomeration of the economic network are the most prominent. (3) The resilience of the urban network structure of the three provinces is the result of the interaction of several factors. Political and economic factors such as government capacity, economic status, and urban vitality are the main factors affecting the resilience of the network structure.

1. Introduction

Resilience originated in the field of ecology, and its primary meaning is the ability of the ecosystem to develop steadily and sustainably [1]. The term “resilience” was gradually applied to other fields such as sociology and psychology [2]. With the continuous acceleration of globalization, industrialization, and urbanization, the disturbance and impact caused by many uncertain factors on urban development are gradually increasing, such that the scale of resilience research has expanded, and resilience is now being explored in urban and regional research. As such, scholars consider theoretical studies and empirical analysis of regional resilience [3,4,5]; some even believe that a close relationship between urban network structure and regional resilience exists [6,7]. As a new urban geographic system, an urban network constitutes a group of cities in a particular region among which there is a flow of information, material, and energy, thereby making these cities nodes [8]. A typical form of spatial characteristics of resilience is the resilience of the urban network structure; hence, the analysis of the ability of the urban network systems to resist, adapt, recover, and maintain their original state under external environmental shocks via inter-city collaboration in ecological, social, economic, and engineering fields is essential [9,10].
A networked urban geographic system is a prerequisite for exploring the resilience of the urban network structure. The spatial organization of cities has changed with the development of an information-based society, and economic globalization has made the relationship among cities increasingly complex. The “space of place” has been replaced by “space of flow,” and the urban networks have gradually become a new perspective for studying urban systems [11,12]. Scholars have explored the structural characteristics, evolutionary trends, and influencing factors of urban networks, including enterprise networks [13,14,15], airline networks [16,17], logistics networks [18], freight networks [19], and information networks [20,21,22]. Presently, the increasingly complex social environment, urban connectivity, and diverse economic structures have made it essential to enhance the capability of urban networks to cope with shocks for maintaining sustainable regional development [23]. Existing studies have shown that indicators such as network efficiency, diversity, and connectivity can effectively characterize the resilience of urban network structures [24,25,26]. Unpredictable, uncertain, and frequent natural and man-made disasters can affect urban nodes to a certain extent or can even fail, which can lead to the failure of urban networks and affect the sustainable development of a region [27]. In this regard, building and strengthening the resilience of urban nodes for coping with external environmental shocks has become a key issue that needs to be addressed urgently [28]. Presently, the gradual spread of COVID-19 in the urban network has significantly impacted the healthy development of the region, such that the sudden virus outbreak has reinforced the importance of strengthening the construction of resilient cities and enhancing the structural resilience of urban networks. Meanwhile, the regional cooperation mechanism adopted by China to cope with COVID-19 demonstrates that mutual collaboration among cities in response to external environmental shocks can create a good network synergy [29].
Previous studies provide few empirical results on the resilience of the urban network structure, which still needs to be explored and improved. Meanwhile, most of the existing studies focus on assessing the resilience of the urban network structure and the analysis of optimization strategies, and the discussion on the influence mechanism of urban network structure resilience is insufficient [30]. As the three provinces of Northeast China are located in the center of Northeast Asia and occupy an important strategic position in the development pattern of China, it is significant to analyze the resilience of the urban network structure in the three provinces of Northeast China. In light of this, we take the three provinces as our study area to construct a multi-linkage network through multi-source data and evaluate the characteristics of the resilience of the urban network structure from the four perspectives of hierarchy, matching, transmission, and agglomeration. We explore the influencing factors of urban network structure resilience and propose appropriate optimization strategies as relevant references and theoretical bases for enhancing the resilience of urban networks by adjusting the spatial organization of cities and optimizing the allocation of resources.

2. Research Data and Methods

2.1. Study Area

We selected the three provinces of Northeast China as the research area to conduct empirical research. The primary reasons for choosing this area are as follows: (1) As one of the four major economic sectors in China, the regions are connected by the three provinces by relying on the development axis of “Harbin–Changchun–Shenyang–Dalian”. As such, affected by geographical proximity and collective rooting, these provinces have close ties with each other. Simultaneously, certain exchanges and cooperation are maintained among them, such that socio-economic ties among the prefectures are characterized by crossover, overlap, and integration, and have strong characteristics of regional integrity. (2) As a complete and independent economic zone, the regional development of the three provinces of Northeast China occupies an important position, and as the window for China’s opening to Northeast Asia, coping with the impact of the external environment in the context of the unstable growth of trade globally, is an important challenge for the urban network structure of the three provinces. Hence, we selected the three provinces of Northeast China as our study area, including Heilongjiang, Jilin, and Liaoning Provinces. Among them, the Daxinganling region of Heilongjiang Province and the Yanbian Korean Autonomous Prefecture of Jilin Province were not included in the research due to missing data. Therefore, a total of 34 prefecture-level cities were considered (Figure 1).

2.2. Data Source

The data in this article mainly include four parts (Table 1): (1) Baidu Index data, mainly from the official website of Baidu Index search (http://index.baidu.com, accessed on 20–23 June 2021). We used the 34 prefecture-level cities as search keywords to obtain the attention data between two cities at a time in the three provinces from 1 January to 31 December 2019. On this basis, the daily average value was obtained by sorting the data, which was used to characterize the strength of information connection among cities; (2) mileage data, including highway mileage and train and railway mileage, where highway mileage data were searched through the official website of Baidu Map (https://map.baidu.com, accessed on 26 June 2021) to obtain the highway mileage among 34 cities, and railway mileage data were retrieved based on the railway mileage search website of the train ticket network (http://www.huochepiao.com/licheng/, accessed on 28 June 2021) to obtain the railway mileage between two cities; (3) Paper co-author data, mainly from the Web of Science database (http://webofscience.com, accessed on 3–5 July 2021), were retrieved from the number of co-authored journal papers between two cities in 2019 to characterize the intensity of innovation linkage among cities; (4) statistical data, mainly from Liaoning Province Statistical Yearbook 2020, Jilin Province Statistical Yearbook 2020, and Heilongjiang Province Statistical Yearbook 2020.

2.3. Multi-City Network Construction Method

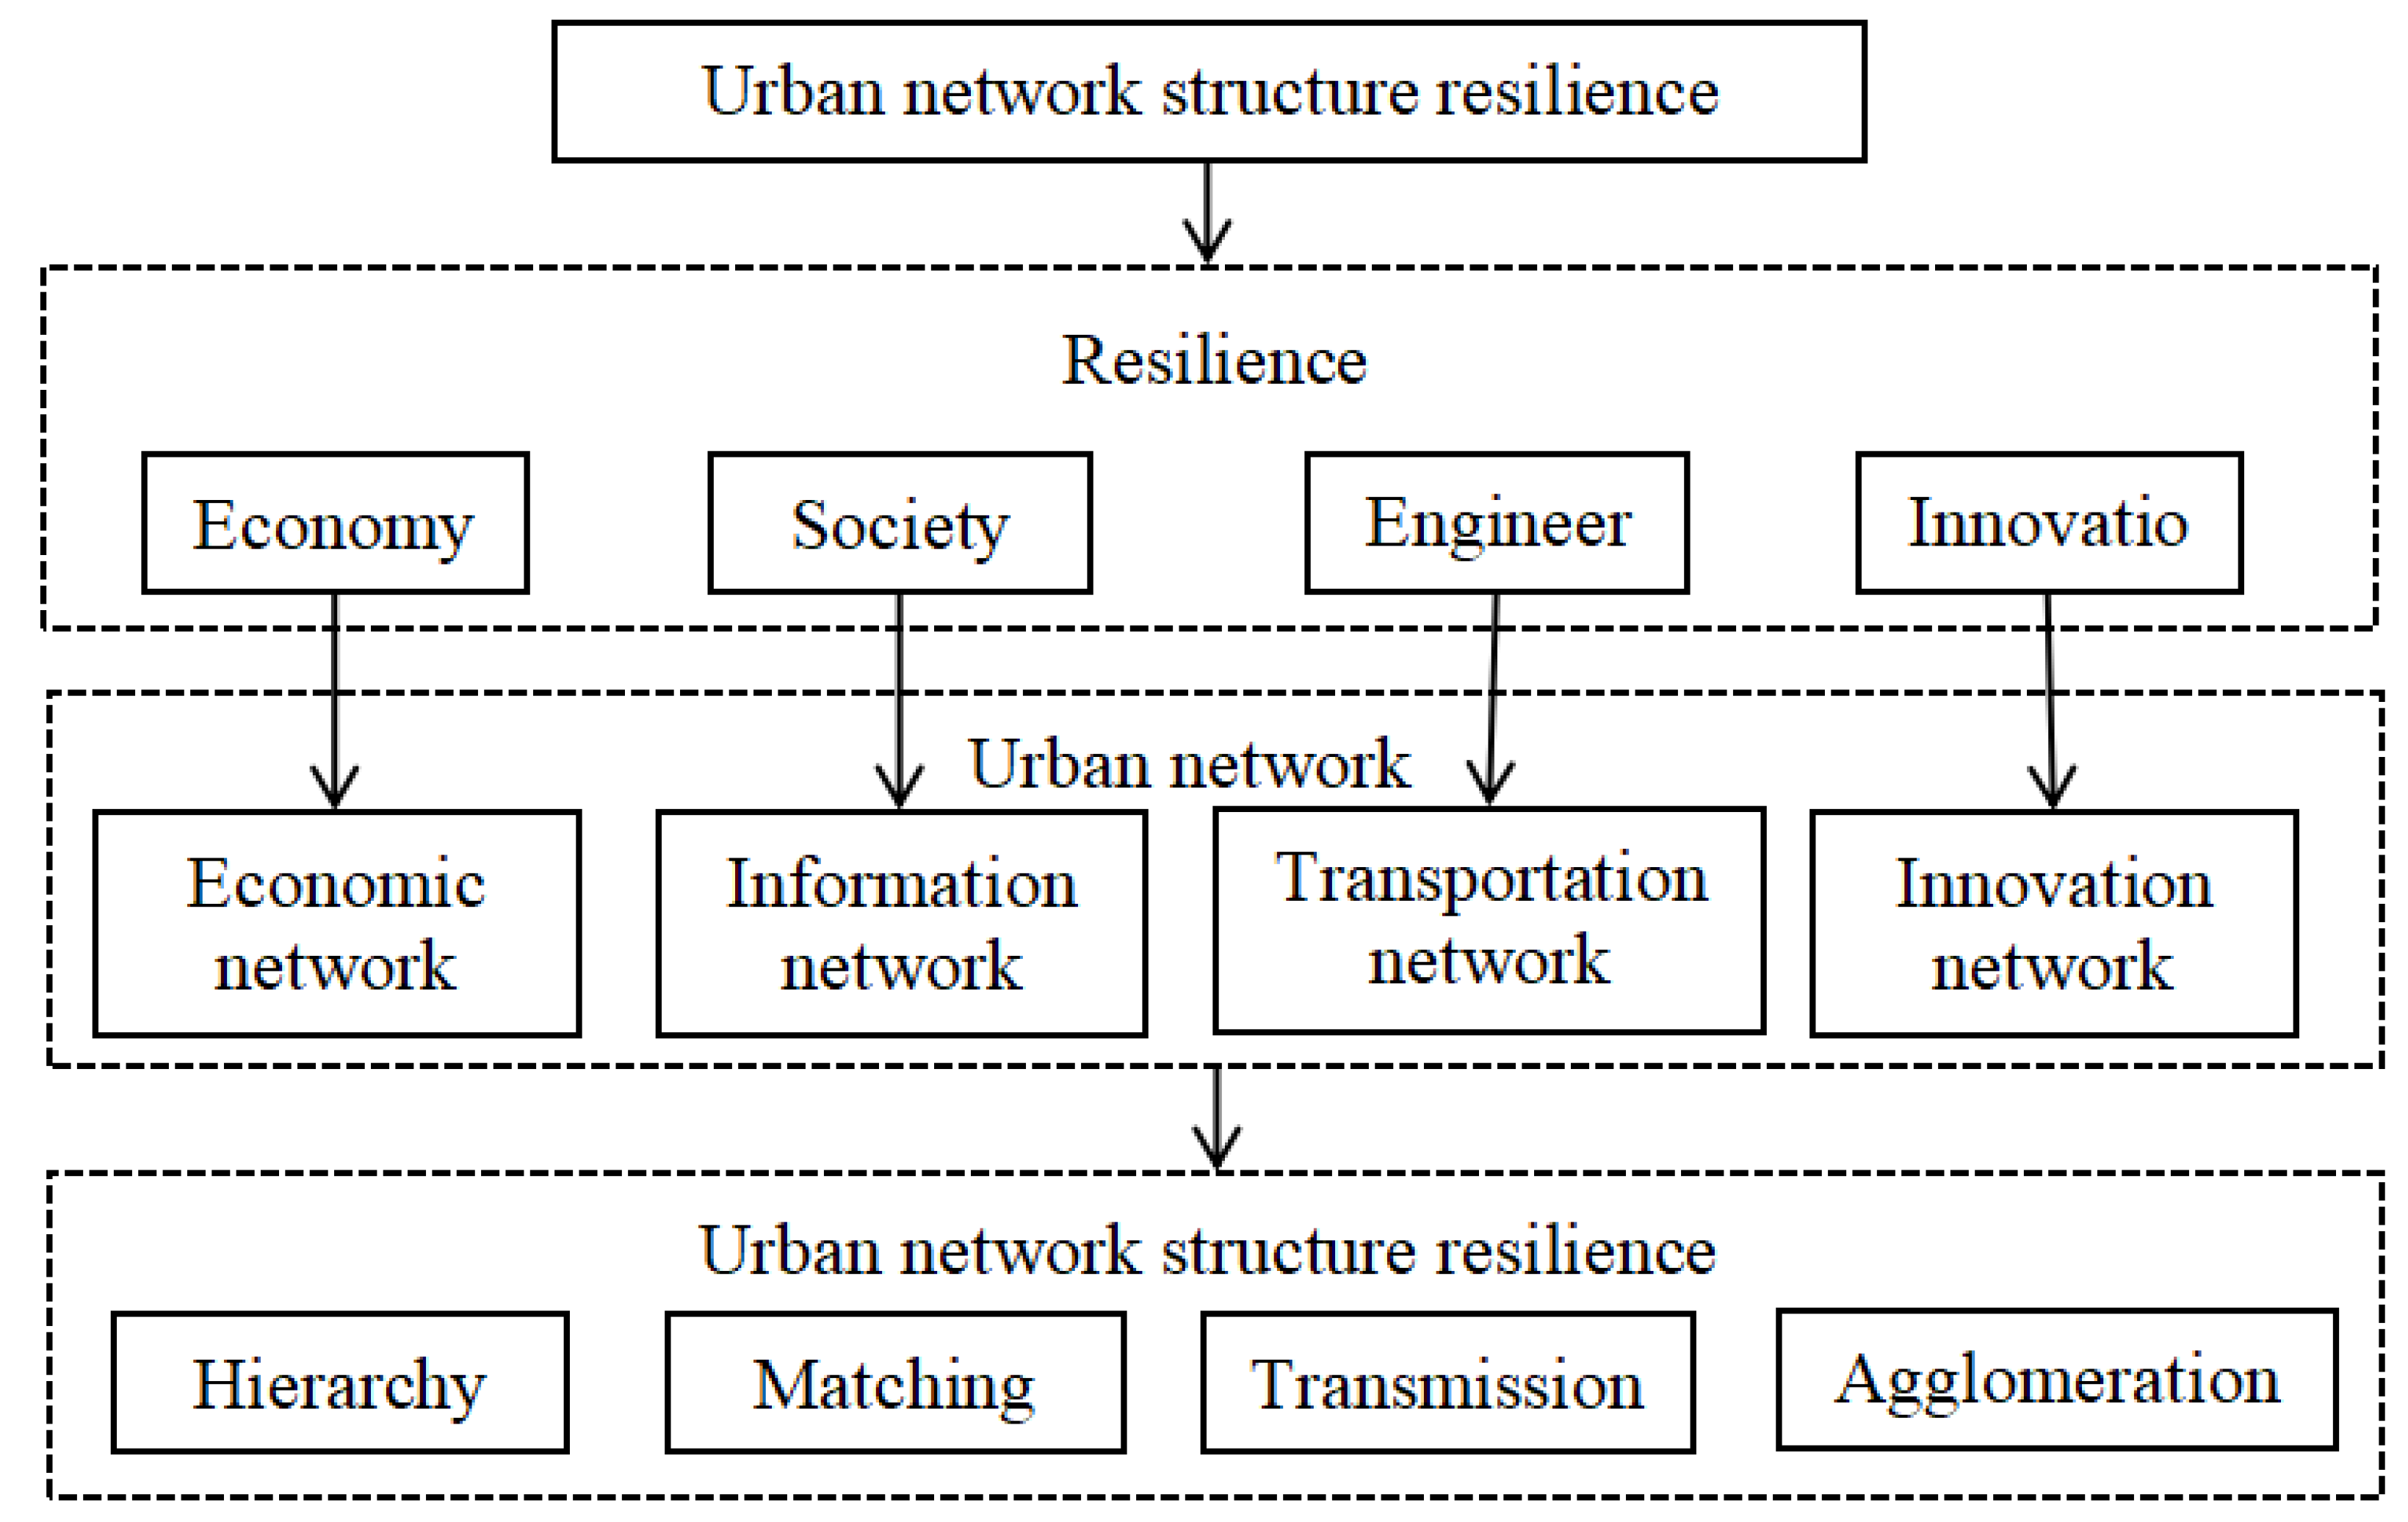
A prerequisite for exploring the resilience of the urban network structure is the construction of multiple urban networks. In general, regional resilience contains four major domains: ecological, economic, social, and engineering [31,32,33]. Furthermore, because the research object of this study is the urban network, the ecological domain is considered a substrate of urban construction and development without considering the construction of the corresponding urban network [9]. In addition, cities are the spatial carriers of innovation, such that the innovation cooperation among cities can effectively reflect the regional development capacity [34,35]. Therefore, the innovation domain is considered to be included in the construction of urban networks. To sum up, based on the four domains of economy, society, engineering, and innovation, we constructed the connection network of economy, information, transportation, and innovation. We measured the hierarchy, matching, transmission, and agglomeration of multiple urban network structures. This enabled us to evaluate the resilience of the urban network structure in the three provinces of Northeast China (Figure 2).

2.3.1. Information Network

The information connection network among cities is represented in the form of the Baidu Index product between cities, the formula for which is [36]:
I = I i j × I j i
where I is the information connection strength, Iij is the Baidu attention value of city i to city j, and Iji is the Baidu attention value of city j to city i.

2.3.2. Transportation Network

Considering that roads and railroads are the primary modes of transportation among cities in the three provinces of Northeast China, we constructed the transportation connection network based on the law of gravity with the formula [10]:
T = K i j × ( P i N i × P j N j ) / D i j 2
In the formula, T is the strength of transportation connection, Kij is the gravitational coefficient, which takes the value of 1, Pi and Pj are the number of economically active populations in city i and city j, Ni and Nj are the GDP of city i and city j, and Dij is the sum of the highway and railway mileage between city i and city j.

2.3.3. Economic Network

Referring to previous research [37], the employed population G in the urban area is chosen to represent the urban functional capacity, and the value of location entropy of a sector’s employees in a city determines whether the city has an outward function, and the location entropy Lqij of employees in department j in city i is presented as follows:
L q i j = ( G i j / G i ) / ( G j / G )     ( i = 1 , 2 , , n ;   j = 1 , 2 , , m )
where, if Lqij < 1, the department does not have an export-oriented function and Eij = 0. If Lqij > 1, the department has an export-oriented function, and, at this time, the export-oriented function Eij of department j in city i is as follows:
E i j = G i j G i * ( G j / G )
Total outward function Ei of m departments in city i:
E i = j = 1 m E i j
Functional efficiency Ni of city i:
N i = G D P i / G i  
The amount of outward function impact of city i:
F i = E i × N i  
On this basis, the economic network is constructed based on the gravity model:
R = ( F i × F j ) / D i j 2  
where R is the strength of economic connection, Fi and Fj are the amounts of the outward functional influence of city i and city j, and Dij is the linear distance between city i and city j.

2.3.4. Integrated Network

The TOPSIS method based on the entropy weight method combines the entropy weight method with the TOPSIS method to avoid the influence of subjective weight assignment on analysis structure. Therefore, we chose the entropy weight TOPSIS method to construct the integrated network [38].

2.4. Urban Network Structure Resilience Measure

Based on relevant research [25,39,40], with the help of the complex network analysis method, the resilience of the urban network structure in the three provinces of Northeast China was assessed from the perspectives of hierarchy, matching, transmission, and agglomeration (Table 2).

2.4.1. Hierarchy

Hierarchy can characterize the rank of urban nodes in the network and degree, whereby degree distribution can measure the hierarchy of nodes in the urban network structure [41]. Nevertheless, this has the drawback of ignoring the functional relationship among urban nodes. Therefore, the weighted degree and weighted degree distribution are used to measure the hierarchical resilience of the urban network structure considering the urban network weights. The formula for this is [32]:
W i = C ( W I * ) a
The formula is processed as follows:
l n ( W i ) = l n ( C ) + a l n ( W i * )
where Wi is the weighted degree of city i, Wi* is the ranking of the weighted degree of city i in the network, C is a constant, and a is the slope of the weighted degree distribution curve. The higher the slope, the more evident the hierarchy of the urban network [32].

2.4.2. Matching

Matching reflects the degree of correlation among urban nodes. As the degree of connection among urban nodes is not equivalent, preferential attachment makes the connection among urban nodes correlated. Based on the results of hierarchical calculation, the urban nodes with a large weighted degree tend to “clump” together, which indicates that the network is homogeneous; however, in reality, it is heterogeneous [32]. This is also the case with the homogeneity network relative to the different distribution of the network; it is more easily affected by curing the contact path. Its innovation, low permeability, and external shocks make it difficult to guarantee a quick update and change, leading to increased risk. Hence, the structure’s resilience in the matching of urban networks is lower [42]. On this basis, the weighted degree correlation is applied to measure the matching resilience of the structure of the urban network. The formula is as follows [30]:
N W i ¯ = 1 K i i G i W k             N W i ¯ = D × W k b
where N W i ¯ is the neighbor-weighted average degree (NWAD) of city i, Wk is the weighted degree of neighbor node k of city i, Ki is the degree of city i, Gi is the set of neighbor nodes of city i, D is a constant, and b is the weighted degree correlation coefficient. Among them, if b > 0, it indicates that the network has homogeneity; however, the network has heterogeneity.

2.4.3. Transmission

Transmission measures the ability of urban nodes to spread and diffuse in the network through path length, such as the shortest path length [43]. Combined with existing research, this study uses network efficiency to measure the transmission resilience of urban network structures. The formula is [44]:
E = 1 N ( N 1 ) i j G 1 D i j
where E is the network efficiency, Dij are all the shortest paths from city i to city j, N is the number of nodes in the network, and G is the set of the remaining nodes in the network after removing the nodes.

2.4.4. Agglomeration

Agglomeration can characterize the nature of grouping urban network nodes. Generally, the stronger the connection among urban nodes, the larger the value of the clustering coefficient of urban nodes. The local clustering coefficient ignores the importance of urban nodes in the weighted network; thus, we consider using the local weighted clustering coefficient to measure the structure agglomeration resilience of the urban network. The formula for this is [45]:
C i w = 1 k i ( k i 1 ) j , k ( w i j ^ w i k ^ w j k ^ ) 1 3
where C i w is the local weighted clustering coefficient, k i is the number of neighbors of node i, and wij, wik, and wjk are the weights of the edges among nodes, which are processed using the network maximum weight standardization method. The more urban transmission among nodes and the stronger the interaction capabilities, the higher the dependence among nodes, the less “robust” the network is, the less the city’s ability to resist interference from the outside world is, and the more network connections will be disrupted in the event of any local outage; as such, the local weighted clustering coefficient’s numerical size and the network structure are inversely proportional to the level of resilience [46].

3. Evaluation of Urban Network Structure Resilience in the Three Provinces of Northeast China

3.1. Spatial Pattern of the Urban Network Structure

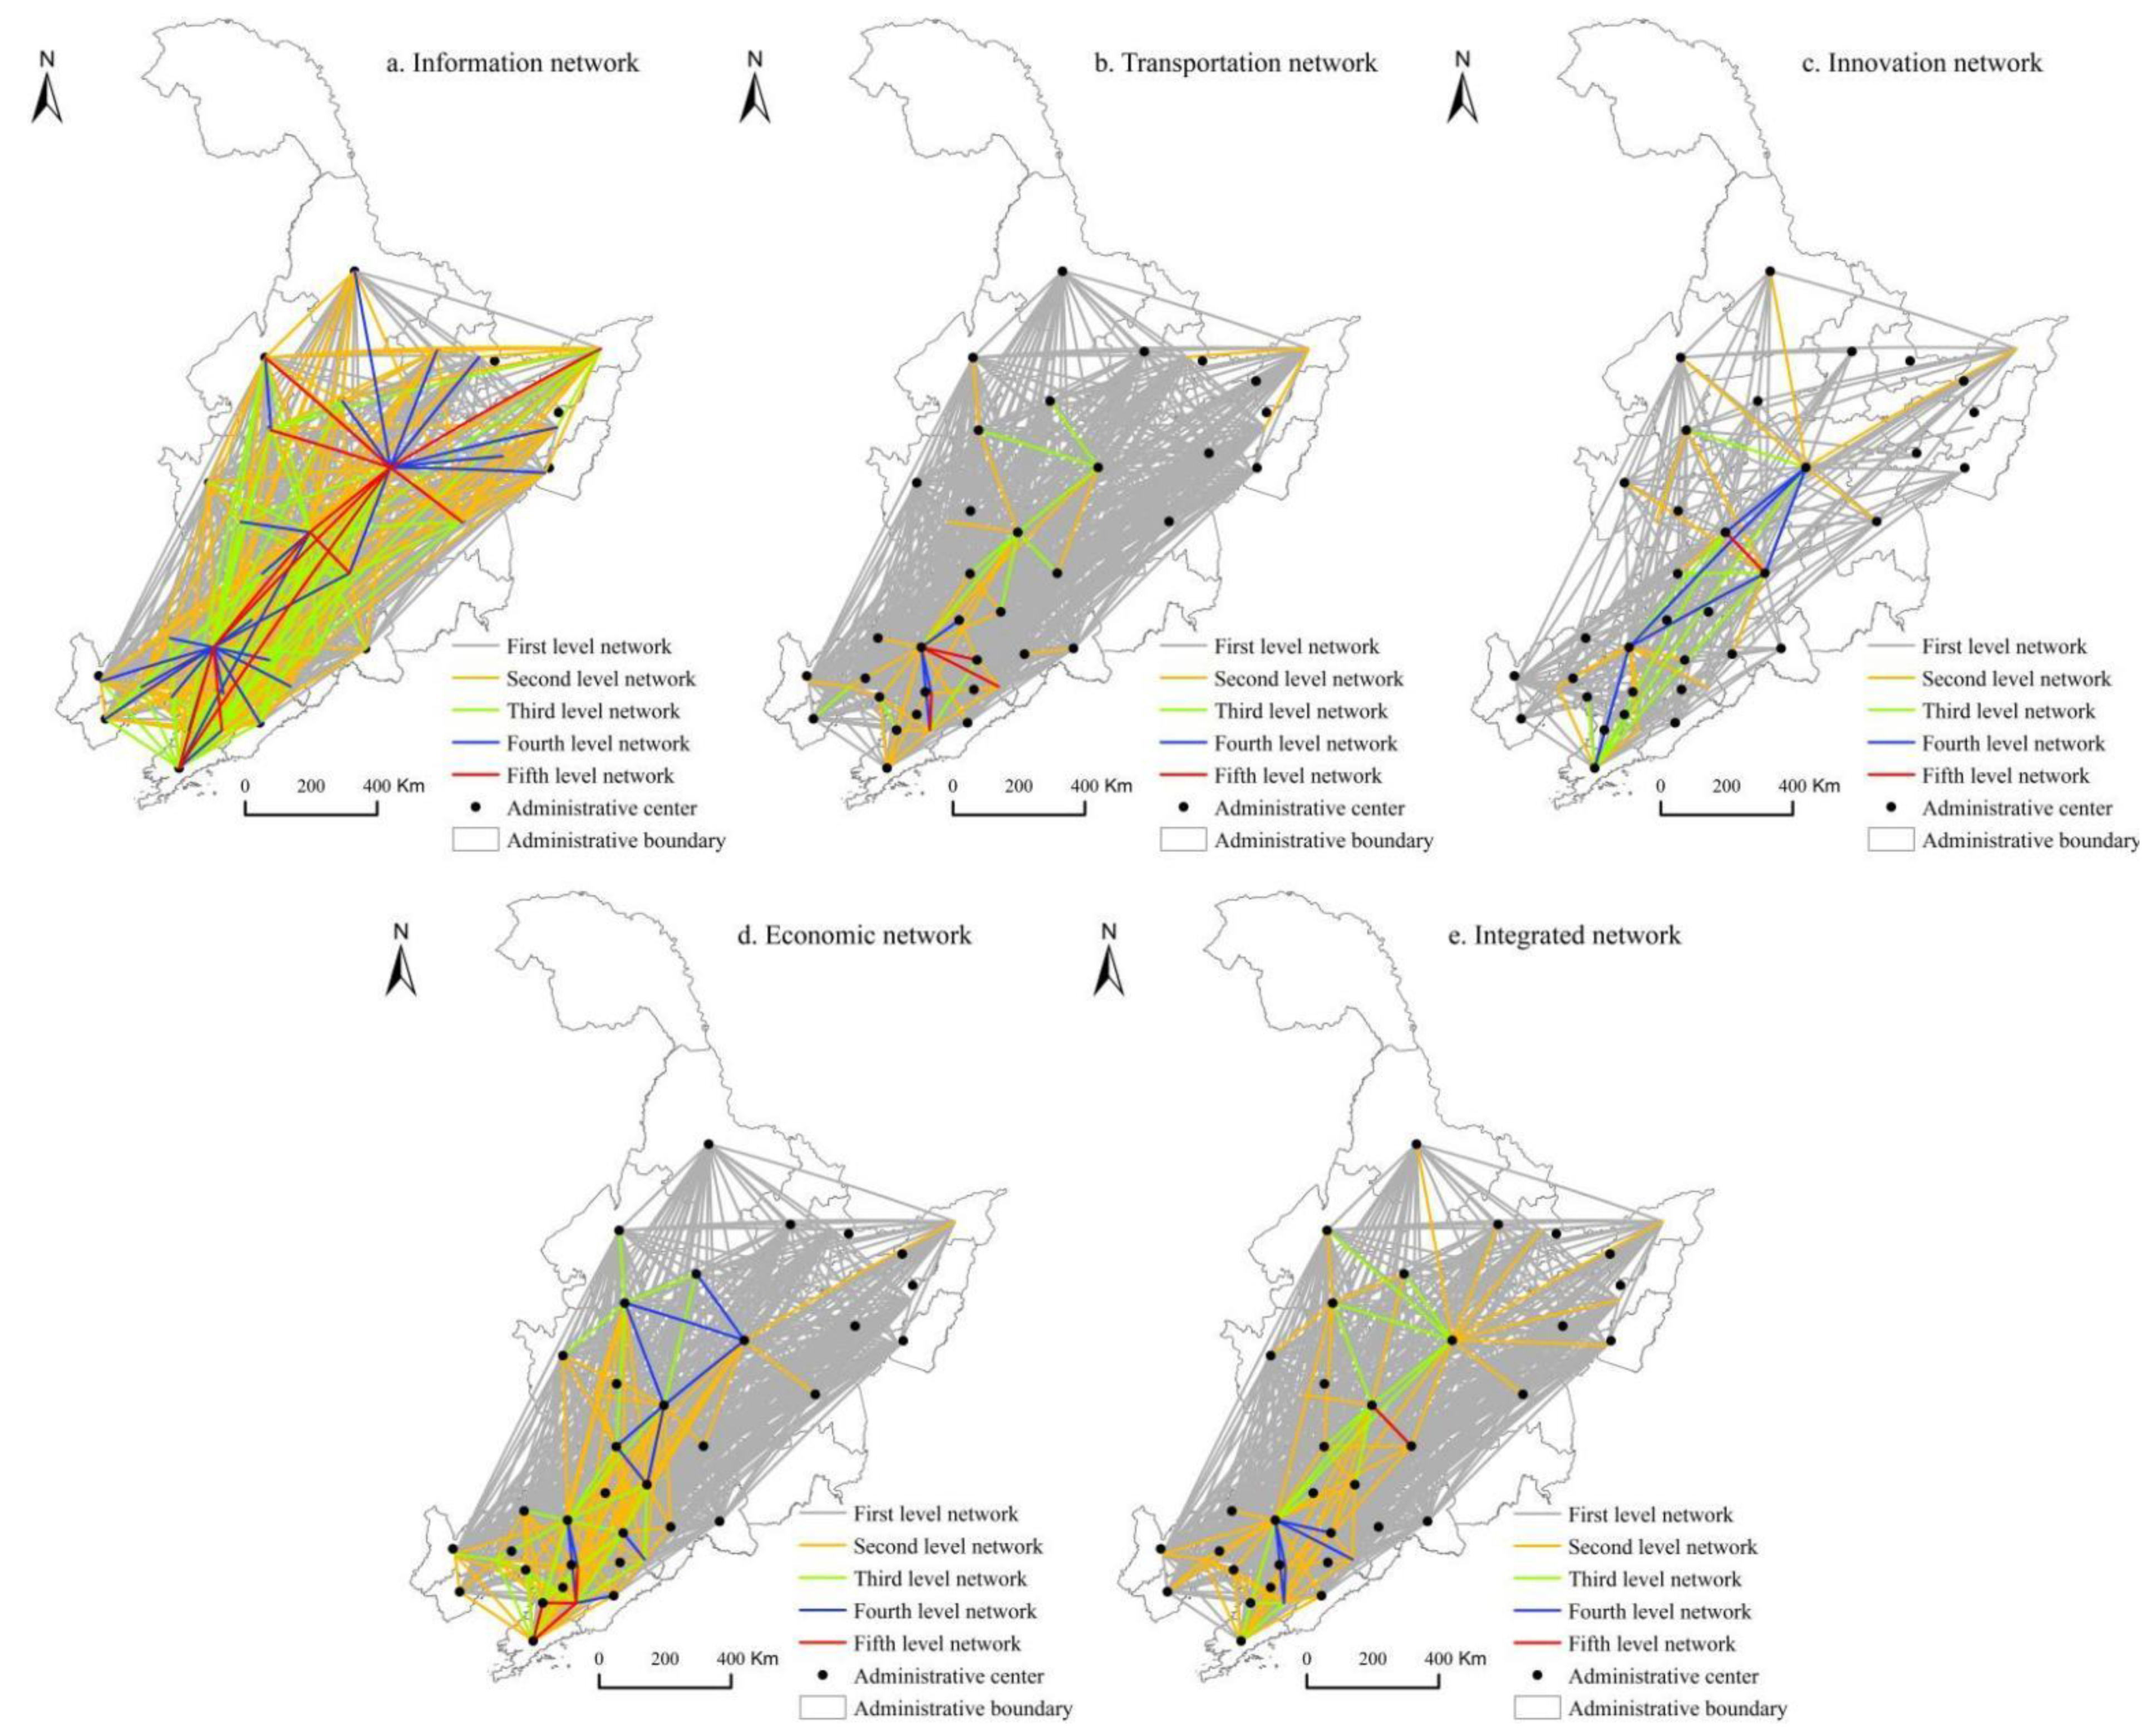
Based on the information of the connection matrix, transportation connection matrix, innovation connection matrix, and economic connection matrix, the multiple connection networks were classified according to the natural breakpoint method. Further, ArcGIS was used to realize spatial visualization and draw the multiple network connection distribution maps (Figure 3). Through the Quadratic Assignment Procedure (QAP) correlation analysis in UNICET (Table 3), we found that the correlation coefficients among the information network, transportation network, innovation network, and economic network are significantly correlated at the 1% level, indicating that the multiple urban networks in the three provinces of Northeast China exhibit strong correlation characteristics. Among them, the correlation between the transportation network and the economic network is the highest (0.610), and the correlation between the innovation network and the economic network is the lowest (0.307); this indicates that there are certain similarities among the multiple urban networks in the three provinces, but, at the same time, high differences also exist. Hence, it is necessary to further explore the structure resilience characteristics of each network.
In order to reflect the urban network spatial pattern of the three provinces in Northeast China more clearly, the natural breakpoint method is used to classify the element connections between cities, and ArcGIS is used to visualize them [10]. The urban networks in the three provinces demonstrate an overall spatial pattern of “dense in the north and sparse in the south”, but each network also has different characteristics (Figure 3). The urban information network has a multi-center network structure with Shenyang, Dalian, Harbin, and Changchun as the core (Figure 3a), whereby the first level constitutes a “cross” spatial pattern, showing a more complex network pattern than other networks. The difference of the urban transportation network is more evident (Figure 3b), influenced by spatial proximity, such that the first level of the transportation network is mainly the connection among Shenyang-Fushun, Anshan-Liaoyang, and Shenyang-Benxi, and the fifth level mainly constitutes the connection among urban nodes. The overall connection of the urban innovation network is looser than that of other networks, and the connections among city nodes are relatively weak (Figure 3c). The intra-provincial linkage of the innovation network is closer, and the cross-provincial linkage is mainly between provincial capital cities and sub-provincial cities. The first level of the urban economic network in Liaoning Province presents an “N”-shaped structure, with closer intra-provincial ties and closer inter-provincial ties than the transportation network and innovation network (Figure 3d). The connections among urban nodes in the integrated network are more complicated than those in other networks, and the connections among cities are closer, and the urban network structure is more robust (Figure 3e).

3.2. Urban Network Structure Resilience

3.2.1. Network Hierarchy

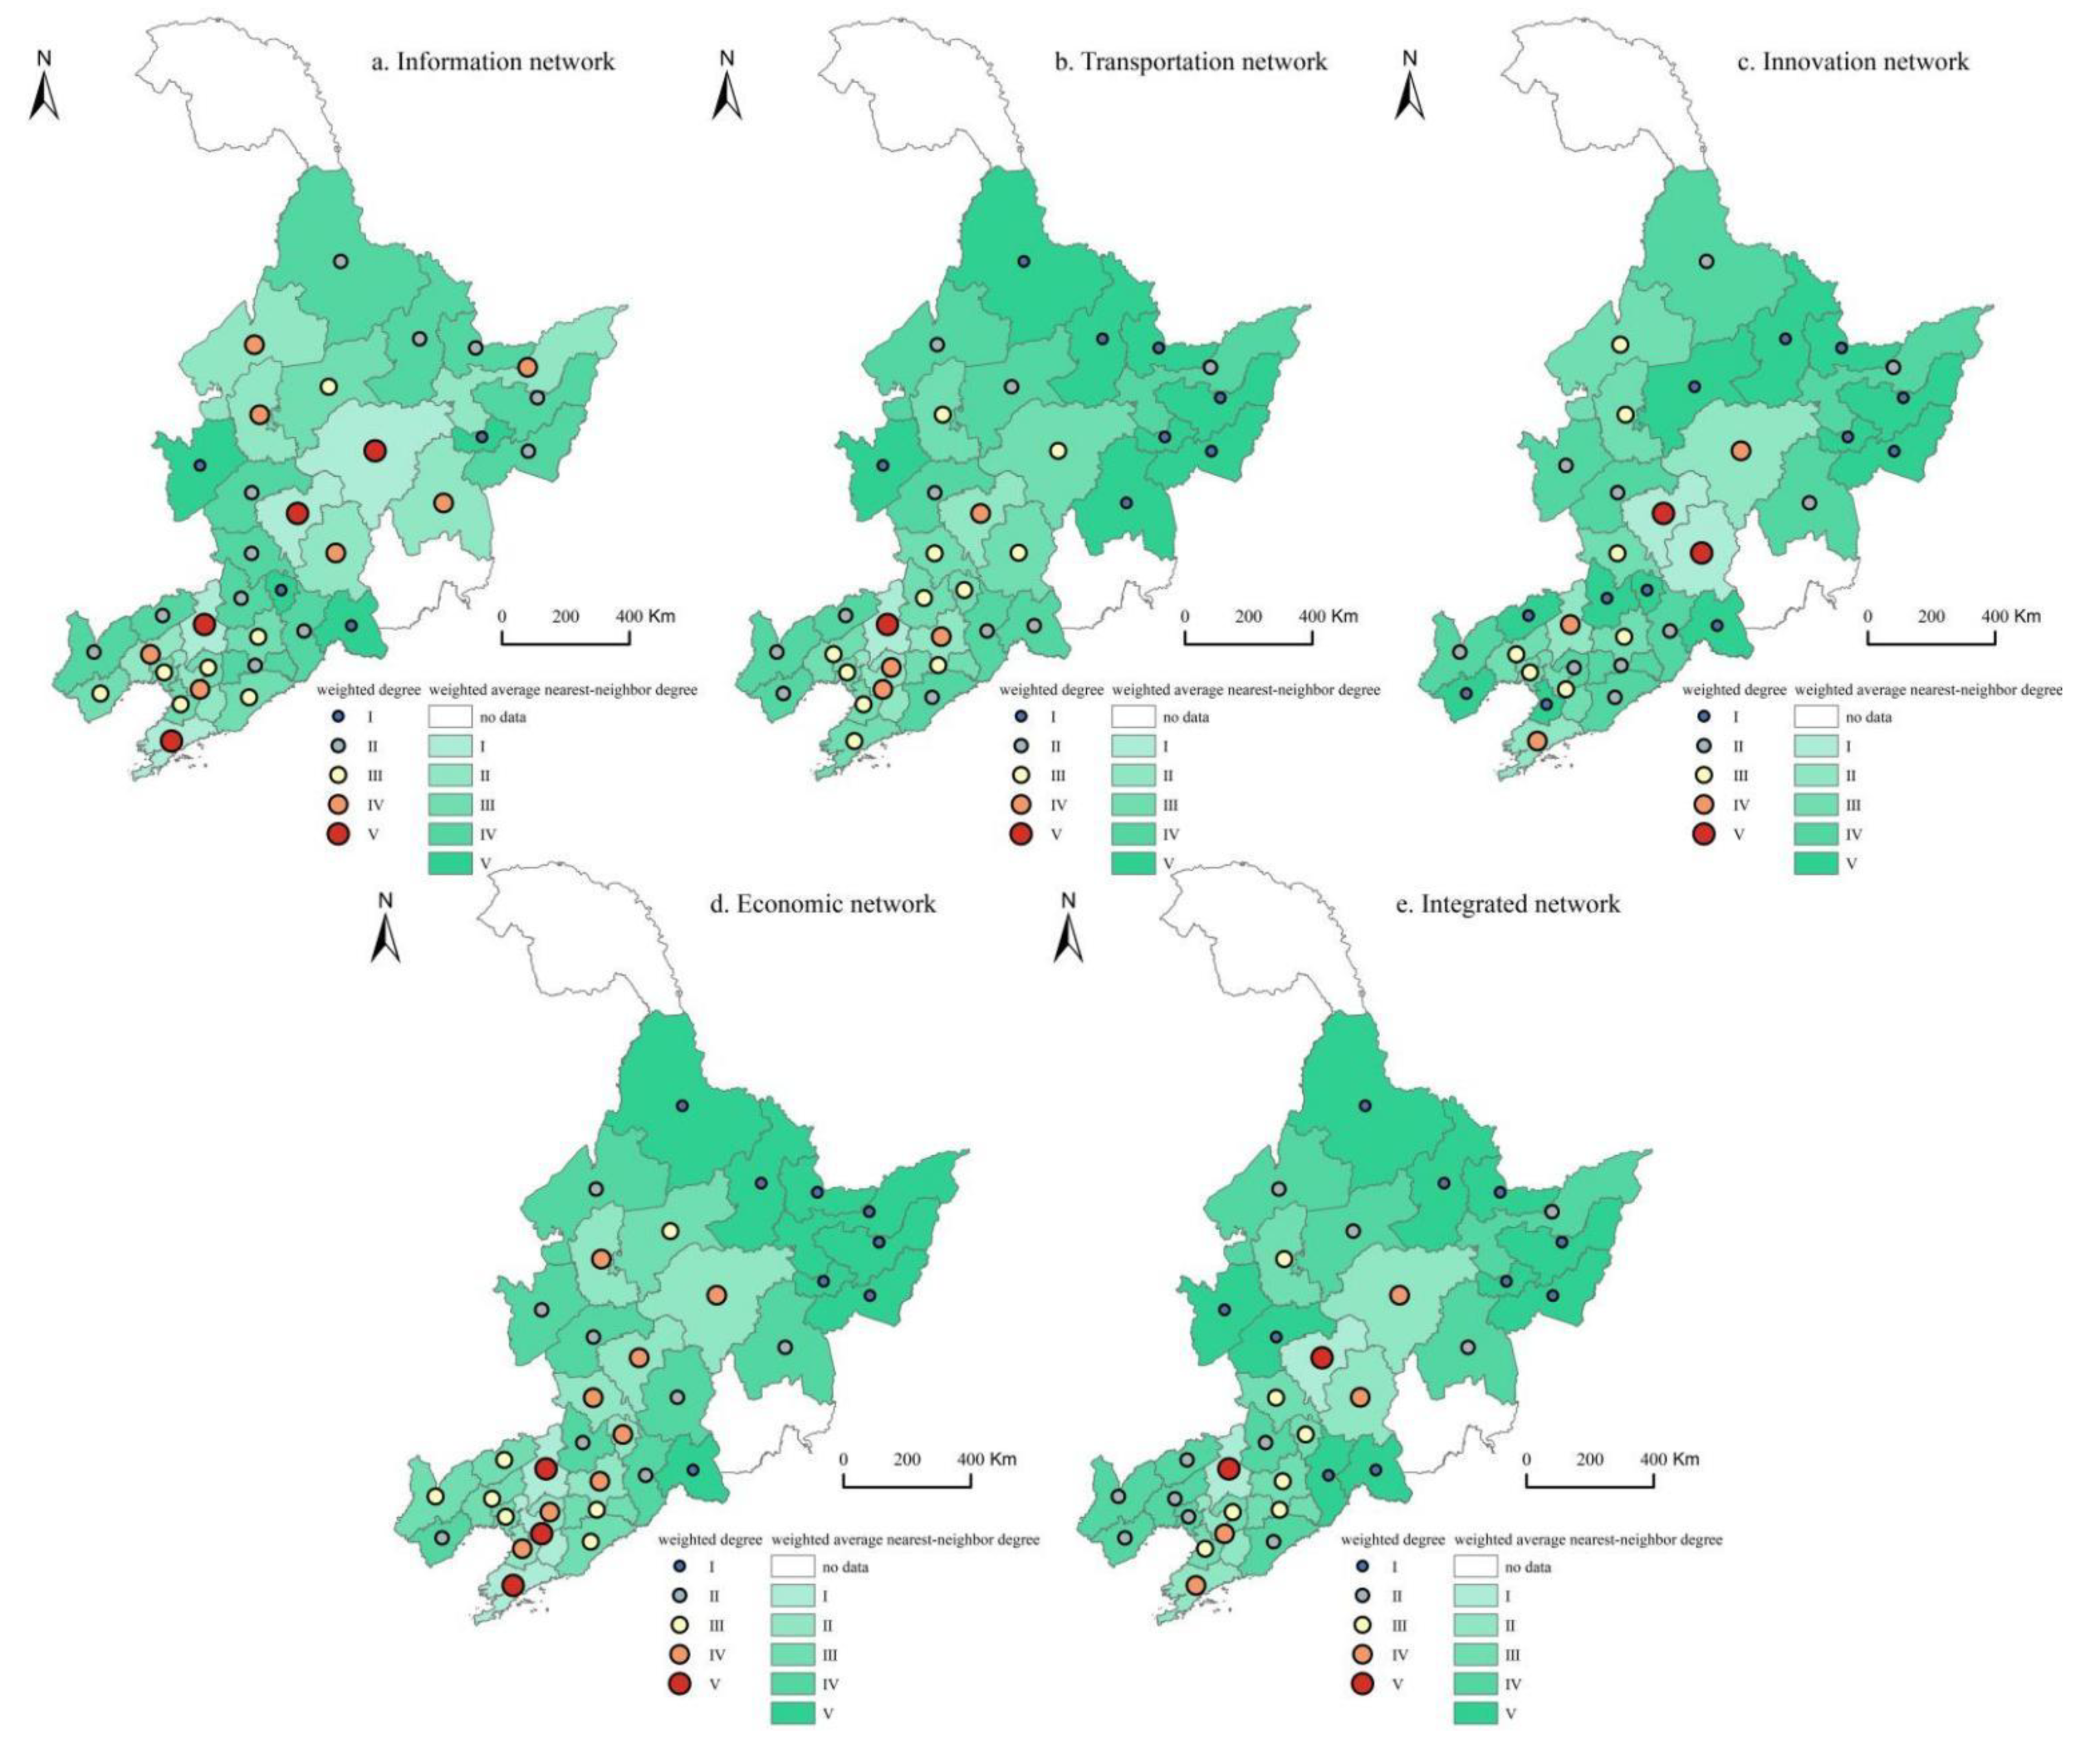
Urban nodes with strong radiation and dispersal capabilities in the information network and transportation network are mainly Harbin, Changchun, Shenyang, and Dalian, indicating that the provincial capital cities and sub-provincial cities are leading in terms of socio-economic development, and the rest of the cities are dependent on them owing to their spatial proximity and radiation-driven effects, resulting in a high hierarchy of city nodes around them (Figure 4a,b). The cities with a high hierarchy in the innovation network are Changchun and Jilin, which form a single core pattern in space with evident polarization characteristics (Figure 4c). The spatial distribution of economic network hierarchy shows a “ridge-type” trend with “Harbin–Changchun–Shenyang–Dalian” as the axis, decreasing from the middle to both ends (Figure 4d). In the integrated network, the urban nodes located at the fifth level are mainly Harbin, Changchun, Shenyang, Dalian, and Anshan, and a spatial axial development trend is evident (Figure 4e).
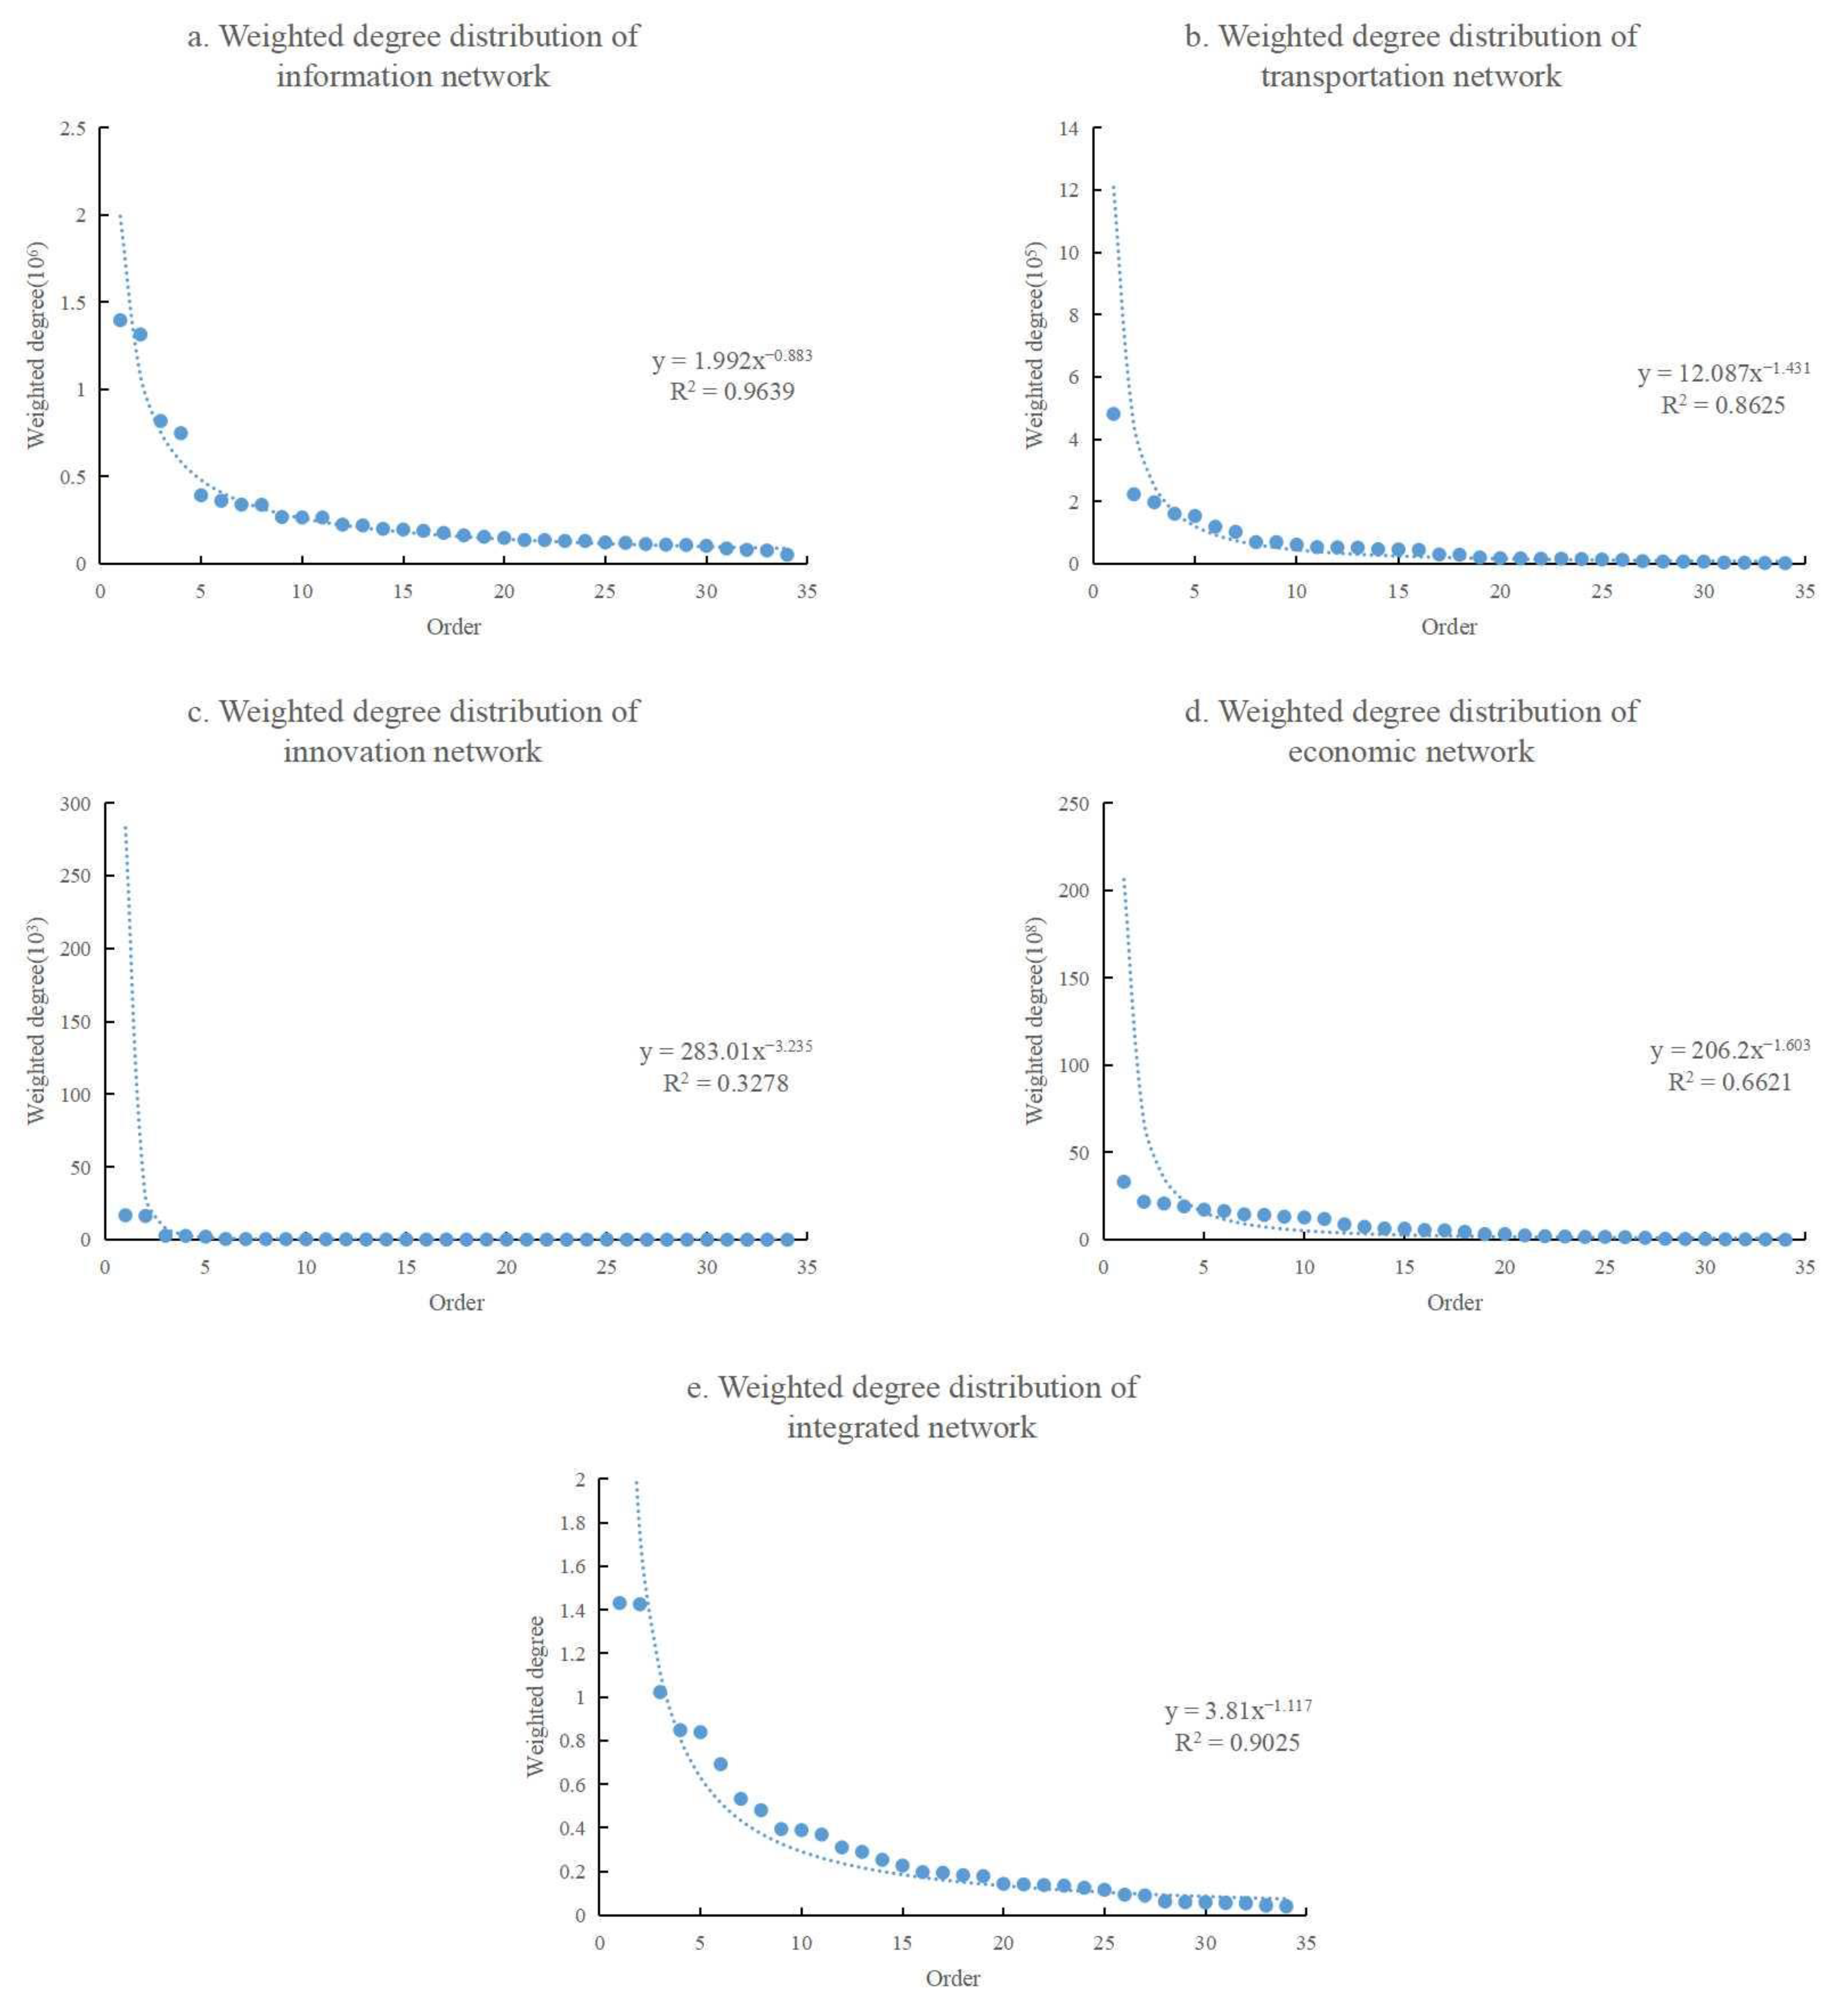
We drew the weighted degree distribution fitting curve according to the weighted degree calculation results of each urban node (Figure 5). From the slope of each curve (0.883 < │a│ < 3.235), we can determine that all kinds of networks have strong hierarchical characteristics. Among them, the curve slope of the innovation network has the largest value (│a│ = 3.235), which indicates that the innovation network has the highest hierarchical level, the core position of the urban node is more prominent, and the three-dimensional development trend of the innovation network is evident. The curve slope of the economic network has the second highest value (│a│ = 1.603), indicating that the network has a more evident hierarchical structure of urban nodes. The transportation network (│a│ = 1.431) and the information network are less hierarchical (│a│ = 0.883), and the high-value areas are mainly provincial capitals and sub-provincial cities, which show spatial homogeneity. The slope of the integrated network curve (│a│ = 1.117) is relatively smooth compared with that of the innovation, economic, and transportation networks, indicating that the degree of external connection of urban nodes under the integrated network is relatively reasonable, and the difference in the hierarchical level among urban nodes is not significant; relatively speaking, the integrated network shows a flat development.

3.2.2. Network Matching

The NWAD values of urban nodes with higher hierarchy in each urban network are smaller (Figure 4). In the integrated network, the number of urban nodes with NWAD in the first group is the largest, and they are mainly the urban nodes with higher values of weighting degree, which, to some extent, indicates that there are more communication and contact paths between the core urban nodes and other urban nodes, which is more conducive to the flow of elements among nodes.
The weighted degree correlation of all five types of network coefficients is negative (−0.041 < b < −0.008), indicating that the information, transportation, innovation, economic, and integrated networks all have heterogeneous characteristics. Among them, the information network has the most evident heterogeneity (b = −0.041), and the urban nodes with higher weighted values can maintain good interaction with the nodes at the same level and can also communicate and cooperate with the urban nodes at different levels. The transportation network has strong heterogeneity (b = −0.027), and the city nodes with evident transportation advantages have a radiating and driving effect on their neighboring cities. In addition, the well-connected transportation network also contributes to the development of regional linkages, and the path connections among city nodes tend to be heterogeneous. The heterogeneity characteristics of the economic network are weak (b = −0.015), with strong mobility of economic factors among core cities but weak mobility of economic factors among peripheral cities, with significant spatial differences in the intensity of the flow of economic factors and the low structural resilience of the economic network. The heterogeneity of the innovation network is not evident compared with other networks (b = −0.008), and the phenomenon of homogeneous grouping exists, the connection among nodes in core cities and nodes in peripheral cities is weak, and the cross-regional exchange and cooperation regarding the innovation factor flow are restricted. The combined network heterogeneity is lower than that of the information network and higher than that of the transportation, economic, and innovation networks (b = −0.025), indicating that there may be a certain degree of bias in measuring the structural resilience of urban networks based on a single factor flow. The combined effect of multiple factor flows can enhance the “robustness” of the connection paths among urban nodes to some degree and jointly improve the level of the urban network.

3.2.3. Network Transmission and Agglomeration

The spatial difference of the economic network transmission is the most evident, followed by that of information, integrated, and transportation networks. Meanwhile, the innovation network transmission has the smallest spatial variability (Figure 6), in which the information network transmission shows an overall hierarchical structure that increases from south to north. Moreover, the spatial pattern of the transportation, economic, and integrated network transmission has a certain similarity, and the innovation network transmission has a multi-core distribution pattern. Shenyang exhibits the most significant influence on the transmission of the information and innovation networks. In the information network, there are three groups that have the same degree of influence on the network transmission after the failure of city nodes: Songyuan and Baicheng, Qiqihar and Jixi, and Mudanjiang and Heihe; the degrees of influence are 0.3808, 0.3818, and 0.3836, respectively. Two groups of cities in the innovation network have the same impact on the innovation network transmission: Anshan and Jinzhou, Baishan and Jixi; the network efficiency after the failure of the city node is 0.4363 and 0.4484, respectively, and the network efficiency after the failure of city nodes in Changchun contributes the most to the transport network transmission, while Anshan, Suihua, Fushun, Tieling, Yingkou, Benxi, Tonghua, and Mudanjiang have the same degree of influence on the network efficiency, at 0.1467, 0.1485, 0.1488, and 0.1491, respectively. The urban node that bears the main transmission function in the economic network is Harbin, in which, the cities of Tonghua-Dandong and Jilin-Jixi-Hegang have equivalent influence on the transmission of the economic network, and the network efficiency after the failure of the city node is 0.6139 and 0.6169, respectively. In the integrated network, Shenyang is the city node that undertakes the main transmission function, and Qitaihe and Baishan have the lowest transmission function.
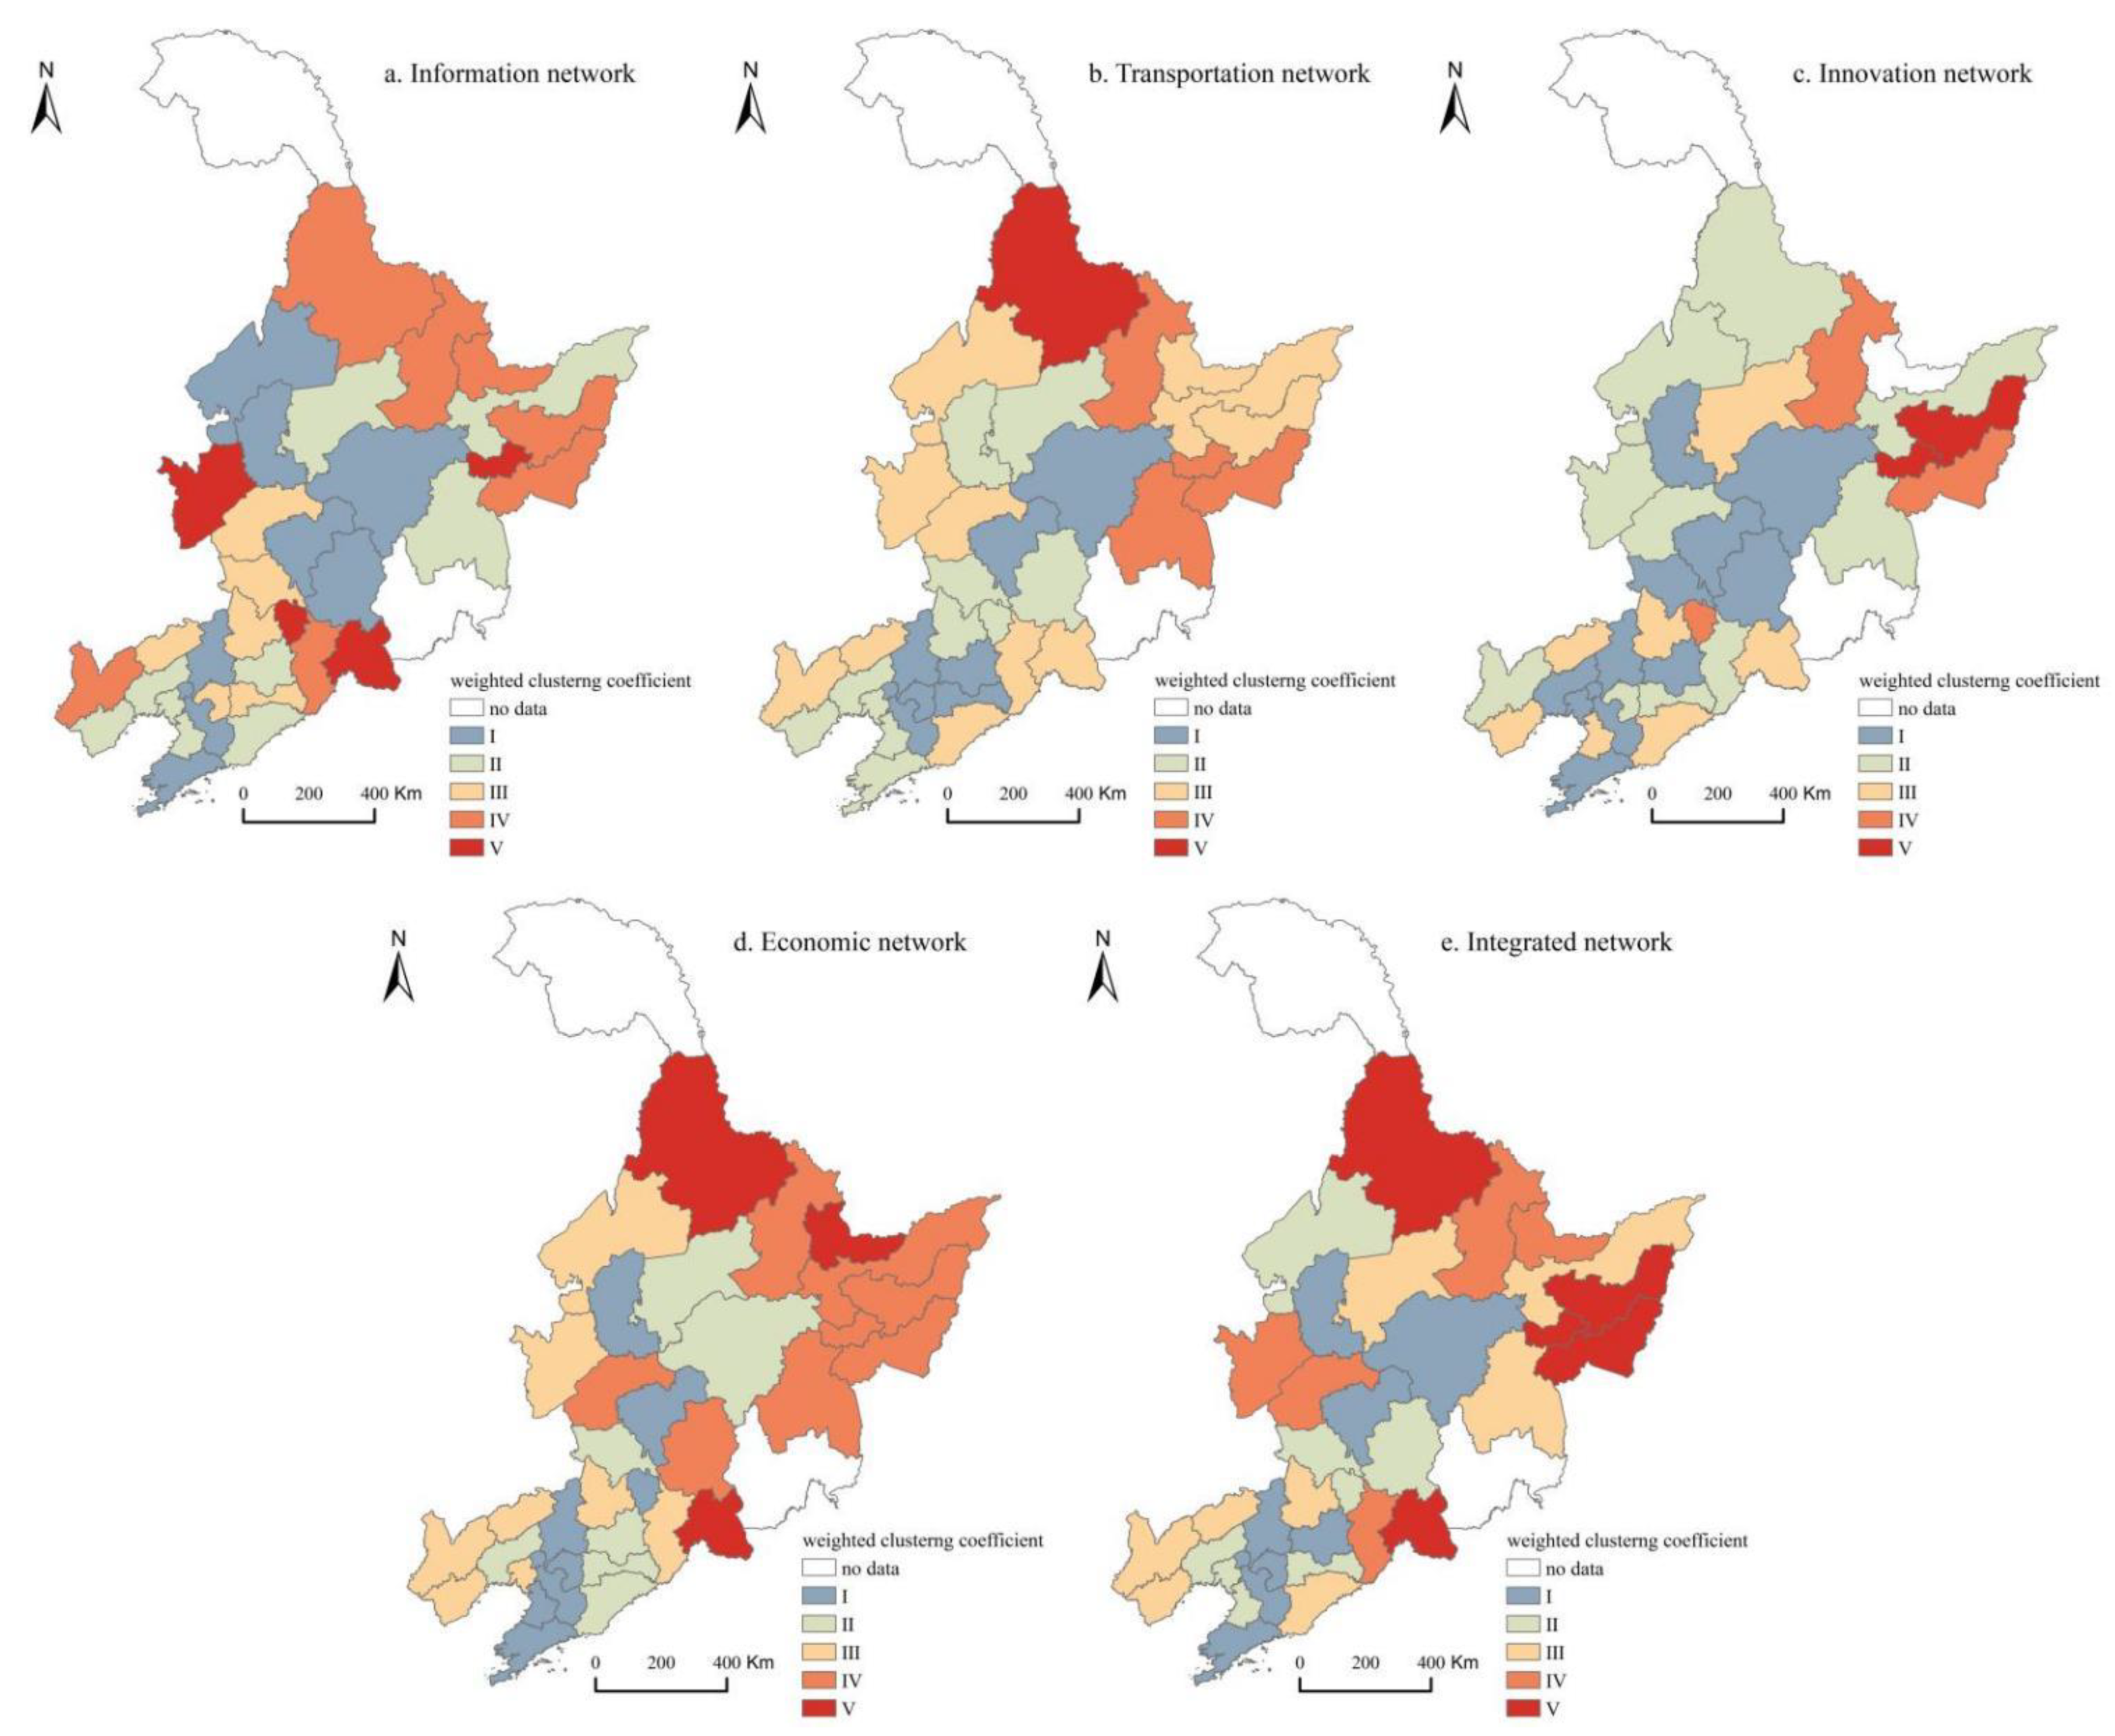
The average weighted clustering coefficients of the information, transportation, innovation, economic, and comprehensive networks are all approximately 0.2, indicating that the clustering characteristics of each type of network are weak, and with the expansion of the network scale, the core urban nodes have a wider radiation range, and other city nodes rely on the core city nodes to achieve cross-regional cooperation. The local weighted clustering coefficients of the rest of the networks except the transportation network show that the local weighted clustering coefficients of provincial capital cities and sub-provincial cities are in the first group (Figure 7). This indicates that the relationship between provincial capital cities and sub-provincial cities and other cities is not very close, but rather, there is a one-way connection between other city nodes and core city nodes, whereby there is less interactive cooperation among other city nodes, such that the node is not yet evident. The interaction and cooperation among other city nodes are lower, and no evident network has been formed. From the perspective of network structural resilience, the weak connection between core city nodes and other city nodes facilitates the penetration of external information, thereby enhancing the “robustness” of the city network in response to external information interference.

3.2.4. Urban Node Type Identification

The city nodes whose transmission and agglomeration are located in the first and second groups are regarded as dominant city nodes. There are five city nodes, which are provincial capital cities (Harbin, Shenyang, and Changchun), sub-provincial cities (Dalian), and resources-based cities (Daqing and Anshan). The cities in this category are in prominent positions in diverse networks, with strong comprehensive strength, leading the construction and development of the neighboring cities. The city nodes with both transmission and agglomeration in the fourth and fifth groups are considered as vulnerable city nodes, such that there are nine city nodes in total, namely, Songyuan, Tonghua, Baicheng, Jixi, Yichun, Heihe, Hegang, Shuangyashan, and Baishan, all of which are located in Jilin Province and Heilongjiang Province; most of them are peripheral cities with a low level of socio-economic development and imperfect public service facilities (Figure 8). Under the effect of administrative barriers, vulnerable city nodes are distant from provincial capital cities. As such, in considering future construction and development, it is necessary to heed and support the development of such cities and enhance their capability to cope with unexpected risks.

4. Influencing Factors of Urban Network Structure Resilience in the Three Provinces of Northeast China

4.1. Variable Selection

Exploring the factors influencing urban network structure resilience can provide relevant references for optimizing the resilience of the urban network structure. Presently, research on urban network structure resilience is still in the exploration stage, and there are few studies on the factors influencing urban network structure resilience. The resilience of the urban network structure is the result of multiple factors interacting and working together, combined with existing research results on the urban network structure and urban resilience [47,48,49,50,51]. The four properties of comprehensive urban network structure resilience are used as dependent variables. Economic scale, knowledge thickness, political status, geographic conditions, urban vitality, government capacity, openness, labor wages, and science and education level are used as the drivers affecting the resilience of the urban network structure (Table 4).

4.2. Regression Results

The least-squares method was used to analyze the influencing factors of urban network structure resilience, and the regression results are shown in Table 5. These results show that the R2 is between 0.455 and 0.793, which can explain 45.50% to 79.30% of urban network structure resilience. Overall, the fitting effect of the least-squares method is more suitable.
The best fit for the hierarchical nature of the city network structure, by controlling the other variables, denotes that political status, urban vitality, and labor wages can have a significant positive effect on enhancing its hierarchical characteristics, and all pass the 1% significance level test. The improvement of government capacity also has an effect, albeit to a lesser extent, but passes the 5% significance level test, consistent with the results for provincial capital cities and sub-provincial cities as core city nodes. Under the interaction of political status, urban vitality, labor wages, and government capacity, the non-heterogeneous pattern of the urban network structure is evident.
In terms of urban network structure matching, the regression results of its influencing factors are similar to those of hierarchy, in which government capacity, political status, and urban vitality significantly impact it negatively. Hence, it is necessary to focus on the interaction and cooperation between provincial capital cities and sub-provincial cities through the macro-regulatory role of the government, enhance the radiation capacity of core city nodes, and promote the development of other urban nodes through core urban nodes.
The transmission of the urban network structure is significantly affected by political status, government capacity, and knowledge thickness, and the transport function of the provincial capital cities and sub-provincial cities occupies a significant position in the entire network. After the failure of such city nodes, the transmission of the urban network structure will be significantly affected, and the network efficiency will decrease. Therefore, it is necessary to enhance the transmission efficiency of other urban nodes to ensure that the urban network can maintain regular operation in unexpected situations.
The agglomeration of the urban network structure is mainly related to urban vitality, government capacity, and knowledge thickness. The local weighted clustering coefficient of urban nodes with a large number of urban residents and a large total number of patent applications is lower, which is consistent with the results of the previous analysis. Therefore, we need to emphasize improving the level of science and technology within the region and strengthening the construction of transportation infrastructure to promote the flow of information, transportation, innovation, economy, and other factors among city nodes to realize regional interaction and cooperation.

5. Conclusions

The structural resilience of urban networks is one of the important factors affecting regional sustainable development. Through studying the structural resilience of urban networks in three provinces of Northeast China, the weak links in regional network structures are found, and the network structure is adjusted to promote the rational flow of regional factors, so as to promote the overall high-quality development of the region. To provide relevant references for optimizing the urban network structure resilience at home and abroad, we measured urban network structure resilience and the influencing factors in the three provinces of Northeast China in 2019. This was accomplished through the construction of urban information, transportation, innovation, economy, and integrated networks in the study provinces. As a result, the following conclusions can be drawn:
(1) There are certain similarities among the multi-city networks in the three provinces of Northeast China; nevertheless, there are also major differences. Overall, information, transportation, innovation, economy, and the integrated network show a spatial distribution pattern of “dense in the north and sparse in the south”, with closer intra-provincial ties than inter-provincial ties. Nonetheless, the spatial structure differences are evident: The information network shows a multi-core spatial pattern. The main levels have a cross-shaped spatial structure in space, which breaks the limitation of regional spatial distance and presents a more complex networked state. The transportation network is evidently affected by geographical spatial proximity, and the flow of transportation elements in neighboring regions is strong. The overall connection of the innovation network is looser, and the connection among urban nodes is relatively weak. The first level of the economic network presents an “N”-shaped structure in Liaoning Province, and the flow of economic factors decreases with increasing spatial distance. The integrated network is more complex than other networks, and the network structure is more robust.
(2) There are evident differences in the resilience characteristics of the multi-city network structure in the three provinces of Northeast China. The information network exhibits the highest heterogeneity, the transmission and agglomeration are at the medium level, and the hierarchy exhibits the lowest. Hence, overall, the information network structure has limited resilience. The hierarchy and heterogeneity of the transportation network are at the medium level, with low transmission and lower agglomeration, and are limited by urban traffic conditions. Hence, the resilience level of the transportation network is low. The innovation network has a high level of hierarchy, with higher transmission, low agglomeration, and the lowest heterogeneity, such that the local network with high resilience has low capability to drive its surrounding network. The economic network has high transmission, agglomeration, higher hierarchy, and low heterogeneity. Hence, its overall resilience is higher. The integrated network is affected by the interaction of multiple networks, and the characteristics of network structure resilience are complicated. Triggering the radiation-driven effect of dominant urban nodes and focusing on the construction and development status of vulnerable urban nodes have important implications for improving the resilience of urban network structures.
(3) The resilience of the multi-city network structure in the three provinces of Northeast China is affected by the interaction of multiple factors. In terms of hierarchy, under the interaction of government capacity, political status, urban vitality, and labor wages, the urban network structure demonstrates a phenomenon of heterogeneity. In terms of matching, the urban network structure of the three provinces exhibits high heterogeneity owing to government capacity, political status, and urban vitality. In terms of transmission, government capacity, political status, and knowledge thickness together shape the transmission resilience of the urban network structure, resulting in a more prominent transmission function of core urban nodes. In terms of agglomeration, government capacity, urban vitality, and knowledge thickness are the main factors influencing the agglomeration of the urban network structure; hence, we need to focus on the construction of urban vitality, government capacity, and knowledge thickness to enhance the connection among urban nodes.

6. Discussion

6.1. Optimization Strategies

With the gradual strengthening of the globalization trend, cities are no longer simple individual units, and the diversified flow of elements connects cities. Hence, it is crucial to maintain a coordinated and stable resilience capacity during the disturbance of the external environment. On this basis, based on the four aspects of hierarchy, matching, transmission, and agglomeration, we propose countermeasures for optimizing the resilience of the urban network structure.
The hierarchy of the urban network structure in the three provinces of Northeast China is evident, and there is a significant trend of heterogeneity, which is significantly influenced by government capacity and political status; which results in the prominent core positions of provincial capital cities (Shenyang, Changchun, and Harbin) and sub-provincial cities (Dalian). Therefore, cross-provincial exchanges and cooperation among core cities to realize the linkage development of the three provinces of Northeast China need to be emphasized. In addition, the radiation function of the nodes of core cities should be allowed to drive the development of surrounding areas, realize the synergistic development between core cities and edge cities, promote the flat development of the urban network structure, and enhance the integrity and rationality of the urban network as well as its resistance to the disturbance of the external environment.
Concerning the matching of the urban network structure, enhancing the flow of elements among urban nodes can improve the “robustness” of the linkage paths among nodes and improve the resilience of the urban network structure. Regarding the transportation network, we should improve the construction of the transportation system, focus on strengthening the advantages of national highways, focus on the construction of the “Harbin–Changchun–Shenyang–Dalian” transportation axis, improve the urban transportation conditions, and strengthen the connections among the municipalities in the provinces and among provinces. In terms of the economic network, we must adjust the economic development model, build industrial clusters, promote the development of manufacturing industries, and realize cross-regional economic exchanges and cooperation. The innovation network is affected by regional barriers and has the lowest heterogeneity and resilience. Therefore, it is necessary to eliminate the restrictions of regional conditions, strengthen exchanges between universities and scientific research institutions, cultivate scientific and technological bases, develop regional knowledge bases, and enhance the diversity and flexibility of innovation links among cities.
The transmission and agglomeration of the urban network structure are closely related to the knowledge thickness in the region. In this regard, we should focus on building science and technology centers with regional characteristics, enhancing regional innovation strength, breaking administrative barriers, and strengthening the construction of emergency response plans while promoting the flow of innovation among cities. Furthermore, we should promote the formation of effective two-way links between core city nodes and other city nodes and enable the radiation-driven role of core urban nodes while enhancing exchanges and interactions among other city nodes to improve and realize an efficiently networked state.
According to the type screening of urban nodes, the dominant urban nodes are essential for influencing the resilience of the urban network structure. When it fails, the resilience of the urban network structure will be seriously damaged; hence, an emergency system of dominant urban nodes should be built to enhance the resilience to cope with external environmental shocks to ensure that urban nodes can operate safely and stably. For vulnerable urban nodes, the construction of public infrastructure should be improved to enhance the resilience of urban nodes to cope with external environmental shocks, and the factor flow between vulnerable urban nodes and other urban nodes should be enhanced to strengthen regional connections.

6.2. Academic Contributions

The impact of COVID-19 and other uncertainties on cities has had a serious impact on the sustainable development of the region. As a relatively complete and independent economic zone, the three provinces of Northeast China have important material value for the interpretation and clarification of the structural resilience of the entire regional network. In addition, the research can also provide relevant reference for the sustainable development of other similar regions. Therefore, taking regional resilience as the starting point, we introduced multiple data such as the Baidu Index, highway mileage, railway mileage, Web of Science, and other data, and integrated them with traditional statistics to build multiple urban networks based on information, transportation, innovation, and economy for a comprehensive assessment of the structural resilience of urban networks; this, to some degree, avoids the one-sidedness of measuring the resilience of the urban network structure based on single factor flow. In addition, considering that the factor flows among urban nodes are not equal, to reflect the real urban network structure more realistically, weighted network structure resilience is analyzed by giving weights, which enriches and expands the theoretical study of urban networks and resilient regions.

6.3. Potential Bias and Future Steps

Although this study is valuable in constructing multiple urban connection networks based on multi-source data, it also has some limitations that need to be mitigated by future studies. First, the study only evaluated the resilience of urban networks within 34 cities in the three provinces of Northeast China, without considering the impact of the external environmental factors on the network structure resilience in the study area. Second, due to the limitations of a large amount of data and a time-consuming cleaning process, the study only statically measured the resilience of the urban network structure in 2019. As such, the dynamic evolution characteristics of the resilience of the urban network structure can be analyzed in the future. Finally, because the research on the resilience of the urban network structure is still in the exploratory stage, this study only conducts a preliminary analysis of the factors influencing urban network structure resilience, which needs to be further studied and discussed in the future.

Author Contributions

Conceptualization, H.L.; methodology, H.L.; software, H.L.; validation, H.L. and X.L.; formal analysis, H.L.; investigation, H.L.; resources, H.L.; data curation, H.L.; writing—original draft preparation, H.L.; writing—review and editing, S.T. and X.L.; visualization, H.L. and Y.G.; supervision, X.L.; project administration, X.L.; funding acquisition, X.L. All authors have read and agreed to the published version of the manuscript.

Funding

This research was funded by the National Natural Science Foundation of China (grant number 41671158).

Institutional Review Board Statement

Not applicable.

Informed Consent Statement

Not applicable.

Data Availability Statement

The data presented in this study are available on request from the corresponding author.

Conflicts of Interest

The authors declare no conflict of interest.

References

  1. Holling, C. Resilience and Stability of Ecological Systems. Annu. Rev. Ecol. Syst. 1973, 4, 1–23. [Google Scholar] [CrossRef] [Green Version]
  2. Heinzlef, C.; Robert, B.; Hémond, Y.; Sreere, D. Operating urban resilience strategies to face climate change and associated risks: Some advances from theory to application in Canada and France. Cities 2020, 104, 102762. [Google Scholar] [CrossRef]
  3. Hill, E.; Wial, W.; Wolman, H. Exploring Regional Economic Resilience; Institute of Urban and Regional Development, University of California: Berkeley, CA, USA, 2008. [Google Scholar] [CrossRef]
  4. Palekiene, O.; Simanaviciene, Z.; Bruneckiene, J. The application of resilience concept in the regional development context. Procedia-Soc. Behav. Sci. 2015, 213, 79–184. [Google Scholar] [CrossRef] [Green Version]
  5. Susan, C.; Jonathan, M.; Peter, T. Regional resilience: Theoretical and empirical perspectives. Camb. J. Reg. Econ. Soc. 2010, 1, 9–10. [Google Scholar] [CrossRef]
  6. Suire, R.; Vicente, J. Clusters for life or life cycles of clusters: In search of the critical factors of clusters’ resilience. Soc. Sci. Electron. Publ. 2014, 26, 142–164. [Google Scholar] [CrossRef]
  7. Graciela, C.; Jones, J.; Statsenko, L. Managing Innovation Networks for Knowledge Mobility and Appropriability: A Complexity Perspective. Entrep. Res. J. 2016, 6, 75–109. [Google Scholar] [CrossRef]
  8. Boschma, R. Towards an evolutionary perspective on regional resilience. Reg. Stud. 2015, 49, 733–751. [Google Scholar] [CrossRef] [Green Version]
  9. Xie, Y.; Wang, C.; Han, Z.; Liu, S. Structural resilience evolution of multiple urban networks in the Harbin-Dalian urban belt. Prog. Geogr. 2020, 39, 1619–1631. [Google Scholar] [CrossRef]
  10. Peng, C.; Lin, Y.; Gu, C. Evaluation and optimization strategy of city network structural resilience in the middle reaches of Yangtze River. Geogr. Res. 2018, 37, 1193–1207. [Google Scholar] [CrossRef]
  11. Wang, J.; Jin, F.; Jiao, J. Impacts of high-speed rail lines on the city network in China. J. Transp. Geogr. 2017, 60, 257–266. [Google Scholar] [CrossRef]
  12. Ai, S.; Miao, C. “Space pf places”, “Space pf flows” and “Space of actor-networks”: From the perspective of ant. Hum. Geogr. 2010, 25, 43–49. [Google Scholar] [CrossRef]
  13. Pan, F.; Zhao, S.; Wójcik, D. The rise of venture capital centres in China: A spatial and network analysis. Geoforum 2016, 75, 148–158. [Google Scholar] [CrossRef] [Green Version]
  14. Yeh, A.; Yang, F.; Wang, J. Producer service linkages and city connectivity in the mega-city region of China: A case study of the Pearl River Delta. Urban Stud. 2015, 52, 2458–2482. [Google Scholar] [CrossRef]
  15. Zhao, M.; Derudder, B.; Huang, J. Examining the transition processes in the Pearl River Delta polycentric mega-city region through the lens of corporate networks. Cities 2017, 60, 147–155. [Google Scholar] [CrossRef]
  16. Guimera, R.; Mossa, S.; Turtschi, A.; Amaral, L. The worldwide air transportation network: Anomalous centrality, community structure, and cities’ global roles. Proc. Natl. Acad. Sci. USA 2003, 102, 7794–7799. [Google Scholar] [CrossRef] [PubMed] [Green Version]
  17. Blondel, V.; Guillaume, J.; Lambiotte, R.; Lefebvre, E. Fast unfolding of communities in large networks. J. Stat. Mech. Theory Exp. 2008, 10, 155–168. [Google Scholar] [CrossRef] [Green Version]
  18. Wang, S.; Zhan, Z.; Huang, Q.; Zhong, Z.; Li, P.; Min, H.; Liu, J. Study on logistics network of Yangtze River Delta city groups: Based on the method of social network analysis. J. Ambient. Intell. Humaniz. Comput. 2018, 9, 1–7. [Google Scholar] [CrossRef]
  19. Liang, S.; Cao, Y.; Wei, W.; Gao, J.; Liu, W.; Zhang, W. International Freight Forwarding Services Network in the Yangtze River Delta, 2005–2015: Patterns and Mechanisms. Chin. Geogr. Sci. 2019, 29, 112–126. [Google Scholar] [CrossRef] [Green Version]
  20. Lever, K.; Kifayat, K. Identifying and Mitigating Security Risks for Secure and Robust NGI Networks. Sustain. Cities Soc. 2020, 59, 102098. [Google Scholar] [CrossRef]
  21. Mei, D.; Xiu, C.; Feng, X. Analysis on the evolution characteristics and driving factors of urban information network structure in China. World Reg. Stud. 2020, 29, 717–727. [Google Scholar] [CrossRef]
  22. Wang, B.; Loo, B. The hierarchy of cities in Internet news media and Internet search: Some insights from China. Cities 2018, 84, 121–133. [Google Scholar] [CrossRef]
  23. Shao, Y.; Xu, J. Urban resilience: Conceptual analysis based on international literature review. Urban Plan. Int. 2015, 30, 48–54. [Google Scholar]
  24. Li, X.; Xiao, R. Analyzing network topological characteristics of eco-industrial parks from the perspective of resilience: A case study. Ecol. Indic. 2017, 74, 403–413. [Google Scholar] [CrossRef]
  25. Rak, J. K-Penalty: A novel approach to find κ-Disjoint paths with differentiated path costs. IEEE Commun. Lett. 2010, 14, 354–356. [Google Scholar] [CrossRef]
  26. Ruiz-Martin, C.; Paredes, A.; Wainer, G. Applying Complex Network Theory to the Assessment of Organizational Resilience. Ifac Pap. 2015, 48, 1224–1229. [Google Scholar] [CrossRef]
  27. Kang, Z.; Kumar, A.; Harrison, T.; Yen, J. Analyzing the Resilience of Complex Supply Network Topologies Against Random and Targeted Disruptions. IEEE Syst. J. 2011, 5, 28–39. [Google Scholar] [CrossRef]
  28. Ribeiro, P.; Gonalves, L. Urban Resilience: A conceptual framework. Sustain. Cities Soc. 2019, 50, 101625. [Google Scholar] [CrossRef]
  29. Wei, Z.; Xiu, C. Study on the concept and analytical framework of city network resilience. Prog. Geogr. 2020, 39, 488–502. [Google Scholar] [CrossRef]
  30. Wei, S.; Pan, J. Network structure resilience of cities at the prefecture level and above in China. Acta Geogr. Sin. 2021, 76, 1394–1407. [Google Scholar] [CrossRef]
  31. Robin, L. Climate change and urban resilience. Curr. Opin. Environ. Sustain. 2011, 3, 164–168. [Google Scholar] [CrossRef]
  32. Crespo, J.; Suire, R.; Vicente, J. Lock-in or lock-out? How structural properties of knowledge networks affect regional resilience. Pap. Evol. Econ. Geogr. 2012, 14, 199–219. [Google Scholar] [CrossRef]
  33. Mcdaniels, T.; Chang, S.; Cole, D.; Mikawoz, J.; Longstaff, H. Fostering resilience to extreme events within infrastructure systems: Characterizing decision contexts for mitigation and adaptation. Glob. Environ. Chang. 2008, 18, 310–318. [Google Scholar] [CrossRef]
  34. Lv, L.; Liang, Z.; Miao, R. The Innovation Linkage Among Chinese Major Cities. Sci. Geogr. Sin. 2015, 35, 30–37. [Google Scholar] [CrossRef]
  35. Benhabib, J.; Spiegel, M. The role of human capital in economic development evidence from aggregate cross-country data. J. Monet. Econ. 1994, 34, 143–173. [Google Scholar] [CrossRef]
  36. Jiang, D.; Sun, Y.; Ren, H.; Chen, Y.; Zhang, Z. Research on the City Network Characteristics of the City Group in the Middle Reaches of the Yangtze River Based on Baidu Index. Resour. Environ. Yangtze Basin 2015, 24, 1654–1664. [Google Scholar] [CrossRef]
  37. Peng, C.; Lin, Y. Spatial-temporal mechanism of internal correlation in Changsha-Zhuzhou-Xiangtan Network cities. Econ. Geogr. 2015, 35, 72–78. [Google Scholar] [CrossRef]
  38. Cao, X.; Zeng, G. The mode of transformation and upgrading based on the methods of entropy weight and TOPSIS in case of Wuhu economic and technological development zone. Econ. Geogr. 2013, 34, 13–18. [Google Scholar] [CrossRef]
  39. Shi, J.; Wang, X.; Wang, C.; Liu, H.; Miao, Y.; Ci, F. Evaluation and Influencing Factors of Network Resilience in Guangdong-Hong Kong-Macao Greater Bay Area: A Structural Perspective. Sustainability 2022, 14, 8005. [Google Scholar] [CrossRef]
  40. Zhang, Y.; Shao, C.; He, S.; Gao, J. Resilience centrality in complex networks. Phys. Rev. 2020, 101, 22304. [Google Scholar] [CrossRef]
  41. Boccaletti, S.; Latora, V.; Moreno, Y.; Chavez, M.; Hwang, D. Complex networks: Structure and dynamic. Phys. Rep. 2006, 424, 175–308. [Google Scholar] [CrossRef]
  42. Wei, S.; Pan, J. Resilience of Urban Network Structure in China: The Perspective o Disruption. ISPRS Int. J. Geo-Inf. 2021, 10, 796. [Google Scholar] [CrossRef]
  43. Thadakamaila, H.; Raghavan, U.; Kumara, S.; Albert, R. Survivability of Multiagent-Based Supply Networks: A Topological Perspective. IEEE Intell. Syst. 2005, 19, 24–31. [Google Scholar] [CrossRef]
  44. Lai, J.; Pan, J. China’s City Network Structural Characteristics Based on Population Flow during Spring Festival Travel Rush: Empirical Analysis of “Tencent Migration” Big Data. J. Urban Plan. Dev. 2020, 146, 4020018. [Google Scholar] [CrossRef]
  45. Onnela, J.; Saramäki, J.; Kertész, J.; Kaski, K. Intensity and coherence of motifs in weighted complex networks. PhRvE 2005, 71, 65103. [Google Scholar] [CrossRef] [PubMed] [Green Version]
  46. Lu, P.; Dong, M.; Cao, L. Analysis of influence of clustering coefficient as its index on robustness of complex network. J. Lanzhou Univ. Technol. 2019, 45, 101–107. [Google Scholar]
  47. Wang, Y.; Wang, H.; Zhang, B.; Huang, X. Analysis of the network structure and influencing factors of urban agglomerations based on the perspective of multi-dimensional factor flow—A case study of Wuhan urban agglomeration. Econ. Geogr. 2021, 41, 68–76. [Google Scholar] [CrossRef]
  48. Li, X.; Liu, H.; Tian, S.; Gong, Y. Network structure and influencing factors of urban human habitat activities in the three provinces of Northeast China: Based on Baidu Post Bar data. Prog. Geogr. 2019, 38, 1726–1734. [Google Scholar] [CrossRef] [Green Version]
  49. Wang, J.; Jing, Y.; Yang, H. The evolution mode of China’s HSR-air competitive network and its driving factors. Sci. Geogr. Sin. 2020, 40, 675–684. [Google Scholar] [CrossRef]
  50. Zhu, J.; Sun, H. Research on spatial-temporal evolution and influencing factors of urban resilience of China’s three metropolitan agglomerations. Soft Sci. 2020, 34, 72–79. [Google Scholar] [CrossRef]
  51. Dawley, S.; Pike, A.; Tomaney, J. Towards the resilient region?: Policy activism and peripheral region development. SERC Discuss. Pap. 2010, 25, 650–667. [Google Scholar] [CrossRef]
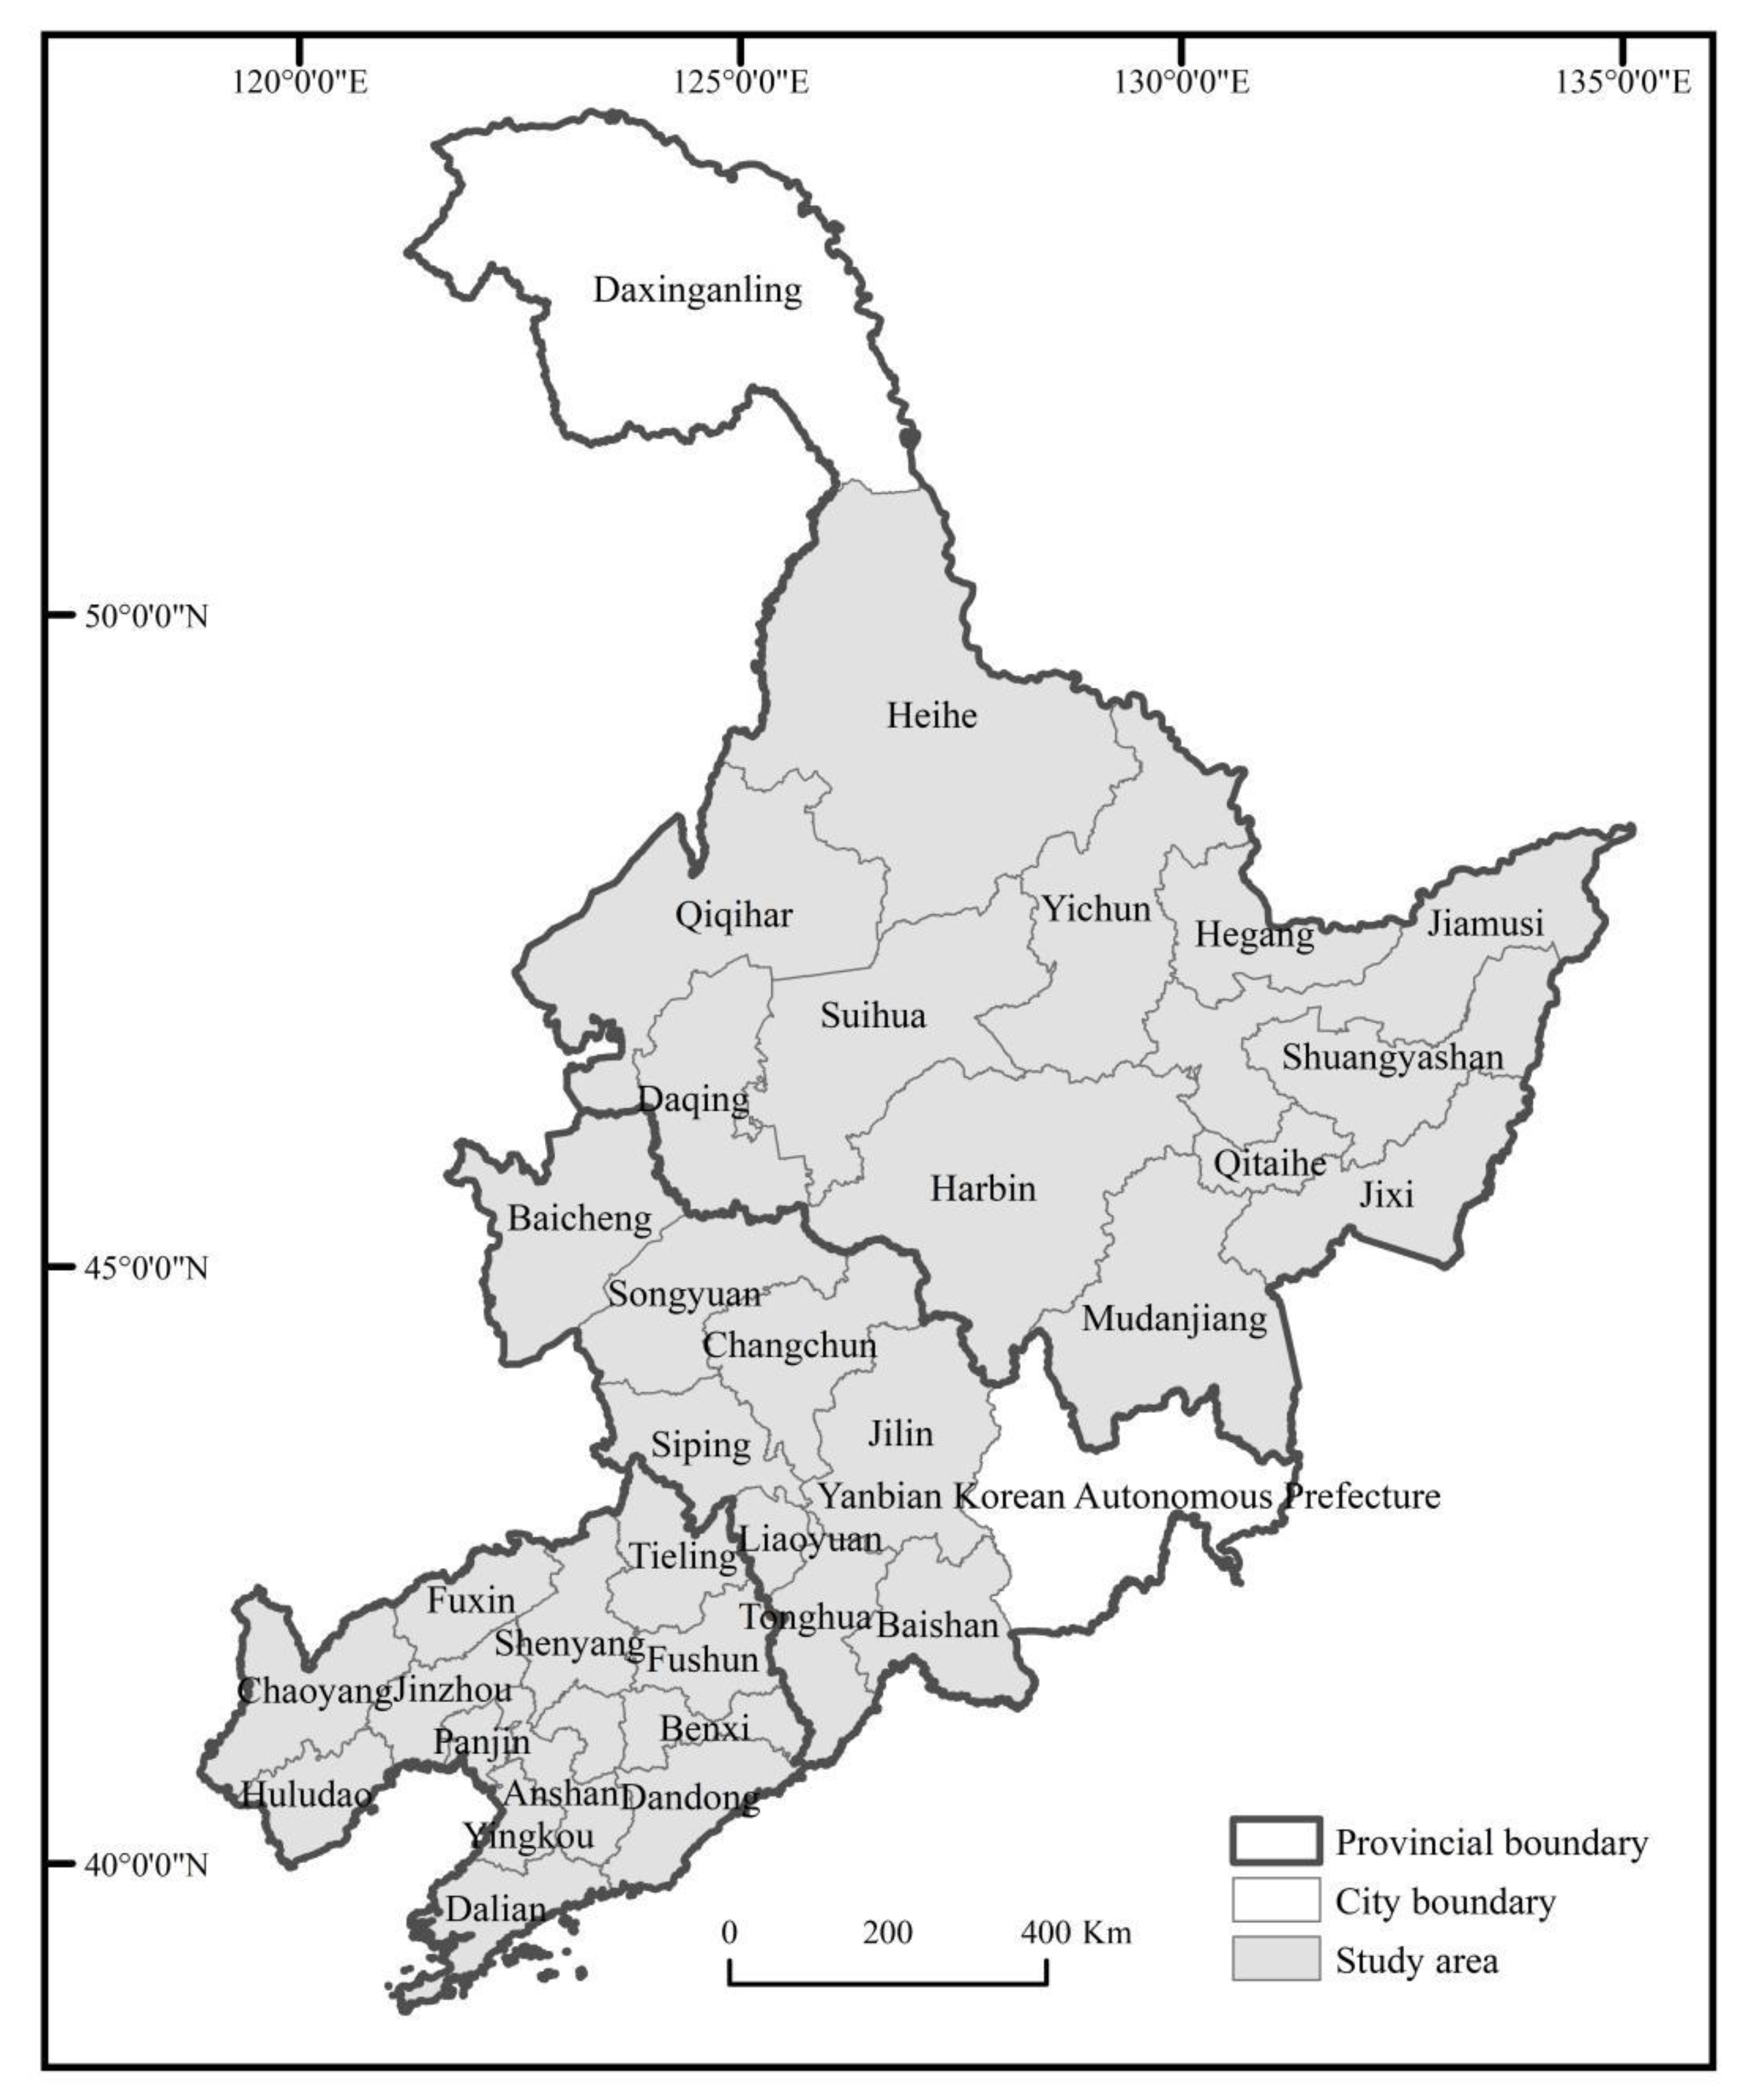
Figure 1. Study area.
Buildings 12 00945 g001
Figure 2. Multi-city network construction framework.
Buildings 12 00945 g002
Figure 3. Distribution of the network connection strength of multiple cities in the three provinces of Northeast China.
Buildings 12 00945 g003
Figure 4. Spatial distribution of weighted degree and weighted average nearest-neighbor degree of the multi-city linkage network in the three provinces of Northeast China.
Buildings 12 00945 g004
Figure 5. Distribution of the weighted degree of the urban network in the three provinces of Northeast China.
Buildings 12 00945 g005
Figure 6. Spatial distribution of the transmission efficiency of the multi-city connection network in the three provinces of Northeast China.
Buildings 12 00945 g006
Figure 7. Spatial distribution of the local weighted clustering coefficients in the multi-city connection network of the three provinces of Northeast China.
Buildings 12 00945 g007
Figure 8. Spatial distribution of the types of urban nodes in the three provinces of Northeast China.
Buildings 12 00945 g008
Table 1. Multi-source data information used in the research.
DataDateData SourcesCorresponding Urban Network Type
Statistical data2019Statistical Yearbook of Liaoning Province, Jilin Province, and Heilongjiang ProvinceEconomic network
Baidu IndexJanuary 2019–
December 2019
Baidu Index search platform (http://index.baidu.com, accessed on 20–23 June 2021)Information network
Mileage data-Baidu Map official website (https://map.baidu.com, accessed on 26 June 2021), train ticket and railway mileage inquiry website (http://www.huochepiao.com/licheng/, accessed on 28 June 2021)Transportation network
Paper co-author2019Web of Science database (http://webofscience.com, accessed on 3–5 July 2021)Innovation network
Table 2. Evaluation indicators of urban network structure resilience.
DimensionIndexSpatial Significance
HierarchyWeighted degreeExternally connected degree of urban nodes
Weighted degree distributionUrban node level
MatchingWeighted average nearest-neighbor degreeCorrelation degree among urban nodes
TransmissionAverage path lengthUrban node communication capability
AgglomerationLocal weighted clustering coefficientAgglomeration degree of urban nodes and their neighboring nodes
Table 3. Correlation coefficients of multiple connection networks in 34 cities in the three provinces of Northeast China.
Multiple NetworkInformation NetworkTransportation NetworkInnovation NetworkEconomic Network
Information network-0.497 ***0.387 ***0.428 ***
Transportation network0.497 ***-0.390 ***0.610 ***
Innovation network0.387 ***0.390 ***-0.307 ***
Economic network0.428 ***0.610 ***0.307 ***-
Note: *** indicates passing the 1% significance test.
Table 4. Influencing factors of urban network structure resilience.
VariableIndexUnitMaxMinMeanStd. Dev.
Economic scaleGross National Product per capitaYuan (RMB)99,99621,04542,314.47121,207.168
Knowledge thicknessTotal number of patent applicationsPiece37,313642608765.050
Political status1 for provincial capital cities and sub-provincial cities and 0 for the rest of the cities-100.1180.327
Geographic conditions1 for cities in eastern provinces and 0 for cities in central and western provinces-100.4120.500
Urban vitalityPopulation densityPerson/km2587.86922.785194.313132.818
Government capacityProportion of public financial expenditure in GDP%59.05612.30032.58912.186
OpennessProportion of total exports to GDP%27.7110.0034.6055.888
Labor wagesAverage salary of on-the-job employeesYuan (RMB)100,78144,95365,556.94112,364.777
Science and education levelProportion of science and education expenditure in total expenditure%16.2836.52111.7802.203
Table 5. Regression results of influencing factors.
HierarchyMatchingTransmissionAgglomeration
Economic scale0.00050.00110.00030.0003
Knowledge thickness−0.00020.0023−0.0006 *−0.0005 *
Political status0.5396 ***−0.0164 ***0.1184 ***0.0578
Geographic conditions−0.19320.00590.09350.0141
Urban vitality0.0015 ***−0.0045 ***−0.0006−0.0005 **
Government capacity−1.5922 **0.0482 **0.9966 *0.9603 *
Openness−1.01810.0309−0.27380.1490
Labor wages0.0004 ***0.0005−0.0001−0.0007
Science and education level−0.63030.0191−2.1147−1.0740
Intercept0.8600.3260.1530.107
Sample size34343434
R20.7930.7150.5430.455
Note: *, **, *** indicate passing the 10%, 5%, and 1% significance test, respectively.
Publisher’s Note: MDPI stays neutral with regard to jurisdictional claims in published maps and institutional affiliations.