1. Introduction
The current practice in the construction sector investigates the industrialization of the construction fields by reducing on-site activities such as the standardization of the structural joint details and connection components to develop fast erection strategies for a more economical construction process while achieving high reliability for the assembly techniques [
1,
2,
3]. Steel plates with serrated surfaces have been in practice by means of adjustable edge and side clamps of Computer Numerical Control (CNC) milling fixtures for many years [
4] and they have proven to be a good candidate to achieve reliable assembly components against dynamic effects. Therefore, structural joint configurations similar to the assembly devices of CNC milling fixtures may offer a variety of possibilities for the construction industry with high reliability against dynamic loading conditions of building and bridge structures. However, the application of adjustable assembly techniques has not yet been the mainstream for the construction industry because of their expensive manufacturing costs compared to the conventional joint detailing such as the reinforcement bars for RC-structures, fin-plates for steel structures and the combination of embedded anchor plate with fin-plates for steel-concrete hybrid building systems.
On the other hand, steel plates with serrated surface topologies have started to gain importance in the construction fields as they provide high flexibility to accommodate construction and manufacturing tolerances. Commercial establishments have recently introduced several joint configurations with serrated steel surfaces for the assembly of the secondary structural members such as the facade, masonry and balcony systems with the main load-bearing frames of the buildings [
5,
6].
Figure 1 shows an example joint configuration consisting of a cast-in anchor channel and steel plates with serrated surfaces to be used for the balcony system installation of a high-rise building. It could be seen in the figure that the steel-to-steel serrated interface is positioned to be parallel to the direction of the gravitational actions. Therefore, the slip resistance achieved with the clamping force along the serrated interface is the main load-bearing mechanism of the joint configuration against the gravitational actions.
Furthermore, it has been shown by a recent study that the construction industry could also benefit from the advantages of the steel plates with serrated surfaces for the beam-to-column connections of the load-bearing building frames [
7].
The latest developments in CNC-cutting technologies may paw the way for the cost-effective production of steel plates with serrated surfaces to be used for the assembly of the structural members. However, the CNC-cutting operation may deteriorate or enhance the surface asperities in other words the slip-resistant load-bearing behaviour. Therefore, considering the allowable level of vulnerability, e.g., slip, for civil engineering structures under serviceability and ultimate limit states, it is required to reliably establish the slip factor between the CNC-cut serrated steel surfaces to develop state-of-the-art structural joint configurations.
Previous studies have shown that the slip factor for steel-to-steel interfaces mostly depends on the surface roughness of the steel plates [
8,
9], thus to the surface finishing applied to protect the steel plates from the environmental effects [
10]. Yolacan [
11] recently showed that friction shims enriched with diamond particles for enhancement of slip-resistance between steel plates may be effective if the surface roughness of the steel plates is kept less than the maximum size of the embedded diamonds particles on the shims. However, to the best of the knowledge of the authors, the slip-resistant load-bearing mechanism of CNC-cut serrated steel surfaces has not yet been investigated for their applications in the structural joint configurations of civil engineering structures.
Therefore, in the scope of this study an experimental testing campaign is conducted according to EN1090-2, Annex G [
12] to establish the characteristic value of the slip factor between the CNC-cut serrated surfaces prepared from S355J2 grade steel plates.
2. Slip Factor Determination Test Campaign
Five experimental tests were performed according to EN1090-2, Annex G [
12] to determine the slip factor between the CNC-cut serrated surfaces prepared from S355J2 grade steel plates. The serrated surfaces, their coupling and the details of a saw-tooth thread from the serrated surfaces are presented in
Figure 2. The geometry of the saw-tooth threads was designed based on the available CNC-cutting tools and the minimum thickness for steel components in respect to corrosion, i.e., 4 mm, in accordance with EN1090-2 [
12] which indicates that to resist the exposure, adequate corrosion protection treatment is to be provided for components with thickness less than 4 mm before leaving the manufacturing workshop.
EN1090-2, Annex G [
12] proposes two different sets of dimensions for the test specimens based on the diameter of the bolts. The dimensions of the test specimens were selected for M16-bolt configurations of EN1090-2, Annex G [
12] to be able to attain the slip-load within the capacity range of the testing machine. However, due to the coupling of the serrated surfaces (see
Figure 2c) and considering the height of the saw-tooth threads (see
Figure 2d) the thickness of the cover plate was selected to be 12 mm instead of 8 mm. In addition, due to the available plate dimensions the inner plates were produced from 15 mm thick plates instead of the 16 mm thickness indicated by EN1090-2, Annex G [
12]. Consequently, the total thickness between the outer surfaces of the cover plates was 0.657 mm more than the test configuration of M16-bolts defined by EN1090-2, Annex G [
12]. This difference was considered insignificant for the determination of the slip factor [
13].
On the other hand, the total clamping length of the bolts was deviated from 40 mm to 62.657 mm due to the load cells (LC—see
Figure 3a) installed to measure the variations of the bolt pre-tension load levels. It was earlier shown that such difference may result in overestimation of the slip factor [
14]. Therefore, a calibration procedure presented by Vrais and Nijgh [
15] was adopted as detailed in
Appendix A to consider the impact of the clamping length on the slip factor values determined with the test campaign. The calibrated values of the slip factors are presented in
Section 4.
The overall geometry and the nominal dimensions of the test set-up, the test specimens and the configuration of the measurement devices are illustrated in
Figure 3. 10.9-grade bolts were selected for the test campaign as EN1090-2, Annex G [
12] states that the characteristic slip factor determined with 10.9-grade bolts may also be used for slip-resistant connections designed with 8.8-grade bolts. Nevertheless, the previous studies showed that the selected bolt size and the material grade of the bolts do not have a significant impact on the slip factor [
13,
14].
Table 1 summarize the nominal dimensions and the material properties with related production standards of the test specimens.
The tests were performed with a 400kN loading capacity uni-axial testing machine provided by the structural laboratory of The University of Luxembourg.
2.1. Assembly of the Test Specimens and the Measurement Devices
The test specimens and the load cells (LCs) were assembled on a preparation bench. 110kN pre-tension load was applied to the bolts while the assembly was clamped to the preparation bench. The pre-tension load level was calculated according to EN1090-2 [
12] with Equation (
1). A calibrated torque wrench was used to apply the pre-tension loads and the level of the pre-tension was recorded during the entire torquing procedure to have accurate initial conditions for the slip factor determination tests. Once the 110kN pre-tension load level was achieved for all of the bolts, the test assembly was carried into the testing machine.
Figure 4 shows the test specimens and their assembly procedure. The assembly procedure was repeated for all of the test set-ups separately.
where;
fub is the characteristic ultimate capacity of the selected bolt material,
As is the stress area of the selected bolt size.
Figure 4.
Assembly of the test specimens and the installation to the testing machine. (a) Test Specimens. (b) Assembly of the test specimens on the assembly bench-side view. (c) Assembly of the test specimens on the assembly bench-plan view. (d) Installation of the test assembly to the testing machine.
Linear variable displacement transducers (LVDTs) were positioned once the test assembly was clamped to the testing machine. As consistent with the provisions of EN1090-2 [
12] the relative displacements between the inner and the cover plates, i.e., slip, were measured at the centre of the bolt groups for all of the four faying surfaces (see
Figure 3a). To be able to measure the slip at the pre-defined position with high accuracy, 3D-printed LVDT containers and measurement blocks were produced (see
Figure 3b), and the LVDT containers were fixed to the test assembly with screws at the centre of the bolt groups.
2.2. Execution of the Tests
The first four tests were performed with normal test speed that corresponds to 10 to 15 min test duration according to EN1090-2, Annex G [
12]. To comply with this limitation a displacement-controlled quasi-static monotonic loading procedure with 0.01 mm/second loading speed was selected. However, it is important to note that the previous studies showed that the test speed, thus the test duration does not have an impact on the slip factor [
14].
The fifth test was performed to measure the creep behaviour of the serrated interface and here on named the creep test. The following loading procedure defined by EN1090-2, Annex G [
12] was applied for the creep test;
Initially, 90% of the mean slip-load calculated based on the results of the first four tests was applied with the displacement-controlled loading procedure of the first four tests.
Thereafter, a static loading period was applied for three hours at a loading level defined in the previous step.
Finally, after the three hours of the static loading period, the displacement-controlled loading procedure of the initial step was continued until attaining the pre-defined slip-criterion of EN1090-2, Annex G [
12] for both the upper and the lower ends.
3. Results of the Test Campaign
EN1090-2, Annex G [
12] defines the individual slip load for the upper and lower ends of the test assembly as the load recorded at an instant that corresponds to 0.15 mm mean relative displacement between the inner and the cover plates, i.e.,
i = 0.15 mm.
Equations (
2) and (
3) formulate the calculation of the slip for the upper and the lower ends of the test assembly based on the LVDT configuration presented in
Figure 3b.
Figure 5a shows the load-slip curves for the upper and the lower ends of the test assemblies together with the pre-defined slip-criterion, i.e.,
criterion = 0.15 mm, of EN1090-2, Annex G [
12]. In addition, the variations of the bolt pre-tension load levels are presented in
Figure 5b with respect to the slip of the corresponding ends.
EN1090-2, Annex G [
12] also defines a delayed slip-criterion, here on named as creep criterion—
creep, criterion, for the creep test (Test-05) as 0.002 mm slip between the fifth minutes and third hours of the static loading period defined in
Section 2.2.
Figure 6 shows slip curves for the upper and the lower ends of the creep test assembly with respect to the test duration.
Table 2 presents the results of the creep tests for the evaluation of the creep behaviour against the pre-defined creep criterion.
According to
Table 2 and
Figure 6 the delayed slip is lower than the pre-defined creep criterion for both of the upper and the lower ends of the test assembly. Therefore, the slip loads recorded at 0.15 mm slip of the creep test could be also used together with the results of the first four tests to determine the mean slip factor [
12].
EN1090-2, Annex G [
12] states that the individual slip factor could be calculated based on the nominal initial bolt pre-tension load level and formulates the calculation of the individual slip factor for the upper and the lower ends of the test assembly with Equation (
4).
where;
On the other hand, previous studies showed that the initial bolt pre-tension load level, i.e., F
p, C,initial-nominal, reduces by the initiation of the upright loading mainly due to lateral contraction orthogonal to the direction of the upright loading [
9,
13,
19]. Therefore, to more precisely define the slip-resistant load-bearing behaviour of CNC-cut serrated steel surfaces, the actual slip factors were determined for both the upper and the lower ends of the test assembly with Equation (
5). For the calculation of the actual slip factors the actual bolt pre-tension load levels,
Fp, C, actual, at the pre-defined slip instant, i.e.,
i = 0.15 mm, were used.
EN1090-2, Annex G [
12] also defines a statistical evaluation procedure to decide if further test are required to establish the characteristic slip factor. Equations (
6)–(
9) define the statistical evaluation parameters. The statistical evaluation of the test results are discussed in
Section 4.
where;
Fsm is the mean slip-load,
sFs is the standard deviation for the distribution of the slip loads,
µm is the mean slip factor,
sµ is the standard deviation for the distribution of the slip factors,
Table 3 presents the test results by means of the individual slip load for the upper and the lower ends of the test assemblies, the initial nominal bolt pre-tension load levels and the actual bolt pre-tension load levels at the pre-defined slip instant, the nominal and the actual slip factors calculated with Equation (
3) and (
4), respectively. In addition, the statistical evaluation parameters are also presented in
Table 3.
It could be detected from
Figure 5 that the pre-defined slip-criterion, i.e.,
i = 0.15 mm, was not attained for the upper ends of Test-03 and Test-05. Because these tests were automatically terminated as the testing machine was configured to stop if more than 50% load-drop occurs instantly. During Test-03 and Test-05, there were sudden slips at the lower ends of the test assemblies which triggered more than 50% load drops instantly, thus the testing machine stopped automatically for these tests. Consequently, it was not possible to further measure the slip for the upper ends of Test-03 and Test-05. Therefore, in
Table 3 the slip factors for the upper ends of these tests were not specified and the statistical parameters defined through Equations (
6)–(
9) were calculated based on the 8 values.
4. Discussion of the Results
According to
Figure 5 it could be noticed that the maximum loads were attained before the pre-defined slip-criterion of EN1090-2, Annex G [
12] at the upper and the lower ends of the all five test specimens. This phenomenon previously investigated in detail by Stranghöner et al. [
14] and they noted that the pre-defined slip-criterion of EN1090-2, Annex G [
12] should be reconsidered for the new version of Eurocodes. Therefore,
Table 4 presents the nominal and the actual slip factors based on the maximum test loads attained before reaching the pre-defined slip-criterion, i.e.,
criterion = 0.15 mm.
Comparing the results from
Table 3 and
Table 4, it is deduced that the mean nominal and the mean actual slip factors determined based on the maximum test loads attained before reaching the pre-defined slip-criterion are about 3.6% and 2.4% higher than the ones calculated based on the pre-defined slip-criterion of EN1090-2, Annex G [
12].
According to EN1090-2 [
12] if the coefficient of variation of 10 slip-loads from five tests is higher than 8% further specimens should be tested. The coefficient of variation of the slip-loads presented in
Table 3 and
Table 4 are less than 8%. However, it is important to note that the statistical parameters presented in
Table 3 were calculated based on 8 slip factors. Therefore, to establish the characteristic value of the slip factor based on the pre-defined slip-criterion of EN1090-2, Annex G [
12] at least one more test with normal test speed shall be performed.
On the other hand, as indicated earlier the initiation of the slip was earlier than the pre-defined slip-criterion (see
Figure 6) of EN1090-2, Annex G [
12] for all of the five tests. Thereby, the slip factors presented in
Table 4 could be used to establish the characteristic value of the nominal slip factor [
14]. However, the clamping length of the bolts (M16 × 85 mm) used in the test campaign (see
Figure 3) was 22.657 mm longer than the test configuration of EN1090-2, Annex G [
12]. Therefore, the pre-tension relaxations in the bolts (see
Figure 5b) were less than the ones that may occur if the clamping length of the bolts were identical to the ones presented in EN1090-2, Annex G [
12]. Consequently the nominal slip factors presented in
Table 4 should be calibrated to consider the impact of the deviation in the clamping length of the bolts to establish a reliable value of the characteristic slip factor for the design purposes.
Recently, Vrais and Nijgh [
15] defined a calibration procedure to determine the corrected slip factor if the slip factor determination tests were performed with bolts having a clamping length longer than the ones defined by EN1090-2, Annex G [
12]. To consider the impact of the deviation in the clamping length of the bolts and to more reliably establish the characteristic value of the slip factor between the CNC-cut serrated steel surfaces of S355J2 their calibration procedure was applied.
Table 5 presents the calibrated values of the nominal slip factors listed in
Table 4 and their comparison with the calibrated values. The formulations and the required parameters of the calibration procedure are presented in
Appendix A.
According to
Table 5, the mean nominal calibrated slip factor is about 6.5% less than the mean nominal uncalibrated slip factor (see also
Table 4).
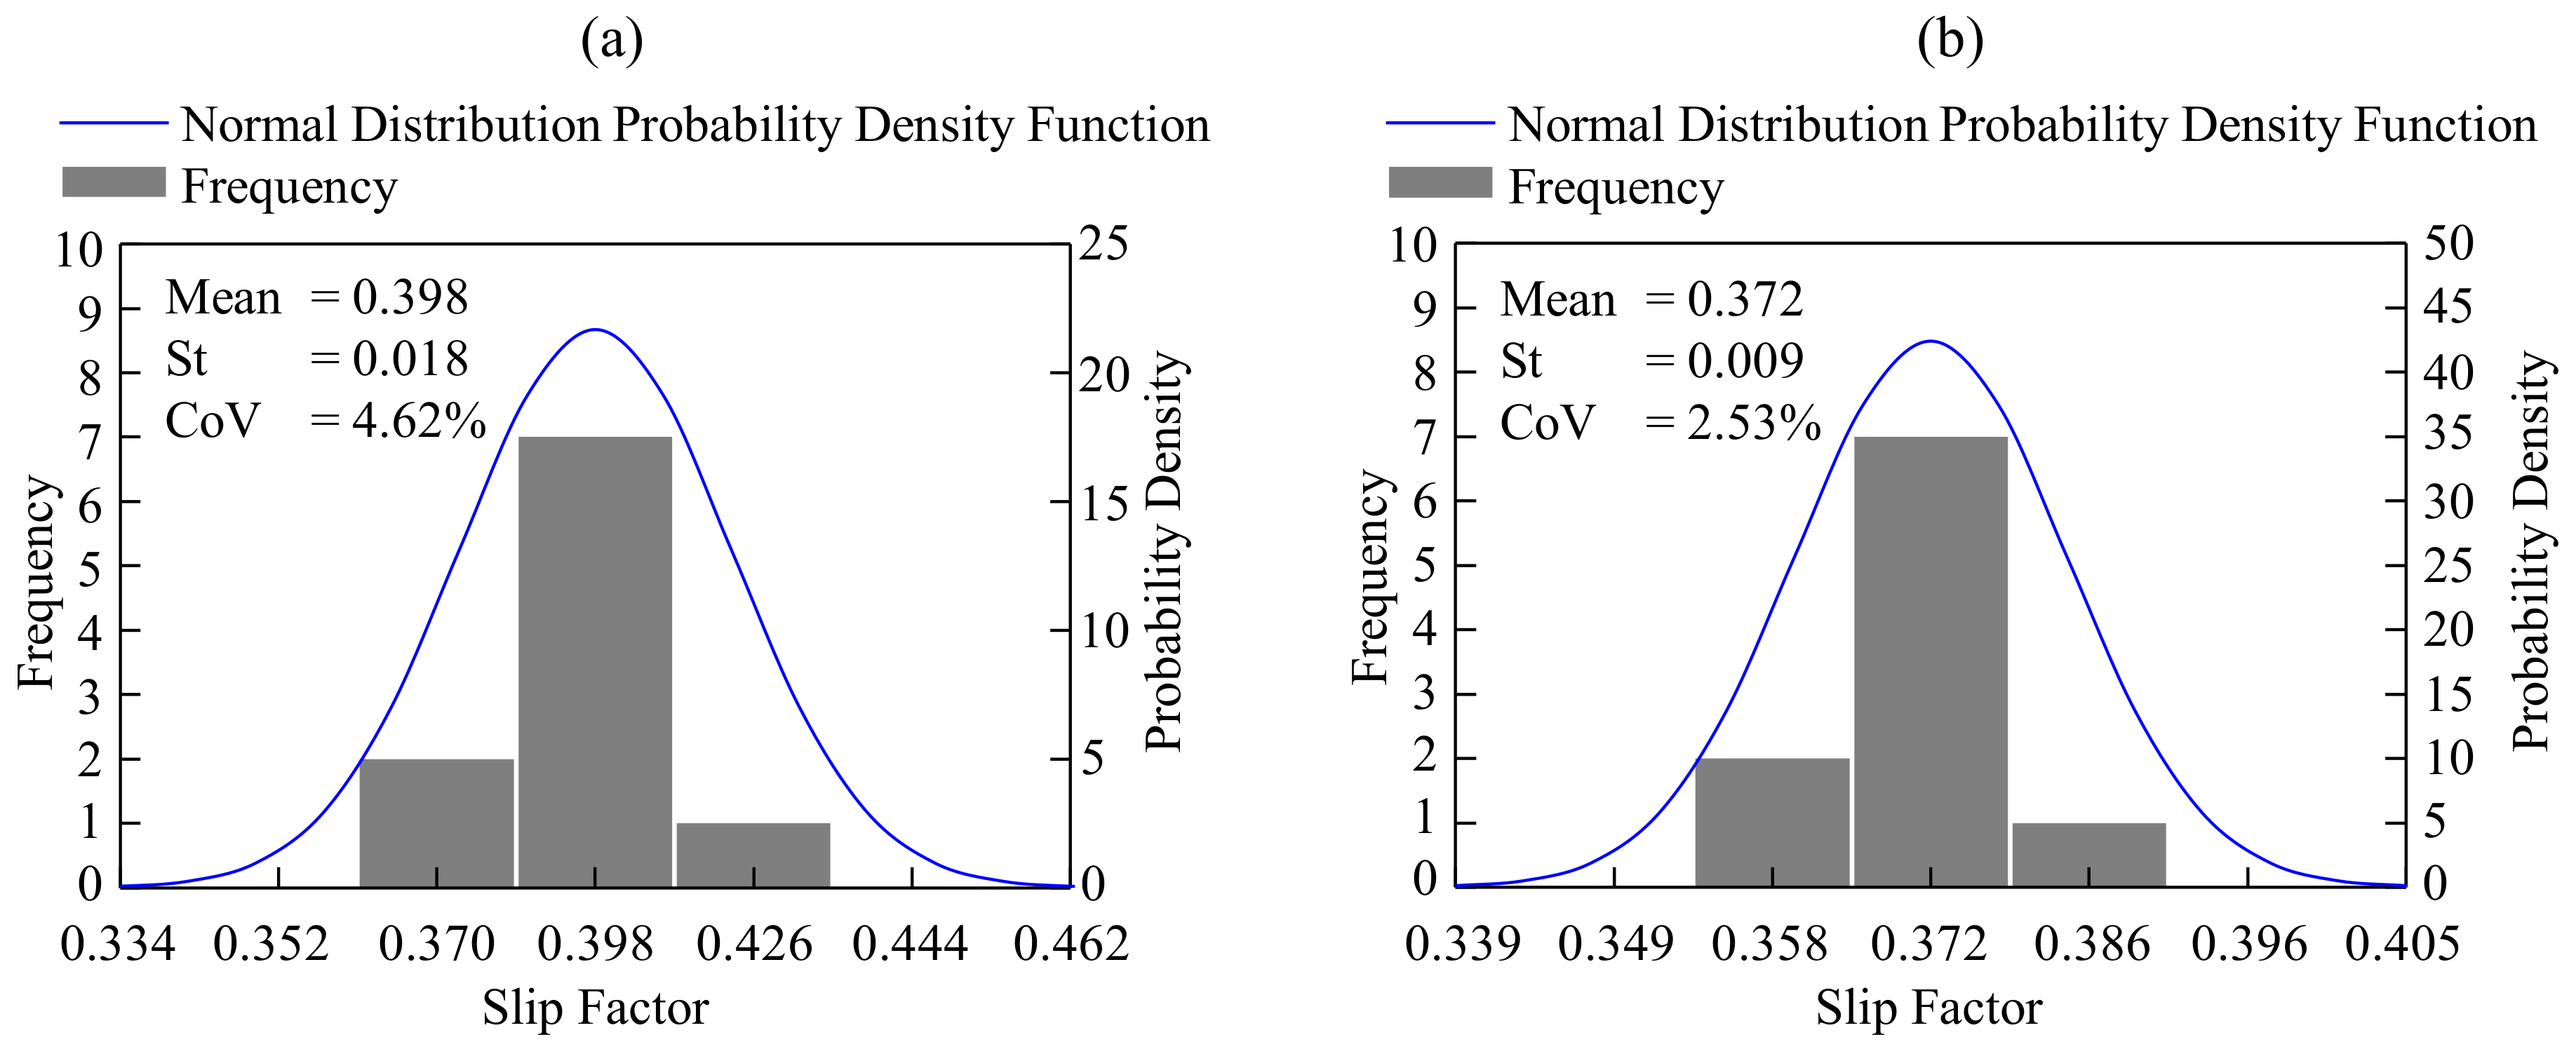
Figure 7 shows the distributions of the slip factors listed in
Table 5. Although the distributions seem to be similar, the probability density function of the calibrated nominal slip factors indicates nearly twice the relative probability for the observation of the slip factor around the mean value against the probability density of the uncalibrated slip factors. In addition, according to
Table 5 the coefficient of variation of the calibrated nominal slip factors is about 45% less than the uncalibrated ones. Therefore, it could be stated that the calibrated values of the nominal slip factors are more reliable to establish the characteristic slip factor between the CNC-cut serrated steel surfaces of S355J2.
In EN1090-2, Annex G [
12], the calculation of the characteristic slip factor is formulated with Equation (
10) for 10 slip factors determined from five tests if the creep test (Test-05) is successful (not creep-sensitive). Consequently, considering that the CNC-cut serrated steel surfaces of S355J2 were not creep sensitive (see
Figure 5 and
Table 2) the characteristic value of the slip factor between the CNC-cut serrated steel surfaces of S355J2 could be established with Equation (
10) using the mean nominal calibrated slip factor presented in
Table 5.
Figure 8 summarize the different slip-criteria and the related slip factors determined in this study. In addition, the procedure to establish the characteristic value of the slip factor is also illustrated in the figure.
EN1090-2, Annex G [
12] defines the characteristic value of the slip factor between steel surfaces prepared by wire-brushing cleaning with loose rust removal as 0.3. In addition, Lacey et al. [
10] determined the characteristic value of the slip factor between steel surfaces with clean mill scale prepared from G350 grade steel as 0.27. Inputting the calibrated nominal mean slip factor,
µm, and standard deviation,
sµ, presented in
Table 5 into Equation (
10), the characteristic value of the slip factor between the CNC-cut serrated S355J2 steel surfaces is found to be equal to 0.354,
µk=0.354, which is about %18 and 31% higher than the reference values of EN1090-2, Annex G [
12] and the reference value of the previous investigation of Lacey et al. [
10], respectively. Thus, CNC-cut serrated steel surfaces may offer optimized solutions for slip-critical structural joint configurations.
Furthermore, it is shown in
Table 2 and
Figure 6 that the CNC-cut serrated S355J2 steel surfaces are not sensitive to creep as similar to corten steel surfaces [
20] and different from hot-dip galvanized, blast-cleaned, ethyl silicate zinc and epoxy coated surface conditions [
14,
20]. Thus, it could be considered that the CNC-cutting procedure enriches the surface asperities, in other words, the surface roughness of the steel plates against creep behaviour.
On the other hand, corrosion protection treatment must be applied for practical applications of the proposed serrated steel surfaces. Consequently, the load-slip behaviour of the serrated steel surfaces may depend on the corrosion protection treatment. Therefore, to eliminate the impact of the corrosion protection treatment, it is suggested to produce the proposed CNC-cut serrated steel surfaces from corten steel plates. By this means, the proposed CNC-cut serrated steel surfaces may provide advanced load-slip behaviour with long-term reliability and durability for slip-critical structural joints.


