Article

AdaBoost-Based Back Analysis for Determining Rock Mass Mechanical Parameters of Claystones in Goupitan Tunnel, China

1
School of Civil and Architectural Engineering, Shandong University of Technology, Zibo 255000, China
2
Key Laboratory of New Technology for Construction of Cities in Mountain Area, Ministry of Education, Chongqing University, Chongqing 400045, China
3
School of Mining and Geomatics Engineering, Hebei University of Engineering, Handan 056038, China
*
Author to whom correspondence should be addressed.
Buildings 2022, 12(8), 1073; https://doi.org/10.3390/buildings12081073
Submission received: 1 June 2022 / Revised: 11 July 2022 / Accepted: 18 July 2022 / Published: 22 July 2022
(This article belongs to the Special Issue Numerical Analysis on Concrete and Rocks)

Abstract

:
The back analysis is an effective tool to determine the representative values of rock mass mechanical properties in rock engineering. The surrogate model is widely used in back analyses since analytical or numerical models are usually unavailable for practical engineering problems. This study proposes a novel back analysis framework by adopting the AdaBoost algorithm for deriving the surrogate model. Moreover, the simplicial homology global optimization (SHGO) algorithm, which is robust and applicable for a black-box global problem, is also integrated into the framework. To evaluate the performance, an experimental tunnel in Goupitan Hydropower Station, China, is introduced, and the representative rheological properties of the surrounding rock are obtained by applying the proposed framework. Then the computed displacements based on the acquired properties via both surrogate and numerical models are compared with field measurements. By taking triple-day data, the discrepancy between the calculated and field-measured displacements is less than 0.5 mm This validates the reliability of the obtained properties and the feasibility of the proposed framework. As an AdaBoost-based method, the proposed framework is sensitive to noise and outliers in the data, the elimination of which is recommended before application.

1. Introduction

The determination of rock mass parameters is essential to the design, excavation, and stability analysis in rock engineering [1] since the representative parameters of rock mass are crucial for choosing the proper engineering measures in rock excavation and support. Although the in-situ and laboratory tests are the typical methods of rock mass property determination, they always suffer from the high consumption of time and cost. Instead, the back analysis is commonly adopted in determining the soil or rock properties based on the field measurements [2]. In ordinary analyses, the mechanical properties of rock mass are required as input data, and the output of the analysis is the mechanical behavior of the rock mass. However, in back analyses, the observed mechanical behaviors are the required input, and the mechanical properties are the output to be determined [3]. The back analysis aims to find the representative values of parameters by minimizing the difference between the field measurements and the computed information via physical model and optimization techniques, which are the two essential components of back analyses. Finding a reliable physical model which describes the mechanical behavior based on the rock mass properties is usually challenging due to the inevitable complexities (e.g., local heterogeneities and unknown discontinuities [4]). Nowadays, more and more numerical models have been developed to serve as physical models with the advantages of simplicity and lower cost consumption. However, the developed numerical models become highly complex and time-consuming when the project is large in scale. It also brings challenges, such as trapping in local minima and confronting high dimensions, to the optimizing procedure.
To overcome the above issues, as an effective machine learning approach, a surrogate model was introduced into the back analysis as a substitute for physical models or complex numerical models. The surrogate model is an approximation model representing a complicated phenomenon of the systems in a computationally efficient manner [5]. Besides, a lot of soft computing techniques, such as the supporting vector machine (SVM) and high dimensional model representation (HDMR), have also been adopted in assisting in the derivation of a proper surrogate model in rock engineering [1,6,7,8]. Ren et al. [9] adopted the symbolic regression method to automatically identify the closed-form equation for predicting the fatigue property of the cement-stabilized cold recycled mixtures. Feng et al. [10] developed an artificial neural network (ANN) model to replace the FLAC (Fast Lagrangian Analysis of Continua) [11]-based numerical model to determine the mechanical parameters of rock mass in Slope of Three Gorges Permanent Lock, China. Pichler et al. [12] proposed an iterative parameter identification method, which involves ANN and genetic algorithm (GA), for back analyses. Yu et al. [13] combined the ANN and evolutionary calculations in their proposed back analysis method for the displacement of the earth-rockfill dam. Besides ANN, a support vector machine (SVM) was also used by Feng et al. [14] and Zhao et al. [15] in displacement back analyses. Although the aforementioned machine learning techniques had excellent performance in deriving surrogate models, the overfitting issue is still encountered sometimes during their applications. To avoid overfitting and improve efficiency, ensemble methods have been employed in the derivation of surrogate models. Zhang et al. [16] utilized extreme gradient boosting (XGBoost) and random forest techniques based on Bayesian optimization for the prediction of undrained shear strength. Zhao et al. [17] proposed an ensemble neural network (ENN) to predict tunnel boring machine (TBM) performance. Their proposed model can take the uncertainties embedded in the site data into account and make appropriate inferences using very limited data via the re-sampling technique. Due to their outstanding performance, the ensemble approaches were used in various studies [18,19,20,21]. Of the various existing ensemble methods, the Adaptive Boosting (AdaBoost) algorithm [22] is adopted in this study to improve the derivation of surrogate models. The AdaBoost algorithm is prevalent in both regression and classification problems. Liu et al. [23] integrated the AdaBoost algorithm with the classification and regression tree (CART) to predict the classification of surrounding rock mass. Ren et al. [24] adopted the AdaBoost algorithm in their proposed framework for determining the optimal composition of cement-based materials.
Optimization is the other essential component in back analyses. It is used to obtain the proper properties by reducing the difference between the measured and computed values via a physical model. Once the physical model is obtained, different candidate values of the concerned property are input into the physical model, based on which the mechanical behaviors are calculated and compared with the measured ones in the field. The smaller the difference between the computed and the measured behavior is, the closer the candidate input is to the representative value. When the difference is small enough and acceptable, the candidate input can be viewed as the representative value of the concerned property. The optimization algorithm carries out these steps in an effective way until the representative value is obtained. Among the various optimization methods, the simplicial homology global optimization (SHGO) algorithm is adopted in this study for determining the rock mass mechanical parameters. Obtaining the derivative information based on the numerical model and the surrogate model is difficult, and it hinders the application of traditional mathematical optimization methods to the back analysis. Several soft computing techniques, such as genetic algorithm [12,14], artificial bee colony [25], particle swarm optimization [26,27], etc., have also been utilized in optimization problems. Since trapping in the local minimum solutions is a commonly encountered issue, the global performance of the optimization algorithm is critical to the back analysis. The SHGO algorithm is a general-purpose global optimization algorithm that integrates simplicial integral homology and combinatorial topology [28]. It is believed that adopting the SHGO algorithm in this study will enhance the efficiency and guarantee the robustness of the back analysis.
The back analysis is not a novel technique in determining the rock mass properties in geotechnical engineering. It has been widely used in many subjects. Based on 93 samples, Barzegar et al. [18] developed an ensemble committee-based artificial neural network (ANN) model for the prediction of uniaxial compressive strength (UCS) of travertine rock. Yin et al. [19] constructed ensemble models via stacking techniques for rockburst intensity prediction, and the results indicate that the ensemble models perform better than the single classical models, especially for imbalanced data. Cai et al. [29] back-calculated the rock mass strength parameters from acoustic emission monitoring data in combination with elastic stress analyses. However, an effective and robust back analysis method for estimating the mechanical parameters of rock mass based on field deformation measurements in tunneling engineering is still lacking. Integrating AdaBoost and SHGO algorithms in this study will not only improve the effectiveness of the surrogate model derivation but also enhance the robustness of the back analysis.
This study aims to propose a novel back analysis framework by combining AdaBoost and SHGO algorithms to determine the mechanical parameters of the surrounding rock mass in rock engineering. The remainder of this study is arranged as follows: the concept of back analysis and the main ideas of AdaBoost and SHGO are revisited firstly; then the procedure of the proposed framework is presented in detail; to verify the proposed framework, the application to a tunnel project in Goupitan hydraulic engineering, China, is comprehensively investigated; the main results are presented, and the advantages of the proposed framework are pointed out.

2. Methodology

The back analysis is a commonly used tool for determining the proper rock mass properties in geotechnical engineering. The schematics of the back analysis are shown in Figure 1. Field measurements provide the basic data sets for the back analysis. The physical model, replaced instead with a surrogate model due to time and cost considerations, is the core of the back analysis. By selecting the proper optimization algorithm as well as the objective function, the analysis is conducted iteratively until the proper mechanical properties are obtained. The working principle of the optimization algorithm is to approach the optimal mechanical parameters by minimizing the objective function, which represents the difference between the field measurements and the calculated values determined by the physical model. In this study, the AdaBoost algorithm and SHGO algorithm are utilized in the surrogate model derivation and optimization section, respectively. The main ideas and computing details of the proposed framework are to be described briefly in this section.

2.1. Surrogate Model Derivation with AdaBoost Technique

Boosting is an efficient instrument for improving the predicting ability of learning systems both in regression and classification problems. It is also known as the lifting or enhanced learning method. AdaBoost algorithm [22] is one of the most successful boosting algorithms, with the advantages of efficiency in speed and simplicity in programming and operation [30]. The boosting technique converts weak learners, which work slightly better than random guessing, into ones with arbitrarily high accuracy [22]. Among various AdaBoost regression algorithms, the AdaBoost R2 algorithm [31] is adopted in this study for surrogate model derivation.
Assumed T = { ( x 1 , y 1 ) , ( x 2 , y 2 ) , , ( x m , y m ) } is the sample training set, including m pairs of data in total. x i and y i are the i th ( i = 1 , 2 , , m ) input and output vectors, respectively. AdaBoost algorithm calls in one weak or base learner repeatedly in a series of time intervals k = 1 , 2 , , K and the output weight of the k th weak learner is denoted as vector D ( k ) = ( w k 1 , w k 2 , , w k m ) . For the first weak learner, the weight of the i th data set can be initialized as w 1 i = 1 m , i = 1 , 2 , , m . Moreover, the output weight of the k th weak learner, D ( k ) , k = 2 , , m , should be updated according to the predecessor, i.e., the ( k 1 ) th weak learner. The maximum error of the k th weak learner can be represented as Equation (1):
E k = max | y i G k ( x i ) | , i = 1 , 2 , , m ,
where G k ( x i ) is the output of the k th weak learner. Then the relative error for the i th data set can be expressed as Equation (2), where linear error form is adopted.
e k i = | y i G k ( x i ) | E k ,
Moreover, the error rate for the k th weak learner can be obtained by Equation (3), which is the weighted summation of relative errors for each data set.
e k = i = 1 m w k i e k i ,
The weight coefficient for the k th weak learner α k can be obtained by Equation (4).
α k = e k 1 e k ,
For updating the sample weight for the successive weak learner, D ( k + 1 ) , Equation (5) is used for the calculation of each element in D ( k + 1 ) :
w k + 1 , i = w k i z k α k 1 e k i ,
where z k = i = 1 m w k i α k 1 e k i is the normalization factor for the k th weak learner.
Finally, by adopting the combination strategy, the weighted weak learner corresponding to the weight median is taken as the final strong learner, i.e., the final regressor, as shown in Equation (6):
f ( x ) = G k * ( x ) ,
where G k * ( x ) is a weak learner of all ln ( 1 / α k ) the median value corresponds to the sequence number k * , k = 1 , 2 , , K .
Although the physical model in the back analysis is usually complex and difficult to obtain, AdaBoost algorithm provides a promising method for the surrogate model derivation via the boosting technique. To avoid losing generality, the surrogate model derived via the AdaBoost algorithm, F ( X ) , can be viewed as a mapping from N dimensional inputs to Q dimensional outputs. It can be defined as in Equation (7):
Y = F ( X ) : R N R Q ,
where X = ( x 1 , x 2 , , x N ) represents a vector of N elements, which are, in this study, the N measured properties of surrounding rock mass. Y = ( y 1 , y 2 , , y Q ) , a Q dimensional vector, represents the responses induced by excavation during construction in this study. Therefore, the AdaBoost-based algorithm proposed in this study facilitates the back analysis by providing a surrogate model, which serves as a physical model, and links the material properties to the system behavior. In this study, the proposed algorithm is implemented in Python.

2.2. SHGO-Based Optimization

As aforementioned, optimization is also a necessary step in back analyses. In this study, a general-purpose global optimization algorithm, SHGO, for its efficiency and convergence speed. It is based on the applications of simplicial integral homology and combinatorial topology. Since the derivatives of objective functions are not required, and only the function evaluations are used in SHGO, it makes this algorithm applicable to black-box global optimization problems. The conduction of the SHGO algorithm mainly consists of four steps:
  • Uniform sampling point generation in the search space;
  • Construction of the directed simplicial complex;
  • Construction of the minimizer pool;
  • Local minimization using the starting points defined in the minimizer pool.
During the optimization process, the difference between the predicted system output via the physical model and measured system responses is expressed as the objective function. In this study, the root mean square (RMS) is adopted as the objective function, and the expression is shown in Equation (8):
R M S = 1 N i = 1 N ( y i ^ y i ) 2 ,
where y i ^ and y i are the i th predicted system outputs and measured system responses, respectively. N is the number of measurements.

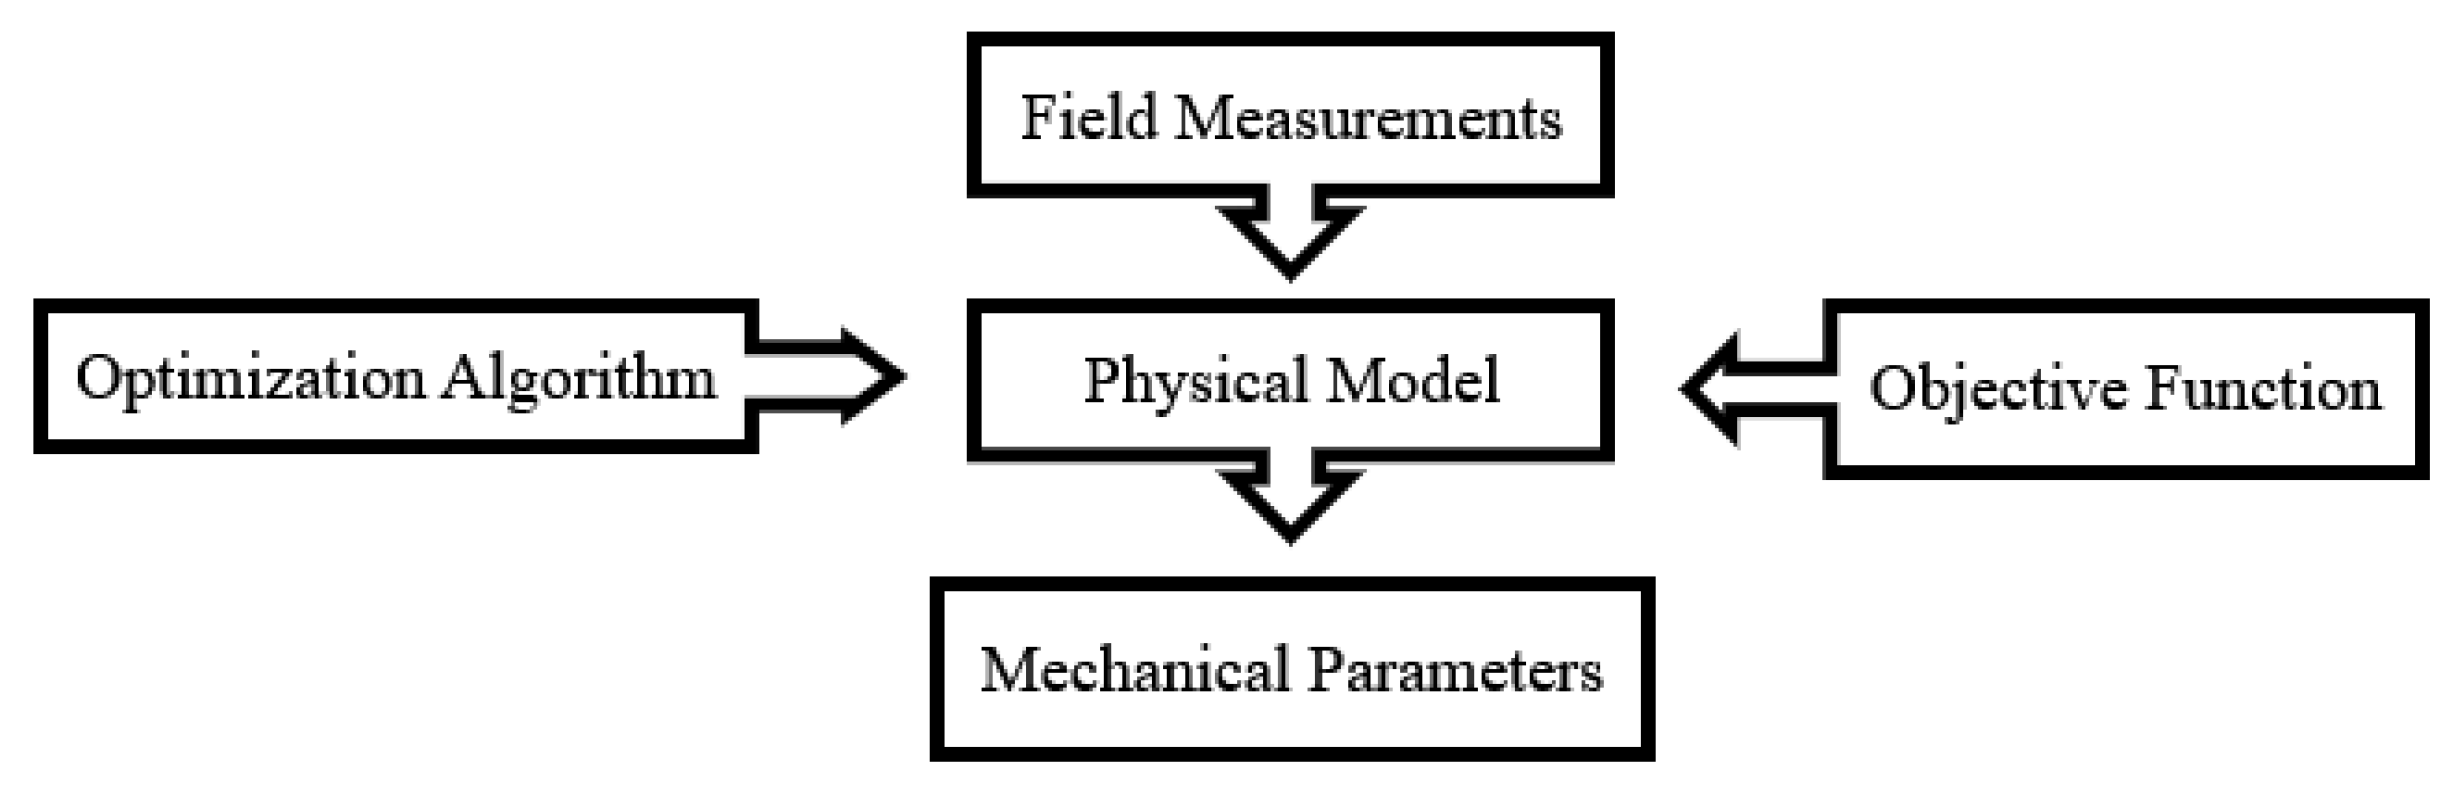
2.3. Procedures of Proposed Framework

Based on the AdaBoost technique and SHGO algorithm, an integrated back analysis framework for rock engineering is proposed in this study. AdaBoost technique facilitates the derivation of the surrogate model, which serves as a physical model and describes the relationship between the properties of surrounding rock mass and their responses during excavation. SHGO algorithm is adopted for optimization sessions in back analysis. The flowchart of the proposed framework is shown in Figure 2 and the procedures are as follows.
  • Step 1: Collect the project information.
  • Step 2: Generate the training data based on numerical simulation via the experimental design. The training data consist of not only the numerical model configurations but also the rheological responses.
  • Step 3: Derive the surrogate model based on AdaBoost algorithm to capture the nonlinear relationship between the mechanical parameters of surrounding rock mass and the corresponding responses during excavation.
  • Step 4: Conduct the optimization via SHGO based on RMS objective function. Then the most likely representative mechanical properties can be obtained. Then the results can be applied in the stability analysis, design scheme optimization, and other works.
The proposed framework is mainly based on the AdaBoost and SGHO algorithms and implemented in Python and the SciPy package [32].

3. Application

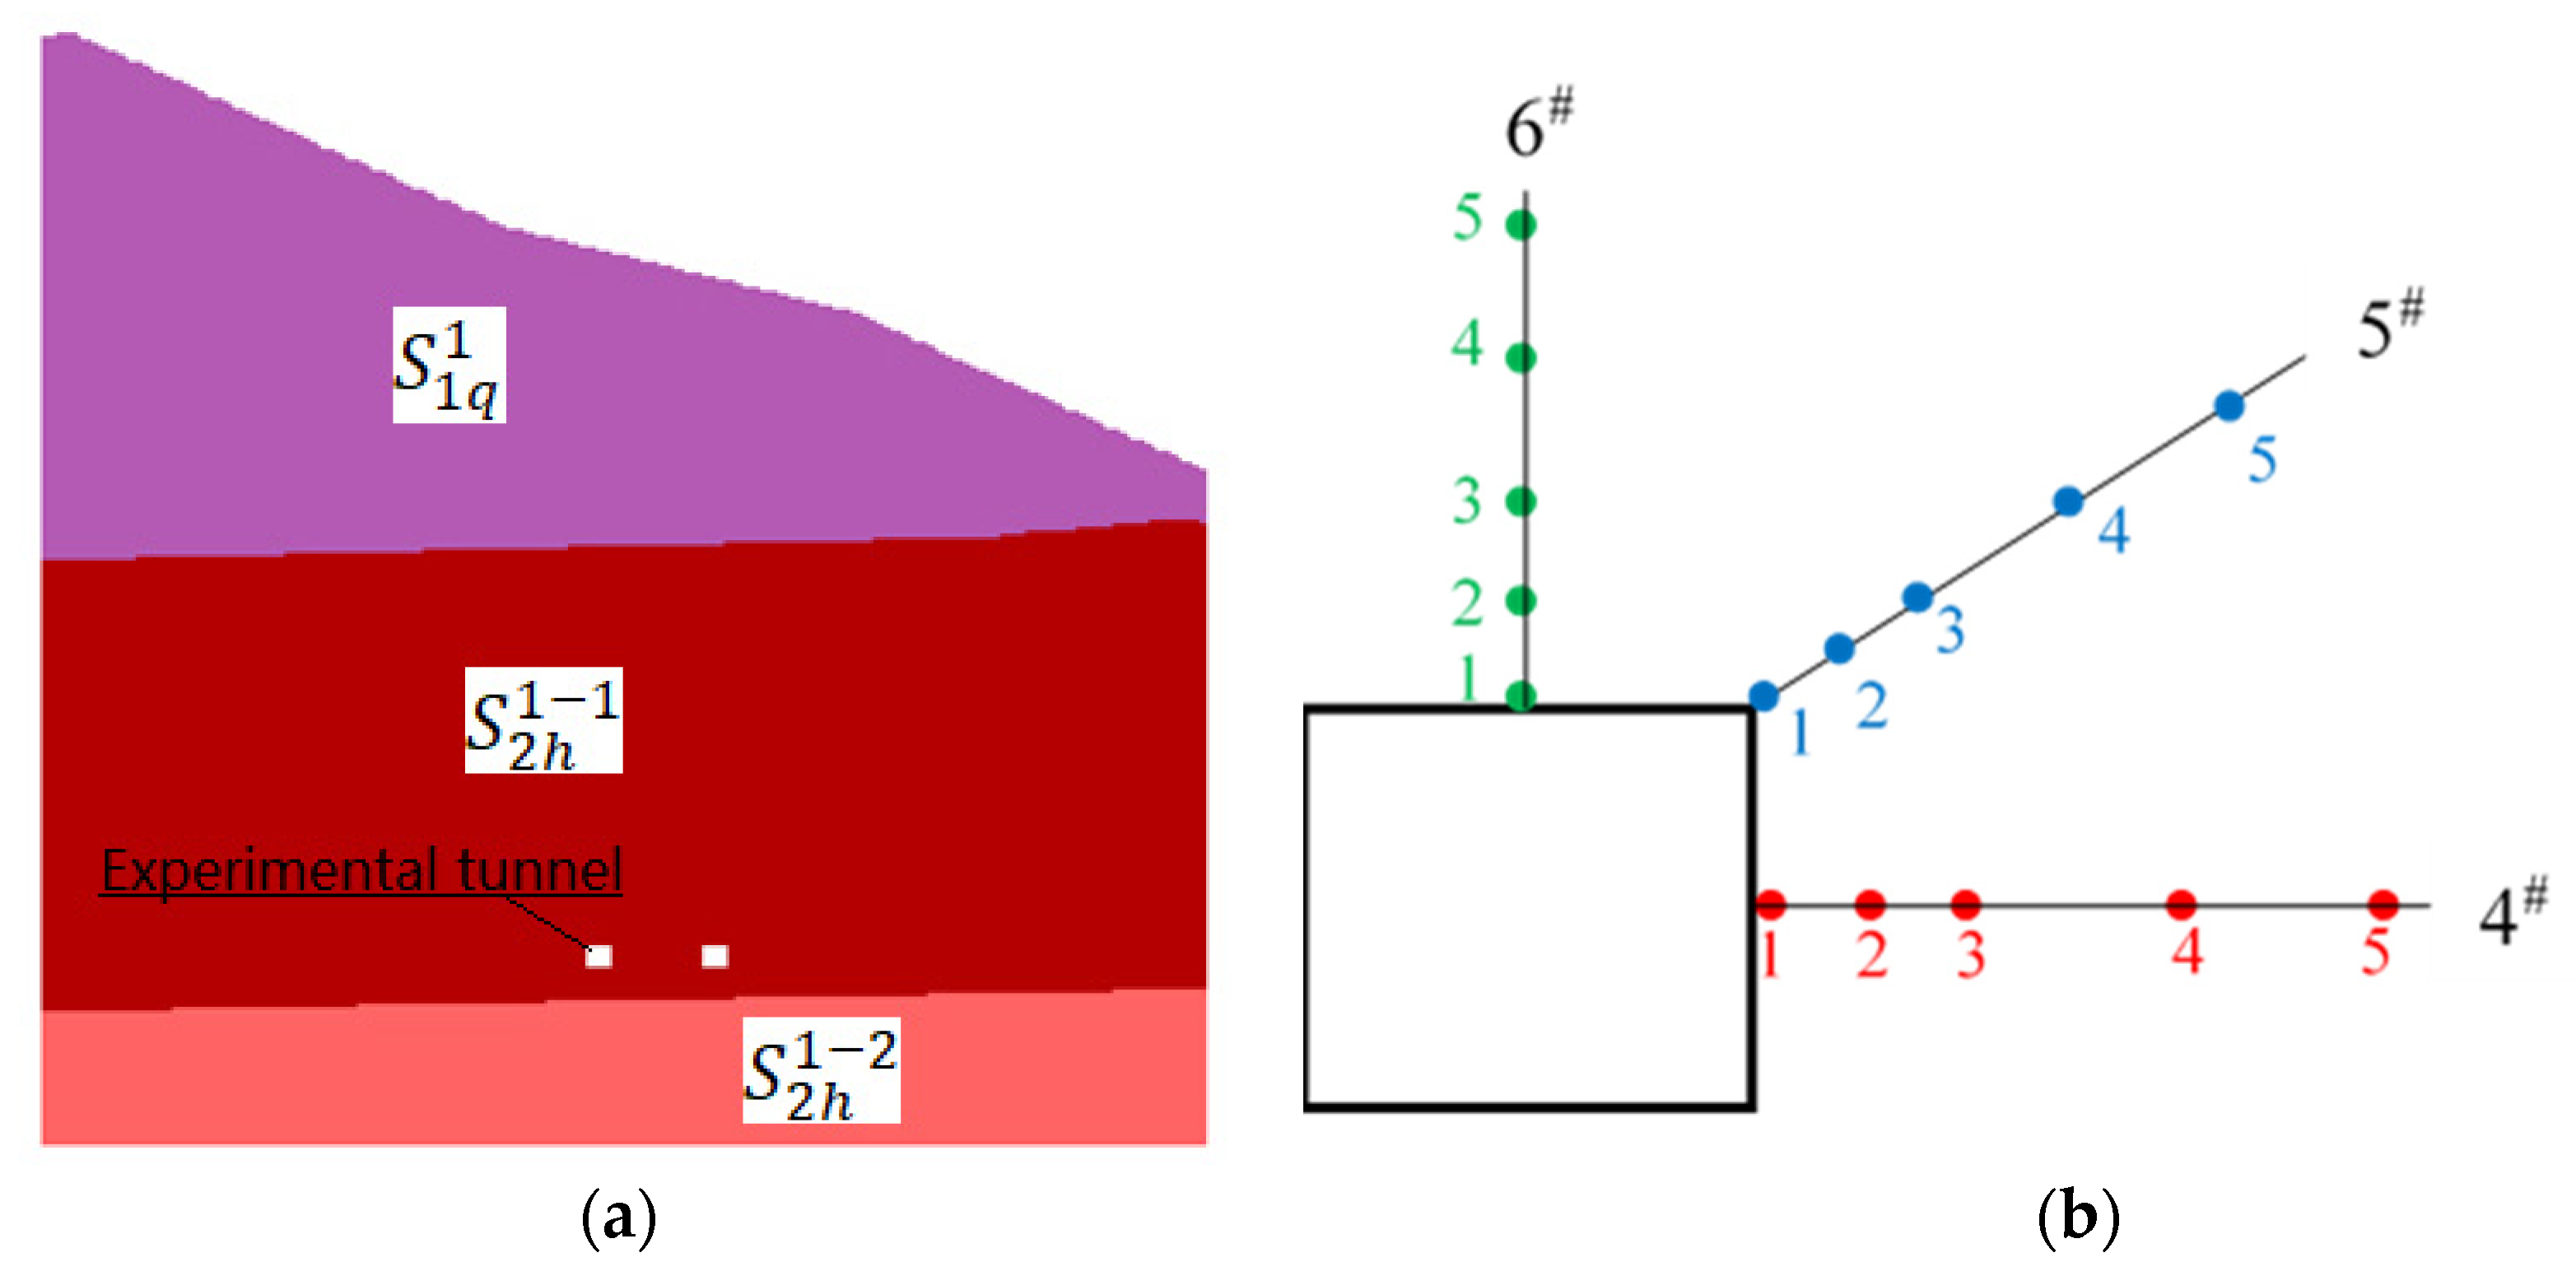
3.1. Project Overview

In order to verify the proposed framework, a practical tunneling engineering project, Goupitan Hydropower Station, was examined in this study. The project is located in Wujiang, Guizhou Province of China. It is a landmark of China’s West-East electricity transmission project [33]. The preliminary design report of the project states that the tailwater tunnel of the underground powerhouse on the right-hand bank and the construction diversion tunnel pass through a soft claystone rock mass. The geological conditions and monitoring configurations are shown in Figure 3. There are three geological layers in this site, and they are labeled as S 1 q 1 , S 2 h 1 1 and S 2 h 1 2 . Below the overburdened rock layer S 1 q 1 , S 2 h 1 1 and S 2 h 1 2 are a grey-green claystone layer and a mauve claystone layer, respectively. An experimental tunnel was excavated to investigate the rheological behavior of the claystone. The dimensions of the tunnel cross-section are 2 m × 2 m, in width and height. The experimental tunnel was excavated through rock layer S 2 h 1 1 . It is 3 m above the underlying layer, S 2 h 1 2 and 70 m deep from the ground surface. To monitor the deformation of surrounding rock after excavation, three boreholes, labeled as 4#, 5#, and 6# in Figure 3, were drilled at a depth of 11.6 m with a length of 7 m. The orientations of boreholes 4# and 6# are horizontal and vertical, respectively, and borehole 5# is inclined at 45°. Along each monitoring borehole, the monitoring instruments were placed at five monitoring points at depths of 0, 1, 2, 4, and 6 m, respectively. Once the monitoring instruments were set up successfully, the displacements of each point were measured and recorded continuously. As a part of field measurements, the relative displacements of monitoring point 5 with respect to point 1 of each borehole are summarized in Table 1.

3.2. Surrogate Model Derivation
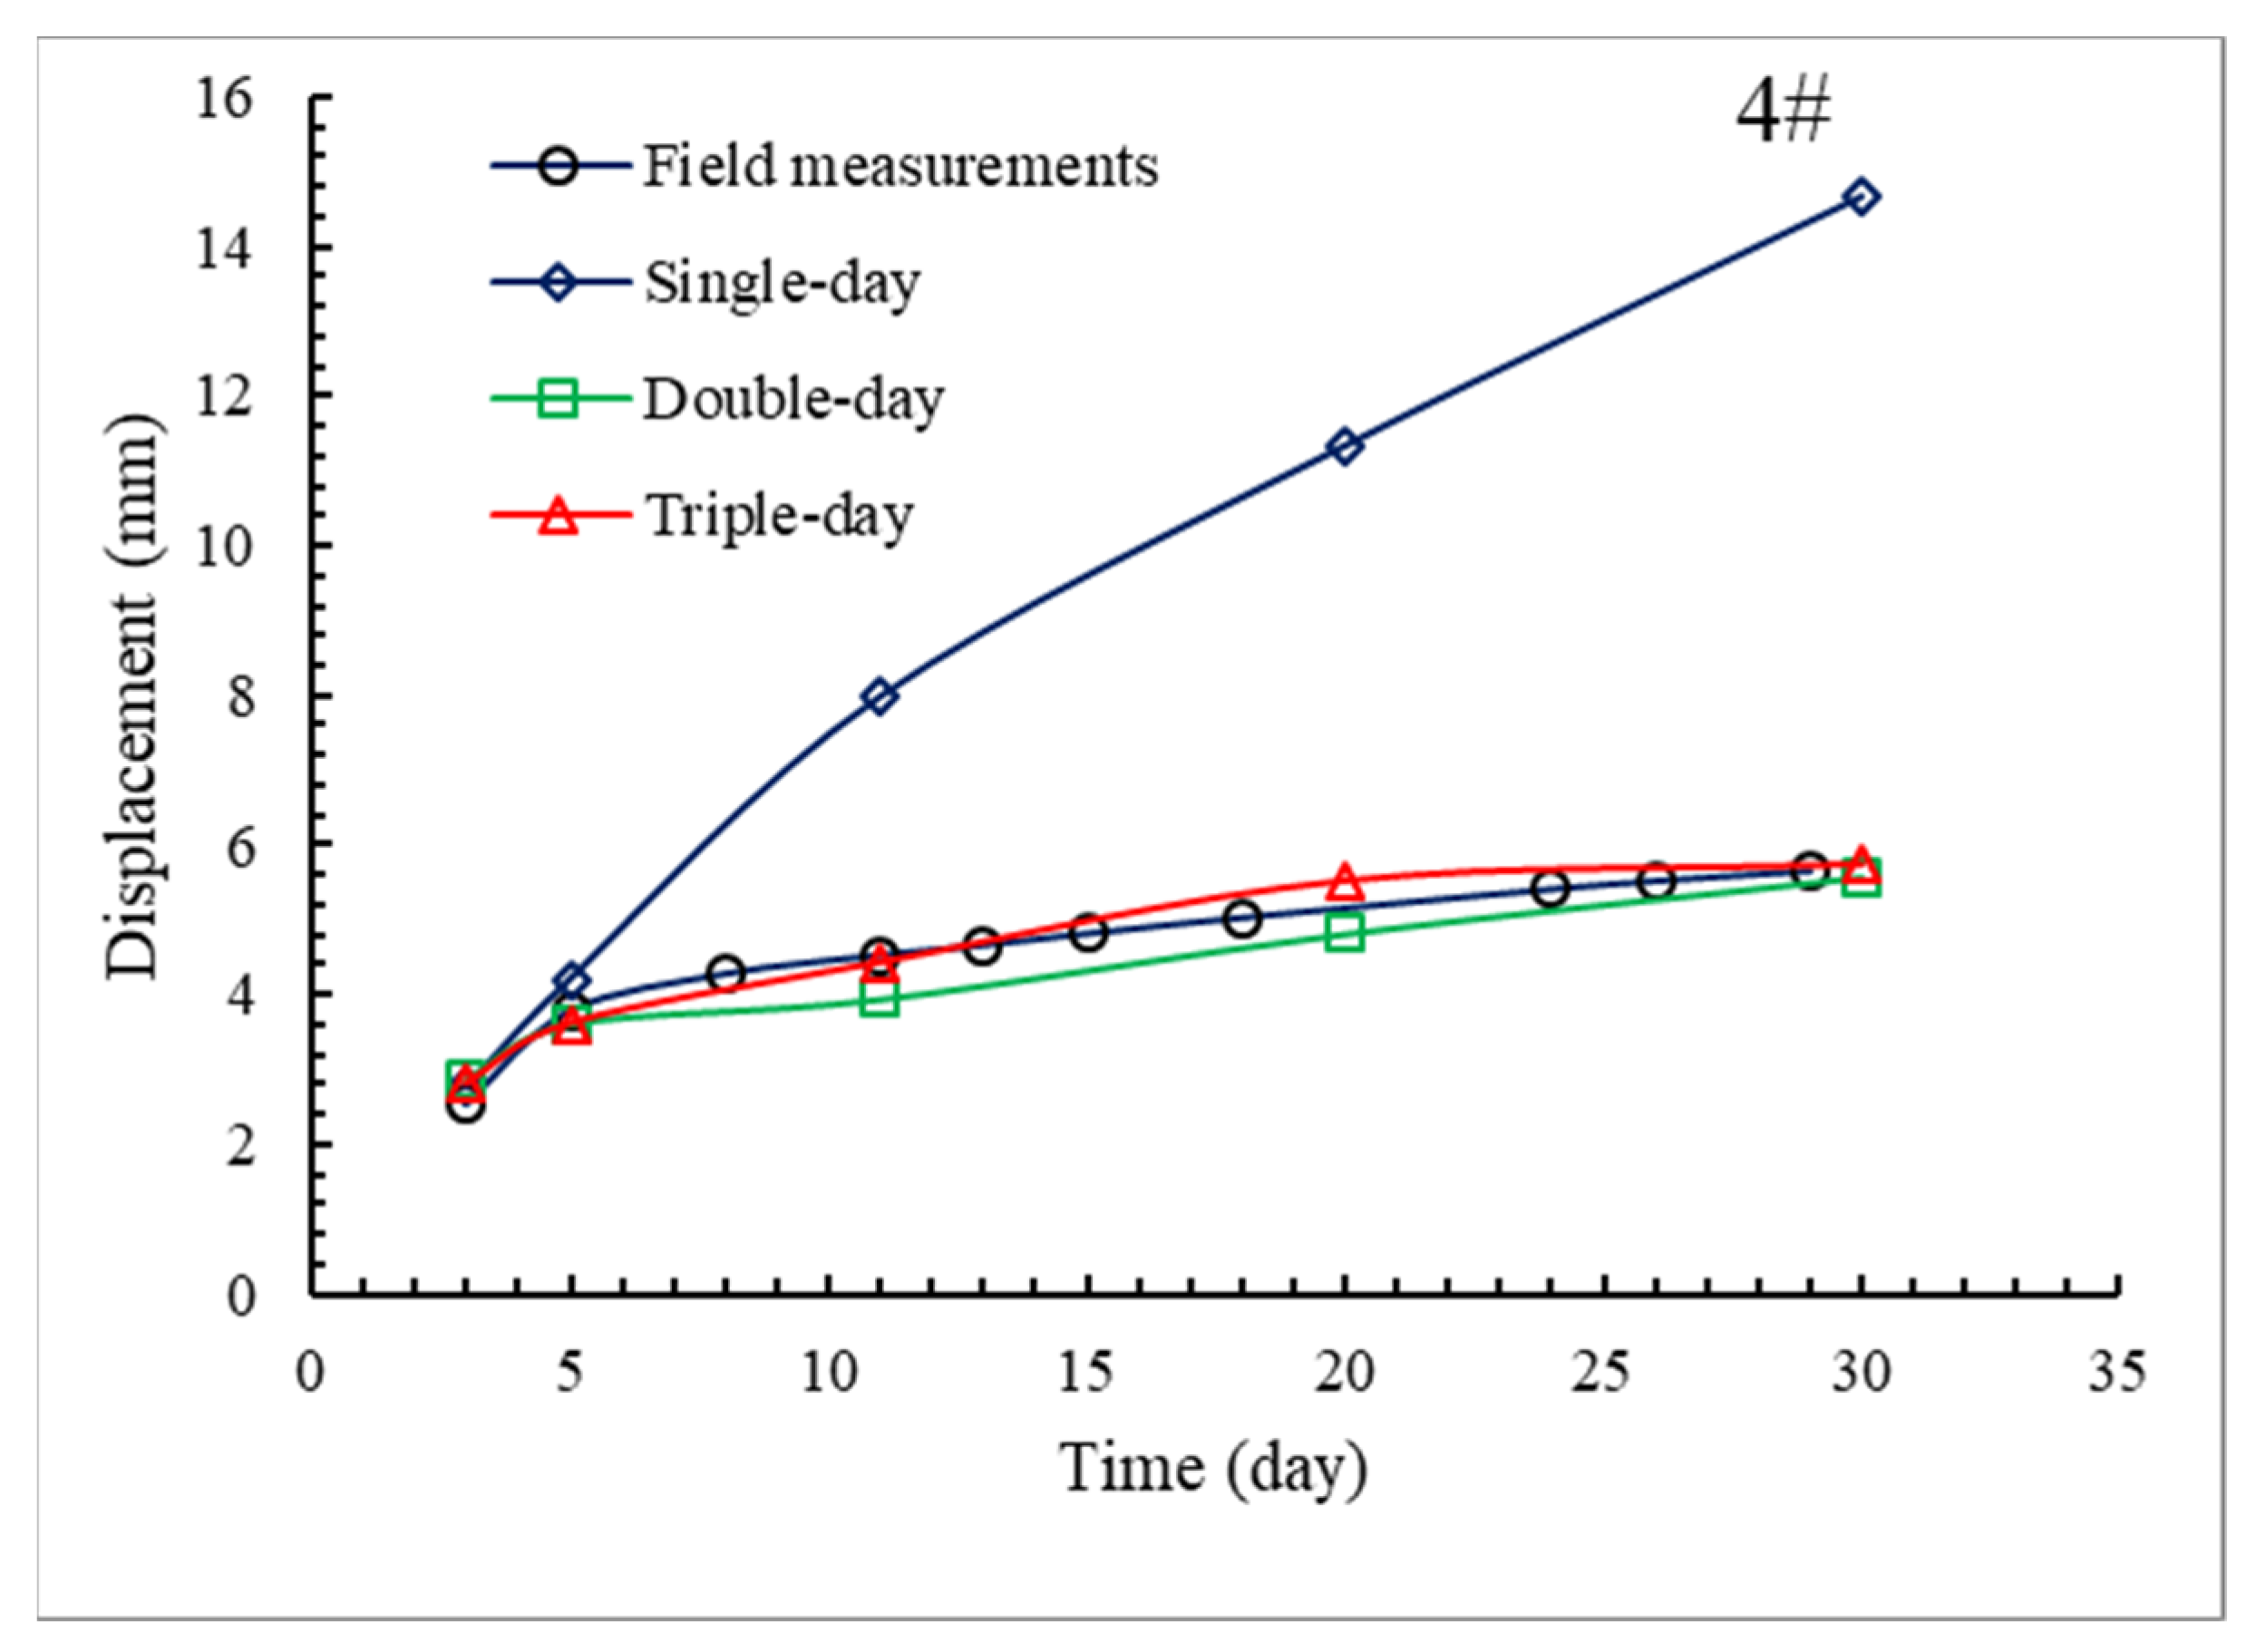
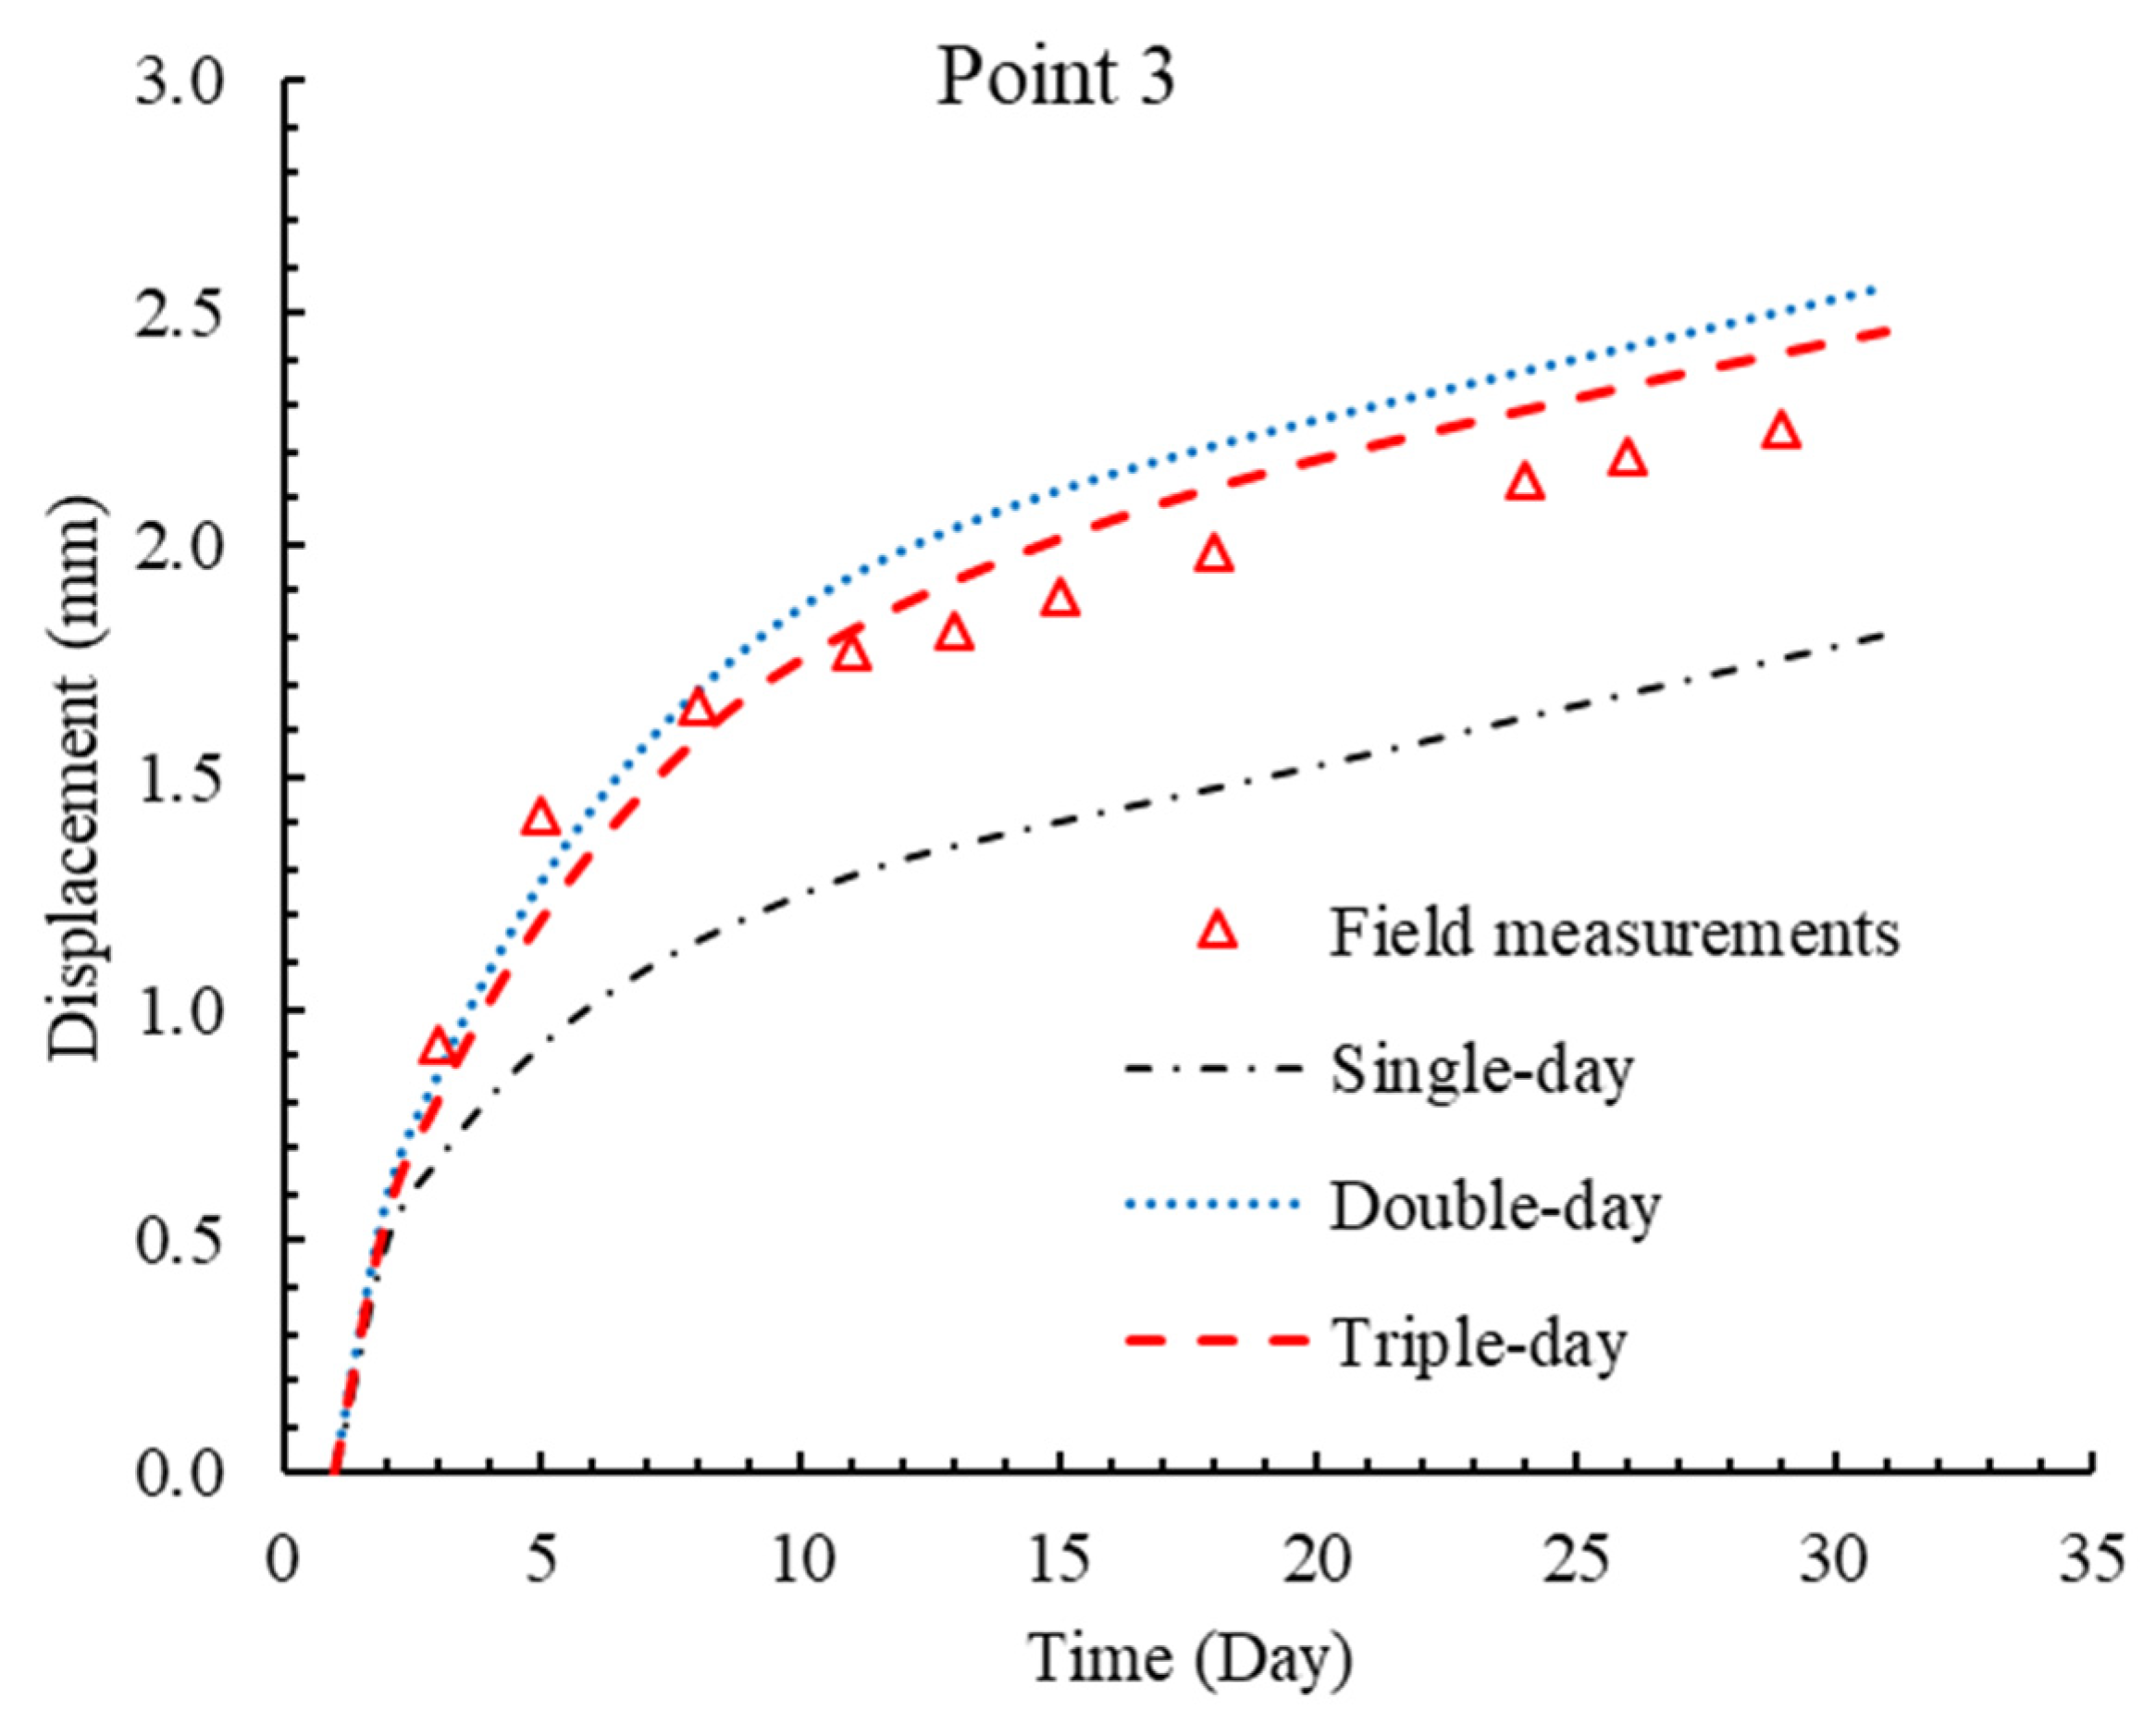
As aforementioned, the analytical model to predict the surrounding rock mass mechanical behavior is usually impossible for a practical project. To conduct the back analysis, the proposed framework and numerical simulation via FLAC software [34] were adopted here for deriving the surrogate model. Based on the ground investigation information, the numerical model was constructed as shown in Figure 4. The maximum dimensions of the numerical model were up to 100 m × 100 m to reduce the boundary effect. The roller supports were used for both vertical and bottom boundaries as boundary conditions such that only vertical movement was allowed along vertical boundaries and only horizontal movement was allowed along the bottom boundary. No support was assigned to the top boundary of the model, and it could deform freely. The mesh was refined around the tunnels to capture the more precise behavior of the surrounding rock. Three materials were adopted for different rock layers. The upper rock layer S 1 q 1 was assumed to be elastic with Young’s modulus 28 GPa and a Poisson’s ratio of 0.25. Rock layers S 2 h 1 1 and S 2 h 1 2 were assumed to be Burgers material [35,36] with different rheological properties. Based on the laboratory and in-situ tests, the range of rheological properties of layers S 2 h 1 1 and S 2 h 1 2 was able to be obtained as listed in Table 2. Moreover, the average bulk unit weight, 0.0265 MN/m3, was shared by all three rock layers.
According to the uniform design method and the prior information of relative mechanical properties, in total 42 training numerical model samples were generated. For each model, the rheological process was simulated via FLAC, and the evolution of displacements at given positions was recorded. By involving the configurations and rheological behaviors of all the samples in the proposed AdaBoost-based framework, a surrogate model linking rheological properties and concerned displacements was derived.
To verify the derived surrogate model, ten numerical testing models were generated as well. For each test model, the rheological properties were generated randomly according to Table 2, and the mechanical responses were obtained through numerical simulation via FLAC. The relative displacements between monitoring points 1 and 5 along 4# borehole predicted by the surrogate model and those directly from FLAC, for both training and testing models, are shown in Figure 5. Three different time points, Day 3, Day 5, and Day 11, were chosen to trace the evolutions of displacements. The coefficient of determination, denoted as R 2 , was also adopted here to indicate the goodness of fit of the surrogate models to the numerical models. Good agreements and higher R 2 values (more than 0.97) were able to be observed for the training samples for all three time points. Although lower R 2 values, ranging from 0.818 to 0.944, were found for testing samples, the displacements from surrogate models and numerical models agreed well for most testing samples, except for a few specific cases, e.g., Sample 2 on Day 3 and Sample 7 on Day 11. For most testing and training samples, the discrepancies were less than 0.5 mm. The largest discrepancy was about 2 mm and took place in Testing Sample 7 on Day 11. Similar conclusions can be drawn by comparing the results along 6# borehole shown in Figure 6. The largest discrepancy between the displacements from the surrogate model and numerical model happened in Testing Sample 7 on Day 11 and was about 2.5 mm. Therefore, it was proved that the derived surrogate model can also capture the nonlinear behavior of surrounding rock, and that the performance is acceptable. Considering the balance between efficiency and performance, the derived surrogate model is believed to be a good choice for back analyses.

3.3. Back-Analysis

To obtain the proper rheological parameters via back analysis, the field measurements (Table 1), as well as the derived surrogate model, were adopted into the SHGO-based optimization process within the proposed framework. Table 3 summarizes the obtained representative rheological properties of rock layers S 2 h 1 1 and S 2 h 1 2 . Based on the data involved in the back analysis, there are three types of field data: single-day, double-day, and triple-day. Single-day data include only the field data on Day 3; double-day data include the field data both on Days 3 and 5; triple-day data include the field data on Days 3, 5, and 11. Different values were found for rheological properties by using a different type of field data.
The obtained representative rheological properties shown in Table 3 were further examined. Figure 7 shows the predicted displacements via surrogate model based on different types of field data along 4# borehole. The field monitored displacements are also provided for reference. The predicted displacements based on the single-day data matched the field measurements well on Days 3 and 5. However, the discrepancy increased dramatically after Day 5. This suggests that the obtained rheological properties based on only Day 3 data are less capable of conducting a long-term prediction. Even for Day 11, which was not long after Day 3, the increasing discrepancy was as large as 4 mm, approximately equal to the field measurement itself. This is less reliable in guiding the long-term tunnel excavation in practice. As observed clearly in Figure 7, the performance is much improved if double-day back analysis results are used. An even better agreement of the predicted displacements via the surrogate model with the field measurements can be found by taking the rheological properties based on triple-day data. From Day 3 to Day 30, the discrepancy of the predicted displacement via surrogate model from the field measurements remained below 0.5 mm. Similar observations can also be found in Figure 8, which shows the predicted displacements via surrogate model based on the different types of field data along 6# borehole. The predicted displacement based on single-day data increased faster than the field measurements and became less and less reliable as time went on. For Day 30, the predicted displacement was about 14 mm, which is greater than four times the field measurement. The discrepancies of the predicted displacements based on double-day data from triple-day data along 6# borehole were smaller than those along 4# borehole. However, significant improvement can also be observed by taking double- or triple-day data compared to single-day data. This confirms that more field-monitored data can provide more accurate predictions and suggests that the rheological properties obtained based on triple-day data are reliable representatives of the surrounding rock mass.
Besides the surrogate model, the numerical model can also be used to examine the obtained rheological properties in Table 3. By assigning the obtained rheological properties based on different types of field data, the numerical models were executed, and the mechanical behaviors were recorded. Rather than the relative displacement between monitoring points 1 and 5, the displacement of monitoring point 3 along 4# borehole was examined here. Figure 9 compares the monitored displacements and those calculated via numerical models with the different obtained rheological properties. It was observed that the calculated displacements based on triple-day rheological properties agreed well with the monitored field results. This further validates the reliability of the obtained rheological properties and the feasibility of the proposed back analysis framework.

3.4. Discussion

This section demonstrated the application of the proposed back analysis framework on the Goupitan Hydropower Station project. Numerical models were adopted in the surrogate model derivation since the practical project is usually complex and no analytical solution was available. The derived surrogate model was verified through the comparison between displacements from the surrogate model and the numerical model. In terms of R 2 values, the surrogate models for all the time points had good fitting effects greater than 0.818 for 4# borehole and greater than 0.701 for 6# borehole. The R 2 values for testing data were lower than those for training data. This is reasonable since the derivation was conducted based on training data. Based on the derived surrogate model, a back analysis was conducted via the SHGO algorithm, and the representative values were obtained for rheological properties. It is less practical to verify the obtained values directly by investigating the claystone properties via an in-situ test. As a test tunnel, the displacements along the borehole are much more meaningful than the rheological properties themselves. Therefore, the predicted displacements, both from the numerical model and surrogate model, were chosen for verifying the back analysis results. Compared with the field measurements, the predicted displacements based on the different types of field data (single-, double- and triple-day) showed different reliabilities. The agreements of predicted displacements to the field measurements were much improved when double- or triple-day data were taken into account, instead of single-day data.
The proposed framework is efficient and robust since it adopts AdaBoost and SHGO algorithms in surrogate model derivation and optimization, respectively. It can be widely applied to similar projects when prior knowledge of the concerned parameters and field measurements are available. However, as a boosting technique, the AdaBoost algorithm is sensitive to noise and outliers in the data. Therefore, it is highly recommended to eliminate the noise and outliers in the data before using the proposed framework.

4. Conclusions

The back analysis is a common and effective tool for finding the representative values of mechanical properties of rock mass for rock engineering. A novel framework combining AdaBoost and SHGO algorithms is proposed in this study. The AdaBoost algorithm is used to derive the surrogate model for predicting system outputs (e.g., mechanical behavior of surrounding rock in tunneling) in a computationally efficient manner. The SHGO-based optimization approach adopted in the proposed framework only requires function evaluations. This provides the framework with more robustness. The main procedures of the framework were presented, and the main ideas of the relative algorithms were revisited. Goupitan Hydropower Station was then introduced as a case study, in order to evaluate the proposed back analysis framework. The surrogate models, which describe the relationship between surrounding rock displacement and rheological properties, were derived via numerical models based on FLAC software. By comparing the monitored displacements and computed displacements from the derived surrogate model, the discrepancies for most samples were found to be less than 0.5 mm. It was validated that the derived surrogate model via the AdaBoost algorithm can also capture the nonlinear mechanical response of surrounding rock, and that the performance is acceptable. Then the representative values of rheological properties were able to be obtained by utilizing the SHGO algorithm within the proposed framework. The obtained properties were further examined by comparing the monitored displacements with the calculated displacements via surrogate model and numerical model, respectively. The predicted displacements based on single-day data were less reliable, and they cannot be used for long-term prediction. By adopting double-day or triple-day data, the agreements were significantly improved. For the whole monitoring period, the discrepancy between the calculated displacement, via either the surrogate model or numerical model, and the field measurements were kept below 0.5 mm. The reliability of the obtained rheological properties and the feasibility of the proposed back analysis framework were confirmed.

Author Contributions

Conceptualization, H.Z.; Writing Original draft: H.Z. and L.Z.; Writing-Review & Editing: L.Z. and J.R.; Investigation: J.R., M.W. and Z.M.; Visualization: M.W. and Z.M. All authors have read and agreed to the published version of the manuscript.

Funding

This study is sponsored in part by Key Laboratory of New Technology for Construction of Cities in Mountain Area, Ministry of Education, Chongqing University, Chongqing 400045, China under open fund LNTCCMA-20220110.

Institutional Review Board Statement

Not applicable.

Informed Consent Statement

Not applicable.

Data Availability Statement

Not applicable.

Conflicts of Interest

The authors declare no conflict of interest.

References

  1. Zhao, H.; Chen, B.; Li, S.; Li, Z.; Zhu, C. Updating the Models and Uncertainty of Mechanical Parameters for Rock Tunnels Using Bayesian Inference. Geosci. Front. 2021, 12, 101198. [Google Scholar] [CrossRef]
  2. Ledesma, A.; Gens, A.; Alonso, E.E. Parameter and Variance Estimation in Geotechnical Backanalysis Using Prior Information. Int. J. Numer. Anal. Methods Geomech. 1996, 20, 119–141. [Google Scholar] [CrossRef]
  3. Sakurai, S. Back Analysis in Rock Engineering Practice; CRC Press: Boca Raton, FL, USA, 2017; ISBN 9781317481942. [Google Scholar]
  4. Azarafza, M.; Akgün, H.; Asghari-Kaljahi, E. Stochastic Geometry Model of Rock Mass Fracture Network in Tunnels. Q. J. Eng. Geol. Hydrogeol. 2018, 51, 379–386. [Google Scholar] [CrossRef]
  5. Hwang, S.; Choi, S.-K. Deep Learning-Based Surrogate Modeling via Physics-Informed Artificial Image (PiAI) for Strongly Coupled Multidisciplinary Engineering Systems. Knowl.-Based Syst. 2021, 232, 107446. [Google Scholar] [CrossRef]
  6. Zhao, H.; Chen, B. Inverse Analysis for Rock Mechanics Based on a High Dimensional Model Representation. Inverse Probl. Sci. Eng. 2021, 80, 6429–6443. [Google Scholar] [CrossRef]
  7. Zhang, W.; Zhang, R.; Wu, C.; Goh, A.T.C.; Lacasse, S.; Liu, Z.; Liu, H. State-of-the-Art Review of Soft Computing Applications in Underground Excavations. Geosci. Front. 2020, 11, 1095–1106. [Google Scholar] [CrossRef]
  8. Zhao, H. A Practical and Efficient Reliability-Based Design Optimization Method for Rock Tunnel Support. Tunn. Undergr. Sp. Technol. Inc. Trenchless Technol. Res. 2022, 127, 104587. [Google Scholar] [CrossRef]
  9. Ren, J.; Zhang, L.; Zhao, H.; Zhao, Z.; Wang, S. Determination of the Fatigue Equation for the Cement-Stabilized Cold Recycled Mixtures with Road Construction Waste Materials Based on Data-Driven. Int. J. Fatigue 2022, 158, 106765. [Google Scholar] [CrossRef]
  10. Feng, X.T.; Zhang, Z.; Sheng, Q. Estimating Mechanical Rock Mass Parameters Relating to the Three Gorges Project Permanent Shiplock Using an Intelligent Displacement Back Analysis Method. Int. J. Rock Mech. Min. Sci. 2000, 37, 1039–1054. [Google Scholar] [CrossRef]
  11. Itasca FLAC Fast Lagrangian Analysis of Continua, v. 3.3. User’s Manual; Itasca Consulting Group, Inc.: Minneapolis, MN, USA, 1995. [Google Scholar]
  12. Pichler, B.; Lackner, R.; Mang, H.A. Back Analysis of Model Parameters in Geotechnical Engineering by Means of Soft Computing. Int. J. Numer. Methods Eng. 2003, 57, 1943–1978. [Google Scholar] [CrossRef]
  13. Yu, Y.; Zhang, B.; Yuan, H. An Intelligent Displacement Back-Analysis Method for Earth-Rockfill Dams. Comput. Geotech. 2007, 34, 423–434. [Google Scholar] [CrossRef]
  14. Feng, X.T.; Zhao, H.; Li, S. A New Displacement Back Analysis to Identify Mechanical Geo-Material Parameters Based on Hybrid Intelligent Methodology. Int. J. Numer. Anal. Methods Geomech. 2004, 28, 1141–1165. [Google Scholar] [CrossRef]
  15. Zhao, H.; Ru, Z.; Yin, S. A Practical Indirect Back Analysis Approach for Geomechanical Parameters Identification. Mar. Georesources Geotechnol. 2015, 33, 212–221. [Google Scholar] [CrossRef]
  16. Zhang, W.; Wu, C.; Zhong, H.; Li, Y.; Wang, L. Prediction of Undrained Shear Strength Using Extreme Gradient Boosting and Random Forest Based on Bayesian Optimization. Geosci. Front. 2021, 12, 469–477. [Google Scholar] [CrossRef]
  17. Zhao, Z.; Gong, Q.; Zhang, Y.; Zhao, J. Prediction Model of Tunnel Boring Machine Performance by Ensemble Neural Networks. Geomech. Geoengin. 2007, 2, 123–128. [Google Scholar] [CrossRef]
  18. Barzegar, R.; Sattarpour, M.; Deo, R.; Fijani, E.; Adamowski, J. An Ensemble Tree-Based Machine Learning Model for Predicting the Uniaxial Compressive Strength of Travertine Rocks. Neural Comput. Appl. 2020, 32, 9065–9080. [Google Scholar] [CrossRef]
  19. Yin, X.; Liu, Q.; Pan, Y.; Huang, X.; Wu, J.; Wang, X. Strength of Stacking Technique of Ensemble Learning in Rockburst Prediction with Imbalanced Data: Comparison of Eight Single and Ensemble Models. Nat. Resour. Res. 2021, 30, 1795–1815. [Google Scholar] [CrossRef]
  20. Zhang, W.; Li, H.; Han, L.; Chen, L.; Wang, L. Slope Stability Prediction Using Ensemble Learning Techniques: A Case Study in Yunyang County, Chongqing, China. J. Rock Mech. Geotech. Eng. 2022; in press. [Google Scholar] [CrossRef]
  21. Azarafza, M.; Nanehkaran, Y.A.; Rajabion, L.; Akgün, H.; Rahnamarad, J.; Derakhshani, R.; Raoof, A. Application of the Modified Q-Slope Classification System for Sedimentary Rock Slope Stability Assessment in Iran. Eng. Geol. 2020, 264, 105349. [Google Scholar] [CrossRef]
  22. Freund, Y.; Schapire, R.E. A Decision-Theoretic Generalization of On-Line Learning and an Application to Boosting. J. Comput. Syst. Sci. 1997, 55, 119–139. [Google Scholar] [CrossRef] [Green Version]
  23. Liu, Q.; Wang, X.; Huang, X.; Yin, X. Prediction Model of Rock Mass Class Using Classification and Regression Tree Integrated AdaBoost Algorithm Based on TBM Driving Data. Tunn. Undergr. Sp. Technol. 2020, 106, 103595. [Google Scholar] [CrossRef]
  24. Ren, J.; Zhao, H.; Zhang, L.; Zhao, Z.; Xu, Y.; Cheng, Y.; Wang, M.; Chen, J.; Wang, J. Design Optimization of Cement Grouting Material Based on Adaptive Boosting Algorithm and Simplicial Homology Global Optimization. J. Build. Eng. 2022, 49, 104049. [Google Scholar] [CrossRef]
  25. Zhao, H.; Yin, S. Inverse Analysis of Geomechanical Parameters by the Artificial Bee Colony Algorithm and Multi-Output Support Vector Machine. Inverse Probl. Sci. Eng. 2016, 24, 1266–1281. [Google Scholar] [CrossRef]
  26. Zhao, H.; Yin, S. Geomechanical Parameters Identification by Particle Swarm Optimization and Support Vector Machine. Appl. Math. Model. 2009, 33, 3997–4012. [Google Scholar] [CrossRef]
  27. Sadoghi Yazdi, J.; Kalantary, F.; Sadoghi Yazdi, H. Calibration of Soil Model Parameters Using Particle Swarm Optimization. Int. J. Geomech. 2012, 12, 229–238. [Google Scholar] [CrossRef]
  28. Endres, S.C.; Sandrock, C.; Focke, W.W. A Simplicial Homology Algorithm for Lipschitz Optimisation. J. Glob. Optim. 2018, 72, 181–217. [Google Scholar] [CrossRef] [Green Version]
  29. Cai, M.; Morioka, H.; Kaiser, P.K.; Tasaka, Y.; Kurose, H.; Minami, M.; Maejima, T. Back-Analysis of Rock Mass Strength Parameters Using AE Monitoring Data. Int. J. Rock Mech. Min. Sci. 2007, 44, 538–549. [Google Scholar] [CrossRef]
  30. Tu, C.; Liu, H.; Xu, B. AdaBoost Typical Algorithm and Its Application Research. MATEC Web Conf. 2017, 139, 00222. [Google Scholar] [CrossRef]
  31. Drucker, H. Improving Regressors Using Boosting Techniques. In Proceedings of the 14th International Conference on Machine Learning, San Francisco, CA, USA, 8–12 July 1997; pp. 107–115. [Google Scholar]
  32. Virtanen, P.; Gommers, R.; Oliphant, T.E.; Haberland, M.; Reddy, T.; Cournapeau, D.; Burovski, E.; Peterson, P.; Weckesser, W.; Bright, J.; et al. {SciPy} 1.0: Fundamental Algorithms for Scientific Computing in Python. Nat. Methods 2020, 17, 261–272. [Google Scholar] [CrossRef] [Green Version]
  33. Chen, B.R. Back Analysis of Rheological Parameters of Rock Mass Using Intelligent Method; Northeastern University: Shenyang, China, 2003. [Google Scholar]
  34. Itasca Consulting Group, Inc. FLAC—Fast Lagrangian Analysis of Continua, Ver. 8.1; Itasca Consulting Group, Inc.: Minneapolis, MN, USA, 2019. [Google Scholar]
  35. Fahimifar, A.; Tehrani, F.M.; Hedayat, A.; Vakilzadeh, A. Analytical Solution for the Excavation of Circular Tunnels in a Visco-Elastic Burger’s Material under Hydrostatic Stress Field. Tunn. Undergr. Sp. Technol. 2010, 25, 297–304. [Google Scholar] [CrossRef]
  36. Goodman, R.E. Introduction to Rock Mechanics, 2nd ed.; John Wiley & Sons: New York, NY, USA, 1989; ISBN 0471812005. [Google Scholar]
Figure 1. Schematics of back analysis in rock engineering.
Buildings 12 01073 g001
Figure 2. Flowchart of proposed framework.
Buildings 12 01073 g002
Figure 3. Overview of Goupitan Hydropower Station project: (a) Geological conditions; (b) Monitoring configuration.
Buildings 12 01073 g003
Figure 4. Meshes of numerical model.
Buildings 12 01073 g004
Figure 5. Computed displacements based on obtained rheological properties via surrogate model for 4# borehole: (a) Testing data; (b) Training data.
Buildings 12 01073 g005aBuildings 12 01073 g005b
Figure 6. Computed displacements based on obtained rheological properties via surrogate model for 6# borehole: (a) Testing data; (b) Training data.
Buildings 12 01073 g006
Figure 7. Predicted displacements along 4# borehole via surrogate model based on obtained rheological properties.
Buildings 12 01073 g007
Figure 8. Predicted displacements along 6# borehole via surrogate model based on obtained rheological properties.
Buildings 12 01073 g008
Figure 9. Calculated displacements along 4# borehole via numerical model based on obtained rheological properties.
Buildings 12 01073 g009
Table 1. Relative displacement between monitoring points 1 and 5.
Time
(Day)
Displacement (mm)
4#5#6#
32.5582.4411.778
53.7893.6812.377
84.2814.0942.6
114.5314.3082.685
134.6624.4342.84
154.8164.5212.907
185.0264.5223.026
245.4064.9863.256
265.514--
295.6465.133.348
346.2225.6213.636
396.4115.7993.751
426.5445.883.788
456.6585.9523.812
Table 2. Ranges of rheological parameters.
Clay-Green Clay Rock S 2 h 1 1 Purple Clay Rock S 2 h 1 2
G1h (GPa)G2h (GPa)η2h(GPad)η1h(GPad)G1z (GPa)G2z (GPa)η2z(GPad)η1z(103GPad)
0.5–4.50.1–3.50.1–3.515–351–155–201–151.5–4.5
Table 3. Obtained rheological parameters.
LayerRheological
Properties
Field Data
Single-DayDouble-DayTriple-Day
Clay-green clay rock S 2 h 1 1 G1h (GPa)4.6875 4.3125 2.9063
G2h (GPa)0.1531 0.4719 0.3391
η2h (GPad)1.3219 0.5781 0.4984
η1h (GPad)31.5625 28.1875 30.7813
Purple clay rock S 2 h 1 2 G1z (GPa)7.3438 13.0313 14.2344
G2z (GPa)19.3594 10.3906 14.9609
η2z (GPad)8.2188 3.4063 1.9844
η1z (103GPad)4.2656 3.2344 2.4141
Publisher’s Note: MDPI stays neutral with regard to jurisdictional claims in published maps and institutional affiliations.

