
Influence of Cotton Knitted Fabric Waste Addition on Concrete Properties


Abstract
:1. Introduction
2. Materials and Methods
2.1. Materials and Sample Preparation
2.2. Testing of Hardened Concrete Samples
3. Results and Discussion
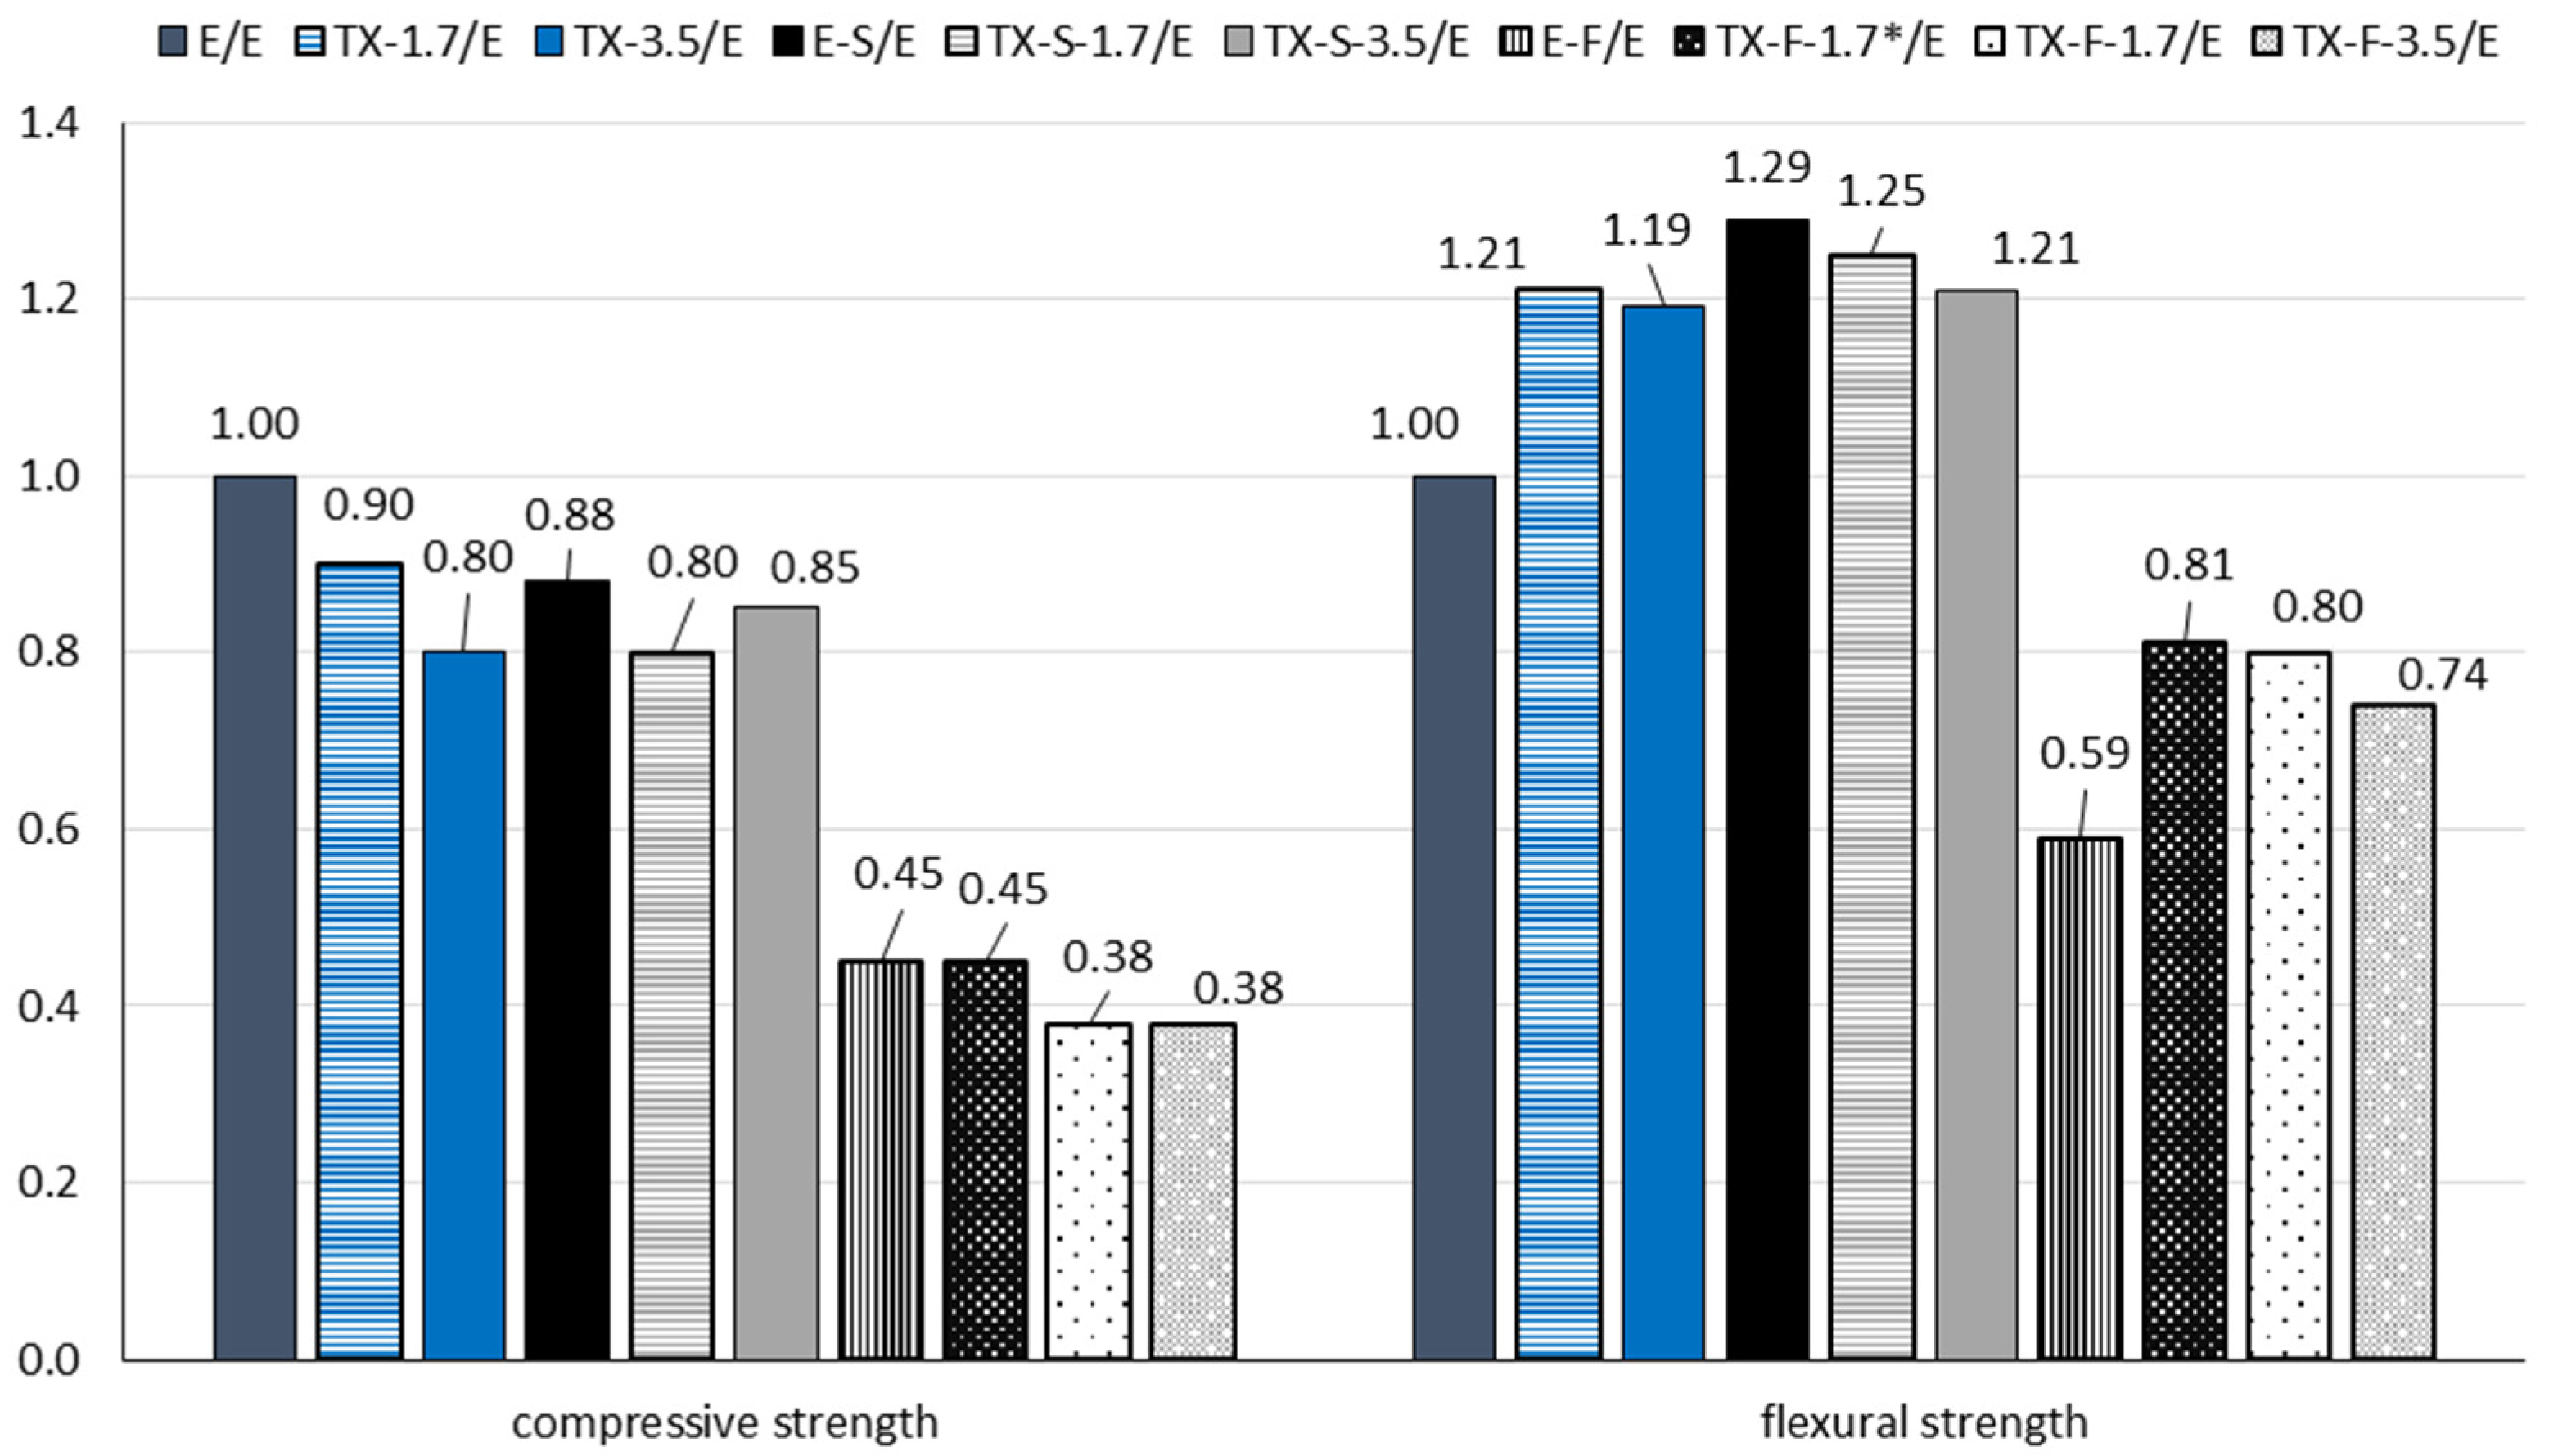
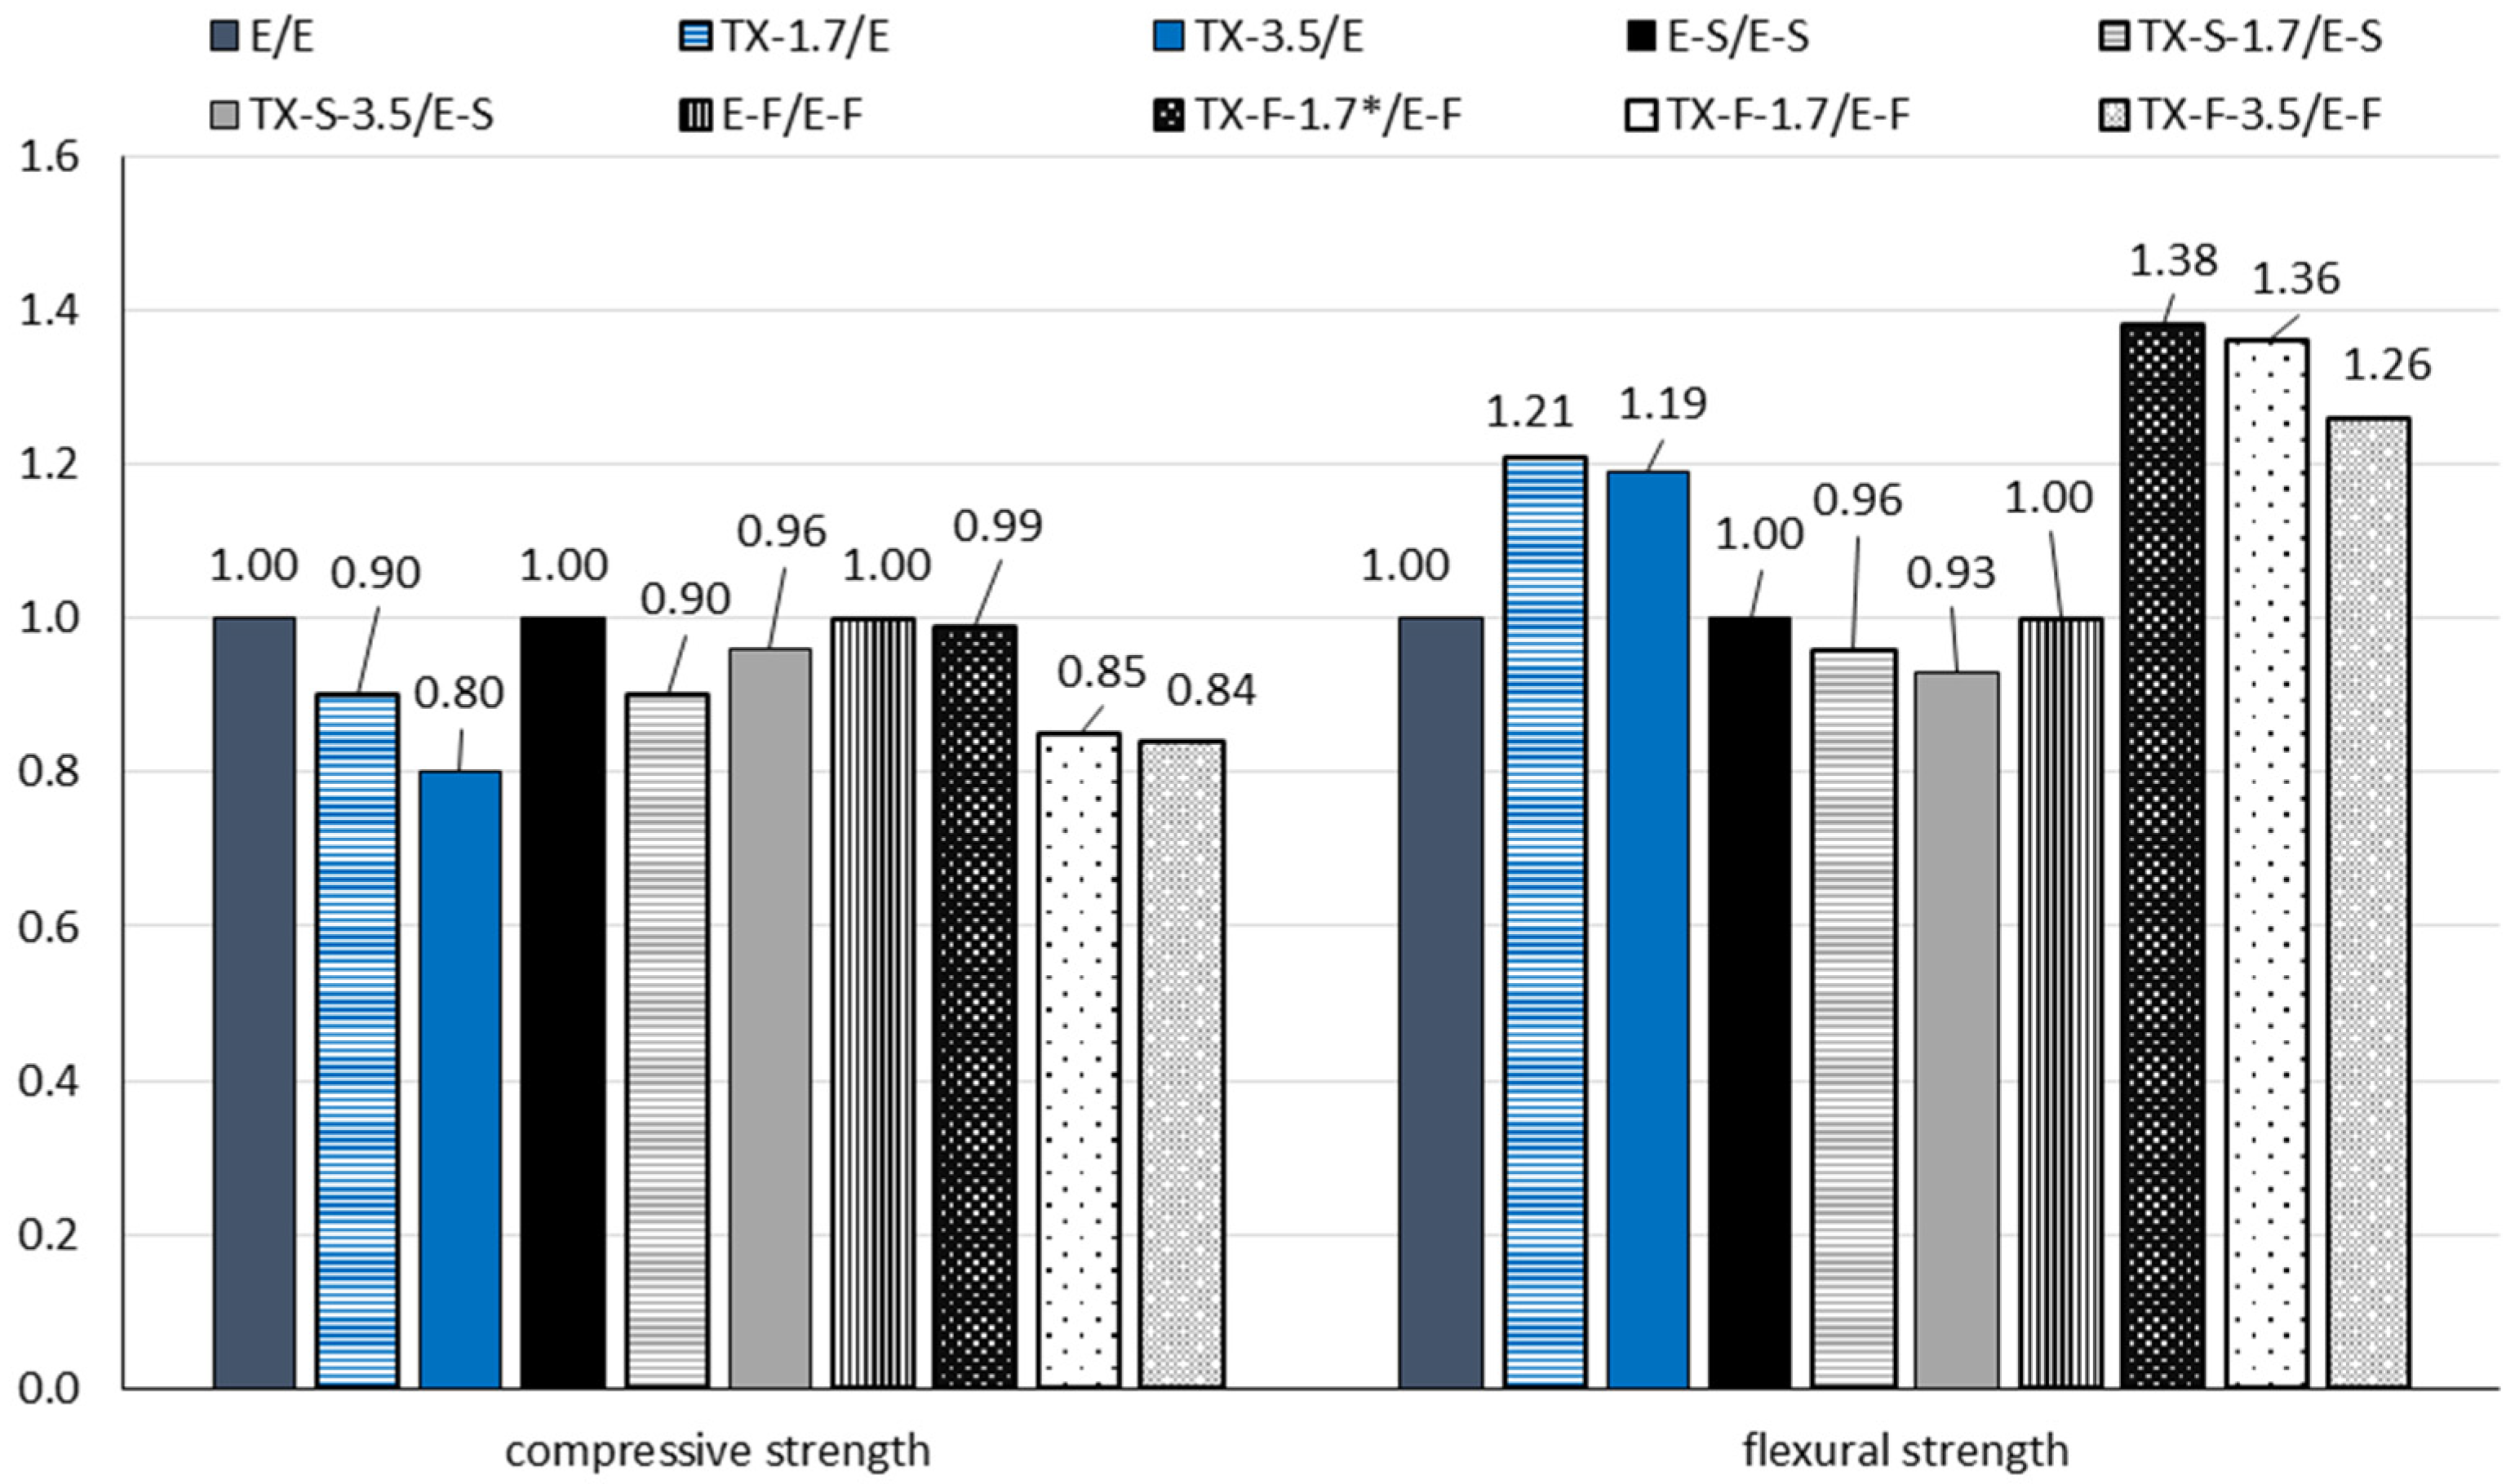
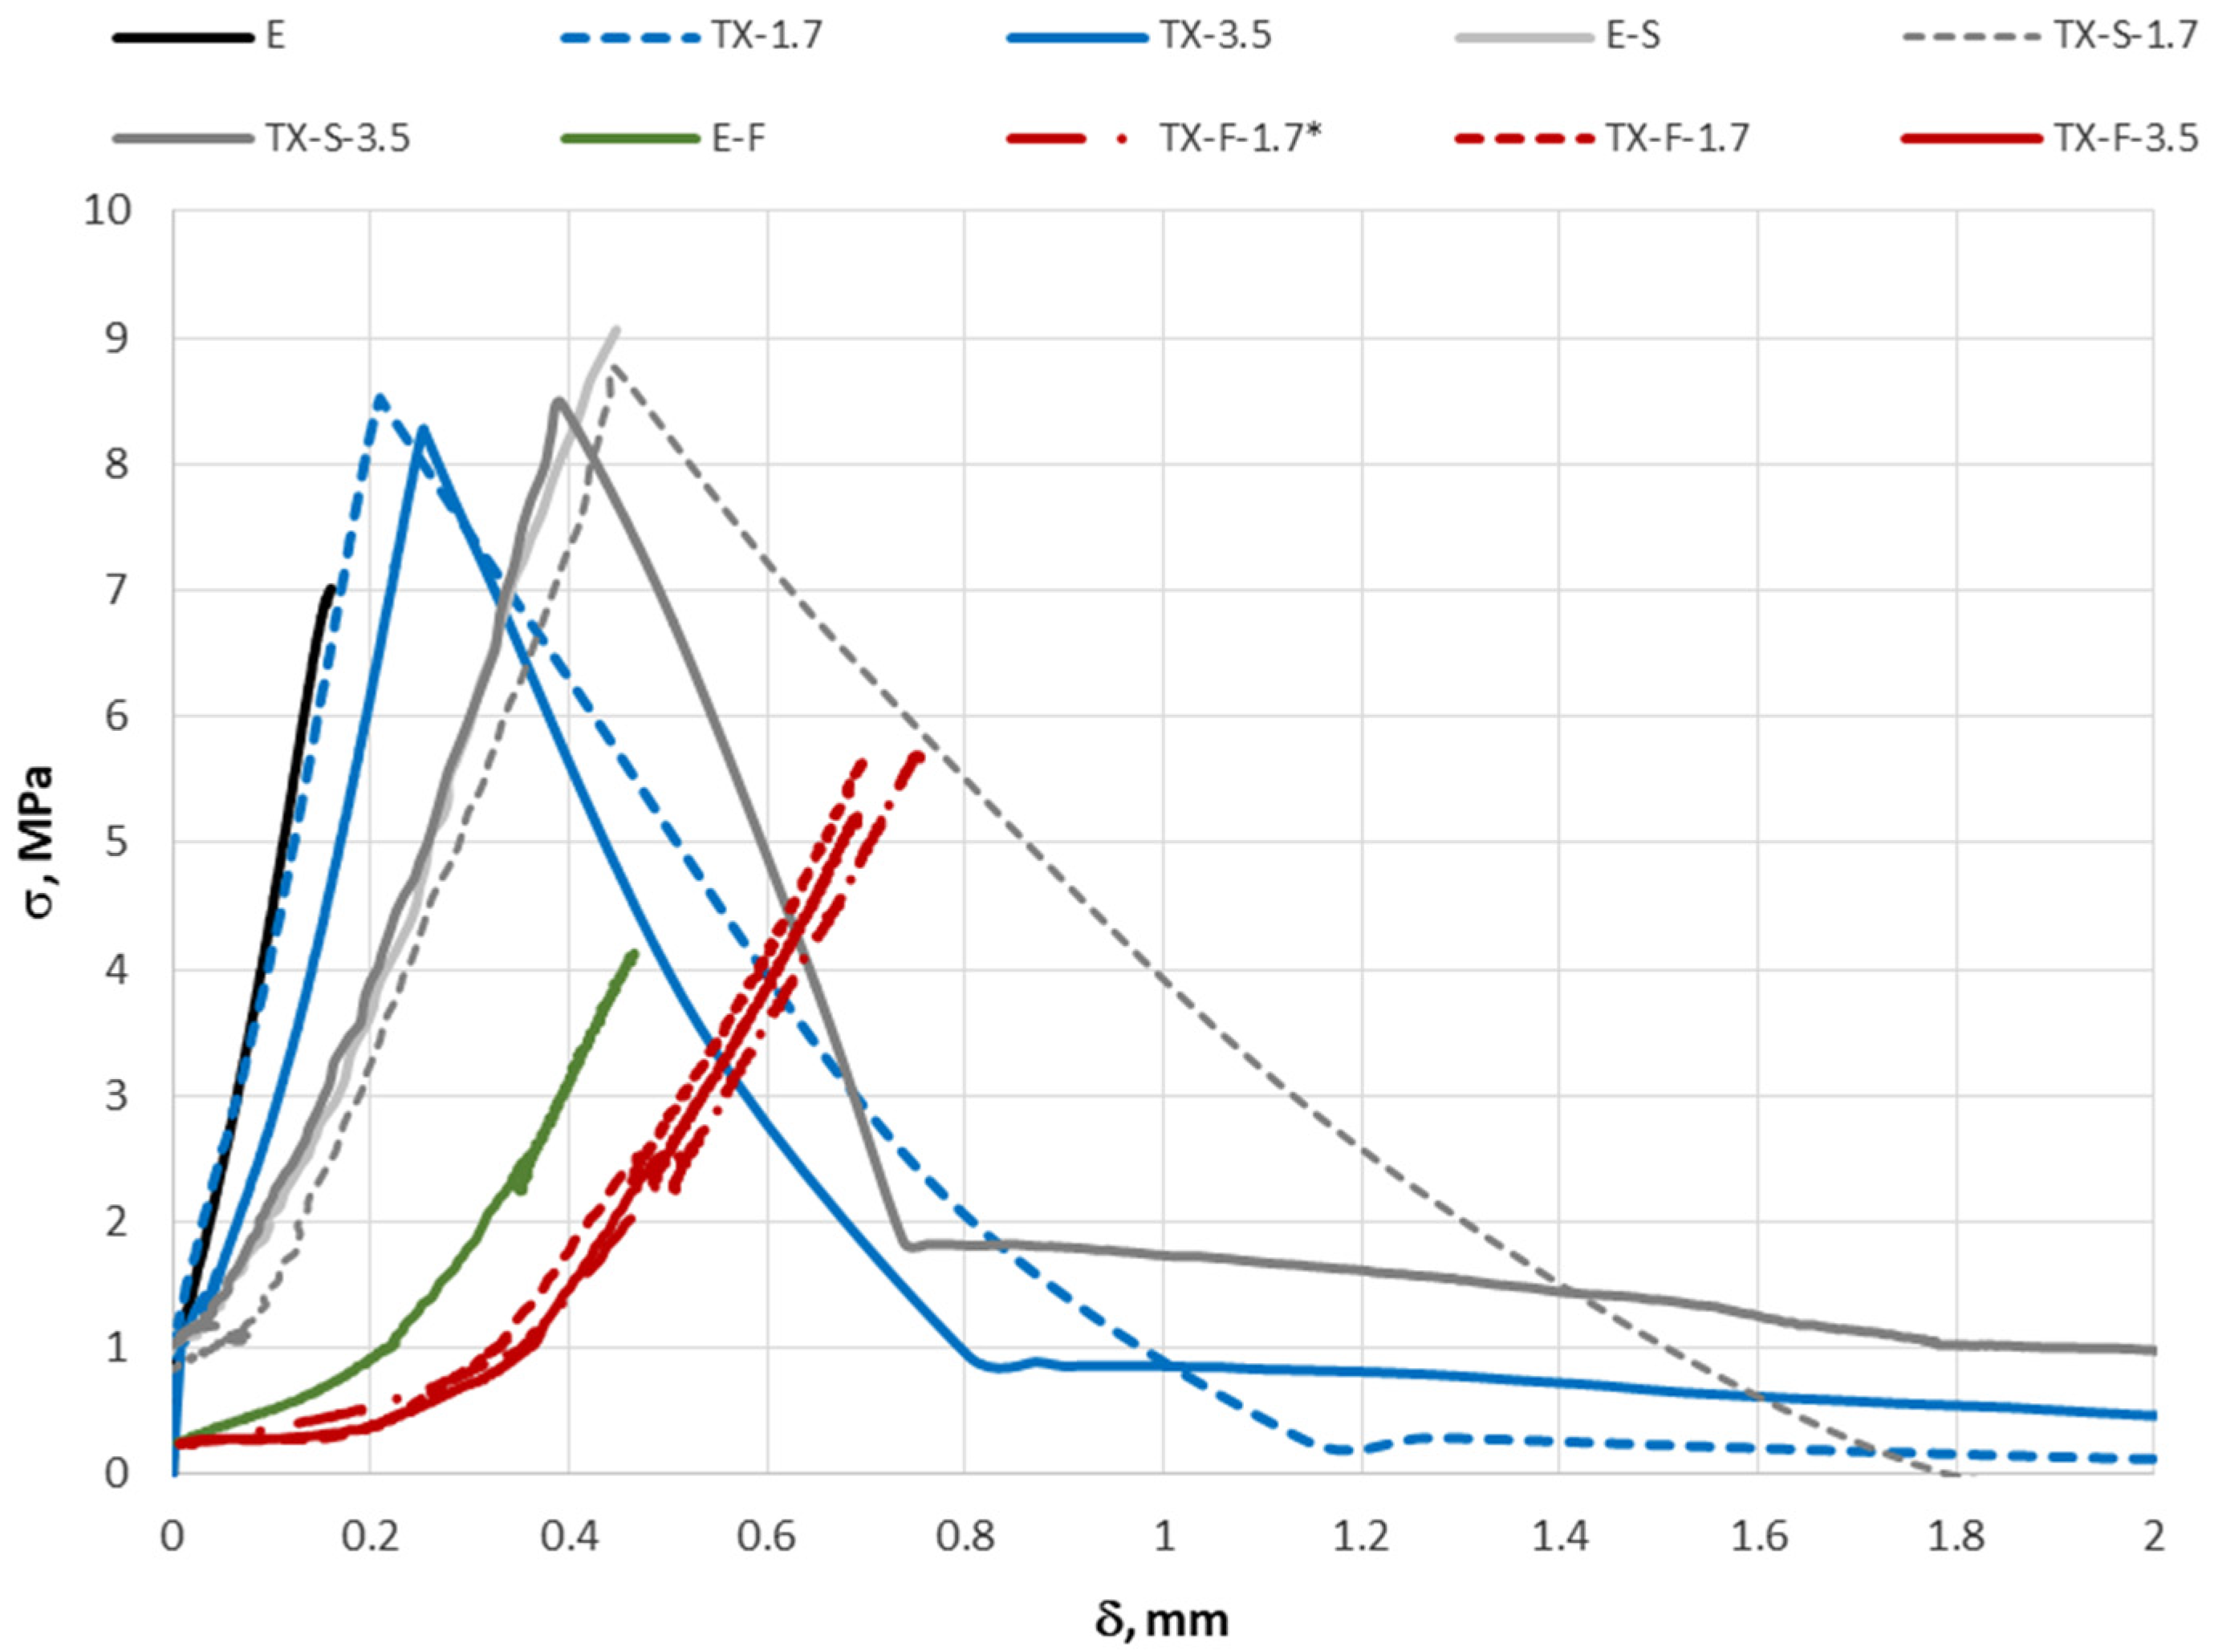
3.1. Compressive and Flexural Strength
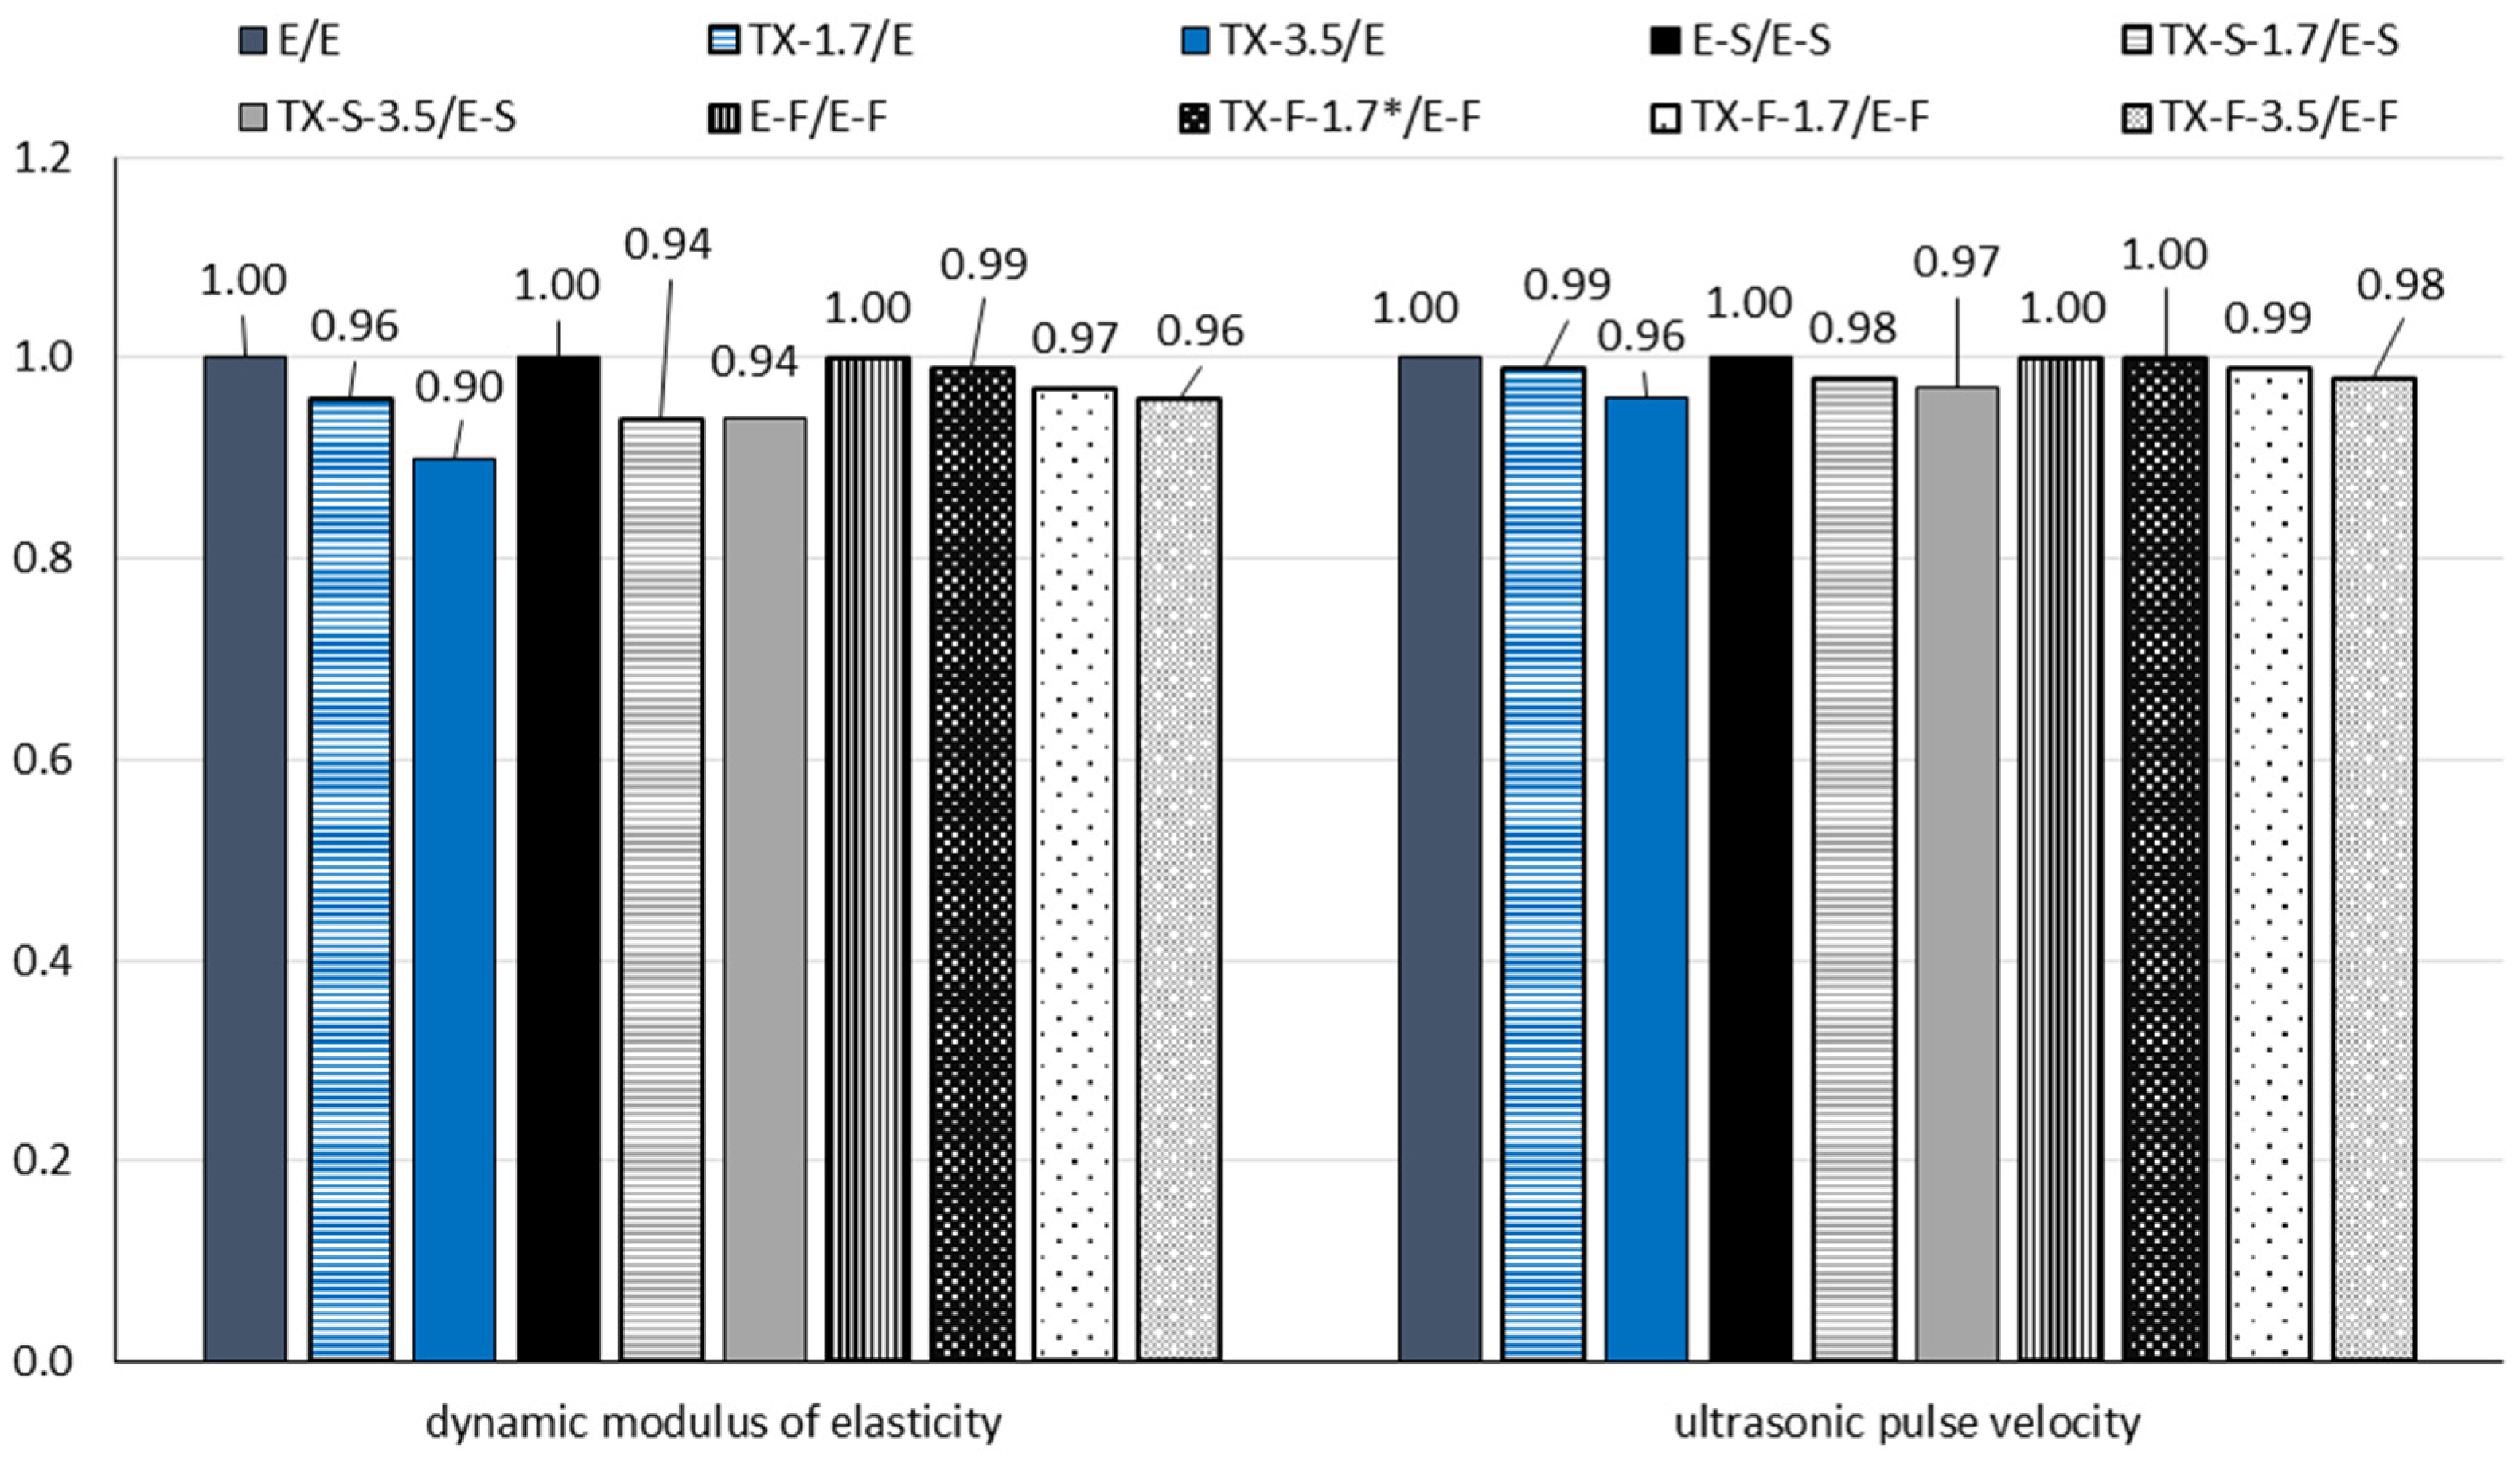
3.2. Dynamic Modulus of Elasticity and Ultra Pulse Velocity
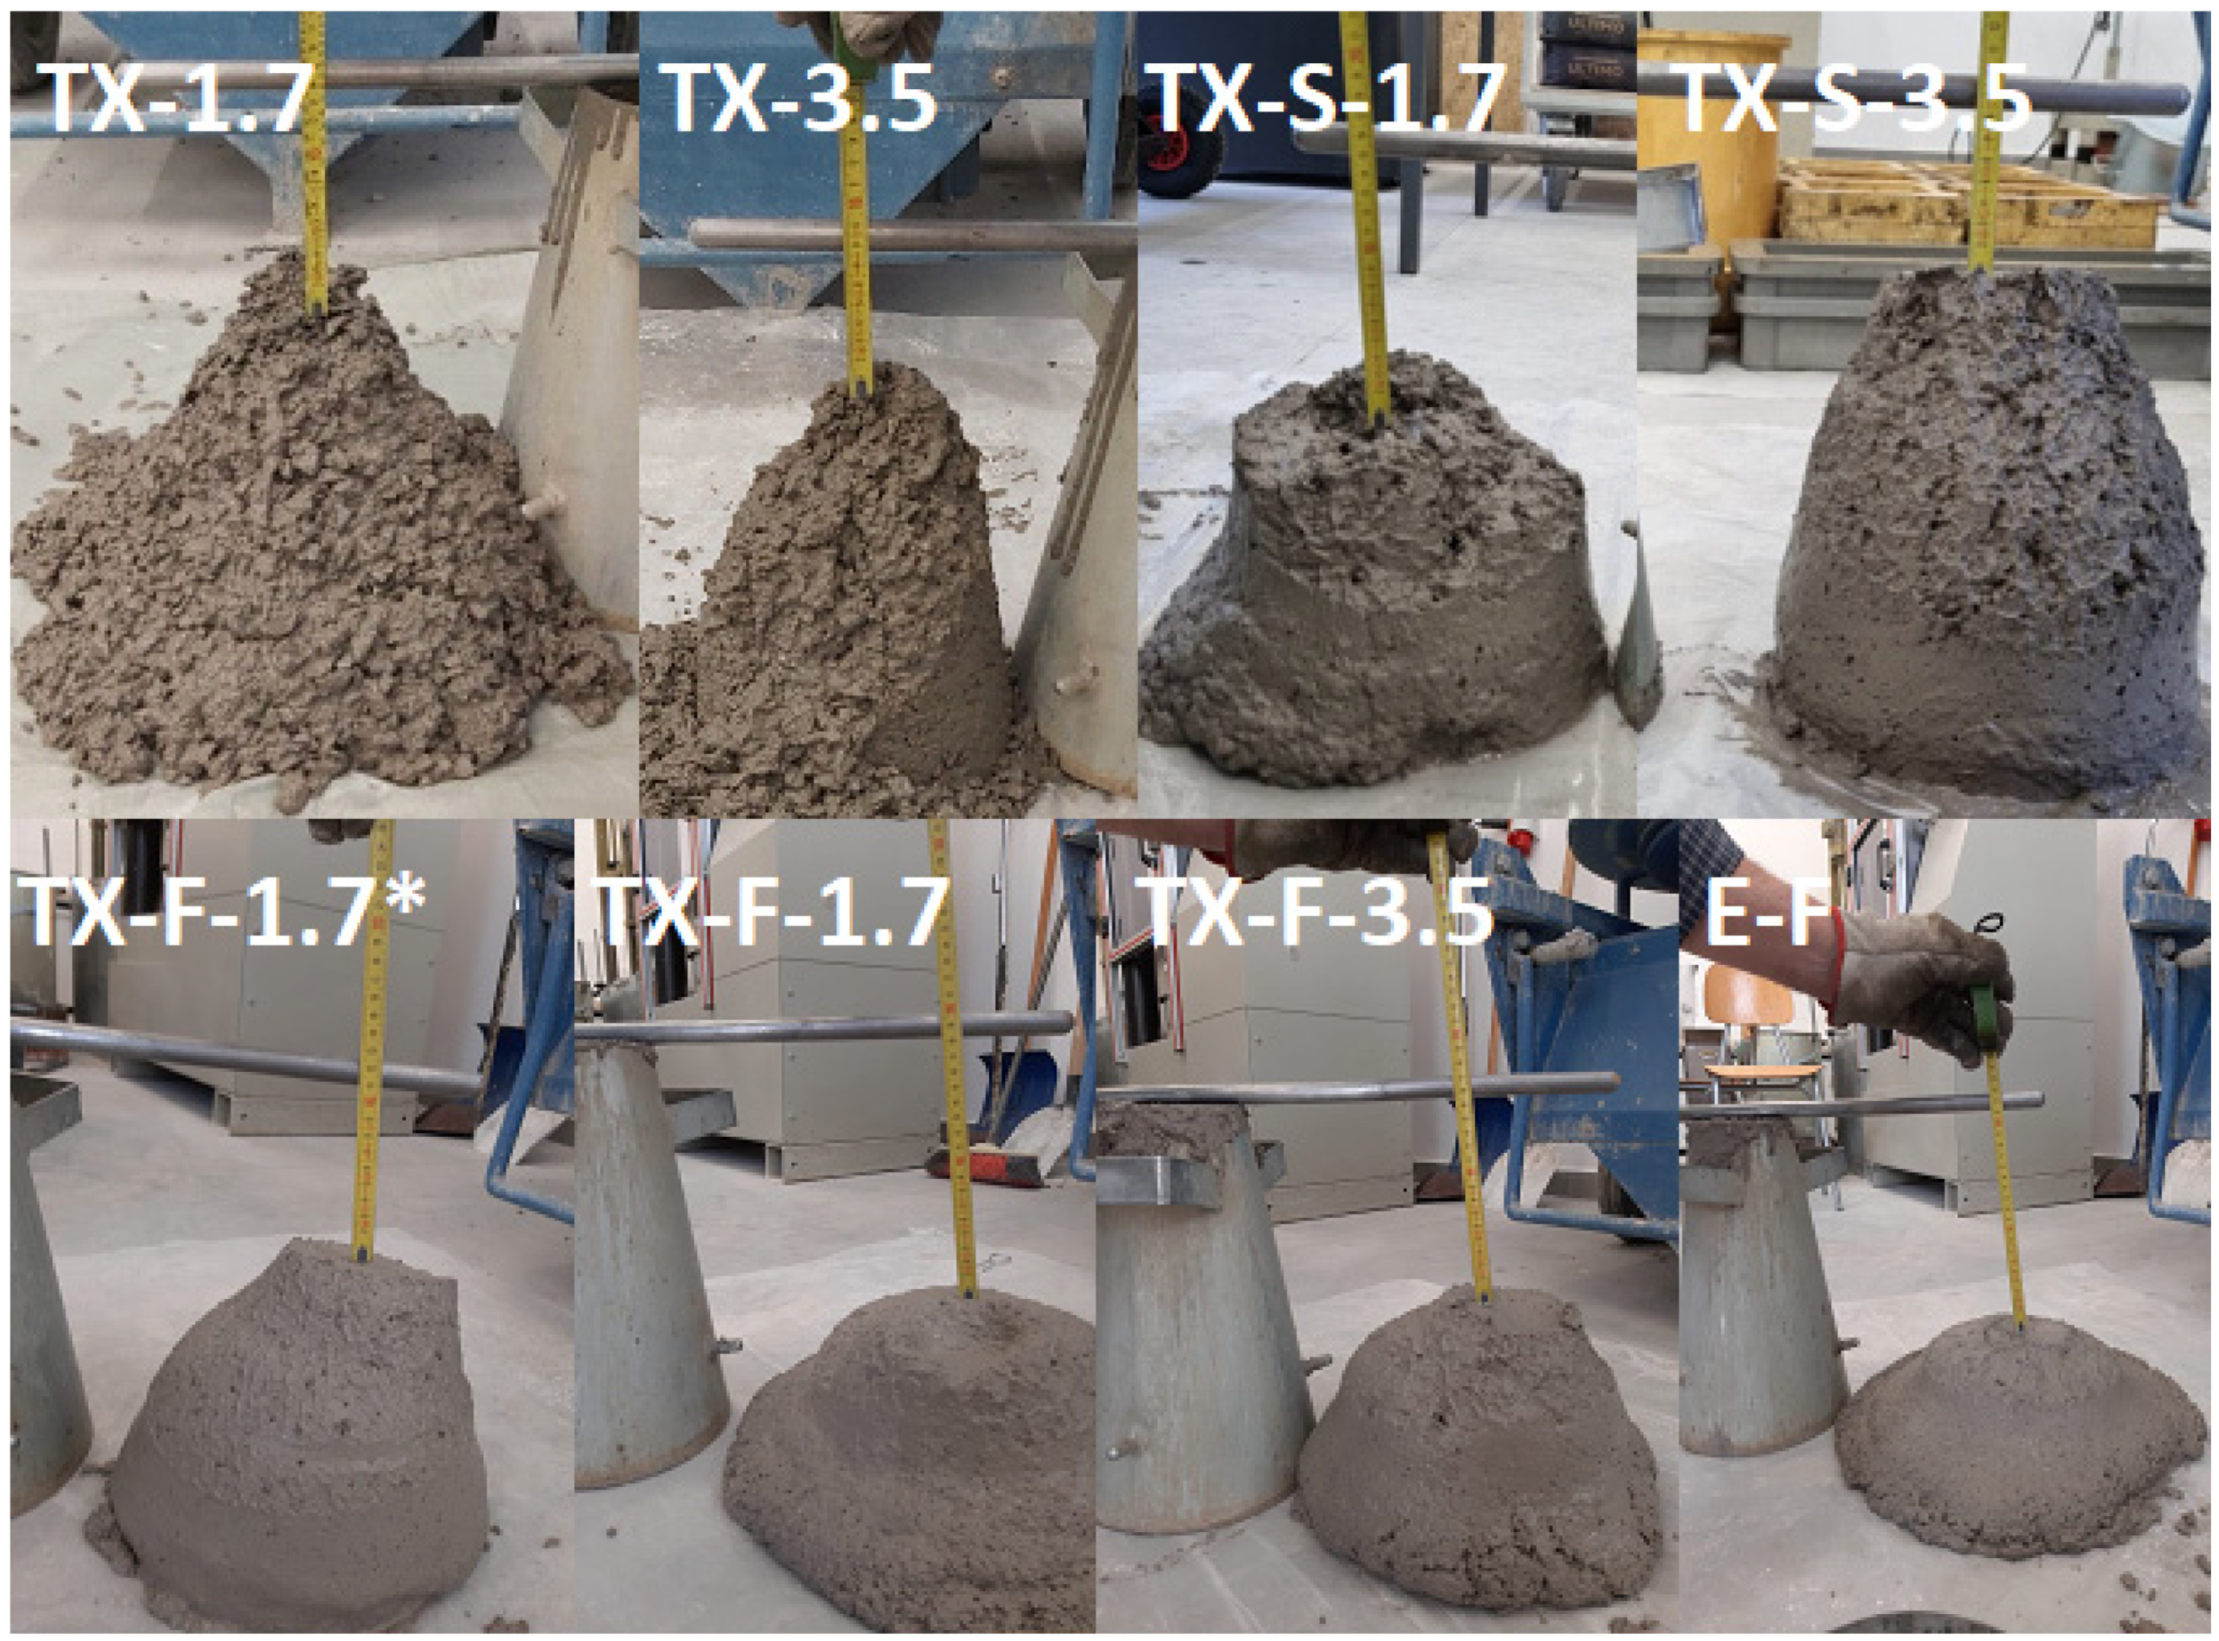
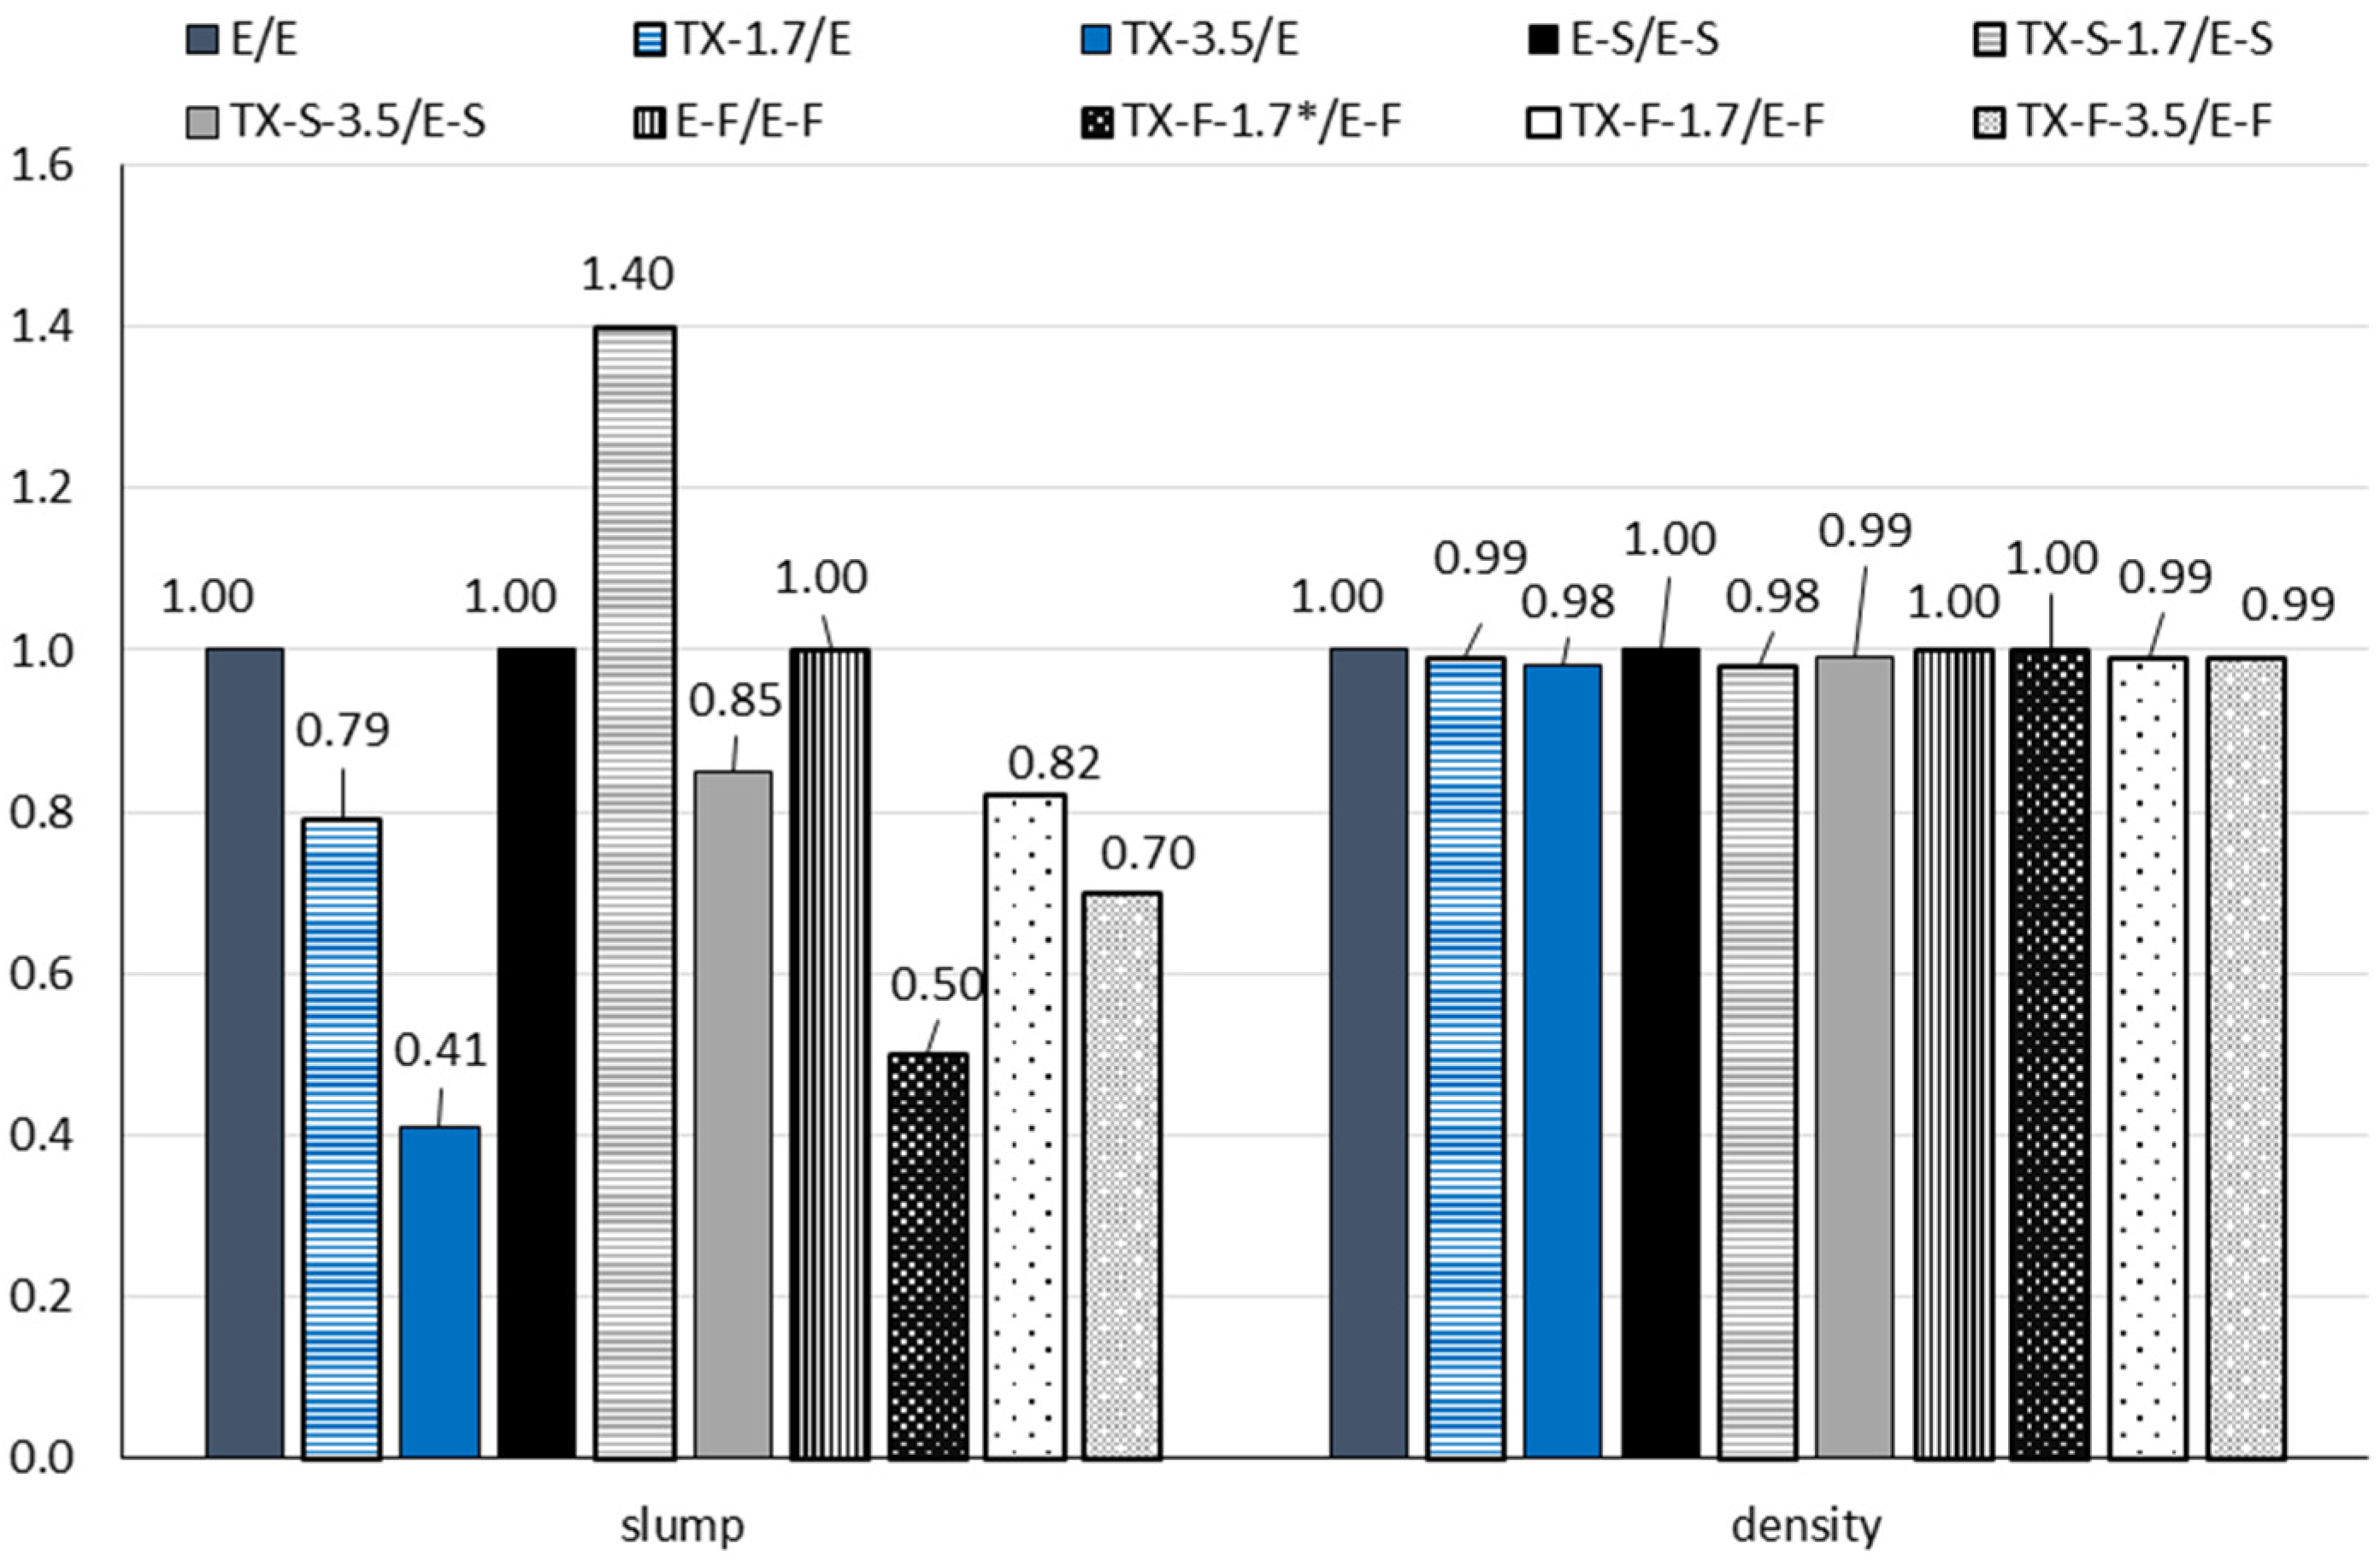
3.3. Workability and Density
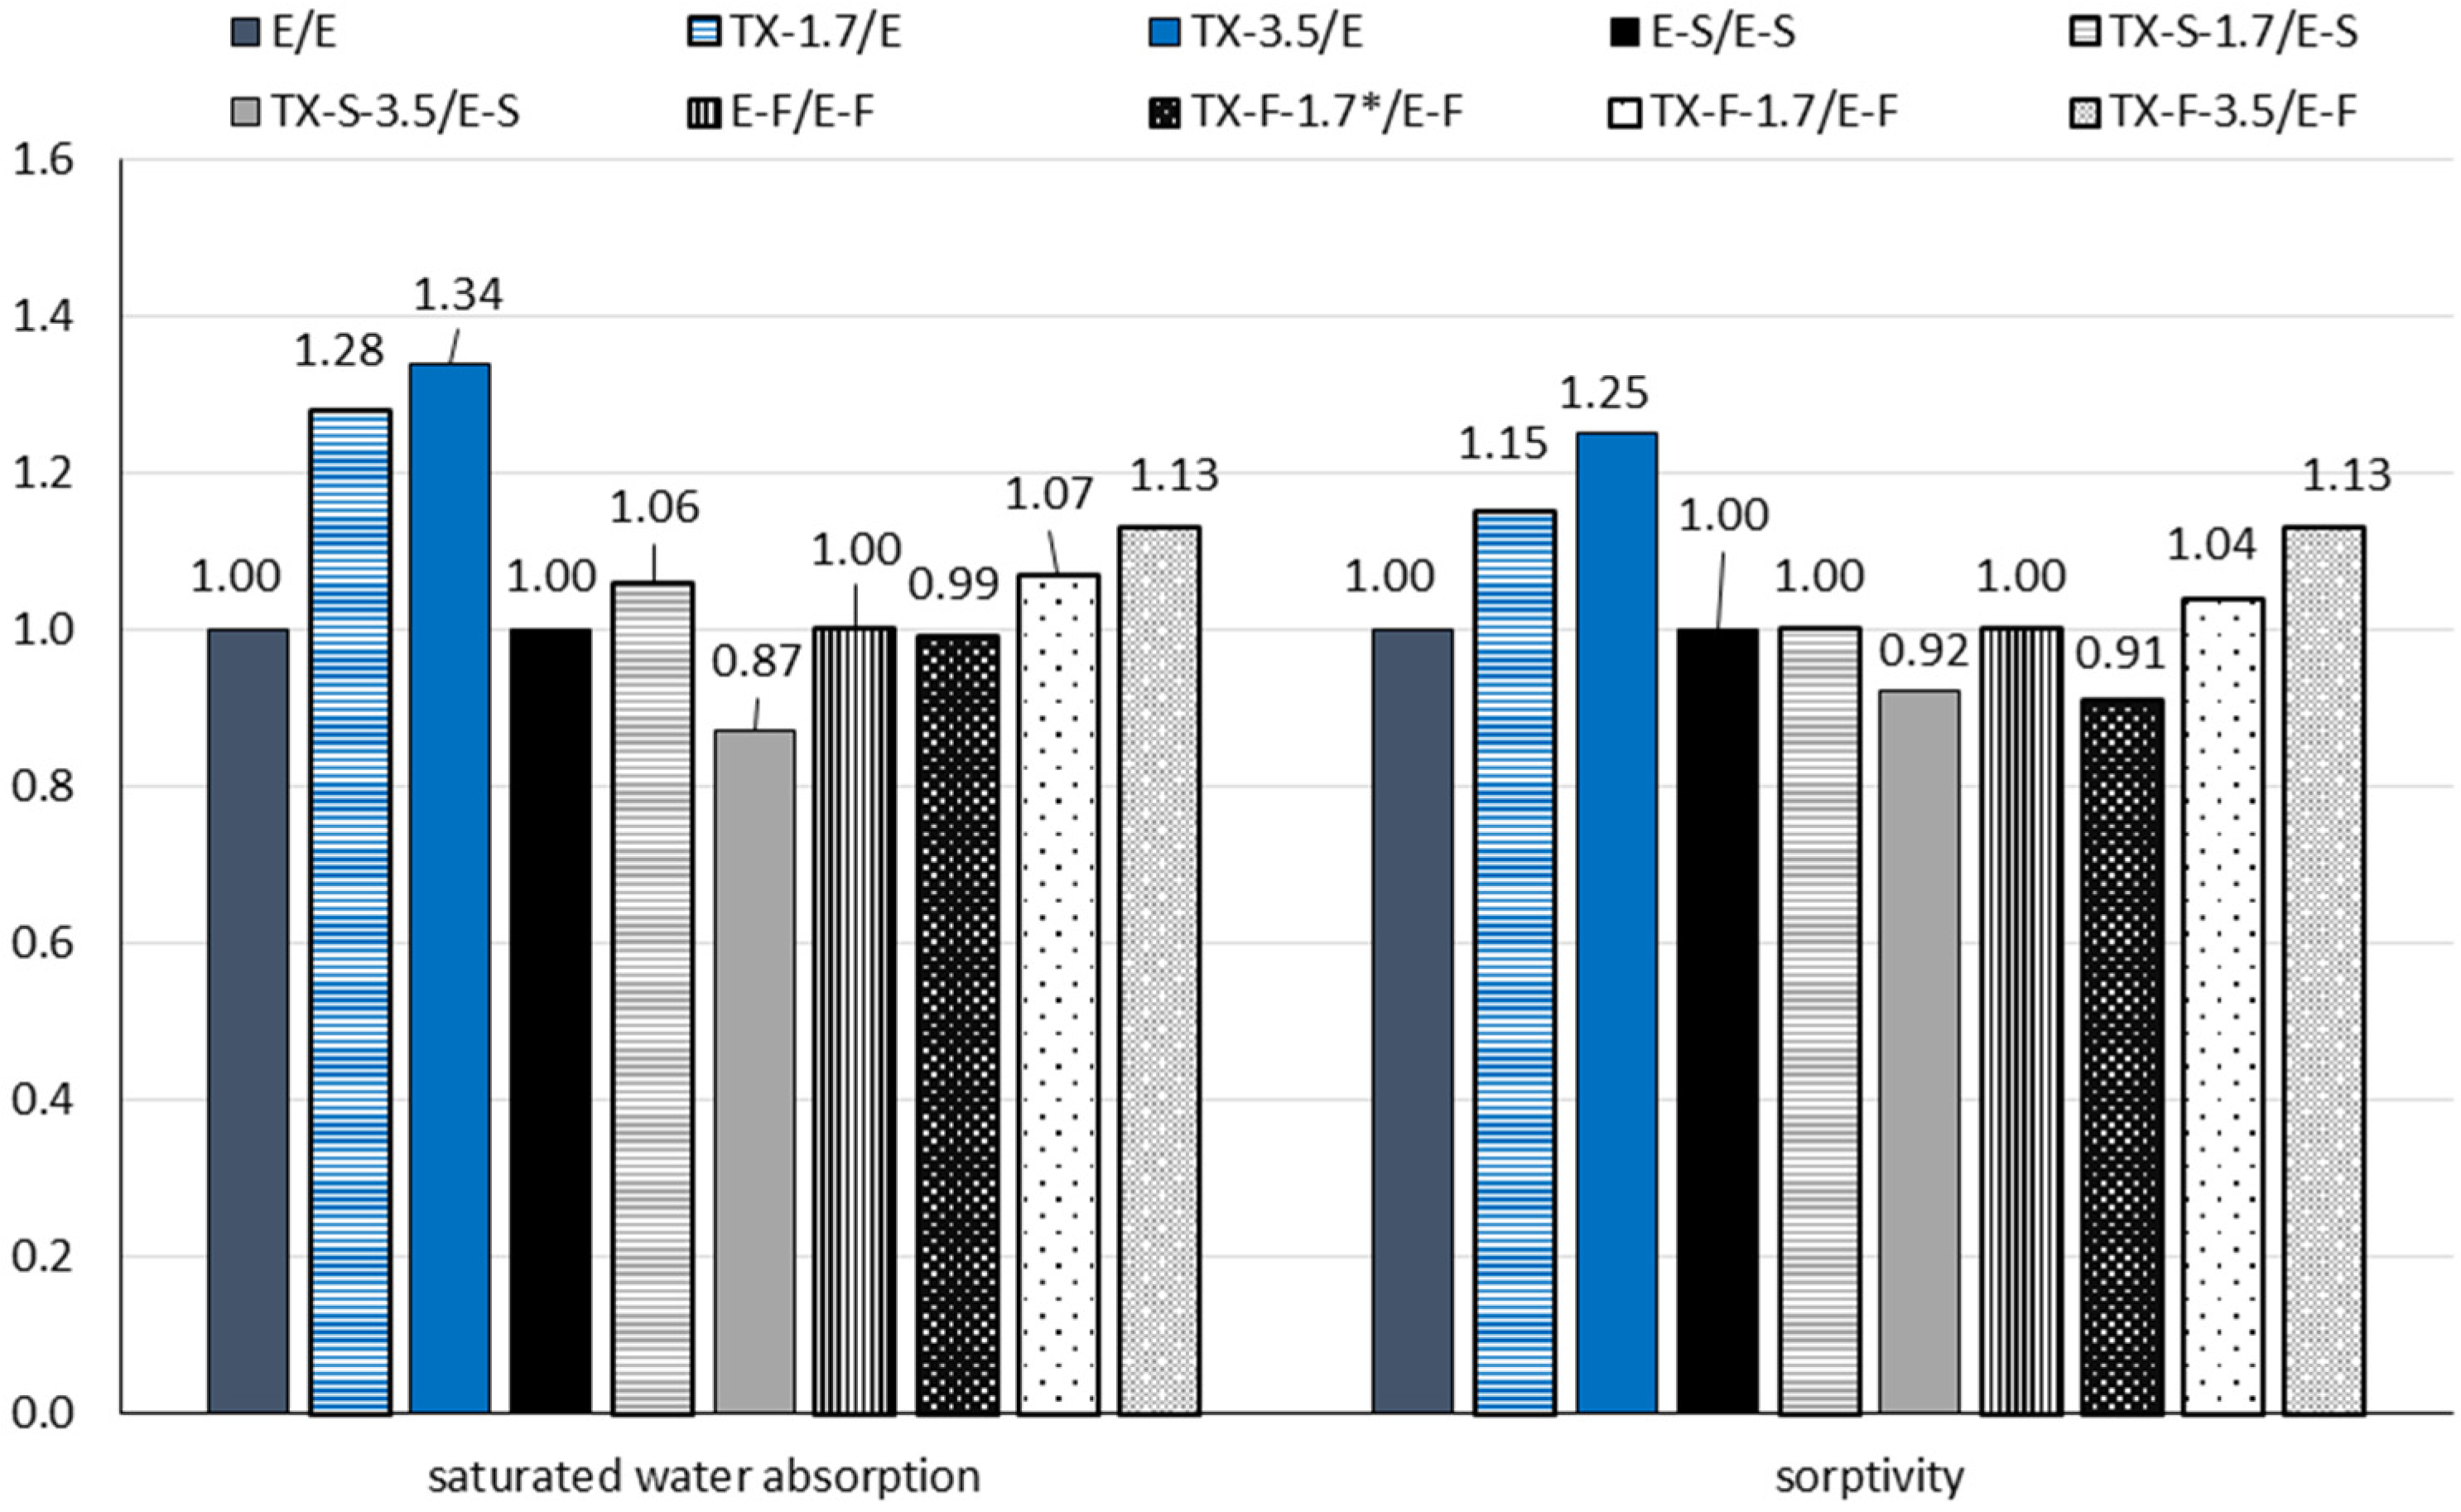
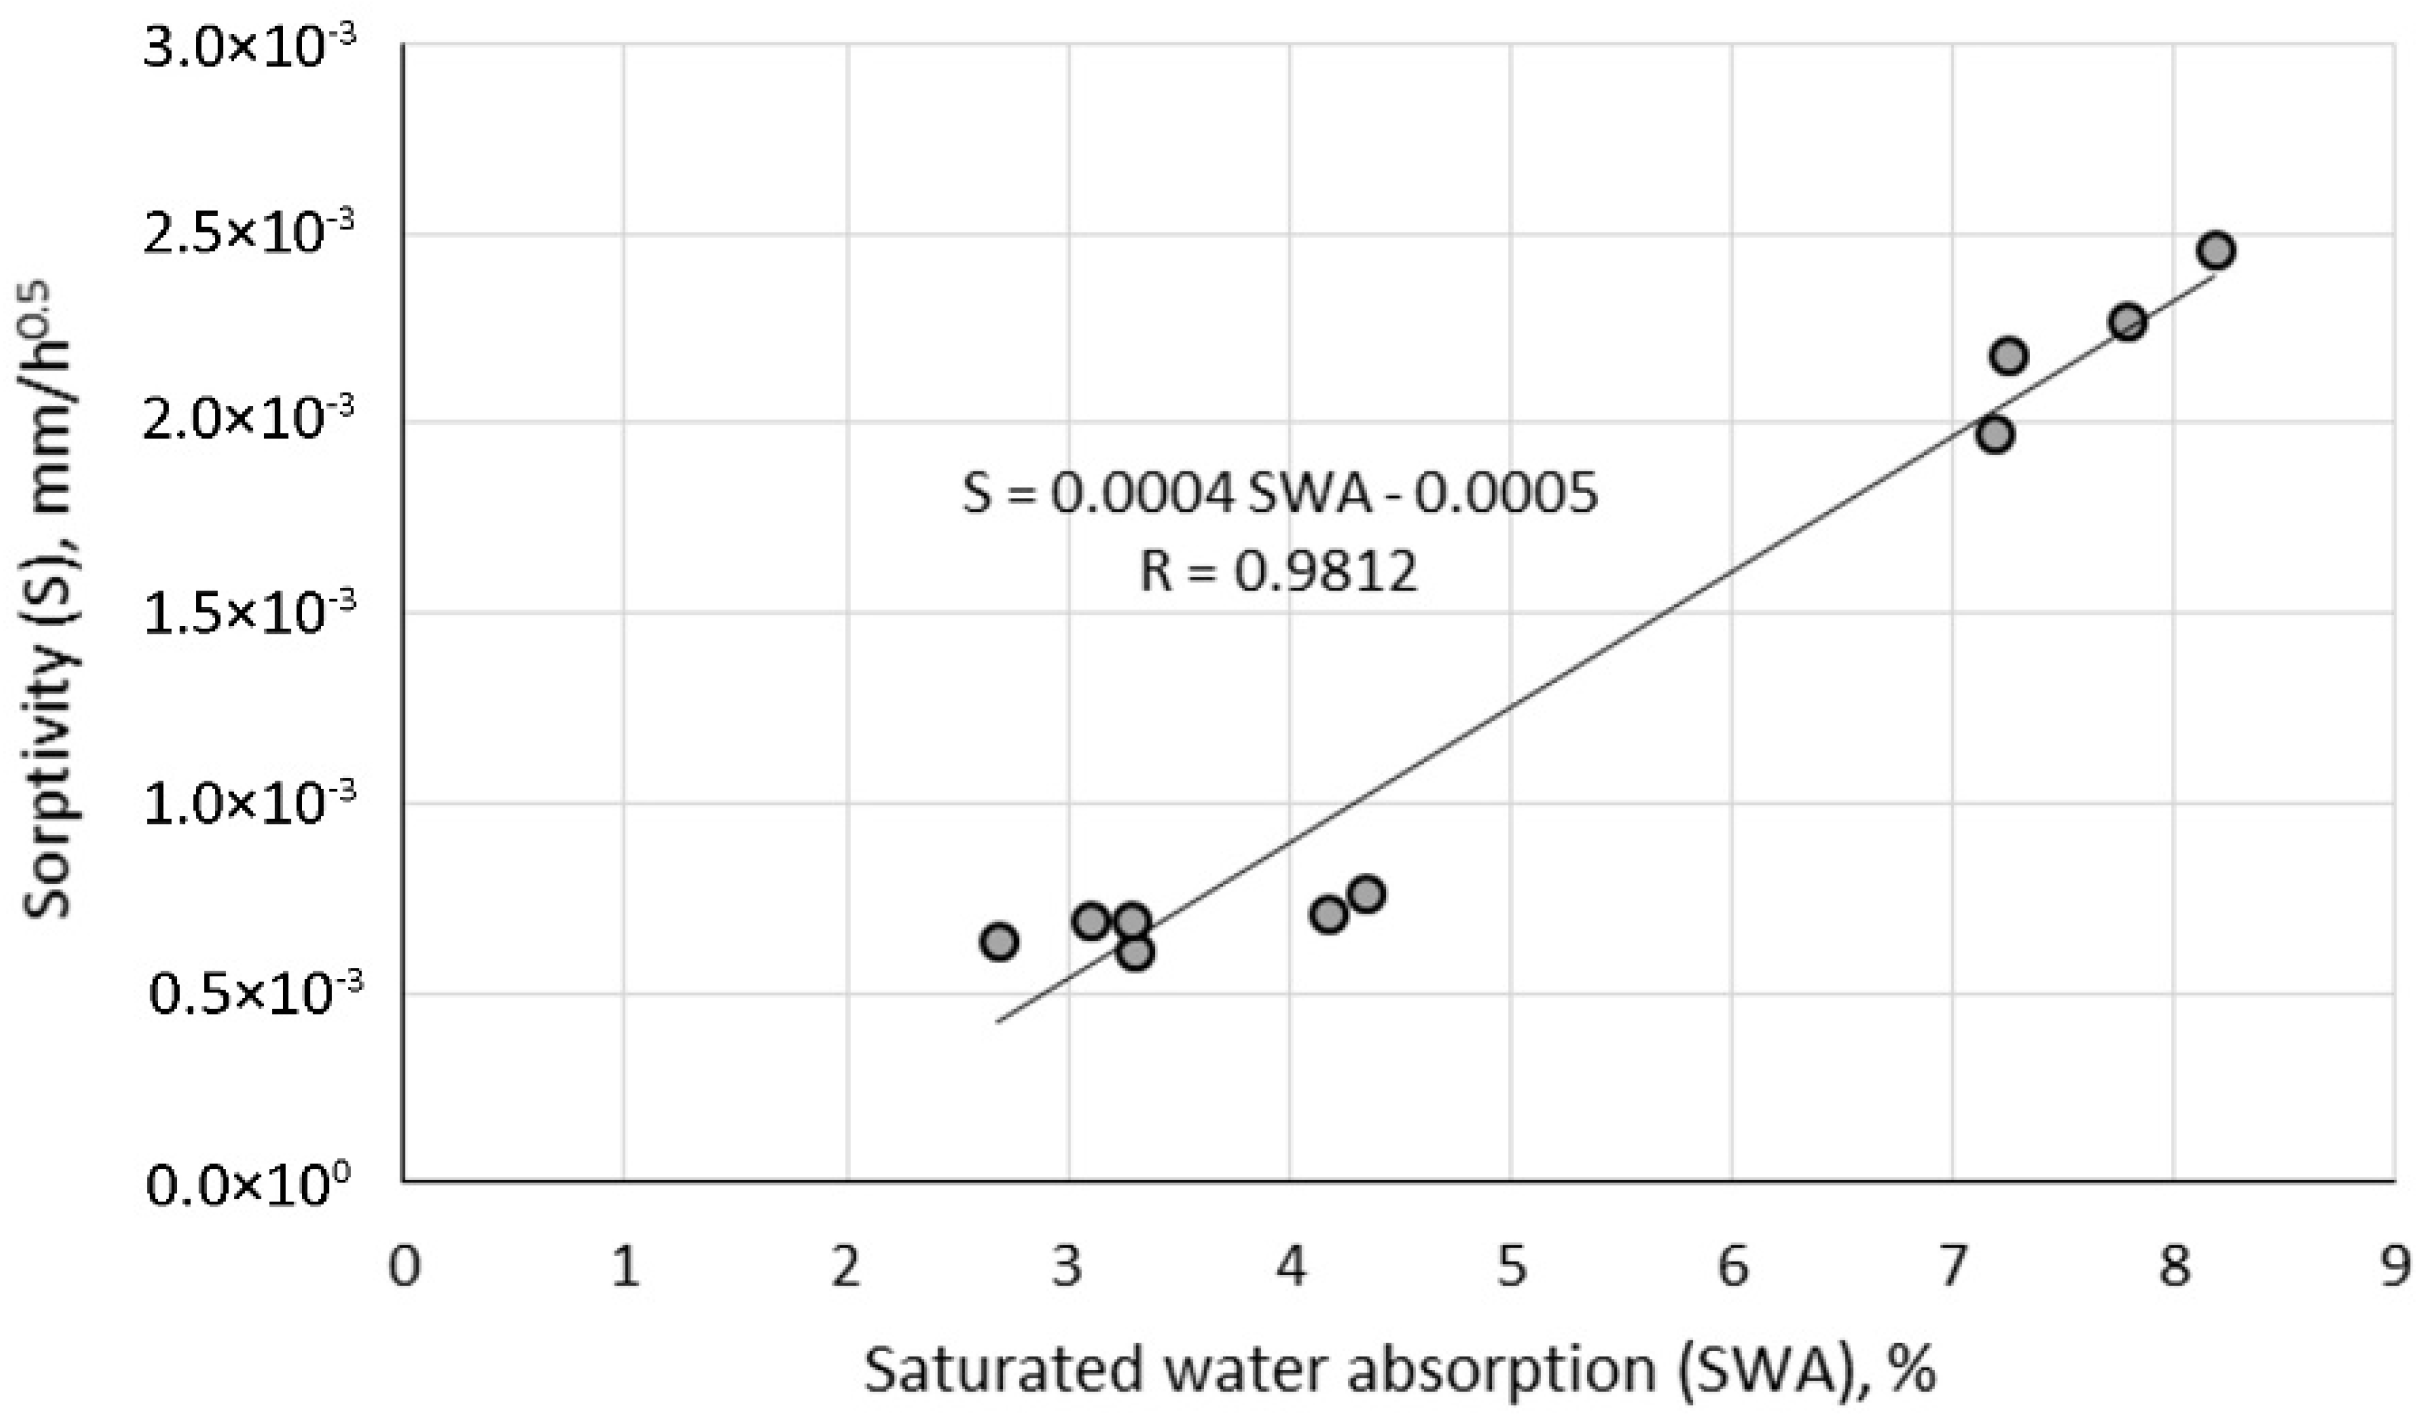
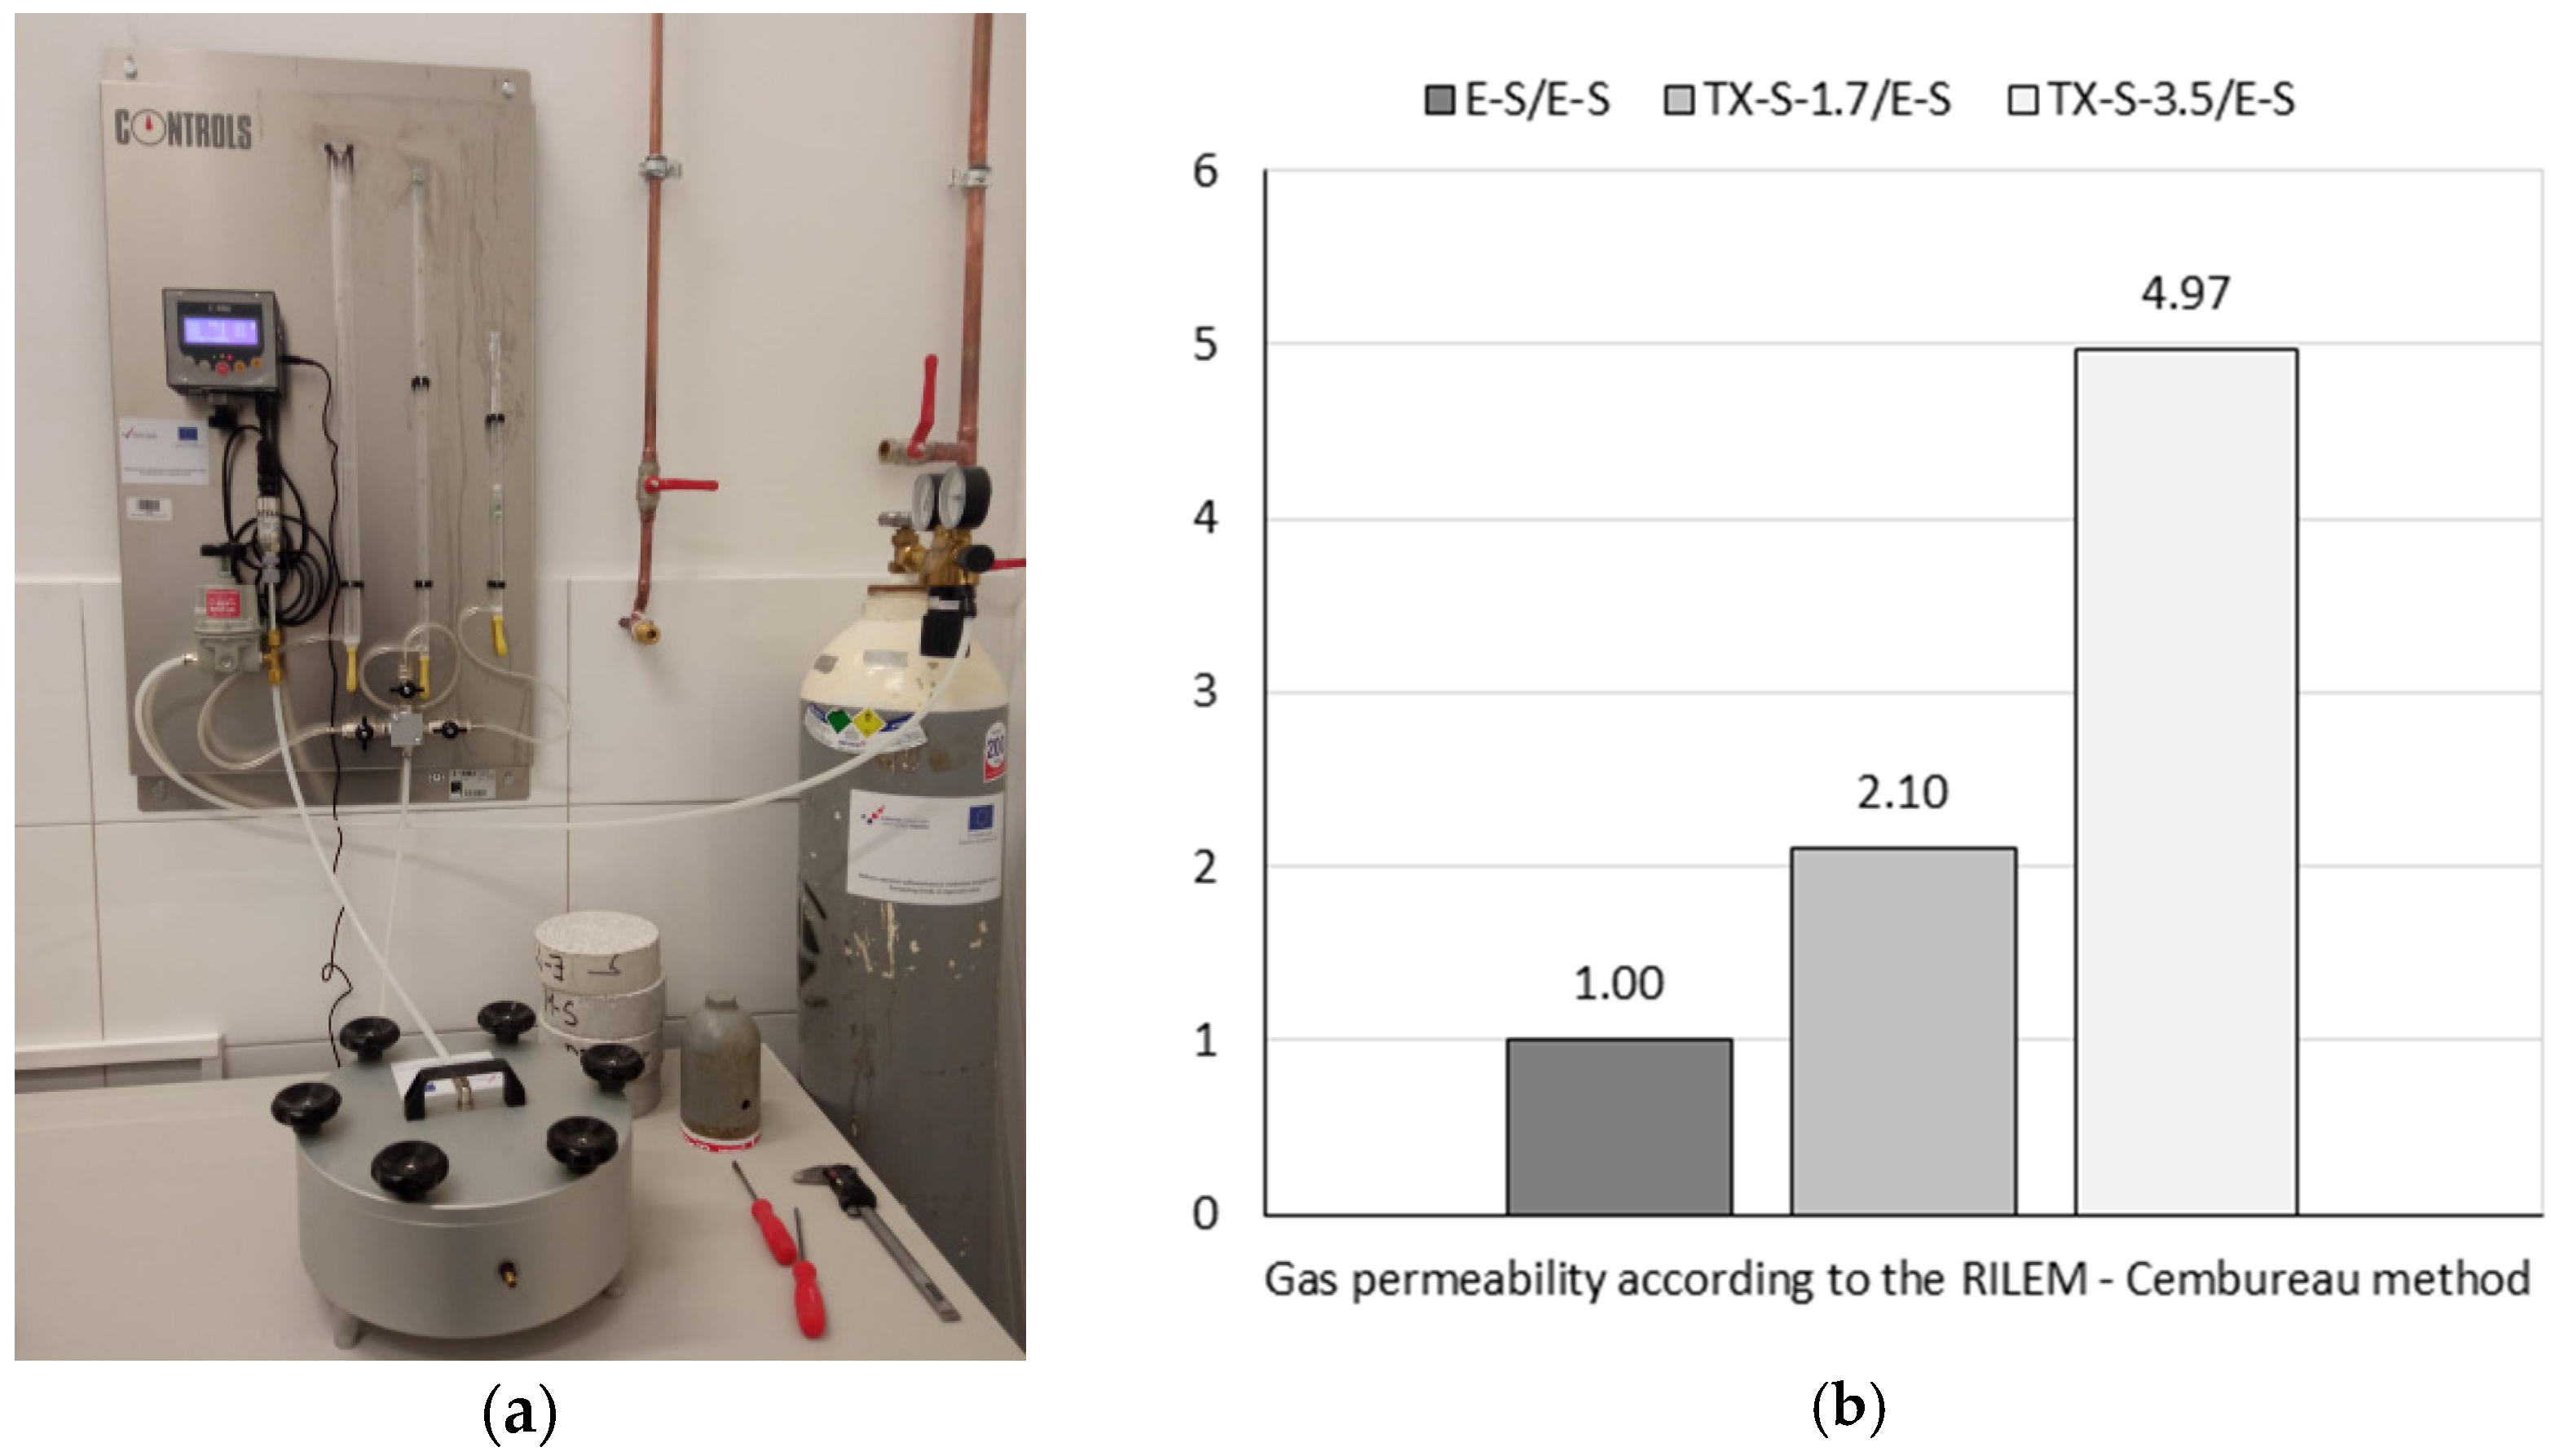
3.4. Durability: Saturated Water Absorption, Sorptivity and Gas Permeability
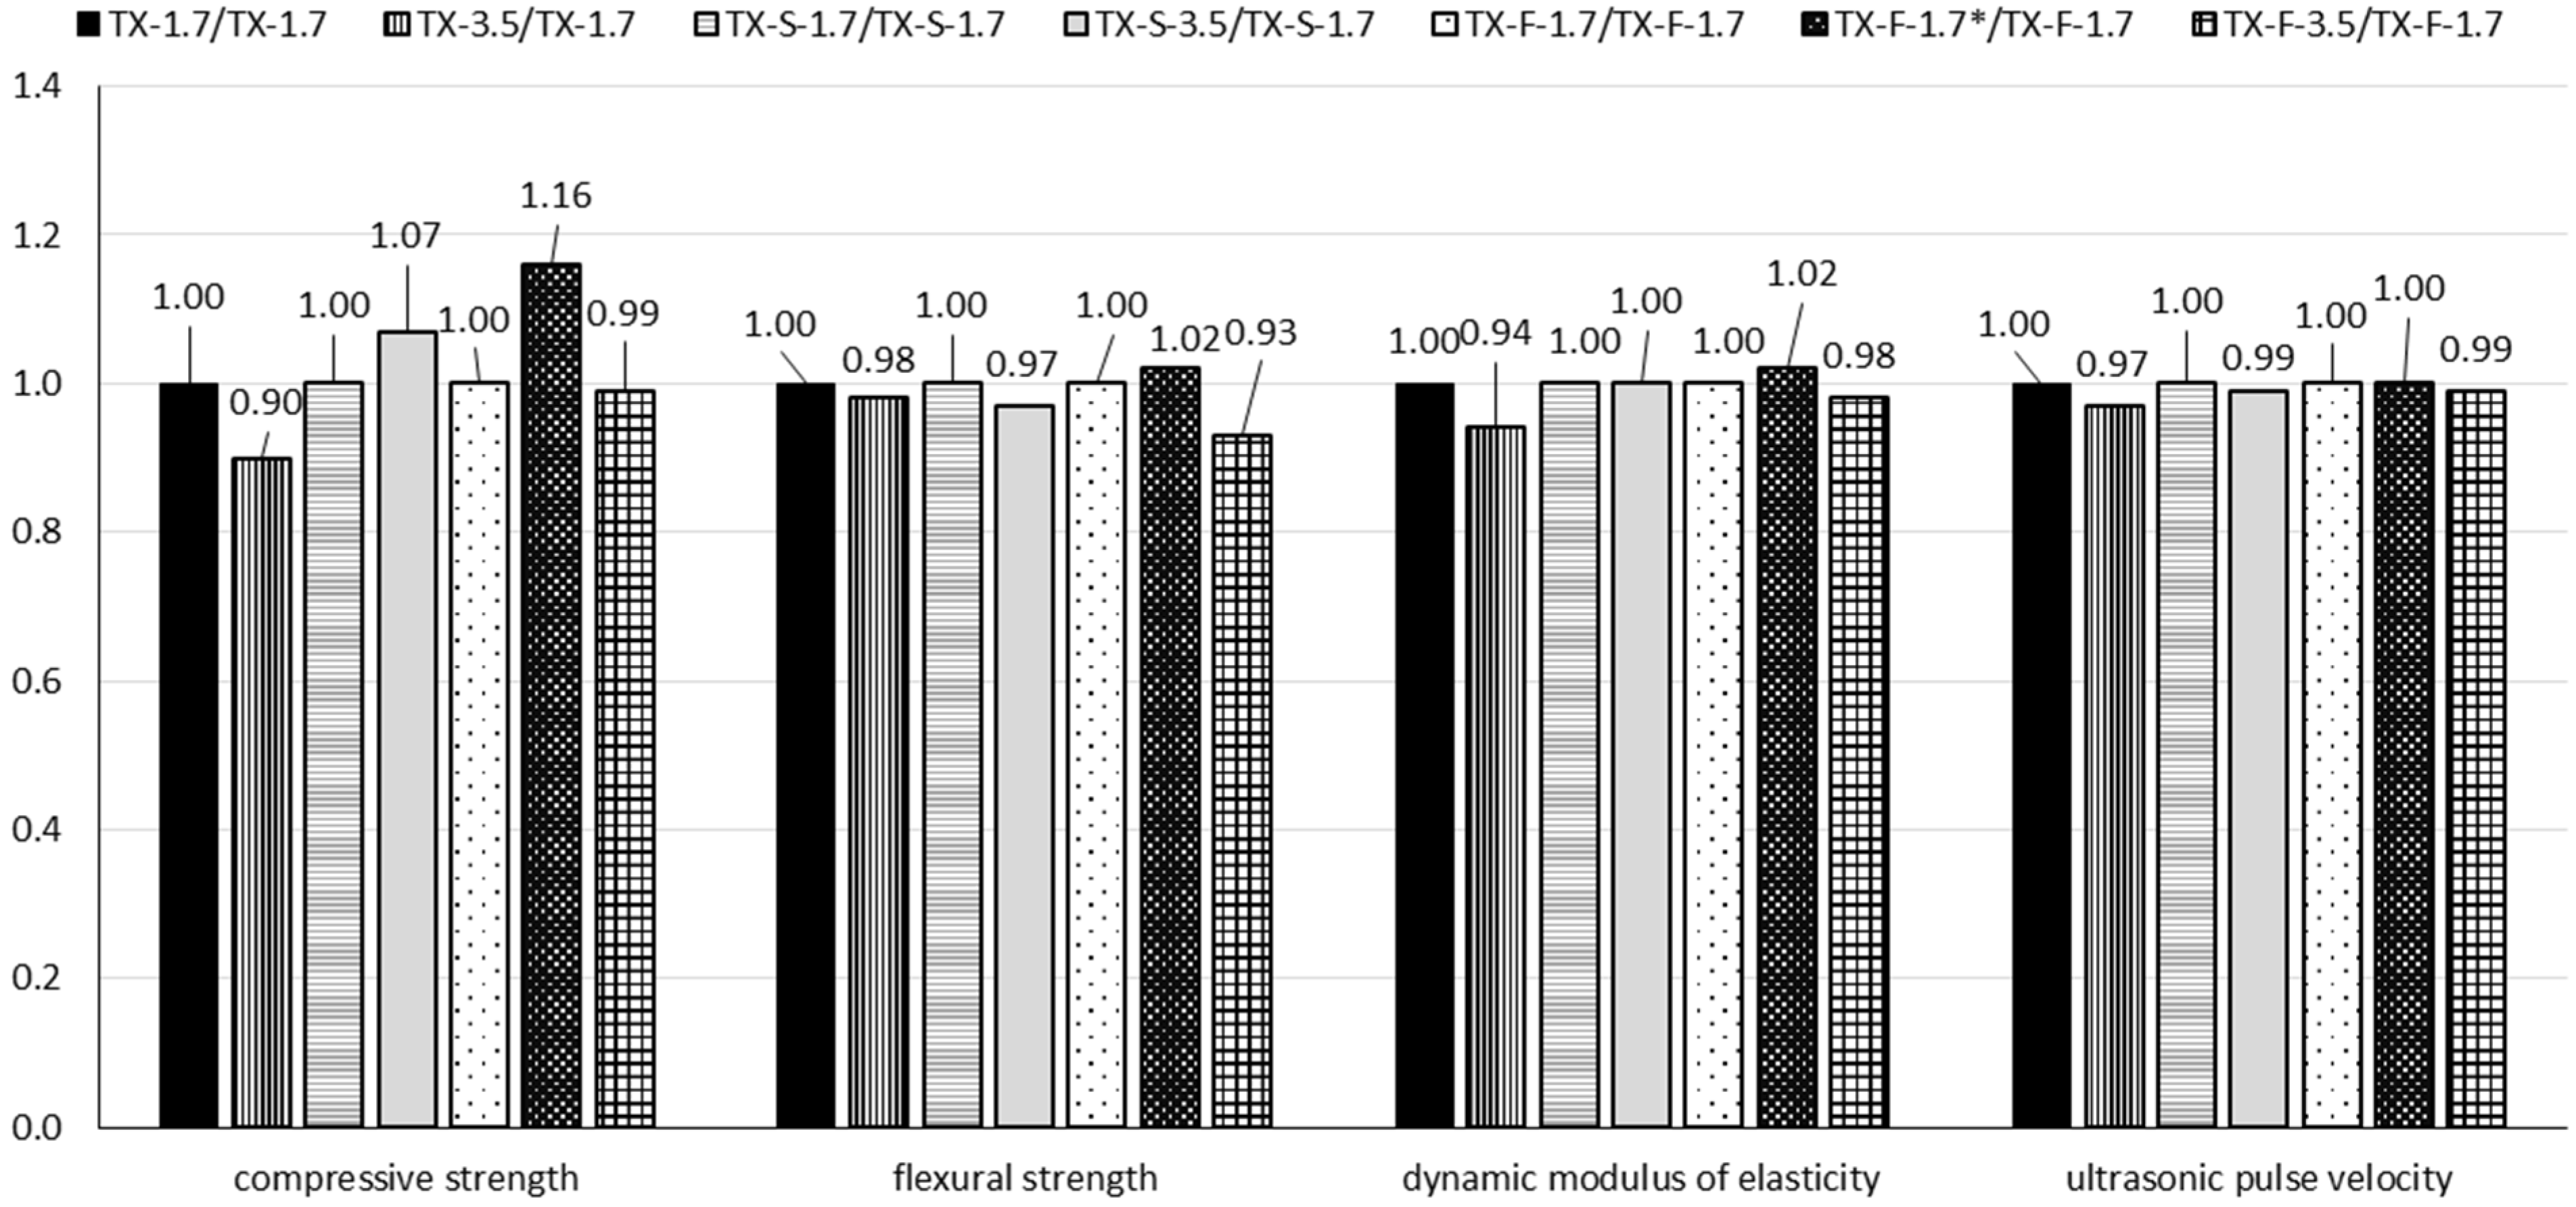
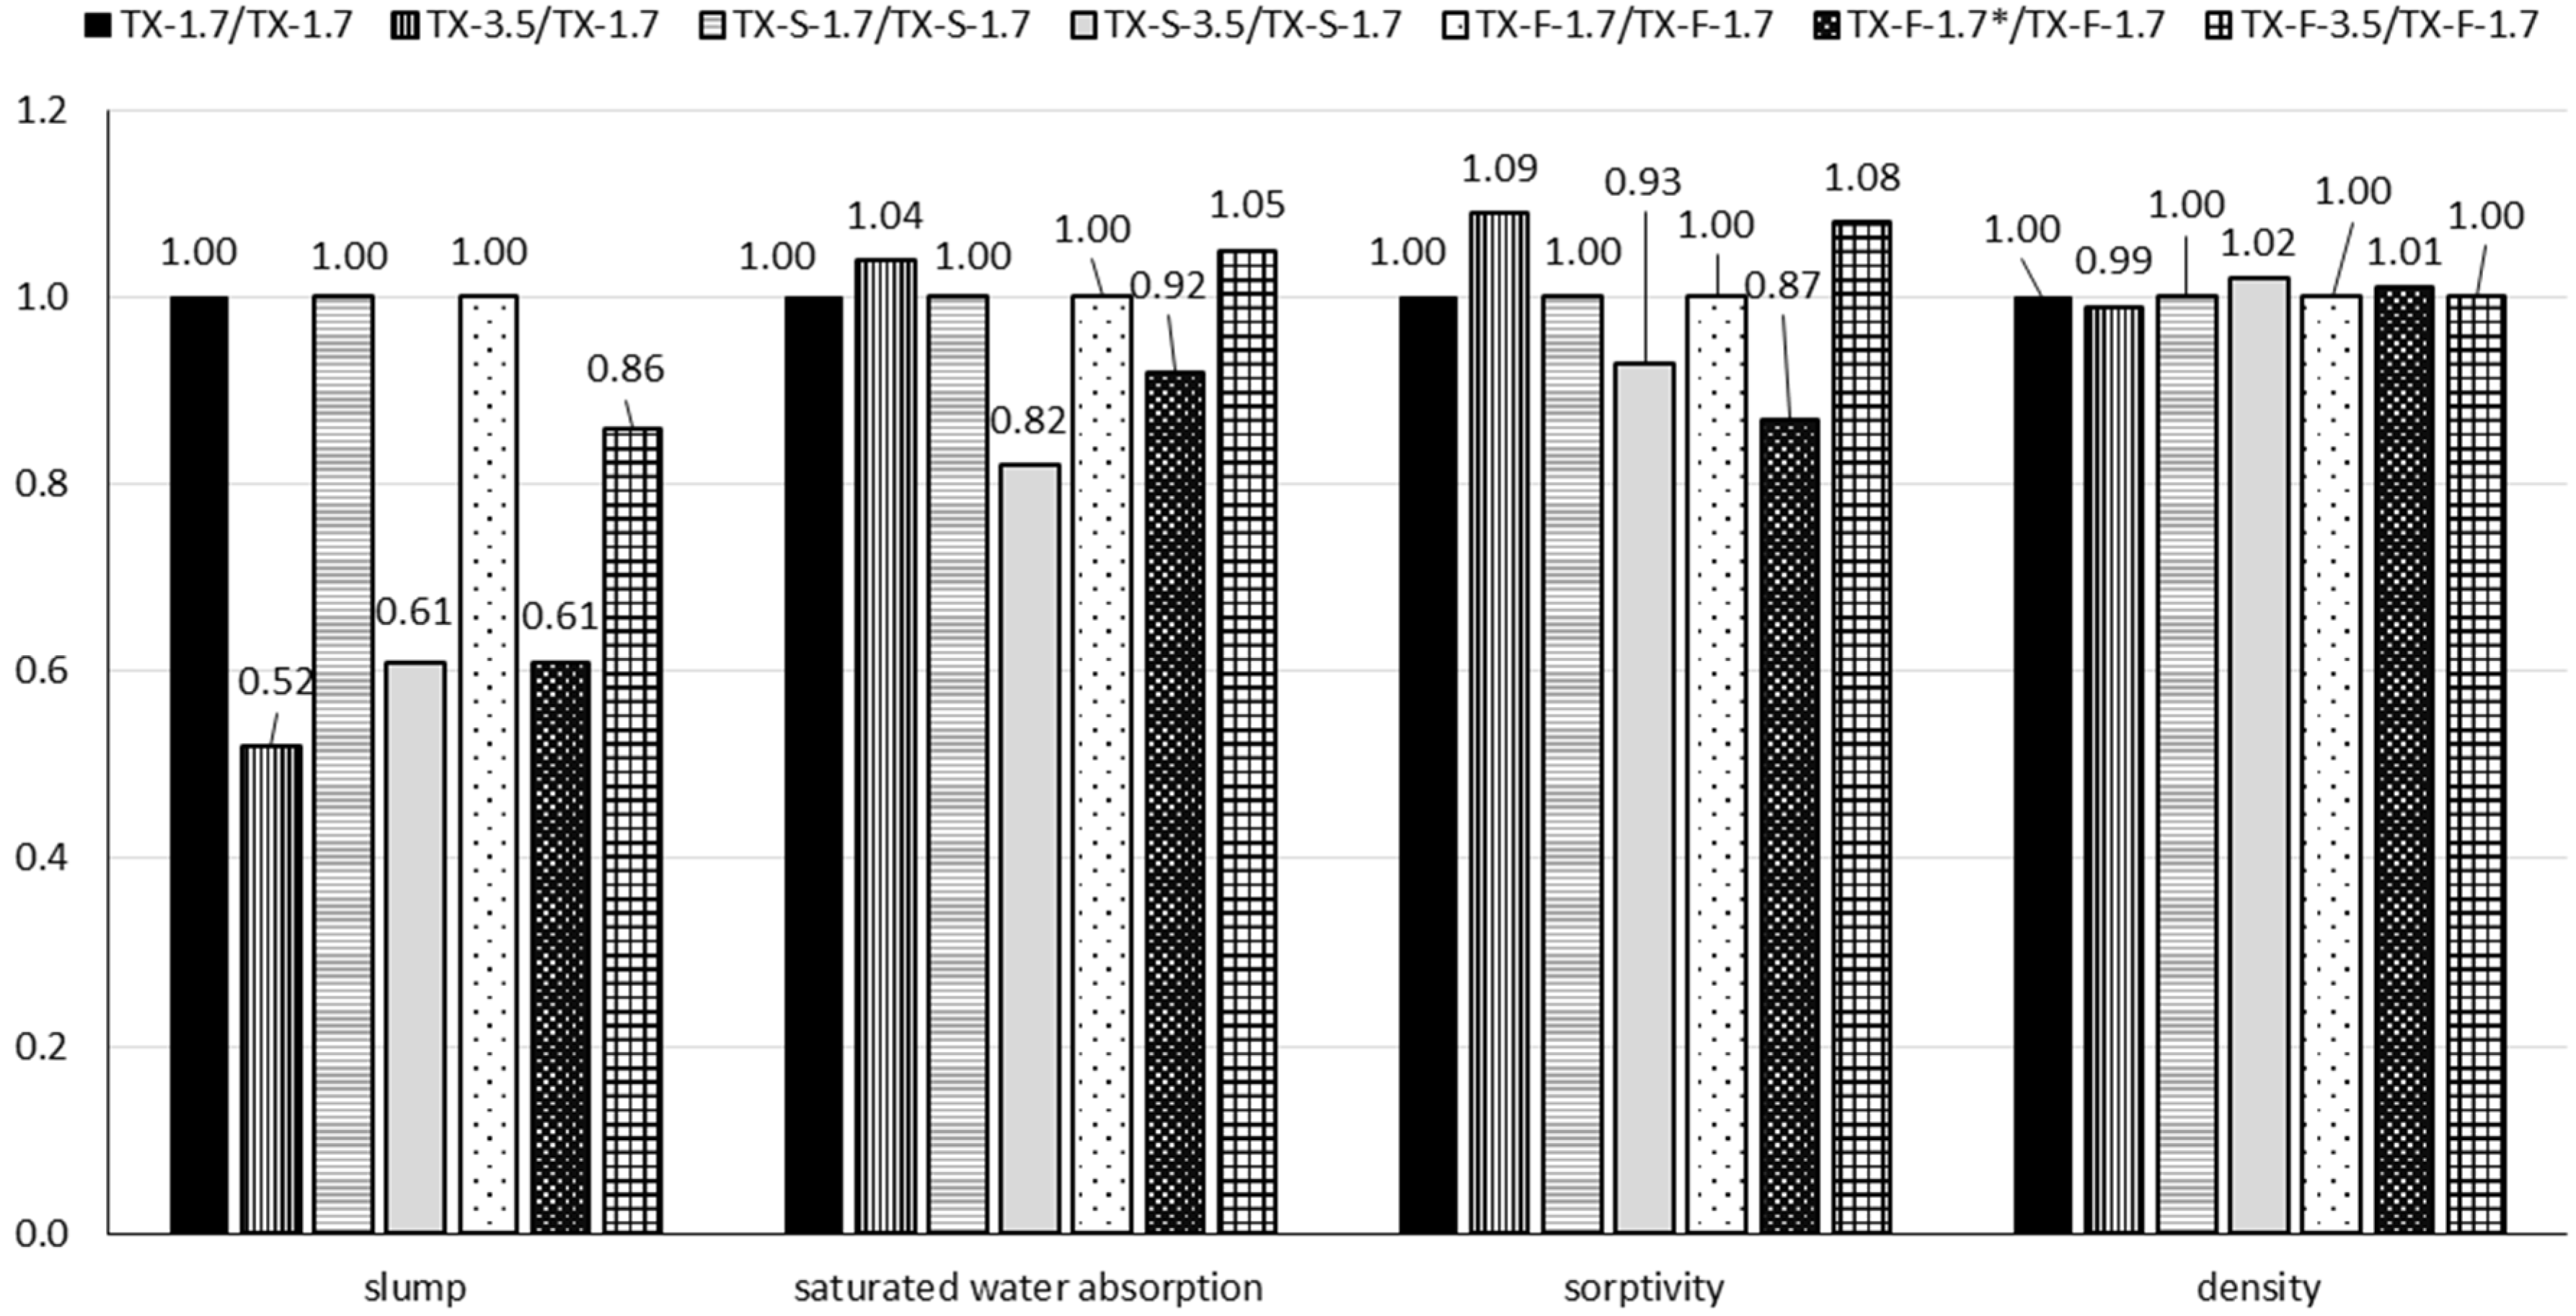
3.5. Influence of Textile Quantity on Test Results
4. Conclusions
Author Contributions
Funding
Institutional Review Board Statement
Informed Consent Statement
Data Availability Statement
Conflicts of Interest
References
- Ailenei, E.C.; Ionesi, S.D.; Dulgheriu, I.; Loghin, M.C.; Isopescu, D.N.; Maxineasa, S.G.; Baciu, I.-R. New Waste-Based Composite Material for Construction Applications. Materials 2021, 14, 6079. [Google Scholar] [CrossRef] [PubMed]
- Zamani, B.; Svanström, M.; Peters, G.; Rydberg, T. A Carbon Footprint of Textile Recycling: A Case Study in Sweden. J. Ind. Ecol. 2014, 19, 676–687. [Google Scholar] [CrossRef]
- Sun, X.; Wang, X.; Sun, F.; Tian, M.; Qu, L.; Perry, P.; Owens, H.; Liu, X. Textile Waste Fiber Regeneration via a Green Chemistry Approach: A Molecular Strategy for Sustainable Fashion. Adv. Mater. 2021, 33, 2105174. [Google Scholar] [CrossRef]
- Ayres, R.U. Industrial Metabolism: Theory and Policy. In Industrial Metabolism: Restructuring for Sustainable Development; Ayres, R.U., Simonis, U.E., Eds.; United Nations University Press: Tokyo, Japan, 1994; pp. 23–37. ISBN 92-808-0841-9. [Google Scholar]
- Rubino, C.; Liuzzi, S.; Martellotta, F.; Stefanizzi, P. Textile wastes in building sector: A review. Model. Meas. Control B 2018, 87, 172–179. [Google Scholar] [CrossRef]
- Kalkan, Ş.O.; Gündüz, L. A Study on the Usage of Denim Waste as Reinforcement Element in Composite Mortars on Exterior Building Applications. In Proceedings of the 12th International Congress on Advances in Civil Engineering, Istanbul, Turkey, 21–23 September 2016; pp. 1–7. [Google Scholar]
- Selvaraj, R.; Priyanka, R. Study on Recycled Waste Cloth in Concrete. Int. J. Eng. Res. 2015, 4. [Google Scholar] [CrossRef]
- Sathiyaraj, S.M.C. Experimental investigation of textile wastes used in concrete. IJSRD 2019, 7, 659–660. [Google Scholar]
- Paiva, A.; Varum, H.; Caldeira, F.; Sá, A.; Nascimento, D.; Teixeira, N. Textile subwaste as a thermal insulation building material. In Proceedings of the International Conference on Petroleum and Sustainable Development IPCBEE, Dubai, United Arab Emirates, 28–30 December 2011; Volume 26, pp. 78–82. [Google Scholar]
- Briga-Sá, A.; Nascimento, D.; Teixeira, N.; Pinto, J.; Caldeira, F.; Varum, H.; Paiva, A. Textile waste as an alternative thermal insulation building material solution. Constr. Build. Mater. 2013, 38, 155–160. [Google Scholar] [CrossRef]
- Teklehaimanot, M.; Hailay, H.; Tesfaye, T. Manufacturing of Ecofriendly Bricks Using Microdust Cotton Waste. J. Eng. 2021, 2021, 8815965. [Google Scholar] [CrossRef]
- Agrawal, S.K.; Watile, R.K.; Mohata, P.V.; Makwana, S.C. Utilization of Textile Apparel Waste in Clay Brick. Int. J. Adv. Res. Eng. Technol. 2013, 4, 48–52. [Google Scholar]
- Dos Reis, J.M.L. Effect of textile waste on the mechanical properties of polymer concrete. Mater. Res. 2009, 12, 63–67. [Google Scholar] [CrossRef]
- Kamble, Z.; Behera, B.K. Mechanical properties and water absorption characteristics of composites reinforced with cotton fibres recovered from textile waste. J. Eng. Fibers Fabr. 2020, 15, 1–8. [Google Scholar] [CrossRef]
- Ramamoorthy, S.K.; Persson, A.; Skrifvars, M. Reusing textile waste as reinforcements in composites. J. Appl. Polym. Sci. 2014, 131, 40687. [Google Scholar] [CrossRef]
- Dissanayake, D.; Weerasinghe, D.; Wijesinghe, K.; Kalpage, K. Developing a compression moulded thermal insulation panel using postindustrial textile waste. Waste Manag. 2018, 79, 356–361. [Google Scholar] [CrossRef] [PubMed]
- Aly, N.M.; Seddeq, H.; Elnagar, K.; Hamouda, T. Acoustic and thermal performance of sustainable fiber reinforced thermoplastic composite panels for insulation in buildings. J. Build. Eng. 2021, 40, 102747. [Google Scholar] [CrossRef]
- Jordeva, S.; Tomovska, E.; Trajković, D.; Zafirova, K. Textile waste as a thermal insulation material. Tekst. J. Text. Cloth. Technol. 2014, 63, 174–178. [Google Scholar]
- Zach, J.; Hroudová, J.; Korjenic, A. Environmentally efficient thermal and acoustic insulation based on natural and waste fibers. J. Chem. Technol. Biotechnol. 2016, 91, 2156–2161. [Google Scholar] [CrossRef]
- Binici, H.; Eken, M.; Dolaz, M.; Aksogan, O.; Kara, M. An environmentally friendly thermal insulation material from sunflower stalk, textile waste and stubble fibres. Constr. Build. Mater. 2014, 51, 24–33. [Google Scholar] [CrossRef]
- Binici, H.; Gemci, R.; Kucukonder, A.; Solak, H.H. Investigating sound insulation, thermal conductivity and radioactivity of chipboards produced with cotton waste, fly ash and barite. Constr. Build. Mater. 2012, 30, 826–832. [Google Scholar] [CrossRef]
- Del Mar Barbero-Barrera, M.; Pombo, O.; Navacerrada, M. Textile fibre waste bindered with natural hydraulic lime. Compos. Part B Eng. 2016, 94, 26–33. [Google Scholar] [CrossRef]
- Aghaee, K.; Foroughi, M. Construction of Lightweight Concrete Partitions Using Textile Waste. In Proceedings of the 2nd International Conference for Sustainable Design, Engineering and Construction, Fort Worth, TX, USA, 7–9 November 2012; American Society of Civil Engineering: Reston, VA, USA, 2012. [Google Scholar] [CrossRef]
- Aghaee, K.; Foroughi, M. Mechanical Properties of Lightweight Concrete Partition with a Core of Textile Waste. Adv. Civ. Eng. 2013, 2013, 482310. [Google Scholar] [CrossRef]
- Aghaee, K.; Yazdi, M.A.; Yang, J. Flexural properties of composite gypsum partition panel. Proc. Inst. Civ. Eng.—Eng. Sustain. 2015, 168, 258–263. [Google Scholar] [CrossRef]
- Sadrolodabaee, P.; Claramunt, J.; Ardanuy, M.; de la Fuente, A. Characterization of a textile waste nonwoven fabric reinforced cement composite for non-structural building components. Constr. Build. Mater. 2021, 276, 122179. [Google Scholar] [CrossRef]
- Sadrolodabaee, P.; Claramunt, J.; Ardanuy, M.; de la Fuente, A. A Textile Waste Fiber-Reinforced Cement Composite: Comparison between Short Random Fiber and Textile Reinforcement. Materials 2021, 14, 3742. [Google Scholar] [CrossRef]
- Aspiras, F.F.; Manalo, J.R.I. Utilization of Textile Waste Cuttings as Building Material. J. Mater. Process. Technol. 1995, 1–4, 379–384. [Google Scholar] [CrossRef]
- Anglade, J.; Benavente, E.; Rodríguez, J.; Hinostroza, A. Use of Textile Waste as an Addition in the elaboration of an Ecological Concrete Block. IOP Conf. Ser. Mater. Sci. Eng. 2021, 1054, 012005. [Google Scholar] [CrossRef]
- Algin, H.M.; Turgut, P. Cotton and limestone powder wastes as brick material. Constr. Build. Mater. 2008, 22, 1074–1080. [Google Scholar] [CrossRef]
- Jayasinghe, I.; Basnayake, B.; Amarathunga, K.; Dissanayake, P. Environmental Conservation Efforts in Developing Textile Waste Incorporated Cement Blocks. Trop. Agric. Res. 2010, 21, 126. [Google Scholar] [CrossRef]
- Tiuc, A.-E.; Vermeşan, H.; Gabor, T.; Vasile, O. Improved Sound Absorption Properties of Polyurethane Foam Mixed with Textile Waste. Energy Procedia 2016, 85, 559–565. [Google Scholar] [CrossRef]
- Dobilaite, V.; Mileriene, G.; Juciene, M.; Saceviciene, V. Investigation of current state of pre-consumer textile waste generated at Lithuanian enterprises. Int. J. Cloth. Sci. Technol. 2017, 29, 491–503. [Google Scholar] [CrossRef]
- Dolatabadi, M.K.; Janetzko, S.; Gries, T. Geometrical and mechanical properties of a non-crimp fabric applicable for textile reinforced concrete. J. Text. Inst. 2013, 105, 711–716. [Google Scholar] [CrossRef]
- Peled, A.; Mobasher, B.; Bentur, A. Textile Reinforced Concrete; CRC Press, Taylor & Francis Group: Boca Raton, FL, USA, 2017; ISBN 9781482282481. [Google Scholar]
- Peled, A.; Bentur, A. Reinforcement of cementitious matrices by warp knitted fabrics. Mater. Struct. 1998, 31, 543–550. [Google Scholar] [CrossRef]
- Peled, A.; Bentur, A.; Yankelevsky, D. Effects of Woven Fabric Geometry on the Bonding Performance of Cementitious Composites. Adv. Cem. Based Mater. 1998, 7, 20–27. [Google Scholar] [CrossRef]
- Peled, A.; Bentur, A. Geometrical characteristics and efficiency of textile fabrics for reinforcing cement composites. Cem. Concr. Res. 2000, 30, 781–790. [Google Scholar] [CrossRef]
- El Messiry, M.; Mito, A.-B.; Al-Oufy, A.; El-Tahan, E. Effect of fabric material and tightness on the mechanical properties of fabric–cement composites. Alex. Eng. J. 2014, 53, 795–801. [Google Scholar] [CrossRef]
- Eldin, M.M.; El-tahan, E. Performance of cotton woven fabrics structures in reinforcing of cement elements. In Proceedings of the International Conference on Advances in Structural and Geotechnical Engineering, Hurghada, Egypt, 27–30 March 2017; p. 15. [Google Scholar]
- Peled, A. Cement Penetrability Characteristics in Textile Cement Systems; Technische Universität Dresden: Dresden, Germany, 2017; pp. 99–114. [Google Scholar]
- Juradin, S.; Boko, I.; Grubeša, I.N.; Jozić, D.; Mrakovčić, S. Influence of harvesting time and maceration method of Spanish Broom (Spartium junceum L.) fibers on mechanical properties of reinforced cement mortar. Constr. Build. Mater. 2019, 225, 243–255. [Google Scholar] [CrossRef]
- Yan, L.; Kasal, B.; Huang, L. A review of recent research on the use of cellulosic fibres, their fibre fabric reinforced cementitious, geo-polymer and polymer composites in civil engineering. Compos. Part B Eng. 2016, 92, 94–132. [Google Scholar] [CrossRef]
- Ferreira, S.R.; Silva, F.D.A.; Lima, P.R.L.; Filho, R.D.T. Effect of fiber treatments on the sisal fiber properties and fiber–matrix bond in cement based systems. Constr. Build. Mater. 2015, 101, 730–740. [Google Scholar] [CrossRef]
- Ferreira, S.R.; Neto, A.R.S.; Silva, F.D.A.; de Souza, F.G.; Filho, R.D.T. The influence of carboxylated styrene butadiene rubber coating on the mechanical performance of vegetable fibers and on their interface with a cement matrix. Constr. Build. Mater. 2020, 262, 120770. [Google Scholar] [CrossRef]
- Ardanuy, M.; Claramunt, J.; García-Hortal, J.A.; Barra, M. Fiber-matrix interactions in cement mortar composites reinforced with cellulosic fibers. Cellulose 2011, 18, 281–289. [Google Scholar] [CrossRef]
- Merta, I.; Poletanovic, B.; Kopecsk, K. Durability of Natural Fibres within Cement-Based Materials—Review. Concr. Struct. 2017, 18, 10–15. [Google Scholar]
- Hasan, K.M.F.; Horváth, P.G.; Alpár, T. Lignocellulosic Fiber Cement Compatibility: A State of the Art Review. J. Nat. Fibers 2021, 1–26. [Google Scholar] [CrossRef]
- Filho, R.D.T.; Silva, F.D.A.; Fairbairn, E.; Filho, J.D.A.M. Durability of compression molded sisal fiber reinforced mortar laminates. Constr. Build. Mater. 2009, 23, 2409–2420. [Google Scholar] [CrossRef]
- Filho, R.D.T.; Scrivener, K.; England, G.L.; Ghavami, K. Durability of alkali-sensitive sisal and coconut fibres in cement mortar composites. Cem. Concr. Compos. 2000, 22, 127–143. [Google Scholar] [CrossRef]
- Juradin, S.; Boko, I.; Grubeša, I.N.; Jozić, D.; Mrakovčić, S. Influence of different treatment and amount of Spanish broom and hemp fibres on the mechanical properties of reinforced cement mortars. Constr. Build. Mater. 2020, 273, 121702. [Google Scholar] [CrossRef]
- Pereira, C.; Jorge, F.C.; Ferreira, J.M.F. Adsorption of Cations from a Cement Suspension onto Lignocellulosic Substrates and its Influence on Cement Setting. J. Wood Chem. Technol. 2005, 25, 231–244. [Google Scholar] [CrossRef]
- Caldeira, F.; Monteiro, H.; Pinto, J.; Varum, H. Recycling Textile Residues into Cement Composites. Environ. Eng. Manag. J. 2018, 17, 1863–1868. [Google Scholar] [CrossRef]
- Hsieh, Y.-L.; Thompson, J.; Miller, A. Water Wetting and Retention of Cotton Assemblies as Affected by Alkaline and Bleaching Treatments. Text. Res. J. 1996, 66, 456–464. [Google Scholar] [CrossRef]
- Alam, R.; Islam, R. Pre-post Bleaching Behaviors of Cotton Knits Using Reductive and Oxidative bleaches. Int. J. Polym. Text. Eng. 2020, 7, 42–53. [Google Scholar] [CrossRef]
- Bartulović, B.; Juradin, S.; Žižić, D.; Mrakovčić, S. Possibility of Using Cotton Knitted Fabric Waste in Concrete. IOP Conf. Ser. Mater. Sci. Eng. 2021, 1203, 022074. [Google Scholar] [CrossRef]
- Juradin, S.; Mihanović, F.; Ostojić-Škomrlj, N.; Rogošić, E. Pervious Concrete Reinforced with Waste Cloth Strips. Sustainability 2022, 14, 2723. [Google Scholar] [CrossRef]
- Sitotaw, D.B.; Adamu, B.F. Tensile Properties of Single Jersey and 1×1 Rib Knitted Fabrics Made from 100% Cotton and Cotton/Lycra Yarns. J. Eng. 2017, 2017, 4310782. [Google Scholar] [CrossRef]
- HRN EN 12350-2:2019; Testing Fresh Concrete-Slump Test. CSI: Zagreb, Croatia, 2019.
- EN 12390-7:2019; Testing Hardened Concrete—Part 7: Density of Hardened Concrete. CSI: Zagreb, Croatia, 2019.
- HRN EN 12504-4:2021; Testing Concrete in Structures—Part 4: Determination of Ultrasonic Pulse Velocity. CSI: Zagreb, Croatia, 2021.
- HRN EN 12390-3:2019; Testing Hardened Concrete—Part 3: Compressive Strength of Test Specimens. CSI: Zagreb, Croatia, 2019.
- HRN EN 12390-5:2019; Testing Hardened Concrete—Part 5: Flexural Strength of Test Specimens. CSI: Zagreb, Croatia, 2019.
- Lakusic, S. Durability characteristics of copper slag concrete with fly ash. J. Croat. Assoc. Civ. Eng. 2017, 69, 1031–1040. [Google Scholar] [CrossRef]
- Gao, Q.; Ma, Z.; Xiao, J.; Li, F. Effects of Imposed Damage on the Capillary Water Absorption of Recycled Aggregate Concrete. Adv. Mater. Sci. Eng. 2018, 2018, 2890931. [Google Scholar] [CrossRef]
- ASTM C1585−13; Standard Test Method for Measurement of Rate of Absorption of Water by Hydraulic-Cement Concretes. ASTM International: West Conshohocken, PA, USA, 2013.
- Sneka, S.; Nirmala, M.; Dhanalakshm, G. Size Effect of Aggregate in the Mechanical Properties. Int. Res. J. Eng. Technol. 2018, 5, 2093–2096. [Google Scholar]
- Ukrainczyk, V. Concrete—Structure, Properties and Technology; Alcor: Zagreb, Croatia, 1994. [Google Scholar]
- Fortes, E.S.; Parsekian, G.A.; Camacho, J.S.; Fonseca, F.S. Compressive strength of masonry constructed with high strength concrete blocks. Rev. IBRACON de Estruturas e Mater. 2017, 10, 1273–1319. [Google Scholar] [CrossRef]
- Awal, A.A.; Mohammadhosseini, H. Green concrete production incorporating waste carpet fiber and palm oil fuel ash. J. Clean. Prod. 2016, 137, 157–166. [Google Scholar] [CrossRef]
- Sadrolodabaee, P.; Claramunt, J.; Ardanuy, M.; de la Fuente, A. Mechanical and durability characterization of a new textile waste micro-fiber reinforced cement composite for building applications. Case Stud. Constr. Mater. 2021, 14, e00492. [Google Scholar] [CrossRef]
- Ali, M.F.; Memon, N.A.; Memon, B.A.; Memon, M.A.; Memon, A.N. The Effect of Textile on Compressive Strength of Concrete. Quaid-E-Awam Univ. Res. J. Eng. Sci. Technol. Nawabshah 2019, 17, 21–26. [Google Scholar] [CrossRef]
- Ultrasonic Pulse Velocity Meter. Available online: https://www.iricen.gov.in/LAB/res/pdf/test-32.pdf (accessed on 20 March 2022).
- HRN EN 13263-1:2009; Silica Fume for Concrete—Part 1: Definitions, Requirements and Conformity Criteria. CSI: Zagreb, Croatia, 2009.
- HRN EN 206-1:2006; Concrete—Part 1: Specification, Performance, Production and Conformity (Includes Amendments A1:2004 and A2:2005) (EN 206-1:2000+A1:2004+A2:2005). CSI: Zagreb, Croatia, 2006.
- FIB—International Federation for Structural Concrete. Diagnosis and Assessment of Concrete Structures State of Art Report; CEB Bulletin; Euro-International Committee for Concrete: Lausannem, Switzerland, 1989. [Google Scholar]
- De Medeiros-Junior, R.A.; Munhoz, G.D.S.; de Medeiros, M.H.F. Correlations between water absorption, electrical resistivity and compressive strength of concrete with different contents of pozzolan. Rev. ALCONPAT 2019, 9, 152–166. [Google Scholar] [CrossRef]
- Yang, L.; Gao, D.; Zhang, Y.; Tang, J.; Li, Y. Relationship between sorptivity and capillary coefficient for water absorption of cement-based materials: Theory analysis and experiment. R. Soc. Open Sci. 2019, 6, 190112. [Google Scholar] [CrossRef]
- RILEM TC 116-PCD: Permeability of concrete as a criterion of its durability-Tests for gas permeability of concrete. Mater. Struct. 1999, 32, 163–173.
- Beushausen, H.; Luco, L.F. (Eds.) Performance-Based Specifications and Control of Concrete Durability; RILEM TC 230-PSC; Springer: Dordrecht, The Netherlands, 2016; ISBN 978-94-017-7309-6. [Google Scholar]


| Cement | C3S | C2S | C3A | C4AF | Ca(OH)2 | CaSO4·2H2O | CaCO3 | Specific Surface Area According to Blaine | Specific Gravity |
|---|---|---|---|---|---|---|---|---|---|
| % | % | % | % | % | % | % | cm2/g | g/cm3 | |
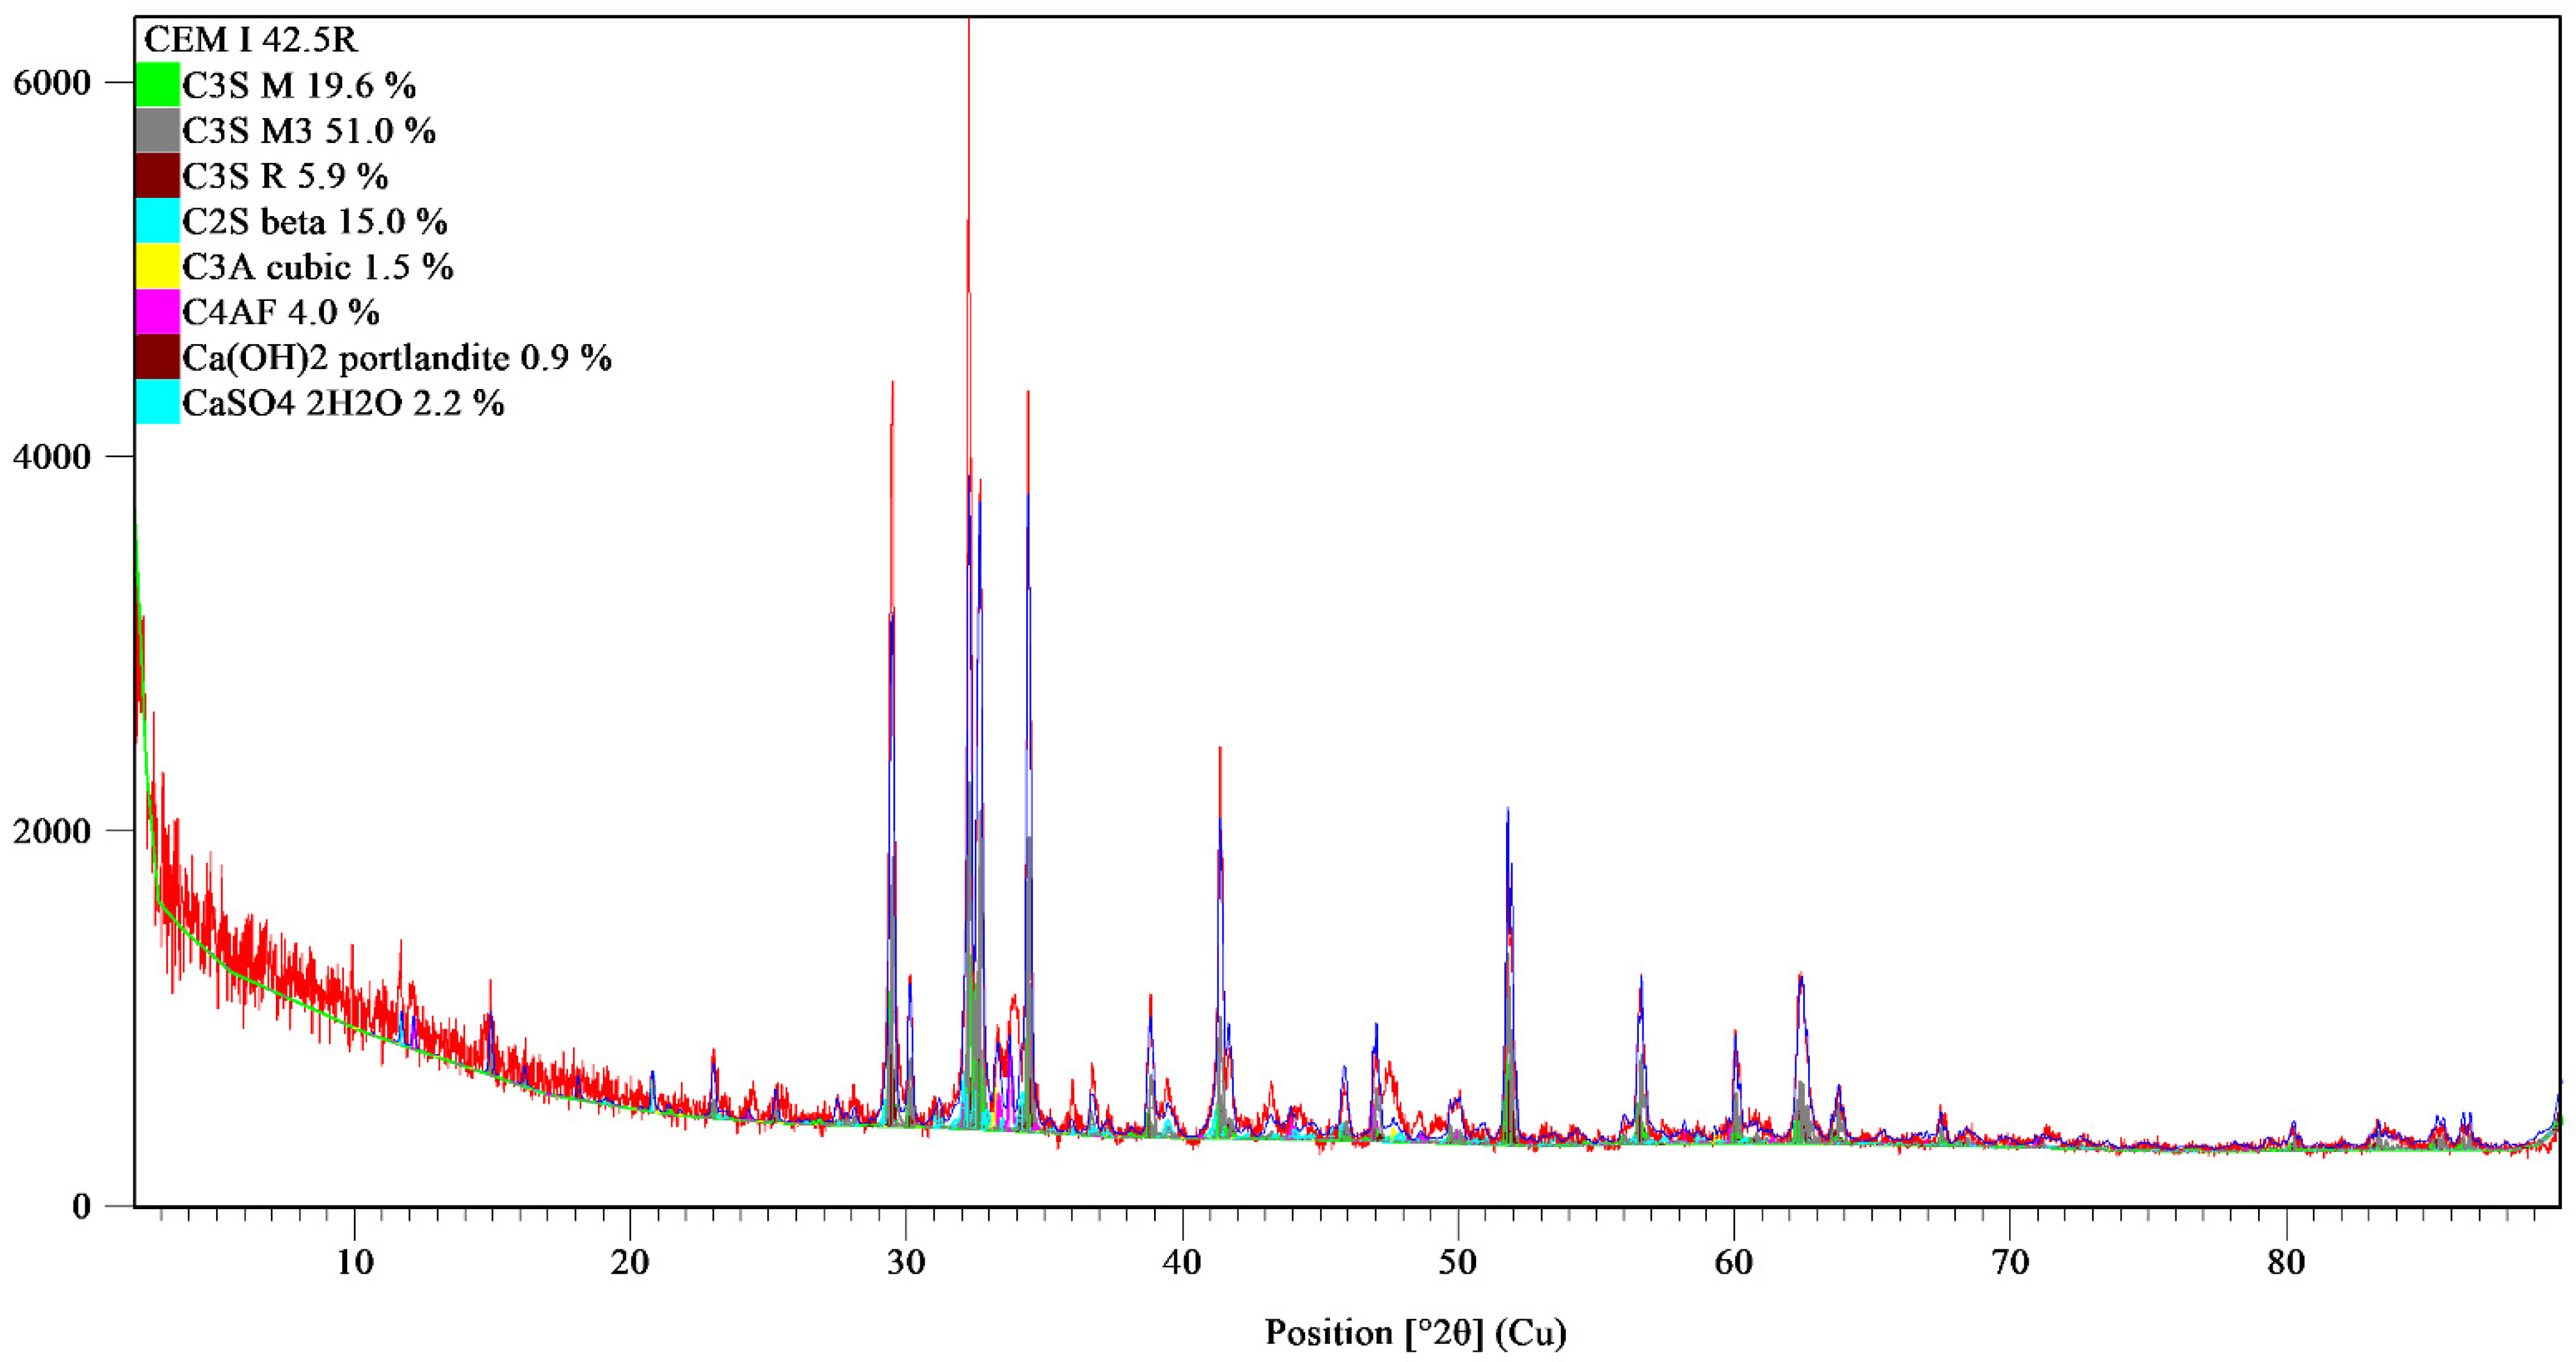
| CEM I 42.5 R | 76.5 | 15.0 | 1.5 | 4.0 | 0.9 | 2.2 | - | 3785 | 3.16 |
| CEM II/B-M (S-LL) 42.5 N | 59.1 | 13.6 | 1.3 | 2.8 | 0.4 | 6.6 | 16.2 | 4110 | 3.09 |
| Single Jersey | Fine Rib | |
|---|---|---|
| Raw material composition | 100% cotton | 100% cotton |
| Fineness of yarn (tex; Nm, Ne): (HRN ISO 7211-5:2003) | 20 tex × 1; Nm 50/1; Ne 30/1 | 20 tex × 1; Nm 50/1 |
| Mass per unit area, dry (g/m2): (HRN EN 12127:2003) | 154 | 180 |
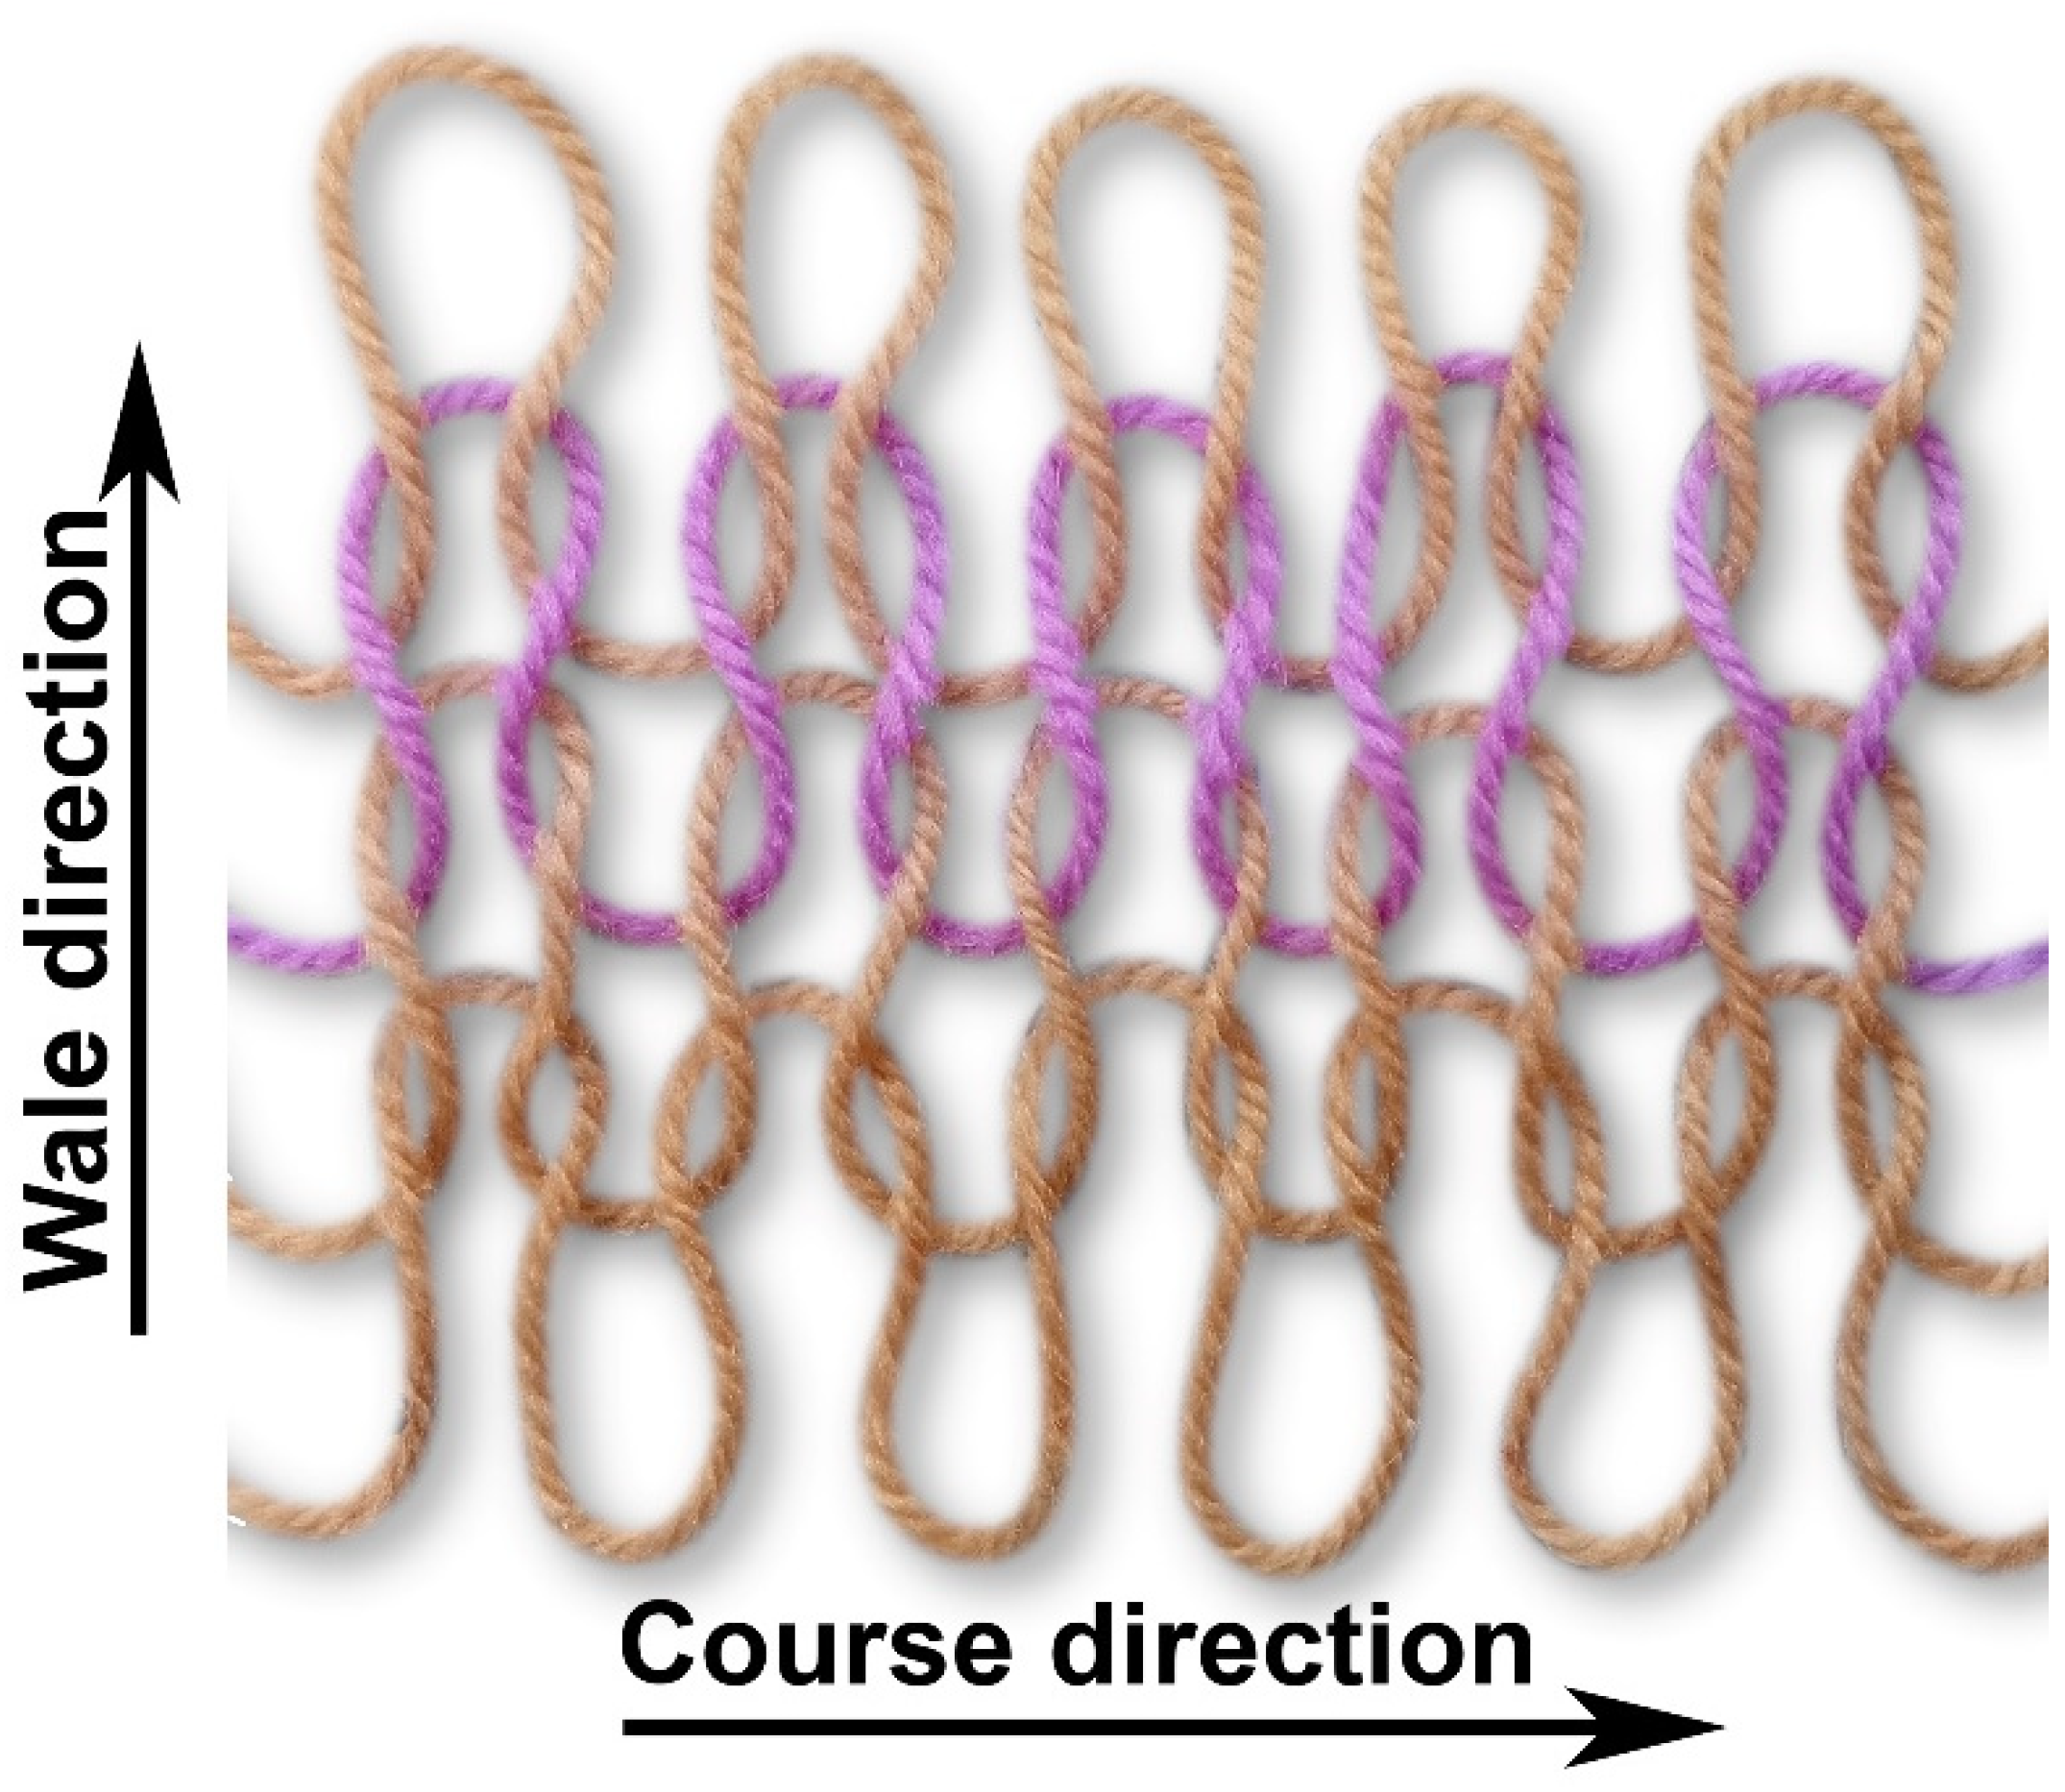
| Loop density per 10 cm: (HRN EN 14971:2008) | Wale direction: 150 | Wale direction: 120 |
| Course direction: 214 | Course direction: 180 |
| Constituent Mixtures | Cement | w/b | CKFW | Silica Fume | Crushed Limestone Aggregate | SP1 | SP2 | ||
|---|---|---|---|---|---|---|---|---|---|
| 0/4 mm | 4/8 mm | 8/16 mm | |||||||
| kg | kg | kg | kg | kg | kg | kg | kg | ||
| E | 350 | 0.5 | - | - | 968.7 | 279.4 | 614.8 | 2.1 | |
| TX-1.7 | 350 | 0.5 | 3.8 | - | 944.5 | 272.5 | 599.4 | 2.1 | |
| TX-3.5 | 350 | 0.5 | 7.7 | - | 920.3 | 265.5 | 584.0 | 2.1 | |
| E-S | 350 | 0.5 | - | 35 | 901.0 | 259.9 | 571.8 | 2.3 | |
| TX-S-1.7 | 350 | 0.5 | 3.8 | 35 | 877.3 | 253.1 | 556.7 | 2.3 | |
| TX-S-3.5 | 350 | 0.5 | 7.7 | 35 | 852.2 | 245.8 | 540.8 | 2.3 | |
| E-F | 350 | 0.5 | - | - | 1824.0 | - | - | 2.1 | |
| TX-F-1.7 | 350 | 0.5 | 3.8 | - | 1785.0 | - | - | 2.1 | |
| TX-F-1.7 * | 350 | 0.5 | 3.8 | - | 1785.0 | - | - | 2.1 | |
| TX-F-3.5 | 350 | 0.5 | 7.7 | - | 1737.0 | - | - | 2.1 | |
| Measured Values Mixtures | Compressive Strength | Flexural Strength | Dynamic Modulus of Elasticity | UPV | Slump | Sorptivity × 10−4 | Saturated Water Absorption | Density |
|---|---|---|---|---|---|---|---|---|
| MPa | MPa | GPa | m/s | mm | mm/h0.5 | % | kg/m3 | |
| E | 66.4 ± 0.21 | 7.0 ± 0.03 | 52.6 ± 0.29 | 4905.9 ± 14.77 | 170 | 6.12 | 3.3 ± 0.02 | 2428.0 ± 1.93 |
| TX-1.7 | 59.5 ± 2.00 | 8.5 ± 0.31 | 50.6 ± 3.08 | 4839.3 ± 147.85 | 135 | 7.04 | 4.2 ± 0.15 | 2399.8 ± 4.69 |
| TX-3.5 | 53.4 ± 1.05 | 8.3 ± 0.16 | 47.5 ± 4.07 | 4709.0 ± 207.39 | 70 | 7.66 | 4.4 ± 0.06 | 2378.8 ± 19.77 |
| E-S | 58.7 ± 2.00 | 9.1 ± 0.42 | 33.0 ± 0.63 | 3986.6 ± 42.24 | 100 | 6.92 | 3.1 ± 0.11 | 2307.3 ± 27.39 |
| TX-S-1.7 | 52.8 ± 1.04 | 8.8 ± 0.15 | 31.0 ± 0.84 | 3908.9 ± 57.57 | 140 | 6.90 | 3.3 ± 0.13 | 2251.5 ± 16.77 |
| TX-S-3.5 | 56.5 ± 0.75 | 8.5 ± 0.08 | 20.9 ± 0.05 | 3870.2 ± 5.20 | 85 | 6.40 | 2.7 ± 0.03 | 2289.7 ± 2.50 |
| E-F | 30.0 ± 0.74 | 4.1 ± 0.32 | 25.7 ± 0.35 | 3580.8 ± 11.59 | 220 | 21.82 | 7.3 ± 0.20 | 2227.3 ± 15.98 |
| TX-F-1.7 * | 29.6 ± 0.69 | 5.7 ± 0.14 | 25.4 ± 0.06 | 3563.0 ± 7.47 | 110 | 19.77 | 7.2 ± 0.43 | 2222.8 ± 8.13 |
| TX-F-1.7 | 25.5 ± 0.70 | 5.6 ± 0.36 | 25.0 ± 0.45 | 3546.1 ± 22.11 | 180 | 22.67 | 7.8 ± 0.23 | 2210.7 ± 14.00 |
| TX-F-3.5 | 25.2 ± 0.21 | 5.2 ± 0.04 | 24.6 ± 0.19 | 3524.4 ± 1.59 | 155 | 24.59 | 8.2 ± 0.07 | 2204.4 ± 18.95 |
Publisher’s Note: MDPI stays neutral with regard to jurisdictional claims in published maps and institutional affiliations. |
© 2022 by the authors. Licensee MDPI, Basel, Switzerland. This article is an open access article distributed under the terms and conditions of the Creative Commons Attribution (CC BY) license (https://creativecommons.org/licenses/by/4.0/).
Share and Cite
Bartulović, B.; Juradin, S.; Žižić, D.; Galić, M. Influence of Cotton Knitted Fabric Waste Addition on Concrete Properties. Buildings 2022, 12, 1121. https://doi.org/10.3390/buildings12081121
Bartulović B, Juradin S, Žižić D, Galić M. Influence of Cotton Knitted Fabric Waste Addition on Concrete Properties. Buildings. 2022; 12(8):1121. https://doi.org/10.3390/buildings12081121
Chicago/Turabian StyleBartulović, Bruno, Sandra Juradin, Dujmo Žižić, and Matea Galić. 2022. "Influence of Cotton Knitted Fabric Waste Addition on Concrete Properties" Buildings 12, no. 8: 1121. https://doi.org/10.3390/buildings12081121