Article

Energy-Efficient Retrofitting under Incomplete Information: A Data-Driven Approach and Empirical Study of Sweden

1
Department of Construction Management, Key Lab of Structures Dynamic Behavior and Control of the Ministry of Education, Harbin Institute of Technology, Harbin 150009, China
2
Department of Applied Physics and Electronics, Umeå University, 90187 Umeå, Sweden
*
Author to whom correspondence should be addressed.
Buildings 2022, 12(8), 1244; https://doi.org/10.3390/buildings12081244
Submission received: 14 July 2022 / Revised: 31 July 2022 / Accepted: 6 August 2022 / Published: 15 August 2022
(This article belongs to the Special Issue The Sustainable Future of Architecture, Engineering and Construction)

Abstract

:
The building performance simulation (BPS) based on physical models is a popular method to estimate the expected energy-savings of energy-efficient building retrofitting. However, many buildings, especially the older building constructed several decades ago, do not have full access to complete information for a BPS method. Incomplete information generally comes from the information that is missing, such as the U-value of part building components, due to incomplete documentation or component deterioration over time. It also comes from the case-specific incomplete information due to different documentation systems. Motivated by the available big data of real-life building performance datasets (BPDs), a data-driven approach is proposed to support the decision-making of building retrofitting selections under incomplete information conditions. The data-driven approach constructed a Performance Modelling with Data Imputation (PMDI) with integrated backpropagation neural networks, fuzzy C-means clustering, principal component analysis, and trimmed scores regression. An empirical study was conducted on real-life buildings in Sweden, and the results validated that the PMDI method can model the performance ranges of energy-efficient retrofitting for family house buildings with more than 90% confidence. For a target building in Stockholm, the suggested retrofitting measure is expected to save energy by 12,017~17,292 KWh/year.

1. Introduction

Large shares of buildings, such as in European countries, are running into the retrofitting phase [1]. Taking Sweden as an example, we can see that many buildings were constructed in the so-called Million Homes Program between 1965 and 1975. The residential buildings in Million Homes Program reach a 50-year service life and beyond, which presents a good opportunity to mitigate energy use of buildings through energy-efficient retrofitting [2]. Similarly, other European countries had a building construction boom after World War II, leaving many buildings needing retrofitting after more than 50 to 70 years of operations. Furthermore, a similar challenge is also faced in countries that have just experienced fast urbanization. In China, for instance, many industrial factories moved away from cities and left the industrial buildings in need of renovation to suit other purposes such as commercial or historical monument [3]. Various retrofitting measures, such as additional insulation walls, change to energy efficient windows, recovery of ventilation heat, and so on, can be adopted for a retrofitted building. It is significant to develop tools to estimate the performance (e.g., energy-savings and cost) of retrofitting measures and support the decision-making.
The building performance simulation (BPS) based on physical models is the main tool to estimate energy-savings from a set of retrofitting measures. Examples of commercial BPS tools include EnergyPlus, eQuest, and Ecotect, which aim to represent a building performance as-installed, as-operated, and as-used [4]. The BPS requires detailed building properties such as building detailed designs, operation schedules, HVAC design information, the climate, and solar/shading information [5]. However, such complete information may not always available, especially for older buildings, and the reason can be explained by two aspects. The incomplete building information comes from the detailed properties that are generally missing for older buildings, such as U-value of part building components due to incomplete design documentations, documented system changes, and deterioration of components, over long time of operations [6]. In addition, it also comes from the individual buildings that miss case-specific, varied information due to their different documentation systems and incomplete maintenance documentations. Because of these two situations of incomplete information in existing buildings (i.e., general and case-specific), it is recognized that identifying the most effective retrofitting measures and predicting the expected energy-savings through BPS approaches remain difficult in practices [7,8,9].
To address the challenge, previous studies would usually set average or other default values for generally missing building properties [10]. However, deterministic evaluations with default settings obviously cannot provide ranges of uncertainties and risks associated with building retrofitting decisions. Moreover, a significant difference between default and actual values is likely to reduce the validity and optimality of related decisions [11]. For case-specific incomplete information, previous studies usually set the missing information to be probability distributions based on statistical method from macrolevel data [12]. Then methods such as Monte Carlo analysis can be applied to compare the performance of various retrofitting measures. However, it is still challenging because an objective probability distribution of missing building information is inherently difficult to determine and different buildings even miss their specific, different information [13]. In addition, if a same probability distribution is applied for buildings, it is theoretically unreliable because the actual values of missing information are heavily influenced by buildings’ characteristics, such as building purpose, local climate, habits, and more [14,15]. Fortunately, recent studies will use the Bayesian method based on buildings’ monitoring data to inverse estimation the case-specific missing information [16]. However, it could still be inefficient and impractical to monitor all buildings in stock that need renovation.
Motivated by increasing availability of big-data sources on real-life building performances, also known as building performance datasets (BPDs), an emerging opportunity is shown to directly utilize BPDs to develop a data-driven approach to model the building performance and impute missing information. Some examples of BPDs include the Building Performance Dataset in the US, the Energy Performance Certificates in the EU, the Database for Energy Consumption of Commercial buildings (DECC) in Japan, etc. Previous studies demonstrated that the data-driven approach is able to learn from big data for building performance predictions [5,17] and for missing data imputation in wide fields [18].
Therefore, the proposed research will use Bayesian regularization backpropagation neural networks and fuzzy C-means clustering (BRBNN–FCM) to directly model the inner connections among available building properties, retrofitting measures, and corresponding performances. It overcomes the barrier that it must depend on complete building information for performance simulation. Meanwhile, the case-specific missing information is imputed by principal component analysis and trimmed scores regression (PCA–TSR) through considering the relationship among building’s characteristics, the missing information, and the entire knowledge describing by big data. The retrofitting in this study was modelled by prediction intervals (PIs), which aim to confidently estimate the performances of retrofitting measures by a range of values, e.g., in 90% confidence. To sum up, this approach is data-driven, and it can complement conventional BPS method in the condition of building renovation under incomplete information.

2. Literature Review

2.1. Current Retrofitting Estimation Methods

The building performance simulation (BPS) is currently the most widely applied method to estimate the performance of different building retrofitting measures [19]. The popular simulation platforms include EnergyPlus, eQuest, and Ecotect, DOE2.1E building energy simulation software, TRNYS, and so on. BPS technologies are able to simulate the theoretical energy, water consumption, and emissions of a building under different retrofitting measures [20] and under different climate scenarios [21]. BPSs were also integrated with optimization technology, such as GA, to search the optimal retrofitting decisions [22]. In this way BPS provides a decision support tool for the design of building retrofitting.
Another method for retrofitting estimation is theoretical model calculation, such as using energy balance [23]. A series of building behaviors such as thermal, ventilated, lighting, and occupation behaviors, are modelled by using a mathematic model. It is especially suitable to us a retrofitting analysis of building stock at the macrolevel, as it requires relatively lower accuracy but high efficiency.
Life-cycle assessment (LCA) is widely applied to evaluate the environmental of a product in full life from “cradle-to-grave” [24]. LCA are also applied to assess building retrofitting in previous researches, such as research by Favi et al. [25]. The advantage of LCA method is able to evaluate the performance of retrofitting decision more comprehensive. It not only can include the influences from different aspects such as energy consumption, emissions, retrofitting materials, construction processes, and demolitions; it can also estimate the long-term influence of retrofitting, from raw material extraction, production and construction, and building operation to material recycling after building demolition [26].
However, it is clear that the above simulation, theoretical model, or LCA methods need detailed and comprehensive information on the buildings [27]. For example, the exact external wall, roof materials, size of windows, and their U-value are the basic information required for building performance simulation. However, it is very common that the older buildings that need retrofitting usually miss certain detailed building information, such as the U-value of certain components, actual energy efficiency of facilities, or similar detailed building information [18]. Another situation is that the buildings miss case-specific information because of their different documentation systems and different maintenances.
A straightforward way to handle the generally missing information of building retrofitting is using average or other default values for unknown properties. Gustafsson et al. [28] compared three innovative HVAC systems for retrofitting in a single-family house by BPS, and the actual building’s ventilation rate is unknown and is set as a default value. A sensitivity analysis was conducted to test the performance under different ventilation rate. It is reasonable to investigate the performance of these HVAC systems in this research, but a default setting obviously causes problems for final retrofitting decision for studied building. The occupant behavior has been demonstrated to be another significant influence factor to building retrofitting and its performance [29]. However, objectively representing every aspect of occupant behavior is usually difficult; thus, default values are usually used in this situation. For example, Serrano-Jimenez et al. [30] set the domestic hot water demand by people as 28 L/person/day according to Spanish code for the retrofitting of studied neighborhood buildings. Pasichnyi et al. [31] also used standardized occupant input data to assume the occupant behavior when analyzing the retrofitting of buildings in Stockholm. However, a uniform average or other default value for missing information cannot represent the characteristics of every building.
The way to handle buildings’ case-specific missing information is the probability distributions from macrolevel statistical data or represented samples. It can describe the uncertainty of unknown information and it is theoretically better than a determined value assumption. Nik, Mata, Kalagasidis, and Scartezzini [12] used Swedish sample buildings to build the probability distributions of U-value of building envelope, ratio of window area, and heated floor area of the building stock of the cities of Stockholm, Gothenburg, and Lund. Based on the probability distribution, the retrofitting measures were analyzed for the building stock of these three cities. Booth, Choudhary, and Spiegelhalter [16] applied the Bayesian method with monitoring data to calibrate the missing building information, such as the internal heating set-point temperature, air leakage, and coefficient of performance for the heating system. Then the retrofitting measures were analyzed based on the calibrated probability distributions of unknown information. Nevertheless, a uniform probability distribution for missing information based on macro statistical data still cannot represent the characteristics of each individual building. The Bayesian method can address this issue with individual building’s monitoring data; but the monitoring system is not practical for all buildings.

2.2. Data-Driven Approach and Application for Building Retrofitting

The data-driven approach becomes a proposing approach to support the building retrofitting with many BPDs. The current cornerstone technologies behind the data-driven approach include Internet, digital devices, and computer-aid simulation (all of them for data generation and collection), as well as computer science, such as machine learning and data mining (all of them for analysis and modelling) [32]. It is recognized that the data-driven approach can be applied to many different aspects, such as regional building energy requirement forecasting [33], the building design performance modelling [27], the scheme planning during building construction [34], building design optimization [35], and building retrofitting [36,37].
In the building retrofitting application, the data-driven approach is used in classification and regression to assess performance and support decisions. Pasichnyi, Levihn, Shahrokni, Wallin, and Kordas [31] utilized big data to cluster building stocks into different clusters based on their own characteristics. Moreover, the energy characteristics of each building are characterized from the big data. In this way, the performance of each building and related retrofitting is simulated by BPS and calibrated by the buildings’ own characteristics. Geyer et al. [38] developed a clustering method for buildings based on their sensitivity to various retrofit measures. It is able to develop the retrofitting strategies for large building stock. The application of a Swiss alpine village showed that proposed data-driven clustering method obtained better results than the conventional age classification method in terms of finding robust and cost- and energy-saving retrofitting strategies.
The data-driven regression method is also widely applied in the building retrofitting. Martinez and Choi [39] applied multivariate linear regression based on a dataset of pre- and post-retrofitting of a group of buildings’ energy consumption in order to investigate the energy-savings performance of three different retrofitting measures. The regression model showed that deep-energy retrofitting obtained the most energy-savings. Moreover, the factors showed that occupant behavior is vital for the final retrofitting performance. In the research of Kim et al. [40], a multiple regression model was developed from 98 actual renovated buildings. Furthermore, it was used to estimate the monetary value of retrofitting buildings and was able to make decisions regarding to the cost of building retrofitting projects. In Sassine et al.’s [41] research, the brick wall’s retrofitting performance in terms of cost and energy was deeply investigated by a Frequency-Domain Regression. Subsequently, the model can be used to analyze the effects of insulation thickness.
The data-driven approach for incomplete data conditions has just started to be applied in the building field. For building performance modelling, in our previous research [27], we demonstrated that the data-driven approach is able to directly establish the connections of available building properties with a building’s performance. Therefore, the data-driven approach does not require complete information for the building performance simulation. On the other hand, the data-driven approach is even able to impute the missing information based on knowledge extracted from big data. For instance, Ma, Cheng, Jiang, Chen, Wang, and Zhai [18] comprehensively discussed the random, continuous, and large proportional missing data situations. Moreover, a hybrid long short-term memory model with bi-directional imputation and transfer learning method was applied to impute the missing data, and the results show that it outperforms the compared Mean Imputation or Linear Interpolation methods. This research attempted to apply the data-driven approach to model the connections between available building properties, retrofitting, and associated performances. Moreover, the case-specific missing data were imputed with the developed data-driven approach to consider the building’s specific characteristics and the most possible values based on the big data.

3. Proposed Approach

The proposed data-driven approach, performance modelling with data imputation (PMDI), comprises two sequential modules—performance modelling and data imputation (see Figure 1). Specifically, the performance modelling first involves a data-cleaning process that detects and removes any invalidity, duplication, and anomaly of building performance datasets (BPDs), with isolation forest (IF), in order to improve the reliability of BPDs and accuracy of performance modelling. After data cleaning, the second section uses a BRBNN–FCM integrated method to model the building’s retrofitting performances based on available building properties. It models the retrofitting performance by establishing the relationship of retrofitting and performances’ prediction intervals, without being supported by generally missing data.
After performance modelling by first module, the second module imputes the case-specific missing data of retrofitting buildings with the PCA–TSR integrated method. The data matrix of BPDs is then estimated by PCA, while TSR is used to replace the initial missing data. This data imputation method exploits the correlations between variables to impute the case-specific missing data that consider the relationship between building characteristics and the whole knowledge, through considering the coherence of the latent structure of the matrix of BPDs. Finally, the retrofitting buildings with imputed data will be input into the performance modelling developed in the first module for retrofitting decision-making.

3.1. Performance Modelling Module

3.1.1. Data Cleaning

Data cleaning is the crucial preparation for every data-driven approach, by which the quality of dataset can be improved and the accuracy of data modelling is ensured [42]. In data cleaning, the invalidity, duplication, and anomaly of samples in BPDs are detected and removed. Invalidity means that the sample does not meet the reasonable laws, constraints, or contradict variables. Specifically, the variables that have contradicting values are one of most common problem in BPDs. Duplication refers to more than one copy of the same sample in the dataset, and anomaly means that the sample are anomalous and located at outliers of the entire dataset. The samples that are invalid, duplicated, and anomalous will be detected and removed in the data cleaning section.
The anomaly is a widely faced problem in a big dataset, and it is extremely difficult to be detected when the dataset has high-dimensional variables. The BPDs are inherently high-dimensional data with multiple building properties and performances. In this study, the isolation forest (IF) approach was used to detect the anomaly in the building dataset, as it has the advantage of dealing with a high-dimensional dataset during anomaly detection [43]. The threshold, in a situation in which a sample is identified as an anomaly, should be defined depending on the special dataset and problem contexts. For brevity, more detailed information regarding anomaly detection based on IF can be seen in References [44,45]. In the proposed approach, the proper threshold of IF for building retrofitting application is analyzed in detail in the following empirical study.

3.1.2. Performance Modelling

Performance modelling is the core function in first module to extract the knowledge from BPDs’ big data and make a modelling of the retrofitting’s performance. Theoretically, the energy-saving performance of a retrofitting measure for a building with incomplete information is not a determined result. Moreover, a determined result also cannot reflect the actual uncertain situation and could lead to biases for decision-making. Therefore, in the performance modelling of the proposed data-driven approach, the prediction intervals are used to describe uncertainty by specifying the lower and upper limits within which the future retrofitting performance is expected to fall for 90% confidence.
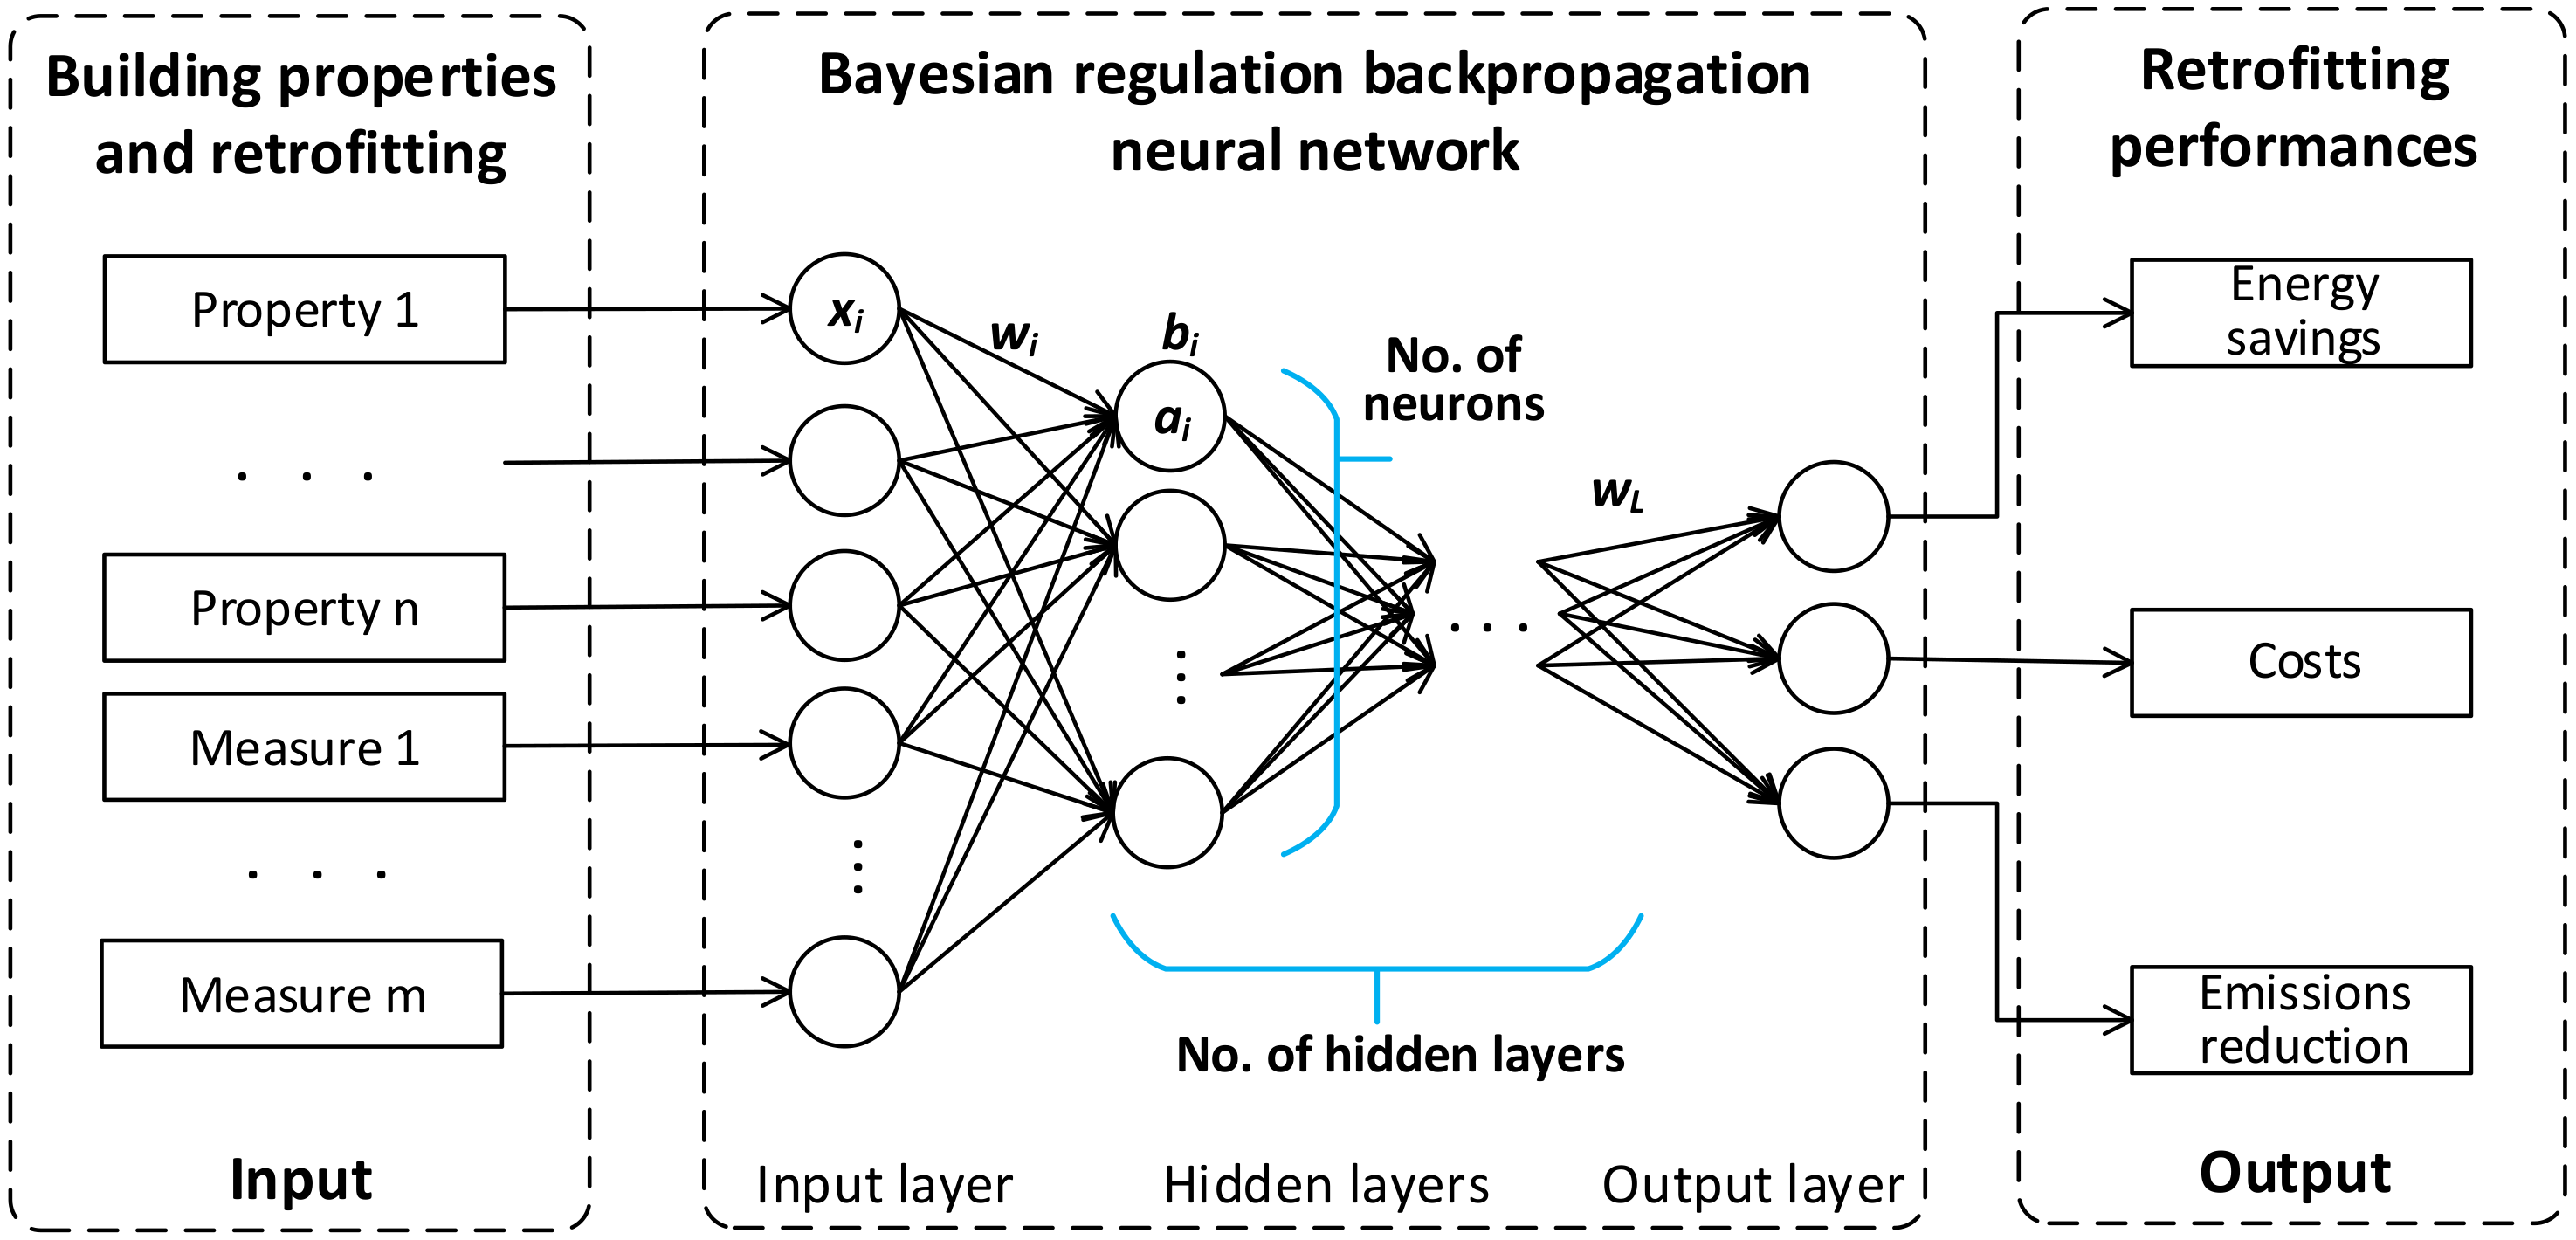
A Bayesian regularization backpropagation neural networks (BRBNNs) and Fuzzy C-means clustering (FCM) integrated method is proposed in this study to conduct performance modelling of building retrofitting. Machine learning is a set of powerful algorithms in data science that can learn from data for classification and regression [46]. The BRBNN is used as a machine-learning algorithm to extract the knowledge and make modelling on building properties, retrofitting, and corresponding performance such as energy-savings or required costs from BPDs. The complex inner knowledge can be extracted, and the relationship can be modelling by machine learning. The overall structure of BRBNN for this study is represented in Figure 2.
Specifically, the BRBNN works on two aspects. On the one hand, it establishes the baseline model of the retrofitting’s performance by connecting the relationship between building properties, retrofitting, and performances. On the other hand, it models the PI of building’s retrofitting and related performances. Meanwhile, FCM in the integrated method is used to cluster the buildings and then calculate the PI of retrofitting’s performance for each building cluster and specific buildings.
The base of neural networks is represented as Equation (1). The backpropagation neural network is a widely used artificial neural network based on backpropagation strategy, which fits a neural network by calculating the gradient of the loss function and then iteratively tuning network parameters. The Bayesian regularization of BRBNN uses Bayes’ rules to infer the optimal regularization values, by which the neural network has excellent generalization capabilities [47].
y ^ = g i N W i x i + B i ,
where y ^ represents the buildings’ retrofitting performance modelled by neural networks; x is the properties and retrofitting of buildings in training dataset; g(·) is the activation function of neural networks; tangent sigmoid is used as activation function in this study to take a trade-off between speed and learning quality; and W and B represent the network weight and bias vector, respectively.
According to statistic theory, the samples with similar features have similar performances [48]. Based on this, an FCM method is used to cluster the buildings that have similar properties and performances. This information is then used to calculate the PI of retrofitting’s performance. FCM was proposed and developed by Dunn [49] and Bezdek [50]; the cost function (Jm) is defined as Equation (2), and parameters are iteratively updated according to constraints Equations (3) and (4) to minimize the cost function.
Jm = ΣNi=1ΣCc=1(μi,c||ximc||2),
μi,c = 1/ΣCk=1(||ximc||/||ximk||)2,
mc = ΣNi=1(μi,c·xi)/ΣNi=1(μi,c),
In the above equations, ||*|| represents the Euclidean norm; xi represents the building properties and retrofitting of the i-th building sample; μi,c represents the membership grade of the i-th sample to the c-th cluster, and is defined by Equation (3); and mc represents the center of the c-th cluster, defined by Equation (4). In this way, the buildings that have similar properties will have higher membership grade into the same cluster. Then, the PI of each cluster and of each sample is calculated as Equations (5) and (6), respectively.
UcL/U = ei/j,
ukL/U = ΣCc=1(μk,c × UcL/U),
where UcL/U represents the lower and upper endpoints of the prediction interval of the c-th cluster, and i is the largest value satisfying Σik=1(μk,c) < α/2Σ(μc), and j is the smallest value satisfying Σjk=1(μk,c) > (1 − α/2)Σ(μc). Moreover, ukL/U represents the lower and upper endpoints of the PI for the k-th sample, and the final performance PI (represented by YL/U) of retrofitting is modelled by summing the baseline prediction ŷ with endpoints uL/U as Equation (7):
YL/U = ŷ + uL/U,
To evaluate the reliability and effectiveness of a PI modelling, prediction interval coverage probability (PICP) and mean prediction interval (MPI) are two crucial indicators. A reliable PI modelling can predict (cover) a target output with a defined confidence level (e.g., 90 or 95%). In this study, PICP is defined as the proportion of samples within prediction intervals to represent PI’s reliability. On the other side, an effective PI modelling means the proposed intervals are concentrated to support decisions. Otherwise, the PI modelling having intervals that are too wide provides meaningless information for decision-making. In this study, MPI is defined as the average width of upper and lower intervals to represent the effectiveness of PI.
The dataset of BPDs is divided into several sets. To train (develop model), validate (calibrate model), and test (test performance) the BRBNN learning models of baseline model (ŷ) and endpoints (uL/U), in total, 70% of all samples in BPDs are used by being divided into 70%, 15%, and 15%, respectively. The remaining 30% of samples in BPDs are used to test the final PICP and MPI performances of modelling.

3.2. Data Imputation Module

It is common that the building was been built several decades ago and that there is not full access to the complete building information when the building requires retrofitting. Therefore, it should supplement the above performance modelling module to address the missing-information challenge and then support building retrofitting decisions. The data imputation module in this study imputes the case-specific missing information of buildings by considering the characteristics of each building through computing the coherent relations and latent structure of the BPDs [51]. Therefore, this data imputation method will infer the most possible values for each building in terms of the missing data. The PCA-and-TSR integrated method that was originally proposed by Arteaga and Ferrer [52] to address the missing data problem of PCA was utilized in this study to impute the missing information of buildings that need retrofitting. Although there are many alternative methods for data imputation, such as projection to the model plane (PMP) and known data regression (KDR), Folch-Fortuny et al. [53] found that PCA–TSR outperformed them by providing the best compromise solution in terms of prediction quality, robustness, and computation time. Hence, PCA–TSR is introduced in the proposed data-driven approach to impute the building’s missing information. The appropriate setting of PCA–TSR for building retrofitting will be analyzed at the section of empirical study.
The idea behind the PCA–TSR integrated method is that PCA is able to estimate the latent variable scores of BPDs in order to converge to the most proper values for the unknown variables. A PCA of a BPD, i.e., building performance dataset matrix X (N rows of samples and K columns of properties and retrofitting variables), can be expressed as Equation (8).
X = TPT,
where T is the component scores matrix, and P is the loadings matrix of data matrix X.
For any new building sample matrix (Z#) with incomplete building information that belongs to the same population of the matrix X, the score vector (T#) can be calculated as Equation (9) [52], and the new building samples, Z#, can be calculated from Equation (10) because P is orthonormal matrix. Therefore, the missing data of building samples Z# can be estimated when the score vector, T#, is available.
T# = PTZ#,
results in Z# = PT#,
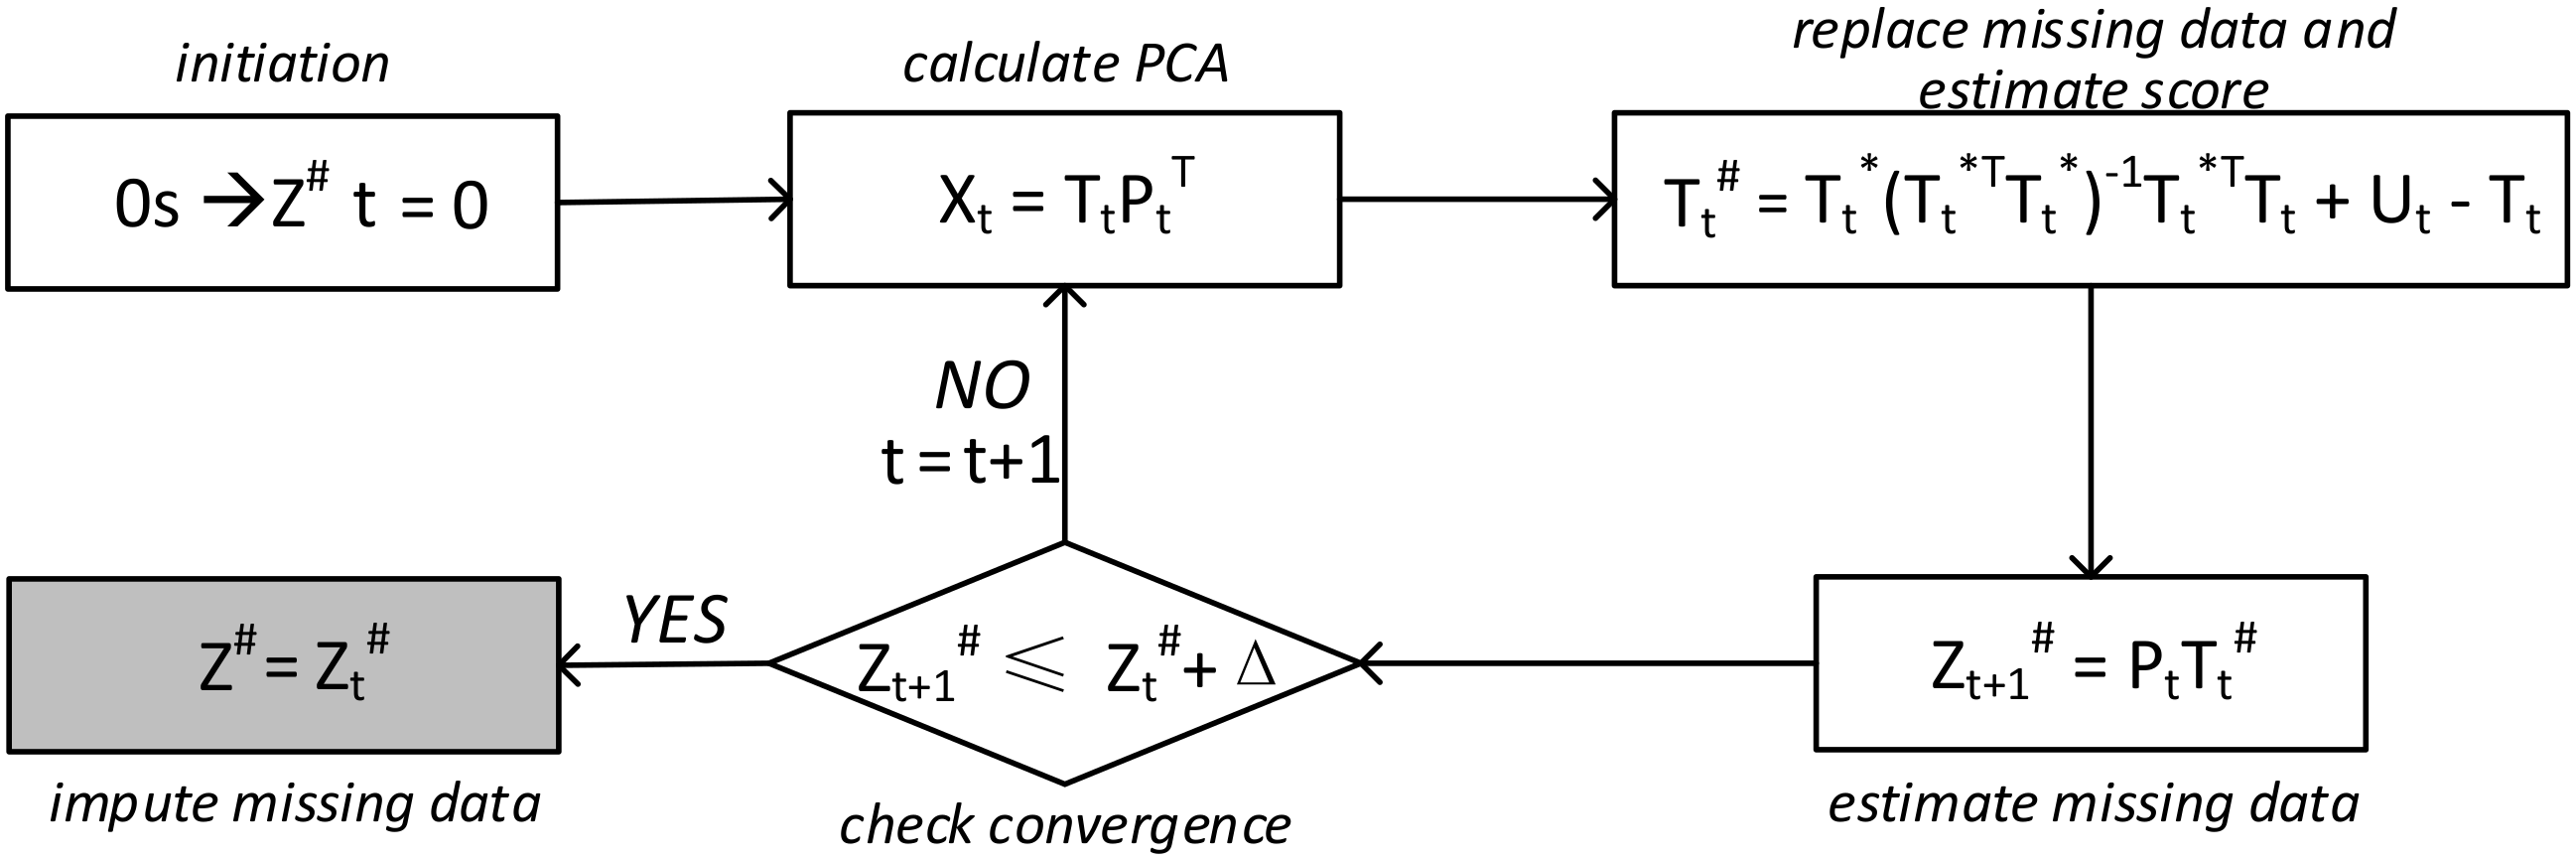
TSR is used to predict the score vector T# from the known part of matrix (X*) by T* = X*P*, based on Equation (8). This method assumes that the X matrix has the same variables with missing values. The “trimmed” is achieved by substituting the missing variables by using estimated data. The score vector T# fits a linear regression model from T* as Equation (11), and it is used to estimate the value of T#. It continues substituting each missing variable until the convergence of the estimated T#.
T# = T*B + U − T = T*(T*TT*)−1T*TT + U − T,
where B is the least squares estimator of the matrix of coefficients. After we obtain the T#, the Z# can be calculated. To sum up, the overall framework of data imputation is represented in Figure 3.
The proposed PCA–TSR integrated method is used to infer the most possible missing data (Z#) of case-specific building properties. The process extracts the correlations from the available building performance dataset (X*) by PCA, and then give imputation for missing building properties based TSR. In this way, the data gap of buildings in need of retrofitting will be filled. Ideally, the imputed building properties are close to the real values. The mean squared prediction error (MSPE) is applied to evaluate the accuracy of the data imputation, as shown in Equation (12) [53]. After the accuracy validation, the building properties and imputed information are all inputted into the performance model developed in the first module; the retrofitting measures are able to estimate and select well based on performance predictions.
M S P E = i = 1 N j = 1 K ( z i j z i j # ) 2 N × K ,
where zij# is the specific building missing data; zij is the corresponding data obtained from the complete dataset; i and j are the observation and variable, respectively; and N and K are the total number of observations and variables, respectively.

4. Empirical Study

The empirical study is a research method that uses direct and indirect evidences such as observation or experience to find or have a proof for specific belief or theory [54]. In this study, the empirical evidence of available building performance datasets from observation records in real life was employed to test the belief of the effectiveness and efficiency of proposed data-driven approach.
With the fast development of data collection and monitoring technologies, many BPDs have been developed to monitor the status of building operations and energy consumptions. In the EU, according to European Union Energy Performance of Buildings Directive 2002/91/EC [55], all European Union members are obligated to pursue energy-efficient buildings in the national realm. The Energy Performance Certificate (EPC) of building is developed to achieve the goal of the EU directive by assessment of the energy and emissions and providing retrofitting suggestions. Currently, it has become one of the biggest datasets regarding buildings’ environmental performance. Similarly, the US Building Performance Database is a national building energy-performance public database developed by the Department of Energy in the United States and the Lawrence Berkeley National Laboratory [56]. The aim of this dataset is to identify cost-saving energy-efficient improvements for buildings. In total, 1,066,891 samples are available in this dataset till now, and a majority of them are commercial and residential buildings. Other BPDs include the Database for Energy Consumption of Commercial buildings (DECC) in Japan [57] and the Building Occupants Survey System (BOSSA) in Australia [58]. The proposed data-driven approach is able to support the building retrofitting decisions based on the above BPDs.

4.1. Empirical Information

Many buildings in Sweden that were constructed during the Million Homes Program have reached their 50-year service life and currently need building retrofitting. This research chose Sweden as the empirical study case to validate the proposed method. In Sweden, all newly built buildings and rental and non-rental buildings, such as multi-dwelling stocks and detached and semi-detached houses, must have their EPC, according to regulations. At 2016, about 550,000 buildings have been certificated by the EPC, including detached houses; apartments; and public, commercial, or industrial facilities [59]. It is designed to make buildings economical in regard to energy and to motivate the building stakeholders to improve the buildings’ energy efficiency. The EPC has become one of the most informative big data on building performances in Sweden.
Each EPC in Sweden is conducted by a trained expert, who will perform a building properties collection, while the energy consumption is collected by sensors for more than 12 months or estimation. Then the expert will perform an energy performance estimation and give an energy classification based on the estimation. Finally, the expert will provide one or several energy-efficient retrofitting suggestions for the building, and then the expected energy savings and costs are calculated. Therefore, EPC comprises four crucial pieces of information on the certificated buildings. The first one is the basic identification information, such as address, post number, building types, and cities. The second is the building properties, including building area, used purpose, number of floors, stairs, type of ventilation, etc. The third is the building performance, such as electricity, fuel, and natural gas consumption; and the corresponding contribution from ventilation, heating, cooling, lighting, watering, etc. The last is the suggested retrofitting measures based on the certification results.
It is inspiring to know that, in the EPC, big data can be expected, and this is the inherent connection between building properties, retrofitting, and corresponding retrofitted performances. When this connection is properly modelled, buildings that need retrofitting in Sweden can infer the energy reduction and related cost under different retrofitting measures based on the modelling. It will be a feasible retrofitting estimation and comparison tool, which exactly addresses the limitations of EPC that only have one or two measures suggestion(s) by experts [60]. On the other hand, many buildings in Sweden miss specific property information due to reasons such as having a different version of the EPC or making mistakes during the EPC’s certification. It is valuable to apply the proposed data-driven approach, PMDI, based on Swedish EPCs to develop a retrofitting decision-making support and, meanwhile, validate the PMDI in the empirical study of Sweden. Table 1 shows the building properties of each EPC sample, and Table 2 shows the suggested retrofitting measures of each EPC sample.

4.2. Method Application and Validation

As the detached and semi-detached house building for one/two families are the most popular housing type in Sweden, the empirical study focused on one/two-family house and supported the house owner and policymaker with retrofitting decisions. The developed method was applied to two scales of application. Firstly, it was used in a microscale application, on individual buildings, to estimate and compare retrofitting suggestions. Ten real buildings located from North Sweden (e.g., Norrbottens) to South Sweden (e.g., Skåne) were selected as the representatives of Sweden. The ten buildings were selected from all of the four climate regions in Sweden to make the empirical study representative. Secondly, the developed method was used in a macroscale application on the building stock to help make retrofitting strategy planning for policymakers. The building stock of Stockholm city was used in this empirical study. The detailed information on these buildings can be found in Appendix A Table A1 and Table A2. The proposed PMDI approach was programmed to be a prototype of the above illustration, and the following sections explain the application process in detail.

4.2.1. Data-Cleaning Process

In the data-cleaning section, the invalidate, duplicated, and anomalous data in Swedish EPCs are eliminated. A validated sample means that the value and relationship of building properties and performance should be reasonable. The Swedish EPC database was criticized by previous studies for having an invalidity problem, for example, in regard to inaccuracy [61]. At the validation check process, all building samples with unreasonable values in samples, such as extremely large values for expected energy-savings or cost for retrofitting, are removed from the EPC. After that, the relationship between building properties and performance is checked. The samples that are found to have an unreasonable relationship—for instance, the expected energy-savings are larger than the total energy consumption—are removed. After the invalidity elimination, in total, 232,089 one/two-family house buildings and their EPC records in the Swedish realm were found to meet the above validation rules. Then the duplication check was performed, and finally 223,930 were obtained.
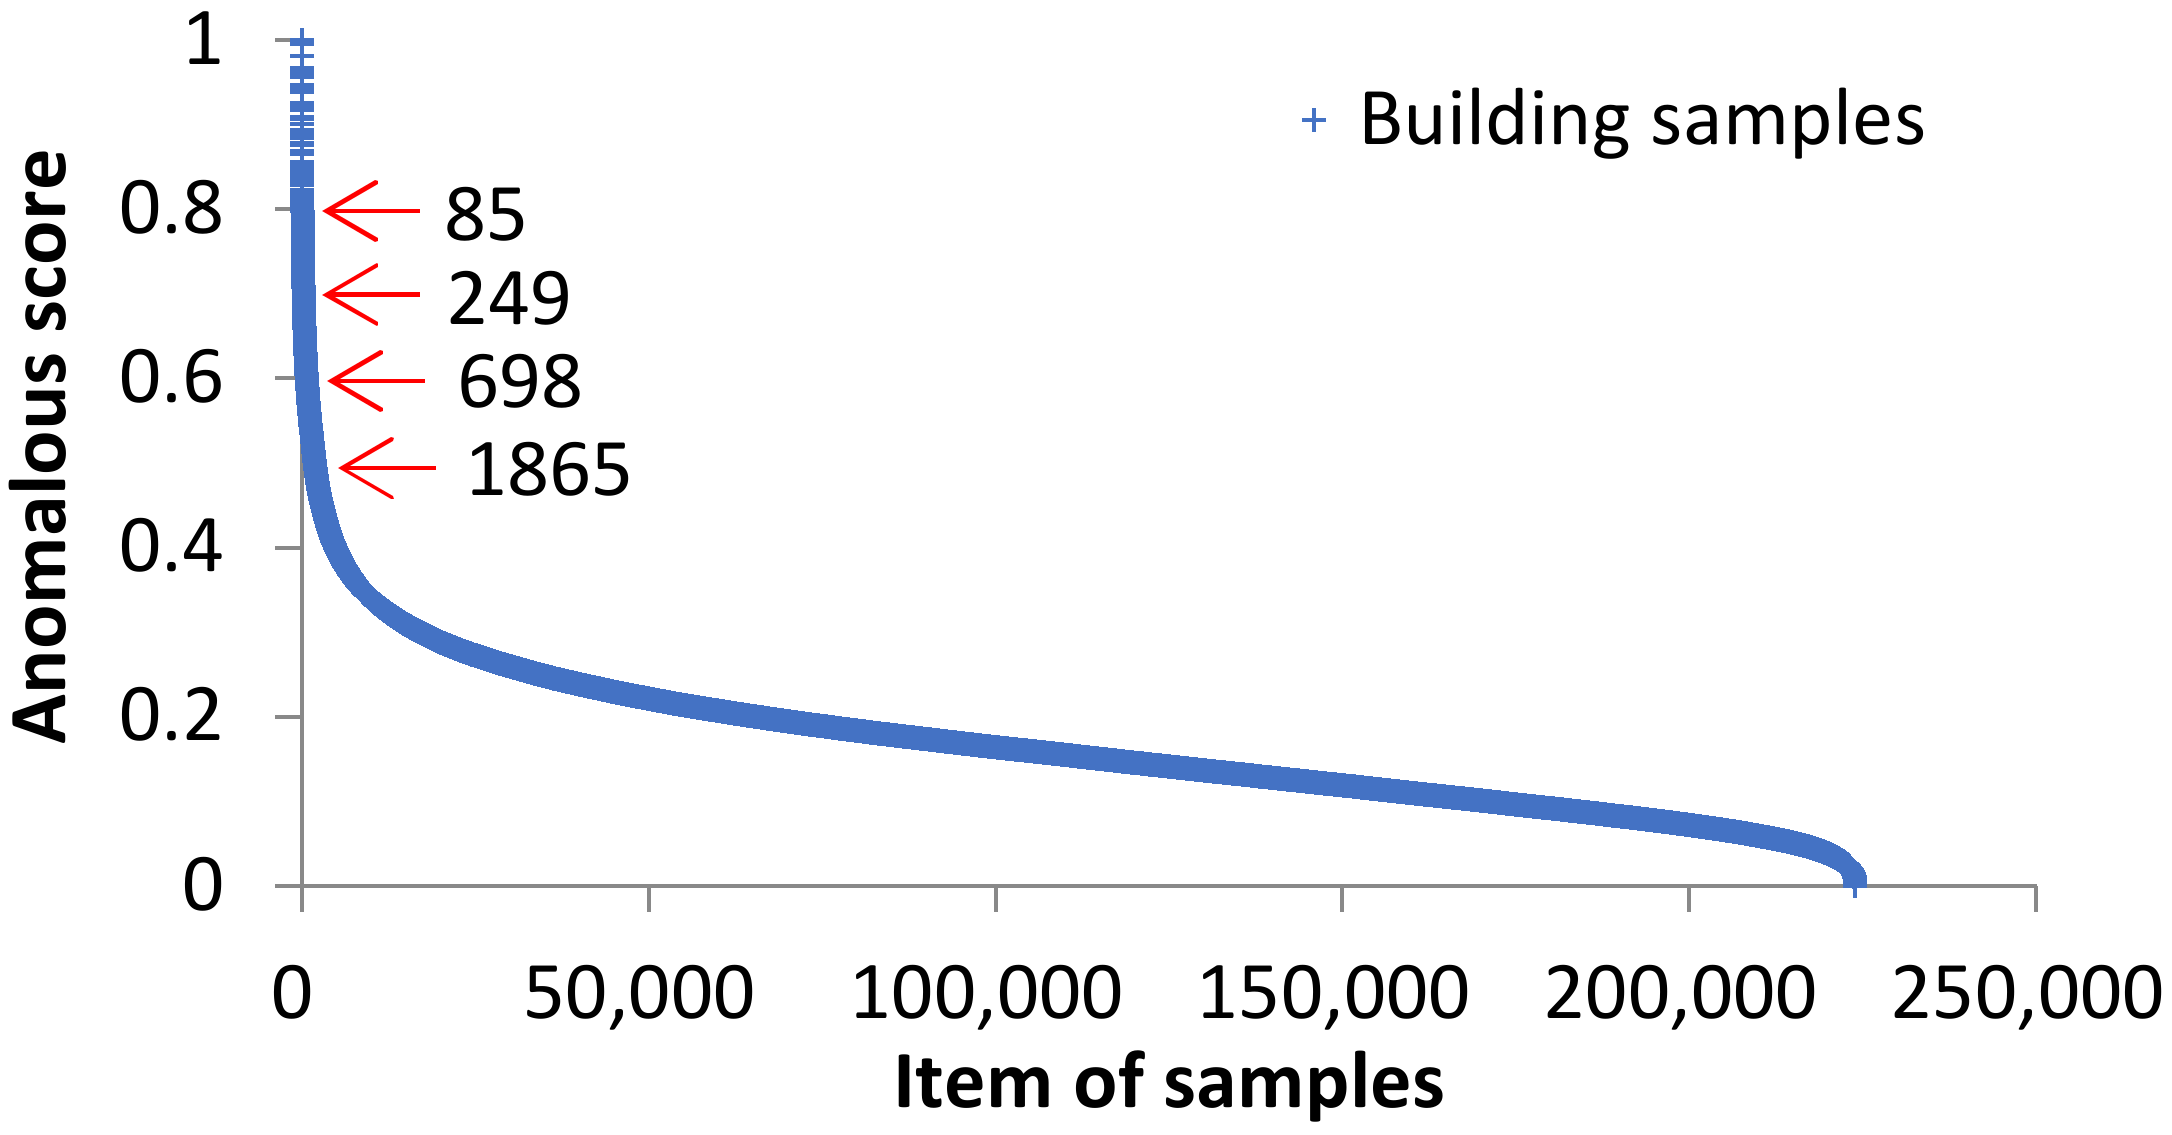
The anomaly detection is performed by using isolation forest (IF) algorithms. The building samples with anomalous properties and performances compared with the entire dataset are identified as anomalies by IF. The anomaly of EPC can derive from the value errors and logic errors that are not eliminated by the invalidity and duplication check. The iteration of IF was set to be 10, and the average anomalous score of each sample is shown as Figure 4. According to the anomaly assessment rules proposed by the inventor of IF [44], the samples with an anomalous score less than 0.5 can be confidently regarded as normal samples. Moreover, samples with an anomalous score from 0.5 to 1, especially their values close to 1, are at a high risk of being an anomaly. Here, the threshold score of anomaly was initially set to be 0.6 in the IF algorithms. A more detailed discussion on different anomaly identification standards is given in following section. After anomaly detection, in total, 698 numbers of samples were identified as being an anomaly, and finally 223,232 one/two-family house buildings with EPC records in the Swedish realm were obtained after anomaly detection.

4.2.2. Performance Modelling Process and Validation

To model the connection between building properties, retrofitting, and corresponding energy-savings and cost, the building properties and retrofitting (see Table 1 and Table 2) are regarded as input, while the retrofitting energy-savings and cost are regarded as output. The proposed BRBNN–FCM integrated approach was run on the EPC dataset after data cleaning. The settings of hidden layers and neurons of BRBNN for the baseline and endpoints model are determined by running a comparison analysis from complex to simple structures including 67-10-10-10-10-2, 67-10-10-2, 67-10-2, and 67-3-2. The RMSE and R2 are utilized to evaluate the accuracy of machine learning models (see Table 3). It can be seen that a BRBNN with 2 hidden layers with 10 neurons for baseline, and 4 hidden layers with 10 neurons for endpoints model ensure a high learning accuracy without underfitting or overfitting. According to our previous research [36], we determined that 100 clusters are appropriate for the Swedish retrofitting modelling. The predefined prediction confidence is dependent on the decision contexts. A higher confidence will obtain a wider MPI, and a lower confidence will obtain a narrower MPI. Here we initially defined it as 90% and modify it when necessary.
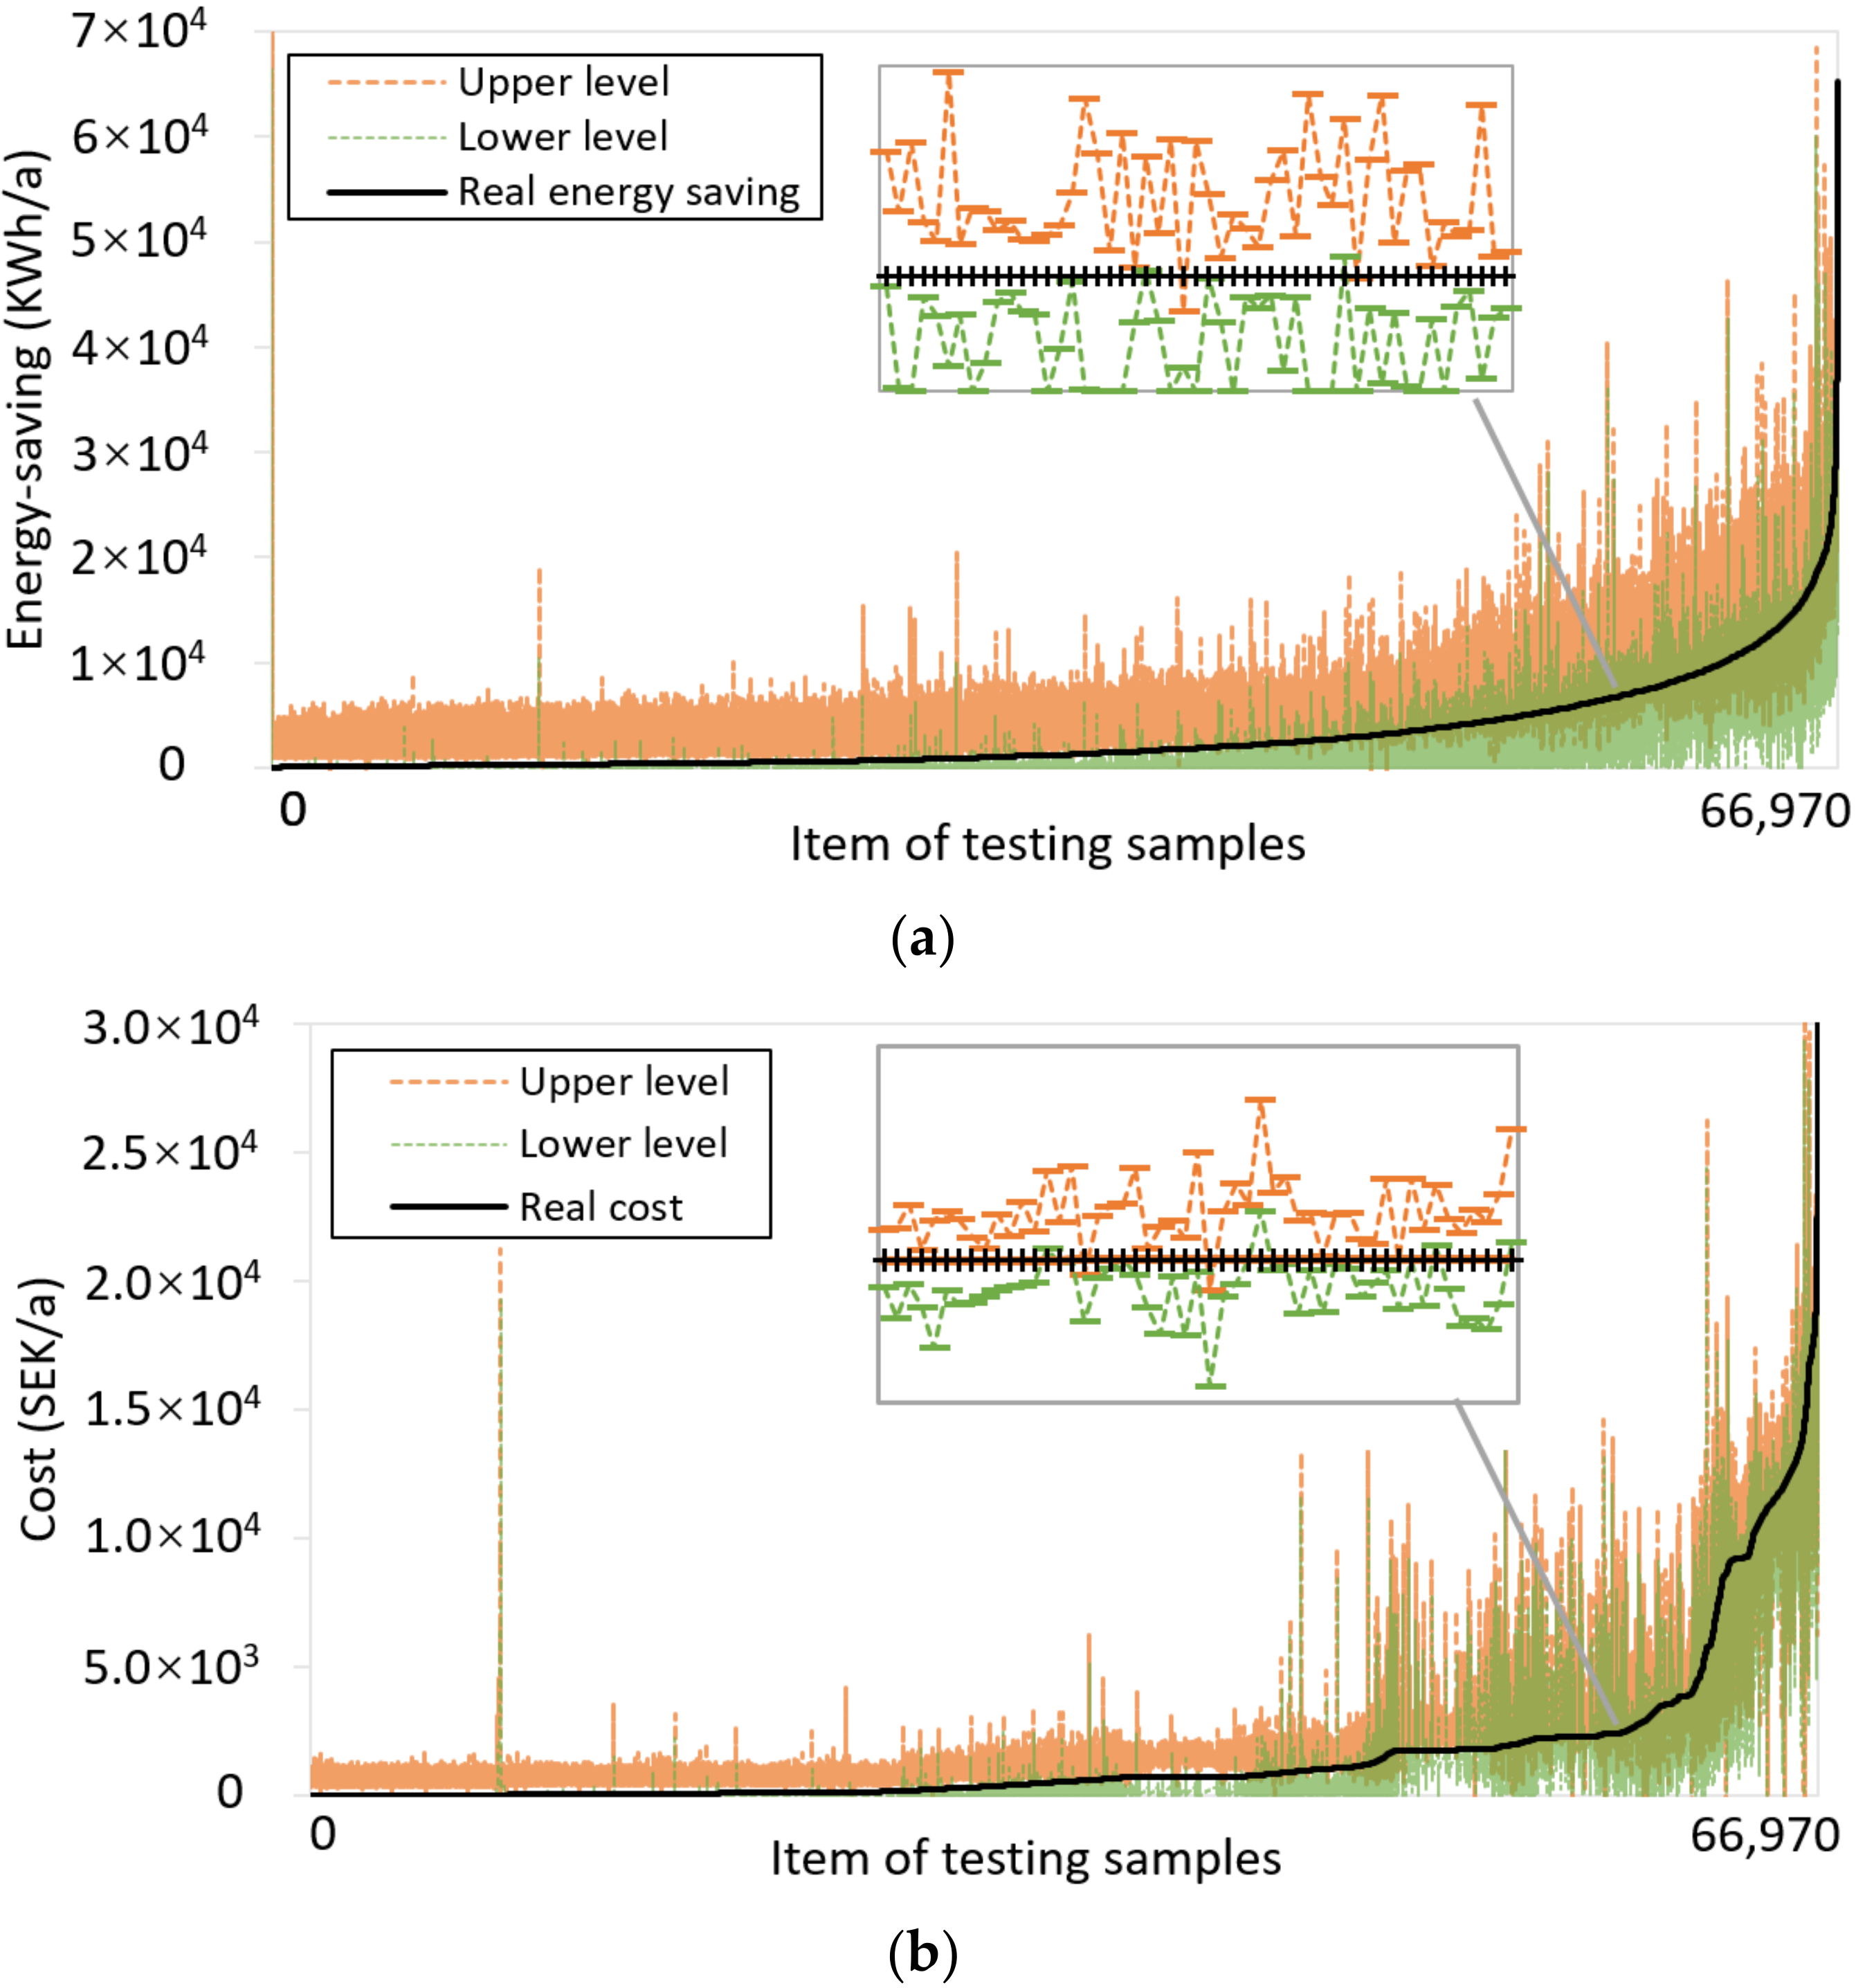
Using the above data learning and parameter setting, the proposed BRBNN–FCM integrated approach was run on the Swedish EPC dataset. For energy-savings of retrofitting, the results of the modelling have PICP as 90.9% and MPI as 3.87 × 10³. For the cost of retrofitting, the results of the modelling have PICP as 90.8% and MPI as 1.03 × 10³. The energy-saving and cost-modelling results can be seen as Figure 5. The results validated that the proposed performance modelling method can accurately predict the performance ranges of retrofitting for any one/two-family house buildings in Sweden. Moreover, the PI of energy-savings and cost-of-retrofitting measure is able to support the decision making of building retrofitting.

4.2.3. Data Imputation Process and Validation

The data imputation process of PMDI is performed by using the PCA–TSR approach based on the big data knowledge from Swedish EPCs. The data imputation process may introduce additional bias into the dataset and data modelling if it provides inaccurate or biased data substitution. To validate the PCA–TSR approach, the selected ten buildings are assumed to have random incomplete building information. It is used to test this approach, and the results can be seen in Appendix A Table A1.
The incomplete information come from two different situations. One situation is that the building does not have an EPC certification yet (see items #8–#10), and some properties, such as the energy consumption of different equipment, are lacking. The other situation is that the building has EPC records; however, the final EPC record is not complete (see items #1–#7). This situation widely exists in EPC records in Sweden. A randomly selected 1000 EPC records from the 223,232 cleaned dataset is initially used as the training dataset for data imputation. The influence of the training dataset on data imputation is analyzed in following discussion section. Firstly, the number of principal components was determined to be 3 according to the cumulative percentage explained by each component. Moreover, after 5000 iterations, the imputation results are shown in Appendix A Table A1. The MSPE is 2.78 × 10⁵, as defined by Equation (12). It can be seen in Appendix A Table A1 that most of the imputed data are the same or very close with the actual data. For the buildings that do not have EPC records (items #8–#10), the imputed final EPC performance class is exactly the same as original EPC.
Furthermore, the results of PCA–TSR in PMDI are compared with the conventional Mean Imputation (MI) and Statistics Imputation (SI) methods in order to validate the effectiveness of information imputation of PMDI. MI will use the average value of each variable to impute the missing data of building properties as z M I # = z i ÷ N . The same 1000 EPC records randomly selected above are used for the MI development. The MSPE of the MI method is 1.66 × 10⁶, which is underperformed compared with PMDI (the smaller, the better; see Table 4). In addition, the Statistics Imputation (SI) method is also developed and compared with PMDI. SI uses the values of each building property to develop the probability distribution for random sampling on each missing building property, as z S I # = z z F z , from which F(z) is the probability distribution function constructed by the z-th variable from the EPC records (223,232). The MSPE of the SI method is 3.23 × 10⁶, which is also underperformed compared with PMDI method. The above results validated that the PCA–TSR method in PMDI is able to accurately impute missing building properties. It outperformed the conventional MI or SI data imputation methods.

5. Application Results and Method Discussion

5.1. Multi-Scale Application

As explained above, the proposed method can be used as a valuable tool for building retrofitting decision-making in two ways. On the one hand, it can support the retrofitting decision of the housing owner for his/her own buildings, i.e., the microscale application. It is valuable because the developed model can estimate the performance of different retrofitting measures of any building in the modelling region, such as Sweden in this empirical study. Moreover, this estimation can be performed under the building information situation in which specific building property information is not available. These are achieved by the proposed method and utilizing the data-driven approach to make performance modelling with data imputation.
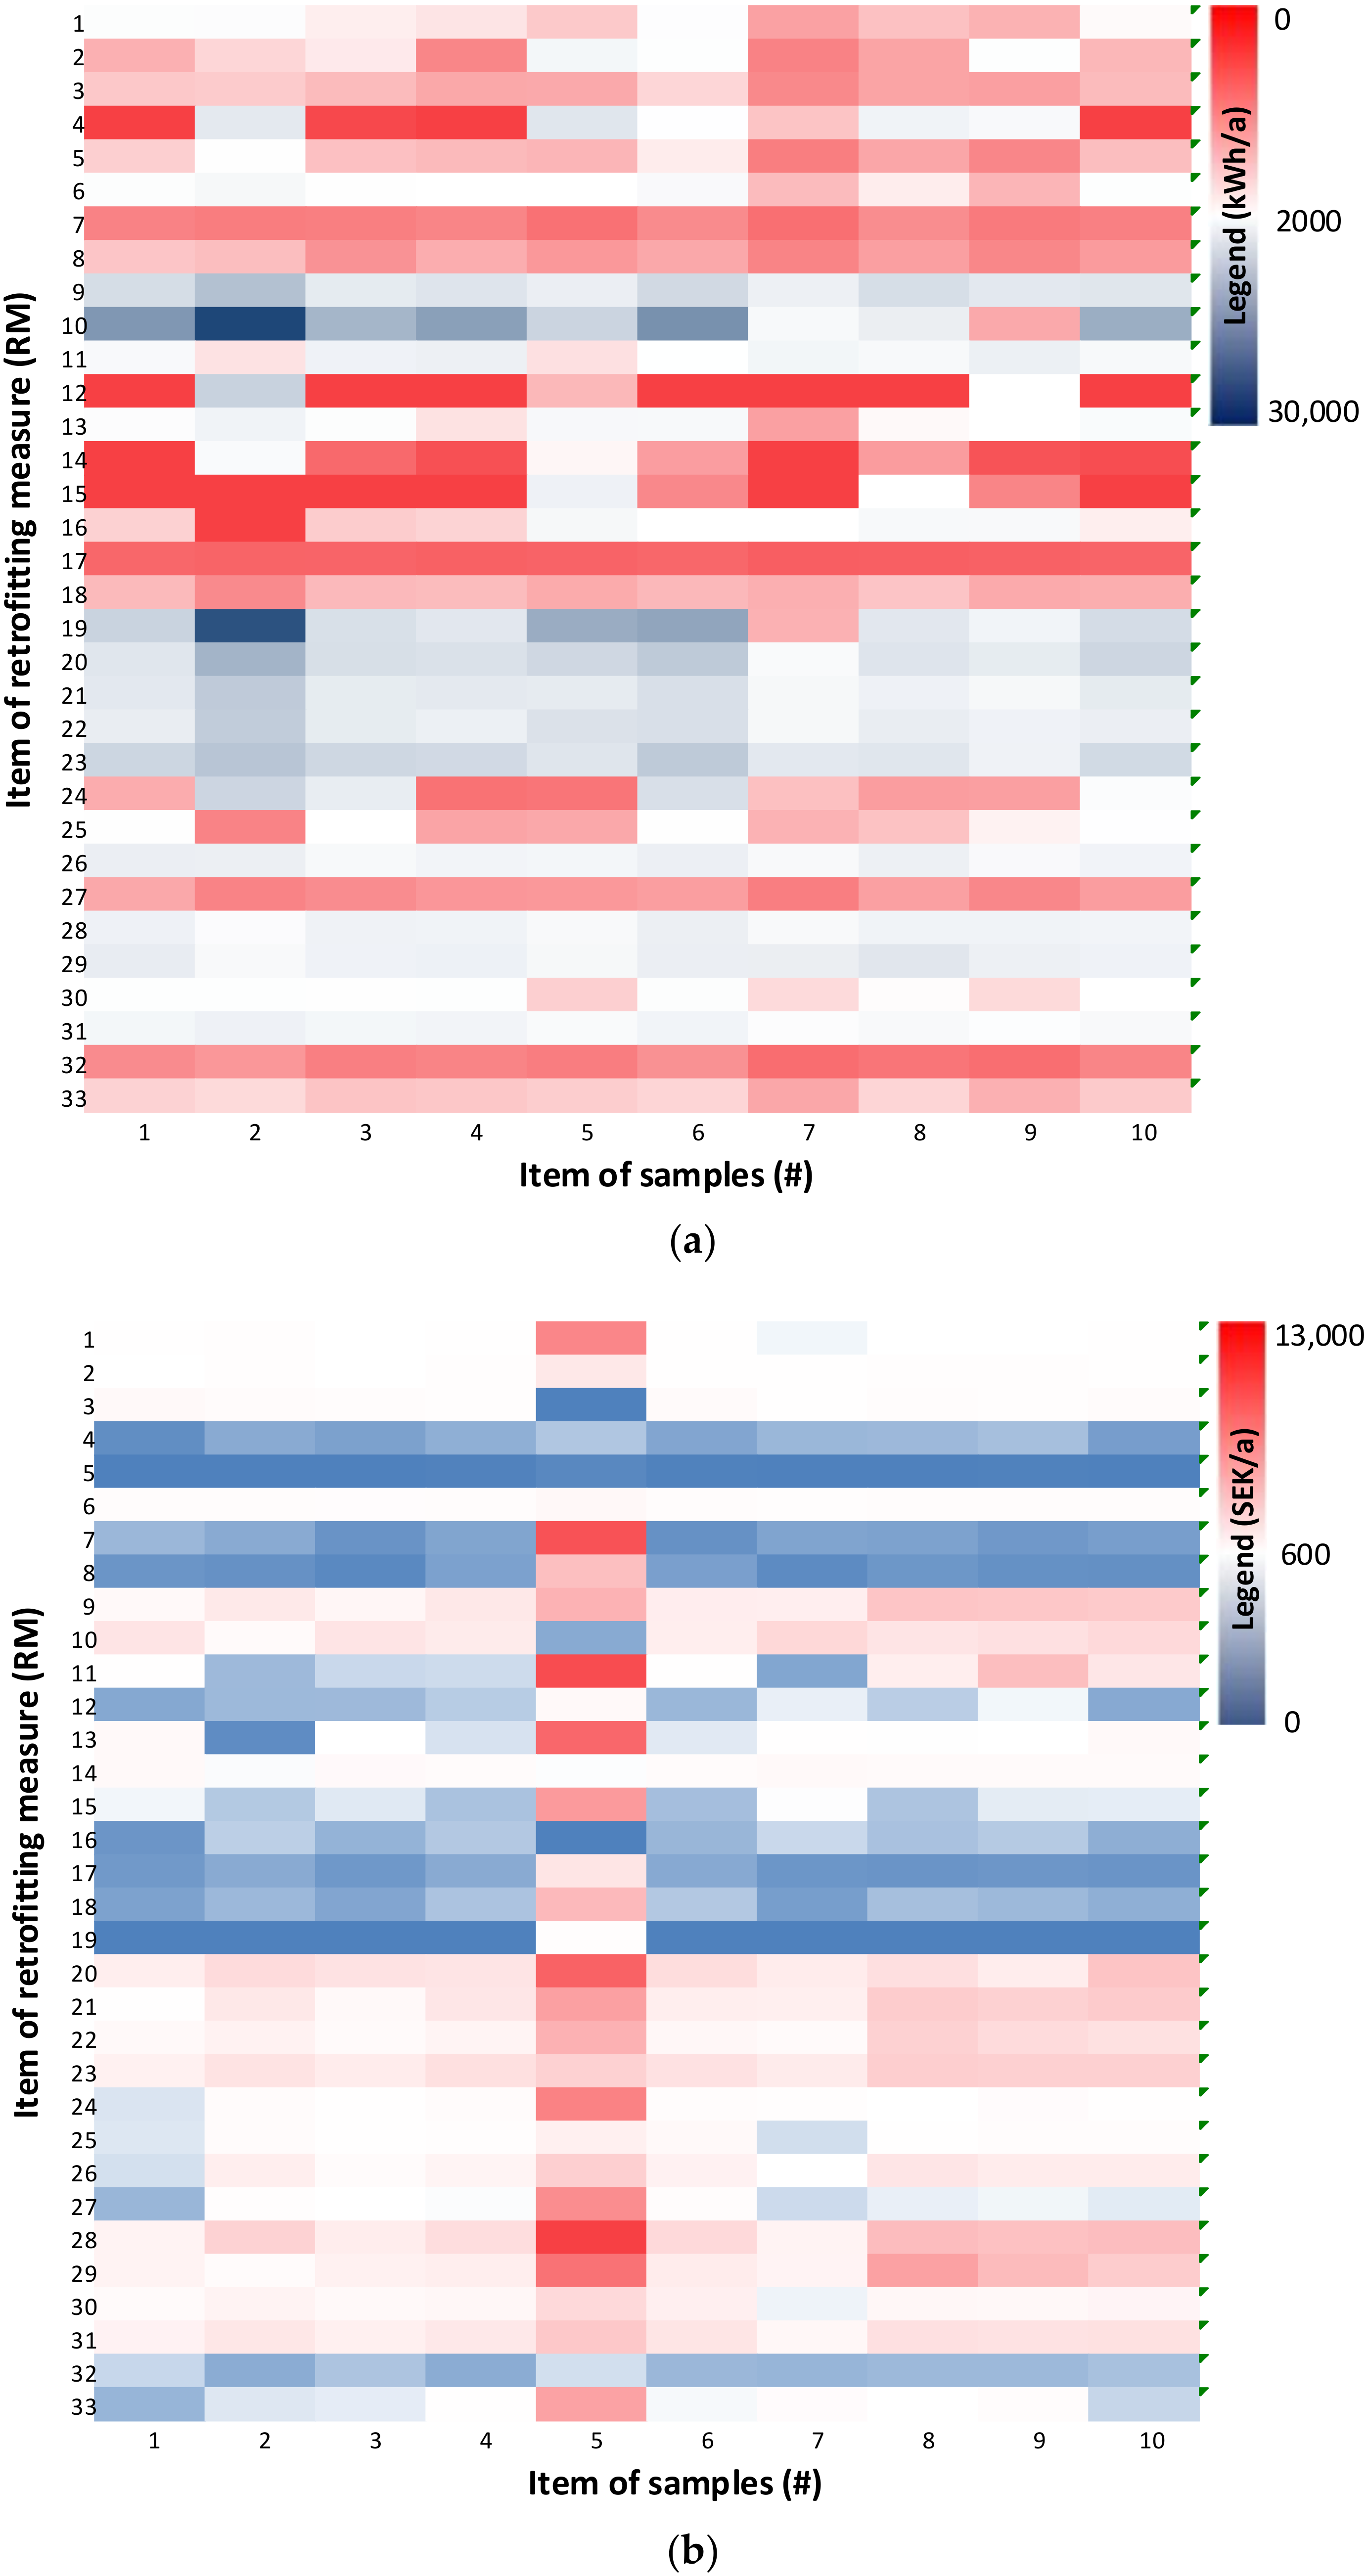
For the selected ten individual buildings with missing information in Section 4.2.3 (for details, see Appendix A Table A1), all possible retrofitting measures were tested; the results show that different buildings have their specifically suitable retrofitting measures (see Figure 6). For example, for Building #1, the renovation measure, RM 10, is the most energy-saving measure, and both RMs 5 and 19 are the least costly measures. On the other hand, for ten retrofitted buildings, it shows that RM 10 and RM 19 generally outperform other measures in terms of energy-savings. As for the cost performance, it shows that RM 5 and RM 19 generally outperform other measures.
To deeply analyze a specific building with the average and PI of retrofitting, the results of Building #5 with the proposed method are shown in Figure 7. It is clear that, for Building #5, the RM 19 (Insulation of pipes and ventilation ducts) is a good option, because it has the most energy-savings (12,017~17,292 KWh/year in average), with only 0.063 SEK/year of cost for per energy-savings. The previous EPC records only make limited retrofitting suggestions for house owners. For Building #5, the suggested retrofitting measure is RM 20 from EPC, which can have energy-savings of 11,200 KWh/year with approximately 1.000 SEK/year of for per energy-savings. Therefore, the proposed method provides more options in terms of both energy performance and costs. Even if certain building information is missing, the decision-making by the proposed method can be very feasible by comparing each retrofitting measure and considering the energy-saving ability and required cost.
The proposed method also makes the retrofitting analysis for larger scales (city or national level) with the bottom-up method both possible and efficient, i.e., the macroscale application. It has been recognized by many previous studies that the bottom-up method for the city or national building retrofitting analysis is preferred compared with the upside-down method [62]. After imputing the missing information and developing the performance model, any retrofitting strategy for specific building stock can be efficiently analyzed by being input in the performance model. Here the developed building retrofitting model is used as a bottom-up tool to analyze the buildings in Stockholm, Sweden. Moreover, the 40,735 EPC records of Stockholm are used with part of the information missing (see Appendix A Table A2). The missing data are imputed by the proposed method (see Section 4.2.3).
Four retrofitting strategies are defined for Stockholm building stock, and they are named “energy-prior”, “cost-prior”, “energy-best”, and “cost-best”. The “energy-prior” regards the energy performance as crucial indictor, and the possibility of house owners choosing each retrofitting measure depends on Equation (13), meaning that the higher energy-savings measures have a higher possibility to be selected. Meanwhile, the “cost-prior” regards the cost as a crucial indictor, and the possibility of house owners choosing each retrofitting measure depends on Equation (14). The lower the cost is, the higher the possibility of the measure being chosen. All buildings with four defined retrofitting strategies are input into the developed performance model.
P j E S = i N E n i N j M ( i N E n i N ) ,
P j C = j M i N C i N i N C i N j M ( j M i N C i N i N C i N )
where P j E S and P j C are the possibility of j measure to be selected for energy-saving (ES) and cost (C), respectively; E n i and C i are the energy-savings and cost of i-th building, respectively; and N and M are the number of buildings and measures, respectively. Here, M is 33, and N will take above ten sample buildings. Unlike “energy-prior” and “cost-prior”, based on the results of the above ten sample buildings, the “energy-best” strategy sets RM 10 and 19 as possible measures with 50%, respectively. Moreover, the “cost-best” strategy sets RM 5 as the retrofitting measure.
Sweden has set a long-term target on building energy, which is to reduce 50% of energy consumption by buildings in 2050 compared with 1995. If it is assumed that the retrofitting rate is linear from now until 2050, based on the developed performance model, the results of Stockholm’s city-level building energy performances under four retrofitting strategies can be seen in Figure 8. The results show that “energy-prior (EP)” and “energy-best (EB)” have the possibility to achieve the 2050 Swedish target. Specifically, the “energy-prior” can meet the target in average level, while “energy-best” is able to achieve the target in defined 90% confidence. However, the cost of these two strategies is, in total, 8.94 × 10⁷ SEK and 7.25 × 10⁷ SEK, which are higher than “cost-prior (CP)” and “cost-best (CB)”, which are 6.88 × 10⁷ SEK and 2.21 × 10⁶ SEK. Therefore, in order to achieve the national building energy target, the “energy-best” is a preferred option not only because it reduced the energy consumption, on average, by 68.9%, but also has less cost compared with the “energy-prior” strategy. On the contrary, the “cost-prior” and “cost-best” strategies cannot reach the national target by 90% confidence, as even the PI’s lower point of building energy is higher than 82 KWh/m2.

5.2. Method Discussion

5.2.1. Different Method Setting

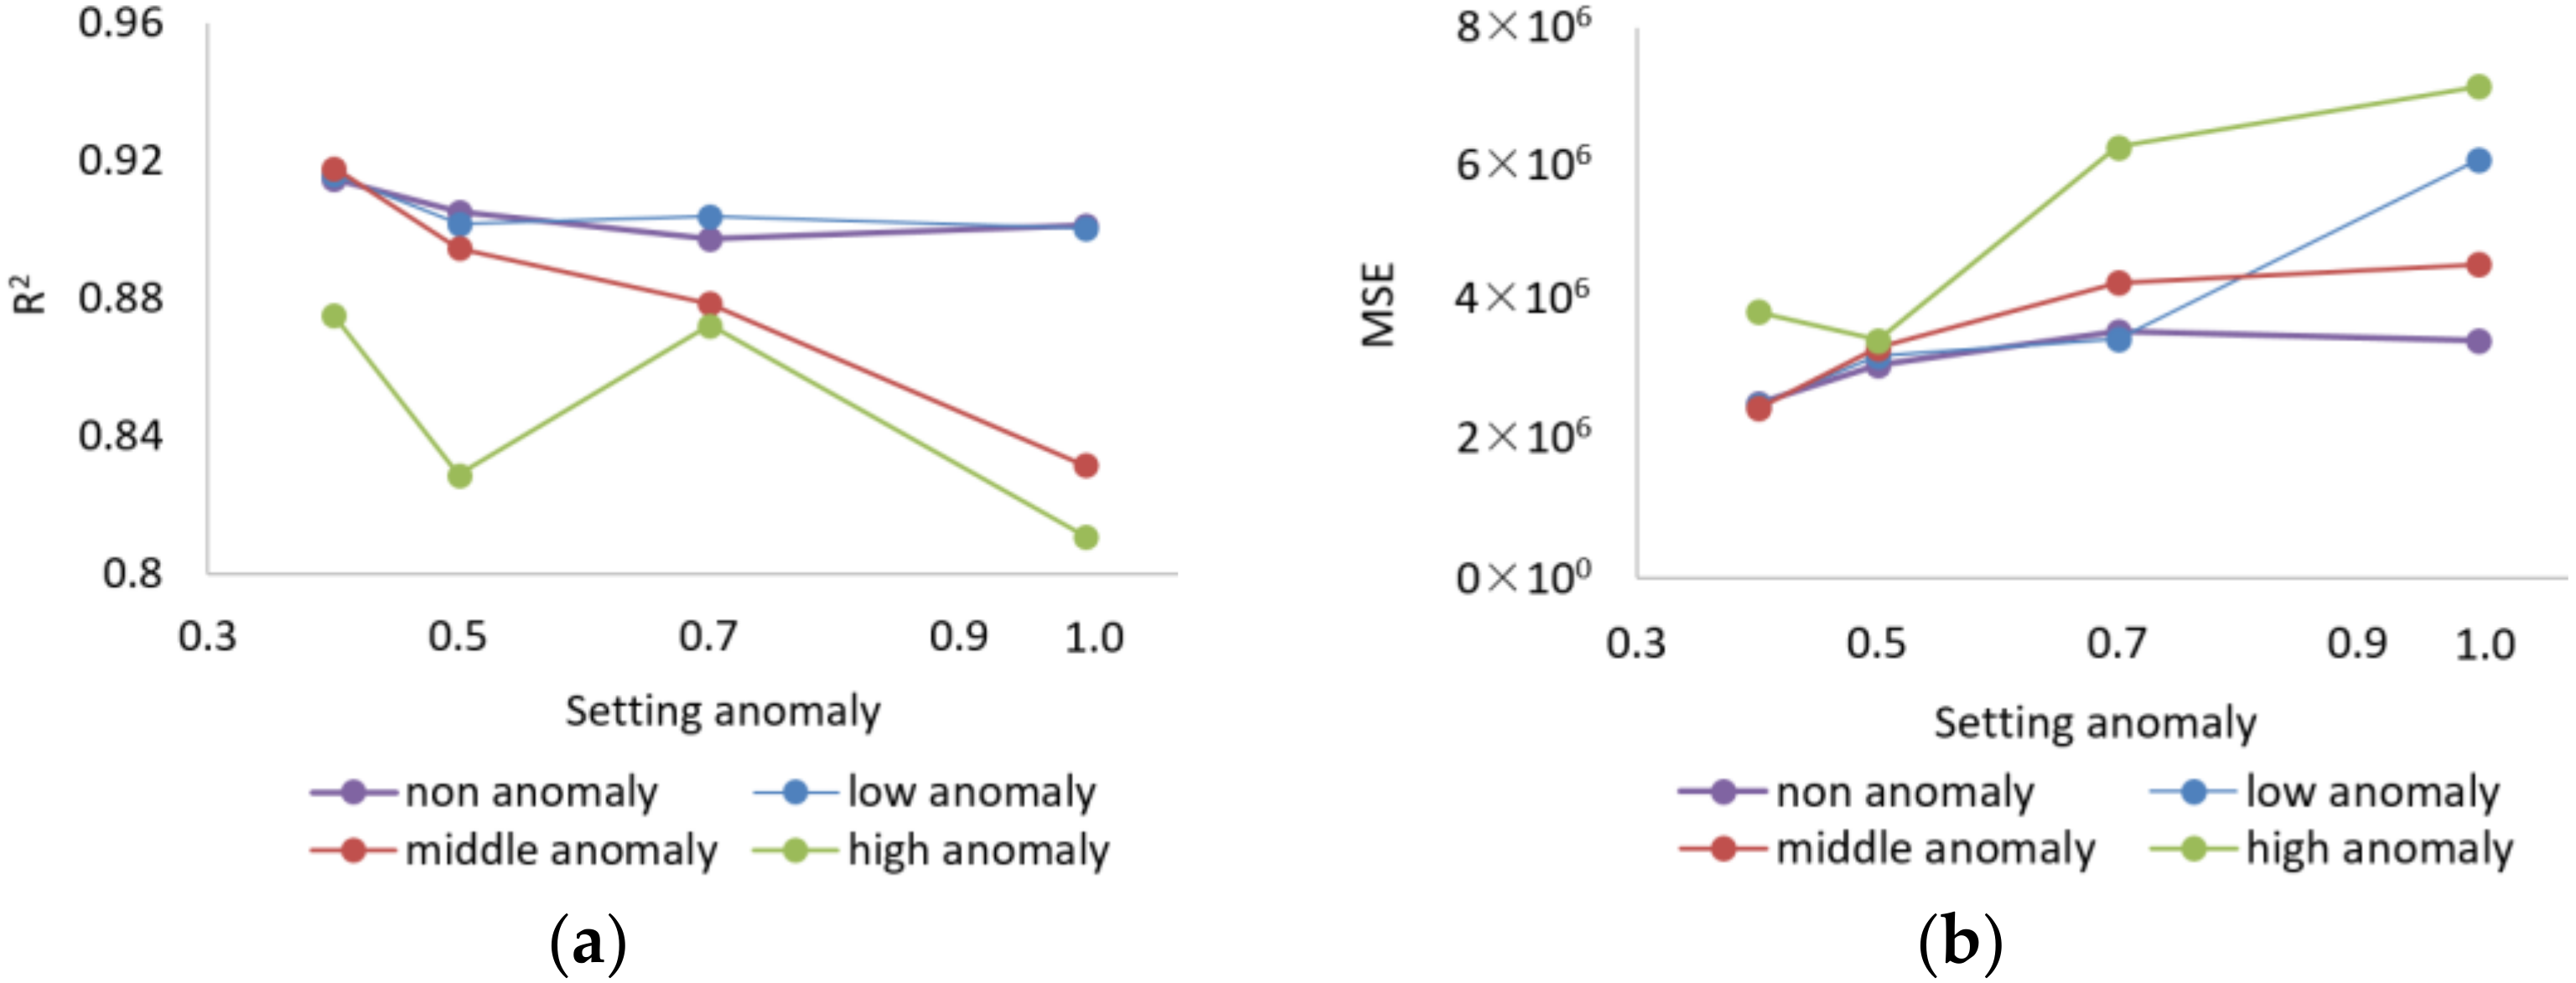
The building performance datasets such as EPC are not ready for direct modelling because of the imperfect data quality and reliability [60,63]. To address this, the PMDI performs data cleaning before conducting the performance modelling. In the empirical study of Sweden, the original anomaly threshold was initially set to be 0.6 in IF. It is interesting to investigate how the anomaly level, i.e., the threshold setting in the proposed PMDI, will influence the final performance modelling. Here the anomaly threshold in PMDI will be selected from 0.4, meaning that it is expected a high level of anomaly, to 1.0, which means that it is expected that no anomaly exists. The middle level as 0.5 and 0.7 are also discussed. Meanwhile, the actual anomaly level (i.e., the real situation of Swedish EPC dataset) is also assumed as four scenarios, non, low, middle, and high, which have an anomaly threshold of 0.4, 0.5, 0.7, and 1.0, respectively. The performances of baseline model modelling are used to compare different anomaly threshold settings to different actual anomaly levels. The coefficient of determination (R2) and mean square error (MSE) are used to represent the modelling performance (see Figure 9).
The results indicate that, in regard to the four discussed actual anomaly levels, it gives a better modelling performance in terms of R2 and MSE when we set the anomaly threshold of PMDI from low (1.0) to high level (0.4) (see Figure 9). It is found that if the assumed anomaly level in the building dataset is underestimated, the final modelling performance (R2 and MSE) will be harmed. While, if the assumed anomaly level in the building dataset is overestimated, the modelling performance will not be significantly affected. To summarize, from the reasonable ranges, setting the anomaly threshold in data cleaning process of developed PMDI approach to be a reasonably high level, 0.4 in this empirical study, will lead to better modelling performance.
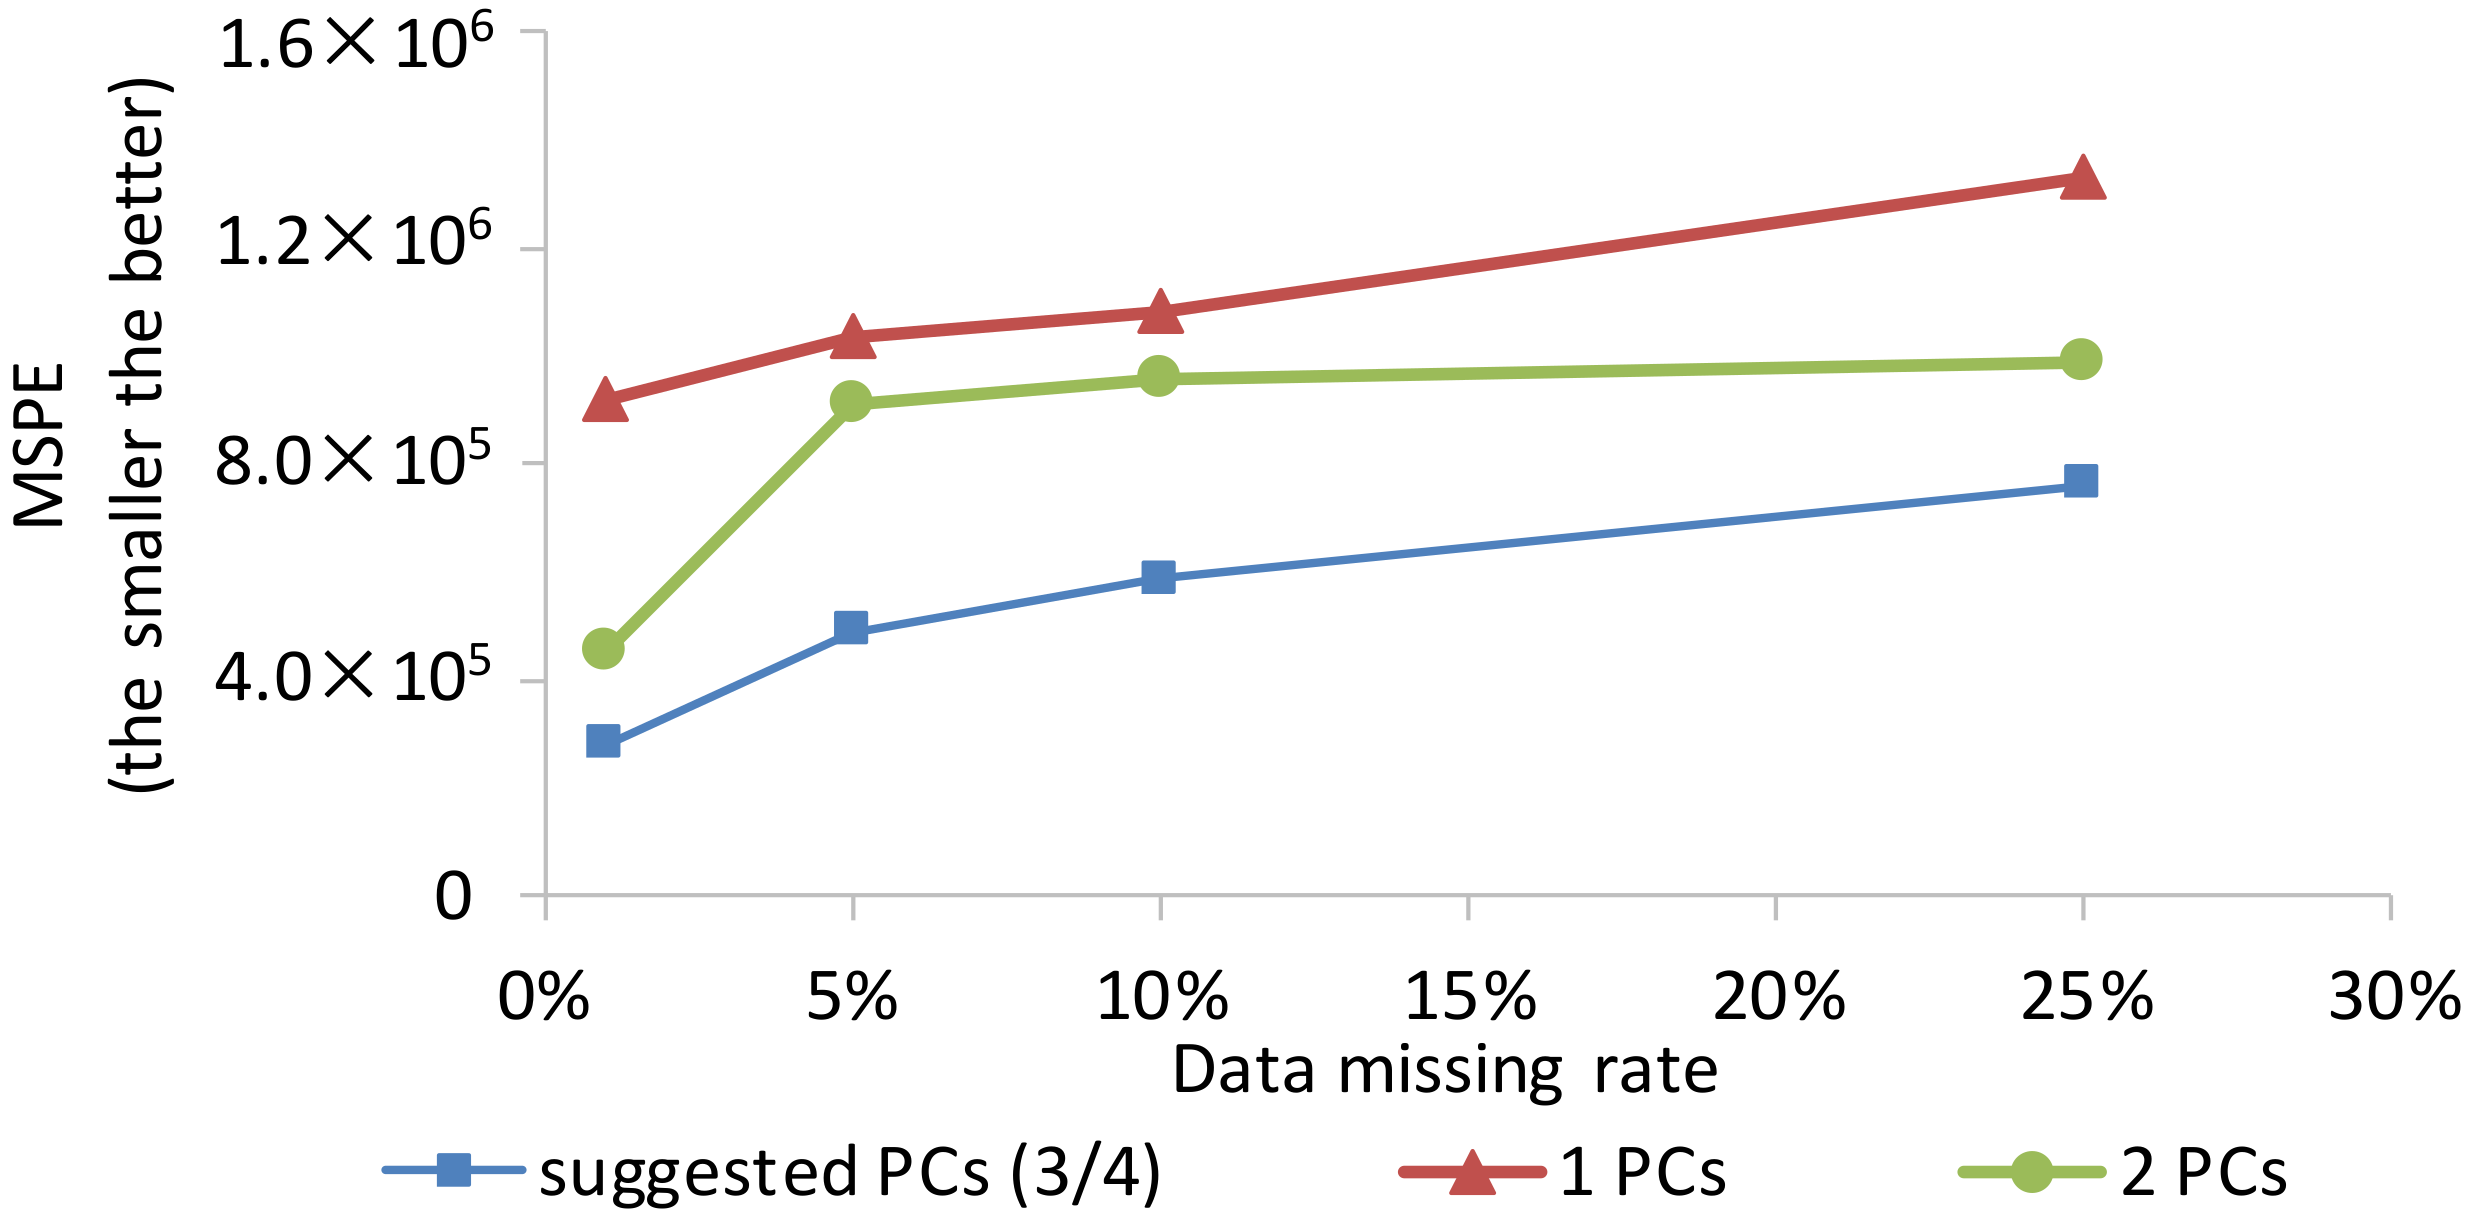
On the other side, the setting of data imputation module in PMDI directly influences the accuracy of missing value imputation. Firstly, different missing rates (missing information samples/complete information samples) of data imputation module are set to analyze their effects on accuracy of data imputation. Four types of sample size (1000, 200, 100, 40) of data imputation samples from EPC dataset after data cleaning are randomly selected to be the training data. Regarding the above ten building samples, accordingly, the missing rate is 1% (10/1000), 5% (10/200), 10% (10/100), and 25% (10/40), respectively. Secondly, the number of principal components (PCs) are compared from 1 to suggested number by PMDI according to the cumulative percentage explained by each component. This setting influences in which level of information can be explained by PCs. The performance of each setting is shown in Figure 10. The accuracy is represented by MSPE as Equation (12), which are 2.78 × 10⁵, 4.88 × 10⁵, 5.86 × 10⁵ and 7.63 × 10⁵ for 1%, 5%, 10%, and 25% of data missing, respectively, when the number of PCs is set to be suggested number. The results indicated that during applying PCA–TSR approach, the less data missing rate is; that is the more training data there are, the more accurate the imputed are. When comparing the MSPE of different number of PCs, it shows that the performance of imputation algorithm with suggested PCs based on cumulative percentage has a better missing data imputation performance. It validated the effectiveness of designed data imputation in PMDI approach.

5.2.2. Previous Study Comparison

In the building retrofitting application, previous studies have already employed the data-driven approach for estimating the expected energy savings of building retrofitting. These studies mainly used the regression ability to model the energy-savings performance of various retrofitting measures’ regression based on a dataset of buildings’ energy consumption [39,40,41]. Nevertheless, previous studies that were not aware of the buildings that needed renovation may not have access to full information for modelling. Afterwards, our previous research [36] demonstrated that the machine learning method can predict the energy use of retrofitted buildings when detailed input parameters are unavailable. In that research, the prediction model correctly covered sample buildings in Stockholm in 91.5%. This pilot result is very similar to the empirical study in this study (see Figure 5). However, in this previous study [36], the case-specific missing building information has not been considered, which is addressed by the data imputation module in the proposed PMDI approach. Moreover, the proposed PMDI approach also tested wider applicability on both a wide scale, i.e., on a country scale, and for a comprehensive objective, i.e., the energy savings and cost of retrofitting.
According to the above results, the PCA–TSR in the PMDI approach outperformed the previous data imputation methods including Mean Imputation and Statistics Imputation. The main reason could be that PCA–TSR is able to use the available building performance datasets to infer the possible value for missing information. Instead, the Mean Imputation only uses the average value to make a rough assumption on missing information, and the Statistics Imputation merely considers the statistical distributions for missing information without considering the characteristics of the buildings.

6. Conclusions

The buildings that need retrofitting usually have a long time of operations, causing the incomplete building information for performances estimation of retrofitting decision-makings. This research proposed an innovative approach from the perspective of data-driven to support retrofitting selection under incomplete information through performance modelling and data imputation based on the already available BPDs’ big data. In the data-driven approach, the machine learning technology using BRBNN–FCM establishes the building performance model that connects the relationship between basic building properties and different retrofitting measures, overcoming the barrier that conventional BPS is not applicable with certain generally missing building information. Moreover, the data imputation is achieved by PDA–TSR that imputes case-specific missing information considering the relationship between buildings’ characteristics and whole building knowledge. The presented data-driven approach is an alternative method to physical models and statistics methods having value assumption on missing information.
The developed approach can be widely applied based on available BPDs in many countries that need retrofitting. Although the data-driven approach was only validated by the Swedish empirical study, the proposed method can be generally applied so long as the accurate dataset is available, such as in the USA, Japan, and Australia, where local datasets are available. It provides a tool to predict the individual buildings’ performance from different retrofitting measures, enabling the building owners who normally have limited retrofitting knowledge and inaccessible complete building information to compare alternative retrofitting measures. The measures that are both energy-efficient and cost-saving will motivate the owners to make wise retrofitting decisions. The data-driven approach also provides a tool to analyze the strategy planning of retrofitting in macroscales. Therefore, different retrofitting strategies can be assessed and compared with the proposed method for reaching the national retrofitting targets. The results could be helpful to make national or regional retrofitting policy.
This research has limitations that can be addressed in future work. The developed approach assumes that the majority of the building big data is reliable, except for the anomaly samples. It will be very valuable to reinforce the developed approach with a quantitative investigation of the data accuracy and reliability of BPDs, from which the whole data-driven approach can consider the data quality and make further model calibrations. Furthermore, the influences of different settings of performance modelling and data imputation were analyzed in the above empirical study. However, there are still plenty of machine learning and data imputation algorithms. It is interesting to investigate how different algorithms will affect the developed approach. In addition, this data-driven approach has to require available local building performance datasets. It will be challenging to apply it to areas without a local dataset. The emerging machine-learning strategies, such as transfer learning, might overcome this limitation. Lastly, the proposed approach was not validated by field data. The open platform developed by our team in AURORLA project will collect first-hand building field data starting in 2023 that can both calibrate and validate the developed data-driven model.

Author Contributions

Conceptualization, W.L. and K.F.; methodology, K.F.; validation, W.L. and K.F.; writing—original draft preparation, K.F.; writing—review and editing, Q.M.; supervision, W.L. and Y.W.; funding acquisition, W.L. and K.F. All authors have read and agreed to the published version of the manuscript.

Funding

This research was funded by the National Natural Science Foundation of China, grant number 52108279; the China Postdoctoral Science Foundation, grant number 2020M670918; the Swedish Research Council for Environment, Agricultural Sciences and Spatial Planning (Formas), grant number 2020-02085, and the EU HORIZON 2020 project AURORAL.

Institutional Review Board Statement

Not applicable.

Informed Consent Statement

Not applicable.

Data Availability Statement

Restrictions apply to the availability of these data. Data was obtained from the Swedish National Board of Housing, Building and Planning “Boverket”.

Conflicts of Interest

The authors declare no conflict of interest.

Abbreviations

BPDsBuilding performance datasets
BPSBuilding performance simulation
BRBNNBayesian regularization backpropagation neural network
EPCEnergy performance certificate
FCMFuzzy C-means clustering
IFIsolation forest
MIMean imputation
MPIMean prediction interval
MSEMean square error
MSPEMean squared prediction error
PCAPrincipal component analysis
PICPPrediction interval coverage probability
PIsprediction intervals
PMDIPerformance modelling with data imputation
R2Coefficient of determination
RMRetrofitting measure
RMSERoot mean square error
SIStatistics imputation
TSRTrimmed scores regression

Appendix A

Table A1. The ten real individual building samples across Sweden and the results of missing data imputation.
Item of Samples (#)12345
ProvinceNorrbottensUppsalaSödermanlandsGävleborgsStockholm
CityBodenUppsala cityEskilstunaSandvikenStockholm city
Own home (Y/N)YYYYY
Building complexity * (Y/N)NNNNN
Building type (attached/detached)attacheddetachedattachedattachedattached
Construction year19711970196519601969
Heated area (m2, Atemp > 10 °C, except storage room)132190176142154
Number of basement floors (>10 °C, except storage room) m201110
Number of floors aboveground13122
Number of stairs00 (0)000 (0)
Number of residential apartments1 (1)111 (1)1
Available electrical power for heating and water (>10 W/m2, Y/N)NNNNY
The building’s energy use for heating and warm water, kWh22,40034,00021,20020,80018,500
The building’s energy use for household, etc., kWh730050004200280024,414
(24,900)
The building’s total energy use, kWh22,40034,00021,20020,80018,500
The electricity that is included in the building’s energy use, kWh000018,500
Normal year adjusted value (degree days), kWh22,76737,522021,0600
Normal year adjusted value (Energy Index)22,76136,98822,80020,93821,247
Energy consumption per area, kWh/m2, year172195130147138
Energy consumption per area of which electricity, kWh/m2, year0000138
Reference value 1 (according to new building requirements), kWh/m2, year130909011055
Reference value 2, min (statistical range), kWh/m2, year180122132143132
Reference value 2, max (statistical range), kWh/m2, year220149162175162
Energy version20122012201520122015
Energy classDFEDG
Requirement for regular ventilation control in the building (Y/N)NNNNN
Ventilation system FTX (Y/N)NNNNN
Ventilation system F (Y/N)NNNNN
Ventilation system FT (Y/N)NNNNN
Ventilation system natural ventilation (Y/N)NNYNY
Ventilation system F with recycling (Y/N)NNNNN
Available air-conditioning systems with nominal cooling power greater than 12 Kw (Y/N)NNNNN
Item of samples (#)678910
ProvinceÖstergötlandsNorrbottensVästernorrlandsSkåneSkåne
CityNorrköpingPiteåHärnösandTrelleborgOsby
Own home (Y/N)YYYYY
Building complexity * (Y/N)NNNNN (N)
Building type (attached/detached)attachedattachedattacheddetachedattached
Construction year19621934193219001958
Heated area (m2, Atemp > 10 °C, except storage room)18511019090119
Number of basement floors (> 10 °C, except storage room), m210(0)101
Number of floors aboveground12(2)211
Number of stairs00000
Number of residential apartments11111
Available electrical power for heating and water (>10 W/m2, Y/N)NYYYN
The building’s energy use for heating and warm water, kWh27,10010,80016,40011,80019,999
(20,000)
The building’s energy use for household, etc., kWh5173
(4000)
14,00021,60017,3004482
(4500)
The building’s total energy use, kWh27,10011,249
(10,800)
16,40011,80020,028
(20,000)
The electricity that is included in the building’s energy use, kWh010,80016,40011,8000
Normal year adjusted value (degree days), kWh31,68212,15619,3688139
(11,611)
13,751
(21,683)
Normal year adjusted value (Energy Index)30,90512,63219,45112,687
(12,021)
21,376
(20,955)
Energy consumption per area, kWh/m2, year167115102141
(134)
180
(176)
Energy consumption per area of which electricity, kWh/m2, year01151021340
Reference value 1 (according to new building requirements), kWh/m2, year9095755590
Reference value 2, min (statistical range), kWh/m2, year132153153112159
Reference value 2, max (statistical range), kWh/m2, year162188187137194
Energy version20122012201220122012
Energy classFDE (E)G (G)F (F)
Requirement for regular ventilation control in the building (Y/N)NNNNN
Ventilation system FTX (Y/N)NNN(N)NN
Ventilation system F (Y/N)NNN(N)NN
Ventilation system FT (Y/N)NNN(N)NN
Ventilation system natural ventilation (Y/N)YNN(Y)NN
Ventilation system F with recycling (Y/N)NNN(N)NN
Available air-conditioning systems with nominal cooling power greater than 12 Kw (Y/N)NNNNN
The number in the parentheses is the actual value for variables, and the number outside the parentheses is the imputed value by proposed approach; * the “complexity” is defined by the Boverket, the Swedish National Board of Housing, Building, and Planning.
Table A2. The EPC records of Stockholm for city-scale method application.
Item of Samples12340,73540,736
Building Properties
ProvinceStockholmStockholmStockholmStockholmStockholm
CityNorrtäljeStockholm citySundbybergSödertäljeSödertälje
Own home (Y/N)NNNNN
Building complexity (Y/N)NNNNN
building type (attached/detached)attachedattachedattachedattachedattached
Construction year19711770190919091968
Heated area (m2, Atemp > 10 °C, except storage room)20571193185305
Number of basement floors heated (>10 °C, except storage room) m210101
Number of floors aboveground1NaN221
Number of stairs0NaNNaNNaN2
Number of residential apartments1NaN1NaN0
Available electrical power for heating and water (>10 W/m2, Y/N)NYNYN
The building’s energy use for heating and warm water kWh40,00010,00041,58230,09212,900
The building’s energy use for household, etc., kWh010,450662237,40216,900
The building’s total energy use kWh40,00010,45041,58230,48416,900
The electricity that is included in the building’s energy use kWh010,450216230,48416,900
Normal year adjusted value (degree days) kWh42,74011,83846,68031,52018,167
Normal year adjusted value (Energy Index)42,59811,51846,98932,57918,246
Energy consumption per area kWh/m2, year20816224317660
Energy consumption per area of which electricity kWh/m2, year01621317660
Reference value 1 (according to new building requirements) kWh/m2, year1105511055110
Reference value 2, min (statistical range) kWh/m2, year15913215713279
Reference value 2, max (statistical range) kWh/m2, year19416219216297
Energy version20102010201020102010
Energy classFGFGB
Requirement for regular ventilation control in the building (Y/N)NNNYNaN
Ventilation system FTX (Y/N)NNNNNaN
Ventilation system F (Y/N)NNNNNaN
Ventilation system FT (Y/N)NNNNNaN
Ventilation system natural ventilation (Y/N)YNYYNaN
Ventilation system F with recycling (Y/N)NNNNNaN
Available air-conditioning systems with nominal cooling power greater than 12 Kw (Y/N)NNNN0
Suggested Retrofitting Strategy and Performances (Y/N)
New radiator valvesNNNNN
Adjustment of heating systemNNNNN
Time/need control of heating systemNNNNN
Cleaning and/or aeration of heatingNNNNN
Maximum indoor temperature limitNNNNN
New indoor sensorNNNNN
Replacement/installation of pressure-controlled pumpsNNNNN
Other action on heating systemNNNNN
Adjustment of ventilation system *NNNNN
Timing of ventilation systemNNNNN
Need control of ventilation systemNNNNN
Replacement/installation of speed-controlled fansNNNNN
Other action on ventilationNNNNN
Time/need control of lightingNNNNN
Time/need control of coldNNNNN
Other action on lighting, coolingNNNNN
Hot-water-saving measuresNNNNY
Energy efficient lightingNNNNN
Insulation of pipes and ventilation ductsNNNNN
Replacement/installation of heat pumpYYNYN
Replacement/installation of energy efficient heat sourceNNNNN
Replacement/completion of ventilation systemNNNNN
Recovery of ventilation heatNNNNN
Other action on installationNNYNN
Additional insulation of attic ceiling/roofNNNNN
Additional insulation wallsNNNNN
Additional insulation basement/groundNNNNN
Installation of solar cellsNNNNN
Installation of solar heatingNNNNN
Change to energy efficient windows/window doors with inner windowNNNNN
Complement window/window doors with inner windowNNNNN
Sealing windows/window doors/exterior doorsNNNNN
Other measure (construction)NNNNN
Energy-savings (kWh/a)16,0004000365916,900385
Cost (SEK/a)14,40018401353.8313,52065.45
NaN means the value of this EPC record is missing. * The adjustment of ventilation system, means that to adjust the setting of the ventilation system to make sure sufficient but not too much air is circulated in each room.

References

  1. D’Oca, S.; Ferrante, A.; Ferrer, C.; Pernetti, R.; Gralka, A.; Sebastian, R.; Op‘t Veld, P. Technical, financial, and social barriers and challenges in deep building renovation: Integration of lessons learned from the H2020 cluster projects. Buildings 2018, 8, 174. [Google Scholar] [CrossRef]
  2. Hall, T.; Vidén, S. The Million Homes Programme: A review of the great Swedish planning project. Plan. Perspect. 2005, 20, 301–328. [Google Scholar] [CrossRef]
  3. Chen, Y.; Xiao, Z.Q. Research on the Eco-Renovation Strategy on Old Industrial Buildings. Appl. Mech. Mater. 2013, 253, 853–856. [Google Scholar] [CrossRef]
  4. Heo, Y.; Choudhary, R.; Augenbroe, G. Calibration of building energy models for retrofit analysis under uncertainty. Energy Build. 2012, 47, 550–560. [Google Scholar] [CrossRef]
  5. Amasyali, K.; El-Gohary, N.M. A review of data-driven building energy consumption prediction studies. Renew. Sustain. Energy Rev. 2018, 81, 1192–1205. [Google Scholar] [CrossRef]
  6. Mathew, P.A.; Dunn, L.N.; Sohn, M.D.; Mercado, A.; Custudio, C.; Walter, T. Big-data for building energy performance: Lessons from assembling a very large national database of building energy use. Appl. Energy 2015, 140, 85–93. [Google Scholar] [CrossRef]
  7. Collinge, W.O.; DeBlois, J.C.; Landis, A.E.; Schaefer, L.A.; Bilec, M.M. Hybrid dynamic-empirical building energy modeling approach for an existing campus building. J. Archit. Eng. 2016, 22, 04015010. [Google Scholar] [CrossRef]
  8. Tian, W.; Yang, S.; Li, Z.; Wei, S.; Pan, W.; Liu, Y. Identifying informative energy data in Bayesian calibration of building energy models. Energy Build. 2016, 119, 363–376. [Google Scholar] [CrossRef]
  9. Nagpal, S.; Mueller, C.; Aijazi, A.; Reinhart, C.F. A methodology for auto-calibrating urban building energy models using surrogate modeling techniques. J. Build. Perform. Simul. 2019, 12, 1–16. [Google Scholar] [CrossRef]
  10. Ochoa, C.E.; Capeluto, I.G. Advice tool for early design stages of intelligent facades based on energy and visual comfort approach. Energy Build. 2009, 41, 480–488. [Google Scholar] [CrossRef]
  11. Hiyama, K.; Kato, S.; Kubota, M.; Zhang, J. A new method for reusing building information models of past projects to optimize the default configuration for performance simulations. Energy Build. 2014, 73, 83–91. [Google Scholar] [CrossRef]
  12. Nik, V.M.; Mata, E.; Kalagasidis, A.S.; Scartezzini, J.-L. Effective and robust energy retrofitting measures for future climatic conditions—Reduced heating demand of Swedish households. Energy Build. 2016, 121, 176–187. [Google Scholar] [CrossRef]
  13. Rezaee, R.; Brown, J.; Augenbroe, G.; Kim, J. Assessment of uncertainty and confidence in building design exploration. AI EDAM 2015, 29, 429–441. [Google Scholar] [CrossRef]
  14. De Wit, S.; Augenbroe, G. Analysis of uncertainty in building design evaluations and its implications. Energy Build. 2002, 34, 951–958. [Google Scholar] [CrossRef]
  15. Macdonald, I.; Strachan, P. Practical application of uncertainty analysis. Energy Build. 2001, 33, 219–227. [Google Scholar] [CrossRef]
  16. Booth, A.T.; Choudhary, R.; Spiegelhalter, D.J. Handling uncertainty in housing stock models. Build. Environ. 2012, 48, 35–47. [Google Scholar] [CrossRef]
  17. Walter, T.; Sohn, M.D. A regression-based approach to estimating retrofit savings using the Building Performance Database. Appl. Energy 2016, 179, 996–1005. [Google Scholar] [CrossRef]
  18. Ma, J.; Cheng, J.C.; Jiang, F.; Chen, W.; Wang, M.; Zhai, C. A bi-directional missing data imputation scheme based on LSTM and transfer learning for building energy data. Energy Build. 2020, 216, 109941. [Google Scholar] [CrossRef]
  19. Nielsen, A.N.; Jensen, R.L.; Larsen, T.S.; Nissen, S.B. Early stage decision support for sustainable building renovation—A review. Build. Environ. 2016, 103, 165–181. [Google Scholar] [CrossRef]
  20. Niemelä, T.; Kosonen, R.; Jokisalo, J. Cost-effectiveness of energy performance renovation measures in Finnish brick apartment buildings. Energy Build. 2017, 137, 60–75. [Google Scholar] [CrossRef]
  21. Mata, É.; Wanemark, J.; Nik, V.M.; Kalagasidis, A.S. Economic feasibility of building retrofitting mitigation potentials: Climate change uncertainties for Swedish cities. Appl. Energy 2019, 242, 1022–1035. [Google Scholar] [CrossRef]
  22. Shadram, F.; Mukkavaara, J. An integrated BIM-based framework for the optimization of the trade-off between embodied and operational energy. Energy Build. 2018, 158, 1189–1205. [Google Scholar] [CrossRef]
  23. Mata, É.; Kalagasidis, A.S.; Johnsson, F. A modelling strategy for energy, carbon, and cost assessments of building stocks. Energy Build. 2013, 56, 100–108. [Google Scholar] [CrossRef]
  24. ISO 14040; Environmental Management—Life Cycle Assessment—Principles and Framework. International Organization for Standardization: Geneva, Switzerland, 2006.
  25. Favi, C.; Di Giuseppe, E.; D’Orazio, M.; Rossi, M.; Germani, M. Building retrofit measures and design: A probabilistic approach for LCA. Sustainability 2018, 10, 3655. [Google Scholar] [CrossRef]
  26. Gustafsson, M.; Dipasquale, C.; Poppi, S.; Bellini, A.; Fedrizzi, R.; Bales, C.; Ochs, F.; Sié, M.; Holmberg, S. Economic and environmental analysis of energy renovation packages for European office buildings. Energy Build. 2017, 148, 155–165. [Google Scholar] [CrossRef]
  27. Feng, K.; Lu, W.; Wang, Y. Assessing environmental performance in early building design stage: An integrated parametric design and machine learning method. Sustain. Cities Soc. 2019, 50, 101596. [Google Scholar] [CrossRef]
  28. Gustafsson, M.; Dermentzis, G.; Myhren, J.A.; Bales, C.; Ochs, F.; Holmberg, S.; Feist, W. Energy performance comparison of three innovative HVAC systems for renovation through dynamic simulation. Energy Build. 2014, 82, 512–519. [Google Scholar] [CrossRef]
  29. Santangelo, A.; Tondelli, S. Occupant behaviour and building renovation of the social housing stock: Current and future challenges. Energy Build. 2017, 145, 276–283. [Google Scholar] [CrossRef]
  30. Serrano-Jimenez, A.; Barrios-Padura, A.; Molina-Huelva, M. Towards a feasible strategy in Mediterranean building renovation through a multidisciplinary approach. Sustain. Cities Soc. 2017, 32, 532–546. [Google Scholar] [CrossRef]
  31. Pasichnyi, O.; Levihn, F.; Shahrokni, H.; Wallin, J.; Kordas, O. Data-driven strategic planning of building energy retrofitting: The case of Stockholm. J. Clean. Prod. 2019, 233, 546–560. [Google Scholar] [CrossRef]
  32. Wei, Y.; Zhang, X.; Shi, Y.; Xia, L.; Pan, S.; Wu, J.; Han, M.; Zhao, X. A review of data-driven approaches for prediction and classification of building energy consumption. Renew. Sustain. Energy Rev. 2018, 82, 1027–1047. [Google Scholar] [CrossRef]
  33. Yildiz, B.; Bilbao, J.I.; Sproul, A.B. A review and analysis of regression and machine learning models on commercial building electricity load forecasting. Renew. Sustain. Energy Rev. 2017, 73, 1104–1122. [Google Scholar] [CrossRef]
  34. Feng, K.; Chen, S.; Lu, W.; Wang, S.; Yang, B.; Sun, C.; Wang, Y. Embedding ensemble learning into simulation-based optimisation: A learning-based optimisation approach for construction planning. Eng. Constr. Archit. Manag. 2021, 228, 1439–1453. [Google Scholar] [CrossRef]
  35. Geyer, P.; Singaravel, S. Component-based machine learning for performance prediction in building design. Appl. Energy 2018, 228, 1439–1453. [Google Scholar] [CrossRef]
  36. Lu, W.; Feng, K. Big-data driven building retrofitting: An integrated Support Vector Machines and Fuzzy C-means clustering method. Proc. IOP Conf. Ser. Earth Environ. Sci. 2020, 588, 042013. [Google Scholar] [CrossRef]
  37. Sharif, S.A.; Hammad, A. Developing surrogate ANN for selecting near-optimal building energy renovation methods considering energy consumption, LCC and LCA. J. Build. Eng. 2019, 25, 100790. [Google Scholar] [CrossRef]
  38. Geyer, P.; Schlüter, A.; Cisar, S. Application of clustering for the development of retrofit strategies for large building stocks. Adv. Eng. Inform. 2017, 31, 32–47. [Google Scholar] [CrossRef]
  39. Martinez, A.; Choi, J.-H. Analysis of energy impacts of facade-inclusive retrofit strategies, compared to system-only retrofits using regression models. Energy Build. 2018, 158, 261–267. [Google Scholar] [CrossRef]
  40. Kim, J.; Cho, K.; Kim, T.; Yoon, Y. Predicting the monetary value of office property post renovation work. J. Urban Plan. Dev. 2018, 144, 04018007. [Google Scholar] [CrossRef]
  41. Sassine, E.; Younsi, Z.; Cherif, Y.; Antczak, E. Frequency domain regression method to predict thermal behavior of brick wall of existing buildings. Appl. Therm. Eng. 2017, 114, 24–35. [Google Scholar] [CrossRef]
  42. Gudivada, V.; Apon, A.; Ding, J. Data quality considerations for big data and machine learning: Going beyond data cleaning and transformations. Int. J. Adv. Softw. 2017, 10, 1–20. [Google Scholar]
  43. Chandola, V.; Banerjee, A.; Kumar, V. Anomaly detection: A survey. ACM Comput. Surv. CSUR 2009, 41, 1–58. [Google Scholar] [CrossRef]
  44. Liu, F.T.; Ting, K.M.; Zhou, Z.-H. Isolation-based anomaly detection. ACM Trans. Knowl. Discov. Data TKDD 2012, 6, 1–39. [Google Scholar] [CrossRef]
  45. Kim, J.; Naganathan, H.; Moon, S.-Y.; Chong, W.K.; Ariaratnam, S.T. Applications of clustering and isolation forest techniques in real-time building energy-consumption data: Application to LEED certified buildings. J. Energy Eng. 2017, 143, 04017052. [Google Scholar] [CrossRef]
  46. Yan, Z.; Wang, J. Robust model predictive control of nonlinear systems with unmodeled dynamics and bounded uncertainties based on neural networks. IEEE Trans. Neural Netw. Learn. Syst. 2013, 25, 457–469. [Google Scholar] [CrossRef] [PubMed]
  47. Foresee, F.D.; Hagan, M.T. Gauss-Newton approximation to Bayesian learning. In Proceedings of the International Conference on Neural Networks (ICNN’97), Houston, TX, USA, 12 June 1997; pp. 1930–1935. [Google Scholar]
  48. Shrestha, D.L.; Solomatine, D.P. Machine learning approaches for estimation of prediction interval for the model output. Neural Netw. 2006, 19, 225–235. [Google Scholar] [CrossRef] [PubMed]
  49. Dunn, J.C. A fuzzy relative of the ISODATA process and its use in detecting compact well-separated clusters. J. Cybern. 1973, 3, 32–57. [Google Scholar] [CrossRef]
  50. Bezdek, J.C. Pattern Recognition with Fuzzy Objective Function Algorithms; Springer Science & Business Media: Berlin/Heidelberg, Germany, 2013. [Google Scholar]
  51. Folch-Fortuny, A.; Villaverde, A.F.; Ferrer, A.; Banga, J.R. Enabling network inference methods to handle missing data and outliers. BMC Bioinform. 2015, 16, 283. [Google Scholar] [CrossRef] [PubMed]
  52. Arteaga, F.; Ferrer, A. Dealing with missing data in MSPC: Several methods, different interpretations, some examples. J. Chemom. J. Chemom. Soc. 2002, 16, 408–418. [Google Scholar] [CrossRef]
  53. Folch-Fortuny, A.; Arteaga, F.; Ferrer, A. PCA model building with missing data: New proposals and a comparative study. Chemom. Intell. Lab. Syst. 2015, 146, 77–88. [Google Scholar] [CrossRef]
  54. Groot, A.D.D.; Spiekerman, J.A.A. Methodology: Foundations of inference and research in the behavioral sciences. In 1. The Empirical Cycle in Science; De Gruyter Mouton: Berlin, Germany, 2020; pp. 1–32. [Google Scholar]
  55. EU. Directive 2002/91/EC Energy Performance of Buildings. 2002. Available online: https://eur-lex.europa.eu/legal-content/EN/ALL/?uri=celex%3A32002L0091 (accessed on 2 July 2022).
  56. Asensio, O.I.; Delmas, M.A. The effectiveness of US energy efficiency building labels. Nat. Energy 2017, 2, 17033. [Google Scholar] [CrossRef]
  57. Takaguchi, H.; Izutsu, S.; Washiya, S.; Kametani, S.; Hanzawa, H.; Yoshino, H.; Asano, Y.; Okumiya, M.; Shimoda, Y.; Murakawa, S.; et al. Development and analysis of DECC (data-base for energy consumption of commercial building): Part 1 Development on basic database of DECC. J. Environ. Eng. 2012, 77, 699–705. [Google Scholar] [CrossRef]
  58. Candido, C.; Kim, J.; de Dear, R.; Thomas, L. BOSSA: A multidimensional post-occupancy evaluation tool. Build. Res. Inf. 2016, 44, 214–228. [Google Scholar] [CrossRef]
  59. Johansson, T.; Vesterlund, M.; Olofsson, T.; Dahl, J. Energy performance certificates and 3-dimensional city models as a means to reach national targets—A case study of the city of Kiruna. Energy Convers. Manag. 2016, 116, 42–57. [Google Scholar] [CrossRef]
  60. Caceres, A.G. Shortcomings and Suggestions to the EPC Recommendation List of Measures: In-Depth Interviews in Six Countries. Energies 2018, 11, 2516. [Google Scholar] [CrossRef]
  61. Abela, A.; Hoxley, M.; McGrath, P.; Goodhew, S. An investigation of the appropriateness of current methodologies for energy certification of Mediterranean housing. Energy Build. 2016, 130, 210–218. [Google Scholar] [CrossRef]
  62. Kavgic, M.; Mavrogianni, A.; Mumovic, D.; Summerfield, A.; Stevanovic, Z.; Djurovic-Petrovic, M. A review of bottom-up building stock models for energy consumption in the residential sector. Build. Environ. 2010, 45, 1683–1697. [Google Scholar] [CrossRef]
  63. Buratti, C.; Barbanera, M.; Palladino, D. An original tool for checking energy performance and certification of buildings by means of Artificial Neural Networks. Appl. Energy 2014, 120, 125–132. [Google Scholar] [CrossRef]
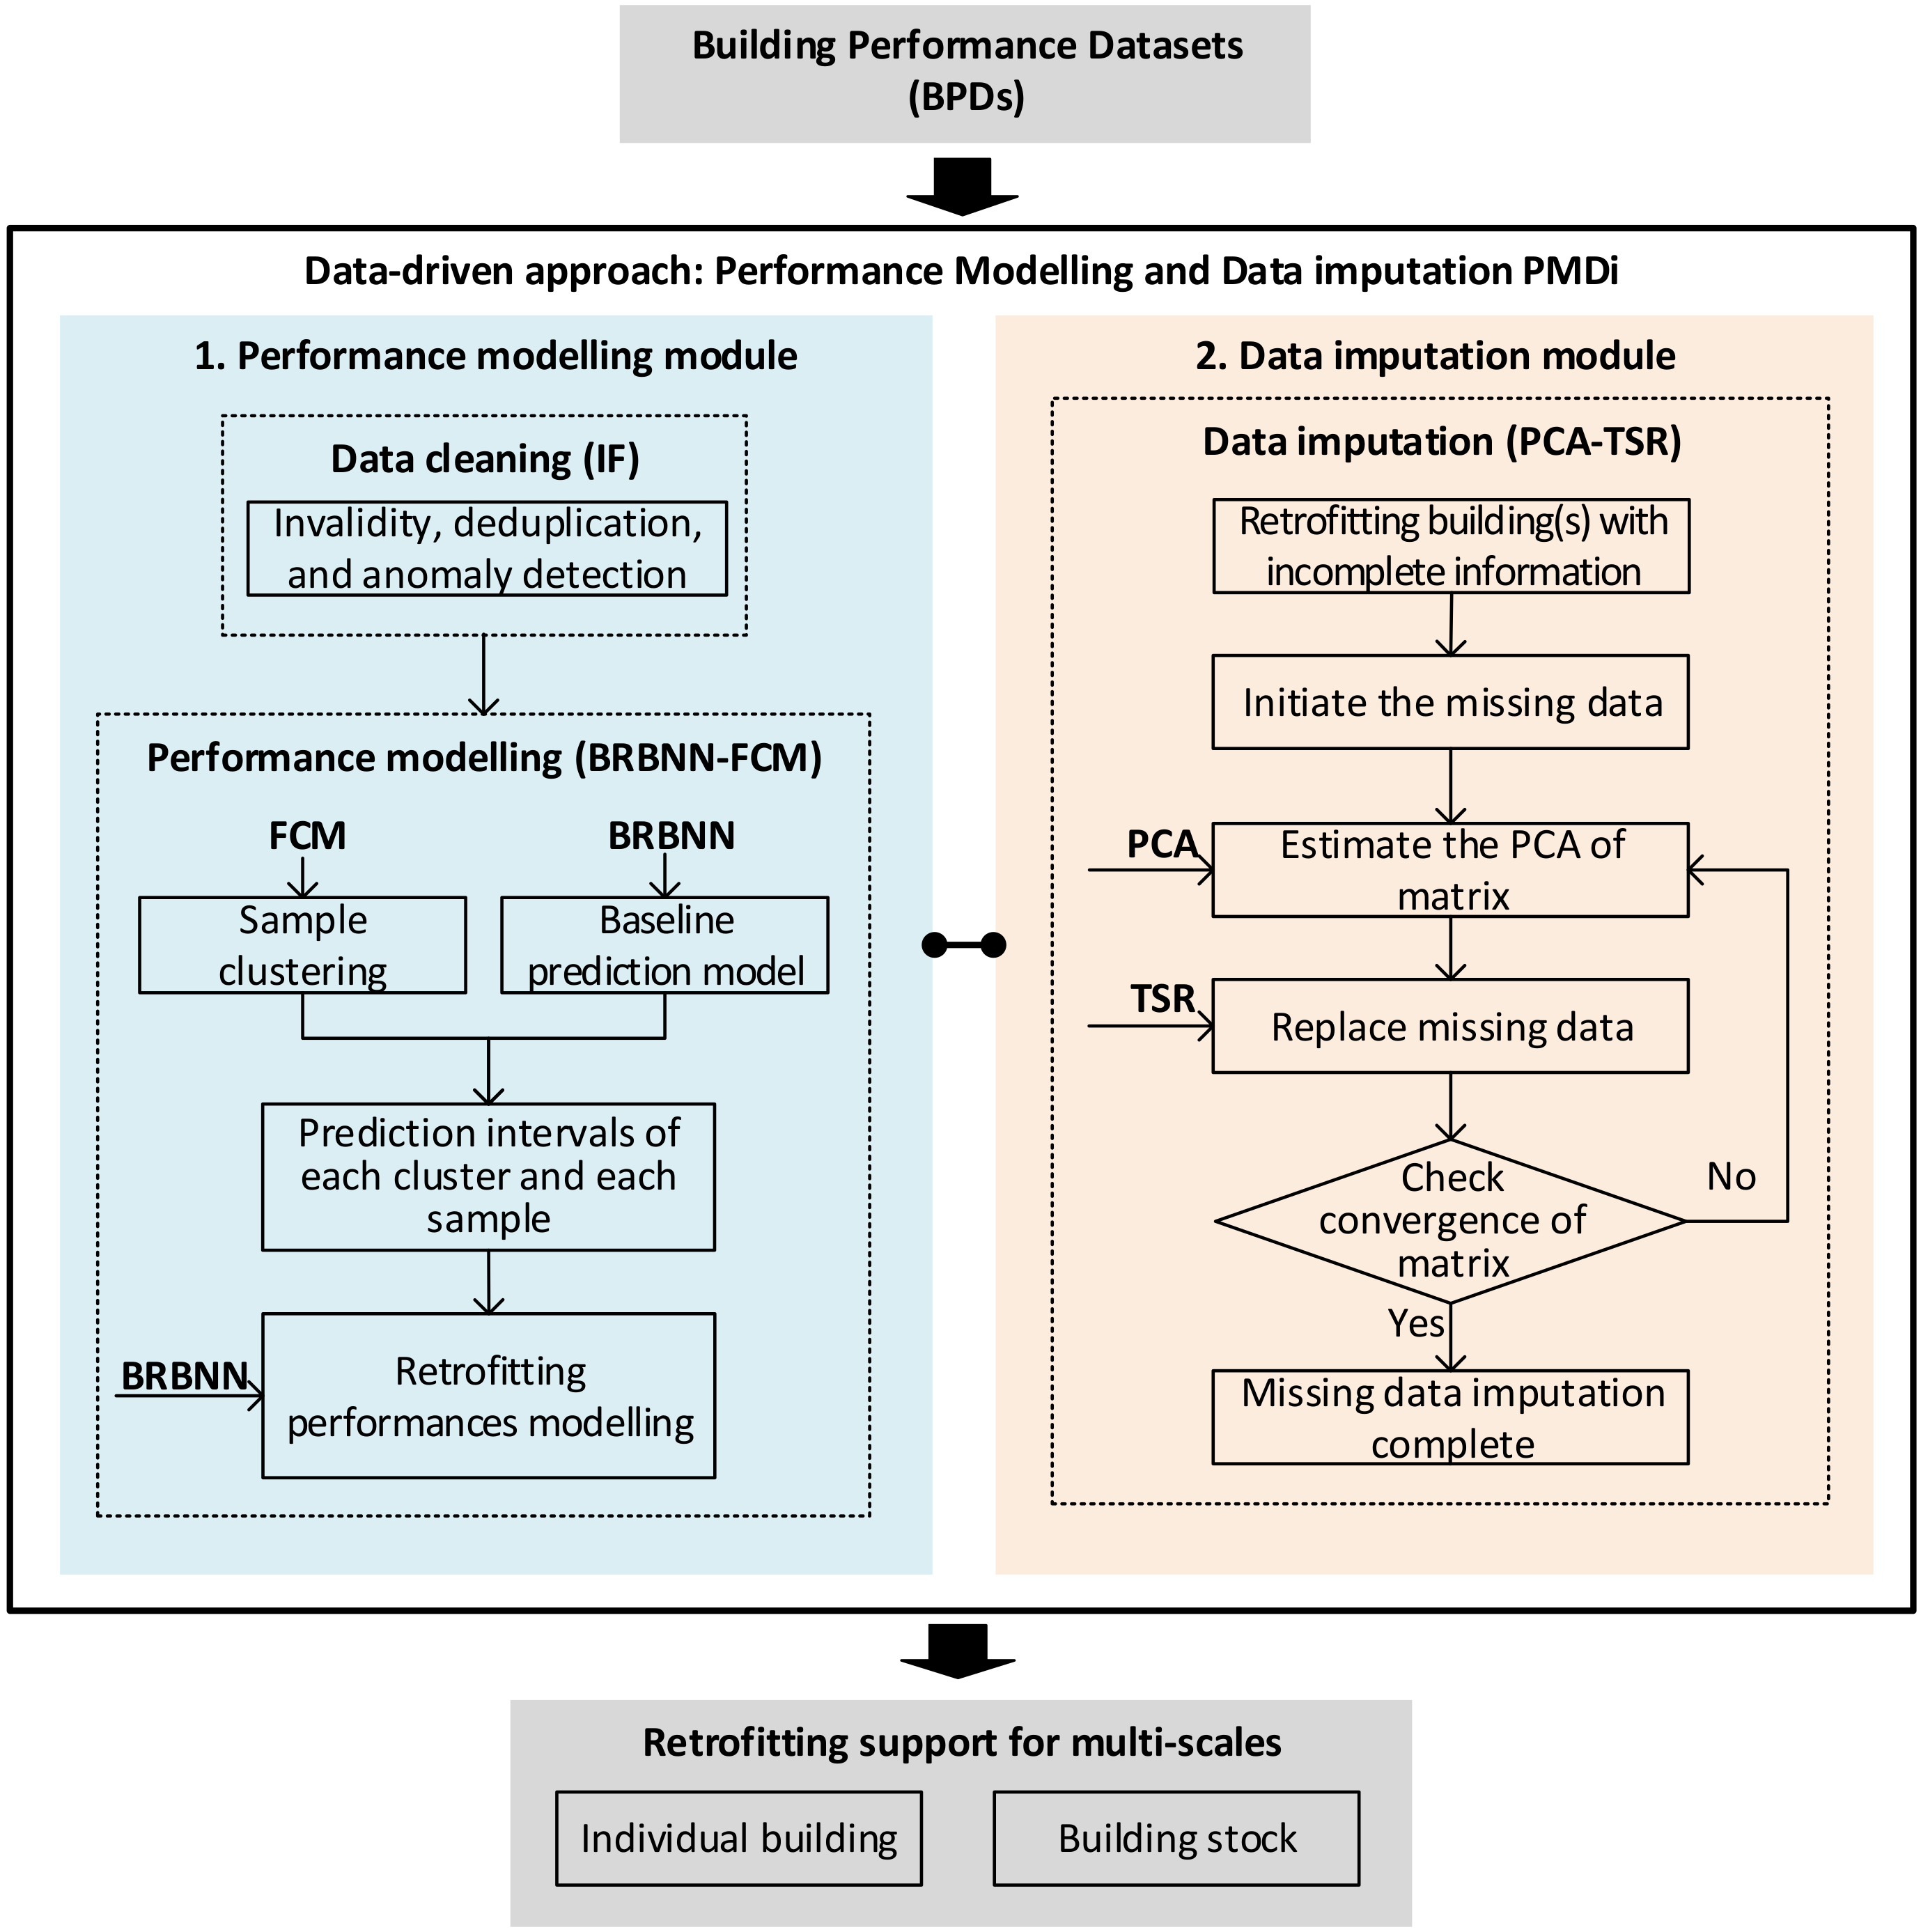
Figure 1. The overall framework of the proposed PMDI data-driven method.
Buildings 12 01244 g001
Figure 2. The overall structure of BRBNN for performance modelling.
Buildings 12 01244 g002
Figure 3. The PCA–TSR data imputation method.
Buildings 12 01244 g003
Figure 4. The average anomalous score of each EPC records calculated by IF algorithms.
Buildings 12 01244 g004
Figure 5. Modelling of energy-savings and cost for EPC testing samples: (a) energy-savings for testing samples (accuracy 90.9%) and (b) cost for testing samples (accuracy 90.8%).
Buildings 12 01244 g005
Figure 6. The energy-saving and cost of sample buildings under different retrofitting measures: (a) energy-savings of sample buildings and (b) cost of sample buildings; the color legend is not evenly distributed.
Buildings 12 01244 g006
Figure 7. The energy-saving and cost of Building #5 with average and PI under different retrofitting measures.
Buildings 12 01244 g007
Figure 8. The energy and cost of Stockholm building stock under four retrofitting strategies.
Buildings 12 01244 g008
Figure 9. The modelling performance of data cleaning method with various anomaly threshold settings in terms of (a) R2 and (b) MSE.
Buildings 12 01244 g009
Figure 10. The accurate performance of data imputation method with various settings and different missing rate scenarios.
Buildings 12 01244 g010
Table 1. The building property of an EPC sample.
No.Building PropertyNo.Building Property
1.Location (province)18.Normal year adjusted value (Energy Index)
2.Location (city)19.Energy consumption per area
3.Own home (Y/N)20.Energy consumption per area of which electricity
4.Building complexity* (Y/N)21.Reference value 1 (according to new building requirements) kWh/m2, year
5.Building type (attached/detached)22.Reference value 2, min (statistical range) kWh/m2, year
6.Construction year23.Reference value 2, max (statistical range) kWh/m2, year
7.Heated area (m2, Atemp > 10 °C, except storage room)24.Energy version
8.Number of basement floors heated (>10 °C, except storage room), m225.Energy class *
9.Number of floors aboveground26.Requirement for regular ventilation control in the building (Y/N)
10.Number of stairs27.Ventilation system FTX (Y/N)
11.Number of residential apartments28.Ventilation system F (Y/N)
12.Available electrical power for heating and water (>10 W/m2)29.Ventilation system FT (Y/N)
13.The building’s energy use for heating and warm water * kWh30.Ventilation system natural ventilation (Y/N)
14.The building’s energy use for household, etc. * kWh31.Ventilation system F with recycling (Y/N)
15.The building’s total energy use * kWh32.Available air-conditioning systems with nominal cooling power greater than 12 kW (Y/N)
16.The electricity that is included in the building’s energy use kWh33.Date of approval
17.Normal year adjusted value (degree days) kWh34.EPC version
* According to the definition in the Swedish National Board of Housing, Building, and Planning (Boverket) regulations.
Table 2. The retrofit strategy of an EPC sample.
No.Retrofit StrategyNo.Retrofit Strategy
1.New radiator valves18.Energy efficient lighting
2.Adjustment of heating system19.Insulation of pipes and ventilation ducts
3.Time/need control of heating system20.Replacement/installation of heat pump
4.Cleaning and/or aeration of heating21.Replacement/installation of energy efficient heat source
5.Maximum indoor temperature limit22.Replacement/completion of ventilation system
6.New indoor sensor23.Recovery of ventilation heat
7.Replacement/installation of pressure-controlled pumps24.Other action on installation
8.Other action on heating system25.Additional insulation of attic ceiling/roof
9.Adjustment of ventilation system26.Additional insulation walls
10.Timing of ventilation system27.Additional insulation basement/ground
11.Need control of ventilation system28.Installation of solar cells
12.Replacement/installation of speed-controlled fans29.Installation of solar heating
13.Other action on ventilation30.Change to energy efficient windows/window doors with inner window
14.Time/need control of lighting31.Complement window/window doors with inner window
15.Time/need control of cold32.Sealing windows/window doors/exterior doors
16.Other action on lighting, cooling33.Other measure (construction)
17.Hot-water-saving measures----
Table 3. The learning model structure and accuracy.
Structure of Baseline ModelRMSER2Structure of Endpoints ModelRMSER2
67-10-10-10-10-21.56 × 1030.82567-10-10-10-10-22.45 × 1030.998
67-10-10-21.29 × 1030.87567-10-10-23.45 × 1030.998
67-10-21.70 × 1030.78767-10-27.09 × 1030.996
67-3-21.31 × 1030.87167-3-21.75 × 1040.991
The bold numbers indicate the best learning model structure.
Table 4. The comparison of data imputation method.
Data Imputation MethodMean Squared Prediction ErrorAbsolute Value Error *
PCA–TSR2.78 × 105−1/+28/+4
Mean Imputation (MI)1.66 × 10⁶−348/−319/+1
Statistics Imputation (SI)3.23 × 10⁶−421/−394/−37
Note: * indicates the error of imputation data to real value for “energy use for heating and warm water”, “total energy use”, and “energy consumption per area” of Building #10.
Publisher’s Note: MDPI stays neutral with regard to jurisdictional claims in published maps and institutional affiliations.