Abstract
Industrial silica sand is a by-product obtained from the industries like paint, paper, rubber etc. It has a similar property with river sand and& M sand. This study explores the effect of high content of silica sand as a partial replacement for fine aggregate for concrete making in construction purpose. In this present research four types of silica sand from two different industrial units (coarser silica sand (VC and TC) and finer silica sand (VF and TF)) were used. The physical classification and morphology observation of silica sand through scanning electron microscope (SEM), energy-dispersive X-ray (EDAX), X-ray fluorescence (XRF) is examined. Fresh and hardened concrete properties were performed for the six sand samples, with two grades (M20 and M30) of concrete. No new compositions or phases were identified in silica sand concrete. Both fine and coarse silica sands were finer than river sand and M sand, as evaluated from the physical classification. The workability of silica sand mix at a fresh state improves the concrete performance up to 40%. The mix, which contains 80% coarser silica sand (TC) with 20% river sand, attained the maximum compressive strength of 34.5 Mpa and tensile strength of 3.5 Mpa at 28 days, which was the greatest of all the mixes. The combination of silica sand and river sand or M sand showed the superior impact of the concrete over the discrete concrete. SEM images showed the well-developed hydrated products like calcium silicate hydrate (CSH), calcium hydroxide (CH) and ettringite in all concrete mixes. It was observed from the XRD pattern that all concrete mixes containing silica sand have a high peak of quartz (SiO2), and calcium silicate hydrate (CSH) exhibits the formation of hydration products in the concrete. Similar stretching and bending patterns of silica sand concrete relates the pattern of nominal sand concrete as observed from Fourier-transform infrared spectroscopy (FTIR).
1. Introduction
Due to the scarcity of river sand used as a FA in concrete, their rising price in the construction industry paves the way to search for alternate materials. Now, manufactured sand (M sand) is used widely in construction purposes. However, it is obtained from crushing the natural rocks and stones [1,2,3]. Hence, the prolonged use of only M sand is not possible in future construction. Many researchers have done research on reused materials as fine and coarse aggregates in making concrete to reduce the use of virgin materials to a great extent. In M20 grade concrete, the addition of silica sand reduces the bending resistance by up to a 30% replacement, increases it by up to a 50% replacement, and finally, decreases it by up to a 70% replacement. The flexural and split tensile strengths are reduced with the increase of silica sand in concrete [1,2]. Fine silica sand passing through a 75-µm micron sieve was used as a partial replacement for cement in the M25 grade concrete up to 25% replacements. Fifteen percent silica sand replacement gave the better compressive, flexural and split tensile strengths compared with the control mix. This was due to the fine particle of sand acts as a filler and some active silica in the sand reacts with the cement and promotes the hydration products [3]. Similarly, the use of 6% silica sand as a cement replacement increases strength parameters greater than control mix. At 12% replacement level, concrete cost was reduced around 5% less than conventional concrete [4].
Due to its excellent heat conductivity, foundry sand is a premium natural silica sand used to create metal casting molds. This sand can be recycled and reused for many times in foundry. When it is not being used in the foundry, it can be termed as used/spend/waste foundry sand [5,6,7]. The used foundry sand was used as a fine aggregate in concrete up to 30% replacements. Increase of foundry sand addition increases the mechanical strength of the concrete due to the finer size fills the micropores forms the denser concrete. No change in workability of concrete was observed due to the minor additions [5]. Rapid chloride penetration resistance (RCPT) of concrete contains foundry sand of 20% and 30% exhibits less value than control concrete indicates the good permeability of concrete. H2CO3 depth of concrete emerges with increase of foundry sand addition in concrete mix over the curing ages. Reduced voids and the greatest distribution of C-S-H gel were visible in the microstructure of concretes made with foundry sand at 30% replacement [6].
The foundry sand which was obtained from Al casting industry was used as a FA for M25 grade concrete up to the 50% replacements. Similar properties of conventional concrete mixes are observed up to 20% replacement. Above the 20% replacement, the workability and strength are continuously reduced at higher replacements [7,8]. Adding of 50% waste foundry sand, the strength performance of M30 grade concrete is increased linearly. However, at major replacements, the strength tends to decrease [9]. The use of industrial by-products such as bottom ash and foundry sand as a FA up to 60% replacements with equal proportion leads to the elevate in H2O demand and decrease in compressive strength. RCPT values of all mixes are less than the control one. So, the addition of these industrial by-products leads to the good resistance for chloride penetration. X-ray diffraction pattern highlights the increase of SiO2 peak due to the addition of silica rich materials in the mix. A 30% replacement of foundry sand mixture exhibits the dense microstructure and up to 40% replacements all mixes exhibit compact structure with very less pores as viewed under the SEM [10,11]. Self-compacting concrete of M25 grade made with red mud and used foundry sand were investigated. Cement was replaced with red mud at 1%, 2%, 3% and 4% with 10% of fine aggregate (regular sand) was replaced with used foundry sand. Maximum compressive and flexural strength was achieved at 2% red mud with 10% foundry sand [12,13,14,15]. Similar strength was observed in SCC made with glass powder and 10% used foundry sand [16].
The effect of waste foundry sand (WFS) as a FA replacement of ready-mix concrete and their Mechanical, leaching (environmental) and microstructural properties were investigated. Some units (10%, 20%, 30% and 40%) of foundry sand have been used in place of regular sand. The performance of strength and workability is reduced when ordinary sand is partially replaced by WFS. This was due to the finer particle size of WFS led to the reduction of W/C gel in matrix. A 20% replacement of WFS gives the satisfied results of all mixes. Based on environmental view, leaching test has been carried out for regular sand and WFS at different pH levels. From this, it was observed that foundry sand can be used as a construction material in similar with regular sand [17,18,19,20]. Even though M sand has better interlocking property to enhance the concrete performance, presence of clay and more fines in M sand reduces the strength of concrete [21]. However, M sand will increase the strength when there are no organic impurities present and the wastage was less since it was gradation of sand was made as per the requirement [22]. While using M sand careful mix proportioning is required based on the changes in the physical properties with respect to river sand to attain the required strength [23]. Structural properties of the concrete elements will be improved with M sand with the optimum replacement level of M sand with river sand. The Ultimate load carrying capacity of RC beam was observed in concrete with M sand replacement as 70% for river sand [24]. M sand was replaced for river sand in self-compacting concrete [25]. Optimum replacement level of silica sand was arrived from fresh and hardened concrete properties [26]. A 5% replacement of silica sand with the river sand gives a better compressive and flexural strength [27]. Optimum silica sand replacement level for cement was found to be 6% by weight of cement [28].
Scarcity of river sand and causing legal issues for sand mining leads to explore the possibility of utilizing alternatives for river sand. In that way many researchers are attracted by the usage of industrial by products like steel slag, copper slag, foundry sand etc., for the replacement of river sand partially or completely other than the M sand. Silica sand is the most abundant mineral found in the earth and also it is obtained as a by-product from glass, paint, foundry industries etc. Silica sand contain a high silica content in the form of quartz SiO2 (mostly at inert condition). In this study, silica sand is obtained as a by-product during the kaolin clay beneficiation process from paint, paper, rubber, ceramic etc. from the Veli and Thonnakkal units in Trivandrum. Nearly around 5 lakhs ton of soil (silica sand) is generated during this kaolin beneficiation process. Both coarse and fine sands are produced in these two units. The obtained soil samples were having a clay content of around 18 to 20% and this material was repeatedly washed using water containing a small quantity of dispersants to remove the dispersible Kaolin. All the water washed sand samples have Kaolin content less than 5%. Hence the investigating soil (silica sand) samples named as VC—Veli Coarse sand, VF—Veli Fine sand, TC—Thonnakal Coarse sand and TF—Thonnakal Fine sand.
This paper aims to explore the suitability and optimum utilization of silica sand in concrete mix. Since this sand is rich in silica, studies like XRF, SEM and EDAX were performed to check whether reactive silica is present to confirm its inertness as a fine aggregate. Fresh and hardened concrete properties was examined for VC—Veli Coarse sand, VF—Veli Fine sand, TC—Thonnakal Coarse sand and TF—Thonnakal Fine sand as partial replacement for river sand and M-sand for M20 and M30 grade of concrete mix. Moreover, the effective replacement percentage of silica sand for fine aggregate is optimized through compressive and split tensile test of concrete. This research also included microstructural and energy dispersion studies on concrete samples to evaluate the C-S-H crystal and energy indemnification for all concrete mixes which partially replaced with silica sand (VC, VF, TC and TF). In addition, FTIR analysis was performed for all silica sand added to concrete mixes to confirm the stretching and bending patterns of silica sand concrete relates the pattern of nominal sand concrete.
2. Materials and Methods
2.1. Methodology
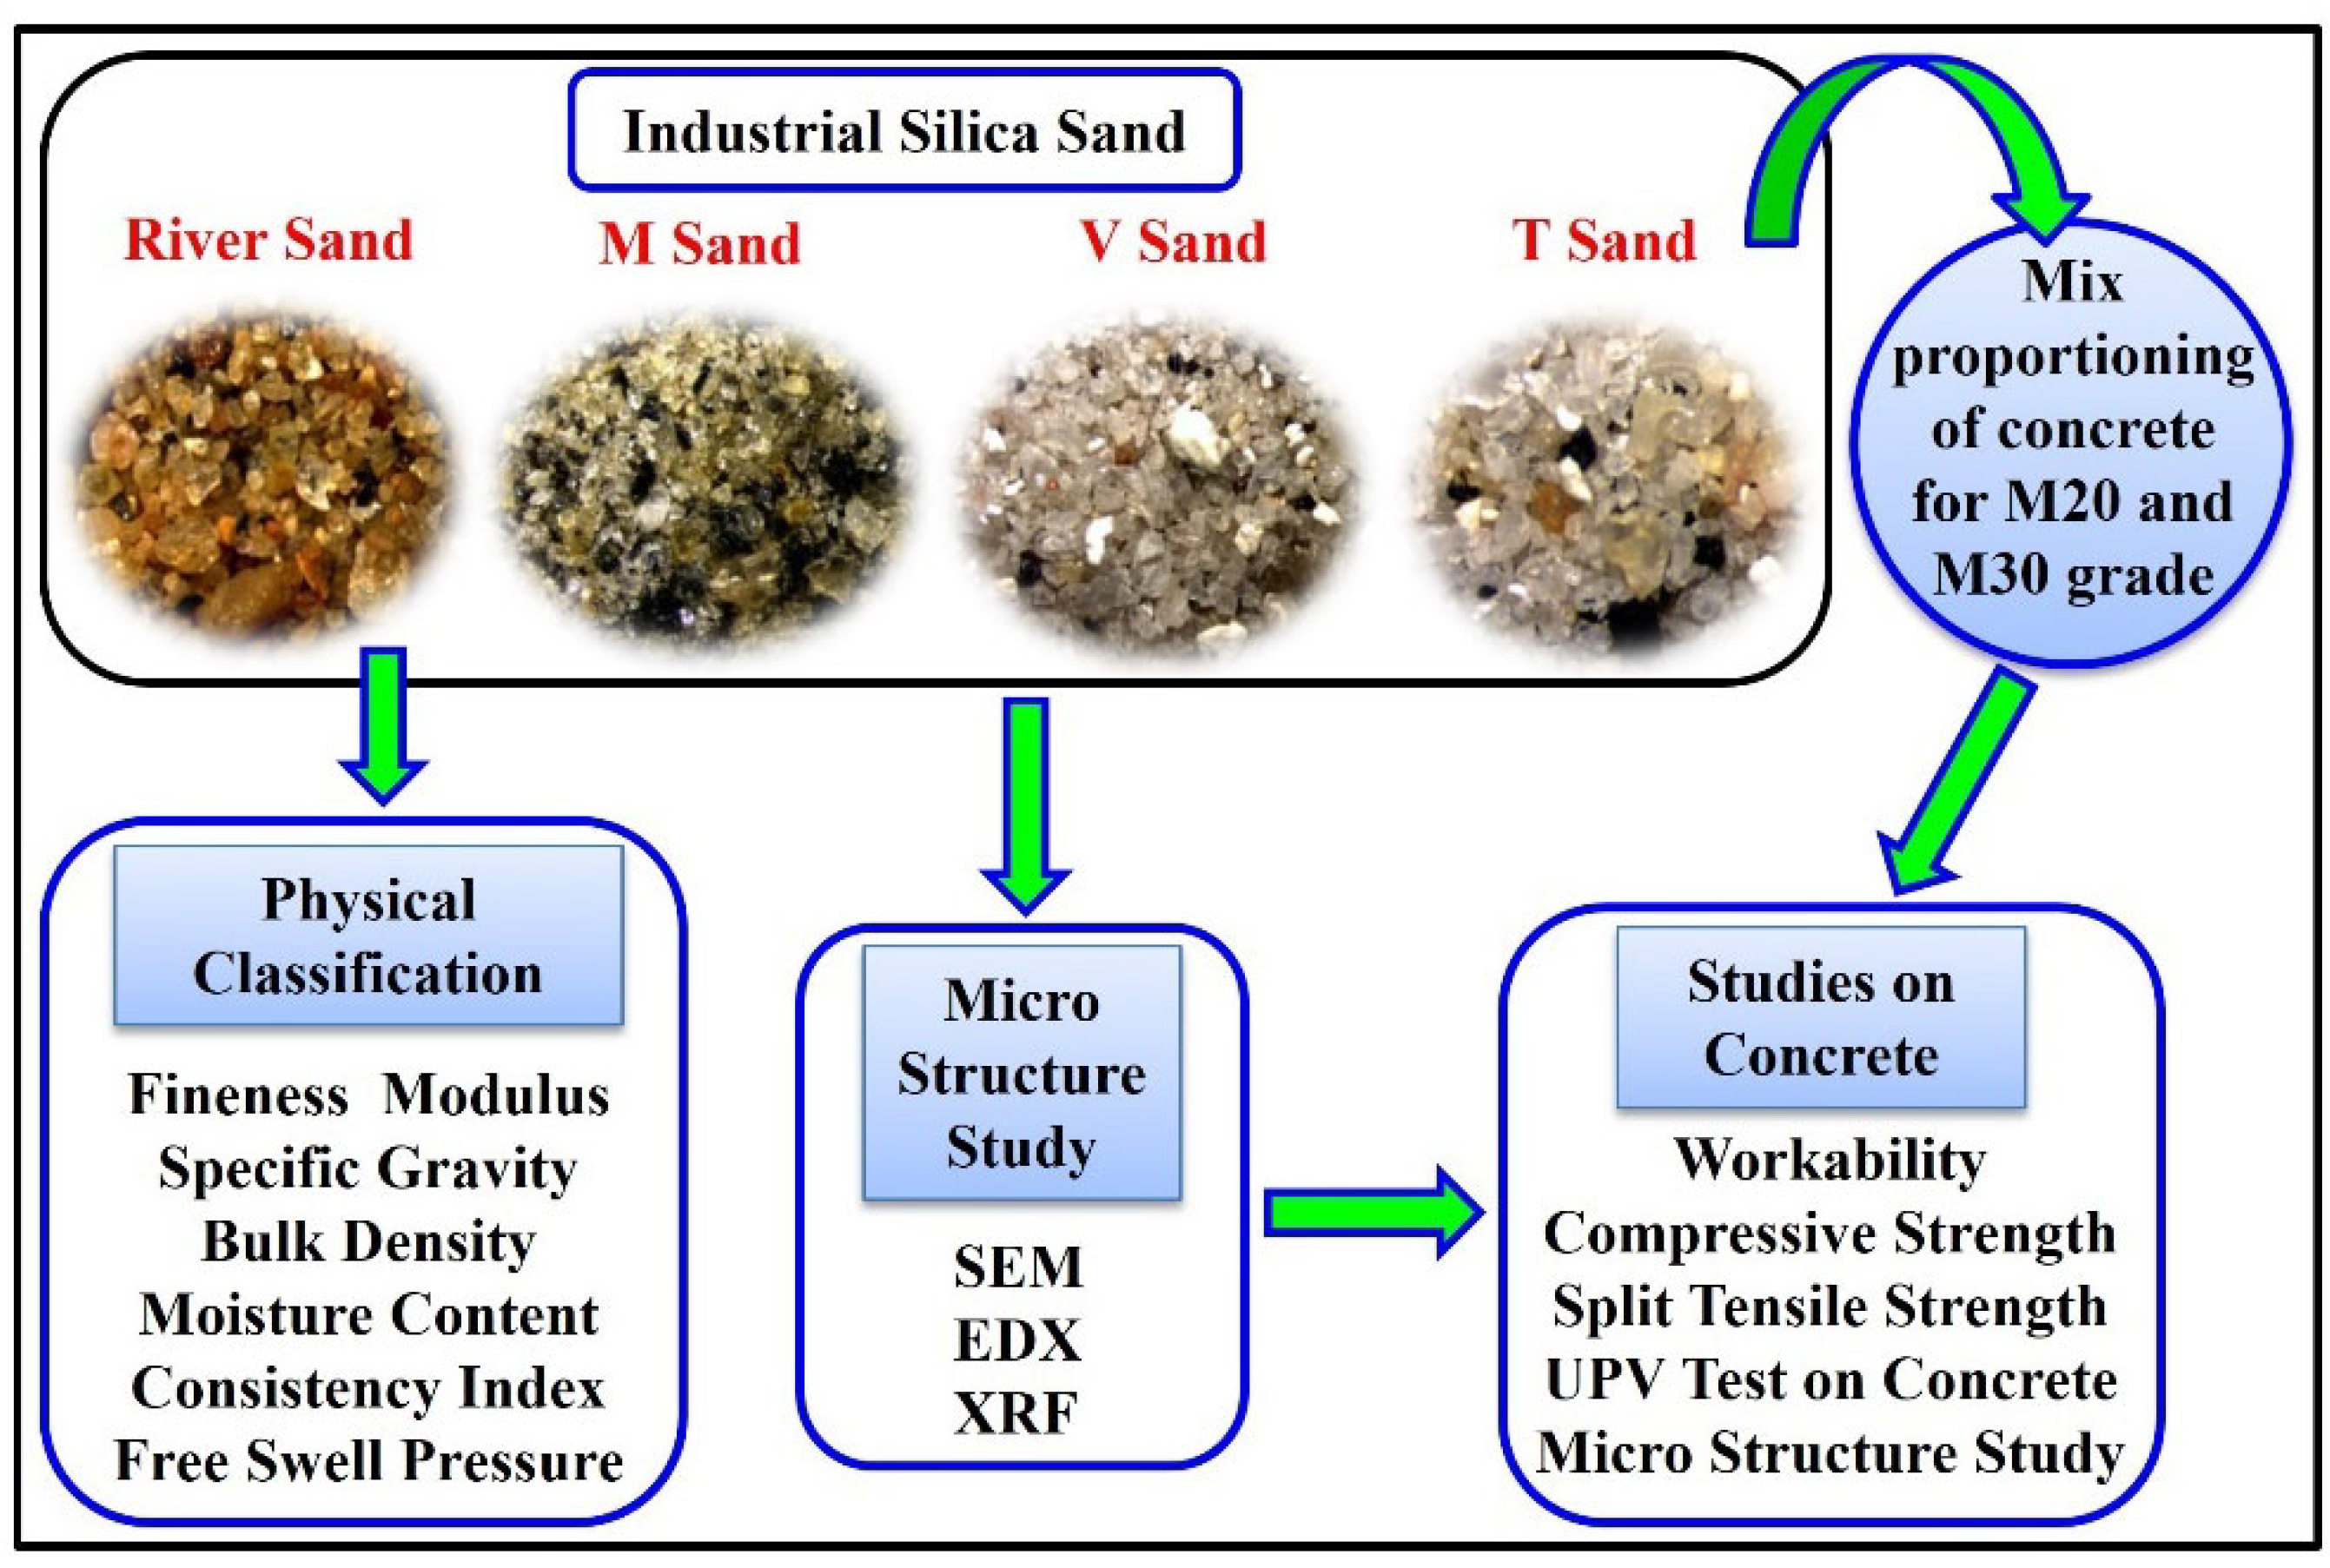
Figure 1 explains the frame work of the present study. Industrial silica sand samples such as VC—Veli Coarse sand, VF—Veli Fine sand, TC—Thonnakal Coarse sand and TF—Thonnakal Fine sand were considered for this study. Their performances are compared with river sand and M sand. This study aims at utilization of silica sand as partial replacement for fine sand or M-sand in M20 and M30 grade mix. The physical classification like fineness modulus, specific gravity, bulk density etc., were carried for all types of silica sand as per IS codal provision. The morphology and spectral analysis for different types of silica sand were analysis to confirm as same as river sand and M-sand properties. The workability and strength properties studies were conducted to examine the optimal replacement percentage of silica sand in concrete mix at different curing days for respective mix ratio. The characteristics studies like XRD, SEM and EDAX were performance on optimized silica sand added concrete mix after 28 days of curing.

Figure 1.
Investigation frame work.
2.2. Materials and Mix Proportions
PPC of 53 grades, according to IS: 1489-1991 [29], was used. River sand and Crushed Mineral sand were used as a reference FA to compare with the investigated silica sand samples. Natural gravel of maximum 20 mm size was used as a CA. Totally six mixes were formed as a preliminary investigation with complete utilization (100%) of two reference mixes (RS, MS) and four investigated mixes (VC, VF, TC, TF). Two concrete mix ratios were arrived for M20 and M30 grade. The mix proportions were calculated as per IS 10262:2019 [30] and the ratios are (1:1.43:2.25, Cement: FA: CA) with W/C ratio of 0.4 for M30 and for M20 the ratios are (1:1.5:3, Cement: FA: CA) with the water content 0.5.
2.3. Studies on Silica Sand
2.3.1. Physical Properties of Silica Sand
The sand samples were made to clean, free from adherent coating, and free from other deleterious substances taken for the physical tests. The number of samples for particle size analysis is taken as per IS 2386:1963 part I [31] clause 3.3. The gradation of the sand samples TF, TC, VF, VC, River sand (RS), and M Sand (MS) were carried out as per IS-383:1970 [32] Clause 4.3. The specific gravity test and bulk density were carried out as per IS 2720 part 3 [33]. Three trials were done, and the average values were taken for consideration. Moisture content of sand samples were calculated based atmospheric dry method and oven dry method.
2.3.2. Micro Studies on Silica Sand
Micro-level study of sand samples was studied under SEM analysis, EDX, XRF, XRD to determine their mineral phases and elemental composition [34,35]. Microstructure and the elemental composition of silica sands were studied and compared with the river sand and M sand using scanning electron microscope subjected to XL30 SEM equipped with an EDX Spectrometer for an X-ray dispersion elemental analysis. The range of scale used in the SEM analysis is two micrometers with a resolution of ×5000. Scanning Electron Microscopy emits a beam of high-energy electrons to the surface of a sample. In that, data is collected over a particular area of the surface of the sample and their corresponding magnified high-quality image is generated. By viewing that image, the physical characterization, texture and orientation of materials can be understood. The EDX detects the energy spectrum of the abundance materials which were in the samples by passing the X-rays.
X-ray fluorescence (XRF) was done for the sand samples to observe the predominant element concentration found in it. This testing is similar with the EDX where the X-rays excites the elements present in the sample and return back to their ground state. As by measuring their fluorescence, exact concentration of the minerals was identified. To confirm the presence of any amorphous minerals in the sand, XRD was done. In a cathode ray tube, X-rays are produced by burning a filament to produce electrons, accelerating the electrons with a voltage toward a target sample, and then hitting the target sample with the electrons. Due to the changes in the inner shell electrons of the samples, the peaks were created, and X-ray spectra are produced. The graph is plotted between the angle (2θ) from 10° to 90° range, at which the wave is diffracted, and their intensity range expands. The differences in diffraction spectrum of fine silica sand and coarse silica sand were observed using the D8 advance model X-ray diffractometer from Bruker, Germany, featuring a 2.2 kW Cu-anode ceramic tube with a scan step length of 0.02 degrees.
2.4. Tests on Concrete
2.4.1. Workability
One of the crucial factors in determining the uniformity of fresh concrete is workability. The most popular technique for assessing the consistency of the concrete is the slump test. In this research articles, the workability of the M20 and M30 grades of concrete with river sand, M sand, coarser silica sand and fine silica sand are measured by the slump cone apparatus as per IS: 1199-1959 [36].
2.4.2. Compressive Strength and Split Tensile Strength
Based on the M20 and M30 mix proportions, concretes were made. The 150 × 150 mm concrete cubes were cast for bending strength against compression and 150 × 300 mm concrete cylinders were cast for split-tensile strength test. The cube and cylindrical specimens were cast and then cured then for 28 days. The specimens were tested as per IS: 516-2004 [37] for finding compressive and tensile strength of M20 and M30 concrete.
2.4.3. UPV Test
Non-destructive testing such as UPV test was done to measure the concrete quality by ultrasonic pulse velocity method as per IS: 13311 (Part 1)—1992 [38]. The pulse experiences several reflections inside the various material phases when it is transmitted into the concrete from a transducer. Longitudinal, shear, and surface waves combine to form a complicated system of stress waves. The fastest waves to be detected by the receiving transducer are the longitudinal waves. The distance travelled by the waves are noted and their velocity is determined. When concrete is made with poor quality materials, the distance travelled by the waves are longer due to the crack, void or flaw inside the concrete. Hence, the good quality concrete has a higher velocity, and the poor-quality concrete has a lower velocity. Quality, density and modulus of elasticity of the aggregates plays a major role in UPV test.
PUNDIT apparatus is used to test the concrete cubes. Concrete cubes cured at 28 days are taken and placed at the flat position. Transmitting and receiving transducer are placed at the opposite sides of the concrete surface. This method of testing is called direct method. The time travel of the ultrasonic pulse waves is observed in the apparatus in microseconds and their velocity is calculated manually in km/sec.
2.4.4. Microstructure Studies on Concrete
Microstructure studies on concrete powder samples like SEM, EDX, and XRD and FTIR were performed to understand the behavior of silica sand in concrete microstructure [39,40,41,42,43,44]. Twenty-eight days cured concrete was broken and coarse aggregate was removed. Then it was powdered and sieved through 75 µm was taken for microstructural analysis. Similar equipment’s as discussed in Section 2.3.2 were used to study the characterization of optimized silica sand added mix concrete mix. FTIR is done to observe the similarities in the functional group of the concrete samples. The FTIR results are subjected to IR Affinity-1 spectrometer, Shimadzu Japan [45,46,47]. It is equipped with a DLATGS controlled by IR Solution 1.60 and appraised under ATR mode. Sixteen scans are recorded over the range 4000–400 cm−1 with a spectral resolution of 4 cm−1. The spectra of powder samples are corrected with a linear baseline.
3. Results and Discussion
3.1. Physical Classifications
3.1.1. Fineness Modulus
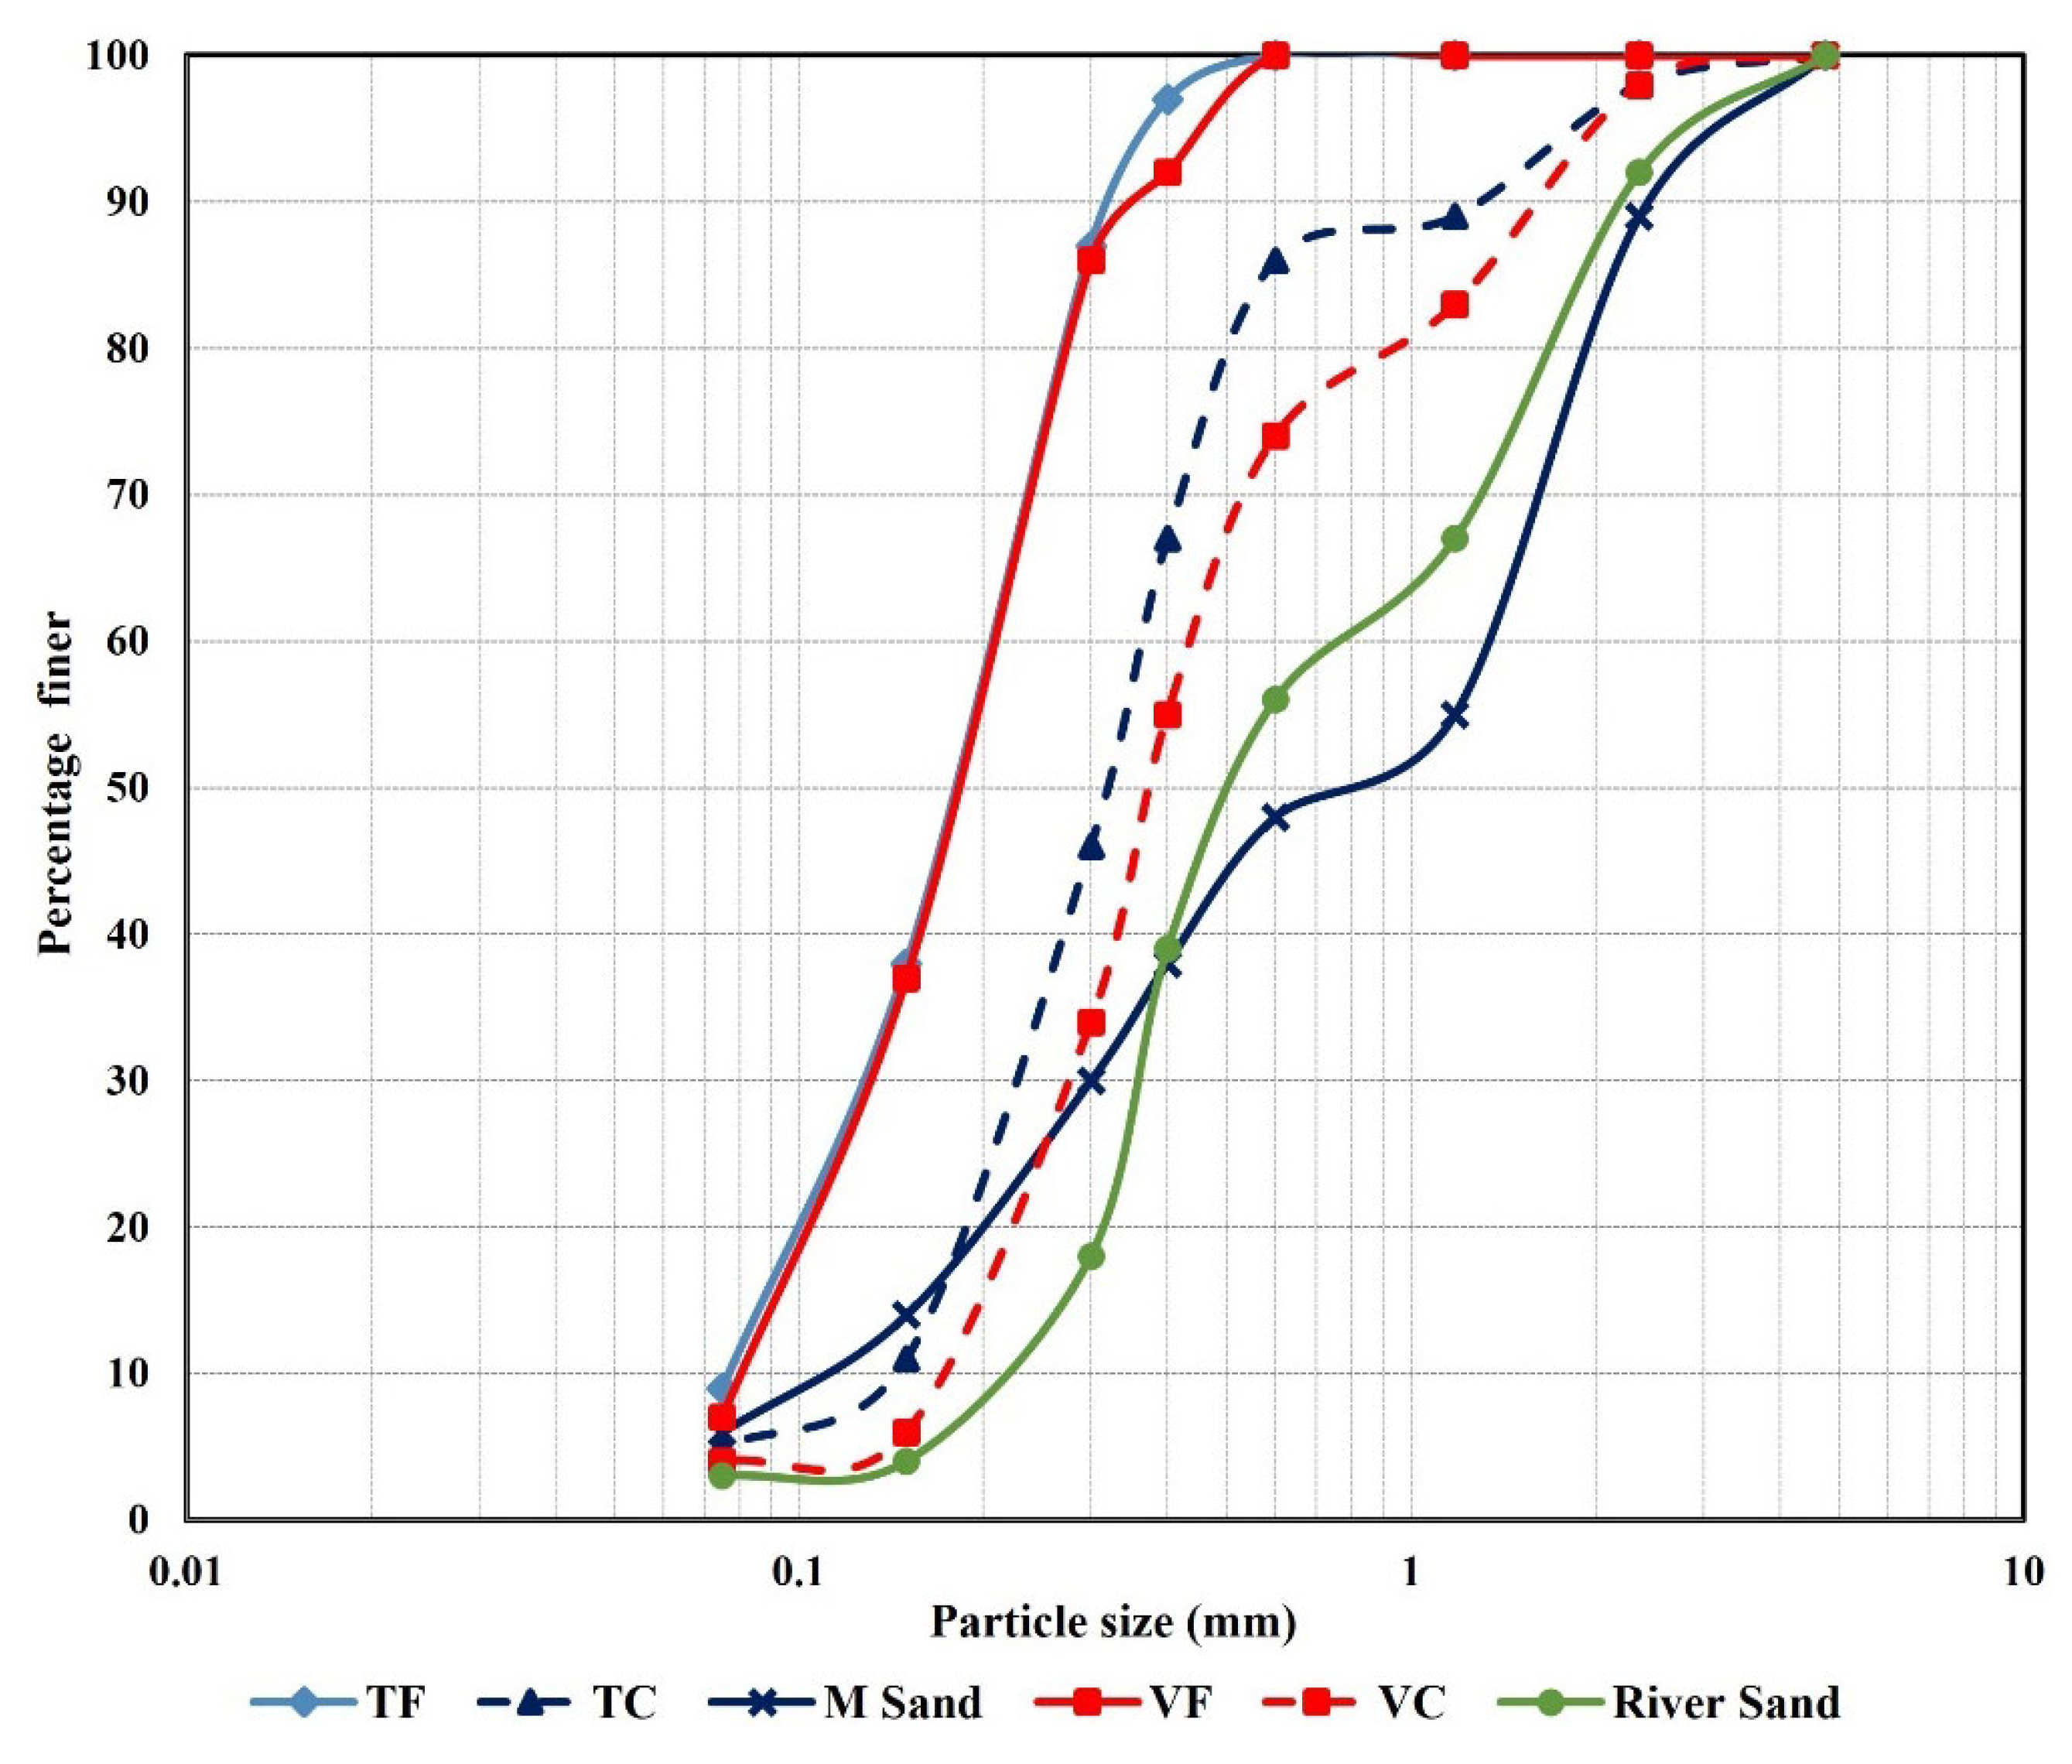
PSD of six sand samples was plotted in Figure 2. It is observed that the fine samples (VF, TF) having more fines, almost 98% of sand particles will be less than 0.5 mm and the uniformity will be more in the rage of 0.2–0.35 mm. For the sample VC and TC, it is close to the river, and M sand particles at the rage of 0.45–0.1 mm and the presence of particles more than 1 mm are much less; this shows that presence of more fines in VC, TC classification also. Based on the particle size grading, fineness modulus is calculated. Fineness Modulus (F.M) value is a ready index coarseness or fineness of the aggregates. The fineness value of sand samples is given in Table 1.
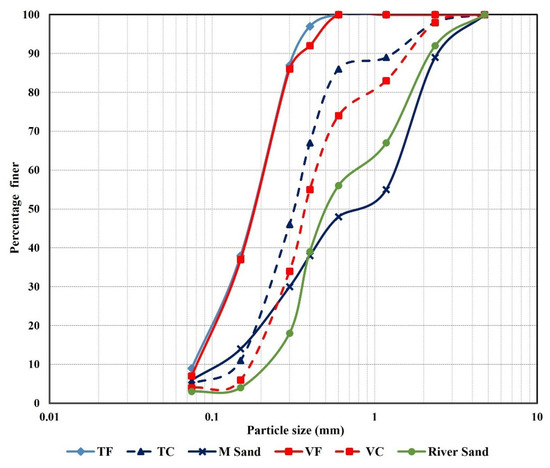
Figure 2.
Particle size analysis.

Table 1.
Fineness modulus of sand samples and classification as per IS 383-1970.
From the results, it was observed that the sand sample VF and TF fall under very fine category. The sample TC and VC falls under medium sand category. Generally, very fine sands were not used in concrete.
3.1.2. Specific Gravity and Bulk Density
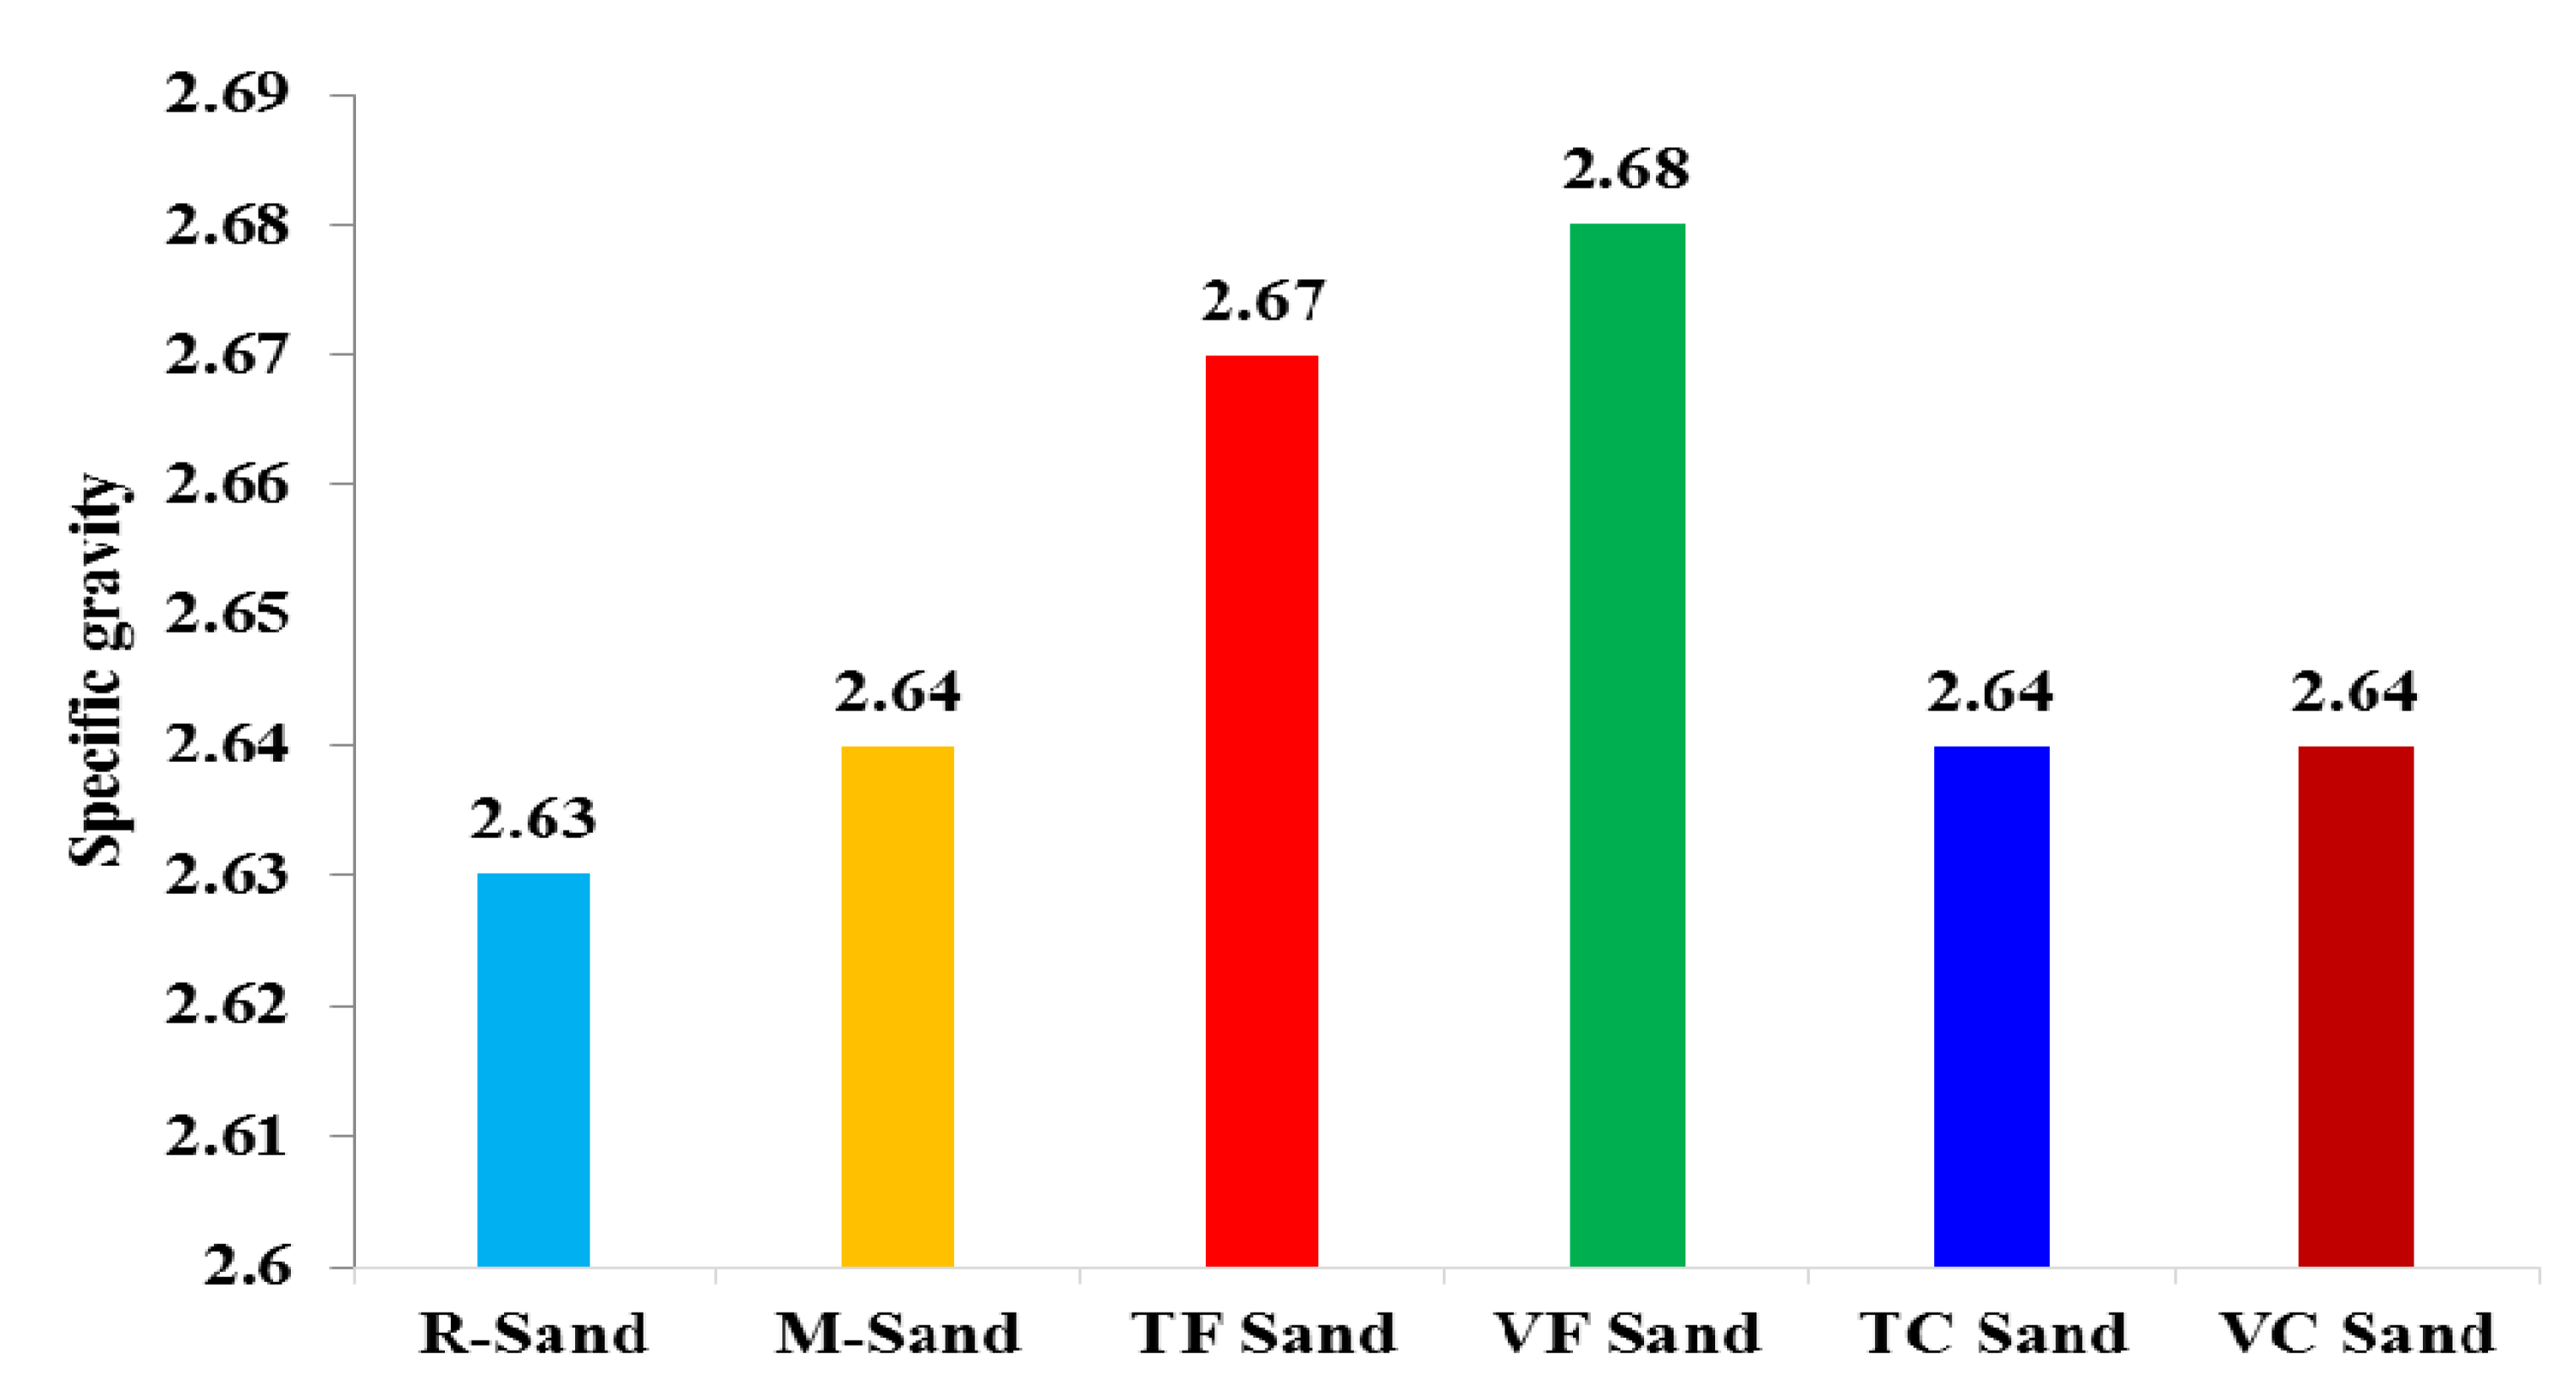
This test is carried out as per IS 2720 part 3 [32], and the specific gravity values of all samples (VF, TF, VC, TC) lie under the range of 2.63–2.67, as in Figure 3. Bulk density of silica sand lies between 1730 and 1750 kg/m3 while river sand and M sand have less bulk density as in Figure 4. This is due to the finer sand fills the pores than coarser and increases the density.

Figure 3.
Specific gravity of sand samples.
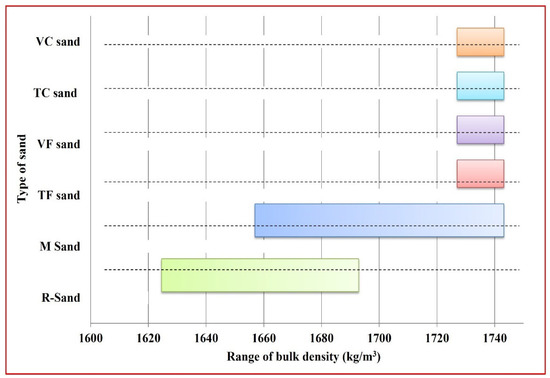
Figure 4.
Bulk density of sand samples.
3.1.3. Moisture Content, Consistency Index and Free Swell Pressure
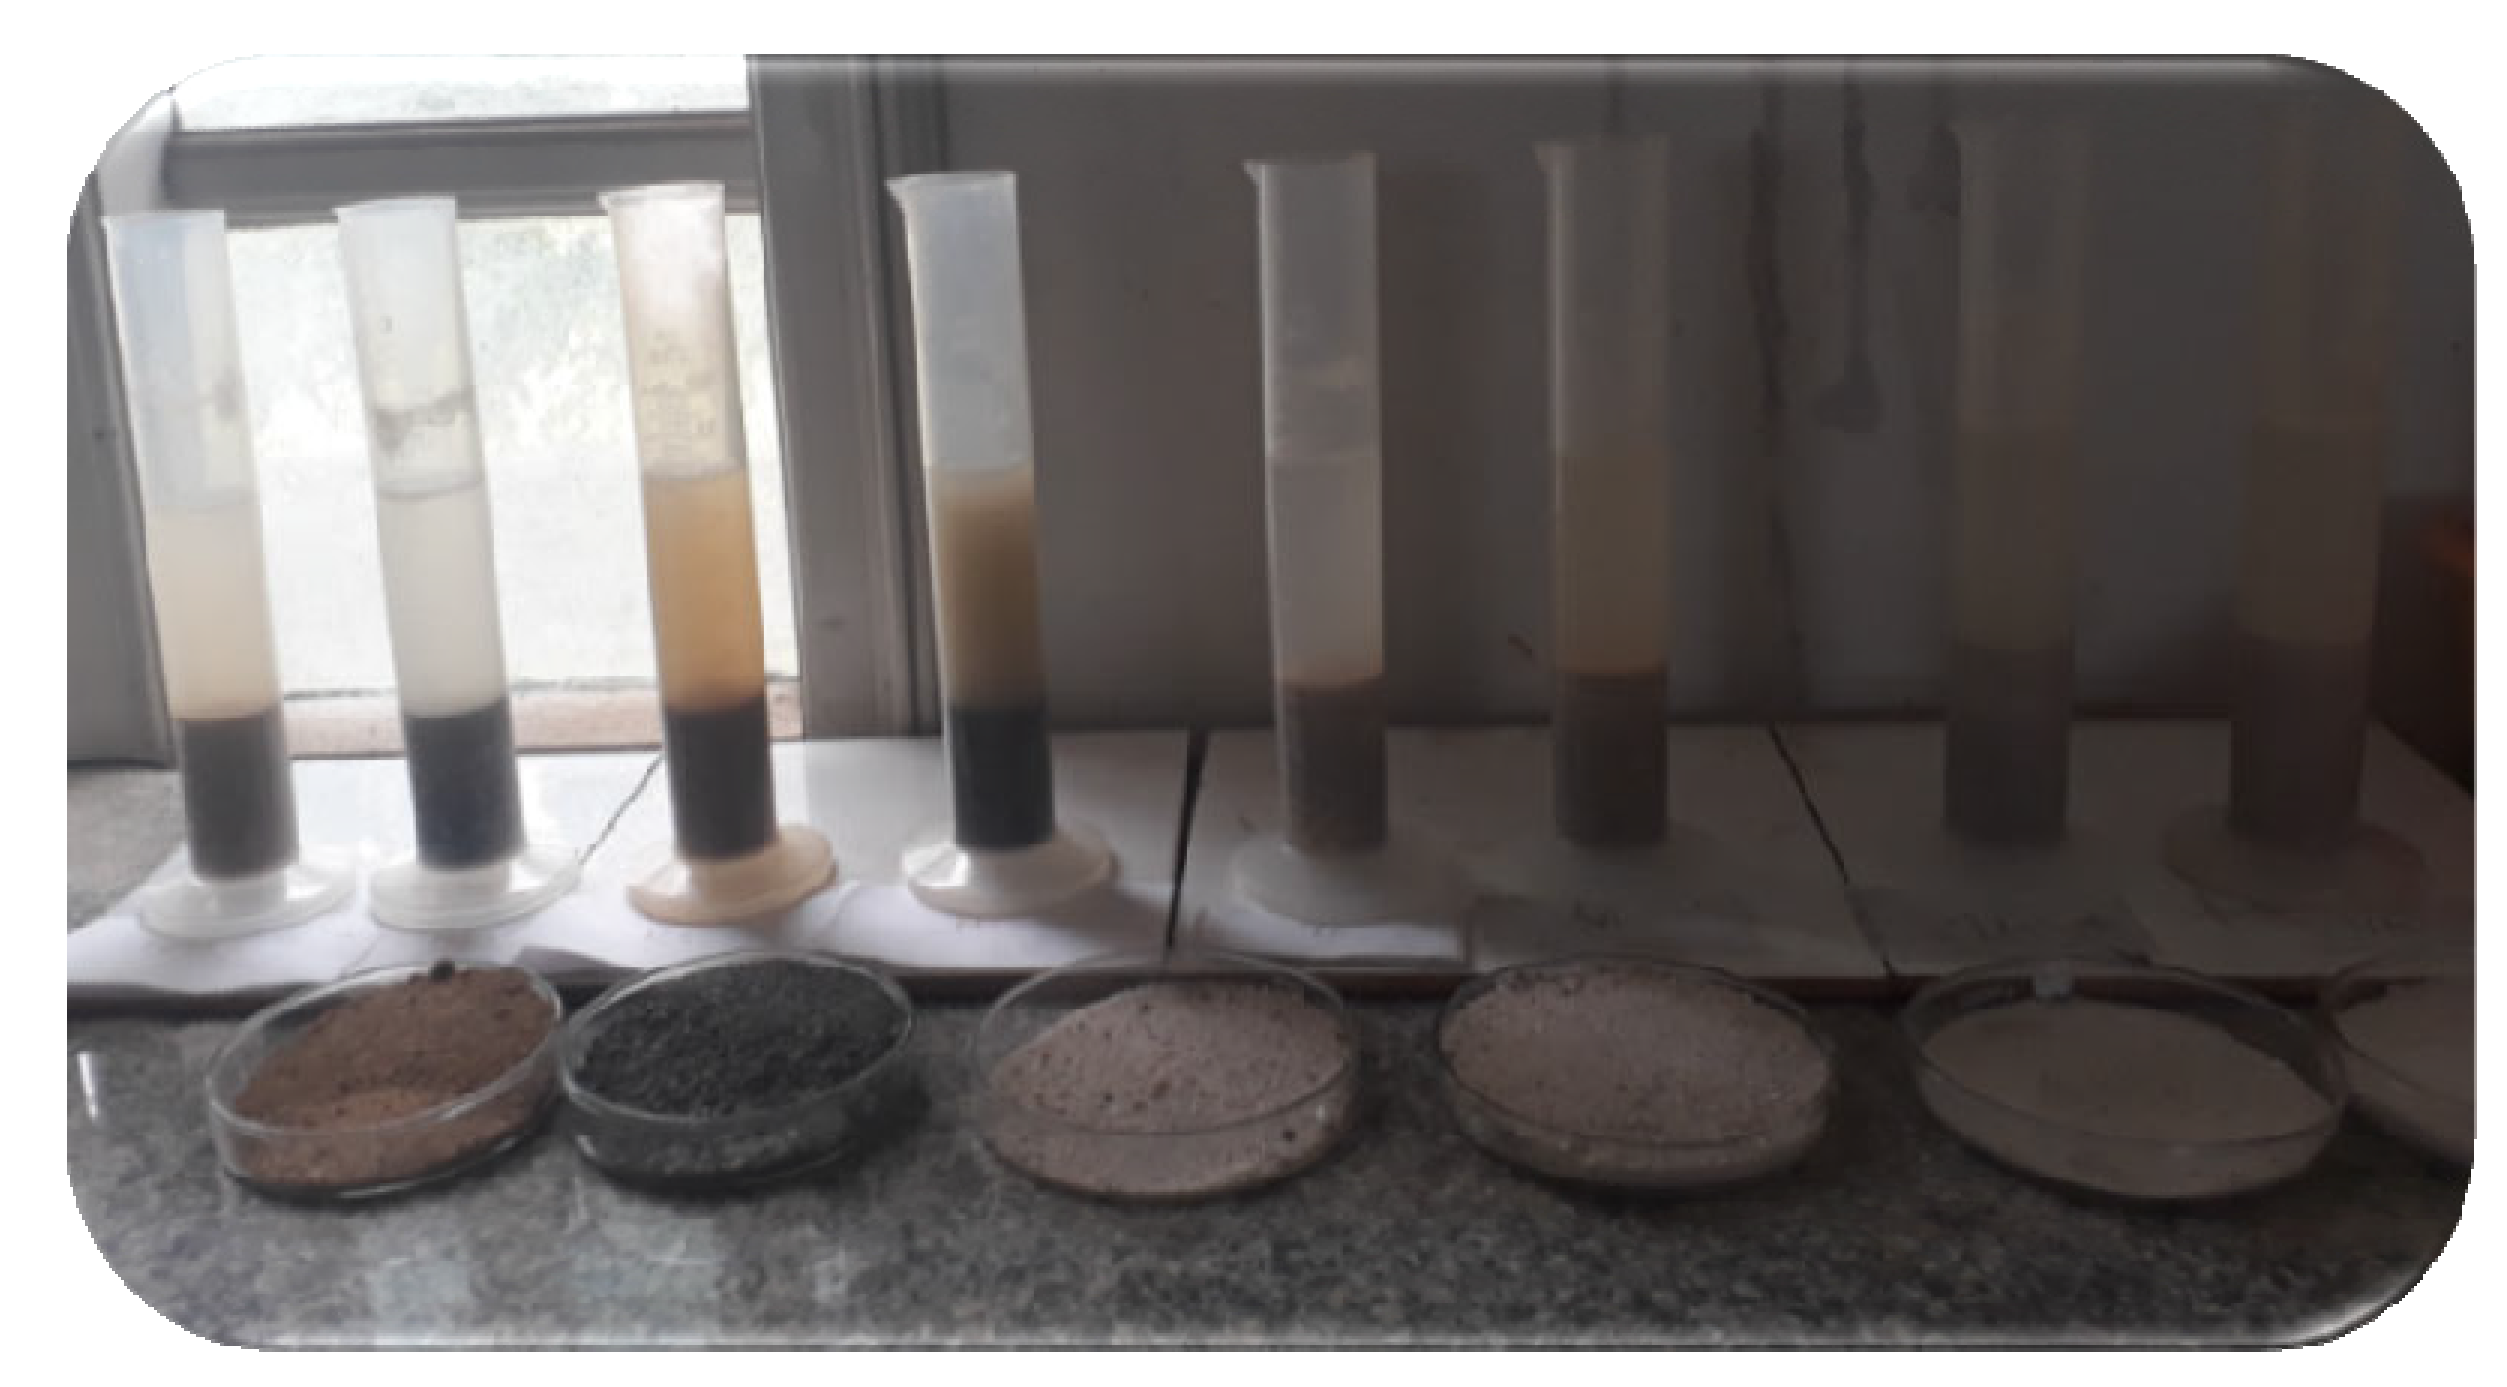
The raw sand sample has more than 30% moisture content since the process involving in obtaining of sand samples. The samples dried in atmospheric temperature for 2 to 3 days to bring down the moisture content to 4–8%. If oven drying method (temperature 80 °C) is adopted it takes 16 to 24 h to reduce the moisture content to 2%. The sand samples have initially surface moisture content, and it was removed by sun dry method. Care should be taken while making concrete and moisture absorption will reduce the workability of concrete. Consistency test is carried out as per IS 2720:1985 part 5 [48] to identify the influence of fine sand particles. From the consistency test results, it was observed that the number of blows is very less (almost 8–12 based on moisture content) for all samples (VF, TF, VC, TC) and it showed the absence of cohesiveness in the given samples. The pH test on sand samples was carried out as per IS 2720:1987 part 26 [49] to find the presence of acidic or alkaline content, and the results showed that the sand samples were free from acidic and alkaline content. Swell pressure test was carried out as per IS 2720:1985 part 40 [50] to find the influence of any swelling effect (bulging of sand) as shown in Figure 5. From the result, it was observed that the swelling of soil was not happen and there was not any influence of fines (clay) and turbidity in the washed sand particles.

Figure 5.
Free swell analysis of sand samples.
3.2. Microstructure of Sand Samples
Figure 6 shows the normal image and microscopic image of the sand samples. R sand is rounded smooth crystals in a shape, and M sand has a surface of angular shaped crystals. Silica sand samples are subangular in shape.
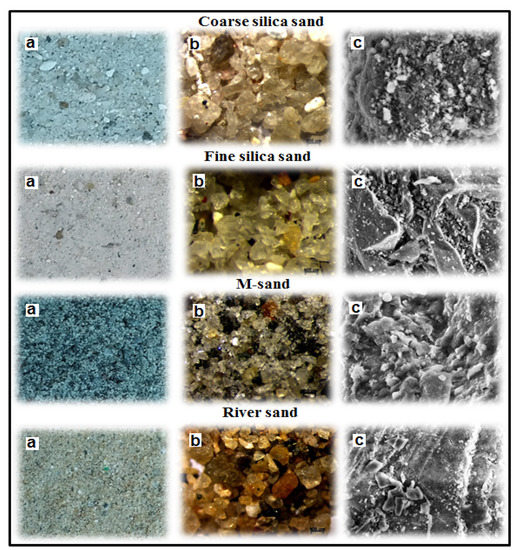
Figure 6.
Image of sand samples (a) normal, (b) microscopic, and (c) SEM.
Figure 7 and Figure 8 show the SEM images and EDX spectra of fine silica sand, coarse silica sand, river sand and M sand, respectively.
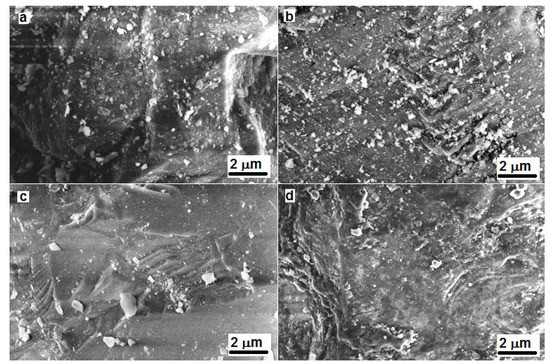
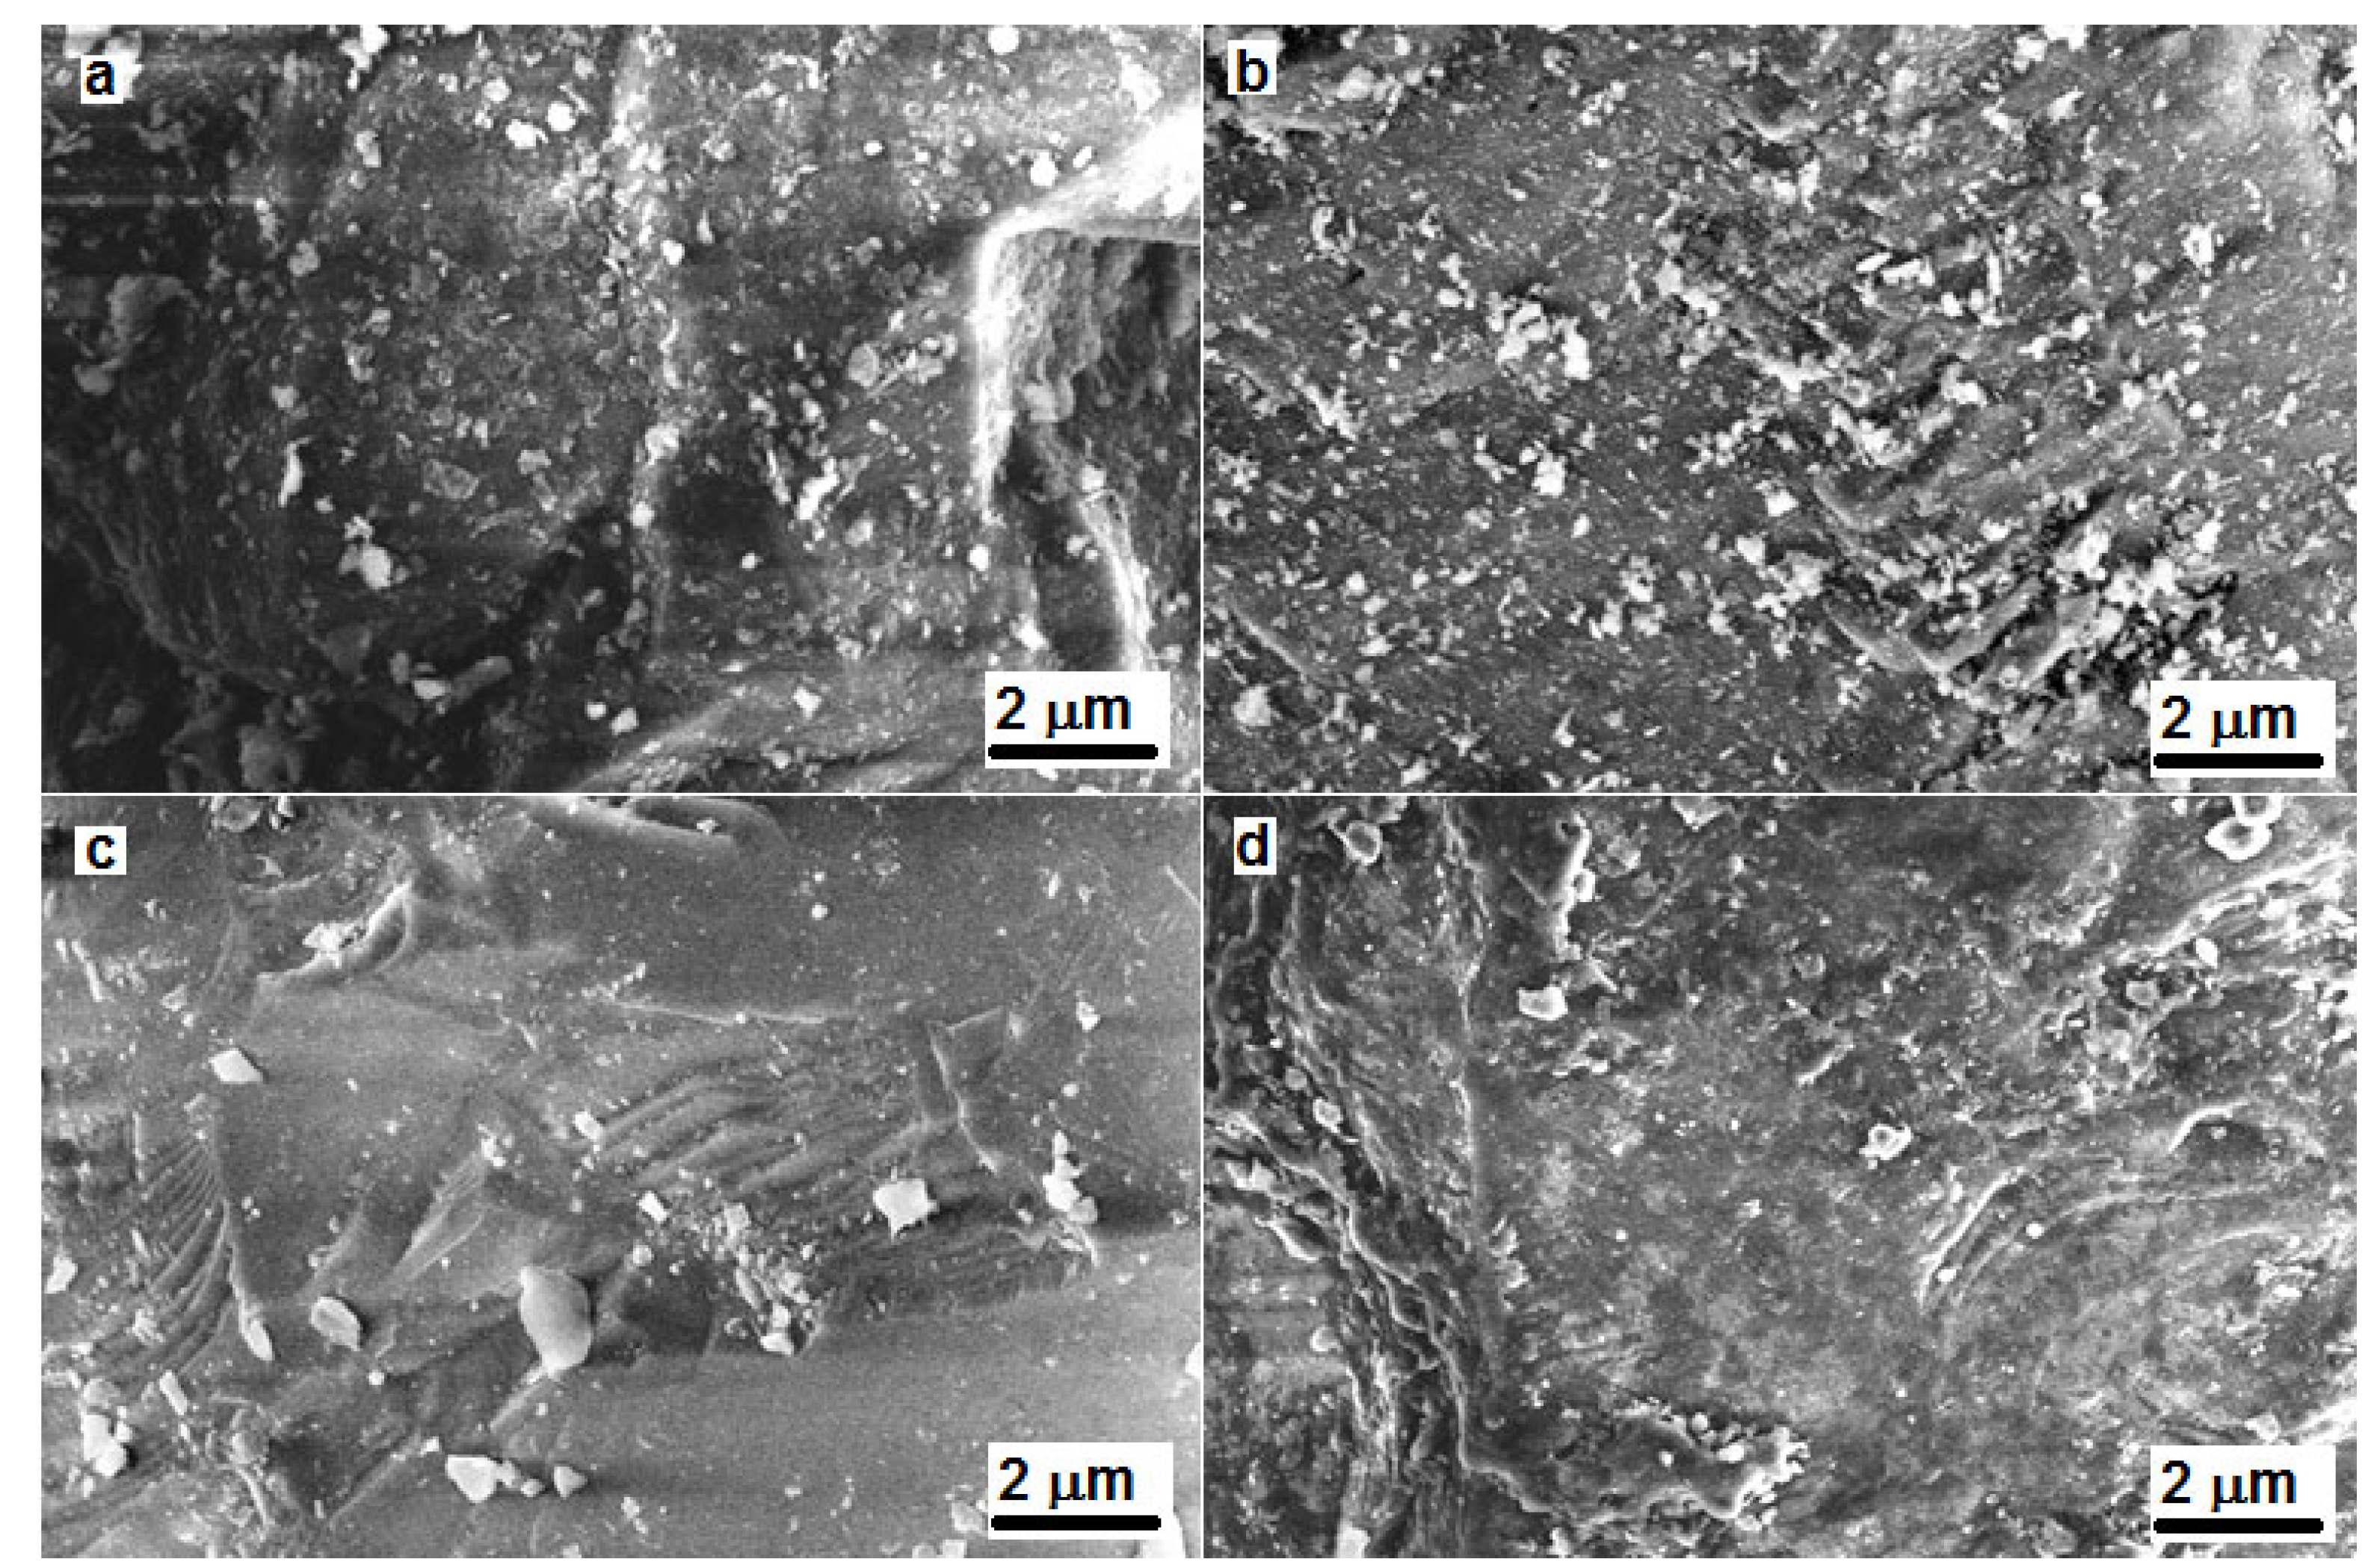
Figure 7.
SEM images of (a) fine silica sand, (b) coarse silica sand, (c) river sand and (d) M sand.

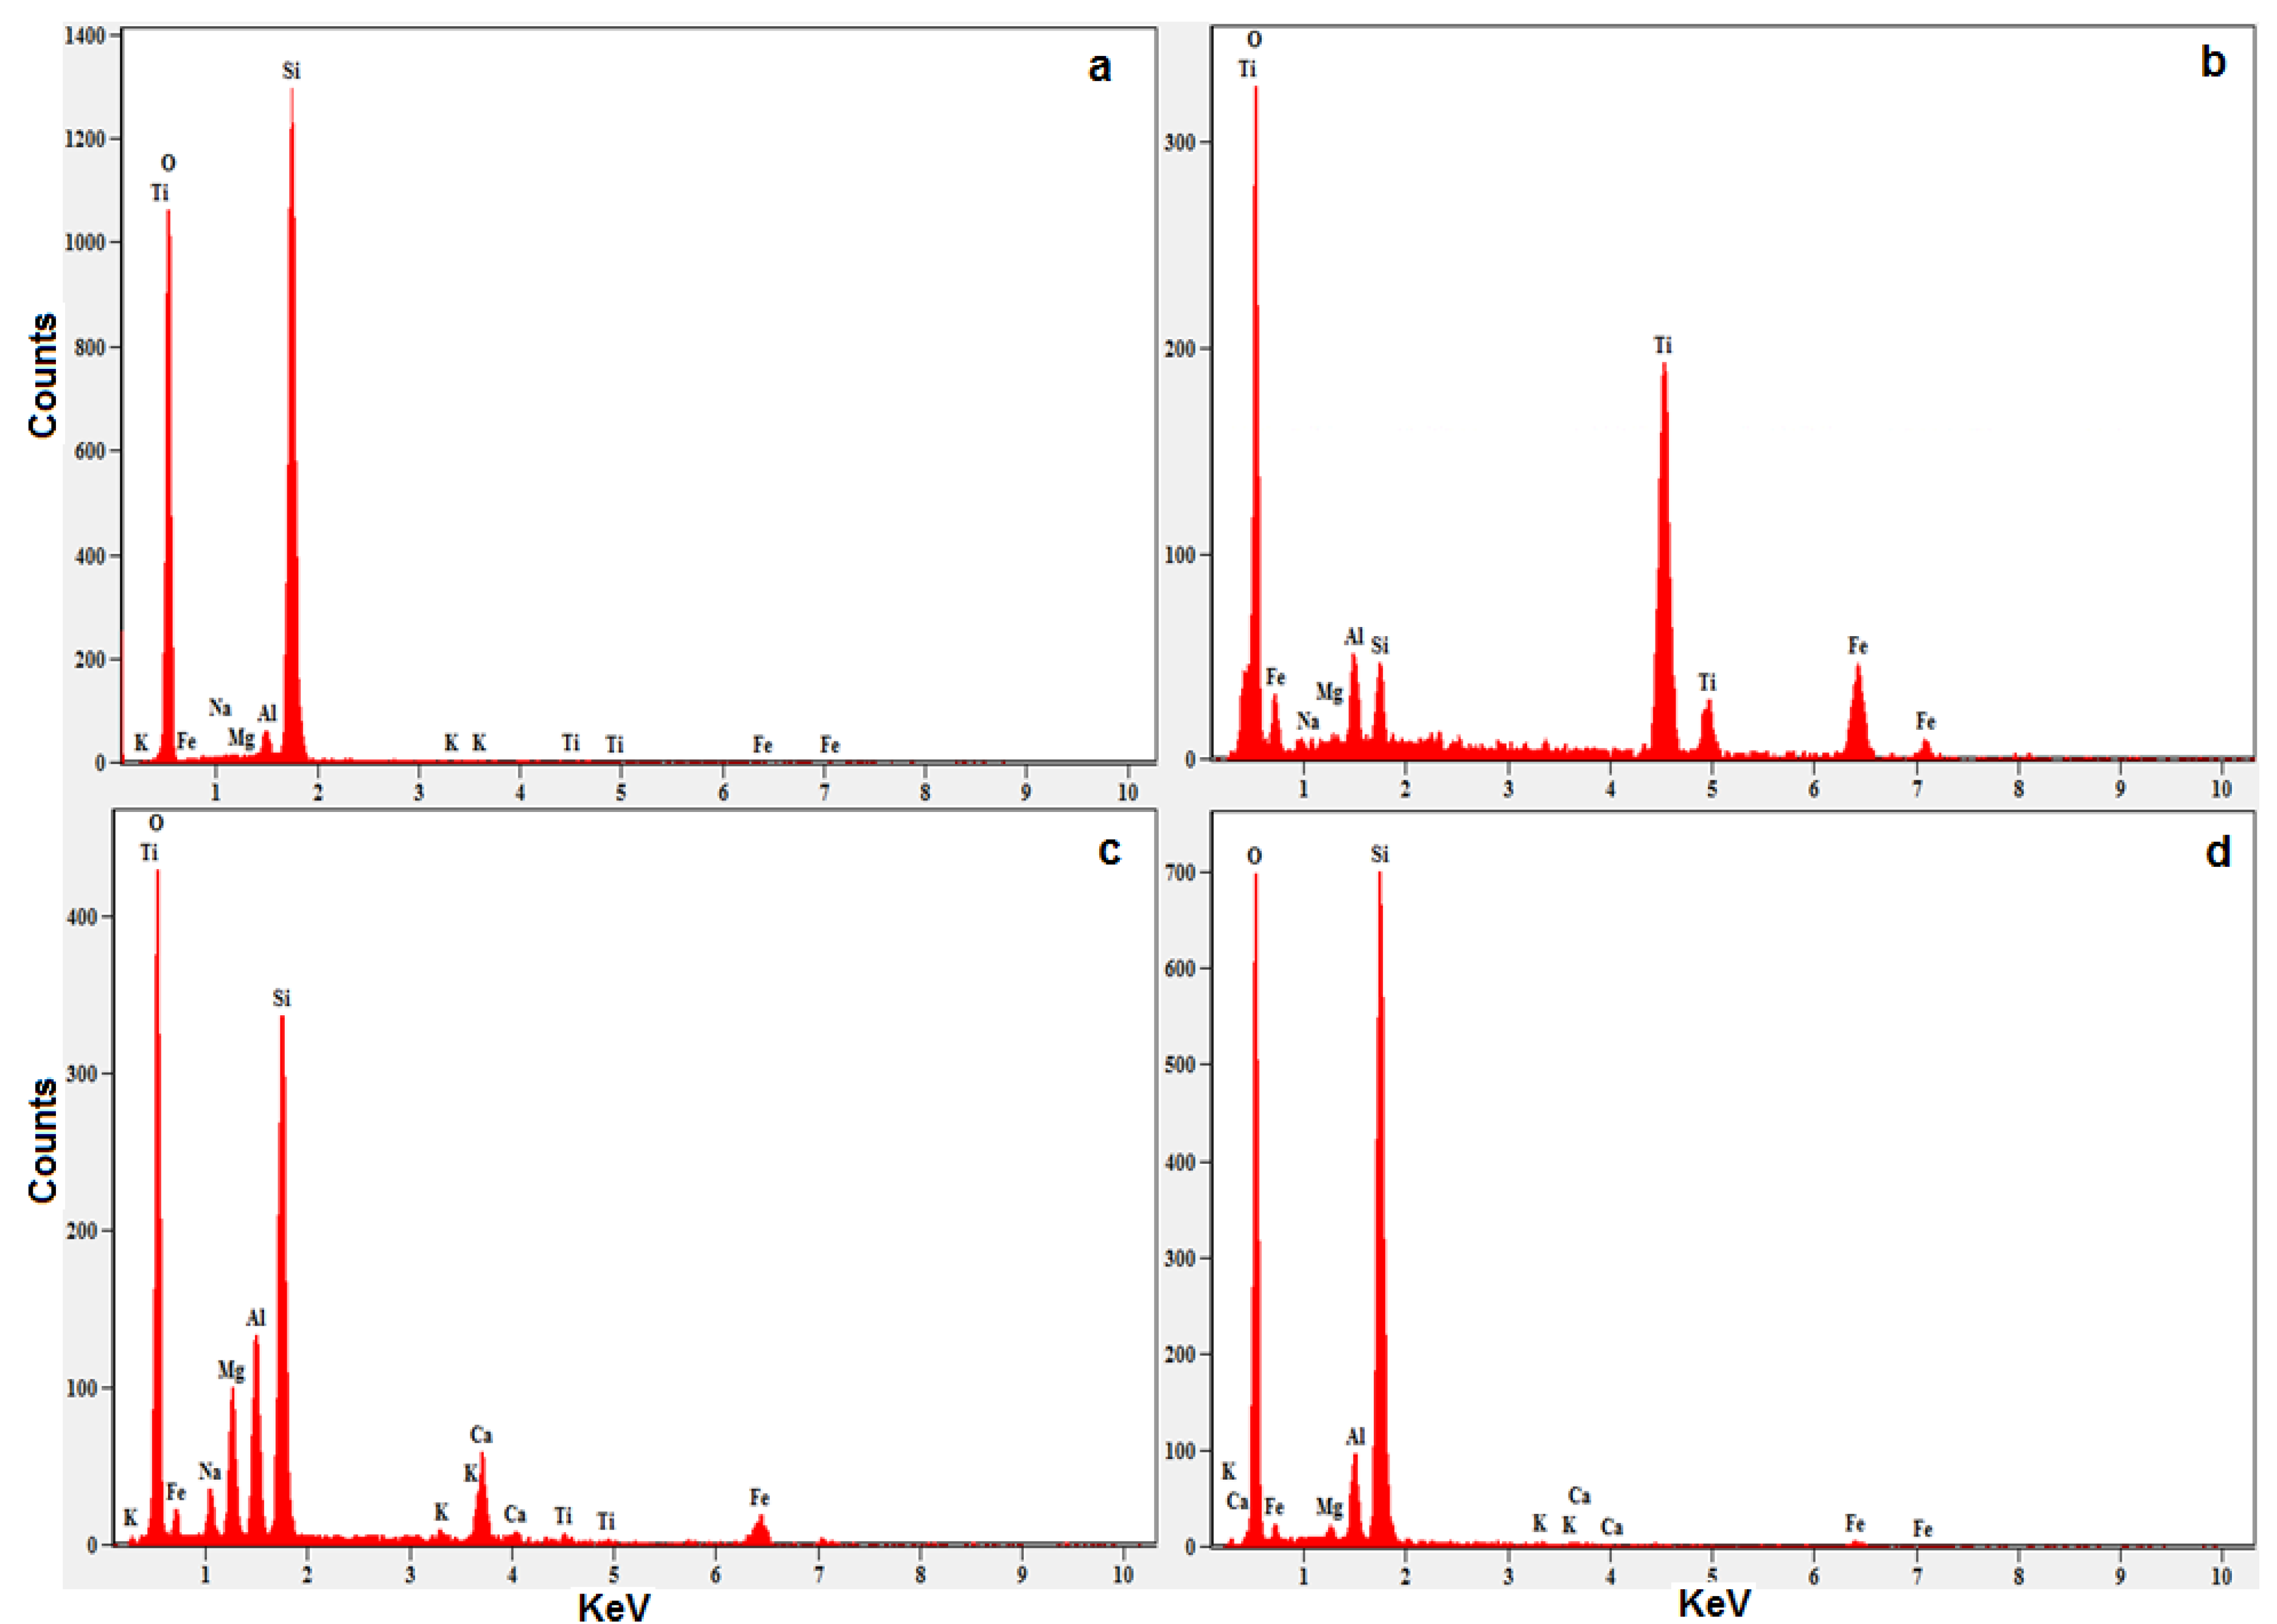
Figure 8.
EDX spectra of (a) fine silica sand, (b) coarse silica sand, (c) river sand and (d) M sand.
From Figure 7, it was noted that the SEM image of fine silica sand exhibits denser structure and also has more quartz (SiO2) content than others. The SEM image of coarse silica sand exhibits some irregular subangular particles and their microstructure was similar like M sand. Iron-titanium (FeTiO3) minerals were maximum than quartz (SiO2). Coarse silica sand contains considerable number of other elements such as calcium, aluminum, magnesium etc. which were not detected much in finer silica sand. The sand samples which have more silica content also does not contain the high quantity of amorphous silica (which were in secondary cementitious material) mostly these silica elements were in inert phase only. Hence, it does not contribute much to the hydration process of cement. Greyish white color of silica sand represents the presence of finer fragments of iron-titanium oxides and quartz minerals in it. Hence, this contributes the fineness to the silica sand samples than R sand and M sand. The use of only denser sand in concrete reduces the strength due to less particle size distribution, lower the formation of cement gel and leads to the reduced particle packing density [5,6,17,39]. From Figure 7c, it was observed that the irregular rounded river sand was obtained from the natural weathering of rocks. Hence it has well distributed sand particles. From Figure 7d, the regular angular shaped M sand was obtained by the man-made weathering of rocks which leads to denser and uniform fragments than river sand. By viewing EDX data, river sand contains major of Iron-titanium (FeTiO3) minerals than quartz (SiO2) while in M sand there was no titanium present in it. River sand is obtained from the river beds where the plenty of various other minerals are deposited along with quartz (SiO2) [39,40,41].
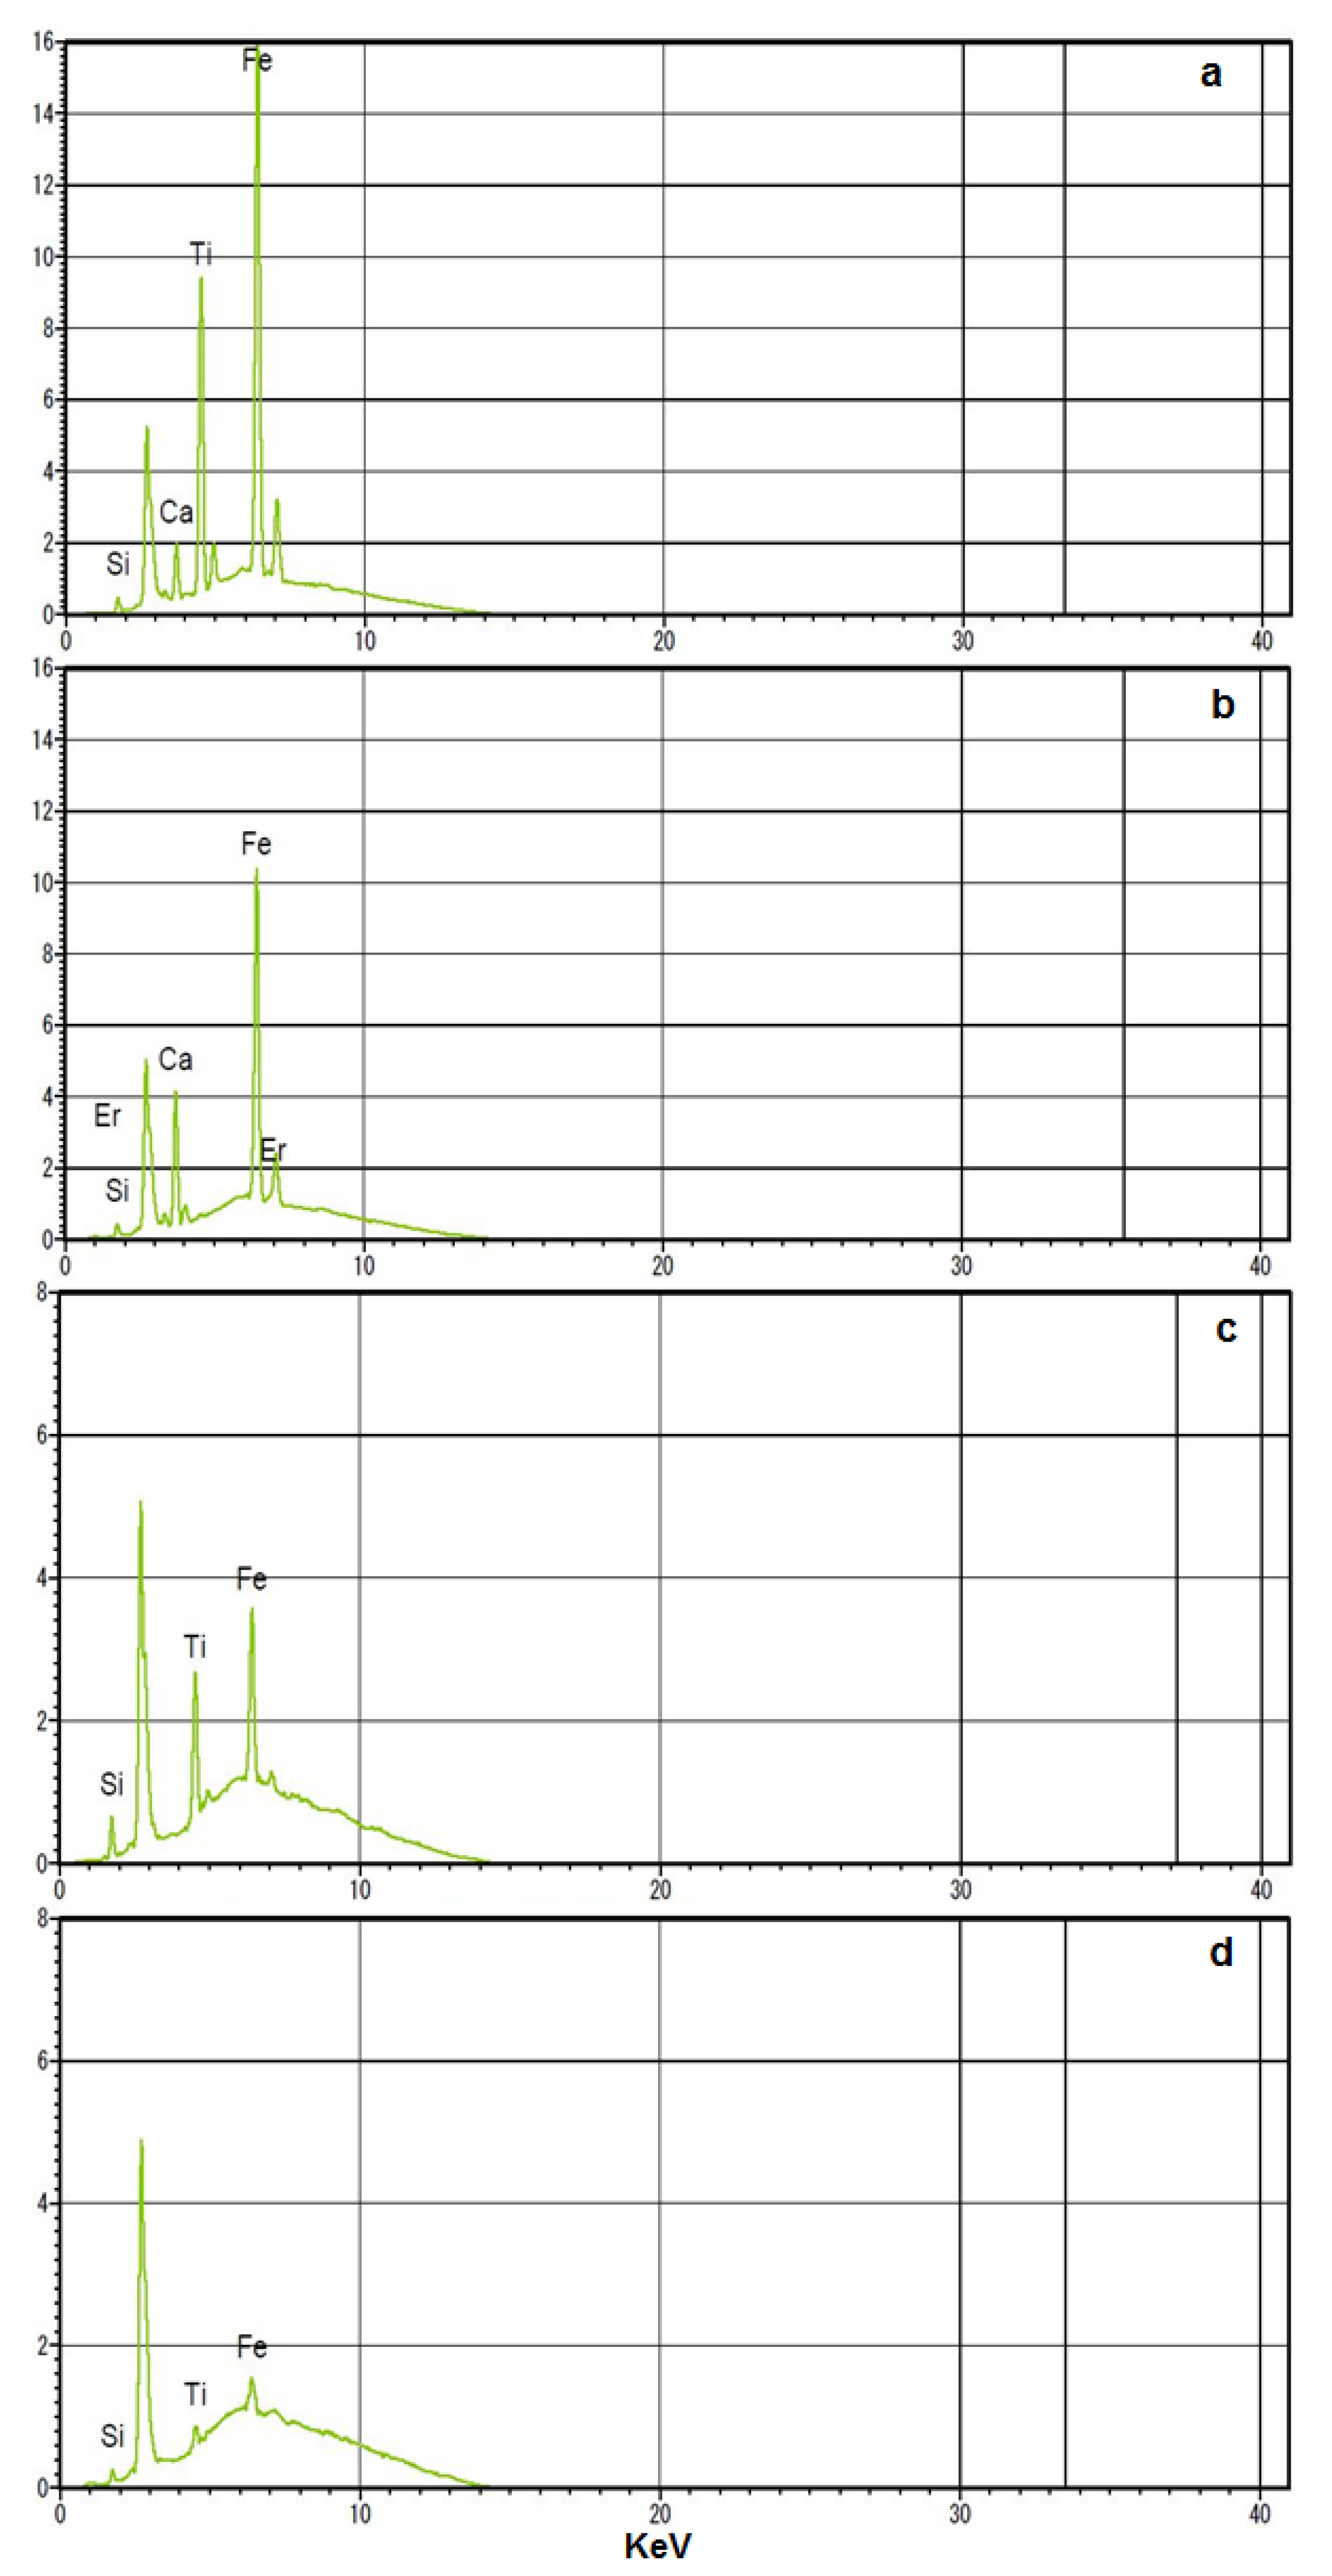
Figure 9 show the XRF analysis of river sand, M sand, fine silica sand and coarse silica sand respectively. Table 2 shows the elemental composition of all the four sand samples. Major elements of iron and titanium were present in the river sand while in M sand considerable amount of iron was present without any titanium content.
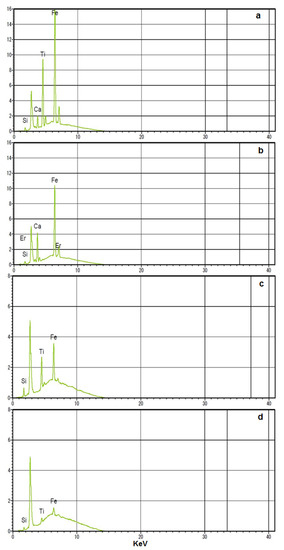
Figure 9.
XRF analysis of (a) river sand, (b) M sand, (c) fine silica sand, and (d) coarse silica sand.
Table 2.
Elemental composition of sand samples (XRF).
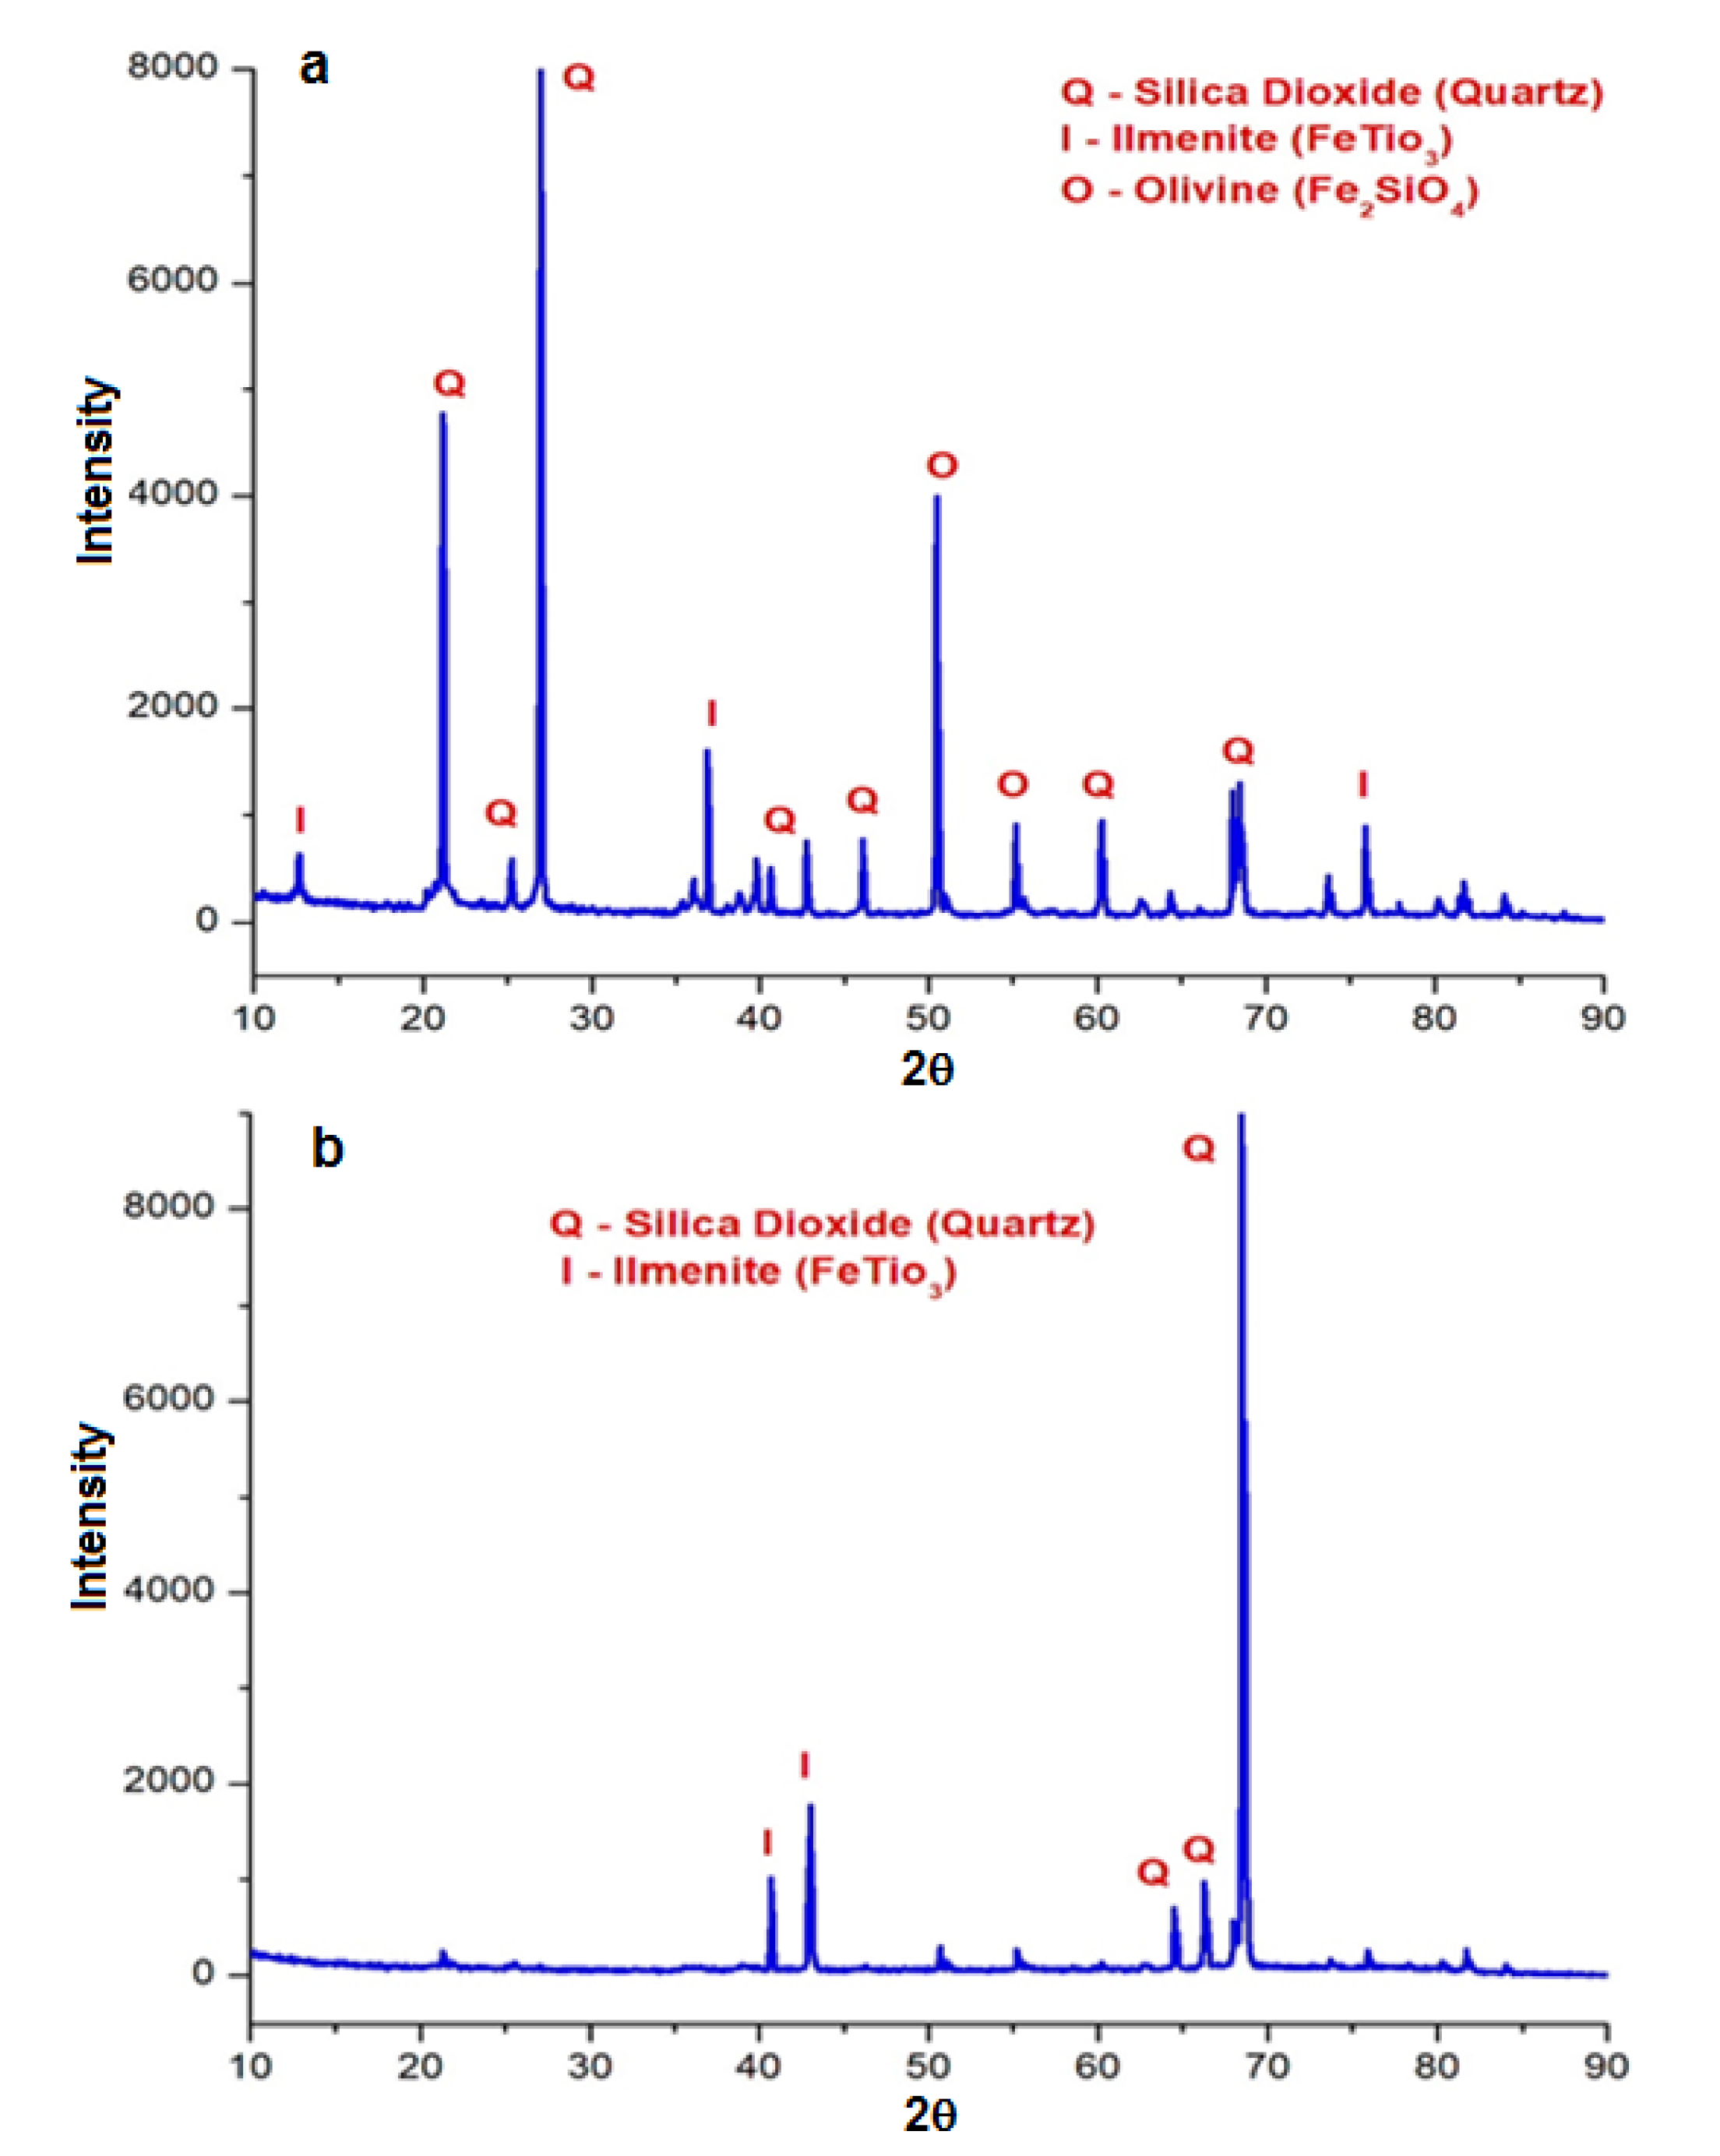
Coarse and fine silica sand exhibit almost similar composition, it has higher quartz (SiO2) content and lower iron content than river sand and M sand. Based on the elemental composition, it was understood that the presence of iron-titanium oxide mineral such as ilmenite (FeTiO3) was found in the silica sands. Generally, this mineral was in crystalline state and used as a flux in furnaces. In silica sand, there was not any traces of calcium was found and higher calcium content was observed in M sand. Along with XRF study, XRD was done to observe the presence of amorphous elements in the silica sands. If it present, it can react with the cement to form more hydration products and helps in building dense microstructure in concrete. From Figure 10, it was observed that there were no amorphous elements were present in silica sands.

Figure 10.
XRD analysis of (a) Fine silica sand, and (b) Coarse silica sand.
Quartz (SiO2) was the major element found in both fine and coarse silica sand. Ilmenite (FeTiO3) is an oxide mineral consists of major elements of Iron-Titanium which was found in both silica sands. Olivine (Fe2SiO4) is an iron-silica mineral which was found only in fine silica sand. Ilmenite and olivine mineral exhibit the presence of strong Silica-Iron-Oxide elements in the silica sands. More number of secondary peaks of quartz, Ilmenite and olivine were identified in fine silica sand while in coarser silica sand only a single major peak of quartz was identified at 68.5⁰. This indicates the minerals were strong in fine silica sand than coarser.
3.3. Experiments on Concrete
3.3.1. Mix Proportioning
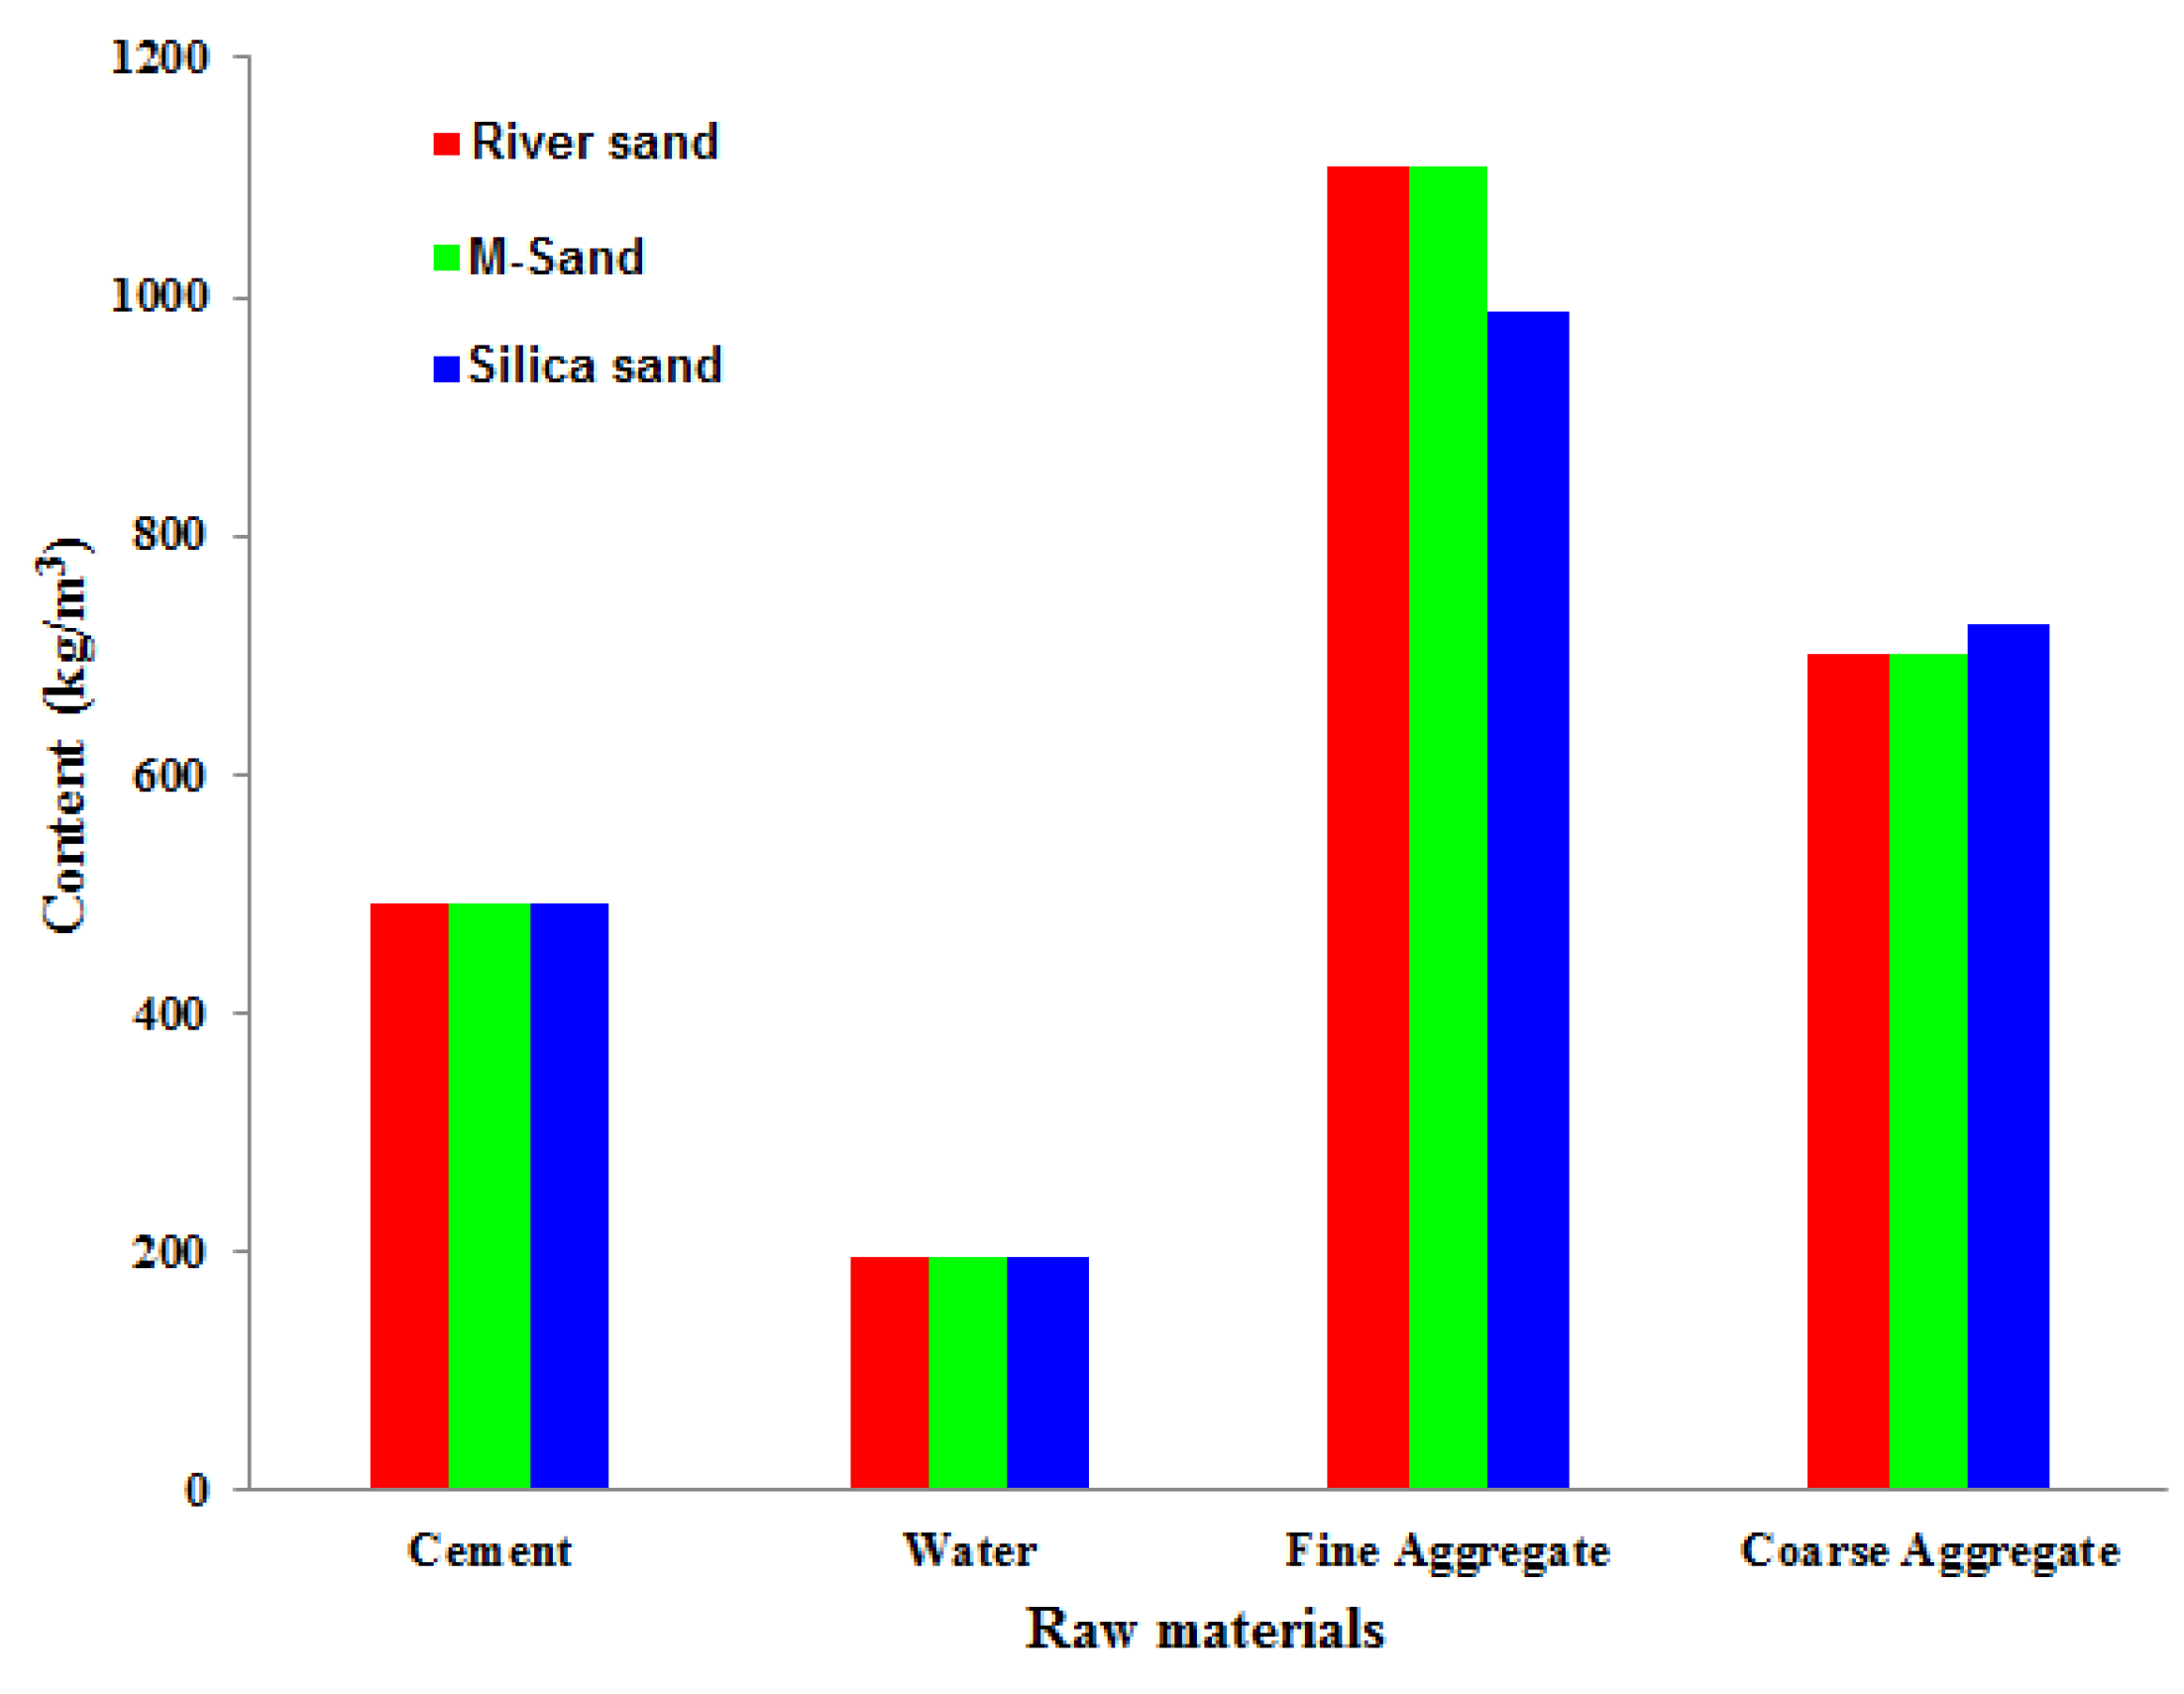
The mix proportions were calculated as per IS 10262:2019 [30] and the ratios are (1:1.43:2.25, Cement: FA:CA) with water-cement ratio of 0.4 for M30 and for M20 the ratios are 1:1.5:0.3 with the water content 0.5. Figure 11 shows the mix ratios of raw materials of M30 concrete with natural sand, M sand and silica sand and from that it was observed that there was no substantial difference between in % of raw materials in concrete with river sand and M sand whereas in case of silica sand, cement content is reduced about 3% with respect to river sand but coarse aggregate content is increased about 4%. It is due to the difference in specific gravity and fineness modulus.
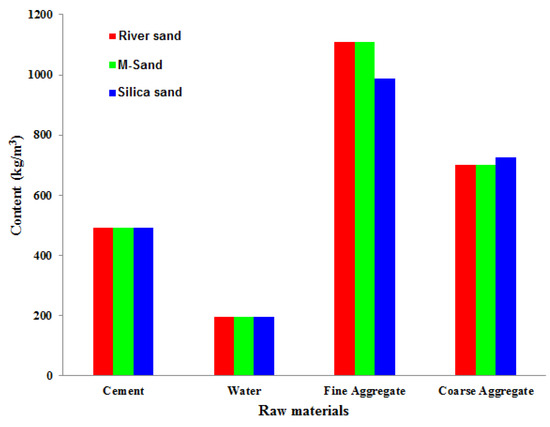
Figure 11.
Mix Proportioning of M30 concrete with river sand, M Sand and silica sand.
3.3.2. Workability of Concrete
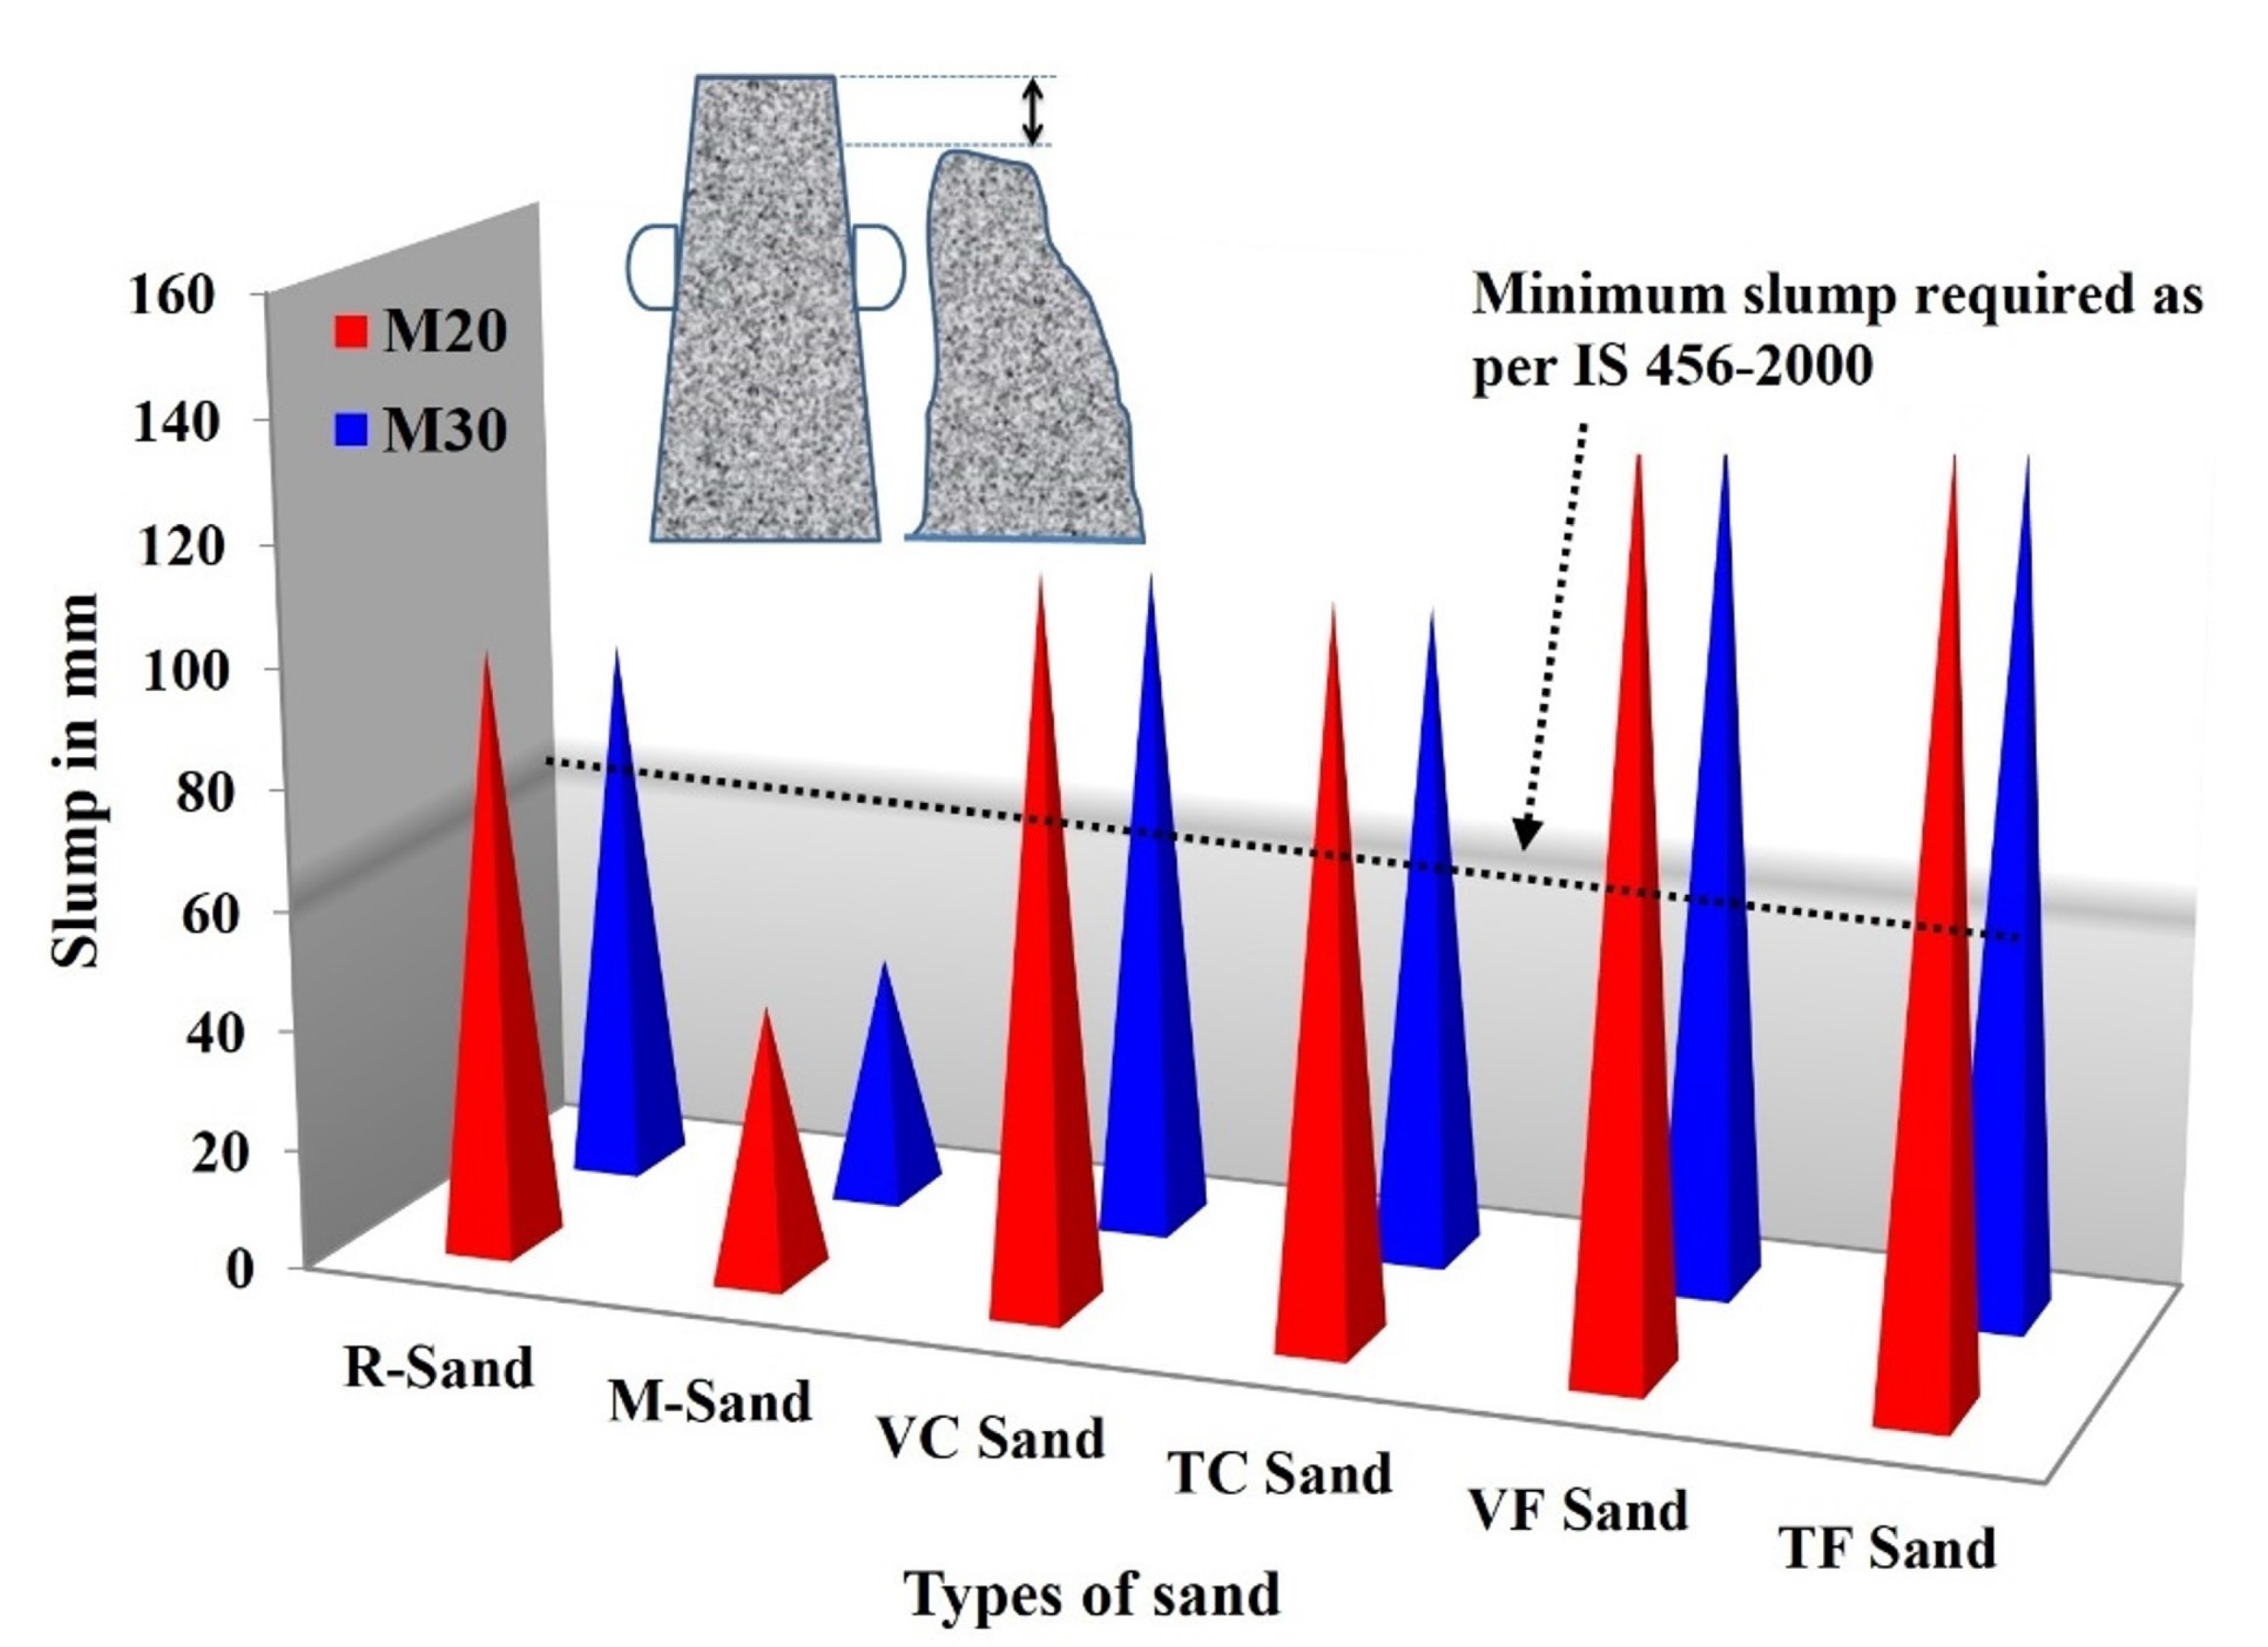
From Figure 12, it was observed that the slump values were reduced in manufactured sand added concrete in both grades M20 and M30. The amount of water needed for the mix is significantly influenced by the form and surface roughness of the manufactured sand. The river sand is round in shape and smooth in texture. As a result, it lessens the friction between the particles in the fine aggregate, increasing the workability of river sand. Due to its angular shape and abrasive surface texture, manufactured sand increases internal friction in the mixture, which decreases the concrete’s workability. Low slump values were observed in M sand due to the presence of a large number of fines in it. In silica sand since the particles are rounded and improve the workability of concrete. Workability of concrete with finer particles of silica sand is higher than the concrete with coarse silica sand. Additionally, it was noticed that workability of silica sand replaced concrete is better than the concrete with river sand [51]. From Figure 12, it was observed that slump value of concrete with M sand is very less when compared to other types of concrete and the minimum slump expected is 50 mm as per Indian standards [52].

Figure 12.
Slump values of M20 and M30 concrete.
3.3.3. Compressive strength of Concrete
Compressive strength of M20 and M30 concrete at 28 days are given in Figure 13.
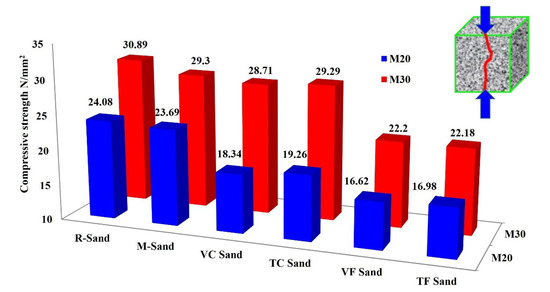
Figure 13.
Compressive strength of concrete.
All silica sand samples exhibit lesser strength compared with reference river sand and M sand. The M20 grade concrete of nominal mix such as river sand and M sand exhibits 24 MPa and 23.7 MPa at 28 days. Coarser sand concrete (VC and TC) exhibits 18.4 MPa and 19.3 MPa while finer sand concrete (VF and TF) exhibits 16.6 MPa. The M30 grade concrete of nominal mix such as river sand and M sand exhibits 30 MPa and 29.3 MPa at 28 days. Coarser sand concrete (VC and TC) exhibits 28.7 Mpa and 29.3 MPa while finer sand concrete (VF and TF) exhibits only 22 MPa. It is observed that the coarser sand samples (VC and TC) exhibits strength greater than finer sand samples (VF and TF). This is due to the finer sand can act as a pore filler material, but it reduces the formation of water cement gel matrix which is responsible for strength contribution in the concrete [5,6,17]. Nearly 20% and 30% lesser compressive strength of coarse and fine silica sand leads to the adverse effect of their usage in concrete. Hence to fulfil the strength requirements, composite mixes were used by combining the coarse silica sands and nominal sands at minor percentages (10%, 20%, and 30%). Twelve composite mixes were prepared and tested. These mixes performed well with the discrete silica sand concrete. The concrete mixes made with 20% and 30% replacements with nominal sand has achieved more than the 30 MPa at 28 days. The mix which contains 80% coarser silica sand (TC) with 20% river sand attained the maximum compressive strength of 34.5 MPa and tensile strength of 3.5 MPa at 28 days which was greatest of all mixes. As a result, silica sand with 20% replacement of river sand or M sand can be effectively used as a fine aggregate for concrete without any lack in their characteristic strength. For these modified samples, cubes were casted for M30 grade concrete, and their 28 days compressive strength are given in Figure 14. Based on the modified mixes, 20% replacements of silica sand samples with river sand and M sand gives the optimum strength of concrete.
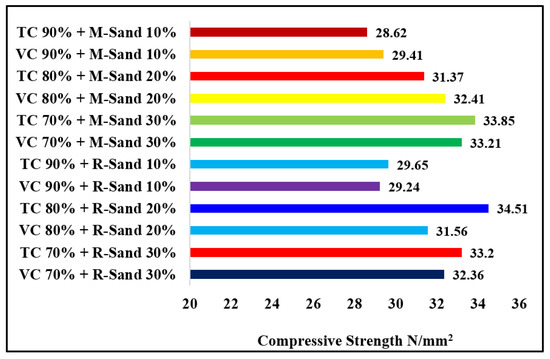
Figure 14.
Compressive strength of modified concrete with partial replacement of silica sand.
3.3.4. Split Tensile Strength of Concrete
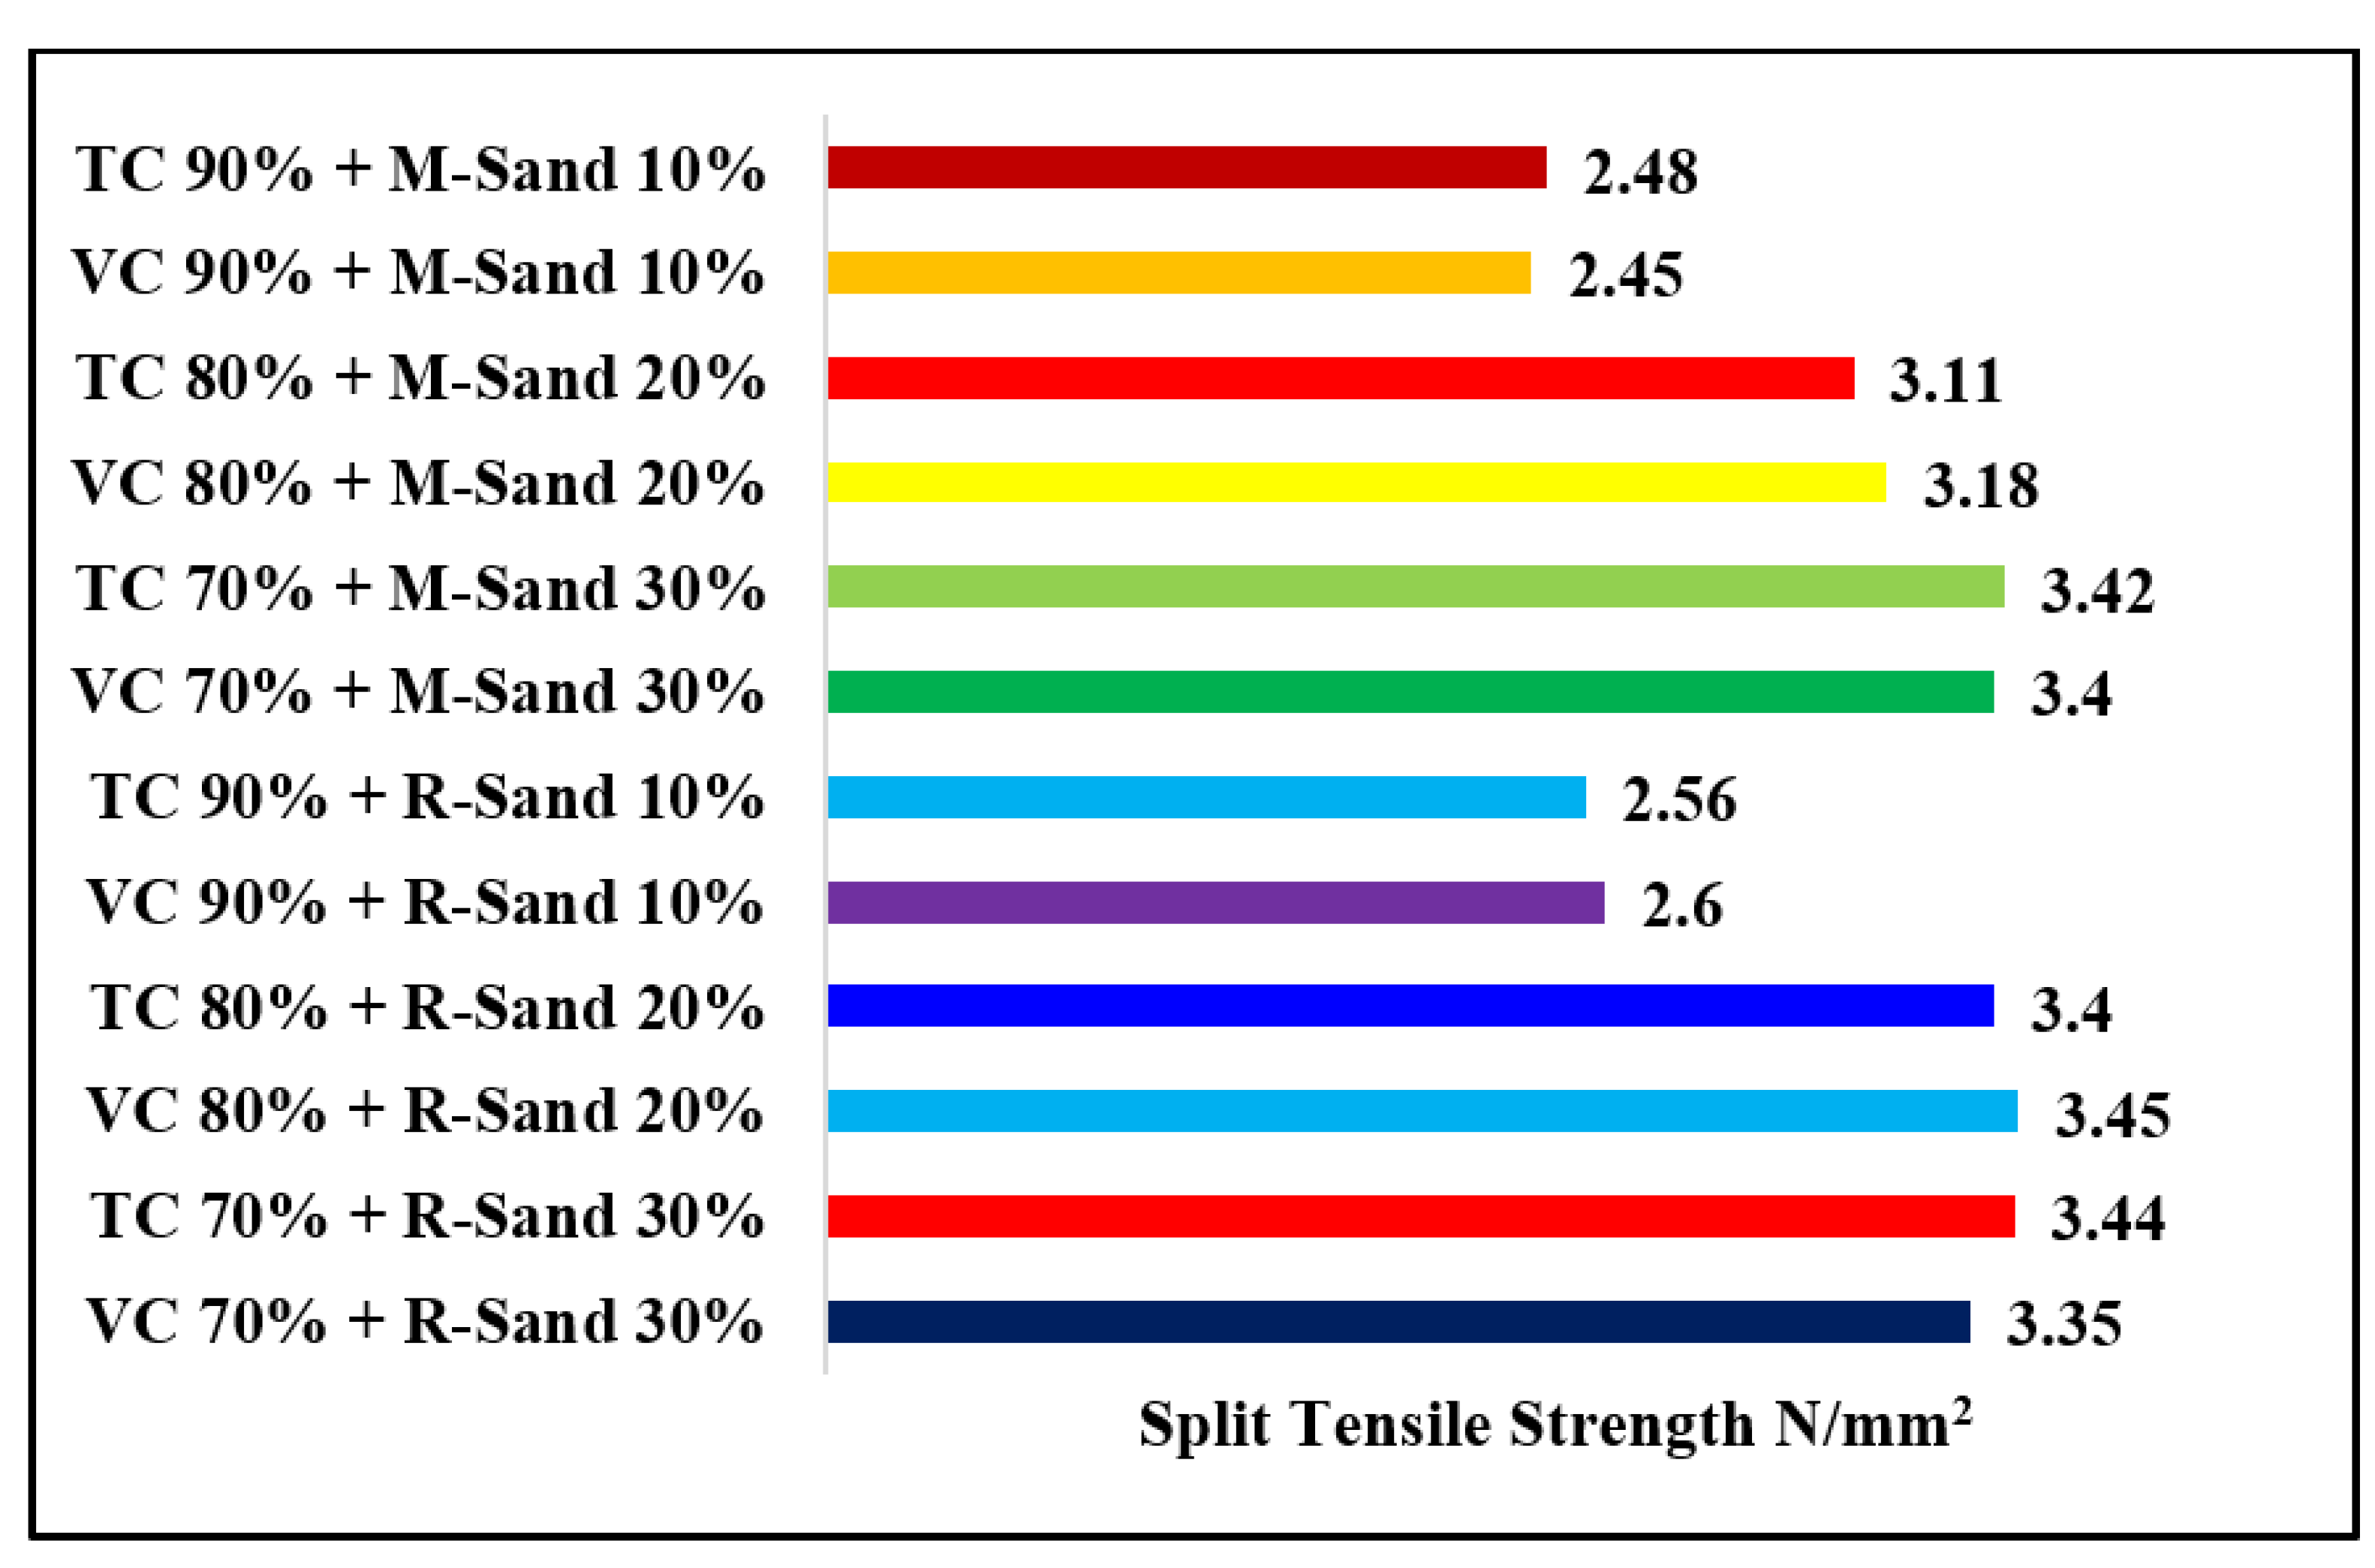
Split tensile strength of M20 and M30 concrete at 28 days are given in Figure 15. Similar trend was observed in split tensile strength, around 40% decrease in their strength was identified. The coarser sand samples (VC and TC) exhibit strength greater than finer sand samples (VF and TF). Concrete made with M sand possess higher strength than all other samples. Hence, to improve their performance coarser silica sand was mixed with R sand and M sand at minor percentages (10%, 20% and 30%). For these modified samples, cylinders were casted for M30 grade concrete, and their 28 days split tensile strength are given in Figure 16. Based on the modified mixes, 20% replacements of silica sand samples with river sand and M sand gives the optimum splitting tensile strength of concrete [53]. Since all concrete mixes have the equal amount of cement content, but Strength decrement mainly due to the interparticle packing and toughness of the aggregates.
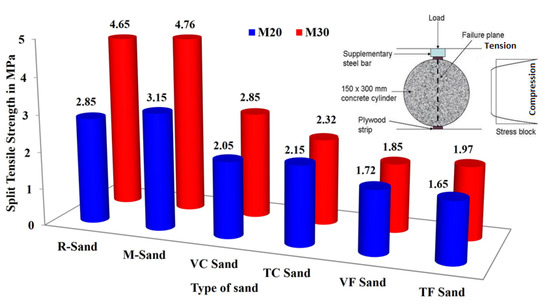
Figure 15.
Split tensile strength of concrete.

Figure 16.
Split tensile strength of modified concrete with partial replacement of silica sand.
3.3.5. UPV Test on Concrete
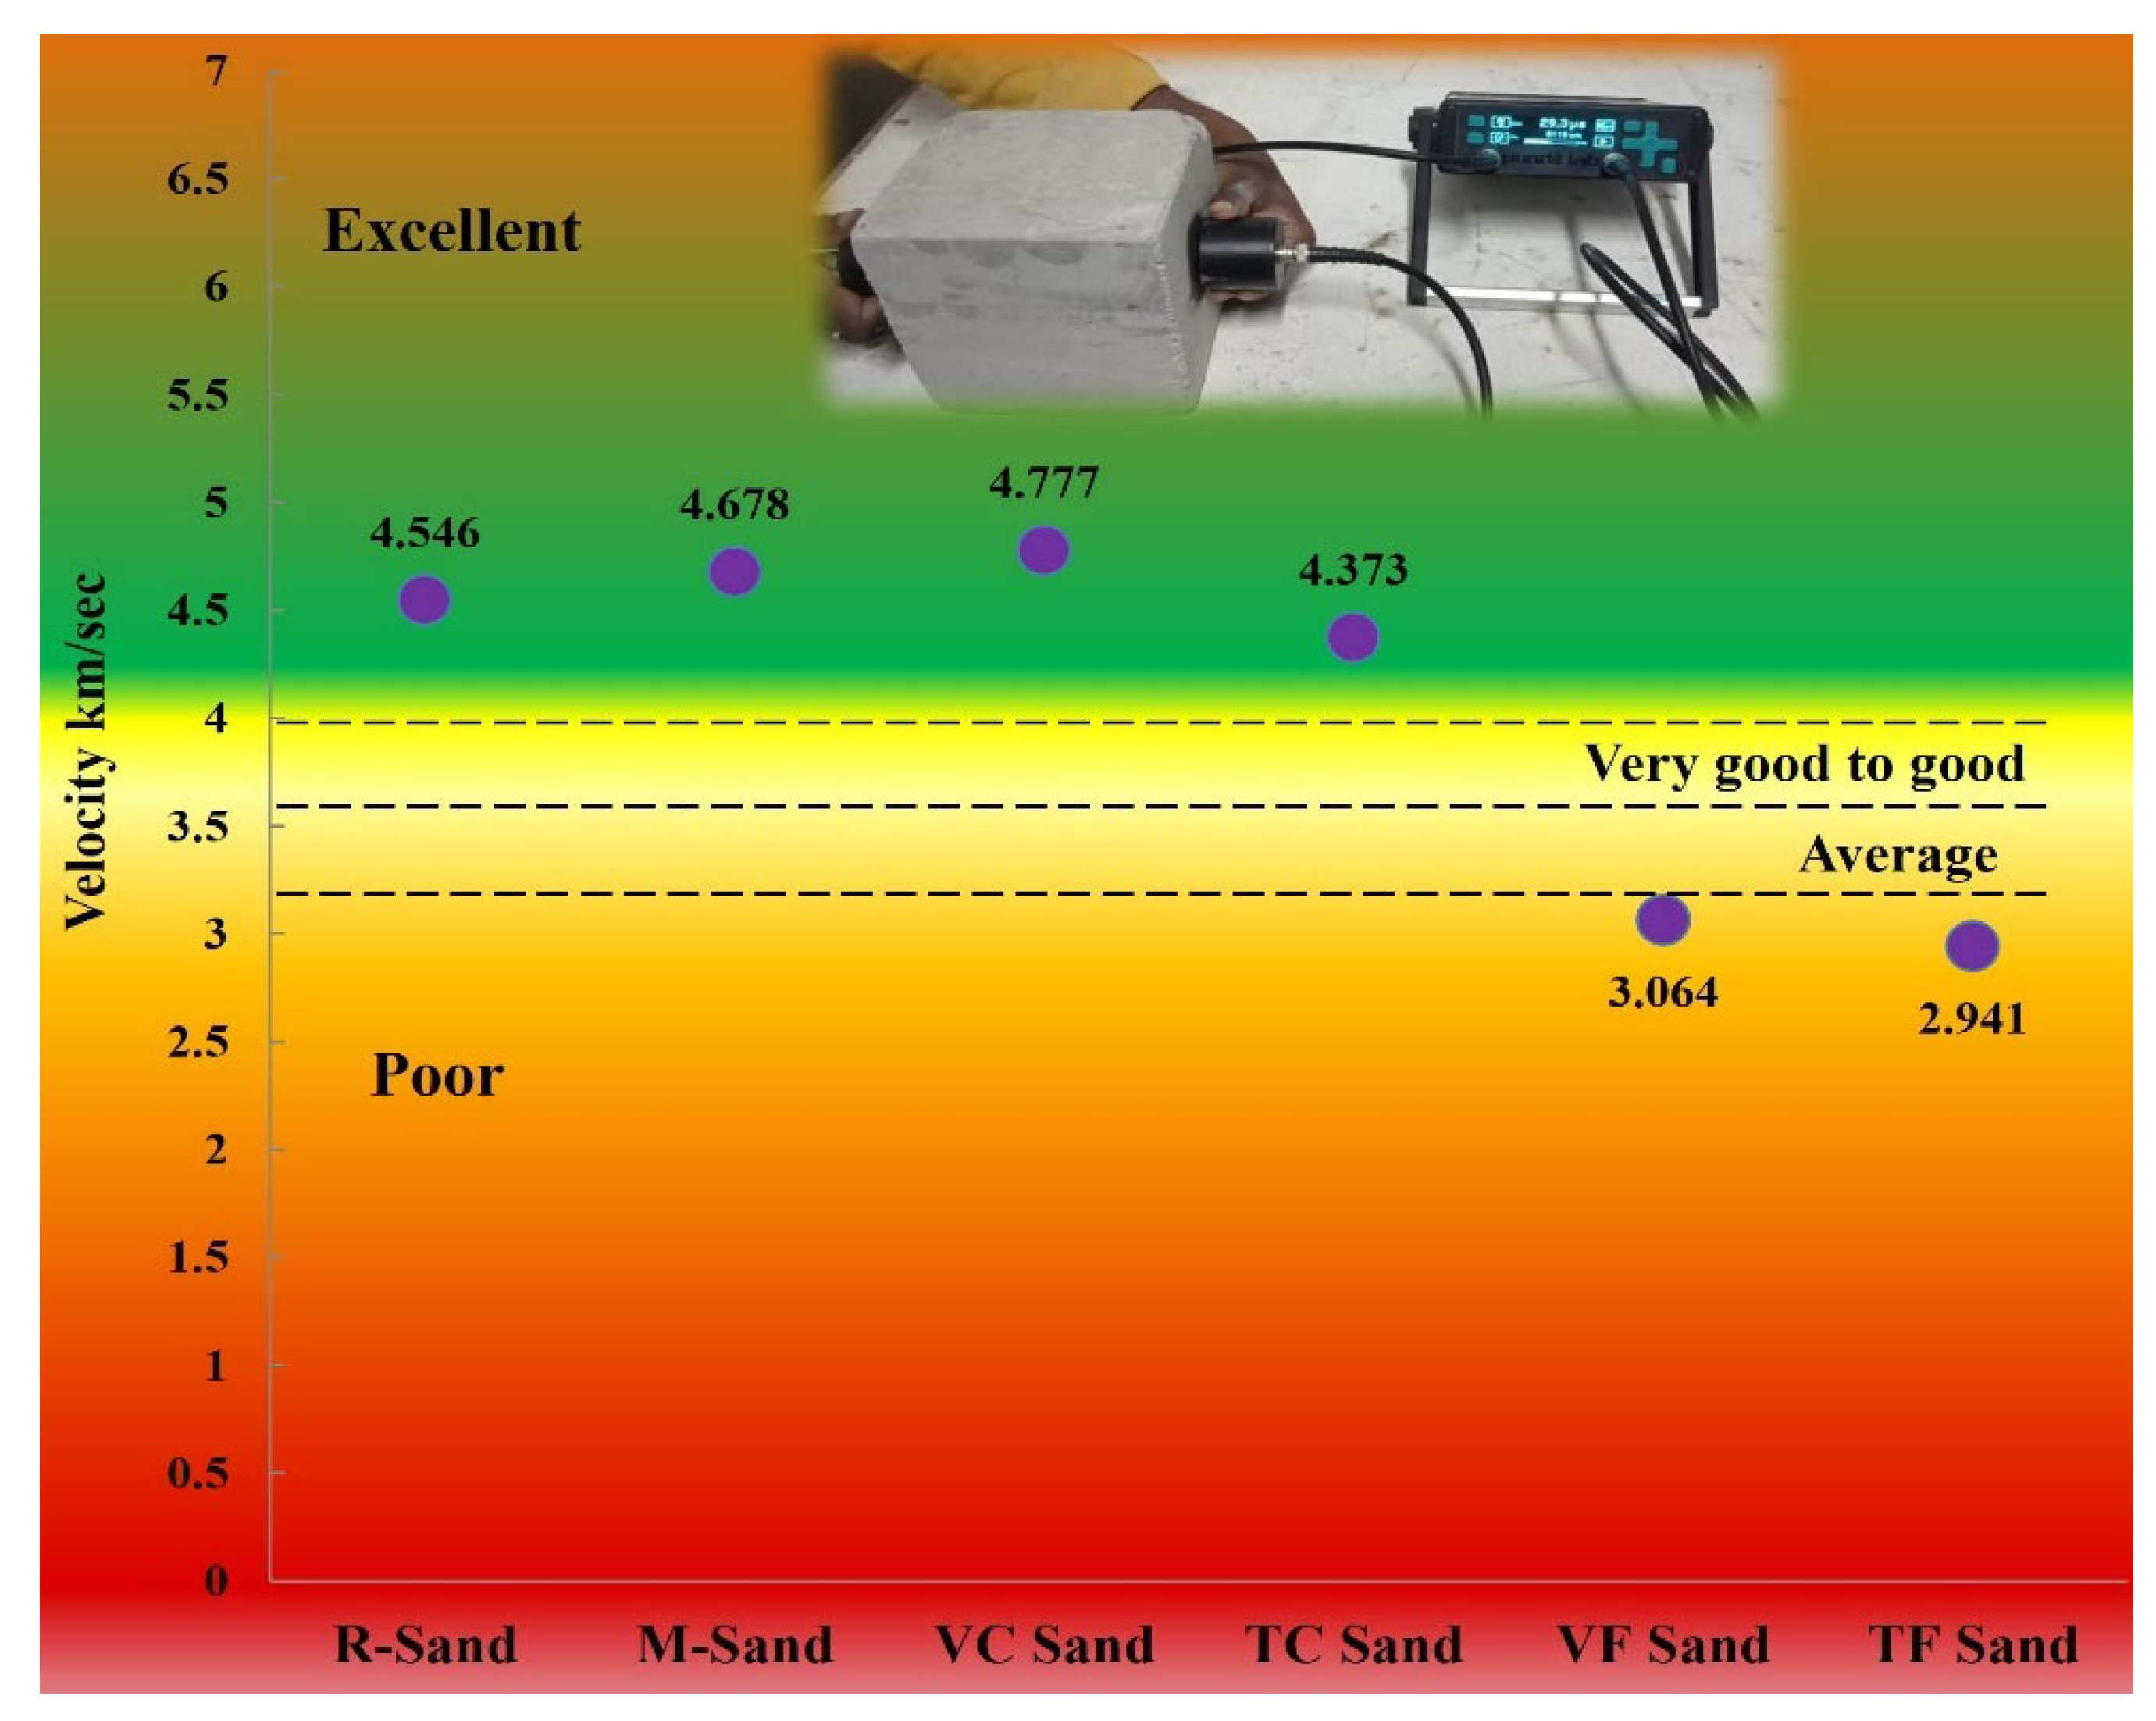
This UPV test is done to assess the quality of concrete as per IS: 13311 (Part 1)—1992 [38]. Figure 17 gives the pulse velocity of concrete with river sand, M sand, coarse silica sand and fine silica sand. From the figure, it was understood that the quality of concrete with coarse silica sand is excellent as like concrete with river sand and M sand whereas concrete with fine silica sand is below average. Hence the quality of concrete with fine silica sand is doubtful but with coarse sand is excellent [13,54].

Figure 17.
Ultrasonic pulse velocity results.
3.4. Microstructure Studies on Concrete Powder
3.4.1. SEM/EDX
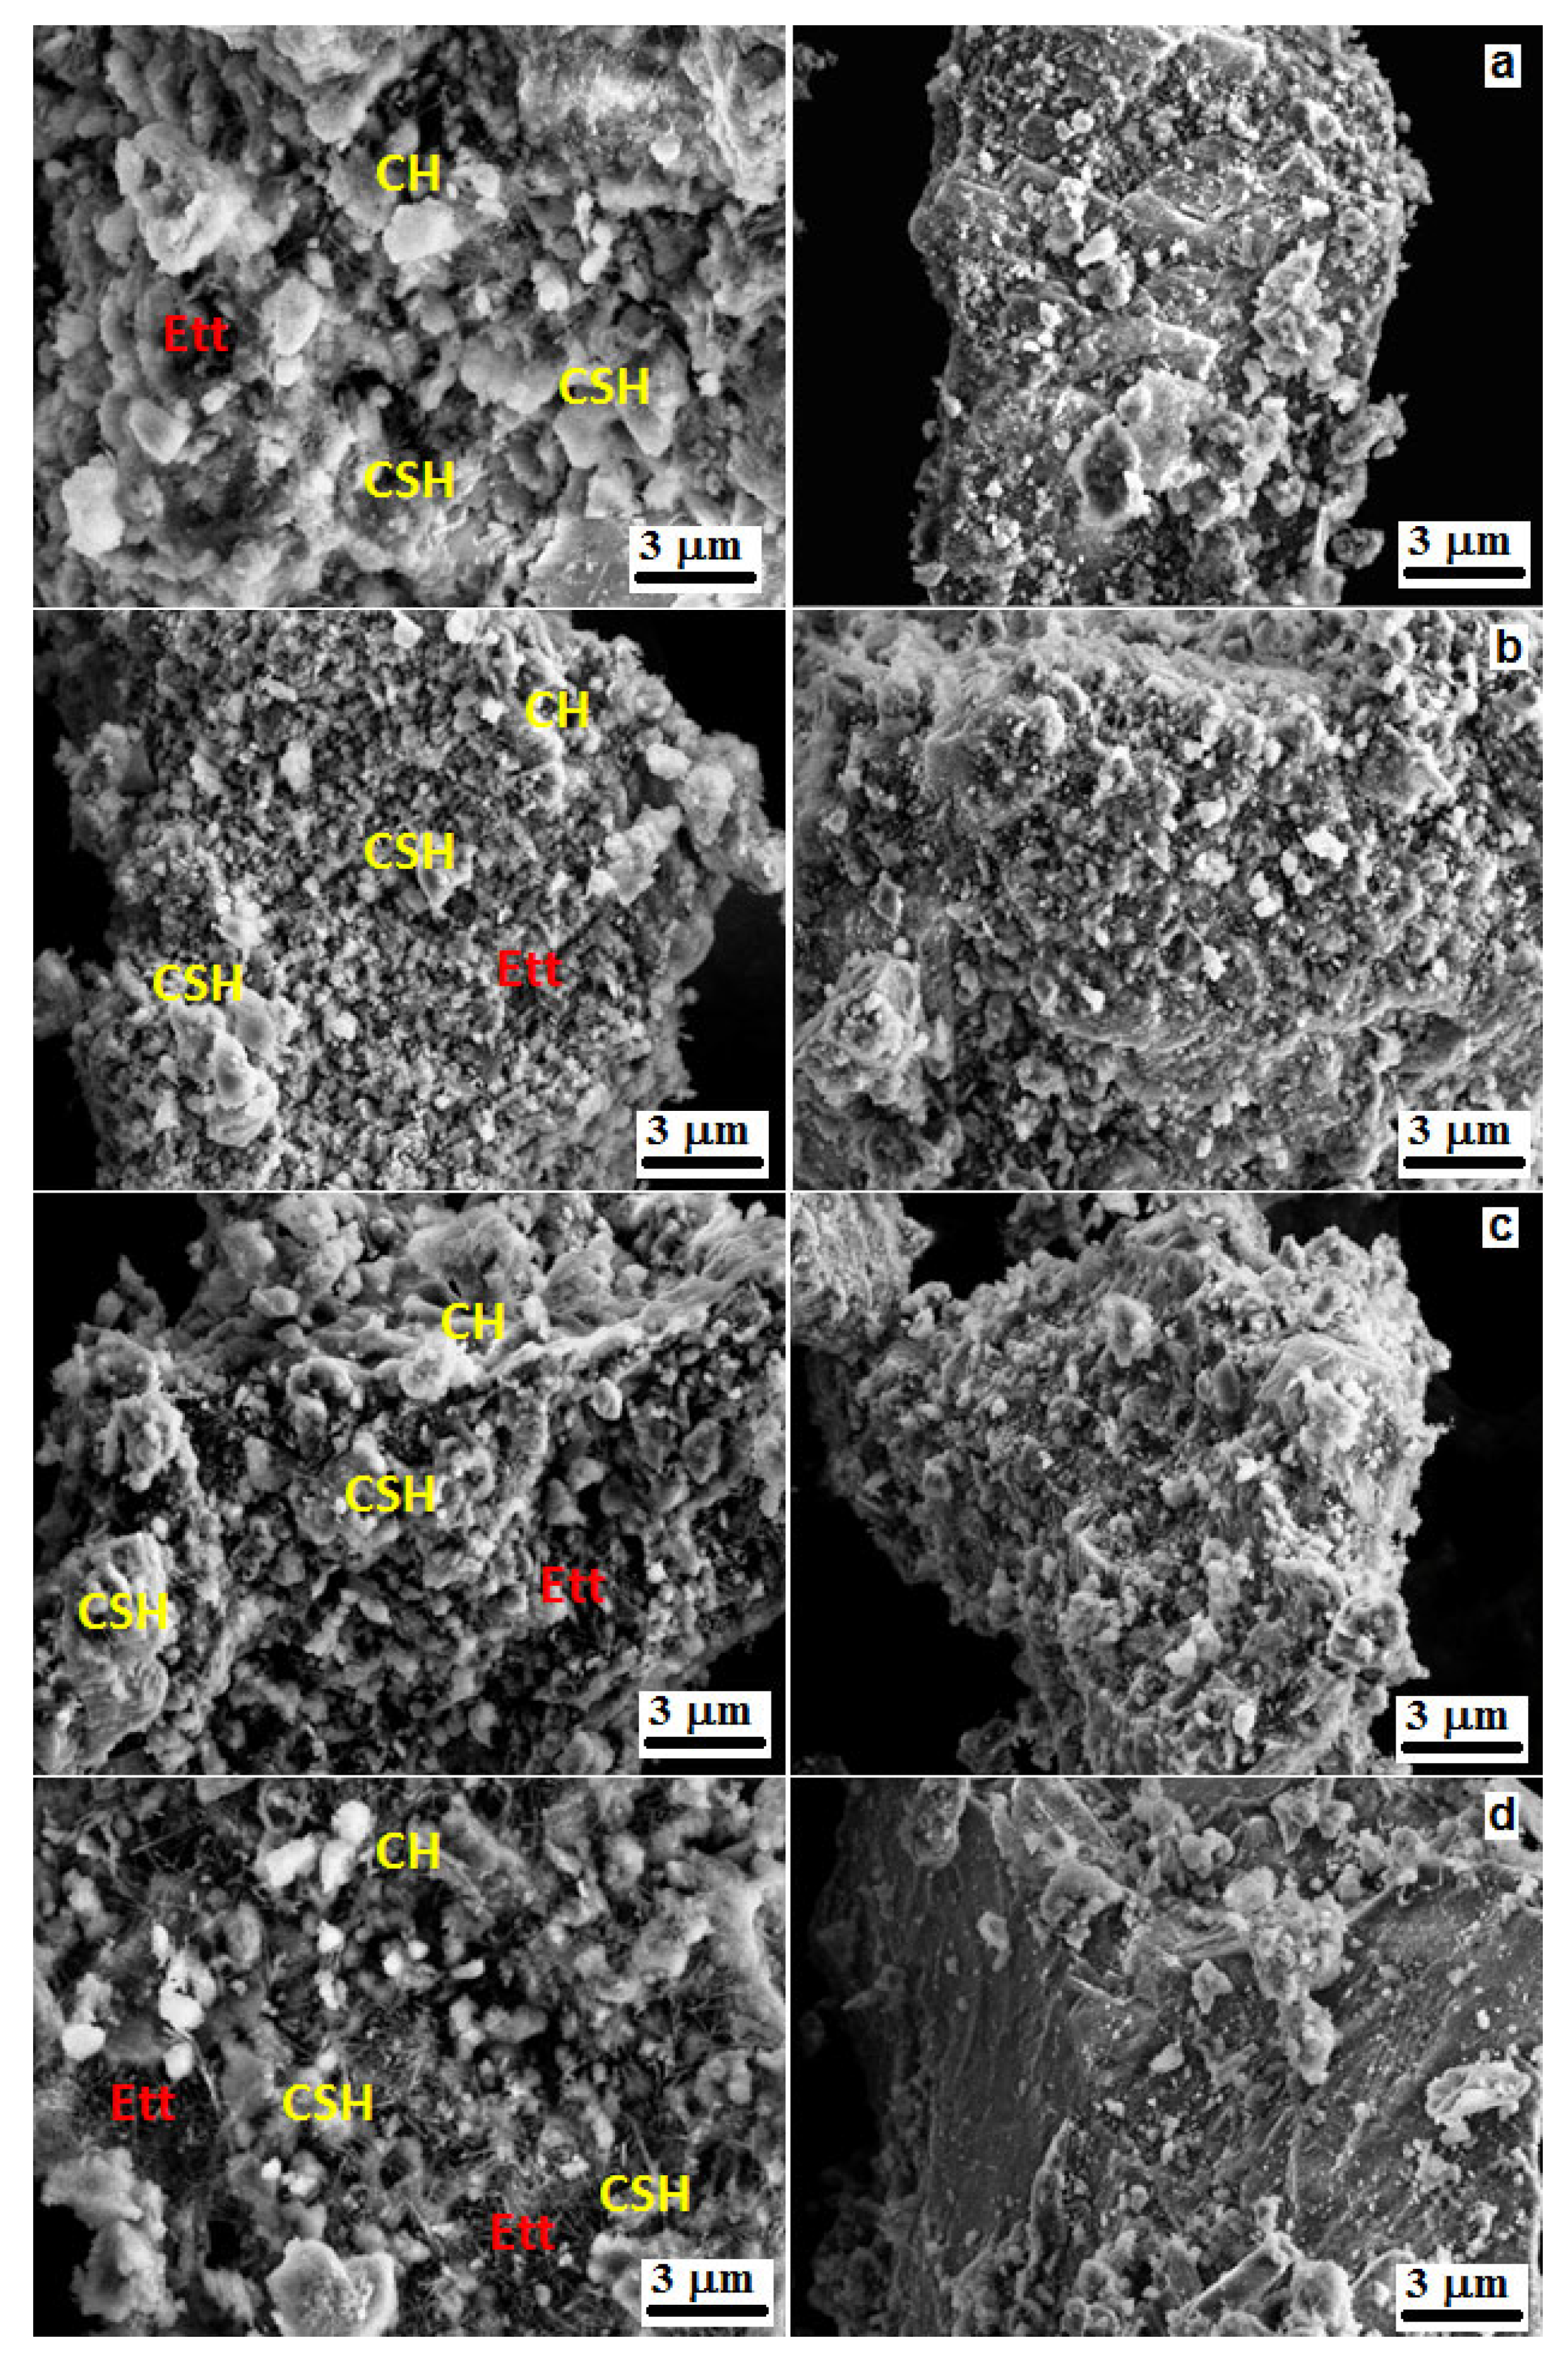
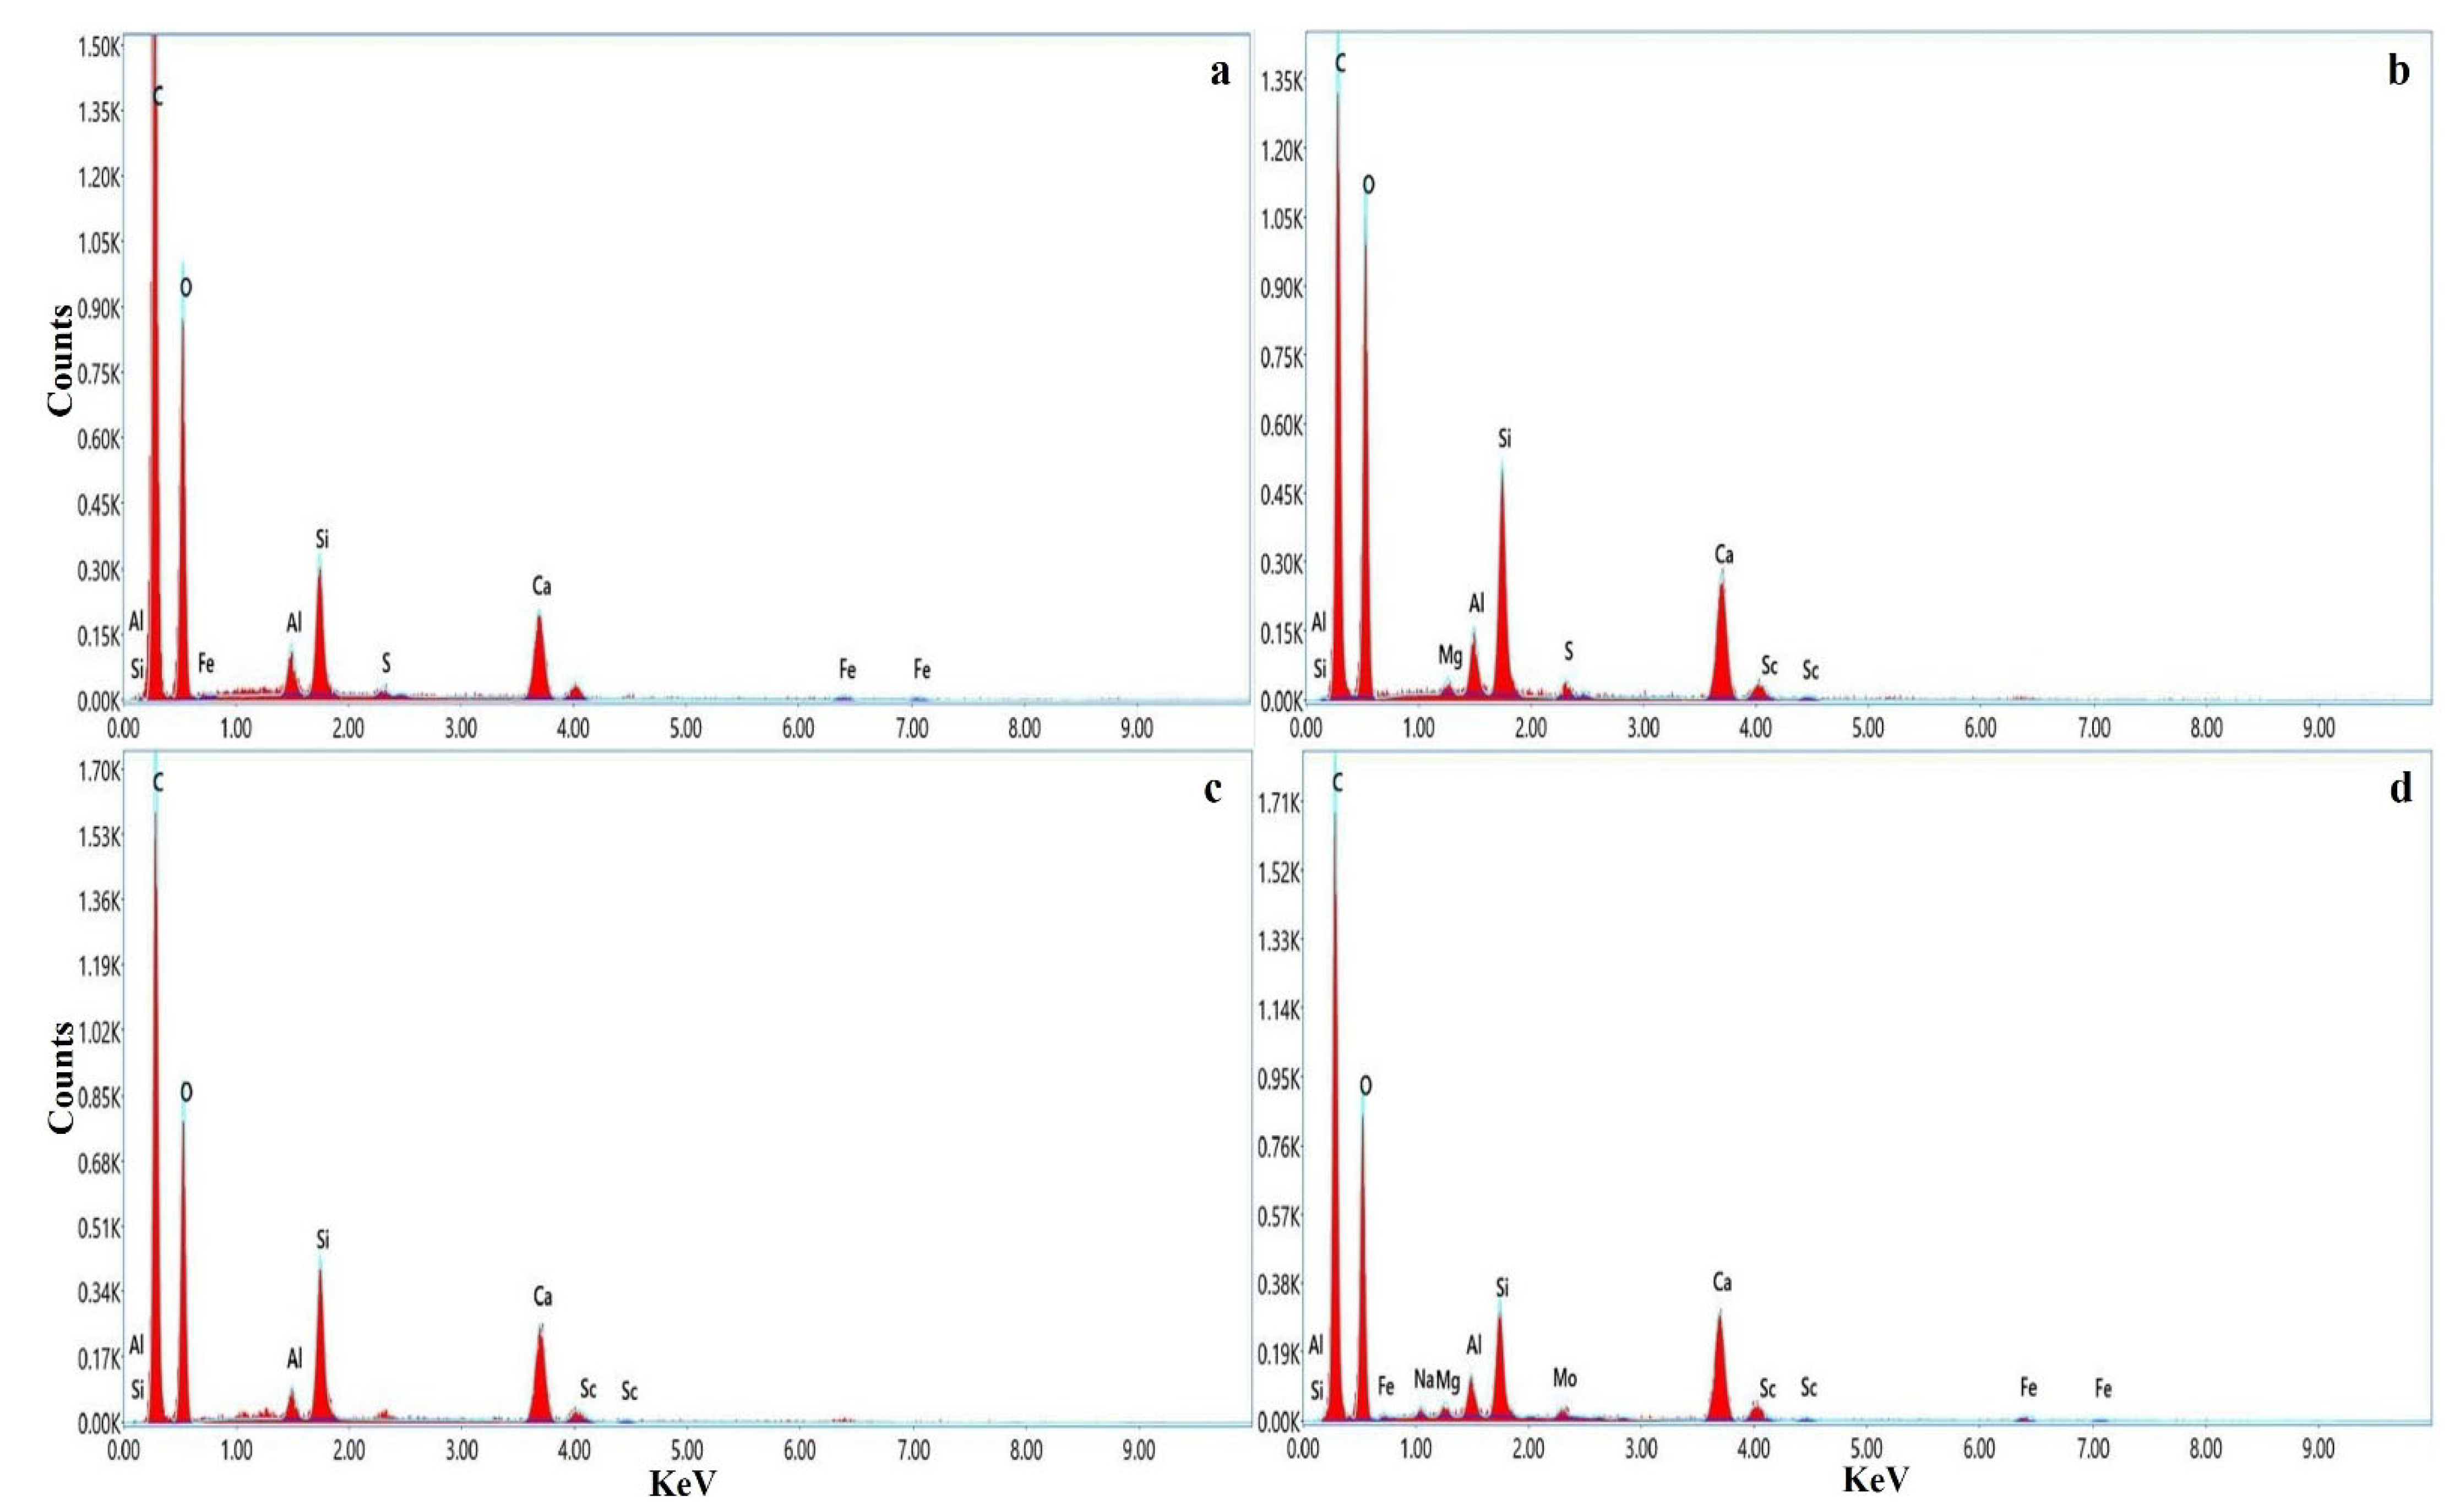
Figure 18 and Figure 19, depicts the SEM and EDX spectra of the concrete powder sample with fine silica sand, coarse silica sand, river sand and M sand respectively.

Figure 18.
SEM image of (a) fine silica sand concrete, (b) coarse silica sand concrete, (c) river sand concrete and (d) M sand concrete.
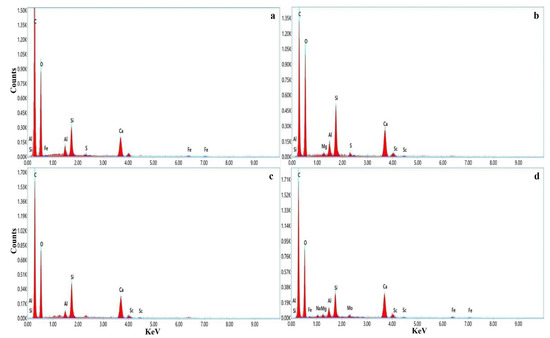
Figure 19.
EDX spectrum of (a) Fine silica sand concrete, (b) coarse silica sand concrete, (c) river sand concrete and (d) M sand concrete.
From the figures, it was observed that C–S–H, calcium hydroxide (CH) was the major hydrated phases present in the concrete [9,13]. Based on the size, shape and distribution of the particles, the microstructure of concrete will vary. Wide distribution of hydration products such as CSH, CH and ettringite (Ett) were formed in all sand samples concrete [55,56,57,58,59,60,61,62,63,64,65,66,67]. The bright portion in the microstructure of SEM image represents calcium hydroxide (CH), needle-like formation represents ettringite and sulfoaluminates (Ett) and grey spherical portion represents calcium silicate hydrate (CSH) [13,67]. Concrete made of river sand has irregular shaped aggregates with well distributed particles. It was observed that a greater number of spherical shaped CSHs were formed in the river sand concrete. This may be due to amorphous SiO2 present in the river sand would react in the cement hydration to produce more hydration products. Hence, river sand concrete performs well in strength properties. In M sand concrete, the number of needle-like hydration products (ettringite and sulfoaluminates) were found than spherical one (CSH). From the observation, the amount of CSH gel in its morphology becomes denser and less porous with the silica sand mix, which increases the mechanical strength. The CSH structure looks too dense and well compacted with silica added due to its pore filling effects. The observation proven by SEM images.
Generally, calcium to silica ratio of Portland cement concrete is 1.5. As per EDX data, the calcium to silica ratio of concrete containing fine and coarse silica sands were 1.85 and 1.60. However, in M sand concrete, the ratio was increased to 2.75. This shows that the M sand contains lesser content of silica than other sands with respect to calcium content. The finer silica sand concrete exhibits compact surface with minimum voids compared with coarser silica sand concrete. Major elements of carbon and oxygen were found in all sand sample concrete. These elements were present in the concrete in the form of oxides and calcites. Considerable traces of sodium and magnesium elements were found in M sand concrete which were not seen in other concretes. The EDAX analysis shows major portion of silica content present in coarse and fine silica mix about 5.7% and 5.0%. The silica content percentage improves up to 62.85% and 42.85% in coarse and fine silica-added mix. Table 3 shows the element composition of silica sand added mix after 28 days of curing. The reaction between the calcium hydroxide in the cement and the silica in the silica sand produces tri-silica alumina hydrate, which is responsible for the increase in strength. The strength developed in fine and coarse silica sand is addressed through presence of higher silica content in the concrete mixes after 28 days of curing.
Table 3.
Element composition in concrete sample.
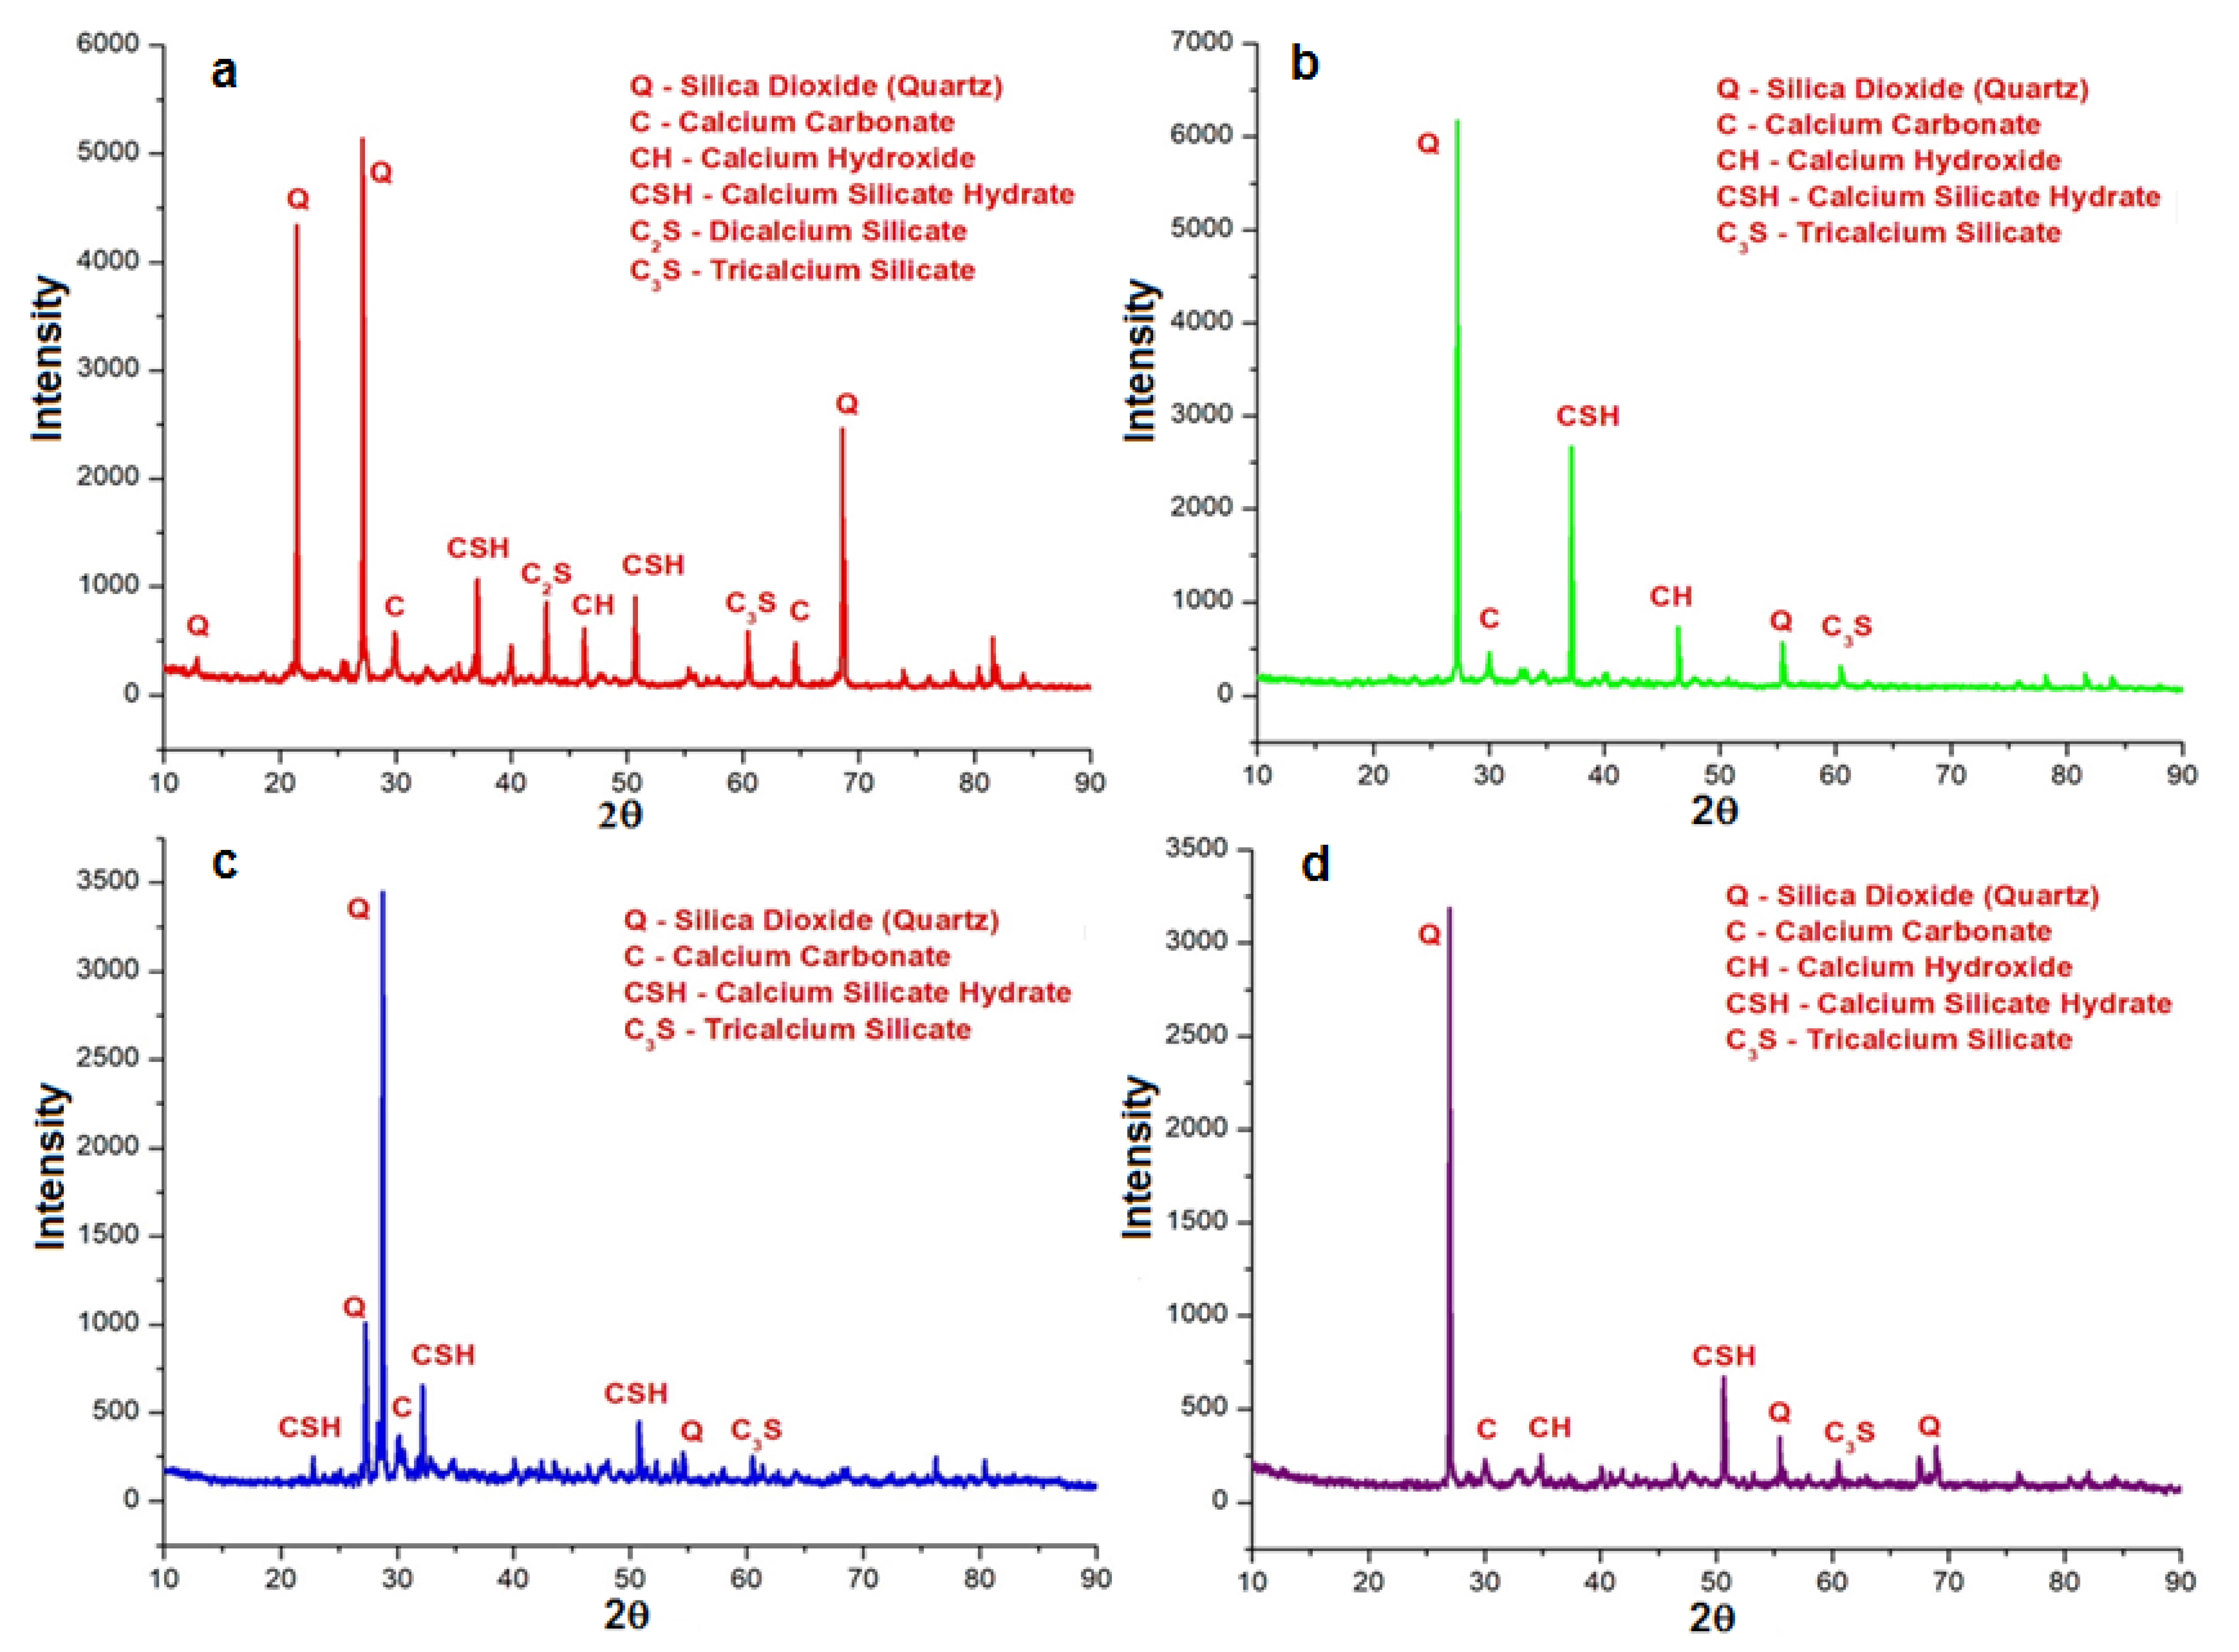
3.4.2. XRD
Figure 20 provided the XRD pattern of concrete powder sample mixed with fine silica sand, coarse silica sand, river sand and M sand respectively.

Figure 20.
XRD pattern of (a) Fine silica sand concrete, (b) Coarse silica sand concrete, (c) River sand concrete, and (d) M sand concrete.
From the figure, it was observed that the XRD pattern of all concretes has a high peak of quartz (SiO2), and calcium silicate hydrate (CSH) exhibits the formation of hydration products in the concrete [6,10,56,57,58,59]. Minor peaks of C2S and C3S indicates the unreacted cement particles in the concrete [62,63]. Peaks of Calcium hydroxide (CH) and calcium carbonate (CaCO3) were found due to the excessive lime content in the cement that were left unreacted due to the absence of amorphous elements in the concrete. Similar pattern was observed in coarser silica sand with the sharp SiO2 peak and CSH peak at the theta angle 27.2° and 37°. Peaks representing SiO2 and CSH in the coarser silica sand is sharp and having high intensity. However. in finer silica sand, numerous secondary peaks of SiO2 (12.86°, 21.4°, 27.43° and 68.6°) and CSH (37°, 38.9° and 50.6°) were found with less intensive. In both river sand concrete and M sand concrete, sharp peak of SiO2 is found and considerable amount of CSH peak is found. Other minerals like CH, CaCO3, C2S and C3S peaks were found weaker. This shows that bogue minerals and calcium minerals were converted almost into hydration products. Thus, it forms well-developed microstructure and helps in strength development of concrete. In all sand samples concrete, there was not any traces of ettringite was found because it could be converted into the next hydrated stage as monosulfoaluminate hydrates with the presence of tricalcium aluminate in the cement.
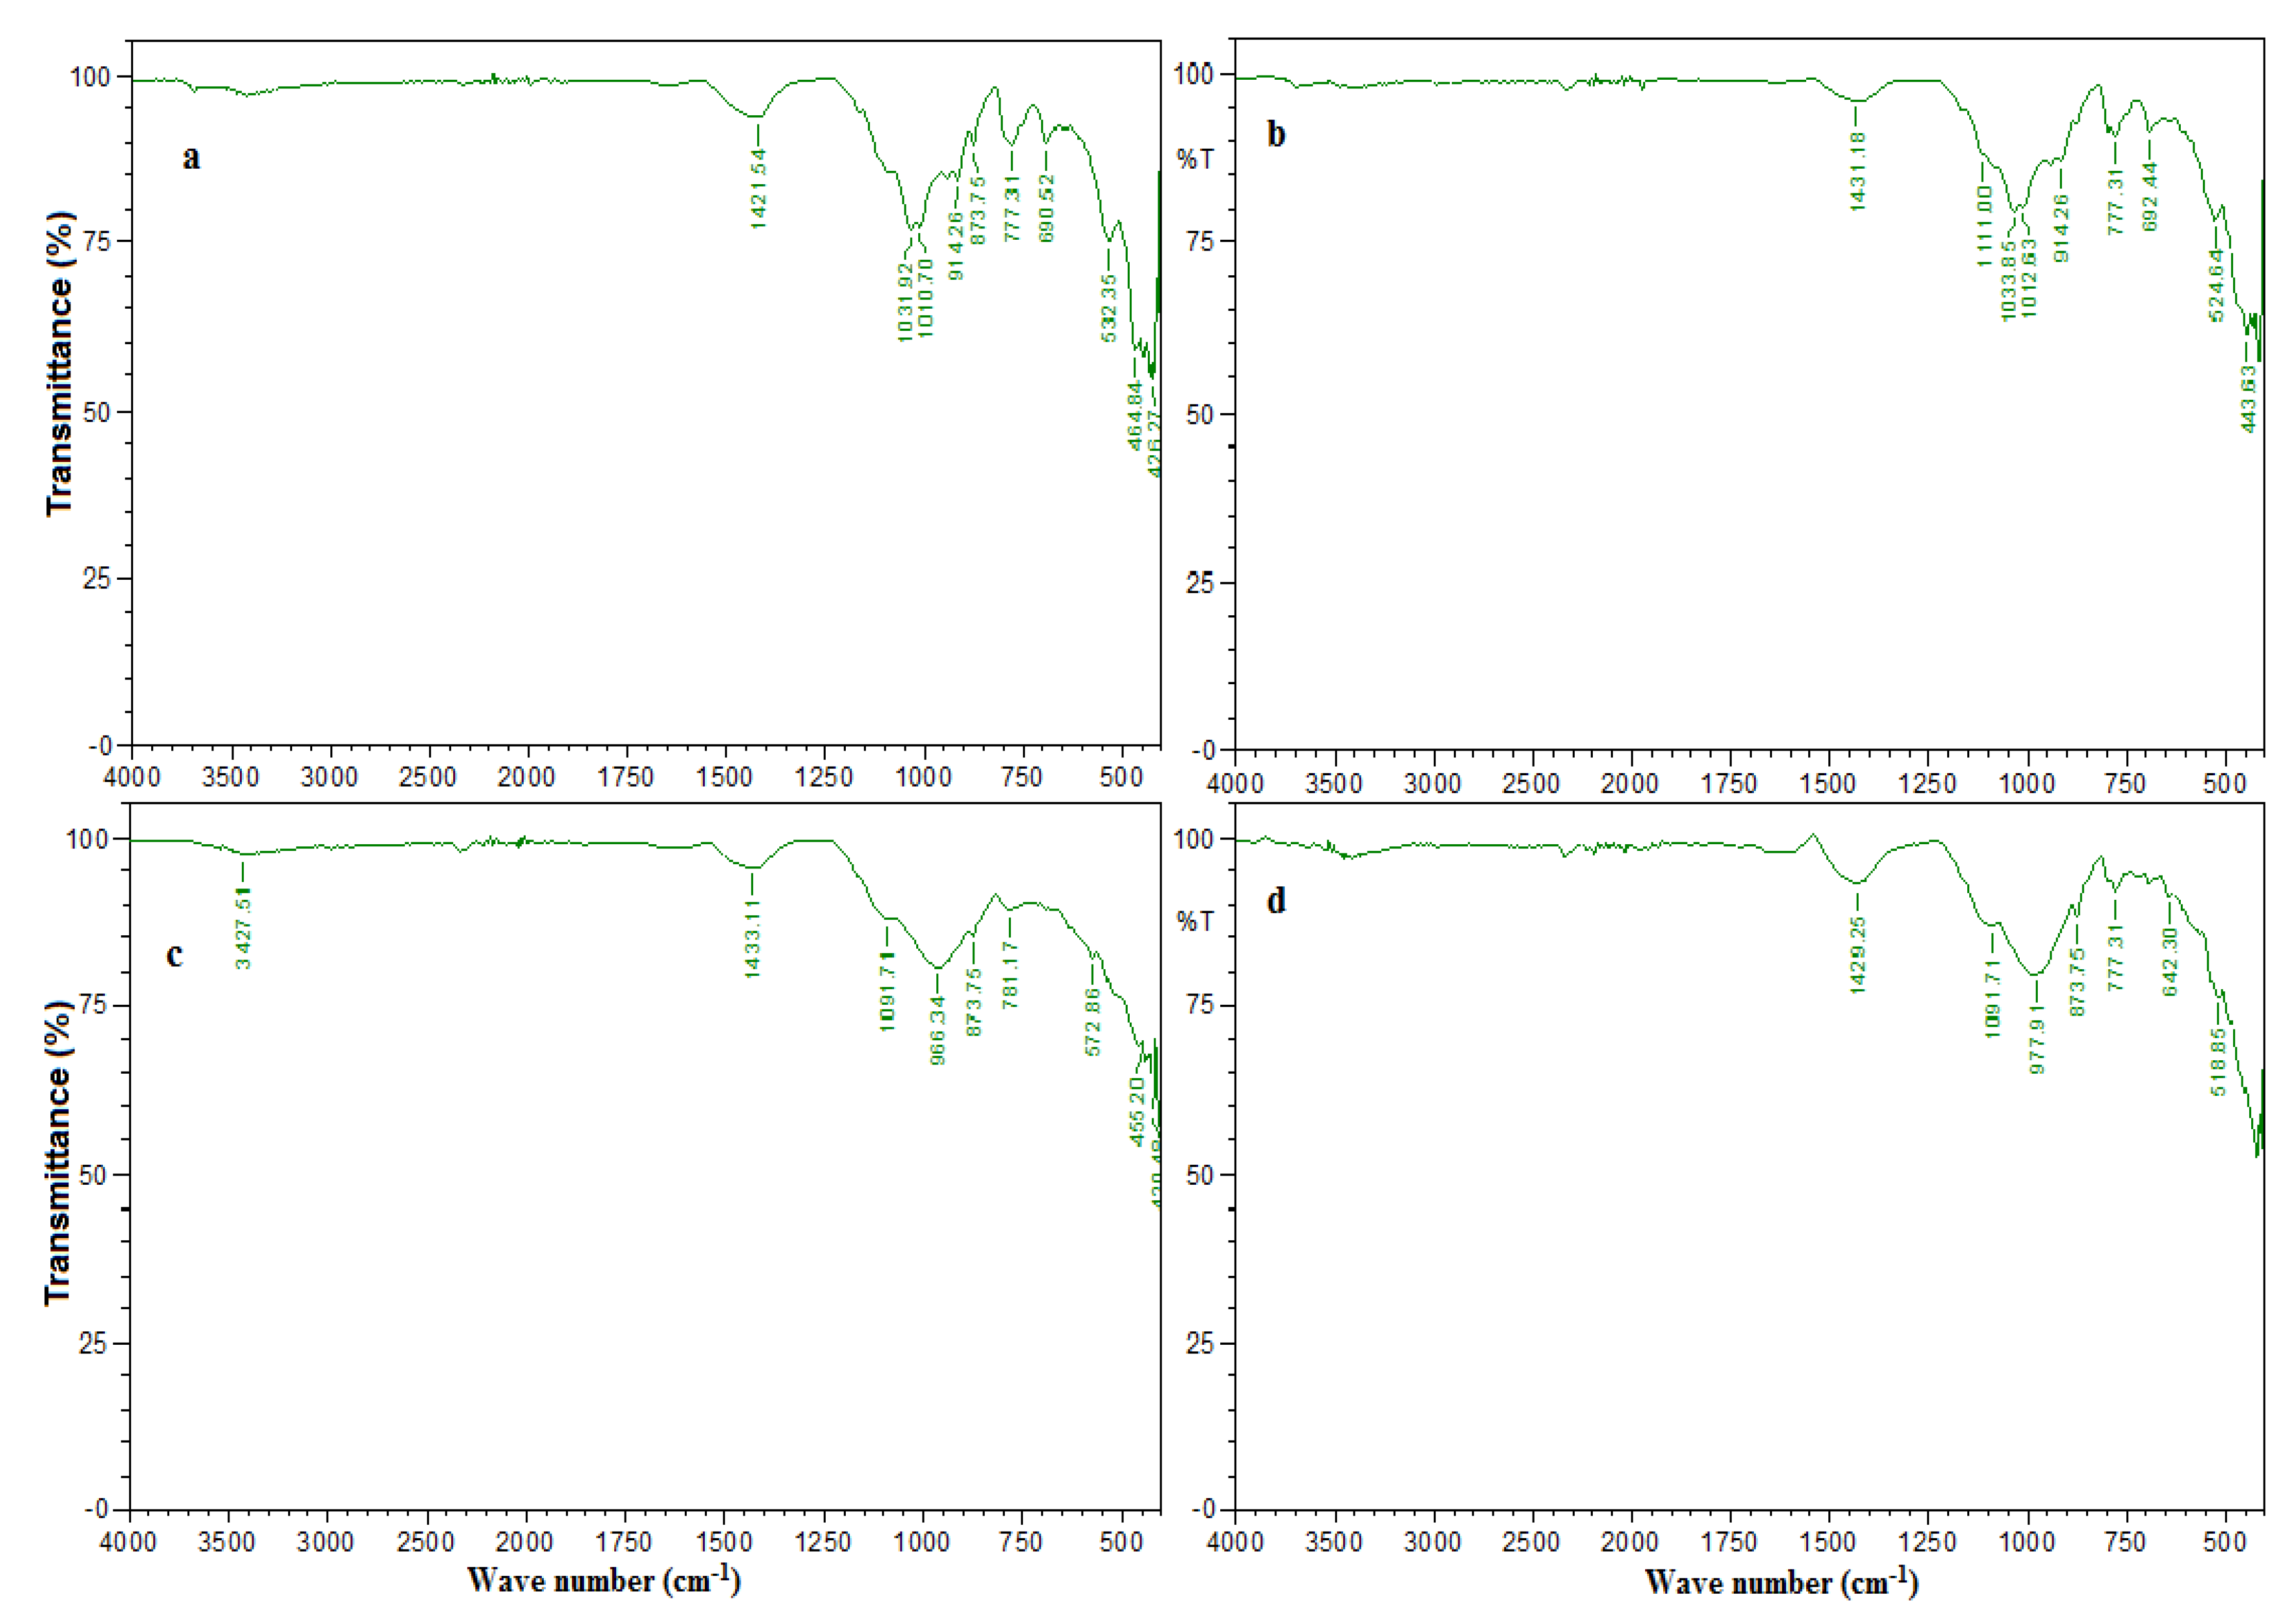
3.4.3. FTIR
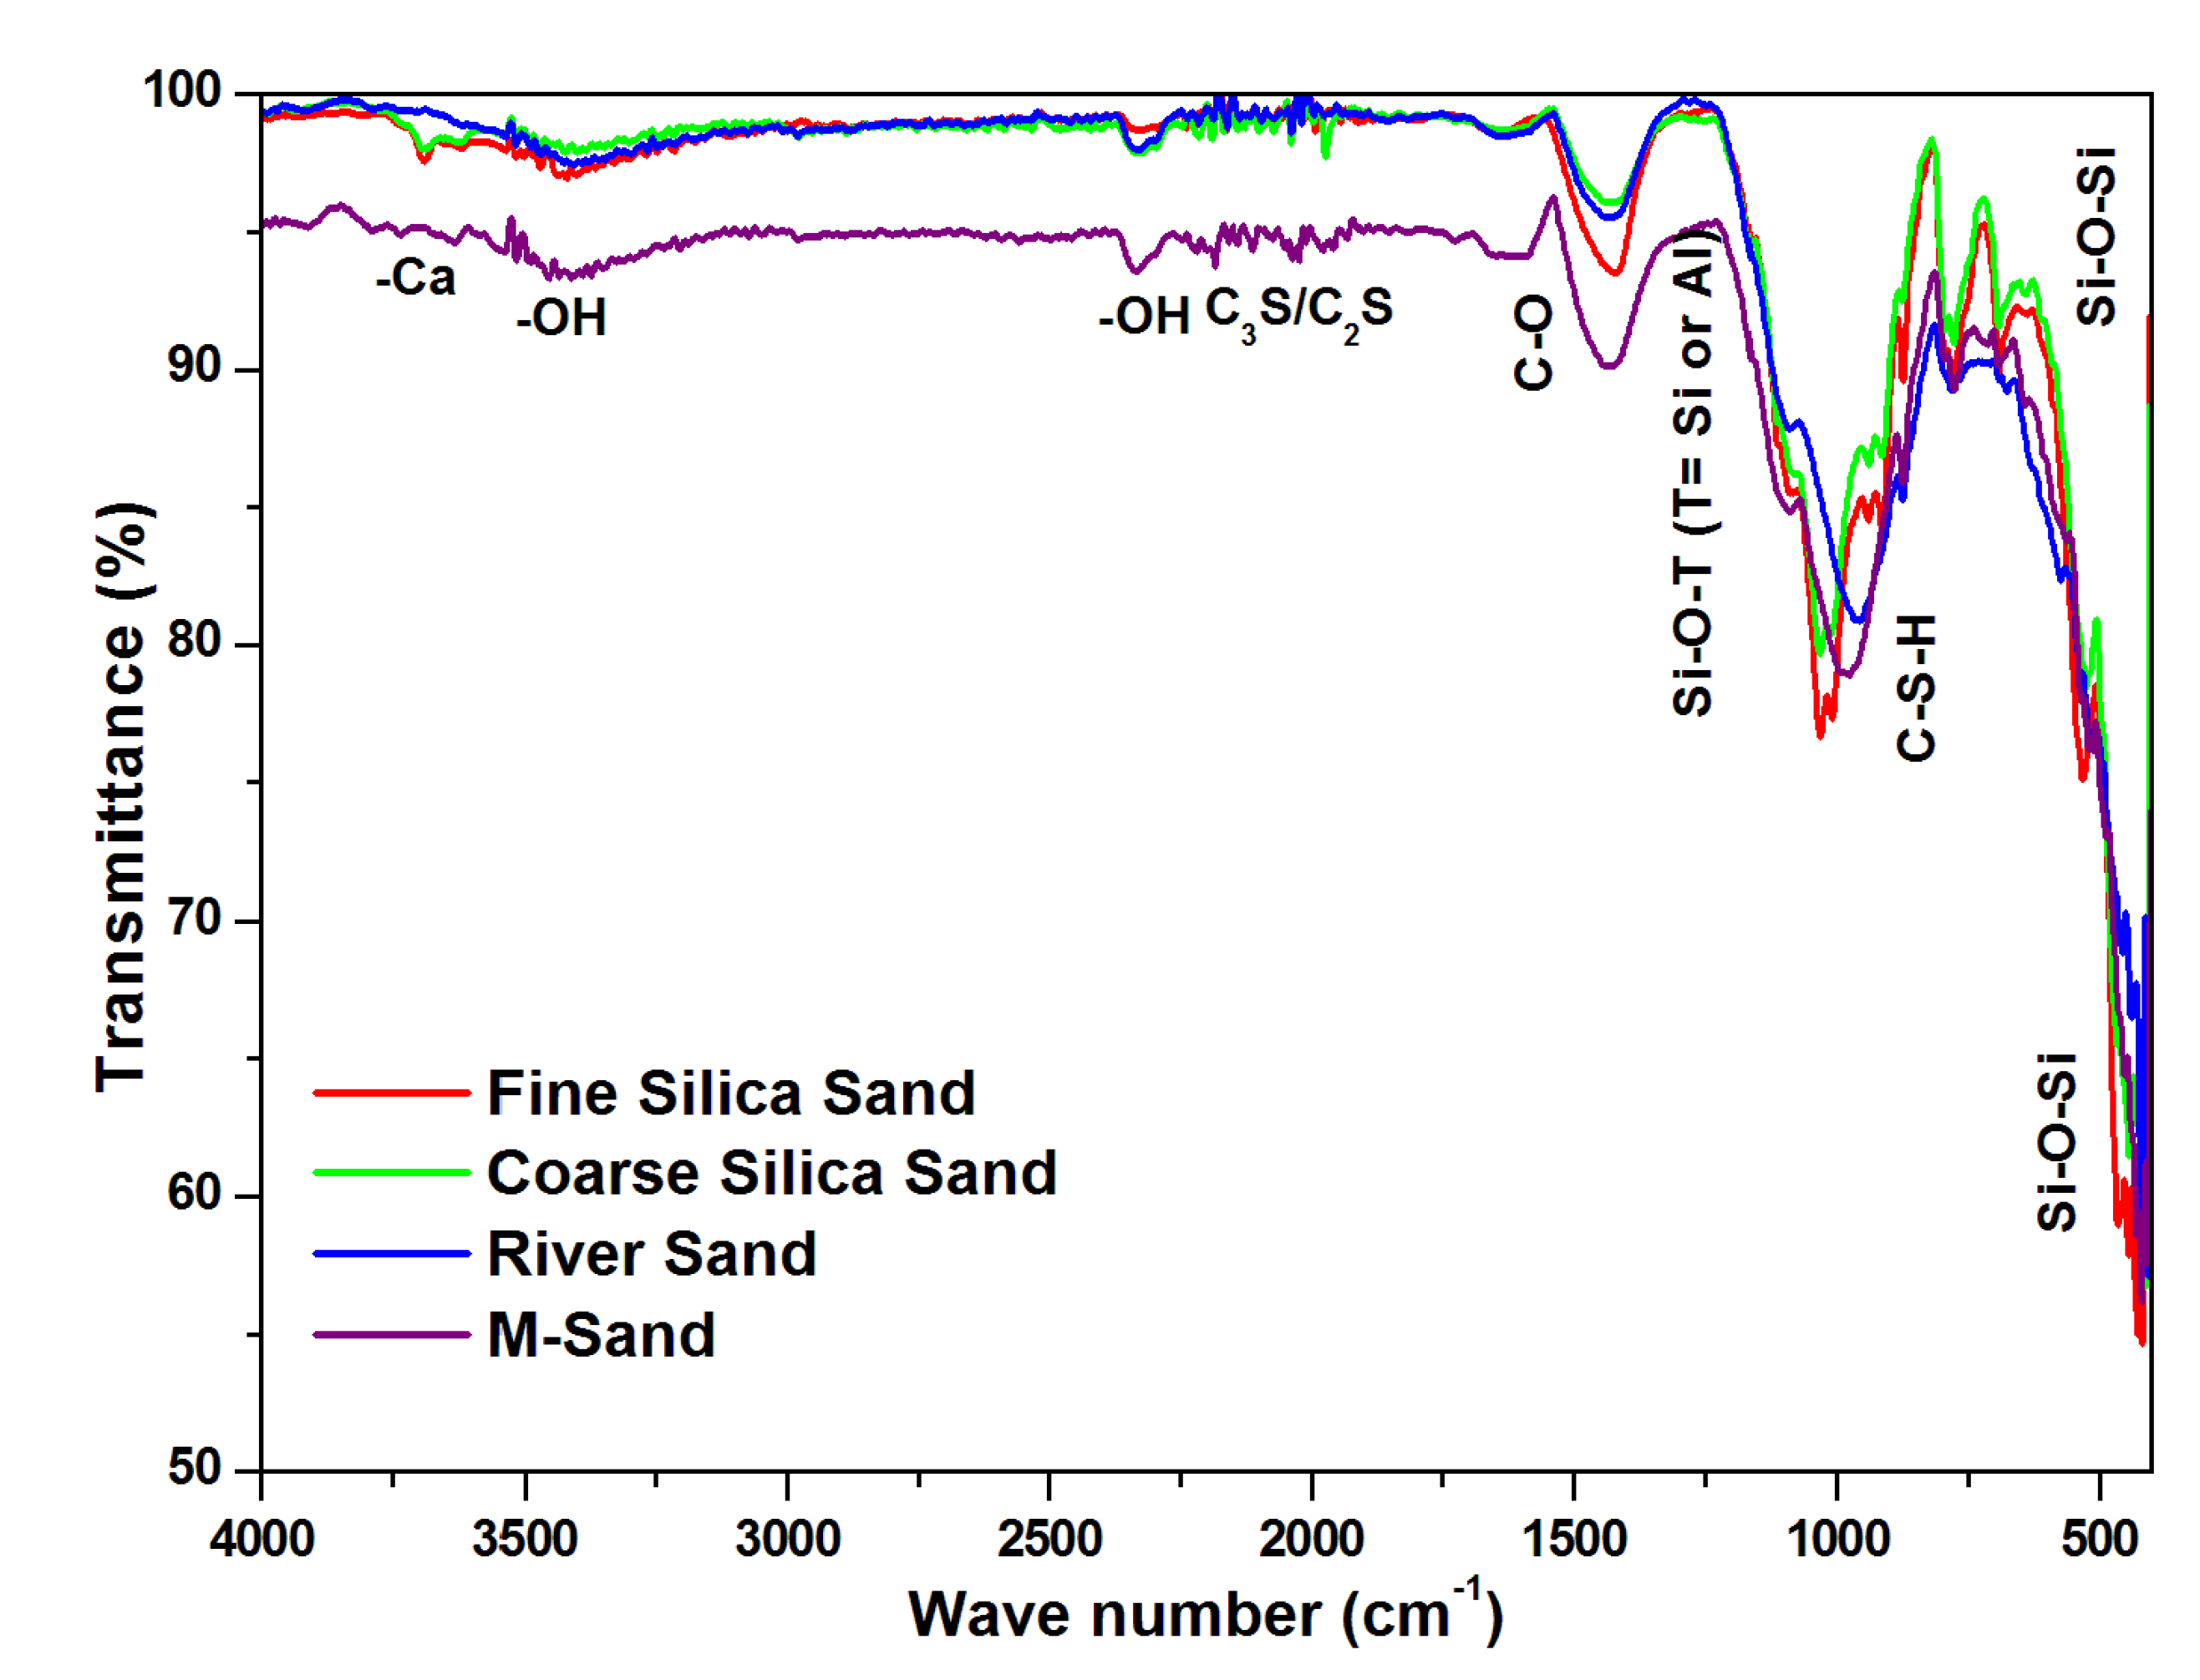
Figure 21 shows the FTIR on ATR mode pattern of concrete powder samples made of silica sand, coarse silica sand, river sand and M sand, respectively.
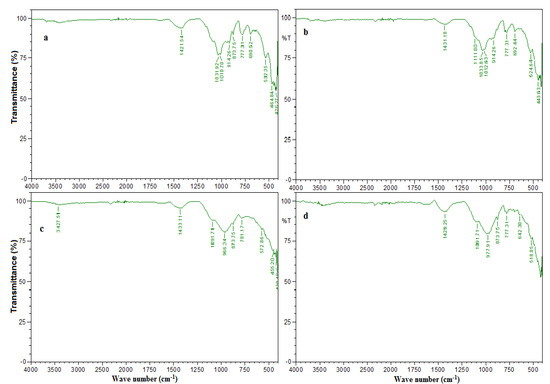
Figure 21.
FTIR graph of (a) Fine silica sand concrete, (b) Coarse silica sand concrete, (c) River sand concrete, and (d) M sand concrete.
Figure 22 compares the FTIR graph of all the four concretes. The strong asymmetric bending and stretching in the range between 400 and 700 cm−1 represents the Si-O-Si bonds [63,64,65]. This indicates the presence of major element quartz (silica dioxide) in the concrete. The strong asymmetric bending at 900–1000 cm−1 represents the formation of hydration products such as C-S-H in the concrete [63,64]. All types of concrete exhibits the more or less similar formation of hydration products. Stretching at 1200 cm−1 represents the silicates and aluminates phases formed from the cement hydration in the concrete. Bending at 1400 cm−1 represents the C-O phase and are attributed to CO3 [56]. The band at 2400 and 3400 cm−1 are of -OH stretching vibrations due to adsorbed water molecules. The water added into the concrete and used for curing gets reacted with the minerals of cement and their molecules were adsorbed in it [64,68,69]. This phase also represents the calcium hydroxide content in the concrete. The band from 1800 to 2100 cm−1 are due to the presence of anhydrous cement phase. This represents some of the unreacted clinker elements like C2S and C3S in the concrete [59]. Small bands at 3600 cm−1 are due to the presence of calcium and calcium related elements in the concrete. Fine and coarse silica sand undergoes bending while there was no change in depression at river sand and M sand concrete. Hence, silica sands concrete has greater content of calcium mineral than others. From Figure 22, it was observed that the FTIR pattern of fine silica sand, coarse silica sand and river sand are of same nature. Similarities in the stretching and bending can be observed and almost all the three are coinciding. However, FTIR of concrete produced with M sand is somewhat deviating from other three but not significantly varying in its profile.
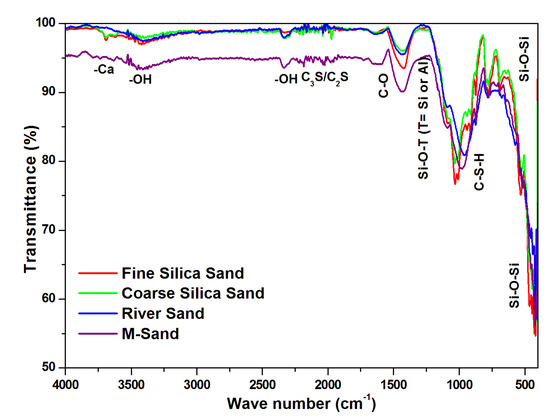
Figure 22.
Comparison of FTIR graphs.
4. Conclusions
Based on the results and discussions, following conclusions can be given as follows,
- ➢
- Based on the physical classifications, the investigated silica sand samples were falls under Zone IV, the presence of fine sand is more than the allowable limit. As per codal recommendation, the sand samples of Zone IV are not recommended for concrete construction.
- ➢
- Even the coarser sand samples (VC and TC) were also finer than river sand and M sand as viewed under the SEM. This fineness in silica sand samples is due to presence of the small fragments of iron-titanium and quartz grains.
- ➢
- As per XRF elemental composition, silica sand samples have higher silica phase than the iron and titanium phase. However, in R sand and M sand iron phase is predominant than silica.
- ➢
- Silica sand does not have any amorphous mineral phase and all minerals are in inert state as observed in XRD. Hence, it acts only as a filler in the concrete.
- ➢
- Due to the roughness of the sand particles’ surfaces, silica sand concrete is more workable than river sand and M sand concrete (by about 40%).
- ➢
- The 28 day’s compressive strength of concrete for M20 and M30 grades were observed. In that, all investigated samples were failed to achieve the nominal strength. Finer sand samples exhibit lesser strength of all mixes. Same trend was observed in split tensile strength.
- ➢
- At 28 days, the M20 grade concrete displays 24 MPa and 23.7 MPa depending on the nominal mix of river sand and M sand. While finer sand concrete (VF and TF) displays 16.6 MPa, coarser sand concrete (VC and TC) displays 18.4 MPa and 19.3 MPa.
- ➢
- At 28 days, M30 grade concrete with a nominal mix of river sand and M sand displays 30 MPa and 29.3 MPa. The compressive strengths of coarser sand concrete (VC and TC) and finer sand concrete (VF and TF) are 28.7 MPa and 29.3 MPa, respectively.
- ➢
- To improve their strength performance and coarseness, coarser sand samples (VC and TC) were added with minor percentages of R sand and M sand (10%, 20% and 30%).
- ➢
- The compressive and split tensile strength of the modified mixes perform better than the nominal silica sand mixes.
- ➢
- The mix which contains 80% coarser silica sand (TC) with 20% river sand attained the maximum bending to compression is 34.5 MPa and tensile strength of 3.5 MPa at 28 days which was greatest of all mixes.
- ➢
- The microstructure as studied by SEM, EDX, XRD and FTIR for all sand samples concrete confirms the formation of hydration products and silica sand could compete well with the nominal sands.
- ➢
- Well-developed and distributed microstructure were observed in all sand concretes. Minor phase of calcium hydroxide in all mixes indicates that it was utilized maximum in the cement hydration.
- ➢
- Microstructure images shows well developed CSH crystal and dense images were observed with silica sand mix.
- ➢
- In all the mixes, quartz (SiO2) and CSH were the major peak found. Minor peaks of C2S and C3S were found in the mixes indicating that they are almost consumed in the cement hydration.
- ➢
- In FTIR, similar bending and stretching of spectrum were observed in all concrete. Fine silica sand, coarse silica sand and river sand concrete exhibits almost same spectrum than M sand concrete. This may be due to the similar elemental composition of silica sand and river sand.
- ➢
- Results of the microstructural investigation suggest that silica sand can be conveniently used as a fine aggregate in making good quality concrete and construction materials.
- ➢
- The utilization of silica sand instead of river sand up to 30% replacement will reduces cost up to 7.5% for one cubic meter of concreting.
- ➢
- Based on the study, it is recommended to use silica sand partially in concrete as replacement for fine aggregate up to some extent for sustainable and eco- friendly construction.
- ➢
- Further study on precast Ferro cement panels and ready mix plant with silica sand will explore on effective utilization of silica sand in thin elements and for strengthening purpose.
Based on the study, it is recommended to use silica sand partially in concrete as replacement for fine aggregate. Further study on precast Ferro cement panels with silica sand will explore on effective utilization of silica sand in thin elements and for strengthening purpose.
Author Contributions
R.M.: Software, Investigation, Formal analysis, Resources, Writing—Original Draft and Visualization; S.R.R.S., A.R.P. and B.B.D.: Methodology, Resources, Data Curation and I.-M.C. and S.-H.K.: Methodology, Resources, Data Curation, Visualization and Writing—Review and Editing; M.P.: Investigation, Resources, Data Curation, Writing—Original Draft, Writing—Review and Editing, Supervision, Project administration and Funding acquisition. All authors have read and agreed to the published version of the manuscript.
Funding
This research received no external funding.
Institutional Review Board Statement
Not applicable.
Informed Consent Statement
Not applicable.
Data Availability Statement
Not applicable.
Acknowledgments
This paper was supported by the KU Research Professor Program of Konkuk University.
Conflicts of Interest
The authors declare no conflict of interest.
References
- Ren, Q.; Tao, Y.; Jiao, D.; De Schutter, G.; Jiang, Z. Rheological properties of concrete with manufactured sand: A multi-level prediction. Cem. Concr. Compos. 2022, 133, 104647. [Google Scholar] [CrossRef]
- Beddaa, H.; Ben Fraj, A.; Lavergne, F.; Torrenti, J.-M. Reuse of Untreated Fine Sediments as Filler: Is It More Beneficial than Incorporating Them as Sand? Buildings 2022, 12, 211. [Google Scholar] [CrossRef]
- Mao, W.; Cao, C.; Li, X.; Qian, J.; Dang, Y. An Experimental Investigation on the Effects of Limestone Fines in Manufactured Sands on the Performance of Magnesia Ammonium Phosphate Mortar. Buildings 2022, 12, 249. [Google Scholar] [CrossRef]
- Jignesh, K.; Vaniya, S.R. Effect of use of silica sand as fine material in concrete. Int. J. Innov. Res. Sci. Technol. 2015, 2, 266–271. [Google Scholar]
- Kazim, T.; Nehdi, M.L. Flexural toughness of sustainable ECC with high-volume substitution of cement and silica sand. Constr. Build. Mater. 2021, 270, 121438. [Google Scholar]
- Pachipala, S. A Study on Mechanical Properties of Concrete using Silica Sand as Partial Replacement of Cement. Int. J. Civ. Eng. 2017, 4, 34–39. [Google Scholar] [CrossRef]
- Chaudhary, J.L.; Harison, A.; Srivastava, V. Sand as cement replacement in PPC concrete. Int. J. Res. Eng. Technol. 2015, 4, 55–58. [Google Scholar]
- Siddique, R.; de Schutter, G.; Noumowe, A. Effect of used-foundry sand on the mechanical properties of concrete. Constr. Build. Mater. 2009, 23, 976–980. [Google Scholar] [CrossRef]
- Siddique, R.; Aggarwal, Y.; Aggarwal, P.; Kadri, E.-H.; Bennacer, R. Strength, durability, and micro-structural properties of concrete made with used-foundry sand (UFS). Constr. Build. Mater. 2011, 25, 1916–1925. [Google Scholar] [CrossRef]
- Prabhu, G.G.; Hyun, J.H.; Kim, Y.Y. Effects of foundry sand as a fine aggregate in concrete production. Constr. Build. Mater. 2014, 70, 514–521. [Google Scholar] [CrossRef]
- Bhandari, P.; Tajne, K.M. Use of foundry sand in conventional concrete. Int. J. Latest Trend. Eng. Technol. 2016, 6, 249–254. [Google Scholar]
- Md, S.; Wahab, A.; Md, A.K. A study on the mechanical properties of concrete by replacing sand with waste foundry sand. Int. J. Emerg. Technol. Adv. Eng. 2013, 3, 83–88. [Google Scholar]
- Aggarwal, Y.; Siddique, R. Microstructure and properties of concrete using bottom ash and waste foundry sand as partial replacement of fine aggregates. Constr. Build. Mater. 2014, 54, 210–223. [Google Scholar] [CrossRef]
- Daniel-Mkpume, C.C.; Okonkwo, E.G.; Aigbodion, V.S.; Offor, P.O.; Nnakwo, K.C. Silica sand modified aluminium composite an empirical study of the physical, mechanical and morphological properties. Mater. Res. Express. 2019, 6, 076539. [Google Scholar] [CrossRef]
- Shetty, K.K.; Nayak, G.; Shetty, K.R. Self-compacting concrete using red mud and used foundry sand. Int. J. Res. Eng. Technol. 2014, 3, 708–711. [Google Scholar]
- Lam, L.H.; Lam, D.D.; Duy, H.P. The effect of Vietnam’s nano-silica on mechanical properties of high-performance concrete. Transp. Comm. Sci. J. 2021, 72, 76–83. [Google Scholar]
- Rashid, R.S.M.; Salem, S.M.; Azreen, N.M.; Voo, Y.L.; Haniza, M.; Shukri, A.A.; Yahya, M.-S. Effect of elevated temperature to radiation shielding of ultra-high performance concrete with silica sand or magnetite. Constr. Build. Mater. 2020, 262, 120567. [Google Scholar] [CrossRef]
- Mahalakshmi, S.H.V.; Veerendrakumar, C.K. Experimental study on M-sand in self-compacting concrete with and without silica fume. Mater. Today Proc. 2020, 27, 1061–1065. [Google Scholar] [CrossRef]
- Arjun, N.; Vennila, A.; Sreevidya, V. Experimental study on self-compacting concrete with foundry sand and glass powder. Int. J. Chem. Technol. Res. 2017, 10, 390–395. [Google Scholar]
- Basar, H.M.; Aksoy, N.D. The effect of waste foundry sand (WFS) as partial replacement of sand on the mechanical, leaching and micro-structural characteristics of ready-mixed concrete. Constr. Build. Mater. 2012, 35, 508–515. [Google Scholar] [CrossRef]
- Gopinath, E. Experimental study on silica sand using bottom ash on metal casting. Mater. Today Proc. 2021, 46, 4884–4891. [Google Scholar] [CrossRef]
- Sadarang, J.; Nayak, R.K. Utilization of fly ash as an alternative to silica sand for green sand mould casting process. J. Manuf. Process. 2021, 68, 1553–1561. [Google Scholar] [CrossRef]
- Belmahi, S.; Mohamed, Z.; Abdelkader, H. Valuation of foundry sand in the construction sector. Leban. Sci. J. 2021, 22, 112–126. [Google Scholar] [CrossRef]
- Pilegis, M.; Gardner, D.; Lark, R. An Investigation into the Use of Manufactured Sand as a 100% Replacement for Fine Aggregate in Concrete. Materials 2016, 9, 440. [Google Scholar] [CrossRef]
- Rathore, A.; Kushwaha, P.K.; Gangwar, M. A review on use of manufactured sand in concrete production. Int. J. Adv. Res. Dev. 2018, 3, 97–100. [Google Scholar]
- Shanmugavadivu, P.M.; Malathy, R.; Sindhu, M.; Eskezia, H.; Gerba, A.F.; Gudeta, Y. The effect of manufactured sand in concrete. Int. J. Adv. Sci. Technol. 2020, 29, 4809–4820. [Google Scholar]
- Shanmugavadivu, P.M.; Malathy, R.; Sindu, M.; Eskezia, H.; Gudeta, Y. Structural properties of concrete with the replacement of natural sand by manufactured sand. J. Xidian Univ. 2020, 14, 1707–1712. [Google Scholar]
- Kothai, L.; Malathy, R. Strength studies on self-compacting concrete with manufactured sand as partial replacement of natural sand. Eur. J. Sci. Res. 2012, 89, 490–496. [Google Scholar]
- Setiati, N.R. The Potential Use of Silica Sand as Nanomaterials for mortar. In Proceedings of the 3rd International Conference on Construction and Building Engineering (ICONBUILD), Palembang, Indonesia, 14–17 August 2017; AIP Conference Proceedings, no. 1903. pp. 050010-1–050010-7. [Google Scholar] [CrossRef]
- Nathan, L.S. Study on structural behaviour of silica sand in concrete. J. Eng. Applied Sci. 2018, 13, 10837–10838. [Google Scholar]
- Poornima, V.; Ananthkumar, M.; Kumar, S.B.; Ahamed, K.I. Suitability of dolomite silica-sand in partial replacement with m- sand for cement mortar. IOP Conf. Series: Mater. Sci. Eng. 2019, 577, 012135. [Google Scholar] [CrossRef]
- IS 1489-1991; Portland-Pozzolana Cement Specification. Bureau of Indian Standards: New Delhi, India, 1991.
- IS 10262: 2019; Concrete Mix Proportioning—Guidelines. Bureau of Indian Standards: New Delhi, India, 2019.
- IS 2386-1 (1963); Methods of Test for Aggregates for Concrete, Part I: Particle Size and Shape. Bureau of Indian Standards: New Delhi, India, 1963.
- IS 383: 1970; Specification for Coarse and Fine Aggregates from Natural Sources for Concrete [CED 2: Cement and Concrete]. Bureau of Indian Standards: New Delhi, India, 1970.
- IS 2720-3-2 (1980); Methods of Test for Soils, Part 3: Determination of Specific Gravity, Section 2: Fine, Medium and Coarse-Grained Soils. Bureau of Indian Standards: New Delhi, India, 1980.
- Guedes, M.; Evangelista, L.; Brito, J.; Ferro, A.C. Microstructural characterization of concrete prepared with recycled ag-gregates. Microsc. Microanal. 2013, 19, 1222–1230. [Google Scholar] [CrossRef] [PubMed]
- Siddique, R. Effect of fine aggregate replacement with Class F fly ash on the mechanical properties of concrete. Cem. Concr. Res. 2003, 33, 539–547. [Google Scholar] [CrossRef]
- IS 1199-1959; Methods of Sampling and Analysis of Concrete. Bureau of Indian Standards: New Delhi, India, 1959.
- IS 516-2004; Method of Test for Strength of Concrete. Bureau of Indian Standards: New Delhi, India, 2004.
- IS 13311-1 (1992); Method of Non-Destructive Testing of Concrete, Part 1: Ultrasonic Pulse Velocity. Bureau of Indian Standards: New Delhi, India, 1992.
- Reddy, P.N.; Naqash, J.A. Experimental study on TGA, XRD and SEM Analysis of Concrete with Ultrafine Slag. Int. J. Eng. 2019, 32, 679–684. [Google Scholar]
- Kumar, S.V.; Rajkumar, R.; Umamaheswari, N. Study on Mechanical and Microstructure Properties of Concrete Prepared Using Metakaolin, Silica Fume and Manufactured Sand. Rasayan J. Chem. 2019, 12, 1383–1389. [Google Scholar] [CrossRef]
- El-Hassan, H.; Elkholy, S. Performance Evaluation and Microstructure Characterization of Steel Fiber–Reinforced Alkali-Activated Slag Concrete Incorporating Fly Ash. J. Mater. Civ. Eng. 2019, 31, 04019223. [Google Scholar] [CrossRef]
- Malathy, R.; Prabakaran, M.; Kalaiselvi, K.; Chung, I.M.; Kim, S.H. Comparative polyphenol composition, antioxidant and anticorrosion properties in various parts of Panax ginseng extracted in different solvents. Appl. Sci. 2021, 11, 93. [Google Scholar] [CrossRef]
- Hemapriya, V.; Prabakaran, M.; Chitra, S.; Swathika, M.; Kim, S.H.; Chung, I.M. Utilization of biowaste as an eco-friendly bi-odegradable corrosion inhibitor for mild steel in 1 mol/L HCl solution. Arab. J. Chem. 2020, 13, 8684–8696. [Google Scholar] [CrossRef]
- Malathy, R.; Arivoli, M.; Chung, I.-M.; Prabakaran, M. Effect of surface-treated energy optimized furnace steel slag as coarse aggregate in the performance of concrete under corrosive environment. Constr. Build. Mater. 2021, 284, 122840. [Google Scholar] [CrossRef]
- Yuan, G.; Prabakaran, M.; Qilong, S.; Lee, J.S.; Chung, I.-M.; Gopiraman, M.; Song, K.-H.; Kim, I.S. Cyclodextrin functionalized cellulose nanofiber composites for the faster adsorption of toluene from aqueous solution. J. Taiwan Inst. Chem. Eng. 2017, 70, 352–358. [Google Scholar] [CrossRef]
- Chung, I.-M.; Kim, S.-H.; Prabakaran, M. Evaluation of Phytochemical, Polyphenol Composition and Anti-corrosion Capacity of Cucumis anguria L. Leaf Extract on Metal Surface in Sulfuric Acid Medium. Prot. Met. Phys. Chem. Surf. 2020, 56, 214–224. [Google Scholar] [CrossRef]
- Chung, I.-M.; Malathy, R.; Priyadharshini, R.; Hemapriya, V.; Kim, S.-H.; Prabakaran, M. Inhibition of mild steel corrosion using Magnolia kobus extract in sulphuric acid medium. Mater. Today Commun. 2020, 25, 101687. [Google Scholar] [CrossRef]
- IS: 2720 (Part 5), 1985; Code of Determination of Liquid Limit. Bureau of Indian Standards: New Delhi, India, 1985.
- IS 2720-26 (1987); Method of Test for Soils, Part 26: Determination of pH Value. Bureau of Indian Standards: New Delhi, India, 1987.
- IS: 2720 (Part 40) 1977; Code of Free Swell Index of Soils. Bureau of Indian Standards: New Delhi, India, 1977.
- IS 456:2000; Plain and Reinforced Concrete–Code of Practice [CED 2: Cement and Concrete]. Bureau of Indian Standards: New Delhi, India, 2000.
- Manokaran, G.; Prabakaran, M. Evaluation of antioxidant and anticorrosion activities of Ligularia fischeri plant extract. Chem. Sci. Eng. Res. 2019, 1, 16–24. [Google Scholar] [CrossRef]
- Rabadiya, H.M.; Vaniya, S.R.; Parikh, K.B. A study on properties of self-compacting concrete using silica sand as partial re-placement of fine aggregate. Int. J. Emerging Technol. Innov. Res. 2016, 3, 59–69. [Google Scholar]
- Mohammad, T.S.; Mohammed, A.A. Ultrasonic Pulse Velocity and Morphology of High Strength Concrete with PVC Waste Aggregate. Int. J. Recent Technol. Eng. 2020, 8, 3783–3788. [Google Scholar] [CrossRef]
- Seghir, N.T.; Benaimeche, O.; Krzywiński, K.; Sadowski, Ł. Ultrasonic evaluation of cement-based building materials modified using marble powder sourced from industrial wastes. Buildings 2020, 10, 38. [Google Scholar] [CrossRef]
- Malathy, R.; Chung, I.-M.; Prabakaran, M. Characteristics of fly ash based concrete prepared with bio admixtures as internal curing agents. Constr. Build. Mater. 2020, 262, 120596. [Google Scholar] [CrossRef]
- Waghmare, S. Microstructural analysis of M30 grade concrete using scanning electron microscopy (SEM). Int. J. Eng. Res. Appl. 2020, 10, 65–71. [Google Scholar]
- Saran, A.S.A.; Harish, T. Strength, microstructure of sustainable high performance concrete. Int. J. Recent Technol. Eng. 2019, 8, 4694–4700. [Google Scholar] [CrossRef]
- Alehyen, S.; El Achouri, M.; Taibi, M. Characterization, microstructure and properties of fly ash-based geopolymer. JMES 2017, 8, 1783–1796. [Google Scholar]
- Manoharan, T.; Laksmanan, D.; Mylsamy, K.; Sivakumar, P.; Sircar, A. Engineering properties of concrete with partial utilization of used foundry sand. Waste Manag. 2018, 71, 454–460. [Google Scholar] [CrossRef]
- Chopra, D.; Siddique, R.; Kunal. Strength, permeability and microstructure of self-compacting concrete containing rice husk ash. Biosyst. Eng. 2015, 30, 72–80. [Google Scholar] [CrossRef]
- Kavitha, O.; Shanthi, V.; Arulraj, G.P.; Sivakumar, V. Microstructural studies on eco-friendly and durable Self-compacting concrete blended with metakaolin. Appl. Clay Sci. 2016, 124–125, 143–149. [Google Scholar] [CrossRef]
- Medina, C.; del Bosque, I.S.; Frías, M.; de Rojas, M.S. Design and characterisation of ternary cements containing rice husk ash and fly ash. Constr. Build. Mater. 2018, 187, 65–76. [Google Scholar] [CrossRef]
- Horgnies, M.; Chen, J.J.; Bouillon, C. Overview about the use of Fourier Transform Infrared spectroscopy to study cementitious materials. WIT Trans. Eng. Sci. 2013, 77, 251–262. [Google Scholar] [CrossRef]
- Malathy, R.; Shanmugam, R.; Chung, I.-M.; Kim, S.-H.; Prabakaran, M. Mechanical and Microstructural Properties of Composite Mortars with Lime, Silica Fume and Rice Husk Ash. Processes 2022, 10, 1424. [Google Scholar] [CrossRef]
- Stuart, B.H. Infrared Spectroscopy: Fundamentals and Applications; John Wiley and Sons Ltd.: Chichester, UK, 2004. [Google Scholar]


Publisher’s Note: MDPI stays neutral with regard to jurisdictional claims in published maps and institutional affiliations. |
© 2022 by the authors. Licensee MDPI, Basel, Switzerland. This article is an open access article distributed under the terms and conditions of the Creative Commons Attribution (CC BY) license (https://creativecommons.org/licenses/by/4.0/).