Article

Numerical and Experimental Study on the Indoor Climate in a Classroom with Mixing and Displacement Air Distribution Methods

1
Department of Mechanical Engineering, Aalto University, 02150 Espoo, Finland
2
Halton Oy, Haltonintie 1–3, 47400 Kausala, Finland
3
College of Urban Construction, Nanjing Tech University, Nanjing 211816, China
*
Author to whom correspondence should be addressed.
Buildings 2022, 12(9), 1314; https://doi.org/10.3390/buildings12091314
Submission received: 1 August 2022 / Revised: 25 August 2022 / Accepted: 26 August 2022 / Published: 27 August 2022
(This article belongs to the Section Building Energy, Physics, Environment, and Systems)

Abstract

:
One main challenge of air distribution in classrooms is to guarantee ventilation performance under different usage conditions. In this study, the indoor climate in summer and winter conditions with different occupancy densities in the classroom is presented. Thermal condition measurements of a half-size classroom were performed in a test room with four air suppliers: wall-grilles, ceiling diffusers, perforated duct diffusers, and displacement ventilation. Those measured data were used for CFD validation of the whole classroom. With CFD simulations, indoor climate parameters with different air diffusers are compared in summer and winter conditions. The results show that displacement ventilation gives the best performance in the occupied zone. The air change efficiency can be reached with displacement ventilation of 1.4 and of only 1 with the other three air diffusers. The air velocities were reasonably low (<0.3 m/s), and the indoor was quite uniform with ceiling diffusers, which is another well-performing solution for classrooms. Corridor wall-grilles give uniform thermal conditions but can have high velocities (0.4 m/s) on the perimeter side of the room space. The air distribution from the perforated duct diffuser is unstable, which causes high local draft (over 20%) in the occupied zone.

1. Introduction

A classroom environment is important for children as they may spend substantial time inside. However, some classrooms cannot provide a satisfactory indoor climate for children [1]. Poor indoor climate causes some adverse effects on pupil health, shortened concentration, and impaired performance on standardized tests [2]. This is especially important in the Nordic countries, where it is cold most of the time of the year and pupils spend longer indoors. However, a good indoor climate can not only improve children’s learning performance but also increase teachers’ work productivity [3]. Adequate outdoor airflow rates should be used [4,5] and suitable air distribution should be carefully provided for an acceptable indoor climate.
Previous studies have widely analyzed the effects of the indoor climate on children’s performance. Wargocki and Wyon [6] investigated the effect of classroom conditions on learning performance. The results show that the indoor climate most of classrooms cannot fulfill the relevant requirements. Children’s performance can be decreased by 30% due to inadequate outdoor airflow rate and high CO2 concentration. A better environment that includes favorable light, acoustics, and temperature can help students learn better. In many cases, improving these attributes can also reduce energy consumption. The productivity can be improved 25% if the indoor climate, acoustic environments, and high-performance lighting systems are presented [7].
ASHRAE standard 66 [8] recommends minimum ventilation rate of 8 L/s/person for classrooms. IAQ in schools is primarily evaluated by CO2 concentrations. Many international standards recommend a maximum concentration level of 1000–1200 ppm to satisfy perception criteria concerning human bio effluents [9,10,11,12]. To fulfill this target, the guidelines published by FINVAC [13] require the minimum airflow rate to be 6 L/s/person.
Spaces with high occupant densities result in high heat gains and a need for a relatively high air change rate when all-air systems are used for cooling. Employing traditional air distribution strategies, it becomes a challenge to supply large amounts of air into a space without creating local discomfort for occupants. It should be also noted that the actual air distribution could also be varied significantly spatially and temporally under different heat gain conditions. Due to the indoor airflow pattern being influenced by the convection flows arising from heat loads [14,15,16], the airflow pattern is strongly dependent on the distribution and strength of heat gain.
Previous studies [17,18] presented results for mixing ceiling supply device, bag-supply devices, displacement ventilation, and down-to-floor impinging jet supply devices tested in a full-size classroom with simulated occupancy as well as computational fluid dynamics (CFD) modeling. The results showed the CFD simulation can give very promising results with measured surface temperatures as boundary conditions. The CFD simulation is also capable of predicting thermal comfort conditions, the age of air, and ventilation effectiveness. The airtightness of garages [19] and passive houses [20] were analyzed by the Ansys Fluent simulation program. CO2 concentration was as indicator to show the effect of airtightness on air quality.
The indoor climate in the classroom using confluent jets with full-scale measurements was measured with different thermal conditions in classrooms [21]. Then CFD simulation were used to verify the measurement data including ventilation effectiveness, air exchange effectiveness, the effect of flow rate, the effect of solar heat gain, and the effect of supply temperature. Additionally, the comparison of an impinging jet ventilation system and a wall displacement ventilation system was theoretically and experimentally investigated [22]. The performance of underfloor air distribution systems [23] was studied by numerical simulation with a multi-objective optimization approach. The simulation outcomes demonstrate the optimal parameters for thermal comfort, indoor air quality (IAQ), and energy saving in a densely occupied classroom. A wall-mounted displacement ventilation system was experimentally analyzed, including distributions of air velocity, air temperature, and contaminant concentration, and validated by the subsequent CFD model [24]. The performance of the diffuse ceiling inlet in the classroom was measured and the data was validated by the detailed large eddy simulation model with the aim to evaluate an indoor comfort numerically [25].
The previous full-scale test showed a thermal environment in the half-size classroom with four typical air distribution methods [26]. However, due to the limitation of size of the test room, the thermal environment and indoor air quality under the same thermal conditions in the whole-size classroom is not clear. The main target of this paper is to investigate the indoor climate with four air diffusers in both winter and summer conditions with different occupancy densities in a full-size classroom.
In this paper, these effects were evaluated with different air distribution arrangements, which are critical factors for the design of effective classroom air distribution solutions. The proposed CFD modeling was firstly validated by the measured temperature in the full-scale test. Full-scale tests were conducted in a chamber, and CFD simulation results were validated by the measurement results. Then IAQ was evaluated with air change efficiency with four air diffusers by numerical study. The location and level of the heat gains in the summer or winter may influence the indoor airflow patterns. The novelty of this paper comes from the analysis of the performance of four typical air diffusers by experimental test and numerical simulation, which were studied in both winter and summer conditions with different occupancy densities to ensure operation in different weather and classroom usage situations.

2. Methodology

2.1. Mixing and Displacement Air Distribution Methods

The analyzed air distribution methods are wall-grille (WTS-450-100), displacement ventilation unit (AFQ-125) on the floor, ceiling diffuser (TCV-160/A R4), and perforated duct diffuser (HPS-160), as shown in Figure 1.

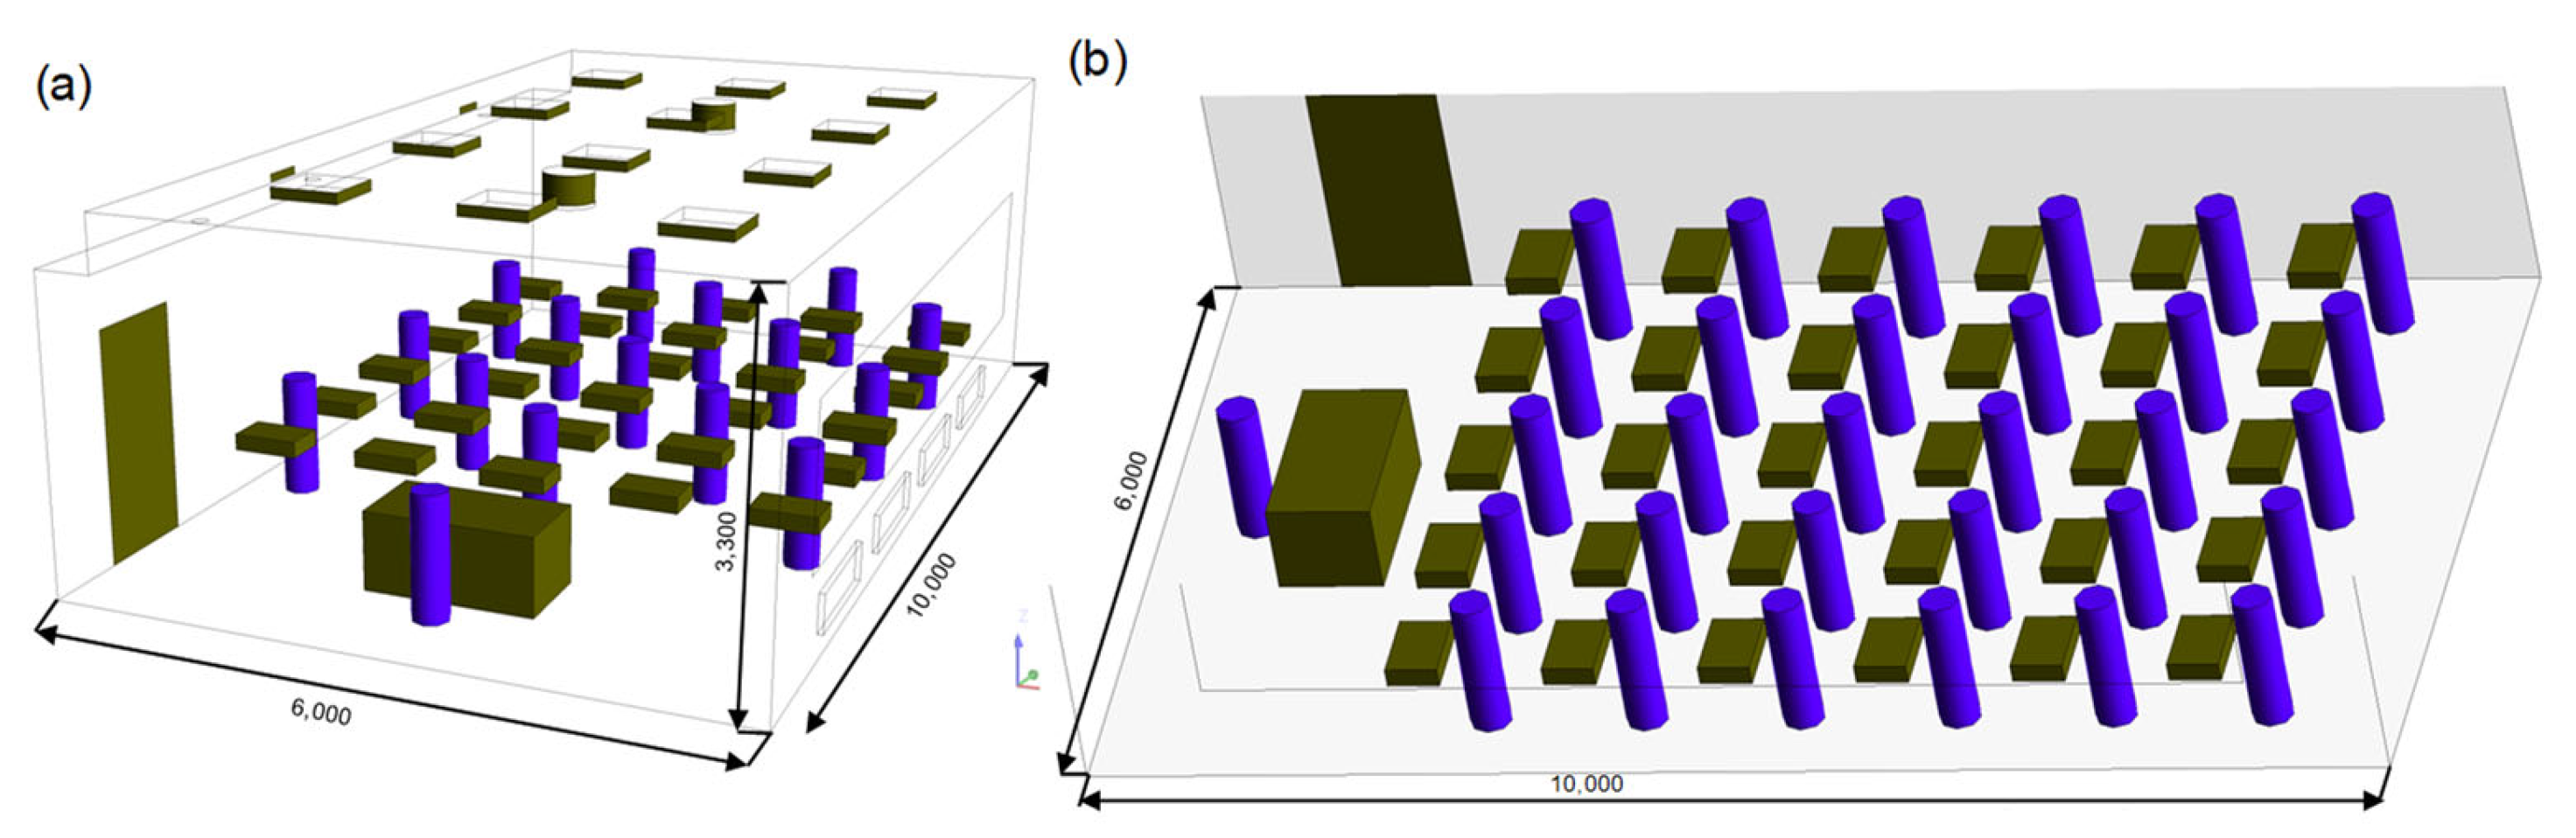
2.2. Full-Scale Laboratory Test

The thermal condition of the half-size classroom was measured by full-scale laboratory test. The size of the half-classroom is 6.0 m × 4.4 m × 3.3 m (height), as shown in Figure 2. The half-classroom results were published in an earlier paper [26]. In the full-scale laboratory test, the air temperature was measured by PT 100 class A with accuracy of ±(0.15 °C + 0.2%). The air velocity was monitored by omnidirectional velocity sensor with accuracy of ±1%. The airflow rate was measured by orifice plate with differential pressure transmitter with accuracy of ±1%. The water flow rate was measured by Krohne electromagnetic flowmeter with accuracy of ±0.5%.

2.3. Numerical Validation and Whole Classroom Simulation

The computational fluid dynamics (CFD) software was used to simulate the same set-up of full-scale case. The parameters of CFD models are shown in Table 1, reprinted/adapted with permission from Ref. [27] (copyright 2011, Indoor Air, ISIAQ). CFD-simulations were used to investigate the airflow field in the classroom with four air distribution methods and compared the similarity with the measured results. The grid density level with the wall-grille was shown in Figure 3.
The indoor climate of the whole classroom was simulated in full-occupied summer and part-occupied winter conditions, as shown in Figure 4. In the simulated whole classroom, there are two wall-grilles located on the corridor wall facing the window. Two semi-round displacement low velocity units are installed close to wall behind the teacher’s desk. In the middle of the ceiling, there are two ceiling diffusers and perforated duct diffusers. A total of four air exhausts are installed near the wall-grilles’ side in the ceiling.
The supplied airflow rate was 180 L/s (3.0 L/s/m2) in both summer and winter. Heat balance in the simulated cases is described in Table 2. The selected cases present the maximum and minimum cooling loads. The maximum cooling represents the fully occupied classroom in the summer conditions. The minimum cooling represents the half-occupied classroom in the winter conditions. This describes the possible range of the cooling load with the different number of pupils in the lecture. In summer conditions, there are 31 people in the classroom and the surface temperature of the window is 30 °C. The maximum effect of the heat gains from solar load and occupants was investigated with different air distribution methods. In winter conditions, there are 16 people in the classroom, and the surface temperature of the window is 11 °C. In addition, there is a 500 W radiator underneath the window in the winter conditions. Due to the heat balance in the winter, the number of occupants is 16 people. The minimum effect of the heat gain from occupants and heat loss from window were investigated. The design room air temperatures are 26 °C and 21 °C [29] in summer and winter conditions, respectively.

2.4. Evaluation Indices

The thermal conditions in this paper were assessed by draft risk. The draft rate (DR) is as given by Equation (1):
DR = ( 34 t a , l ) ( u ¯ a , l 0.05 ) 0.62 ( 0.37 · u ¯ a , l · Tu + 3.14 )
where t a , l is the local mean air temperature, u ¯ a , l is the local mean air speed, and Tu is the local turbulence intensity.
Ventilation efficiency of four air diffusers were simulated by the concept of the air change efficiency (ACE).
A C E = τ n 2 τ ¯ · 100 %
where τ n is nominal age of air and τ ¯ is the mean age of air.

3. Results

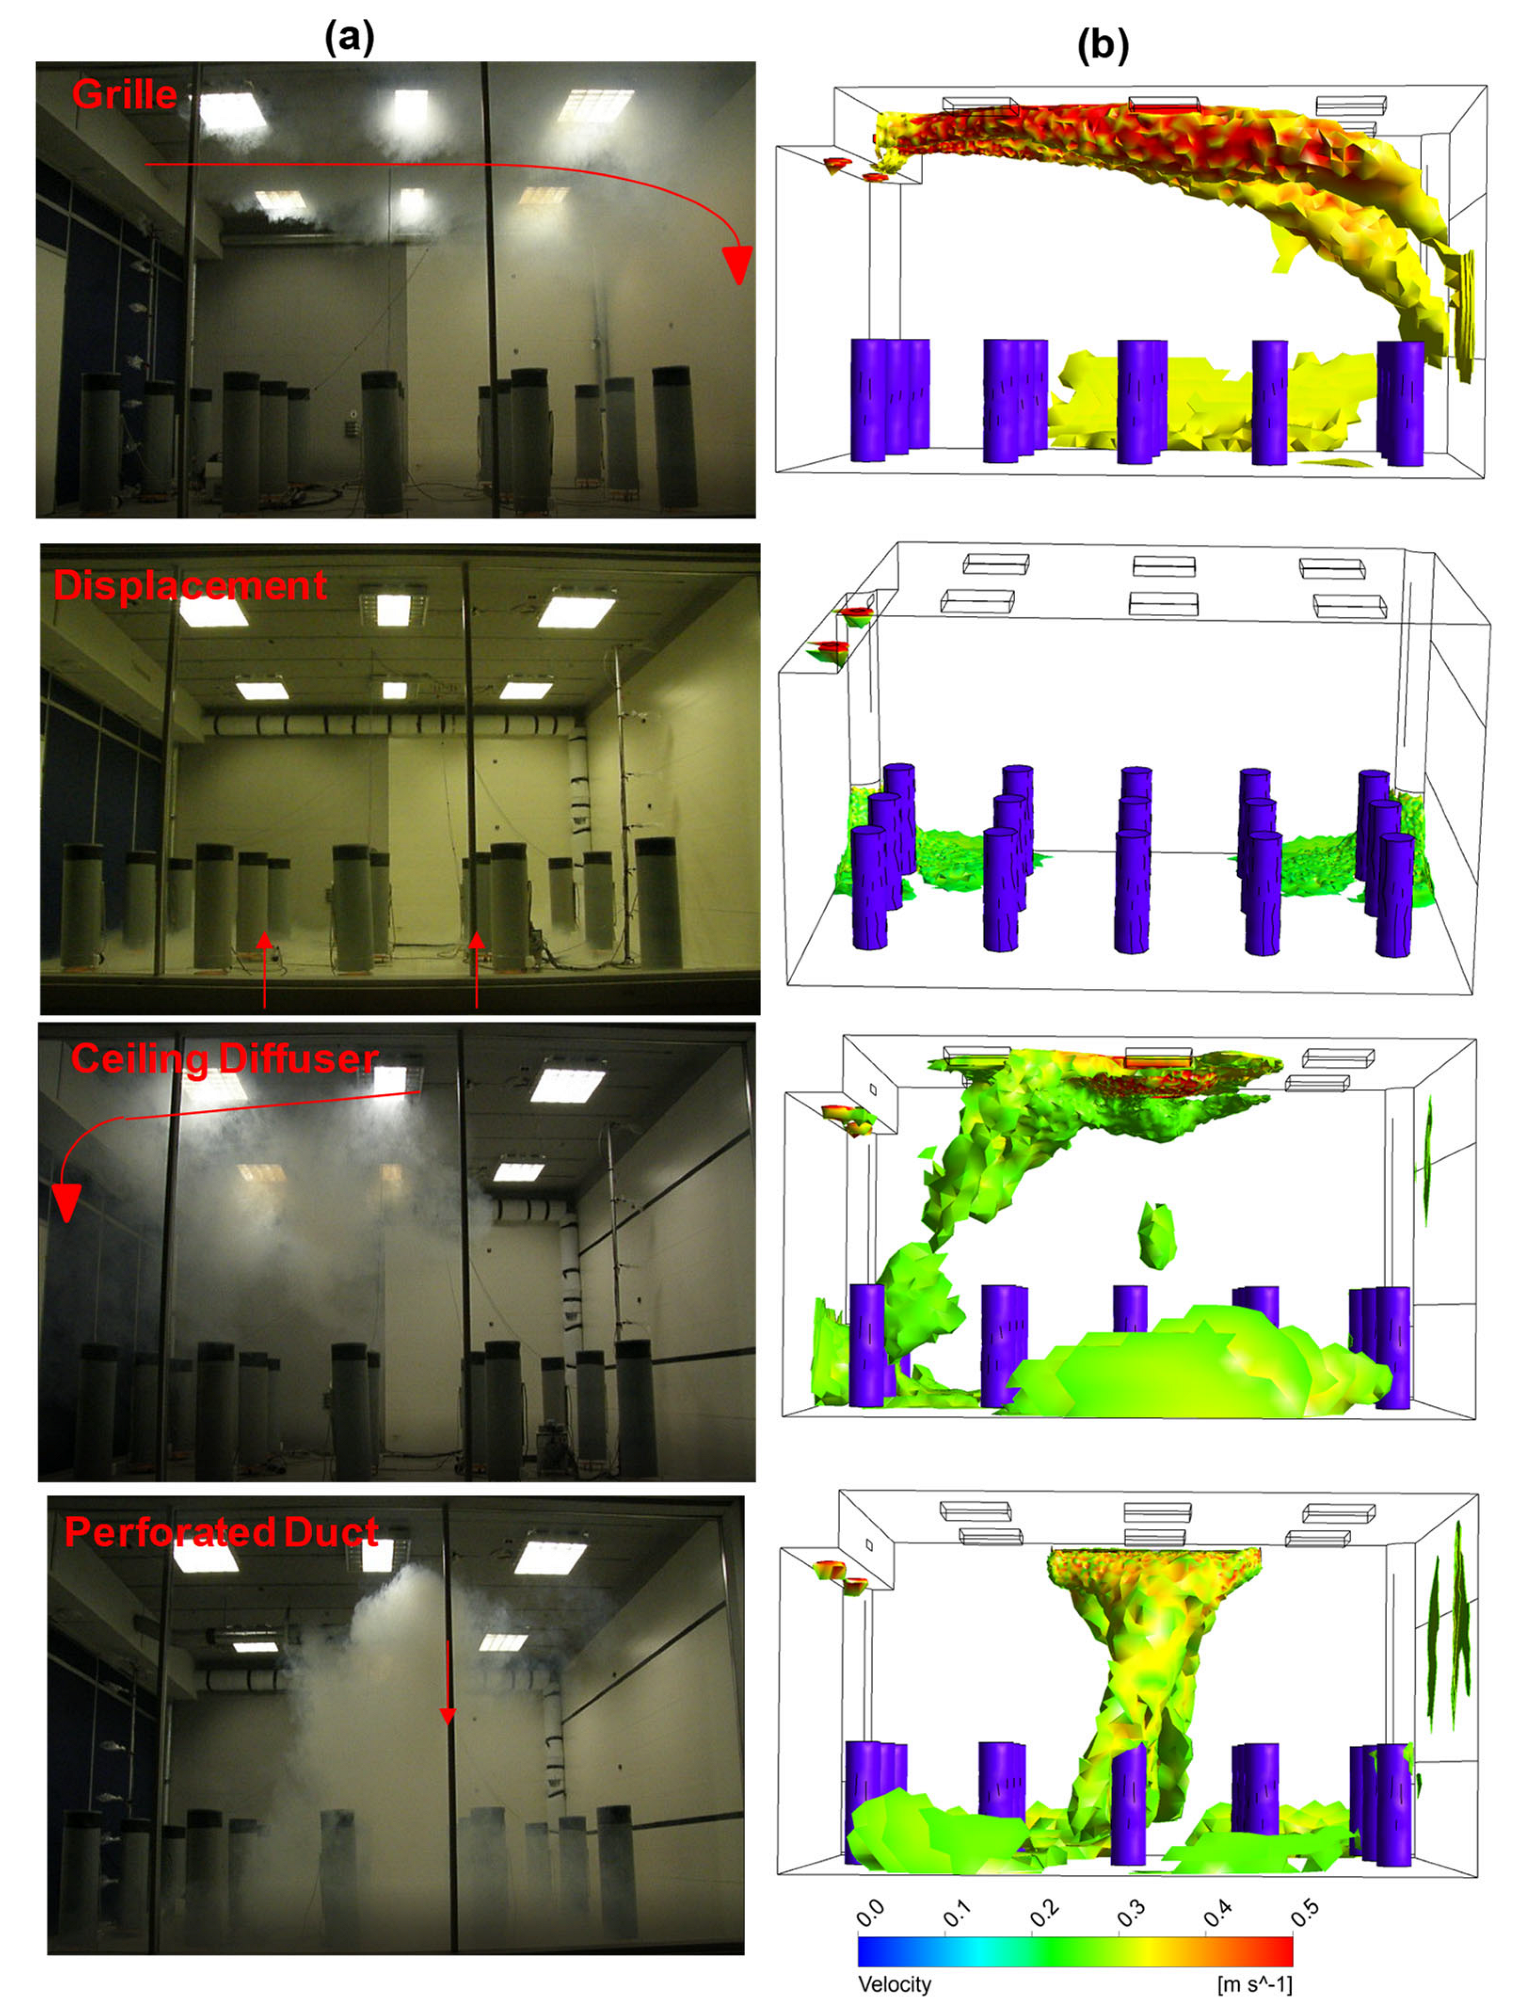
3.1. Airflow Patterns

Supply airflow patterns were compared with smoke visualization in the laboratory tests and simulated data (Figure 5). The tests were conducted in a mock-up of the half-size classroom with different air distribution methods in summer conditions. The selected ventilation strategies are different. The air distribution of wall-grille and ceiling diffuser is high momentum flux. The perforated-duct and displacement ventilation strategies are low momentum flux.
The smoke visualization and CFD simulation confirmed that the air jet from a wall-grille was quite forceful to arrive at the opposite direction of the space, even though the wall-grilles can make the air jet flow more evenly horizontal. Hence, the air distribution of a high momentum wall-grille was not affected by the convective flow generated by the warm window. The air jet from the wall-grille was attached to the ceiling zone with high initial velocity and then turned down along the surface of the simulated window. CFD simulation depicts that velocity iso-volume was over 0.35 m/s. Finally, the supply air was mixed with the room air. The supply air from the displacement units spread effectively to the whole occupied area at floor level and then rose. Therefore, this indicates that displacement ventilation is able to create a quite uniform condition over the whole floor area. By CFD simulation, it is possible to see that the velocity iso-volume was only 0.2 m/s. However, the air jet with the ceiling diffuser together with a thermal plume flowed opposite the window wall in the summer conditions. However, the airflow pattern of the ceiling diffuser was more uniform in the winter [26]. The perforated duct diffuser tended to create a downwards airflow in the middle of the classroom. This airflow pattern may cause local thermal discomfort under the perforated duct. CFD simulation shows that the velocity iso-volume with the perforated duct and ceiling diffuser was over 0.25 m/s.

3.2. Validation between Full-Scale Test and Simulated Data

The measured and simulated air temperature are compared in the middle of the half-classroom (Section A-A in Figure 2). Results show the measured and simulated temperatures are reasonably close to each other from points 10 to 15 (Table 3). The average measured temperature was 0.8 °C lower than the simulated temperature at these points with the wall-grille, but with the displacement ventilation unit and perforated duct, the measured temperature was 0.8 °C and 0.6 °C higher. The temperature difference with the ceiling diffuser was the smallest, at only 0.1 °C. Similarly, the velocity difference can be ignored with the displacement ventilation. For the thermal comfort analysis, it is especially important to model accuracy conditions in the occupied zone. The CFD results show high accuracy for the air temperature in the occupied zone (0.1–1.8 m).

3.3. Simulated Cases with Whole Classroom

In Section 3.2, the CFD models of the half-size classroom for each air distribution are validated with the full-scale measurements. To analyze the performance of typical air distribution in the real whole-size classroom, in this section, the thermal comfort of the whole-size classroom (Figure 3) with four air distribution methods was simulated, and the indoor air quality was analyzed. The thermal conditions for the simulated whole classroom were shown in Table 2. In the summer case, there are 31 people in the classroom and the average heat flux is 51 W/m2. In the winter case, there are 16 people in the classroom and the average heat flux is 39 W/m2.

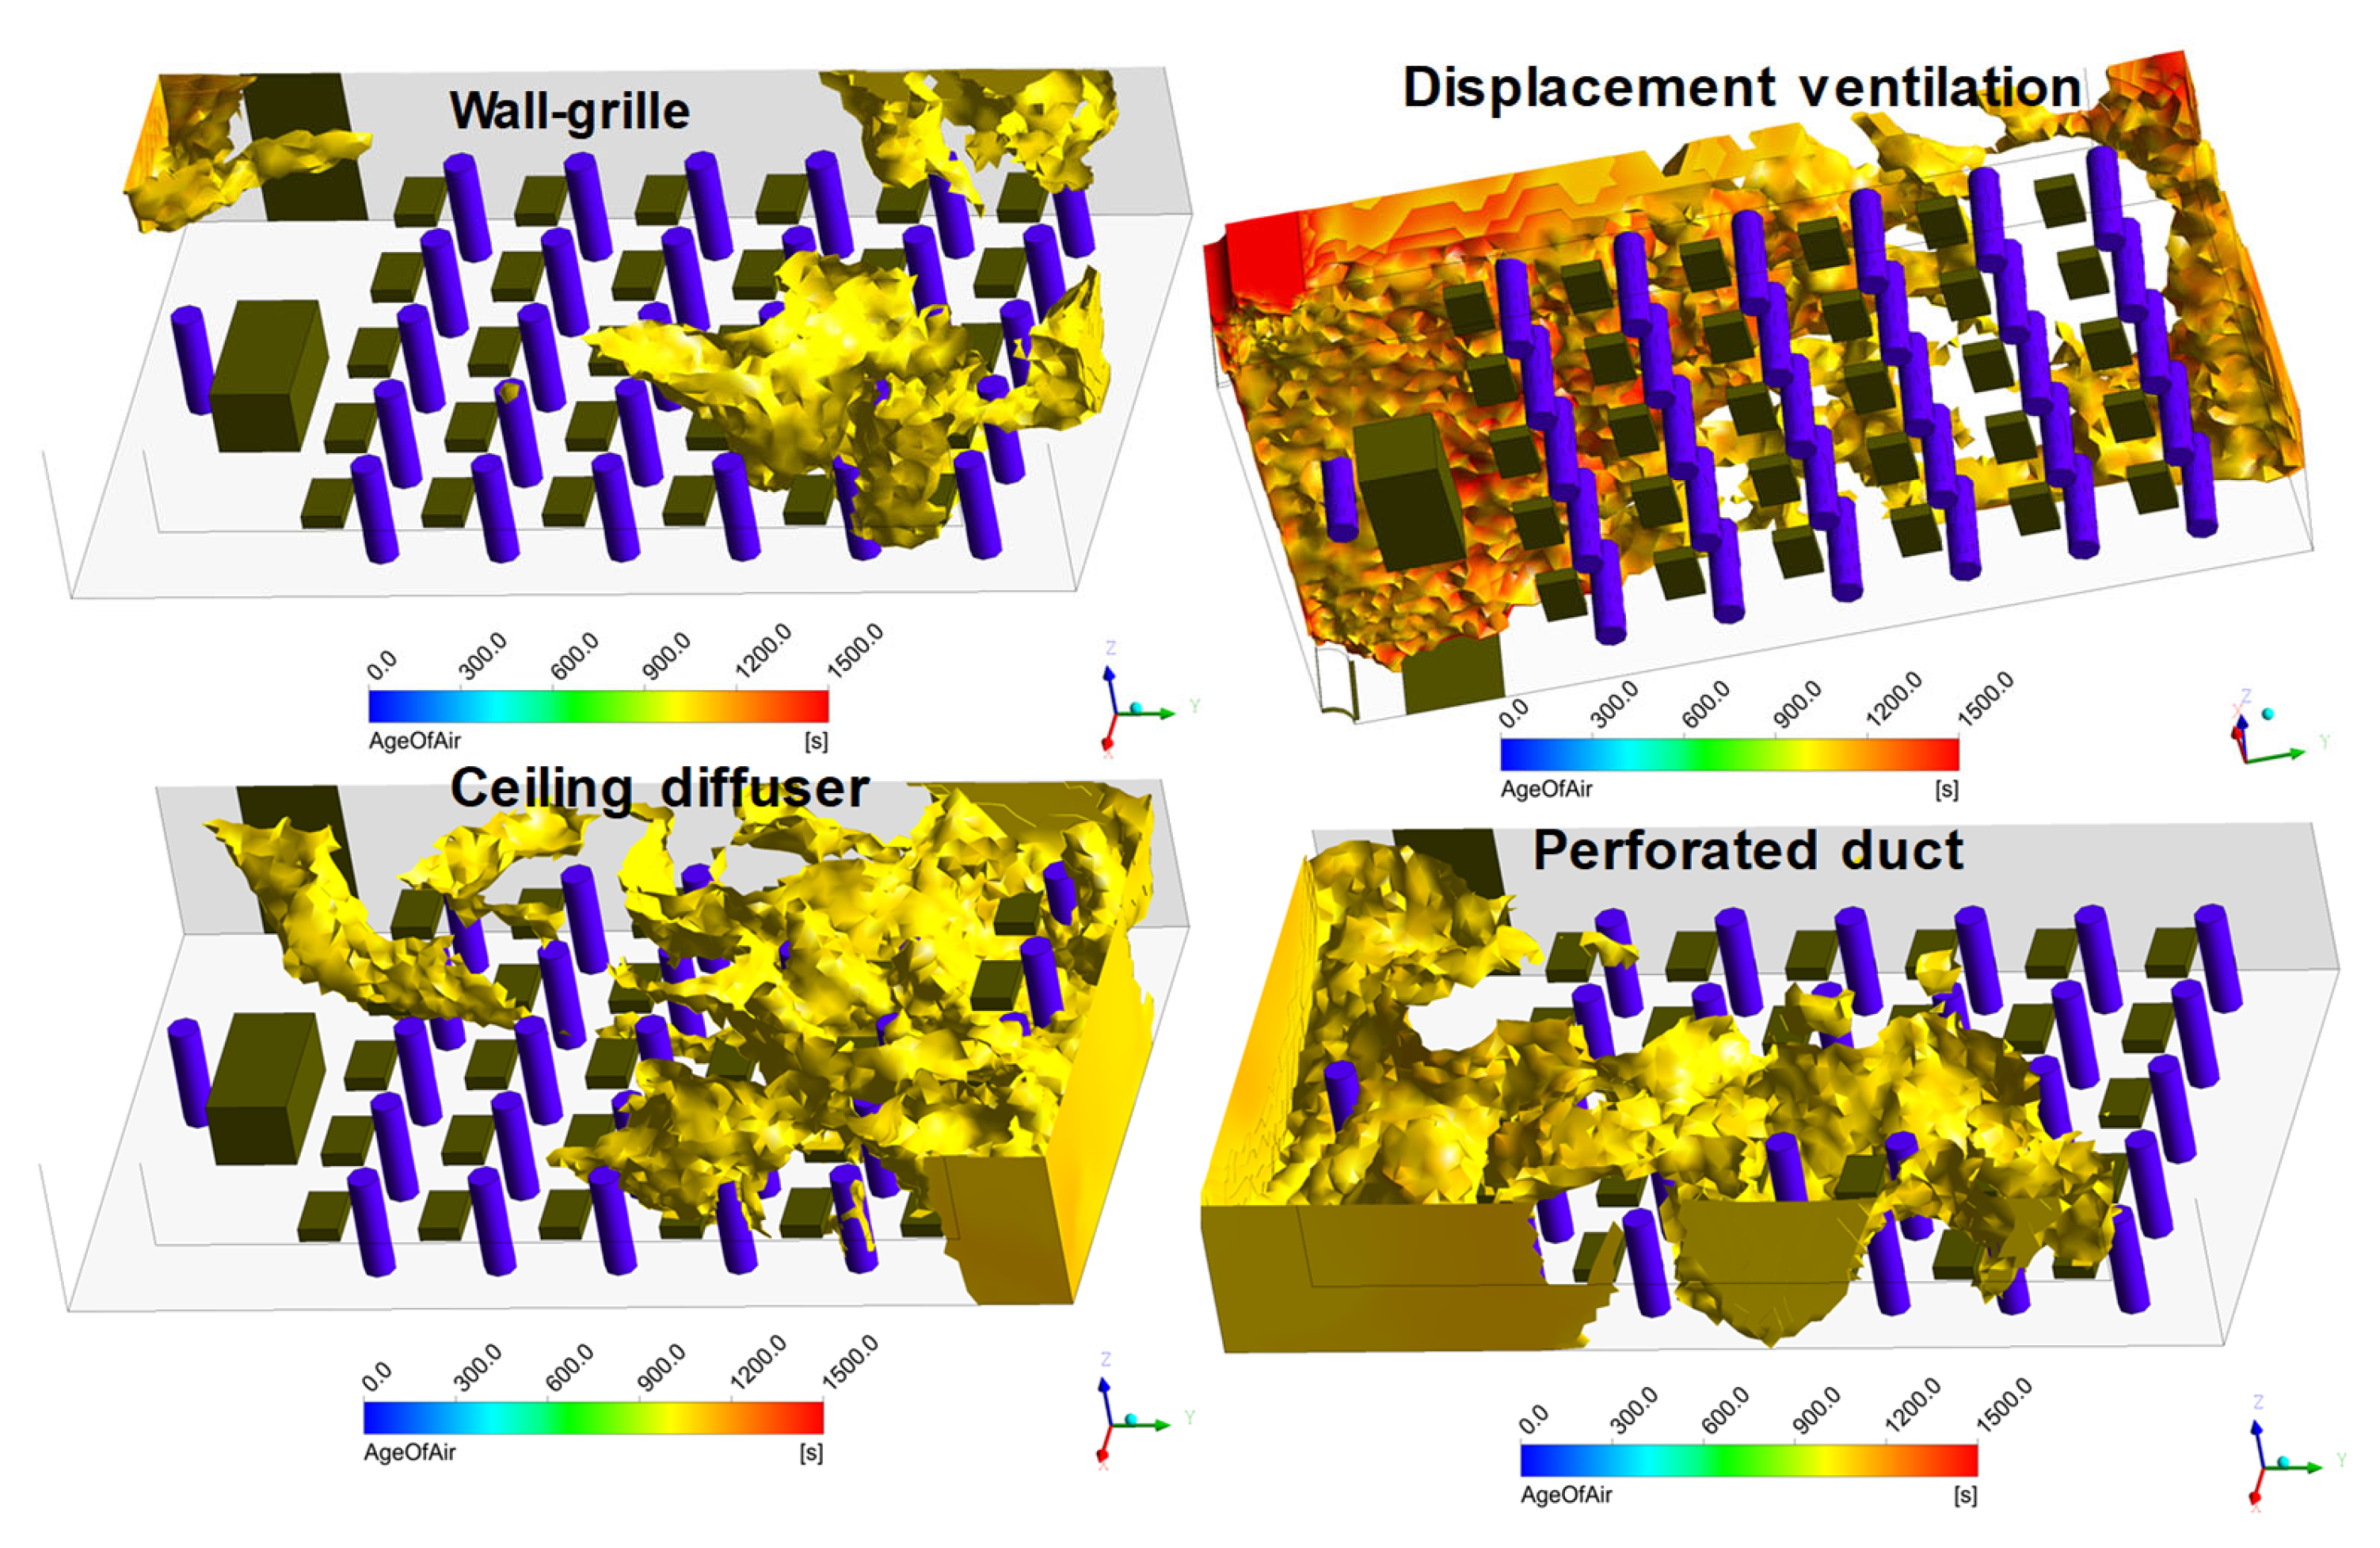
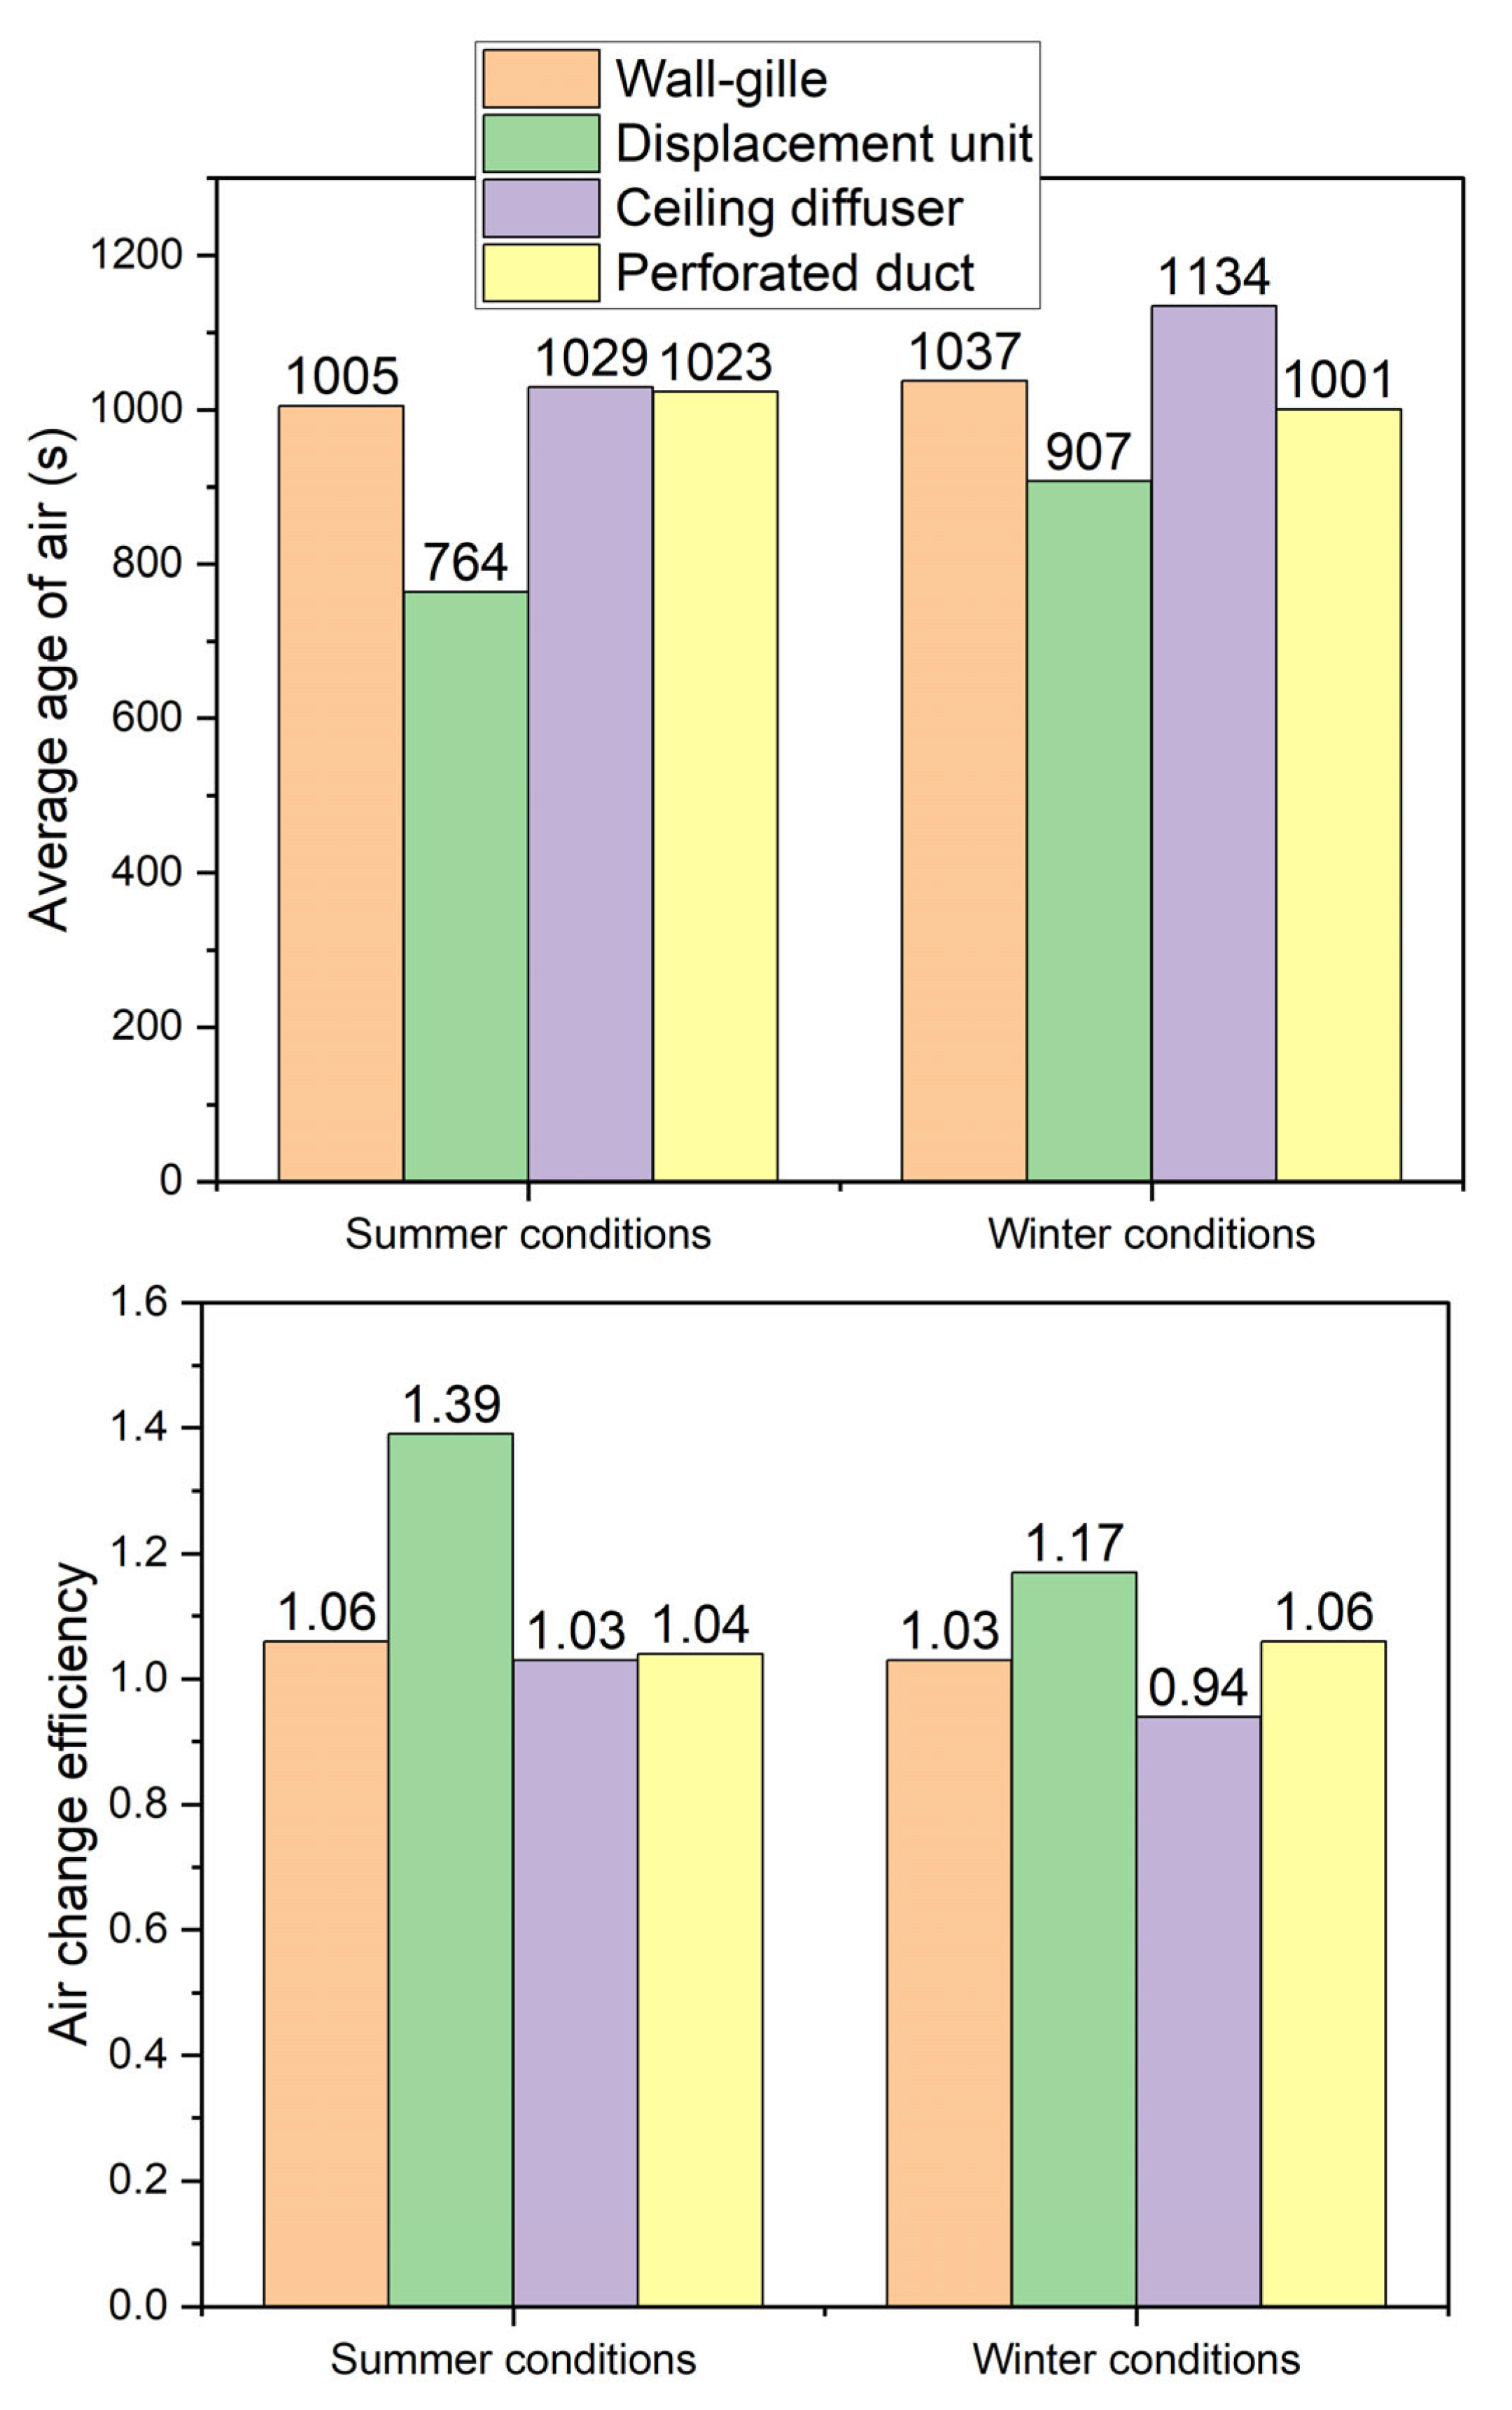
3.3.1. Age of Air and Air Change Efficiency

The age distribution of air was simulated in the summer and winter conditions in the occupied zone, as shown in Figure 6 and Figure 7. Compared with the fully mixed condition, where the age of air is the same everywhere with the same supply airflow rate [33], the age distribution of air with displacement units was superior to other three diffusers in the occupied zone. This is because the supply air from displacement units leads the pollutant gradient in the occupied zone. The age of the air in most area was younger than the fully mixed condition except in the zone near the displacement units (the teacher side) in summer and far from the displacement units (the other side of the classroom) in winter. Because the air jet can directly arrive in the middle of the space with the ceiling diffuser and perforated duct, the age of the air in the middle of the classroom was much younger than in the perimeter areas.
Effective air distribution with good air quality can be achieved in nearly all parts of the room with four types of air diffusers. The simulated air distribution was also observed with smoke visualizations in the full-scale tests.
The average age of air in the occupied zone and air change efficiency are presented in Figure 8. In general, the average age of the air in the summer is lower than that in the winter because of higher thermal plume enhancing the mixing; hence, the performance regarding air change efficiency of the four diffusers in the summer is better than in the winter. Except for the displacement unit, the air change efficiencies with the other three air distribution methods were around 1. This means that the functions of the wall-grille, ceiling diffuser, and perforated duct were similar, with ideal mixing air distribution. The average age of air with displacement unit was 764 s and 907 s in the summer and winter conditions, respectively, which is much younger than the fully mixed ventilation (1065 s). With displacement ventilation, the air change efficiency can reach 1.4 in the summer conditions.
In the analysis conducted, displacement unit created the best average indoor air quality in the occupied zone. Nonetheless, Figure 9 shows slower replacement of air occurred in some local areas. (Reprinted/adapted with permission from Ref. [27]. Copyright 2011, Indoor Air, ISIAQ.) In the summer conditions with 31 pupils indoors (Figure 9a), when units are located at the teacher’s side of the classroom, slower replacement of air happened at the zone near the displacement units, but in the other areas, the supply air was quite fresh. The reason for this should be that the supplied cold air with higher density and gravity at the classroom corner is slower to achieve full mixing. Most heat gains are located at another end where the fresh air rises up. However, in the winter conditions (Figure 9b), the area with poor air quality is far from the displacement units. This is because the thermal plume of the pupils raises the supplied air before it reaches the back side of the classroom. Additionally, the difference between supply air and room air temperature is smallest in the winter case, so it is mixed most easily with room air before reaching the other end of the room. To solve these problems, four low velocity units can be used in each corner of the room. Additionally, locating two units in two corners of the long wall would perform better.

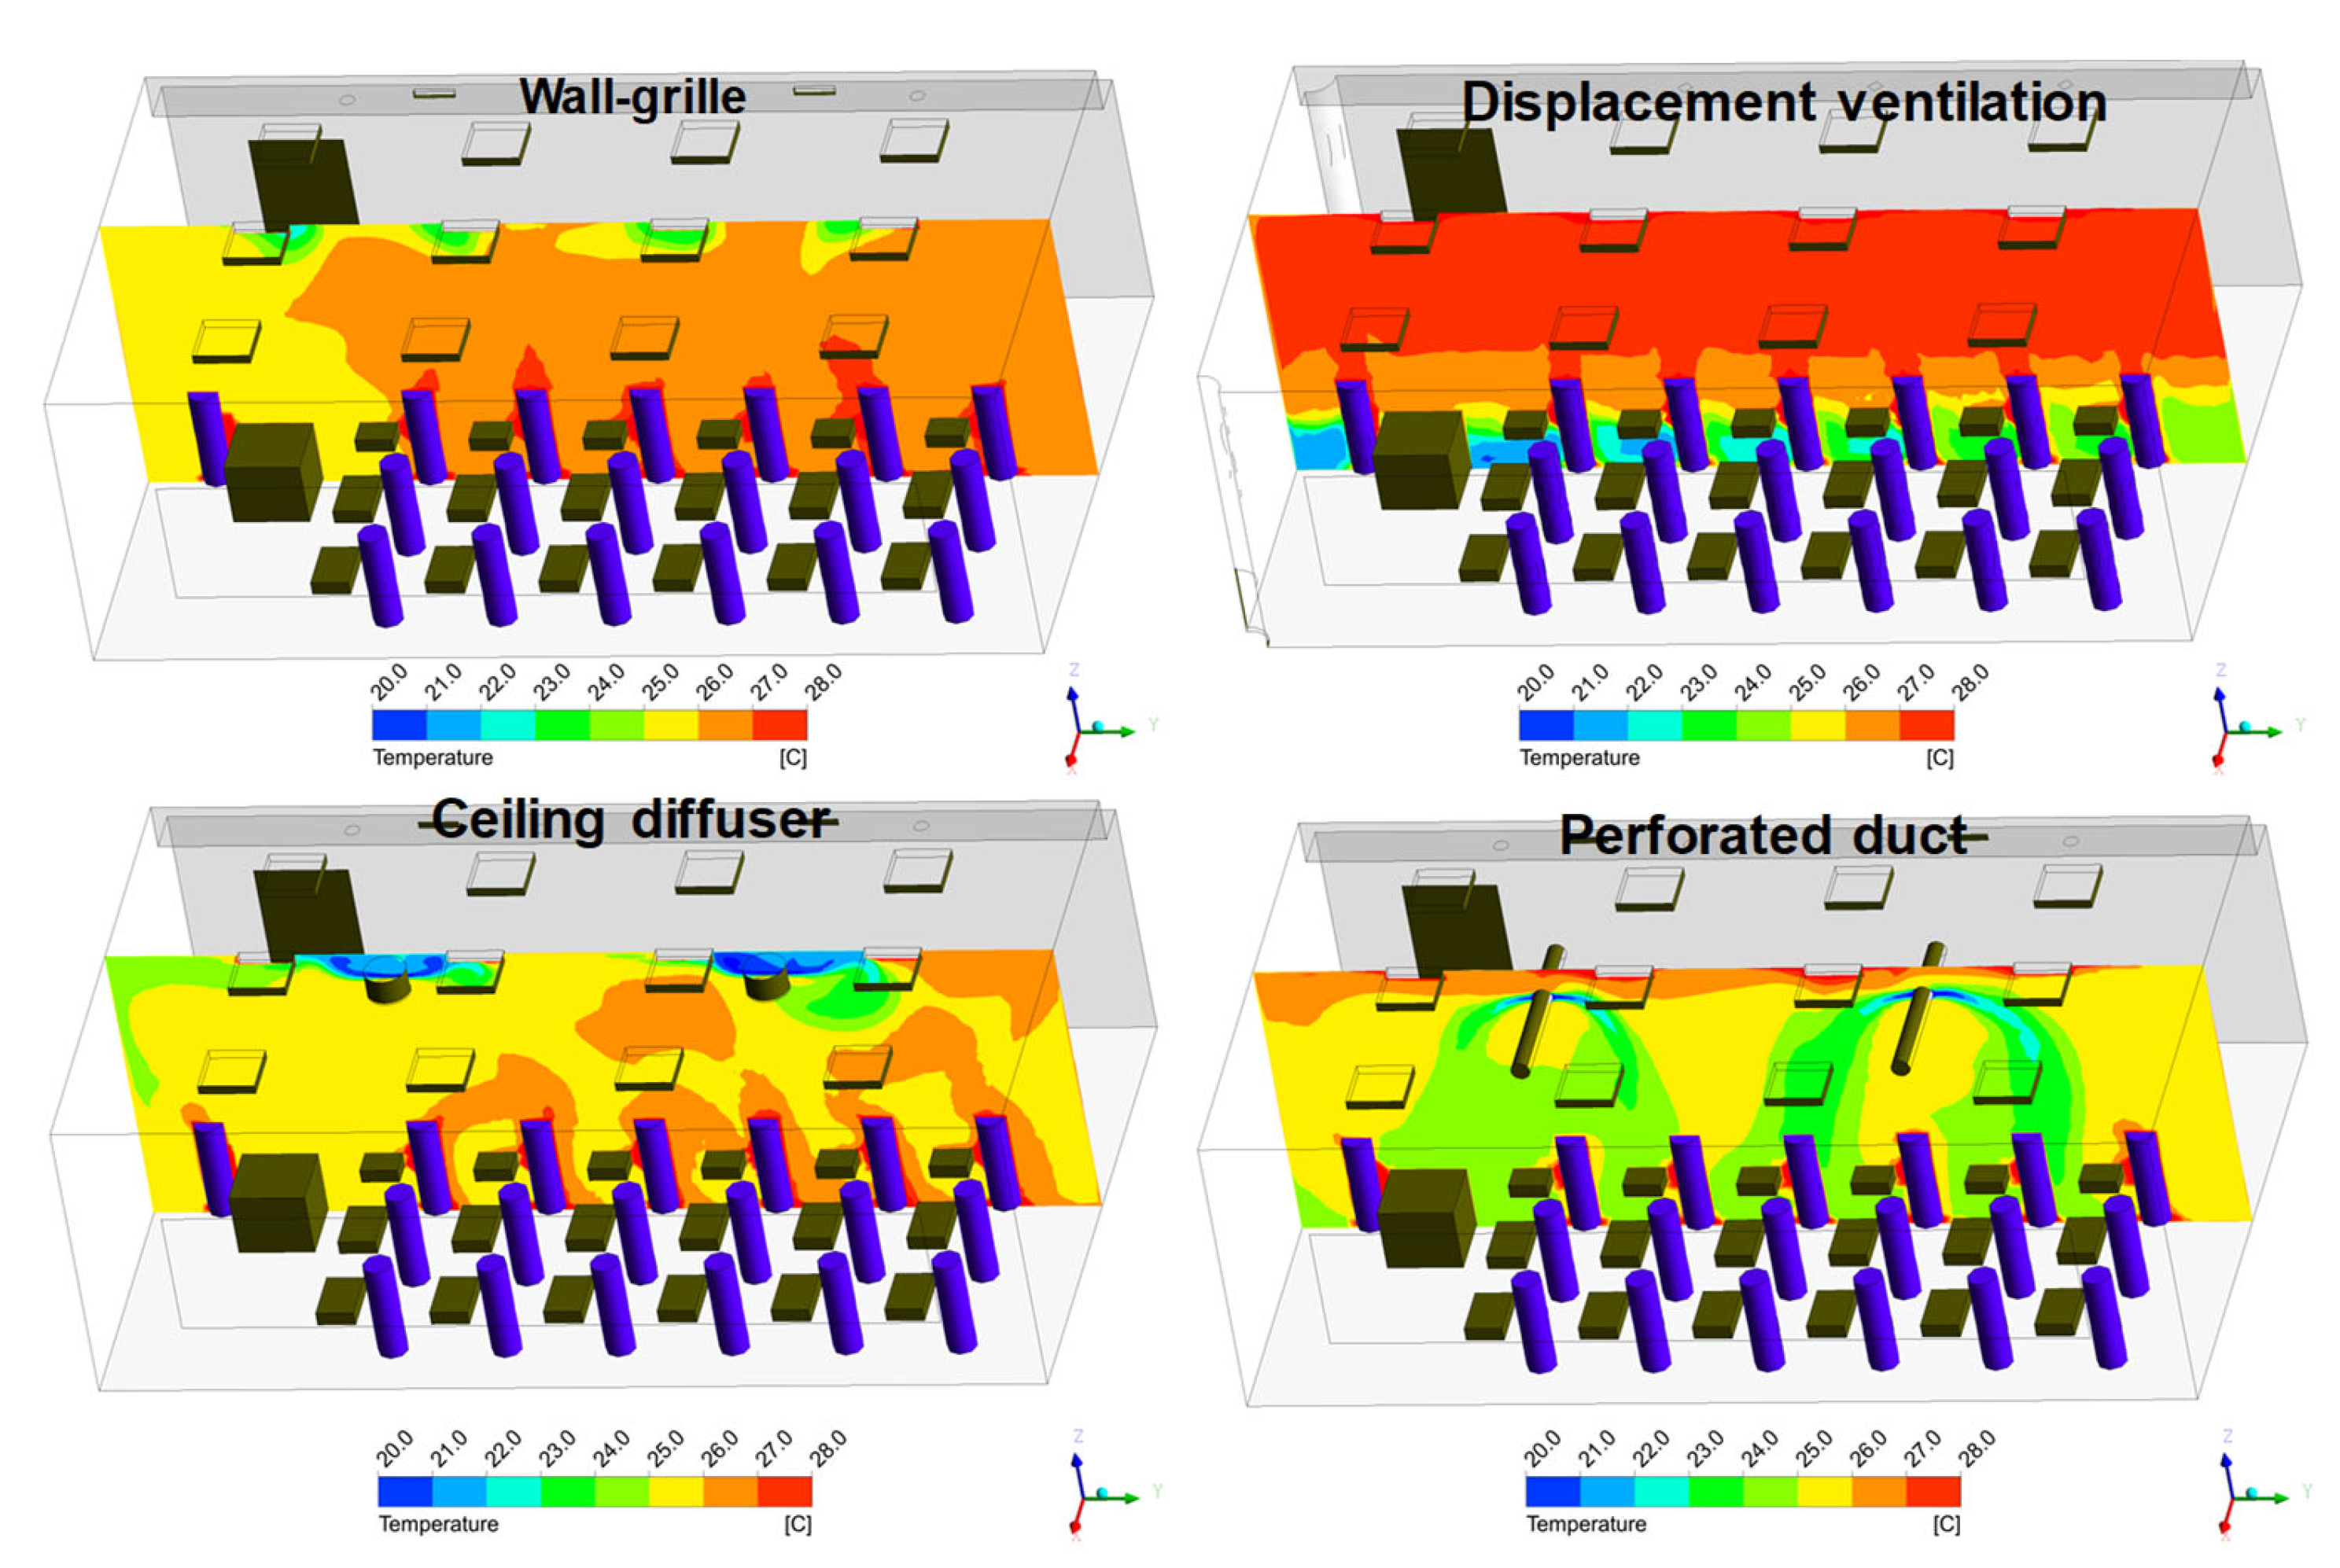
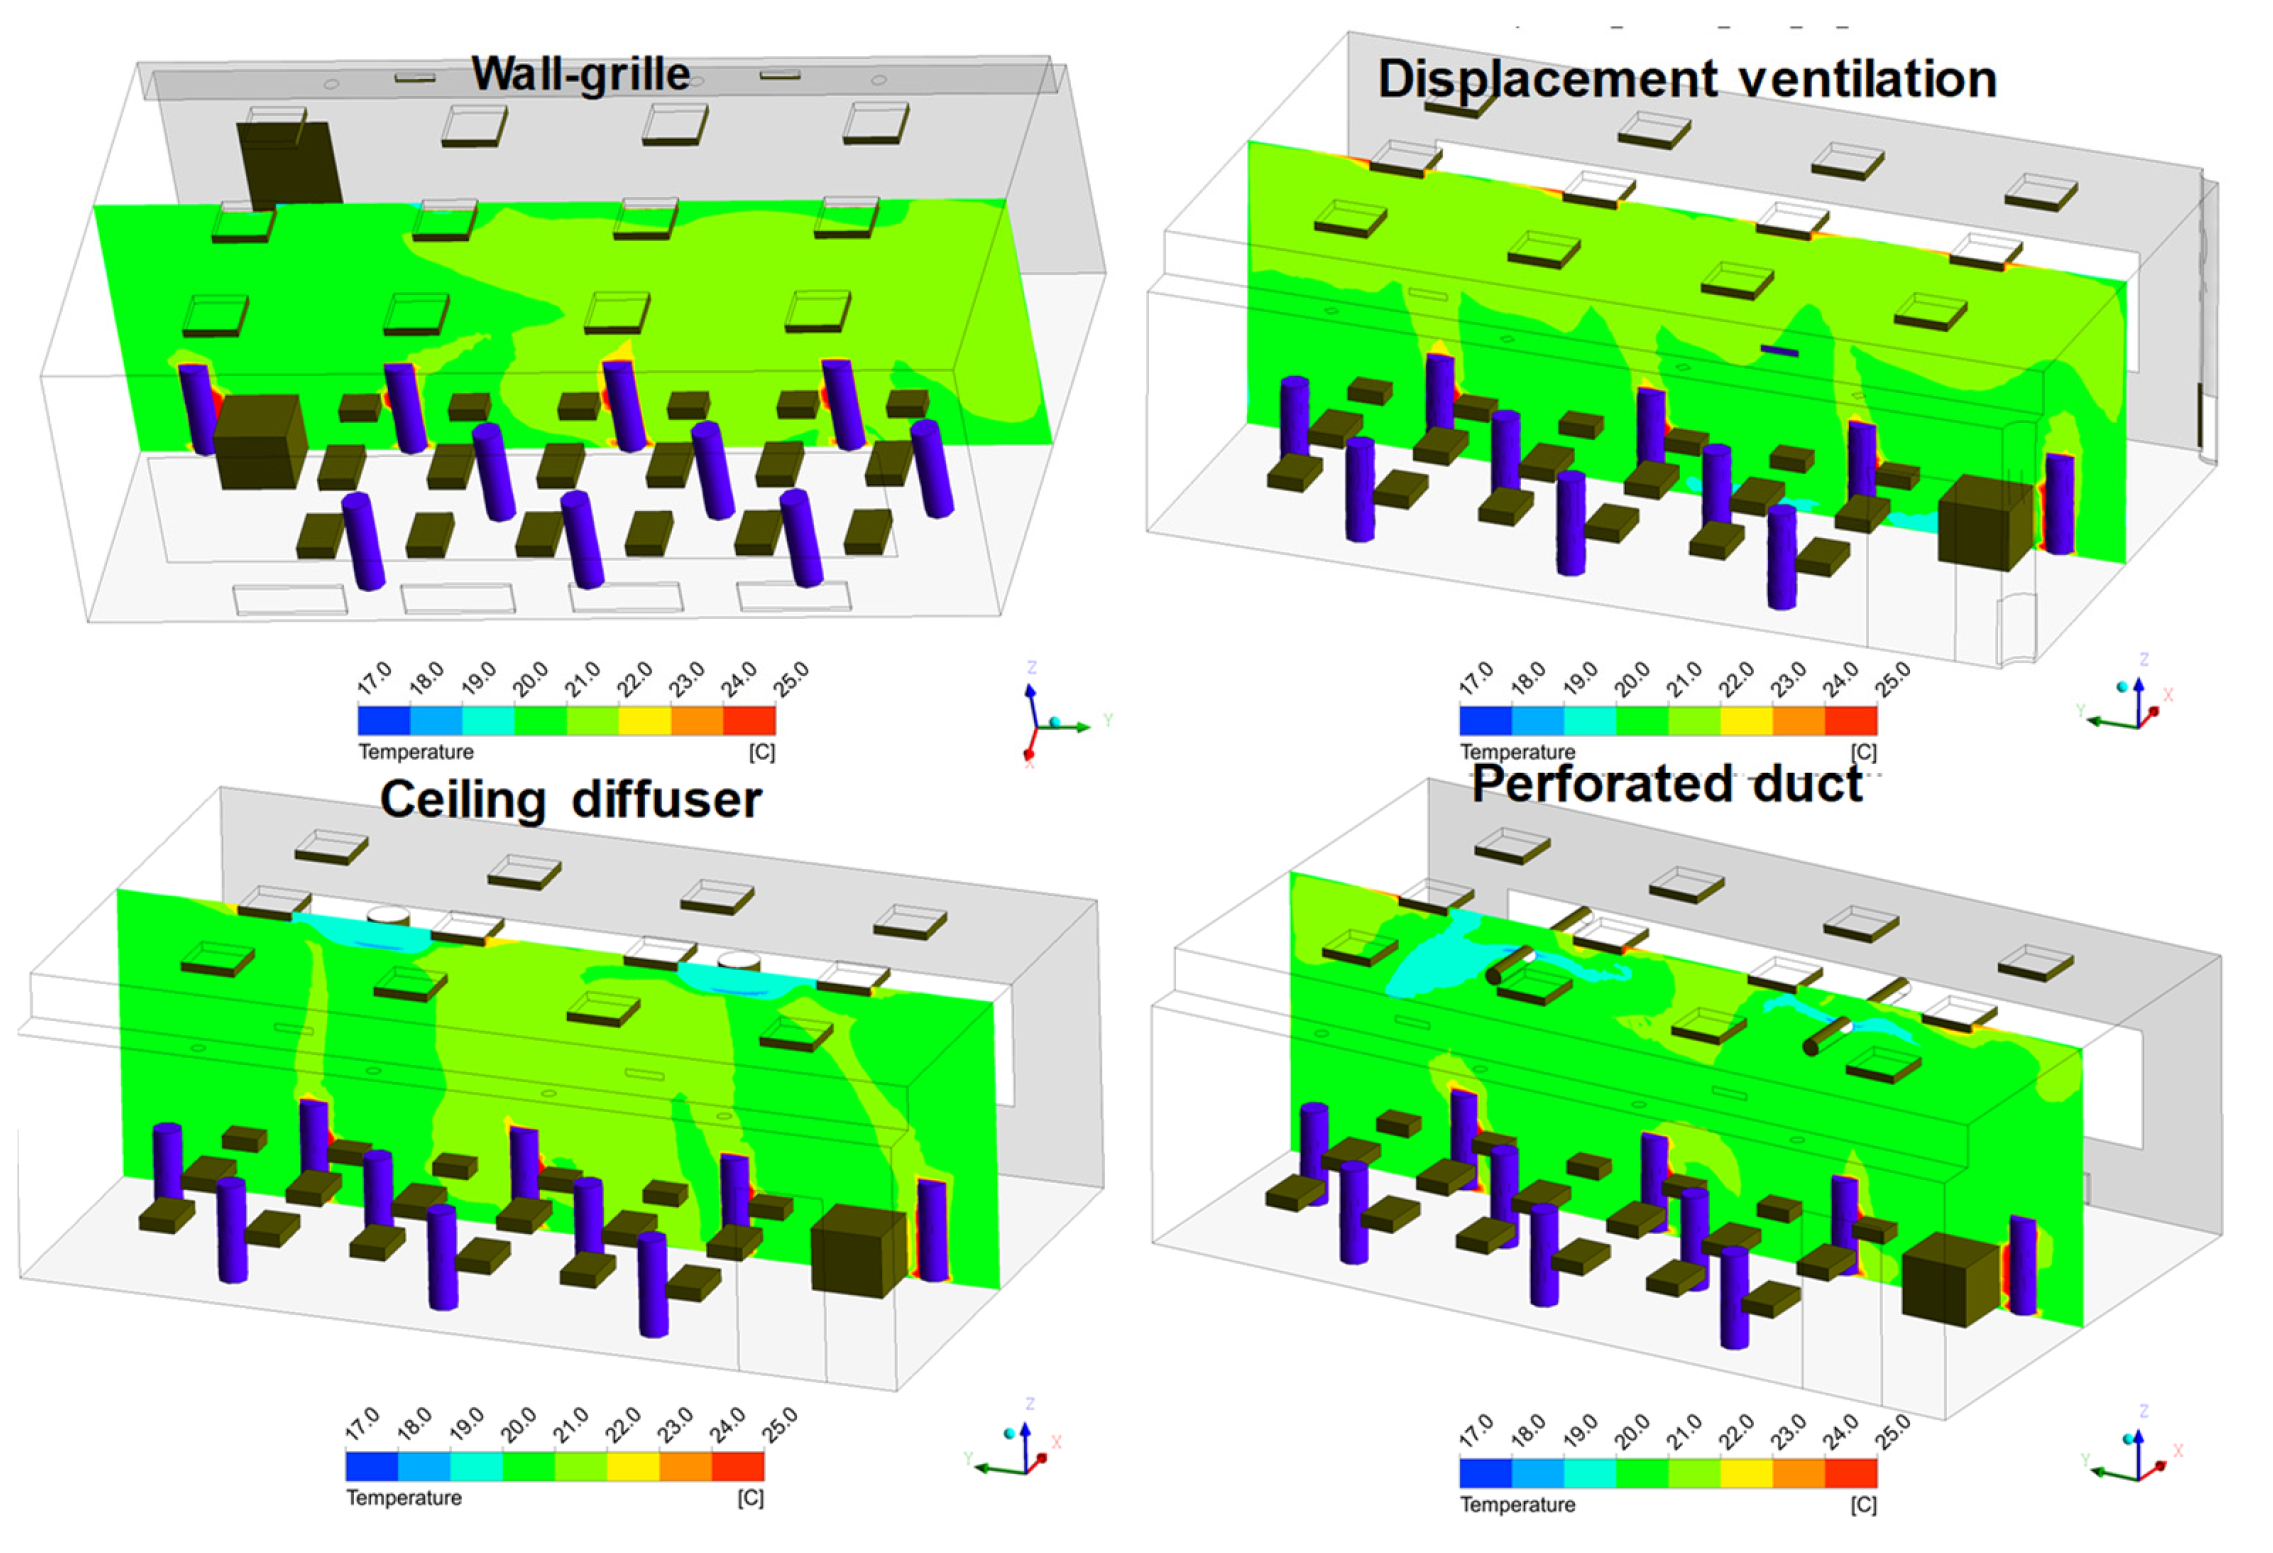
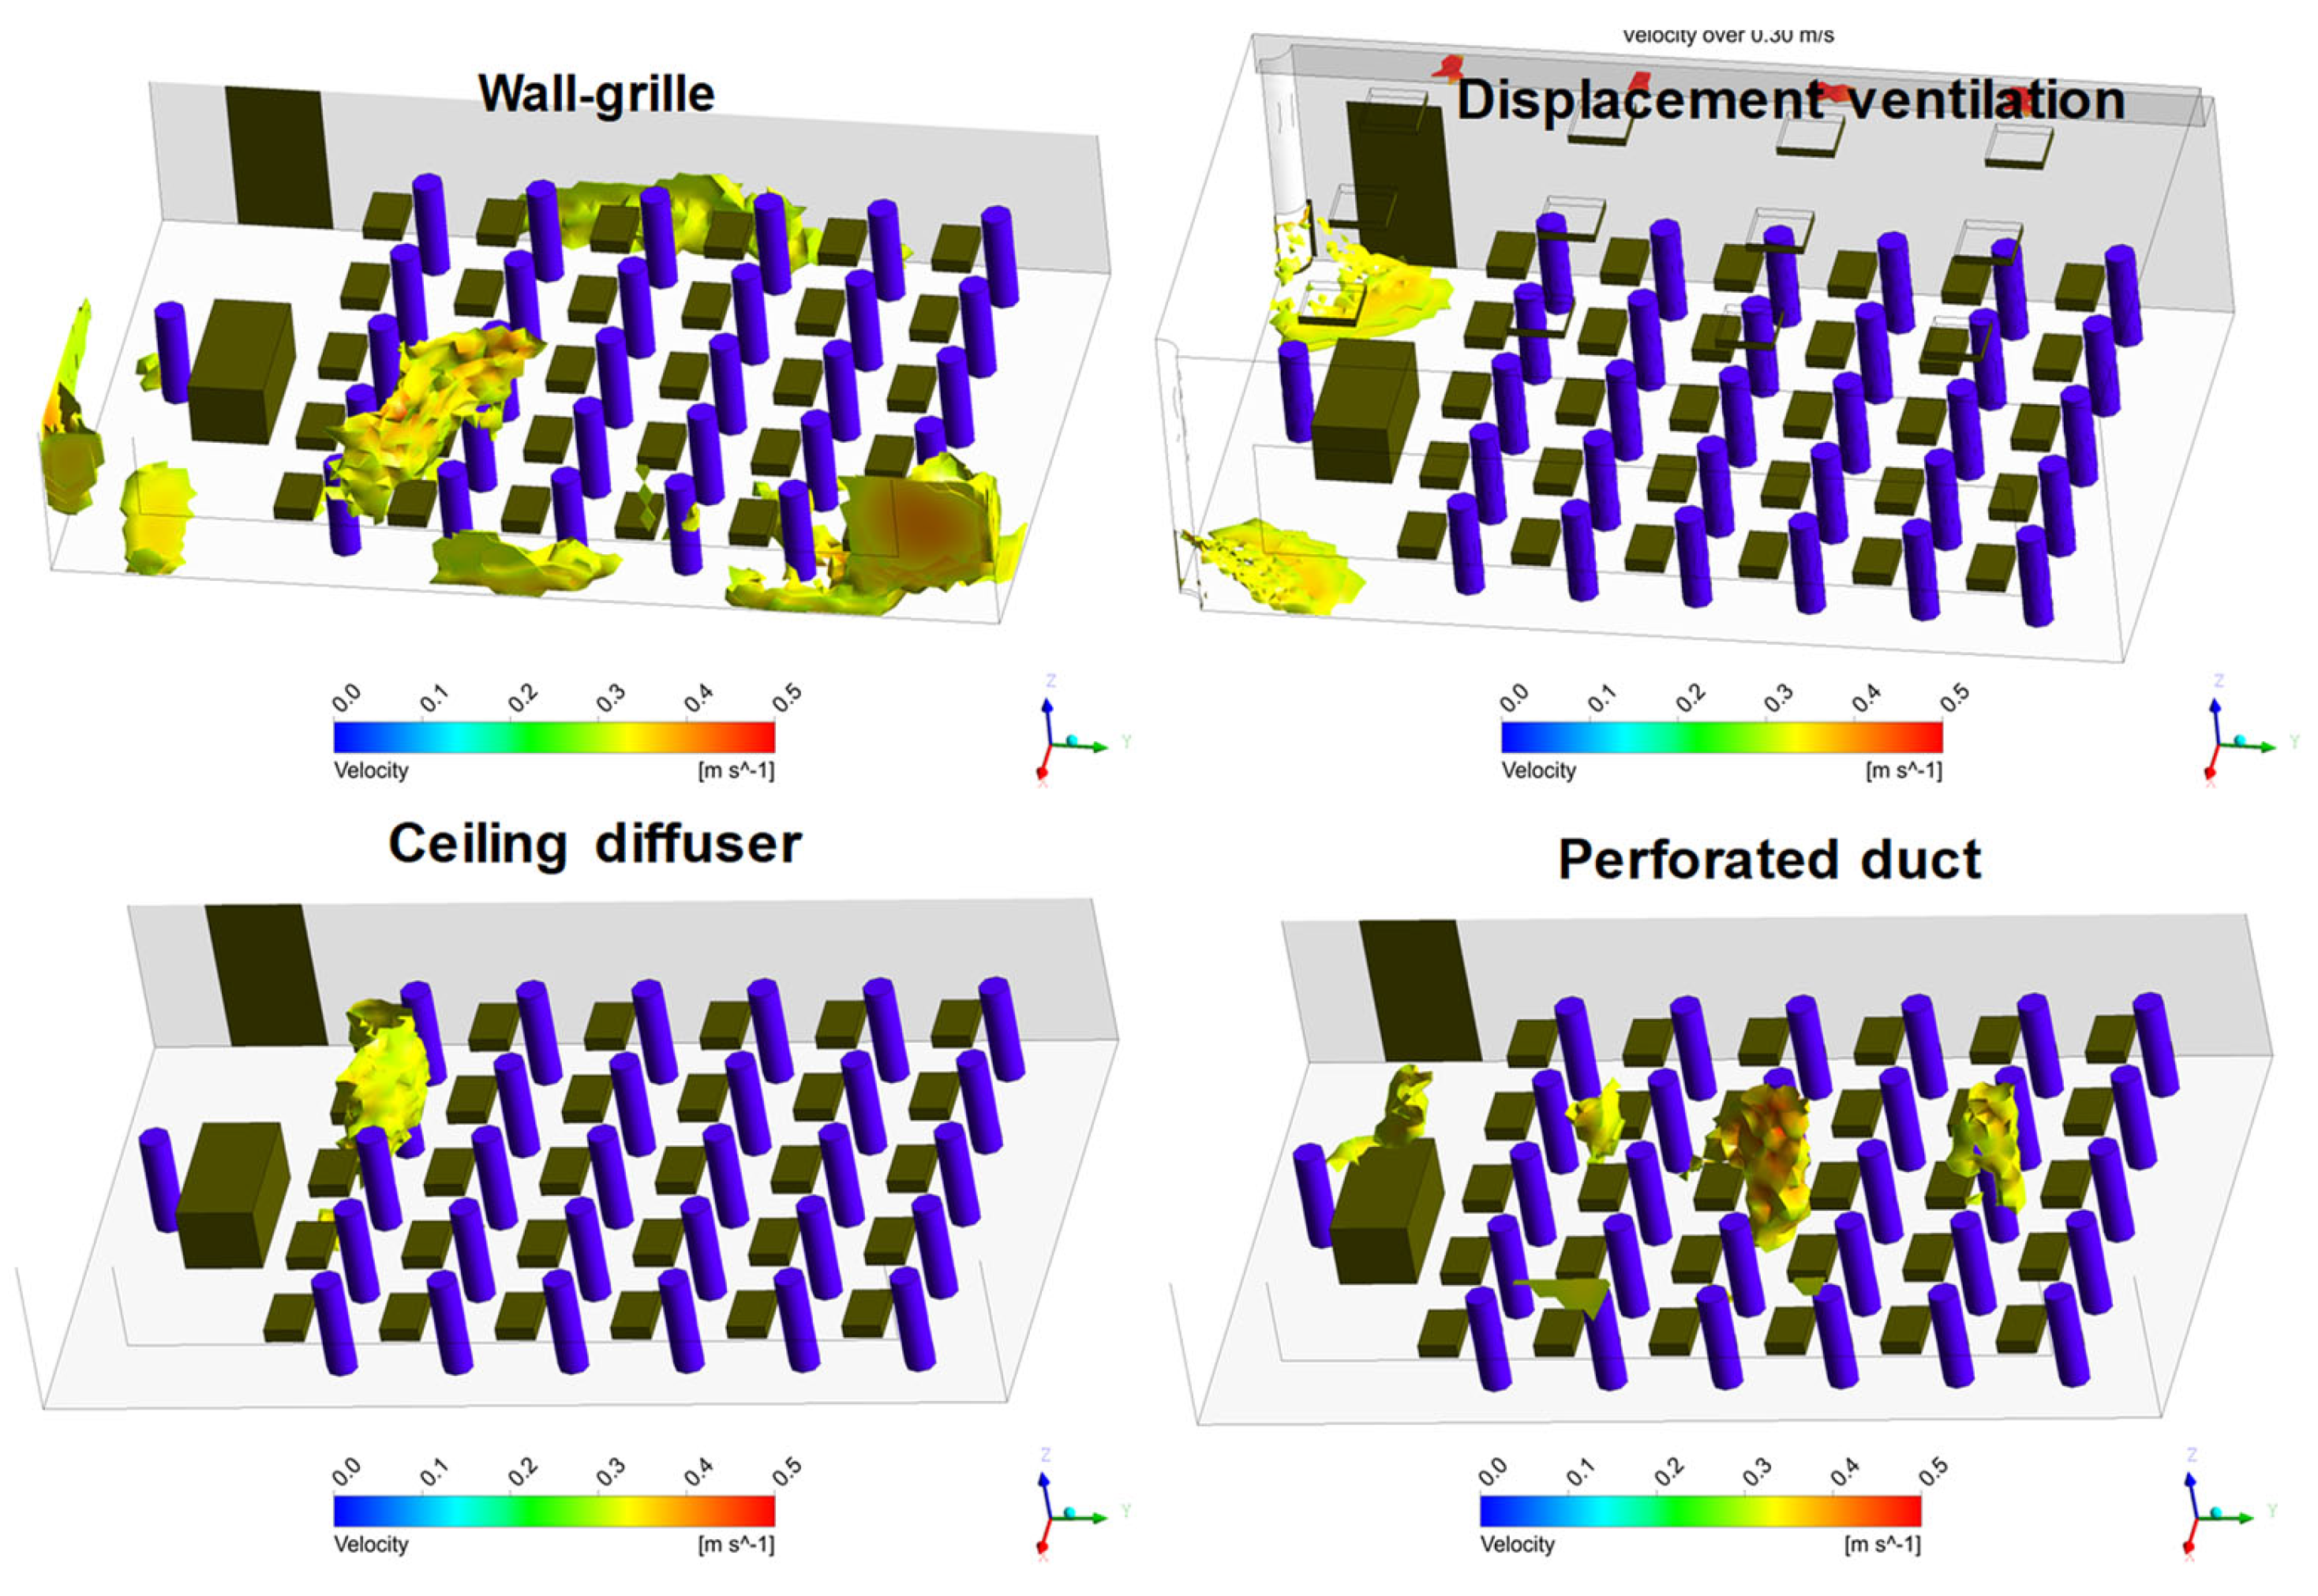
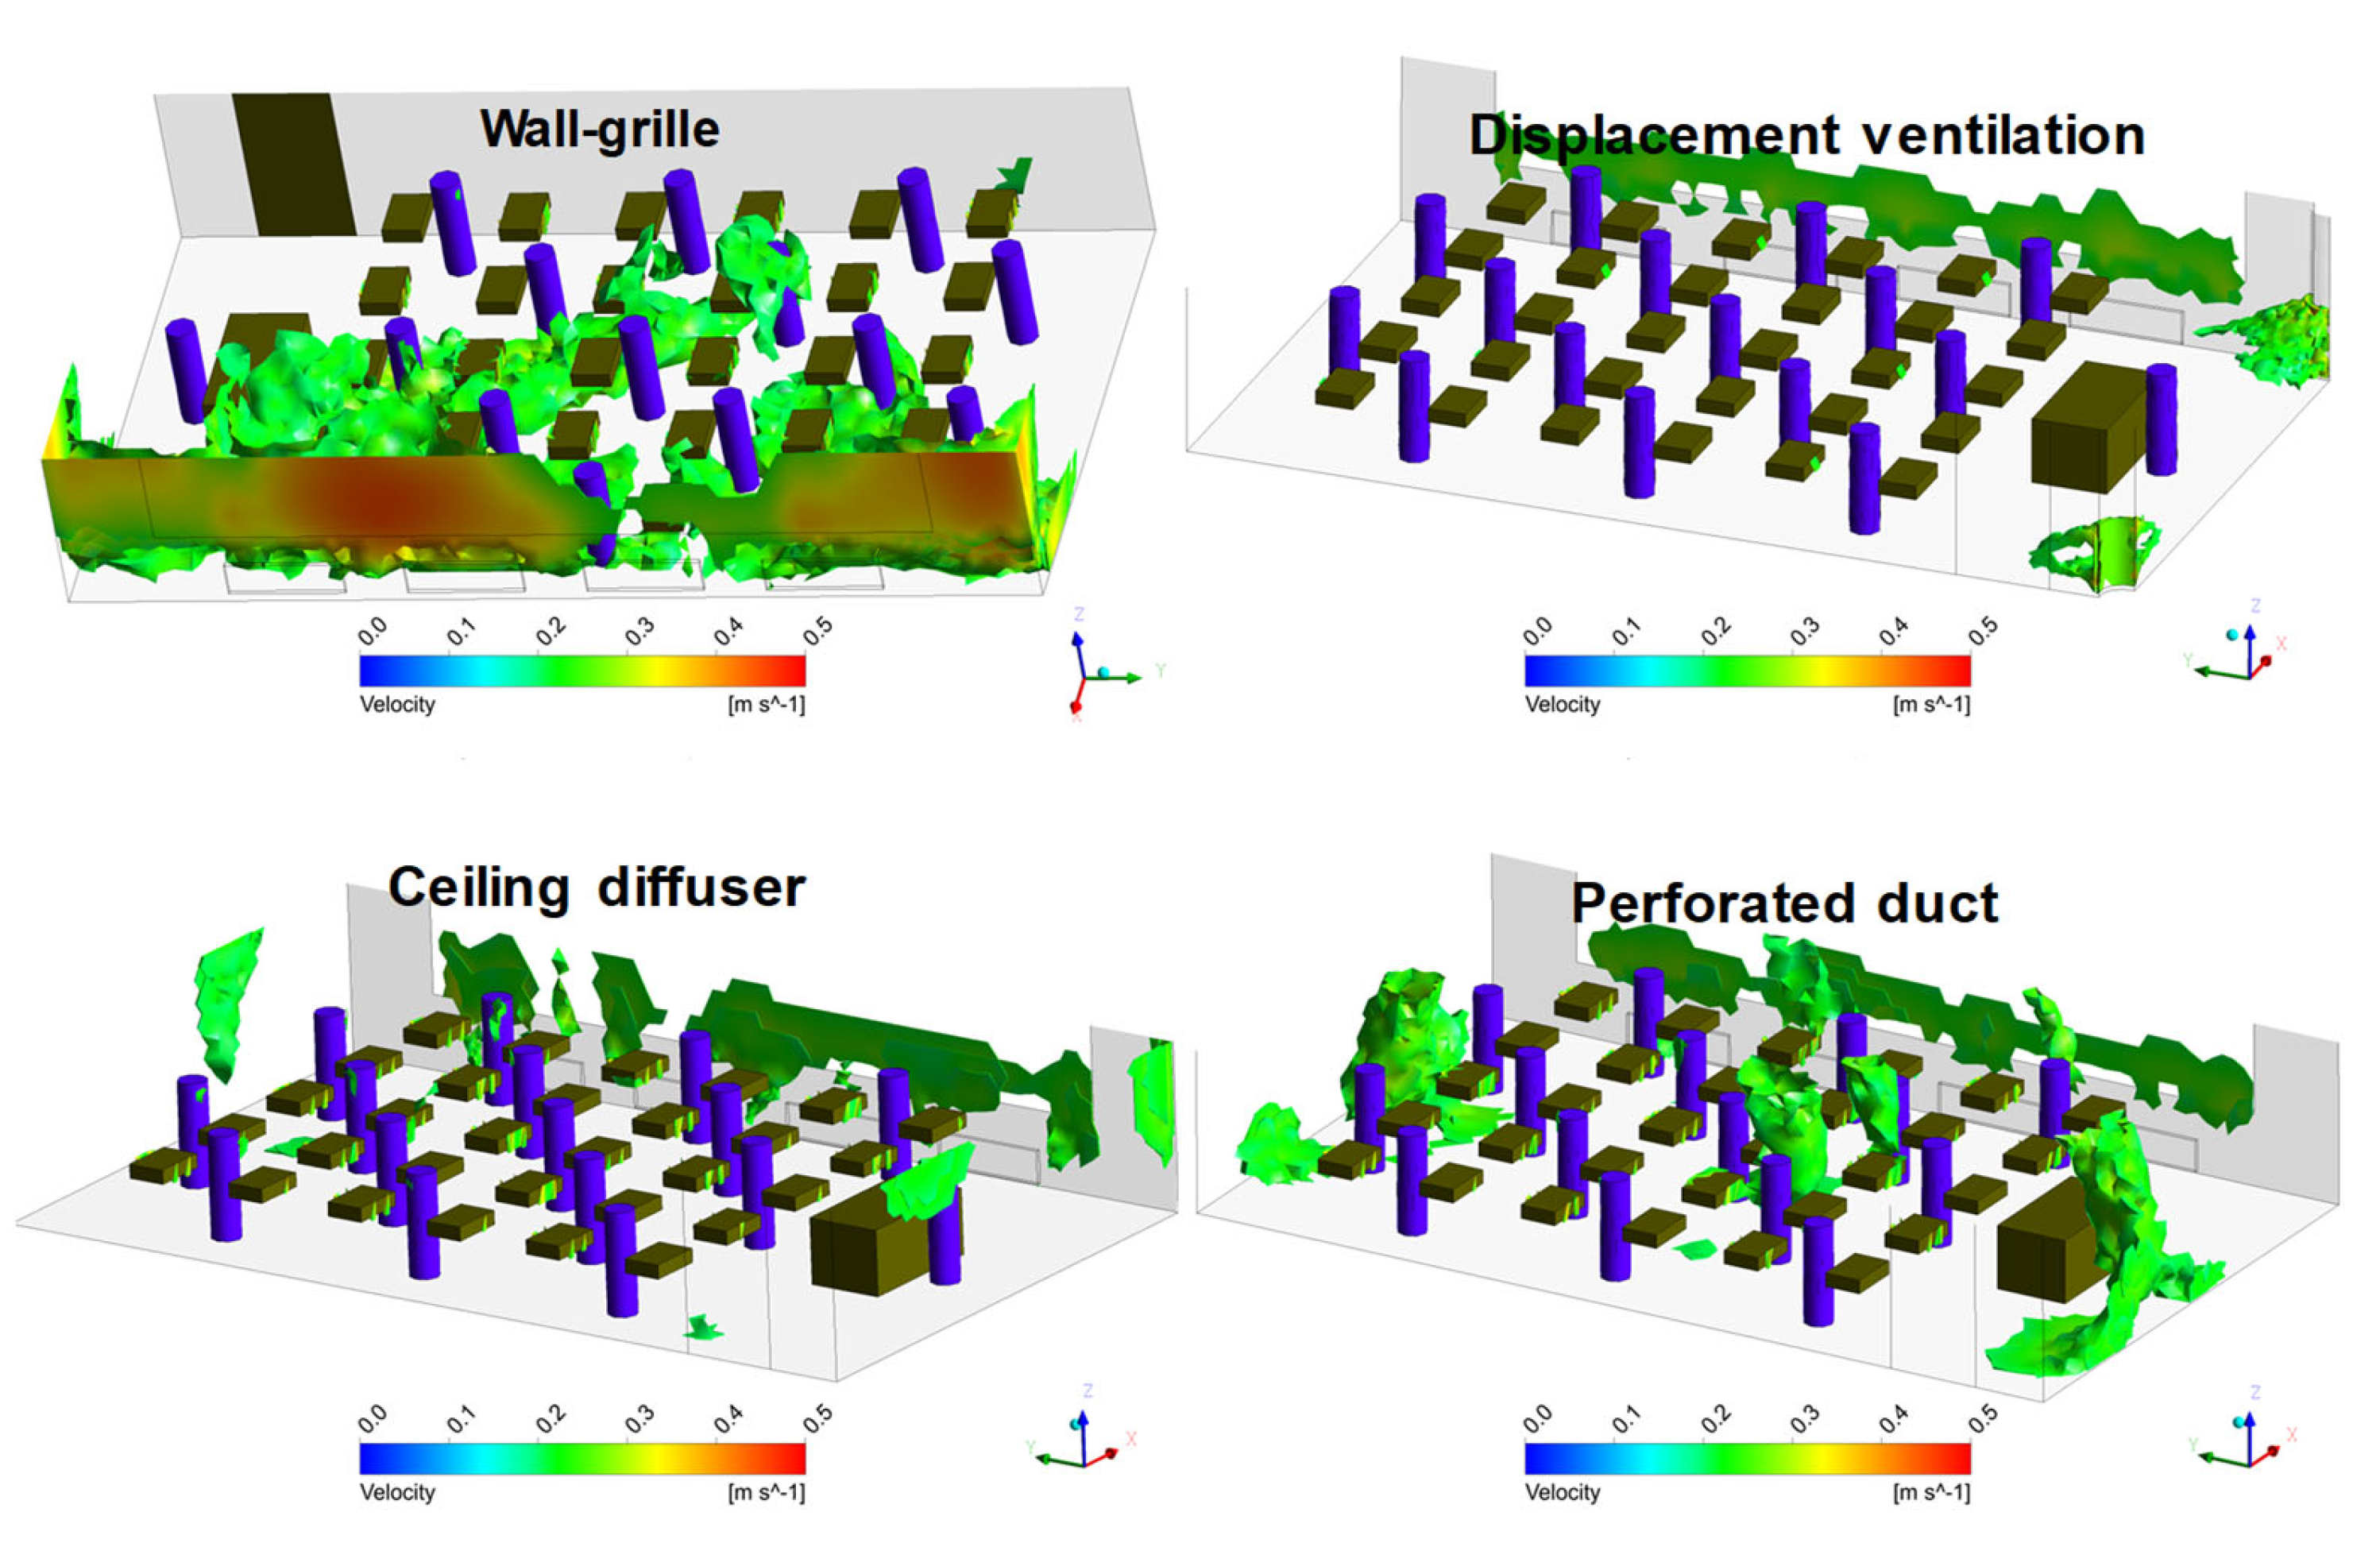
3.3.2. Air Temperature and Velocity Profiles

The air temperatures in the middle cross-section plane of the simulated whole classroom in summer and winter conditions are shown in Figure 10 and Figure 11. From 0.1 to 1.8 m height, the lowest average air temperature in the middle cross-section occurred with the displacement ventilation (25.0 °C), and the highest air temperature occurred with the wall-grille (26.4 °C) in summer. The average air temperature can be maintained under 26 °C in the occupied zone with the ceiling diffuser and perforated duct. The maximum vertical air temperature difference is 4.4 °C with the displacement unit. However, with three mixing air distribution methods, the vertical air temperature distribution is quite uniform, as it could be assumed to be.
In winter, the air temperature distribution with four diffusers is rather uniform due to the smaller temperature difference between the supply air and room air and a lower heat gain level. The vertical temperature difference is less than 1.5 °C even with the displacement unit. The air temperature in winter is 20.9 °C, 20.9 °C, 21.1 °C and 21.6 °C with displacement unit, perforated duct, ceiling diffuser and wall-grille, respectively.
The air velocity is shown in the simulated whole classroom in summer and winter in Figure 12 and Figure 13. According to guidelines published by FINVAC [13], the maximum air velocity for summer should be less than 0.3 m/s and 0.2 m/s in winter. In summer condition, the air velocity in the whole occupied zone is within the design criteria with the displacement unit except for the adjacent zone near the terminal unit. With the wall-grille, the air velocity near the window side is higher (0.4 m/s) because of the high momentum flux from the corridor wall installed unit, which was also noticed in the full-scale test [26]. With the ceiling diffuser, the velocity is less than 0.3 m/s all over the occupied zone. The airflow pattern with the perforated duct is not stable; therefore, the air velocities below the supply airflow diffusers are quite high. The supply air jet from perforated duct diffuser tends to be carried along with thermal plumes from the heat gains. The air velocity distribution with the ceiling diffuser is more uniform when comparing the mixing ventilation cases.
In winter, the air velocity in the occupied zone is both quite low with the displacement terminal unit and ceiling diffuser. The air velocity is higher at the window side with the wall-grille and some parts of the occupied zone with the perforated duct.

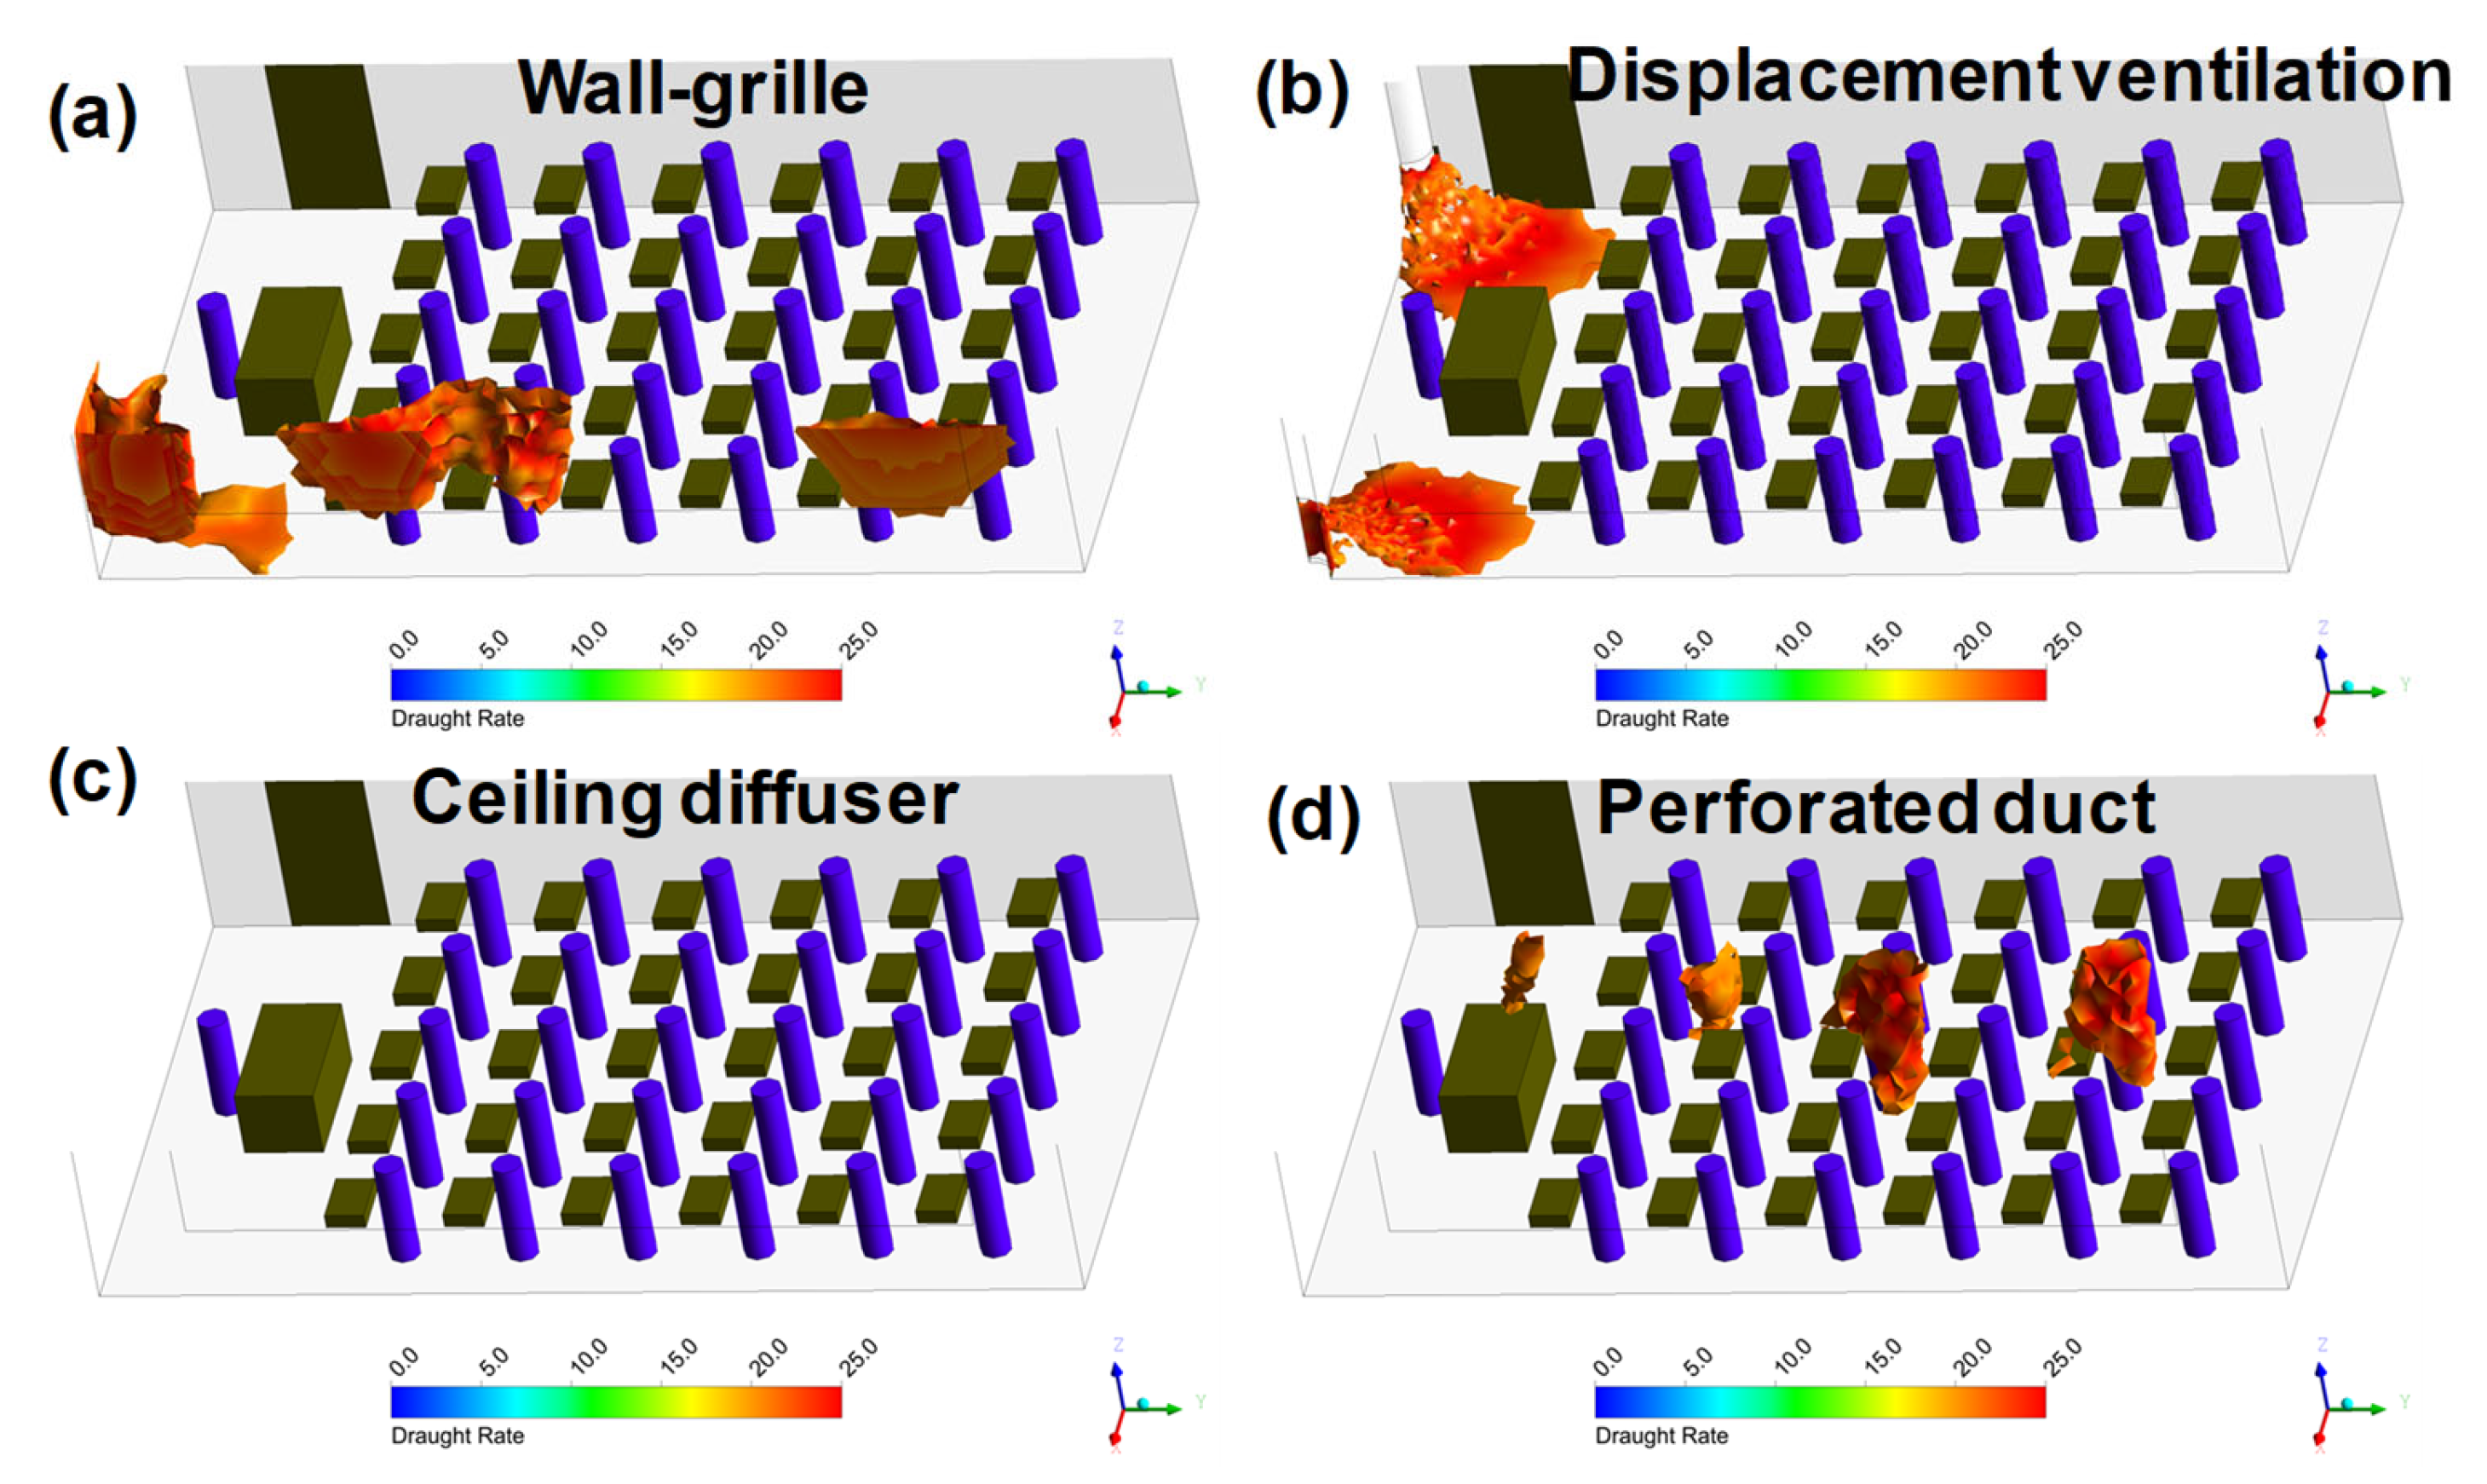
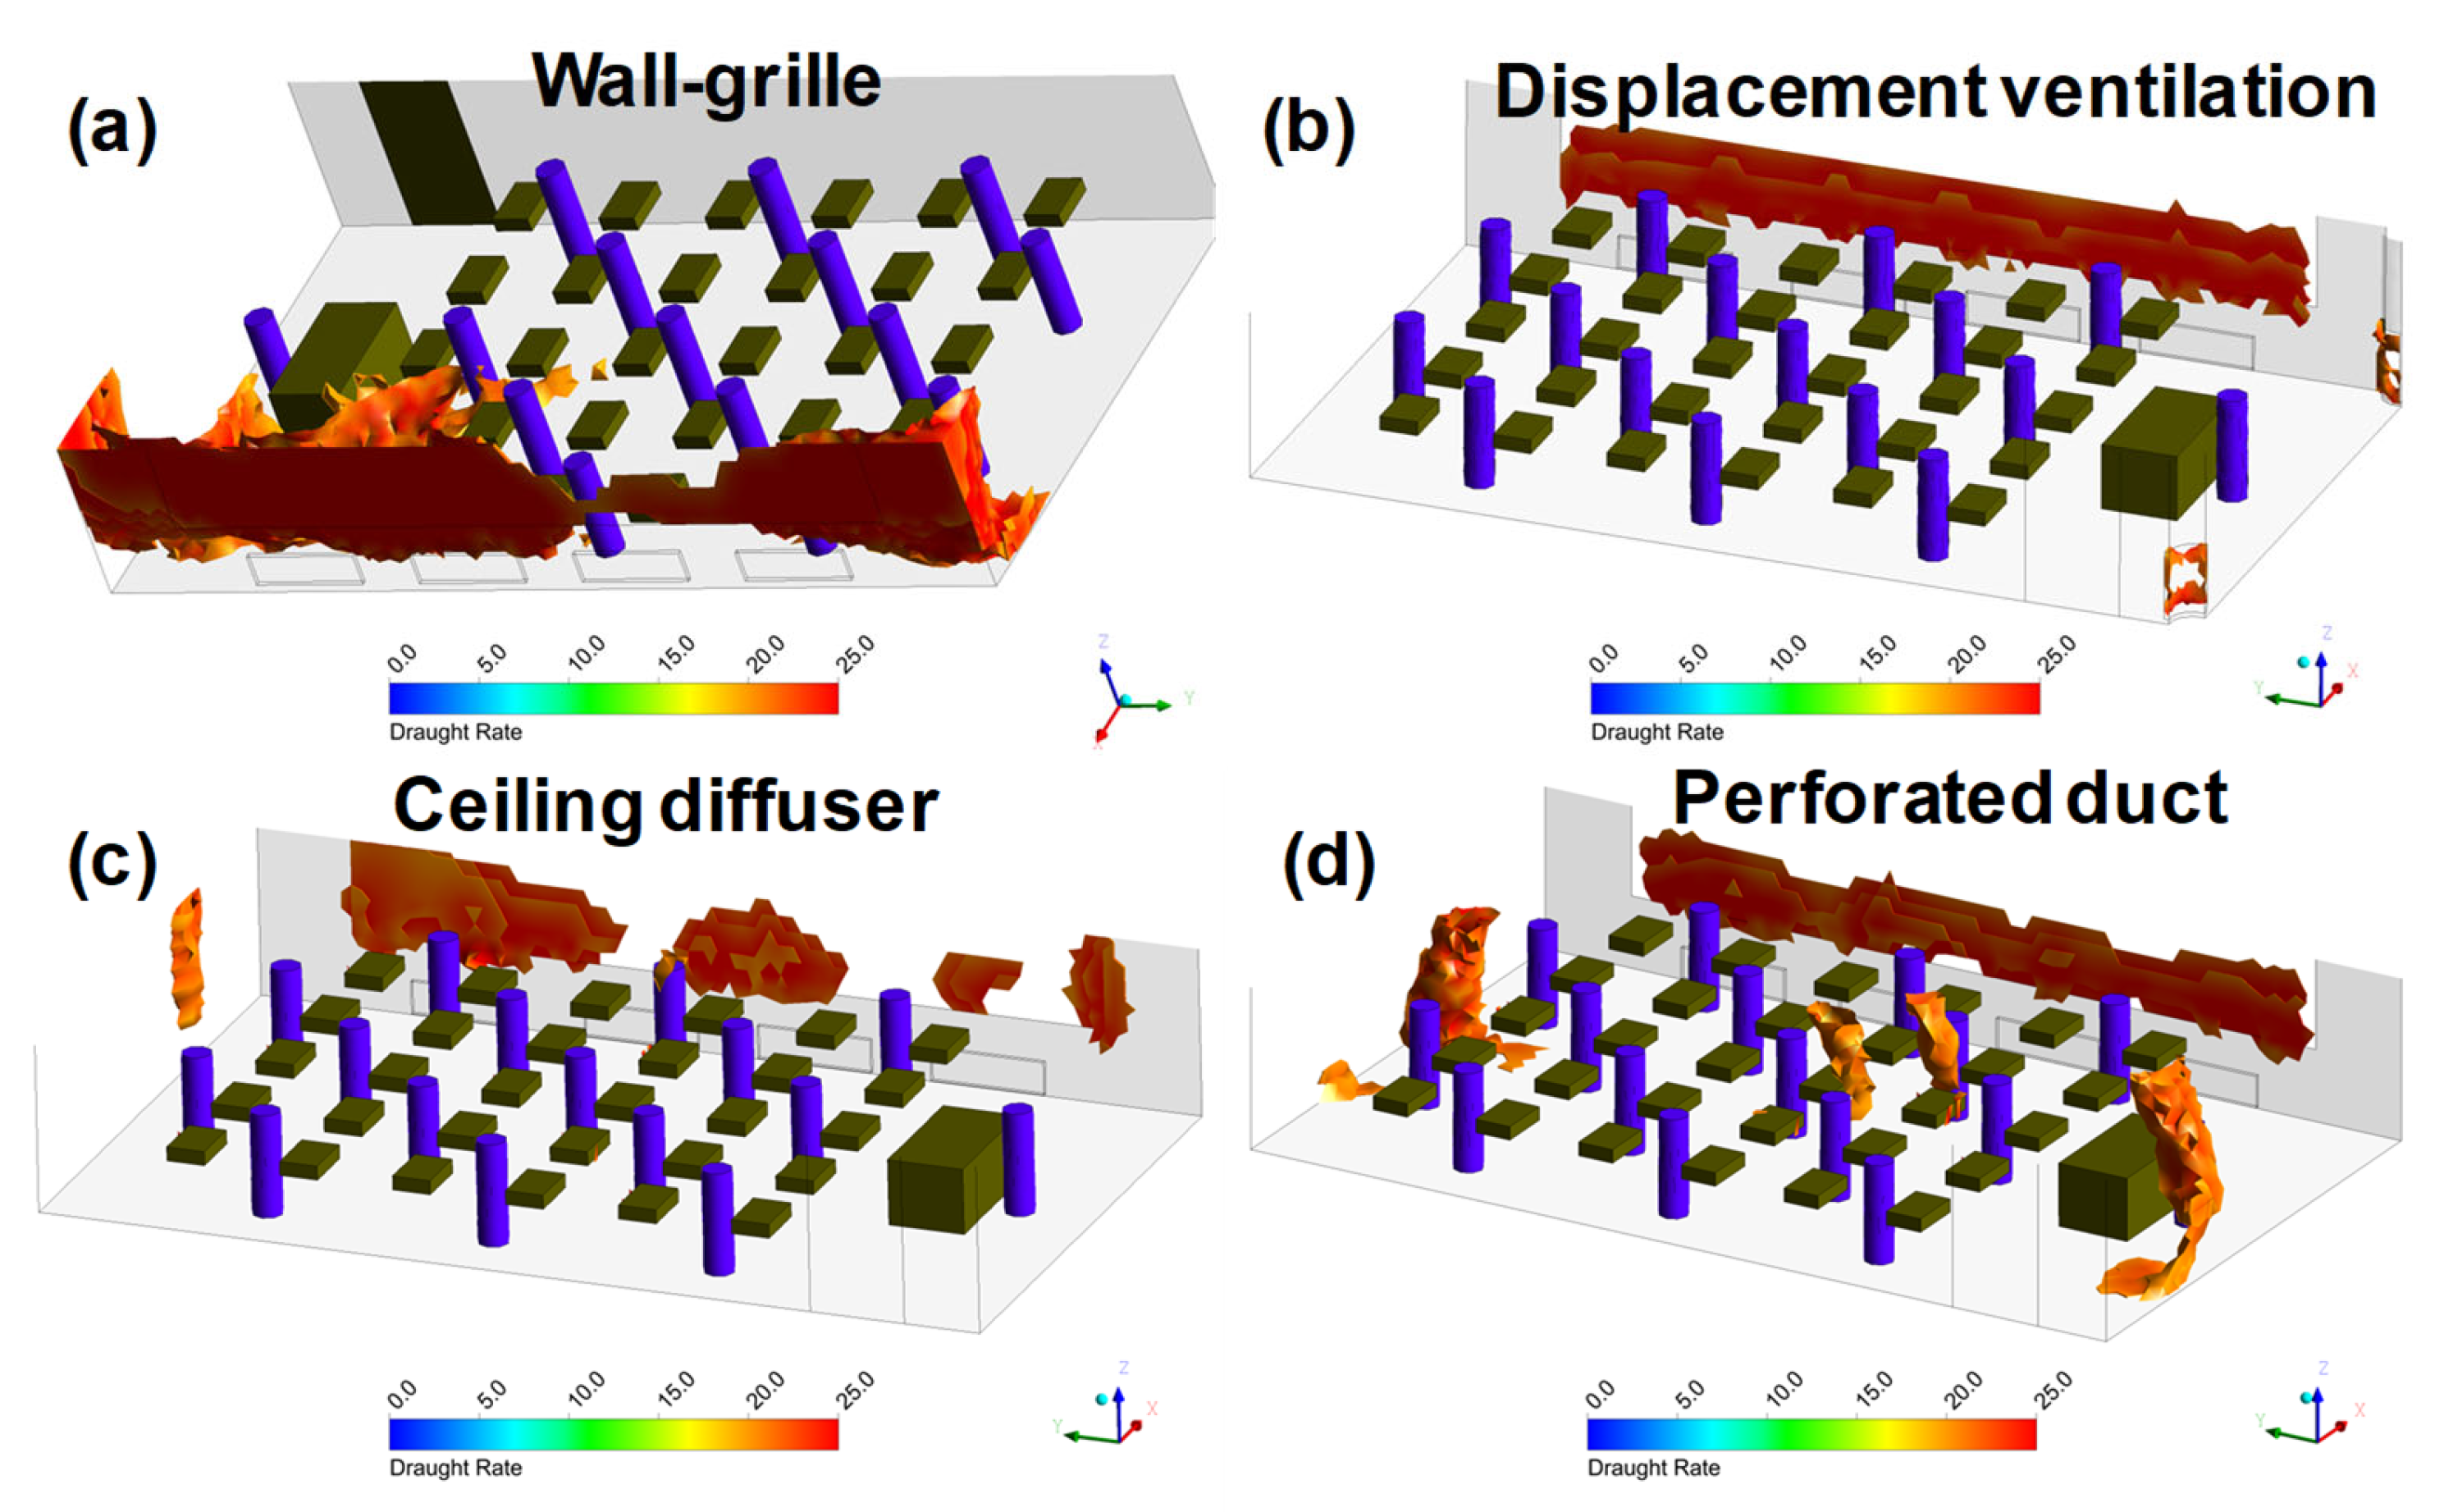
3.3.3. Local Thermal Comfort

Local thermal comfort regarding the draft risk is compared in summer (Figure 14) and winter (Figure 15) by presenting draft rate distribution in all whole-classroom cases. According to EN 16798 [34], the draft risk should be less than 20% to fulfill thermal discomfort design criteria Category II. Because of the high air velocity at the window side with the wall-grille, the higher draft risk also happens there. Thermal conditions in the displacement ventilation cases are excellent. No draft or too-high-temperature differences occur in the occupied zone. With the ceiling diffuser, no high draft rate is found in the occupied zone. Due to the unstable airflow pattern with the perforated duct, the draft risk is much higher in some parts of the occupied zone under the diffusers.

4. Discussion

Due to unbalanced ventilation, the energy consumption of fans increases, and lower or higher supplies of air can make the occupants feel drafts or too warm and decrease performance. The balance between supply and exhaust airflows is important, especially in new office buildings which are designed to be very airtight.
Due to the interaction of thermal plumes and supply air jets, the CFD solution was fluctuating a bit in the mixing ventilation cases. This affects the draft rate and age of air distribution a bit. The limitation of the CFD results presented is that they are time averaged results under steady state conditions. Moreover, to be able to show the large eddies and the flow fluctuation, large eddy simulation is required. CFD simulation modeling with Reynolds-averaged turbulence models can give a slightly over-estimated picture of this situation. With the different air distribution methods, the interaction between the supply airflow and thermal plume of indoor occupants and heated windows is varied. The higher heat gain level in summer conditions may enhance the interaction between different airflows. This leads a faster indoor air replacement under the same supply airflow rate and improves indoor air quality.
Displacement ventilation is not sensitive to heat gains, and thus the performance of displacement ventilation is more are less similar under low and high heat gain conditions. Additionally, thermal conditions and indoor air quality were best with displacement ventilation. However, the locations of the displacement diffusers must be considered carefully during design phage to avoid the possible thermal discomfort of the adjacent zone close to the terminal devices. To minimize the risk of the displacement units, the location, size, and number of the units should be analyzed.
The mixing ventilation could be designed perfectly for one heat gain condition, but in varied conditions, the air distribution of mixing ventilation changes. This means that the draft risk is higher in other operation conditions. The commonly used wall-grille has the worst performance in this study and should not be considered an optimal solution in the classroom where varied conditions occur. The performance of the perforated duct is very dependent on the heat gains, but the ceiling diffuser works better with the varied thermal conditions. This is also verified by Wu et al. [35], where the advantage of using active ceiling diffusers to provide more uniform thermal environment with varying supply airflow rates and heat load levels was observed. The usage of ceiling diffusers might be advantageous in classroom air distribution.
The presented results are valid only with the given set-up and indoor conditions. Therefore, to better understand the performance of four air distributions, more simulation with different setups should be conducted.
More advanced air distribution strategies are appreciated, e.g., stratum ventilation and personalized ventilation that makes it possible to create a better indoor climate in an energy-efficiency manner. In the future, together with indoor climate, the methods to prevent airborne disease spreading should be considered, and airborne transmission in crowded places should be analyzed.

5. Conclusions

The thermal conditions and indoor air quality of the simulated classroom in full-occupied summer and half-occupied winter conditions with three different mixing and displacement air distribution methods by CFD models were analyzed. To validate the accuracy of the simulations, the simulation results were compared with the full-scale test. Based on the results:
  • The indoor air quality was best with displacement ventilation. The age of air is the smallest and the air change efficiency is the highest in the occupied zone with the displacement air distribution. The other three air distribution methods analyzed performed almost like fully mixed ventilation.
  • With the ceiling diffuser, the indoor thermal condition is good in the occupied zone.
  • The air distribution with wall-grilles is quite uniform, but local thermal comfort problems at the perimeter side may happen.
  • Air distribution with the perforated duct diffuser is quite unstable with varied heat gain conditions, which may increase draft risk in the occupied zone.

Author Contributions

Conceptualization, W.Z. and P.M.; methodology, W.Z. and P.M.; formal analysis, W.Z. and R.K.; writing—original draft preparation, W.Z.; writing—review and editing, P.M., S.K., S.L., J.J. and R.K.; supervision, R.K. All authors have read and agreed to the published version of the manuscript.

Funding

This research was funded by the project Post doc/T21201 from Aalto University.

Institutional Review Board Statement

Not applicable.

Informed Consent Statement

Not applicable.

Acknowledgments

The authors wish to acknowledge the funding of project Post doc/T21201 from Aalto University.

Conflicts of Interest

The authors declare no conflict of interest.

References

  1. Ali, H.H.; Al-Hashlamun, R. Assessment of indoor thermal environment in different prototypical school buildings in Jordan. Alex. Eng. J. 2019, 58, 699–711. [Google Scholar] [CrossRef]
  2. Mendell, M.J.; Eliseeva, E.; Davies, M.; Lobscheid, A.; Fisk, W.; Apte, M. Association of Lower Classroom Ventilation Rates with Increased Illness Absence in a Prospective Study of California Elementary Schools. ISEE Conf. Abstr. 2013, 2013, 5318. [Google Scholar] [CrossRef]
  3. Gao, J.; Wargocki, P.; Wang, Y. Ventilation system type, classroom environmental quality and pupils’ perceptions and symptoms. Build. Environ. 2014, 75, 46–57. [Google Scholar] [CrossRef]
  4. Petersen, S.; Jensen, K.L.; Pedersen, A.L.S.; Rasmussen, H.S. The effect of increased classroom ventilation rate indicated by reduced CO2 concentration on the performance of schoolwork by children. Indoor Air 2016, 26, 366–379. [Google Scholar] [CrossRef] [PubMed]
  5. Wargocki, P.; Wyon, D.P. The effects of moderately raised classroom temperatures and classroom ventilation rate on the performance of schoolwork by children (RP-1257). HVAC R Res. 2007, 13, 193–220. [Google Scholar] [CrossRef]
  6. Wargocki, P.; Wyon, D.P. Providing better thermal and air quality conditions in school classrooms would be cost-effective. Build. Environ. 2013, 59, 581–589. [Google Scholar] [CrossRef]
  7. Kats, G. Greening America’s Schools; American Federation of Teachers; American Institute of Architects; American Lung Association; Federation of American Scientists; U.S. Green Building Council; Capital E: Washington, WA, USA, 2006. [Google Scholar]
  8. ASHRAE. ANSI/ASHRAE Standard 62-2001: Ventilation for Acceptable; ASHRAE: Atlanta, GA, USA, 2004. [Google Scholar]
  9. EN 13779 Ventilation for Non-Residential Buildings; General Requirements for Ventilation and Air–Conditioning Equipment. STN Standards: Brussels, Belgium, 2005.
  10. EN 15251; Criteria for the Indoor Environment Including Thermal, Indoor Air Quality, Light and Noise. CEN (European Committee for Standardization): Brussels, Belgium, 2019.
  11. Danish Standard, DS/CEN/CR 1752; Ventilation for Buildings—Design Criteria for the Indoor Environment. International Organization for Standardization: Geneva, Switzerland, 2001; p. 2920.
  12. A. 62.1-2013; Ventilation for Acceptable Indoor Air Quality. ASHRAE Standard: Atlanta, GA, USA, 2013.
  13. Seppänen, O.; Strand, T.; Lönnqvist, S.; Säteri, J.; Ahola, M.; Räinä, I.; Hyvärimen, J. Opas ilmanvaihdon mitoitukseen muissa kuin asuinrakennuksissa, Helsinki. FINVAC Ry. 2017. Available online: https://finvac.org/wp-content/uploads/2020/06/IV_opas_Muut_kuin_asuinrakennukset_muutokset-1.pdf (accessed on 20 July 2022).
  14. Koskela, H.; Häggblom, H.; Kosonen, R.; Ruponen, M. Air distribution in office environment with asymmetric workstation layout using chilled beams. Build. Environ. 2010, 45, 1923–1931. [Google Scholar] [CrossRef]
  15. Mohelníková, J.; Novotnỳ, M.; Mocová, P. Evaluation of school building energy performance and classroom indoor environment. Energies 2020, 13, 2489. [Google Scholar] [CrossRef]
  16. Kosonen, R.; Saarinen, P.; Koskela, H.; Hole, A. Impact of heat load location and strength on air flow pattern with a passive chilled beam system. Energy Build. 2010, 42, 34–42. [Google Scholar] [CrossRef]
  17. Karimipanah, T.; Awbi, H.B.; Blomqvist, C.; Sandberg, M.; Fresh, A.B. Effectiveness of confluent jets ventilation system for classrooms. In Proceedings of the 10th International Conference in Indoor Air Quality and Climate-Indoor Air, Beijing, China, 4–9 September 2005; pp. 3271–3277. [Google Scholar]
  18. Karimipanah, T.; Sandberg, M.; Awbi, H.B. A comparative study of different air distribution systems in a classroom. In Proceedings of the Roomvent, Reading, UK, 9–12 July 2000; pp. 1013–1018. [Google Scholar]
  19. Szczepanik-Ścisło, N.; Ścisło, Ł. Air leakage modelling and its influence on the air quality inside a garage. In Proceedings of the E3S Web of Conferences, EDP Sciences, Polanica-Zdrój, Poland, 16–18 April 2018; p. 00172. [Google Scholar]
  20. Szczepanik, N.; Schnotale, J. CFD simulations and measurements of carbon dioxide transport in a passive house. In Proceedings of the 24th IIR International Congress of Refrigeration: Improving Quality of Life, Preserving the Earth, Yokohama, Japan, 16–22 August 2015. [Google Scholar]
  21. Karimipanah, T.; Awbi, H.B.; Sandberg, M.; Blomqvist, C. Investigation of air quality, comfort parameters and effectiveness for two floor-level air supply systems in classrooms. Build. Environ. 2007, 42, 647–655. [Google Scholar] [CrossRef]
  22. Karimipanah, T.; Awbi, H. Theoretical and experimental investigation of impinging jet ventilation and comparison with wall displacement ventilation. Build. Environ. 2002, 37, 1329–1342. [Google Scholar] [CrossRef]
  23. Shokrollahi, S.; Hadavi, M.; Heidarinejad, G.; Pasdarshahri, H. Multi-objective optimization of underfloor air distribution (UFAD) systems performance in a densely occupied environment: A combination of numerical simulation and Taguchi algorithm. J. Build. Eng. 2020, 32, 101495. [Google Scholar] [CrossRef]
  24. Shi, Z.; Chen, Q. Experimental and computational investigation of wall-mounted displacement induction ventilation system. Energy Build. 2021, 241, 110937. [Google Scholar] [CrossRef]
  25. Mikeska, T.; Fan, J. Full scale measurements and CFD simulations of diffuse ceiling inlet for ventilation and cooling of densely occupied rooms. Energy Build. 2015, 107, 59–67. [Google Scholar] [CrossRef]
  26. Zhao, W.; Lestinen, S.; Mustakallio, P.; Kilpeläinen, S.; Jokisalo, J.; Kosonen, R. Experimental study on thermal environment in a simulated classroom with different air distribution methods. J. Build. Eng. 2021, 43, 103025. [Google Scholar] [CrossRef]
  27. Mustakallio, P.; Kosonen, R. Indoor air quality in classroom with different air distribution systems. Indoor Air 2011, 5–10. [Google Scholar]
  28. Menter, F.R. Two-equation eddy-viscosity turbulence models for engineering applications. AIAA J. 1994, 32, 1598–1605. [Google Scholar] [CrossRef]
  29. EN 16798-1; Energy Performance of Buildings—Ventilation for Buildings—Part 1: Indoor Environmental Input Parameters for Design and Assessment of Energy Performance of Buildings Addressing Indoor Air Quality, Thermal Environment, Lighting and Acoustics—Module M1-6. CEN-CENELEC Management Centre: Brussels, Belgium , 2019.
  30. ASHRAE Handbook. Fundamentals, ASHRAE–American society of heating. In Ventilating and Air-Conditioning Engineers; ASHRAE: Atlanta, GA, USA, 2017. [Google Scholar]
  31. Mustakallio, P.; Bolashikov, Z.; Kostov, K.; Melikov, A.; Kosonen, R. Thermal environment in simulated offices with convective and radiant cooling systems under cooling (summer) mode of operation. Build. Environ. 2016, 100, 82–91. [Google Scholar] [CrossRef]
  32. Mustakallio, P.; Kosonen, R.; Korinkova, A. Full-scale test and CFD-simulation of radiant panel integrated with exposed chilled beam in heating mode. Build. Simul. 2016, 10, 75–85. [Google Scholar] [CrossRef]
  33. Mundt, E.; Mathisen, H.M.; Nielsen, P.V.; Moser, A. Ventilation Effectiveness; REHVA: Federation of European Heating and Air-conditioning Associations: Brussels, Belgium, 2004; pp. 485–541. [Google Scholar]
  34. Indoor Environmental Input Parameters for Design and Assessment of Energy Performance of Buildings Addressing Indoor Air Quality, Thermal Environment, Lighting and Acoustics. REHVA J. 2015, 52, 17–23.
  35. Wu, Y.; Mustakallio, P.; Kosonen, R.; Kaukola, T.; Chen, J.; Liu, H.; Li, B. Experimental study of five different VAV air terminal devices under variable heat gain conditions in simulated office and meeting rooms. Build. Environ. 2022, 209, 108641. [Google Scholar] [CrossRef]
Figure 1. Air diffusers: (a) corridor wall-grille, (b) displacement ventilation unit, (c) mixing ventilation, and (d) perforated duct diffuser.
Buildings 12 01314 g001
Figure 2. Full-scale experiment. (a) Set-up of half-size classroom and (b) measured points in the test chamber.
Buildings 12 01314 g002
Figure 3. The grid density level with the wall-grille.
Buildings 12 01314 g003
Figure 4. Set-up of the whole classroom by CFD simulation in (a) winter case (16 people) and (b) summer case (31 people).
Buildings 12 01314 g004
Figure 5. Smoke visualization in summer conditions (a) with the full-scale laboratory test and (b) by CFD simulation.
Buildings 12 01314 g005
Figure 6. Iso-volume visualization of age distribution of air in the occupied zone over 1063 s (fully mixed condition) in the summer.
Buildings 12 01314 g006
Figure 7. Iso-volume visualization of age distribution of air in the occupied zone over 1063 s (fully mixed condition) in the winter.
Buildings 12 01314 g007
Figure 8. Average age of air in the occupied zone and air change efficiency of four air distribution methods.
Buildings 12 01314 g008
Figure 9. Locations in the occupied zone where age of air over 25% older than fully mixed with displacement unit (a) in summer conditions and (b) in winter conditions.
Buildings 12 01314 g009
Figure 10. Air temperature in the middle cross-section plane of classroom in summer.
Buildings 12 01314 g010
Figure 11. Air temperature in the middle cross-section plane of classroom in winter.
Buildings 12 01314 g011
Figure 12. Air velocity distribution in summer.
Buildings 12 01314 g012
Figure 13. Air velocity distribution in winter.
Buildings 12 01314 g013
Figure 14. Draft rate of more than 20% in summer conditions.
Buildings 12 01314 g014
Figure 15. Draft rate of more than 20% in winter conditions.
Buildings 12 01314 g015
Table 1. Details of CFD-simulation.
CFD SoftwareAnsys CFX 12.0
Grid resolutionUnstructured grid of 0.5–1.4 million unstructured elements or 120–320 thousand nodes
Inflation layers used near surfaces and finer grid on the trajectory of supply air jets
TurbulenceSST turbulence model with automatic wall treatment [28]
BuoyancyBuoyancy is modeled with Boussinesq approximation
SolutionSteady state solutions. Convergence as good as possible (usually some fluctuation due to the interaction of supply air jets and heat plumes). Solved with high resolution numerical scheme with blend factors (2nd order when applicable) except turbulence with first order discretization scheme
RadiationRadiation modeled with discrete transfer model
Supply air unit CFD modelMomentum method used for CFD model of wall-grille, displacement ventilation unit, ceiling diffuser, and perforated duct diffuser and flow pattern compared to the measurements
Table 2. Heat balance of the simulated whole classroom case.
Heat BalanceSummer ConditionWinter Condition
Full OccupancyPartial Occupancy
Design room air temperature26 °C21 °C
Average heat flux (W/m2)5139
Occupants 58 W/person [30]
(total heat gain) (W)
31 people16 people
1798928
Lighting (W)900900
Solar heat gain or heat loss from window (W)358−896
Surface temperature of window30 °C [31]11 °C [32]
Power of a radiator underneath window (W)0500
Total heat gains (W)30562328
Cooling load from ventilation (180 L/s)−1944−648
Supply temperature [26]
-
mixing
-
displacement
17 °C
18.6 °C
18 °C
20.5 °C
Heat loss through structures (W)−1112−784
Total heat losses (W)−3056−2328
Table 3. Air temperature difference in the middle section A-A plane of classroom (Figure 2) in the summer with of half occupancy density.
Temperature Difference Tmeas.-Tsimu. (°C)
LocationHeight Z (m)GrilleDisplacementCeiling DiffuserPerforated Duct
P101.3−0.60.30.51.5
0.9−0.70.80.41.3
0.5−0.81.00.21.1
0.1−0.90.80.10.8
P111.3−0.80.30.40.7
0.9−0.60.80.30.7
0.5−0.70.80.10.8
0.1−1.21.20.20.8
P121.3−0.50.40.80.9
0.9−0.60.80.40.9
0.5−0.40.9−0.21.1
0.1−0.91.70.01.0
P131.3−0.30.3−0.30.4
0.9−0.60.8−0.60.4
0.5−0.61.0−0.30.3
0.1−1.11.30.00.9
P141.3−0.30.20.40.6
0.9−0.70.80.10.6
0.5−0.81.00.30.4
0.1−1.21.20.20.6
P151.3−0.50.30.20.4
0.9−0.60.90.10.3
0.5−0.91.10.0−0.1
0.1−1.70.8−0.2−0.2
Average temperature difference−0.80.80.10.7
Publisher’s Note: MDPI stays neutral with regard to jurisdictional claims in published maps and institutional affiliations.

