Article

Microclimate Optimization of School Campus Landscape Based on Comfort Assessment †

1
School of Architecture, Southeast University, Nanjing 210096, China
2
School of Architecture and Design, China University of Mining and Technology, Xuzhou 221116, China
*
Author to whom correspondence should be addressed.
A case study at Tangfang Middle School in Xuzhou City, China.
Buildings 2022, 12(9), 1375; https://doi.org/10.3390/buildings12091375
Submission received: 26 July 2022 / Revised: 25 August 2022 / Accepted: 31 August 2022 / Published: 3 September 2022
(This article belongs to the Section Architectural Design, Urban Science, and Real Estate)

Abstract

:
The outdoor wind environment and thermal environment are important factors affecting human comfort in cold winter conditions. The spatial layout of plant communities plays an important role in improving the outdoor microclimate and improving outdoor comfort. In order to explore the positive effect of plant layout on outdoor comfort in cold winter, this study took Xuzhou Tangfang Middle School with typical layout characteristics as the research object. In this study, we simulated the wind environment of these models using computational fluid dynamics (CFD) methods and the outdoor thermal environment using Ecotect (2011), and used linear regression and one-way ANOVA for mathematical statistics. The wind environment and Universal Thermal Climate Index (UTCI) of campus outdoor activities distributed in different spaces were analyzed and evaluated. The research results showed that the superposition of wind and thermal environments identified the key areas of the campus (cross-flow area and corner flow area) and showed a negative correlation. The staggered layout of the three plant combinations increases the wind prevention efficiency by 39.4%. At the same time, this study established the linkage mechanism of campus plant layout, environmental microclimate, and activity area comfort, which effectively improved outdoor human comfort in cold winter. This research can provide a reference for the remediation and improvement of the comfort of the same type of campus, and also provide data support and reference significance for the research on the outdoor pedestrian environment in winter.

1. Introduction

The increasing urbanization process has led to an increase in the density of mid-rise buildings around urban middle school campuses, making the microclimate of this space increasingly complex, which directly affects the quality and efficiency of the use of campus outdoor spaces. The comfort of campus outdoor spaces is influenced by various climatic factors such as sunlight, solar radiation, and wind speed [1]. Deficiencies in campus design planning have serious negative impacts, such as reduced thermal comfort in outdoor spaces, diffusion of particulate pollutants, and increased local urban heat island effect (UHI) [2,3]. The target groups of primary and middle schools are exposed to the outside for a long time when they are on campus. Therefore, by simulating the comfort distribution of the microclimate in the outdoor space of the built campus, the primary task of this study is to find a plant layout that can improve the outdoor thermal comfort of the campus in winter.
Computer fluid dynamics (CFD) simulations are widely used in the study of the physical environments of buildings at different scales, such as urban blocks, villages, buildings, and urban heat islands. Using the East Village of the London Olympic Park as an example, Azin Hosseinzadeh and Amir Keshmiri provided a quantitative tool to evaluate wind microclimates and optimize the design and layout of trees around buildings to improve pedestrian comfort [4]. ZTAi and CMMak verified that flow fields within urban street canyons can be well predicted using a T-shaped computational domain, where the street canyon was connected to a free flow layer above the canyon [5]. Bo Hong et al. used CFD to simulate the diffusion of particulate pollutants in a naturally ventilated auditorium to investigate the effect of outdoor trees on indoor PM10 and PM2.5 [6]. Zhao Yifei et al. investigated the effect of trees on improving microclimate and mitigating the urban heat island (UHI) effect using the ENVI-met model for a closed courtyard in North China [7]. Zeng used CFD simulations based on meteorological data in Tianjin, China, to analyze wind speed and pressure considering different building layout scenarios and determined the most suitable building layout and wind protection measures in cold regions [8]. CFD simulations were also used to discuss various aspects of the physical environment from the building layout, such as wind speed, wind pressure, and temperature [9,10]. Previous studies have verified the reliability of using CFD simulations to study the physical building environment. Based on the above research experience, this study used CFD simulation software PHOENICS (2019) and data from field experiments to determine the boundary conditions and calibrate the numerical model. By combining both simulation and experimental results, the internal relationship between the built microclimate and the thermal comfort of the campus in cold winter was explored.
Thermal comfort is defined as “the psychological state of being satisfied with the thermal environment and assessed through subjective evaluations”. Outdoor thermal comfort is the most important factor for attracting residents to public space activities, and it is also a key point for evaluating urban livability [11,12]. The continuous deterioration of the urban climate and the increasing concern about the urban environment have led researchers all over the world to focus on outdoor thermal comfort, and research results on outdoor thermal comfort are increasing year by year. There are many factors affecting thermal comfort in outdoor environments, mainly meteorological factors and personal factors (meteorological factors include temperature, relative humidity, wind speed and direction, solar radiation, etc.; personal factors include gender, age, stay time, residence time, etc.). These factors are the key to the study of outdoor thermal comfort [13,14]. At present, few researchers have studied the characteristics of outdoor thermal comfort in cold winters as influenced by plant layout using scientific methods. The studies of outdoor thermal comfort have focused on urban neighborhoods, rural villages, landscape gardens, buildings, and urban parks. Using field experiments and simulation calculations, researchers have evaluated the temperature, humidity, solar radiation, and ventilation of the outdoor physical environment. It was also determined that the type and location of plants can effectively reduce solar radiation waves to lower wind speeds and have a positive and effective effect on human thermal comfort [15,16]. These studies can provide valuable references for architects and urban planners and develop optimization strategies for providing a comfortable outdoor environment for outdoor human activities.
Vegetation and solar radiation shading were identified from previous studies as effective methods to improve outdoor thermal comfort, with a particular focus on the effects of plants on wind fields in built outdoor environments and the cooling effect provided by public spaces [17,18]. Previous studies have mainly used on-site monitoring and numerical simulation, as well as the simulation of convection, radiation, and conduction, combined with multi-objective genetic algorithms, to investigate the optimal allocation method of residential plants from the perspective of outdoor thermal comfort evaluation [19]. These studies proposed to improve outdoor thermal comfort by adjusting the correlation between factors such as building space layout and vegetation coverage in the area [20,21]. Xu et al. [15] found that people’s thermal comfort in the plant environment is better than that in the built environment and water environment. Mahmoud [22] found that the sky view factor (SVF) and wind speed (v) have a huge impact on outdoor human thermal comfort. With the deepening of outdoor thermal comfort research, the shape, height, and species of plant canopy directly affect outdoor thermal comfort [16]. Trees with cylindrical crowns are able to provide better thermal comfort compared to spherical and conical crowns [23]. Morakinyo et al. showed that leaf area index (LAI), tree height, trunk height, and canopy density had the greatest impact on outdoor thermal comfort [24]. However, plants undergo morphological changes with seasons, such as germination, leaf expansion, flowering, fruiting, and falling leaves. The effect of plants on outdoor cooling in summer has been widely confirmed [25,26], while the effects of plants on outdoor thermal comfort in cold winter are less studied. At the same time, due to the influence of the monsoon climate, the winter in the northern region lasts for a long time, is cold and dry, and has high wind frequency and intensity [27,28], which further reflects the importance of this study.
In general, previous studies have provided new insights into outdoor thermal comfort, mainly on the effects of plant space combinations and the canopy shape of plants on microclimate [29,30,31], the spatial layout of buildings, and the effects of orientation on thermal comfort in public spaces [32]. However, these studies mainly focused on the improvements brought by the optimized planning layout and lacked quantitative studies on landscape elements. In addition, a large number of studies have confirmed that the same measures have different effects in different regions and seasons [33,34]. Previous studies on outdoor thermal comfort have focused on summer and a single landscape element, lacking research on the effects of multiple factors (solar radiation, architectural shading, plant sunward properties, and distribution methods) on outdoor thermal comfort in winter. At the same time, there are few studies on comfort in cold winters, and there is a great need to supplement the research on outdoor thermal comfort in this region. This study aims at the multi-factor superposition and quantitative research methods of cold winter, which fills the gap of comprehensive research in this field.
The environmental quality of outdoor open spaces on campus directly or indirectly affects staff and student activities and public health [35]. Outdoor thermal comfort on campus is a key factor in encouraging students to participate in outdoor activities, thereby ensuring their health and happiness [36,37]. Students in primary and middle school campuses are in a critical period of growth, and they need more campus outdoor activity space to communicate, learn and grow, and their campus outdoor thermal comfort is particularly important.
This study proposes a method of superimposing the microclimate model of the campus-built environment, the student behavior model, and the regularity of periodic activities, and explores the linkage mechanism between the physical environment of the campus plant community, the physical environment of the microclimate, and the behavioral laws of outdoor activities on campus. Wind speed, wind pressure, solar radiation, and Universal Thermal Climate Index (UTCI) were selected as the parameters to describe the outdoor environment of the campus. CFD, Ecotect simulation, and campus winter field experiments were combined to determine the spatial areas that affect the adaptability of the wind and thermal environment in the built-up space of the campus, especially the key areas such as the “corner effect” and “eddy current effect” formed around the campus buildings. We conclude that the typical vegetation community layout in the gathering area of outdoor activity intensity on campus has a regulating effect on the microclimate and propose a climate-adaptive outdoor activity space design strategy, which can provide references for the planning and construction of outdoor space in winter in the future.

2. Materials and Methods

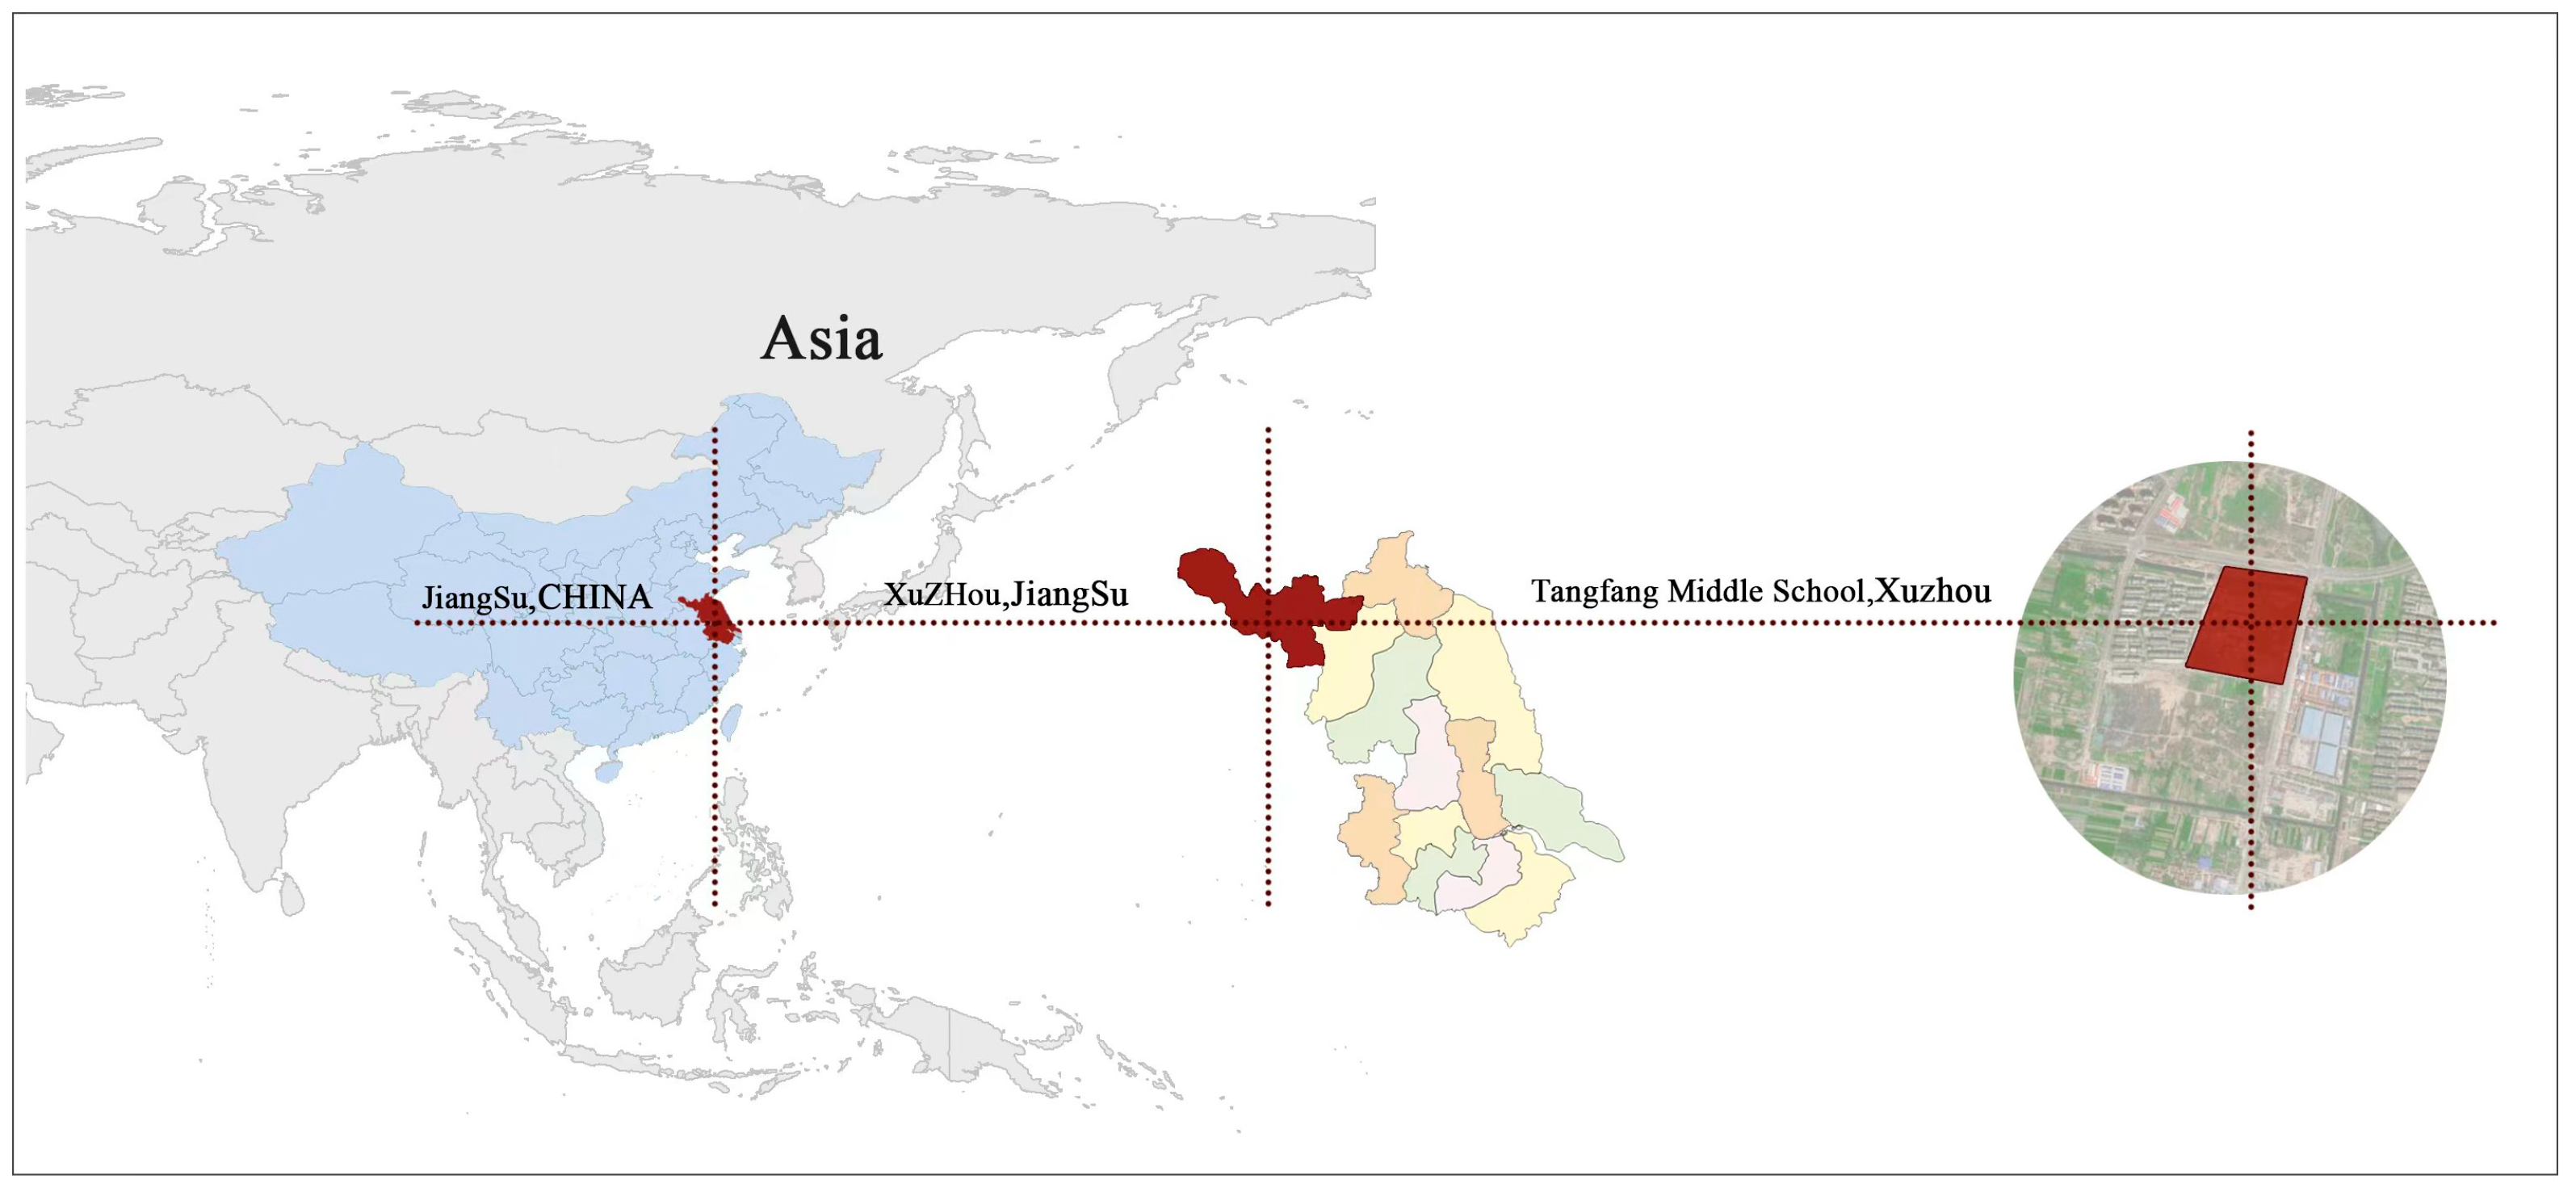
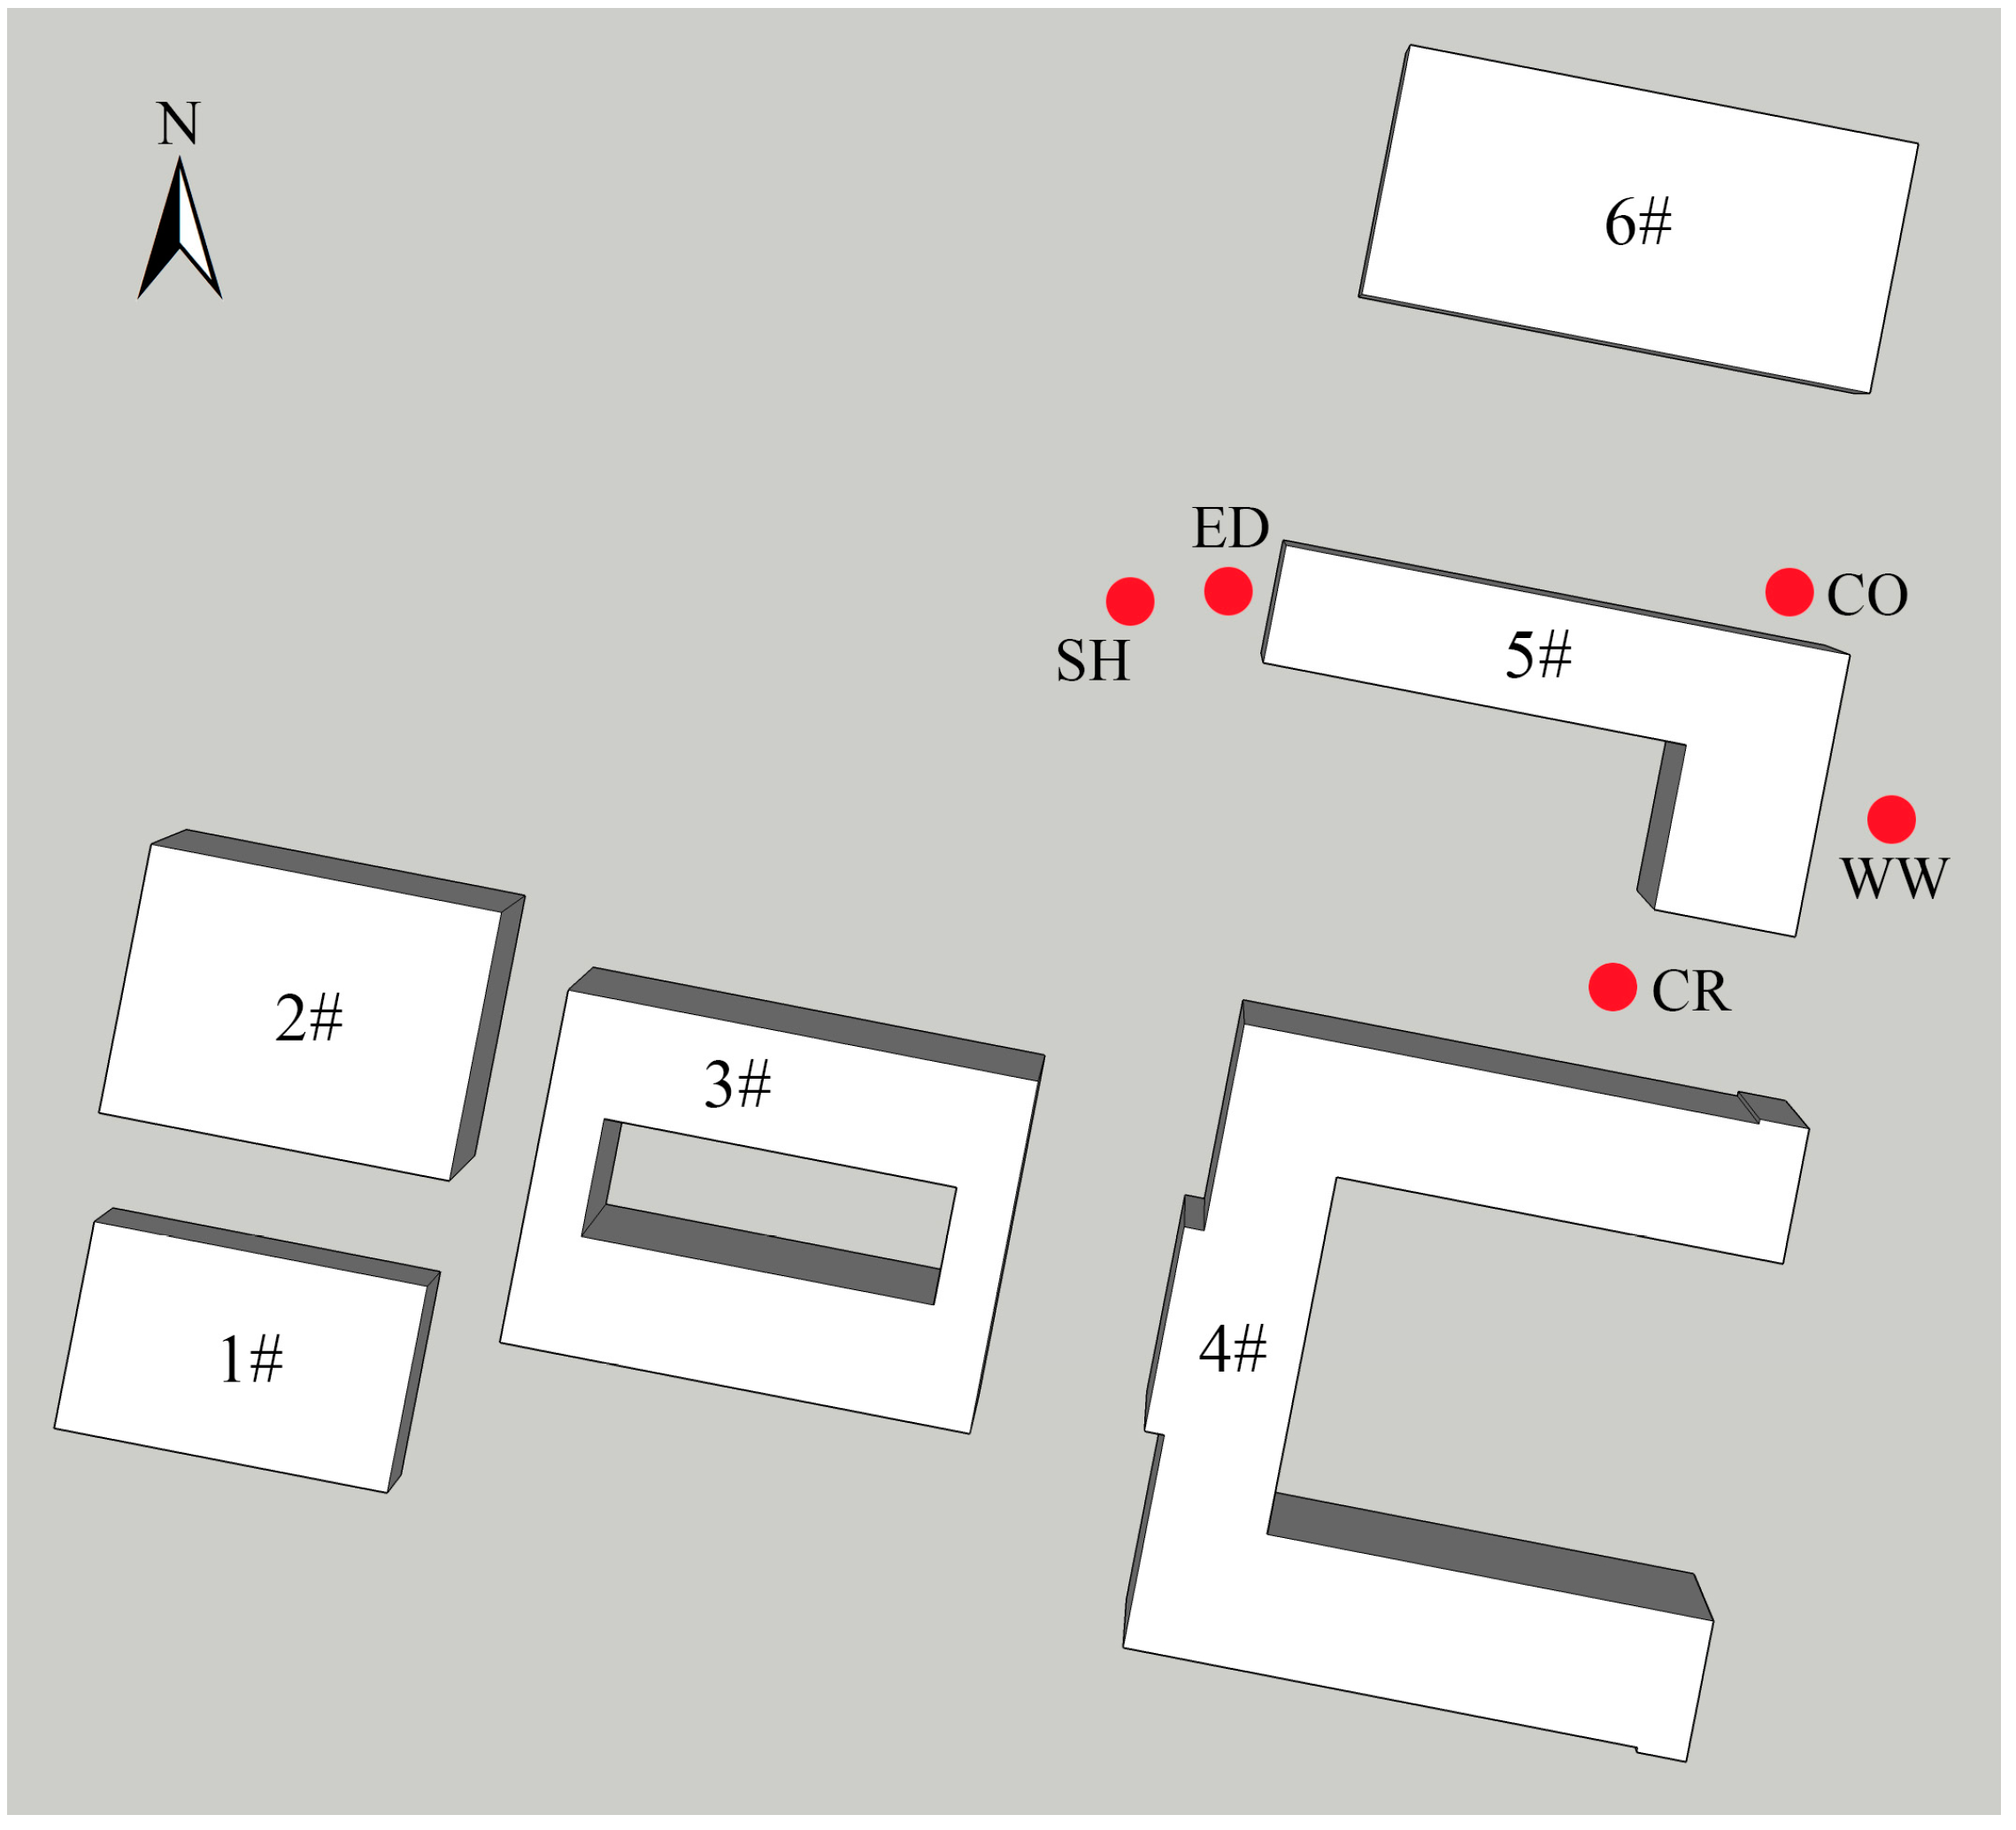
2.1. Project Overview

Xuzhou City is located in the northern part of Jiangsu Province, which is a cold region. It has a typical temperate monsoon climate, with high temperature and rainfall in summer due to the southeast monsoon and cold and dry in winter due to the northwest monsoon. The windiest direction in summer is SSE with an average outdoor wind speed of 2.3 m/s, while the windiest direction in winter is ENE with an average outdoor wind speed of 2.1 m/s. The average wind speed of the outdoor maximum wind direction is 3.0 m/s [38].
This study selects Xuzhou Tangfang School as the research object, and the main target population is primary and middle school students. Primary and middle school students need more outdoor space and time. At the same time, the activity time of primary and middle school students is relatively evenly distributed throughout the day. Compared with high schools with high academic pressure and few outdoor activities and residential areas with obvious differences in population density at different periods, primary and middle schools have the advantages of high population density, a large amount of personnel activities, rich types of activities, and more types of school spaces.
Tangfang Middle School is located in the central-eastern part of Xuzhou (Figure 1). The campus is surrounded by a large number of mid- and high-rise residential buildings that have been built or constructed in recent years, mainly in the eastern and northern parts of the campus. Most of the campus plants are low shrubs. The campus single building has a width of 48 m, a depth of 12 m, and a height of 20 m. Which is typical of urban campus microclimate and meets the experimental requirements of microclimate.
The main population of Tangfang Middle School is primary and middle school students. The landscapes of existing campuses are usually designed from the perspective of students’ learning space while ignoring the need for more outdoor activities for this age group after learning. There has been relatively little research on students’ leisure environment in the existing campus landscape. After a series of research and analysis of the existing campus landscape, according to the types of activities and the number of people as well as the concentrated and dispersed patterns of the crowd in the space, the campus outdoor space is classified into 4 activity types, i.e., entertainment, exercise, rest, and communication (Table 1). Students outdoor activities directly reflect the attractiveness of the thermal comfort of outdoor spaces to students and show the internal link of correlation.

2.2. Horizontal Flow Field

In order to clarify the typical division of the horizontal flow field, determine the location of the measured wind speed environment in the horizontal flow field, and facilitate the study of simulated data, CFD is used to simulate the typical spatial wind environment. The representative space is selected according to the different areas formed by the natural wind after encountering the structure. On that basis, the flow field area can be qualitatively divided into a windward area, cross-flow area, eddy area, shade of wind area, and corner flow area [39] (Figure 2).

3. Measurement and Simulation of Campus Space Microclimate

3.1. Wind Environment Data Measurement

According to the Central Meteorological Observatory, on 23 December 2021, the average temperature in Xuzhou dropped by 12–14 °C degrees due to the affection by cold air, and the onshore wind force was northerly winds of magnitude 5~7 (8.0–10.8 m/s). Under such a condition, the wind environment test on the campus of Tangfang Middle School was conducted from 8:00 to 20:00. The test points were arranged at five positions near the No. 5 teaching building (Figure 3), corresponding to different types of horizontal flow field areas of the campus wind environment. Specifically, 1# is the windward area, 2# is the corner flow area, 3# is the cross-flow area, 4# is the eddy area, and 5# is the shade of wind area. The test point is 1.5 m high from the ground, and a bracket anemometer is used for the test. The measurement accuracies include wind speed ± 2%, wind direction ± 3°, temperature ± 1 °C, and pressure ± 1.5 hPa.
Based on the wind field statistics of the campus for 12 consecutive hours, the wind speed, wind direction, and wind pressure in different areas of the wind environment around the No. 5 building were obtained. The maximum wind speed is 7.3 m/s in the cross-flow area, followed by 6.1 m/s in the corner flow area, the windward area, the eddy area, and the shade of wind area. The wind direction is relatively stable in the windward, cross-flow, and corner flow areas, and there is no turbulence. The wind direction in the eddy area and the shade of the wind area are relatively turbulent. In particular, in the eddy area, although the wind speed is relatively small, turbulence is the most serious, which affects the comfort of the users (Figure 4).
According to the measured data of the campus wind environment, it can be seen that the wind environment of the campus is relatively poor due to the influence of the shade. The corner flow area of the building and the cross-flow area formed with the passageway of adjacent buildings produce a relatively extreme wind field, and there are often instantaneous strong wind phenomena. In particular, the cross-flow area has a high flow of people and a high frequency of use, which leads to a decrease in the comfort of people in this space. Although the entrances and exits of the No. 5 building are set at the back of the windward area of the winter wind, the wind field in this space area is turbulent and exists strong turbulence, which affects the comfort of students’ normal travel.

3.2. Wind Environment Data Simulation

3.2.1. CFD Simulation Process

There are many types of CFD simulation software used for research, such as PHOENICS (2019), ANSYS FLUENT (2020), ENVI-met (5.3), Airpak (3.0), and Butterfly (1.4.0). PHOENICS is mainly used to simulate the wind environment, solar radiation, etc. The application of FLUENT needs to cooperate with the pre-mesh generation software (ICEM CFD (2020), ANSYS Mesh (2020)) and the post-result visualization software (CFD-Post (2020), Tecplot (2021)). FLUENT is mainly used to simulate fluid, heat transfer, and chemical reflection. ENVI-met relies on the principles of fluid mechanics and thermodynamics and can be used to simulate wind and thermal environments. Airpak is a professional artificial environment system analysis software for engineers, architects, and interior designers in the professional field, especially in the field of HVAC. Butterfly is a building weather data analysis software built into the wind environment simulation component of RHINO’s Grasshopper (7.0). Its analysis system can be used to simulate the wind environment and urban heat islands, etc.
The parameter setting of PHOENICS (2019) is simple and intuitive, the mesh can be automatically generated and adjusted, and the rich computational model can be used for efficient simulation. Therefore, more and more researchers choose PHOENICS (2019) to simulate the wind environment in residential areas, school areas, and landscape gardens. Ming Lu et al. performed CFD simulations with PHOENICS (2019) and found that different height distribution patterns have an impact on the changes in wind speed and pressure. The equal height layout of building rows and the layout of taller buildings on the east side can provide higher comfort [40]. Xuan Wei used PHOENICS (2019) and Ecotect to simulate the relationship between building space layout and wind, heat and sunlight environment as a basis for reducing energy consumption and carbon emissions in the community [41]. Xiaodan Li et al. used PHOENICS (2019) simulation software to summarize the strategies for optimizing the campus wind environment in terms of building space layout, site design, and plant distribution [42]. Junying Li et al. used PHOENICS (2019) to study the effect of plant layout in courtyards on outdoor microclimate and thermal comfort of occupants [43]. Xiaodong Xu et al. used PHOENICS (2019) and DesignBuilder to study the courtyard space layout and aspect ratio and create an ecological buffer space to evaluate the performance of courtyard design [44].
A large number of studies in recent years have demonstrated the accuracy and reliability of PHOENICS in wind environments. Therefore, in this study, the Flair module of PHOENICS was used to simulate the turbulence model RNG k-ε. The coupling algorithm for velocity and pressure uses the discrete equation PRESTO, while the small-scale grid can be automatically set to improve the computational accuracy. The convergence accuracy of PHOENICS (2019) simulations is 10−4 [45].
(1).
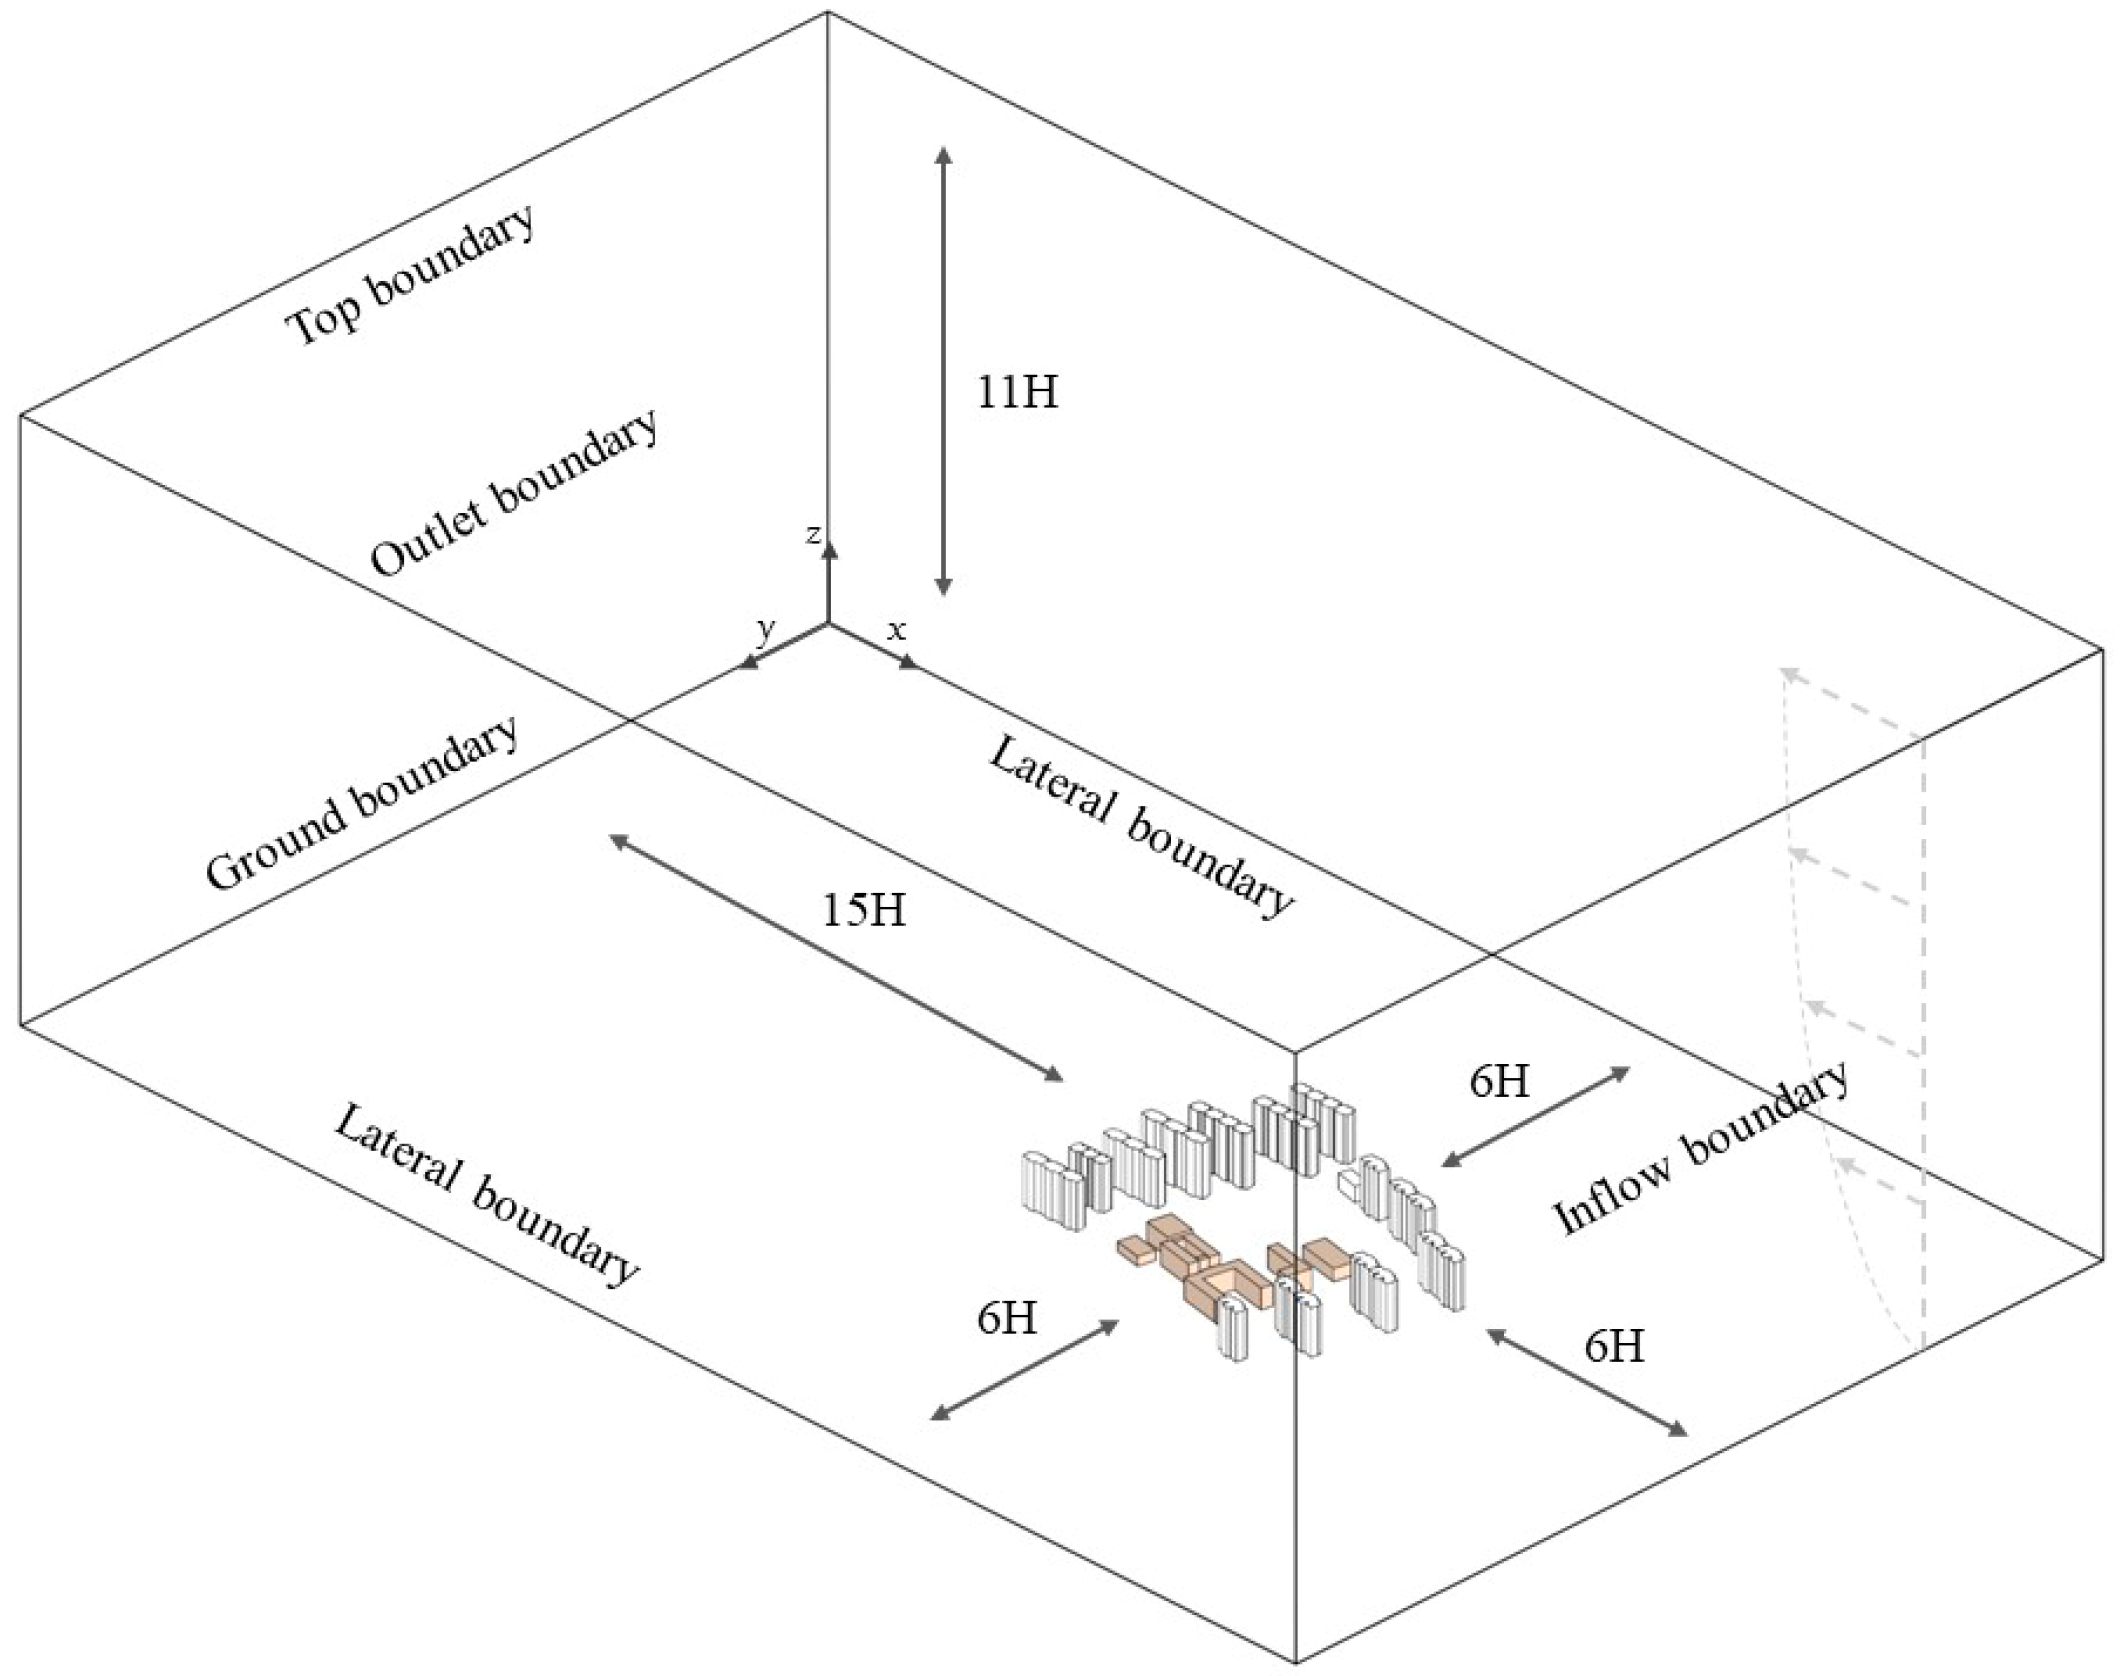
Calculation Area Settings
Corresponding guidelines for model calculation locale have been proposed by predecessors. Fu Yong et al. and Mochida et al. proposed to set the boundary to be 5H or more away from the building to ensure full development of the wind field, where H is the height of the target building [46,47,48]. Chinese standard JGJ/T 449-2018 [49] recommends that the distance from the water inlet and outlet boundary to the building edge should be greater than 5H and 10H, respectively.
In order to truly simulate the overall wind environment of the campus, the calculation area in this study is determined in six buildings from No. 1–No. 6 of the campus. The near-ground wind environment and some of the surrounding residential buildings were simulated, and the overall layout of the buildings showed ranks and columns. The building monoliths were simplified accordingly and used for CFD hydrodynamic simulation of the wind environment in this area (Table 2) (Figure 5).
(2).
Grid Division
The quality of the grid division determines the accuracy of the computational results and the computing time [50]. To generate the mesh, the grid resolution must meet the criteria based on CFD guidelines. The minimum grid resolution must be set to 1/10 of the building scale. The expansion ratio should not exceed 1.2 to avoid too high a volume ratio for adjacent cells. The coarser mesh is used for the parts far from the target area, the minimum size of grid cells X, Y, and Z is 0.3 m × 0.3 m × 0.3 m. On that basis, the corresponding grid of this computational region is generated. Meanwhile, some other works have been performed to ensure the accuracy of the simulation, i.e., appropriately adjusting the sparsity and grid quality of the corresponding computational region grid, checking the maximum grid and minimum grid cell volume and grid quality division, etc. The final computational domain of this simulation is divided into approximately 5,640,000 grids.
(3).
Mathematical Model
According to the fluid flow state, the turbulence equation model is adopted in the simulation [51,52,53]. In the standard k-ε model, the equation of k and ε is:
( ρ k ) t + ( ρ k u i ) x i = x j [ ( μ + μ i σ k ) k x j ] + G k + G N ρ ε
( ρ ε ) t + ( ρ ε u i ) x i = x j [ ( μ + μ i σ ε ) ε x j ] + C 1 ε ε k ( G k + C 3 ε G b ) C 2 ε ρ ε 2 k + S ε
where G b is the generation term due to buoyancy. For incompressible fluids, G b = 0 , while for compressible fluids, it can be expressed as:
G b = β g i μ i p r i T x i
where p r i is the turbulent Prandtl number, and in this model p r i = 0.85 ; g i is the acceleration of gravity, and β is the coefficient of thermal expansion:
β = I ρ ρ T
G k is the generation term of the turbulent kinetic energy k, which is caused by the average velocity gradient:
G k = μ i ( μ i x j + u j x i ) u i x j
For incompressible fluids, Y M = 0 , while for compressible fluids, it can be expressed as:
Y M = 2 ρ a M t 2
where a is the speed of sound, a = r R T ; and M t is the turbulent Mach number, M t = k / a 2 .
In the standard k - ε model: C μ = 0.09 , σ ε = 1.3 , C 1 ε = 1.44 , C 2 ε = 1.92 , and σ k = 1.0 .

3.2.2. Evaluation Criteria for Wind Environment Simulation Results

The wind environment is one of the variables for calculating outdoor thermal comfort. According to previous research, the influence of outdoor wind speed on human body status was observed based on the effect of wind speed on people [54], as shown in Table 3. Xuzhou is located in the cold region of China and is a typical cold region city. Therefore, it is necessary to meet the green building evaluation standard (GB/T50378-2019) that the wind speed in the pedestrian area in winter is less than 5 m/s [55]. Low wind speeds can lead to poor air circulation and long-term accumulation of pollutants, affecting people’s comfort and health. It is further shown that the area with a wind speed lower than 1 m/s or 0.5 m/s can be defined as the quiet wind zone [56,57]. The wind pressure also needs to be evaluated in the wind environment. In the study area, except for the first row of windward buildings, the wind pressure difference between the windward and leeward sides of each building should not be greater than 5 Pa [58]. At the same time, it is also necessary to ensure that more than 75% of concrete buildings have a wind pressure difference of 1.5 Pa between the windward side and the leeward side [59]. The above evaluation is based on the physical feeling at the height of the pedestrian under the natural ventilation state, that is, the acceptable wind speed is 1–3.4 m/s, and the acceptable wind pressure difference range is ±1.5–5 Pa.
In this study, the Universal Thermal Climate Index (UTCI) was used to evaluate the effect of ventilation on thermal comfort, and the Grasshopper software (7.0) was used to calculate the impact of wind speed distribution in different outdoor spaces on the campus on the thermal comfort of students in that space [60,61]. The equation is as follows:
U T C I = f ( R h , T m r t , V a , T d )
where R h is the air humidity, T m r t is the mean radiant temperature, V a is the wind speed, T d is the air temperature. UTCI calculations are performed using Grasshopper scripts. The data for Xuzhou comes from the typical annual meteorological data of the Xuzhou Meteorological Station in China Standard Weather Data (CSWD). As shown in Table 4, different UTCI ranges represent cold or hot regions.

3.2.3. Wind Environment Simulation Results

(1).
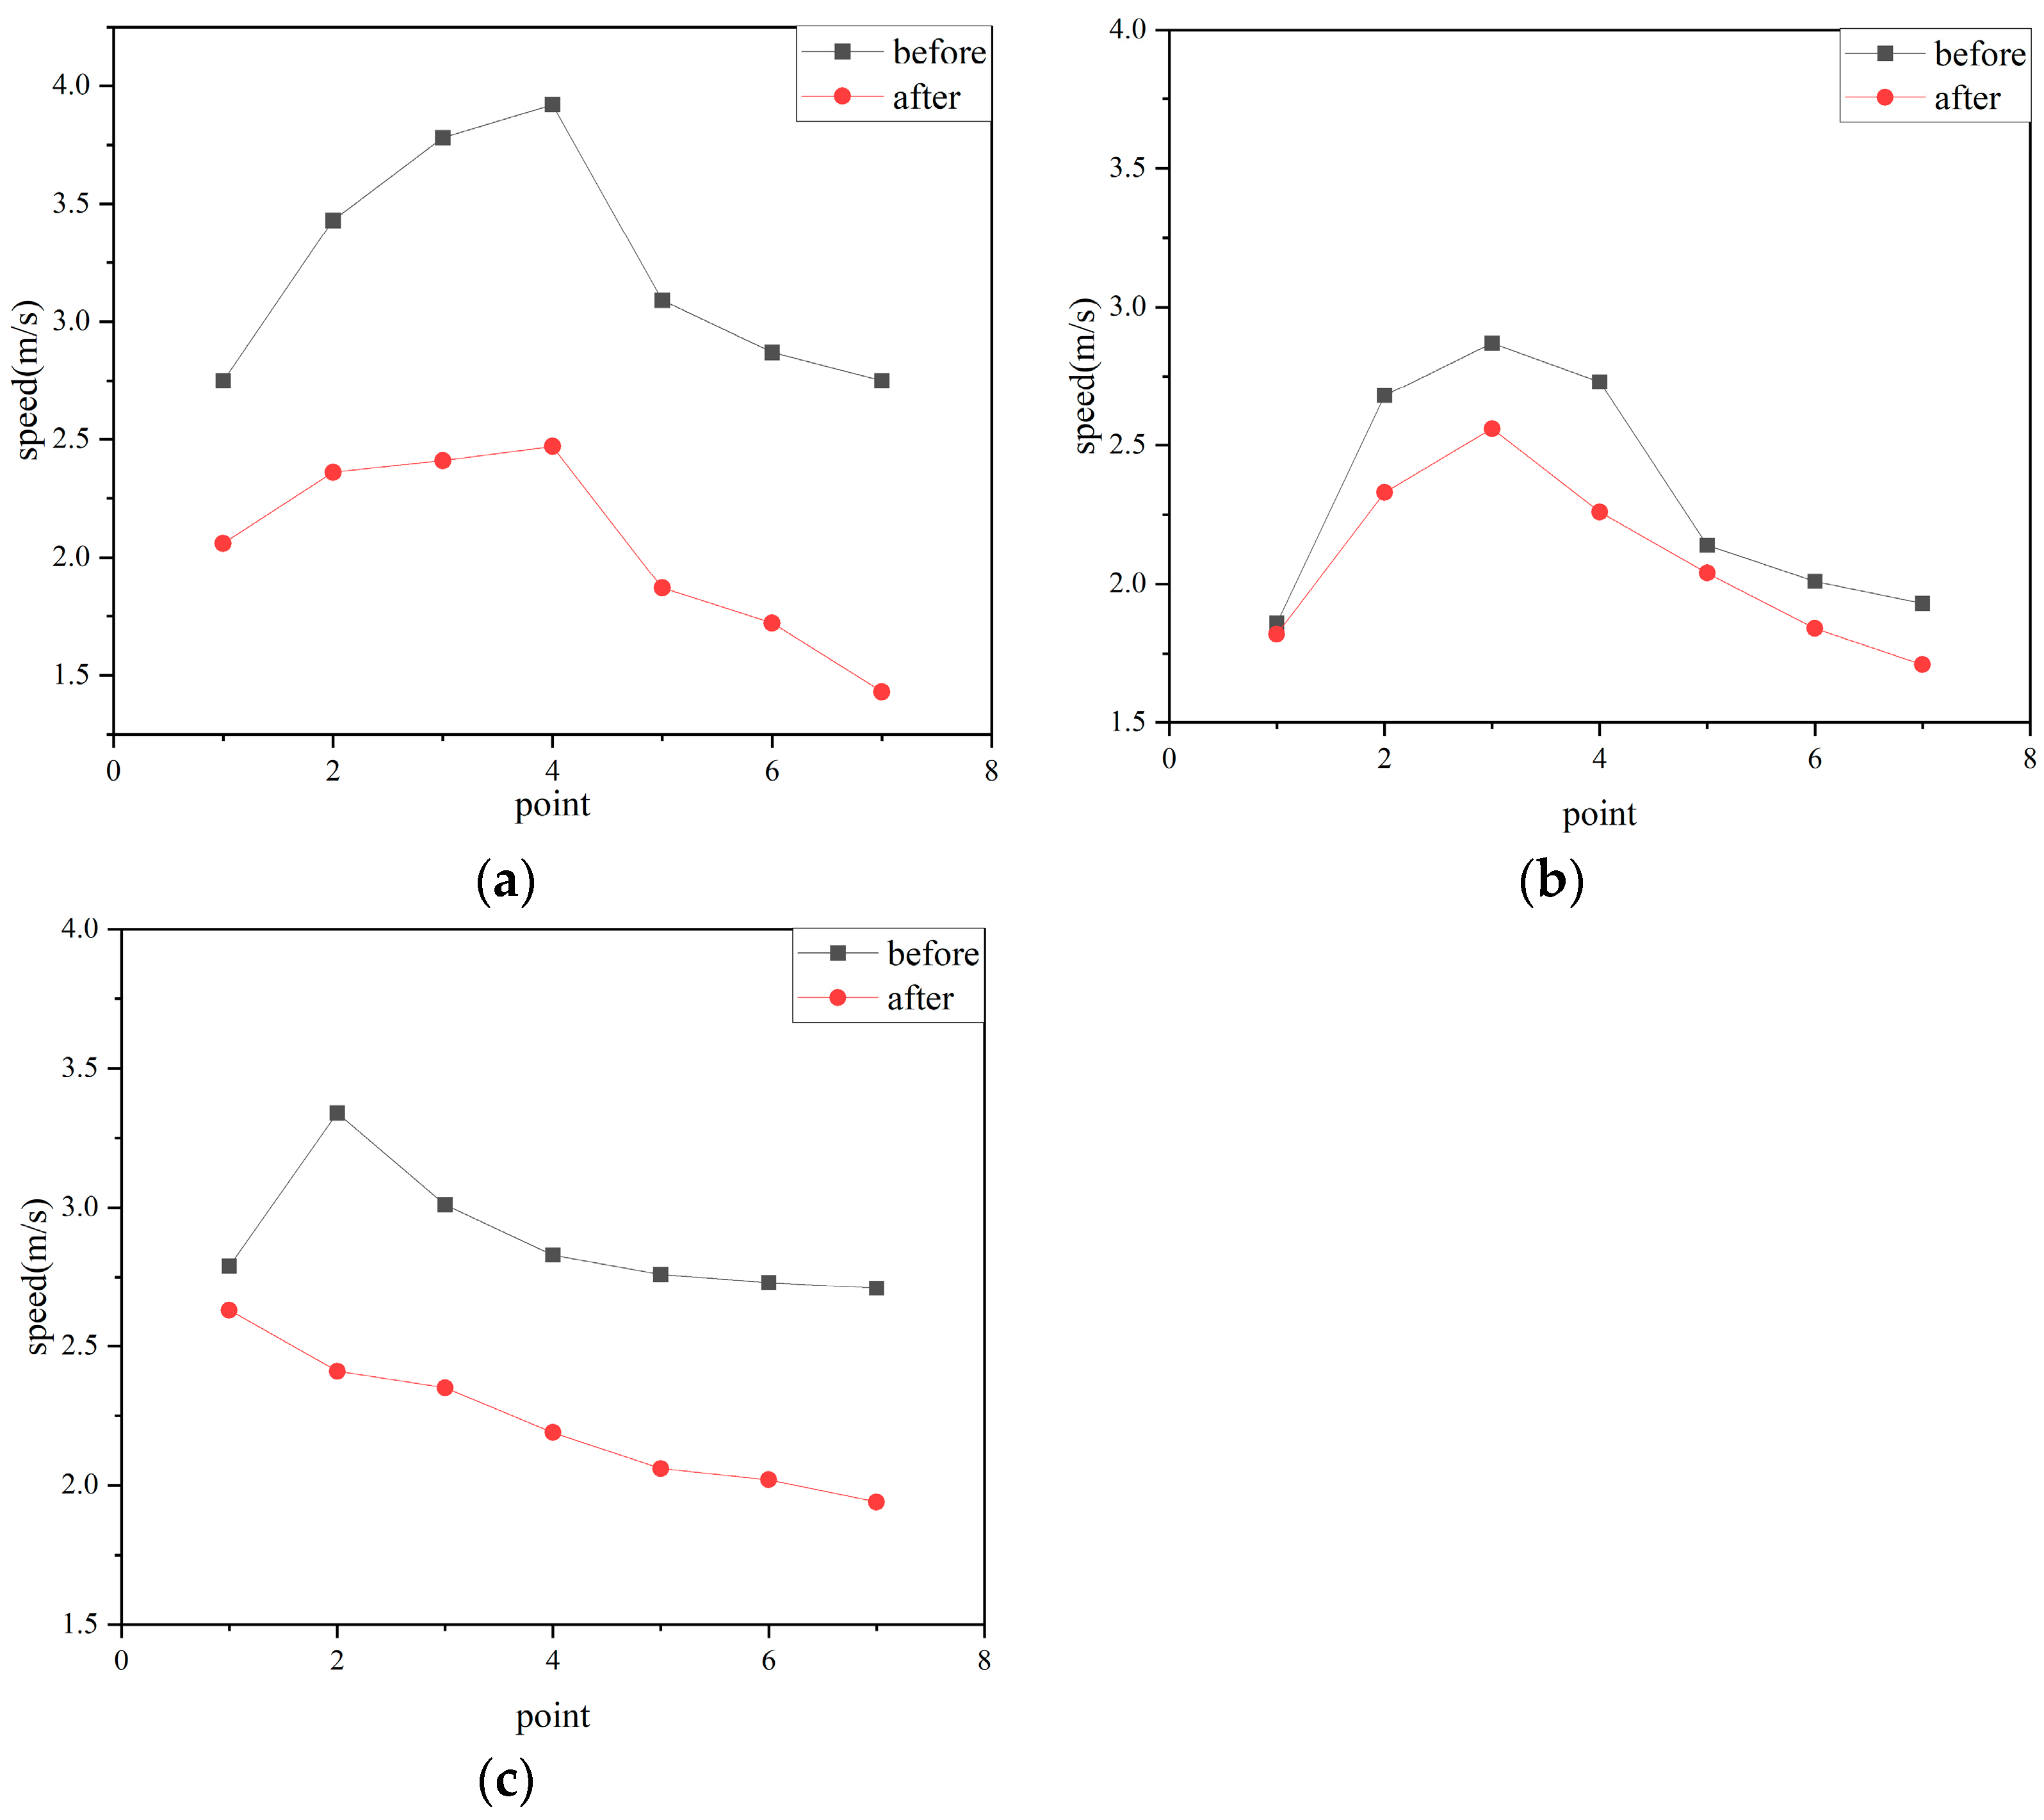
Comparative Analysis of CFD Simulation Data and Actual Measurement
A numerical simulation of the wind environment of the campus was carried out based on CFD. Taking the actual measured average wind speed in the windward area of 3.9 m/s as the simulated inflow wind speed, after 2000 iterations, the maximum gust of wind in the simulated wind field of the campus was 5.5 m/s. The simulated maximum wind speed was smaller than the measured maximum gust wind speed. Then, the location of the measured points was put into the wind field simulation environment to record the average wind speed of the relevant points, and the simulated wind field data of each monitoring point were compared with the measured data for analysis (Figure 6). It was found that the simulated and measured data were in good agreement. However, the maximum wind speed in the simulated wind field was lower than the maximum wind speed at the actual monitoring points, indicating that the actual environmental wind field is more complex and extreme conditions are more frequent.
(2).
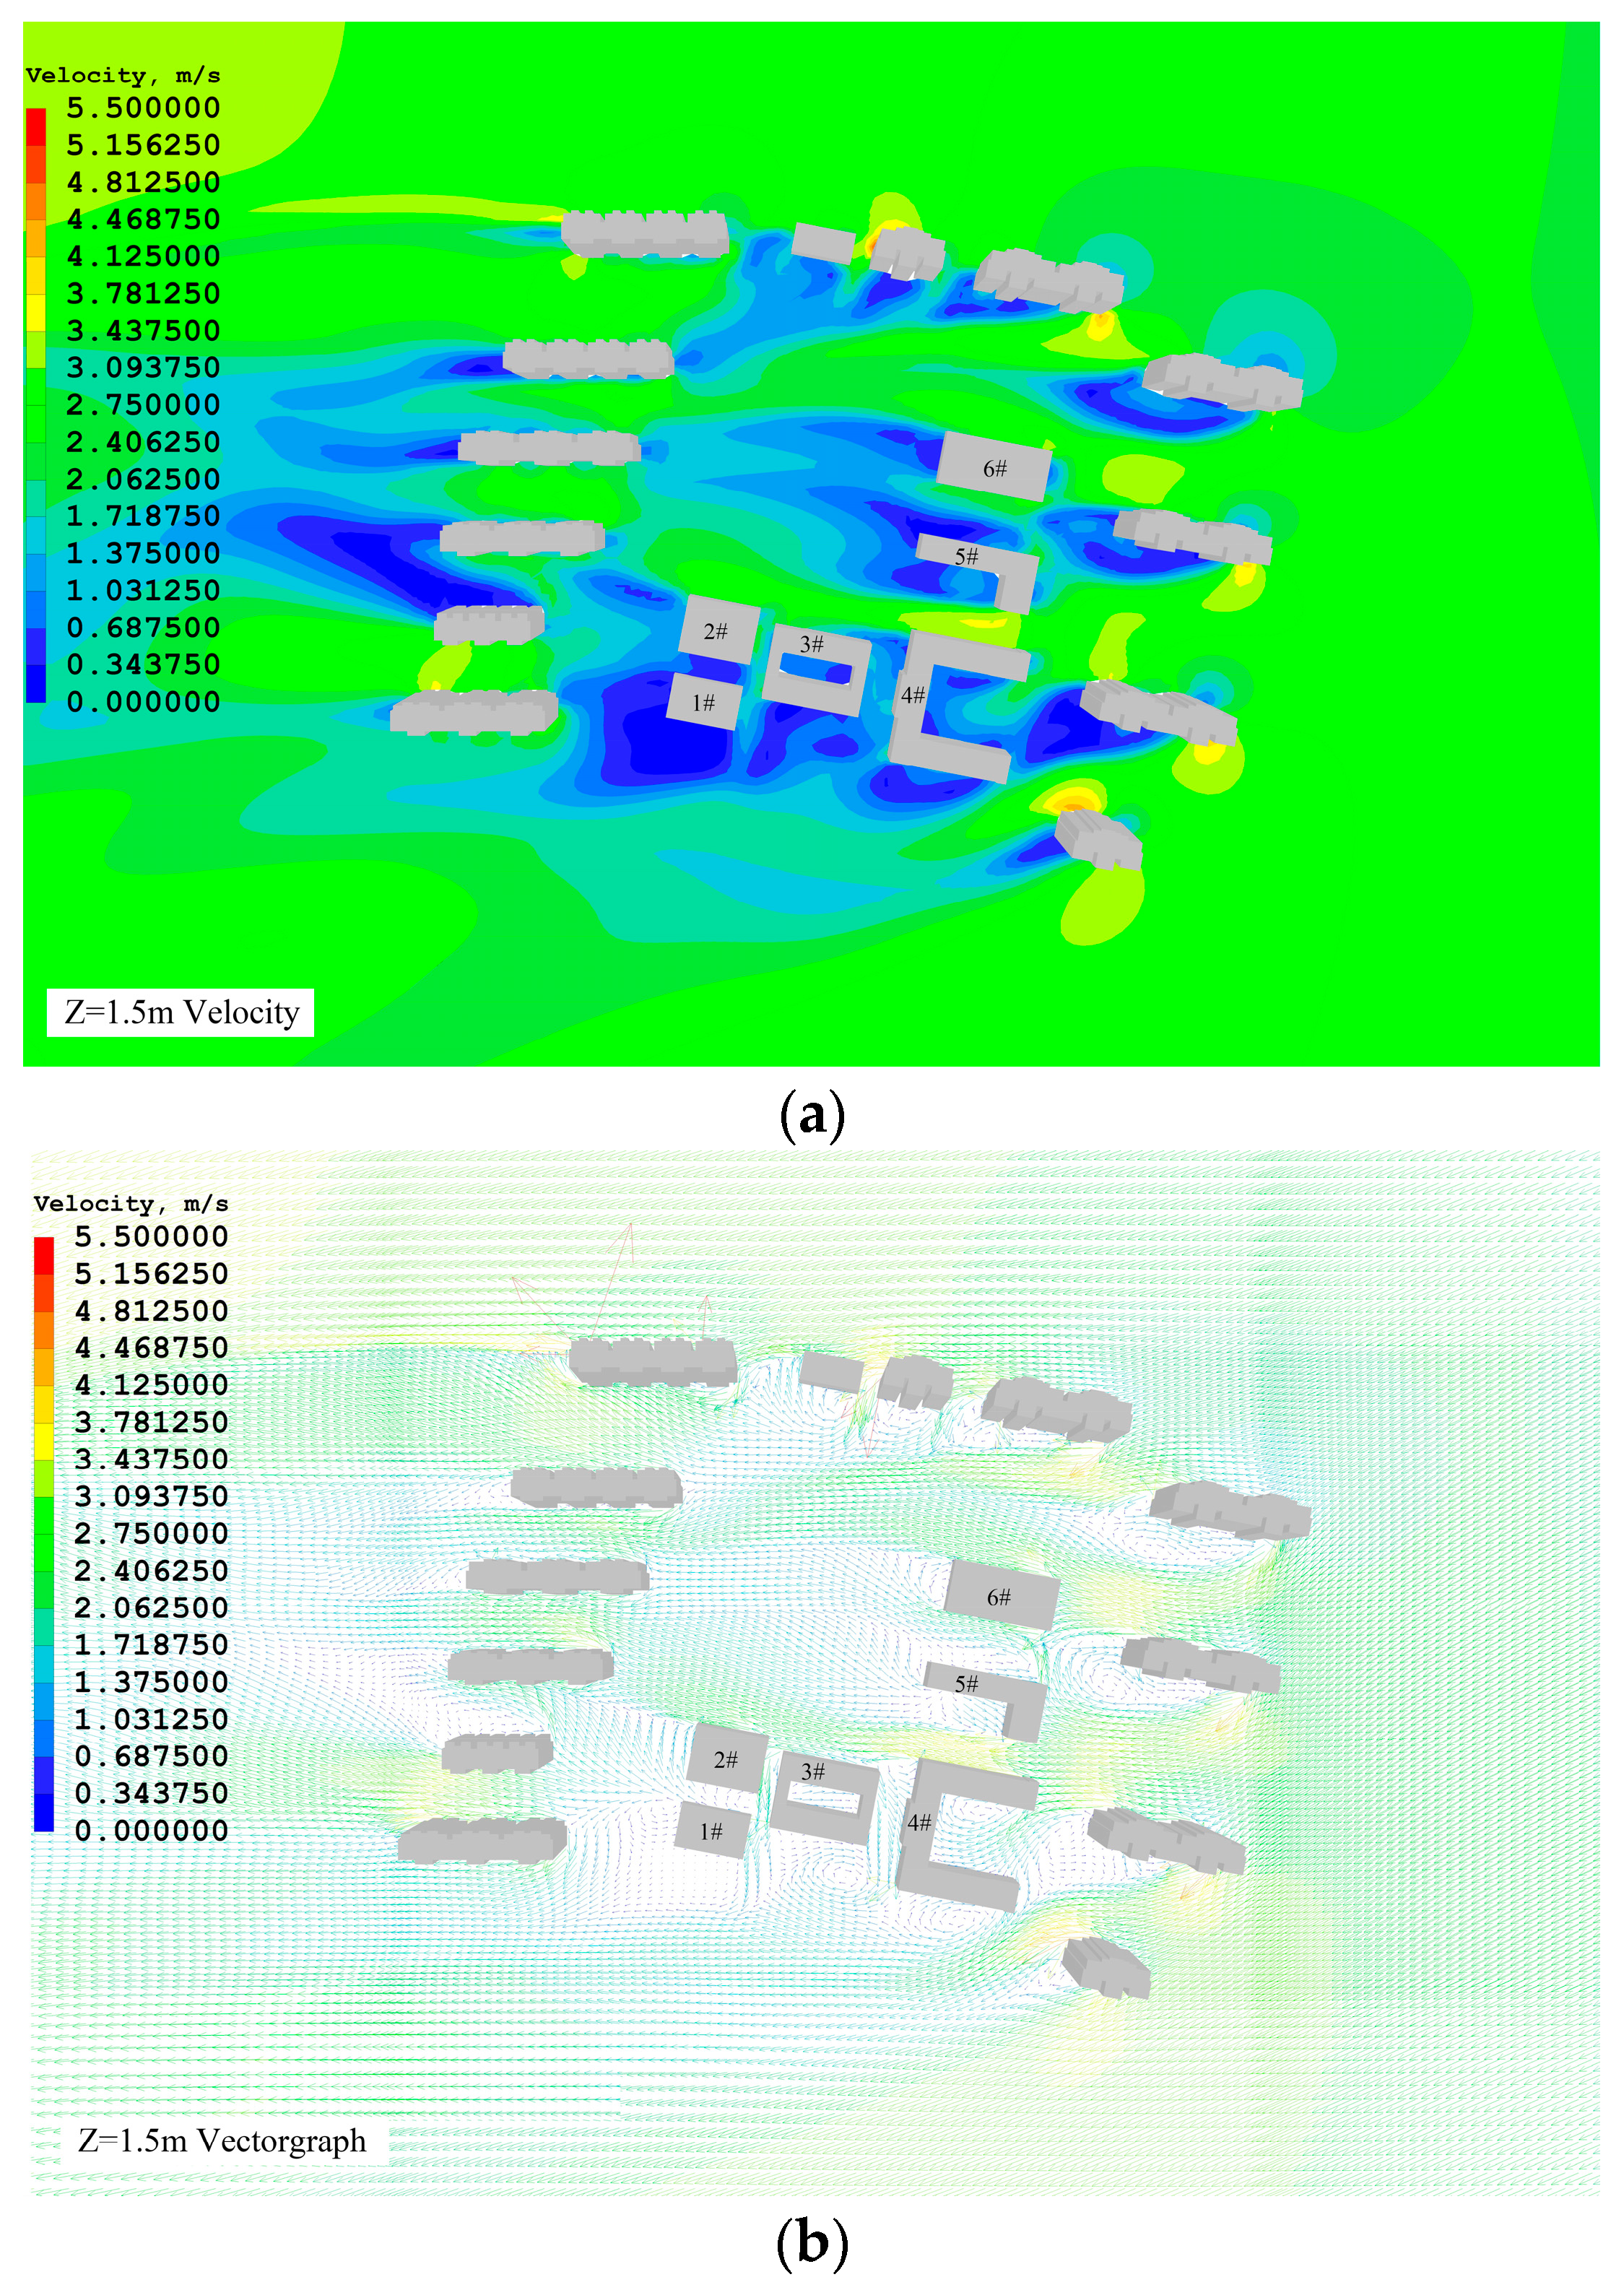
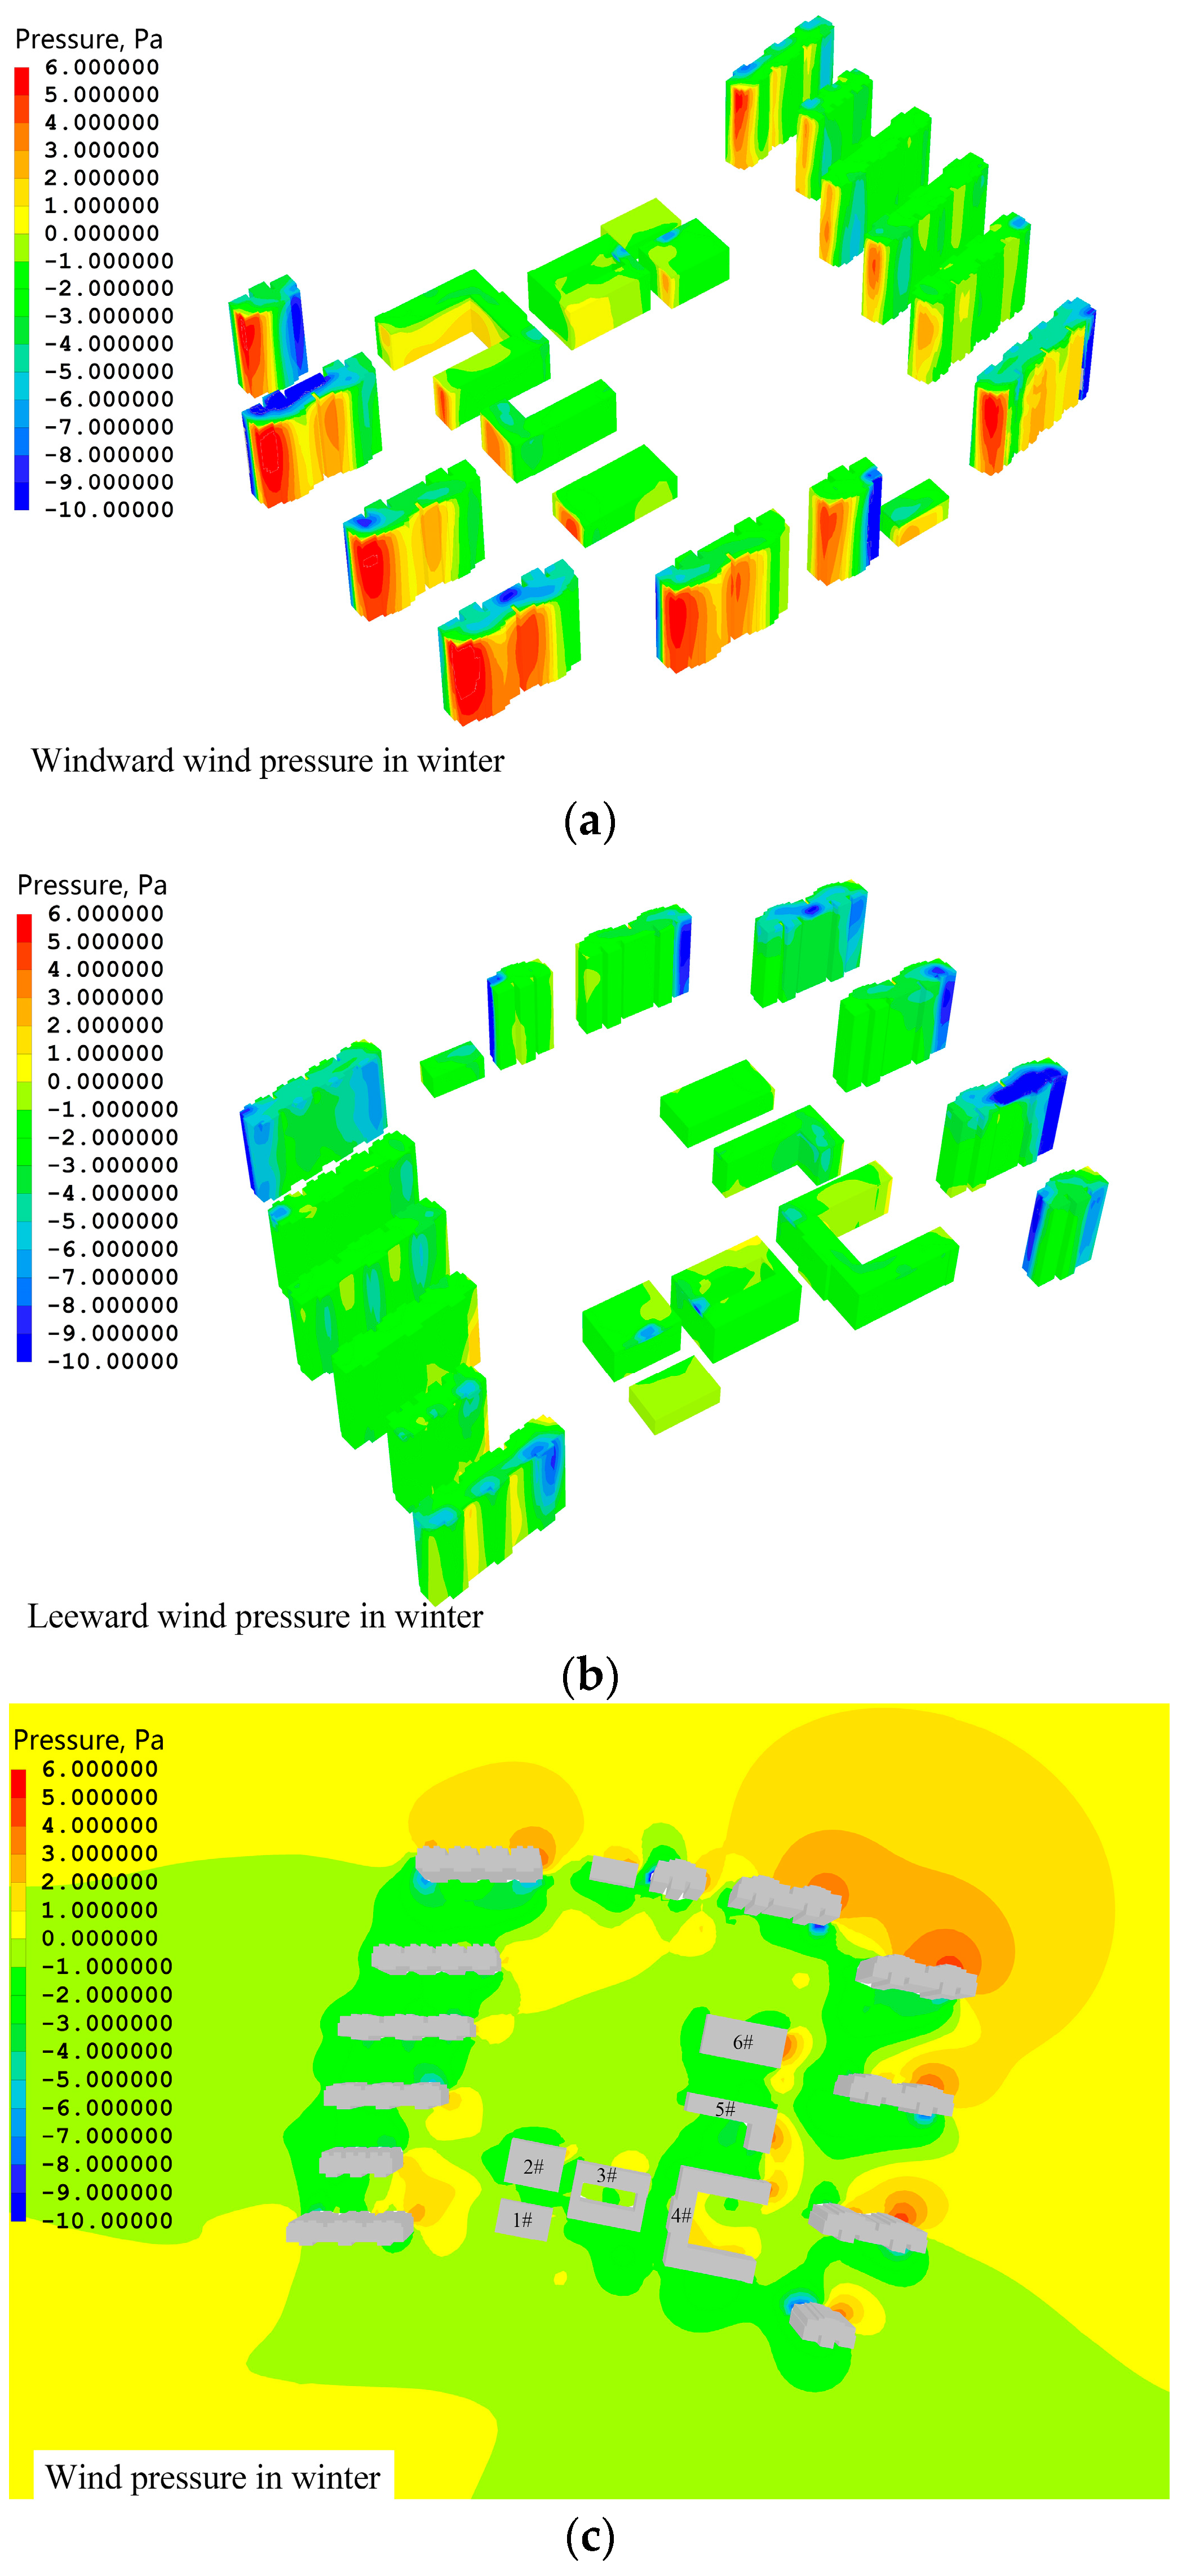
Analysis of the Simulation Data Contour Map
By using CFD to simulate the campus wind environment, the simulation results of the wind environment at the pedestrian height of 1.5 m from the ground (Z = 1.5 m) were obtained (Figure 7 and Figure 8).
According to Table 3, the comfortable wind speed range at pedestrian height under natural ventilation is 1–3.4 m/s. It can be seen from the statistical results that the wind speed in the outdoor space of the campus is distributed between 0.34–5.5 m/s. The comfortable wind speed distribution rate is over 87%. However, according to statistics, the area where the outdoor wind speed of the campus is greater than 3.4 m/s accounts for 4.62% of the outdoor space of the campus. The high wind speed is concentrated in the front and rear passages of the No. 5 building (the building passage between No. 4–No. 5 buildings and the building passage between No. 5–No. 6 buildings) and the corner flow area space of No. 6 building and has a great impact on the overall comfort of the area. According to statistics, the area where the outdoor wind speed of the campus is less than 1 m/s accounts for 8.38% of the outdoor space of the campus. They are located in the middle courtyard of the No. 3 building and the outdoor space on the leeward side of the No. 1, No. 3, and No. 4 buildings.
From the wind pressure on the windward side of Figure 6 and the overall wind pressure distribution in Figure 6, it can be seen that the high-pressure areas on the windward side of the campus are mainly distributed in No. 4, No. 5, and No. 6 buildings. The pressure value in these areas is greater than 6 Pa, showing a longitudinal distribution state. From the wind pressure on the leeward side of Figure 6 and the rectified wind pressure distribution in Figure 6, it can be seen that the negative pressure area on the leeward side of the campus is mainly distributed in the No. 2 and No. 3 buildings with a pressure value of less than −5 Pa, which is horizontally distributed on the roof of the building. Overall, the wind pressure difference in outdoor areas of the campus was 75%, with a distribution ratio of 79.62–84.23%. However, the optimal wind pressure distribution for each distribution mode does not exceed 38%, with a range of 23.77–37.16%. Meanwhile, there are areas where the wind pressure difference was greater than 5 Pa, accounting for 43.90–58.86% of the distribution area in the windward and leeward sides of the No. 5 building. Windproof treatment in winter is needed in this area, and it is necessary to strengthen the windproof effect around the No. 5 building to prevent heat loss due to air outflow, and to reduce the wind pressure difference to stabilize outdoor ventilation, thus meeting the outdoor comfort needs of students in this space.
From Figure 7 and Figure 8, it can be seen that the whole campus is surrounded by high-rise residential buildings, and the No. 5 teaching building as the main experimental object is in the whole campus wind environment where the maximum wind speed and turbulence phenomenon are serious. According to the relationship between wind speed and outdoor human comfort in Table 3, we obtained that the activity area of No. 4–No. 5 buildings (cross-flow area of No. 5 building) is the worse area in the campus wind environment, followed by the corner flow area and windward area of No. 5 building, which are the three areas with poor outdoor human comfort.
The passage between No. 4 and No. 5 buildings is affected by the comprehensive influence of the corner flow area of the No. 5 building and the cross-flow area formed between the No. 4 and No. 5 buildings, and the corner flow area formed by the surrounding high-rise residential buildings aggravates the instantaneous wind speed. Under the simulated conditions, the instantaneous wind speed reached 5.5 m/s, and the branches swayed obviously. On the same day, pedestrians felt strong wind pressure in this area, and it was relatively difficult to walk through this area; at the same time, there were only low shrubs and no tall trees on both sides, which enhanced the passage effect in this area and aggravated the instantaneous wind speed.
The windward area on the right side of the No. 5 building is affected by the superposition of two airflows in the corner flow area and the cross-flow area of high-rise residential buildings, forming another severe wind environment area. Under the simulated conditions, a strong wind environment appeared in this area, and the instantaneous wind speed reached 5.1 m/s. At the same time, the wind pressure was very high, and it was difficult to walk in this environment. The current area has a relatively large flow of people, but there are only a few sparse shrubs, which cannot meet the effect of reducing wind speed.
In the area where the No. 5 and No. 6 buildings intersect, the shearing action of two streams in the corner flow area of the two buildings makes the wind field in this area harsh and turbulent, with a large amount of turbulence, resulting in a sudden high and low wind speed here. At the same time, the wind pressure in this area is unstable, and a very high wind pressure state appears instantaneously.

3.3. Light Environment Simulation

A study of campuses in cold regions of China has revealed that campus crowds have a more urgent need for daylight in cold regions. Especially in the outdoor space in autumn and winter, it is difficult to attract campus people to participate in outdoor activities if there is not sufficient sunlight. At the same time, light plays a decisive role in the growth of plants. Different degrees of light determine the growth habits of plants, such as sun-loving plants, shade-tolerant plants, and other plants with different growth habits. Ecotect (2011) is an ecological building design software developed by Square One, UK [41]; it is mainly used in the schematic design phase and provides six powerful analysis functions such as thermal environment, light environment, sound environment, sunlight, and economic and environmental impact, and visibility. In addition, Ecotect includes a module for visualizing weather data analysis, which includes the main factors affecting the building design. Ecotect can be used for accurate and quantitative analysis of shading, ventilation, and energy consumption in the process of building scheme design, providing a quantitative basis for building design and energy saving. However, the software is mostly used for indoor thermal environment analysis and can calculate the time variation of average indoor temperature but cannot simulate the three-dimensional spatial distribution of temperature. Therefore, the sunlight analysis software Ecotect is used to derive the amount of sunlight and solar radiation for the campus environment, which can provide a basis for later landscape design based on people’s activity needs and plant growth habits.

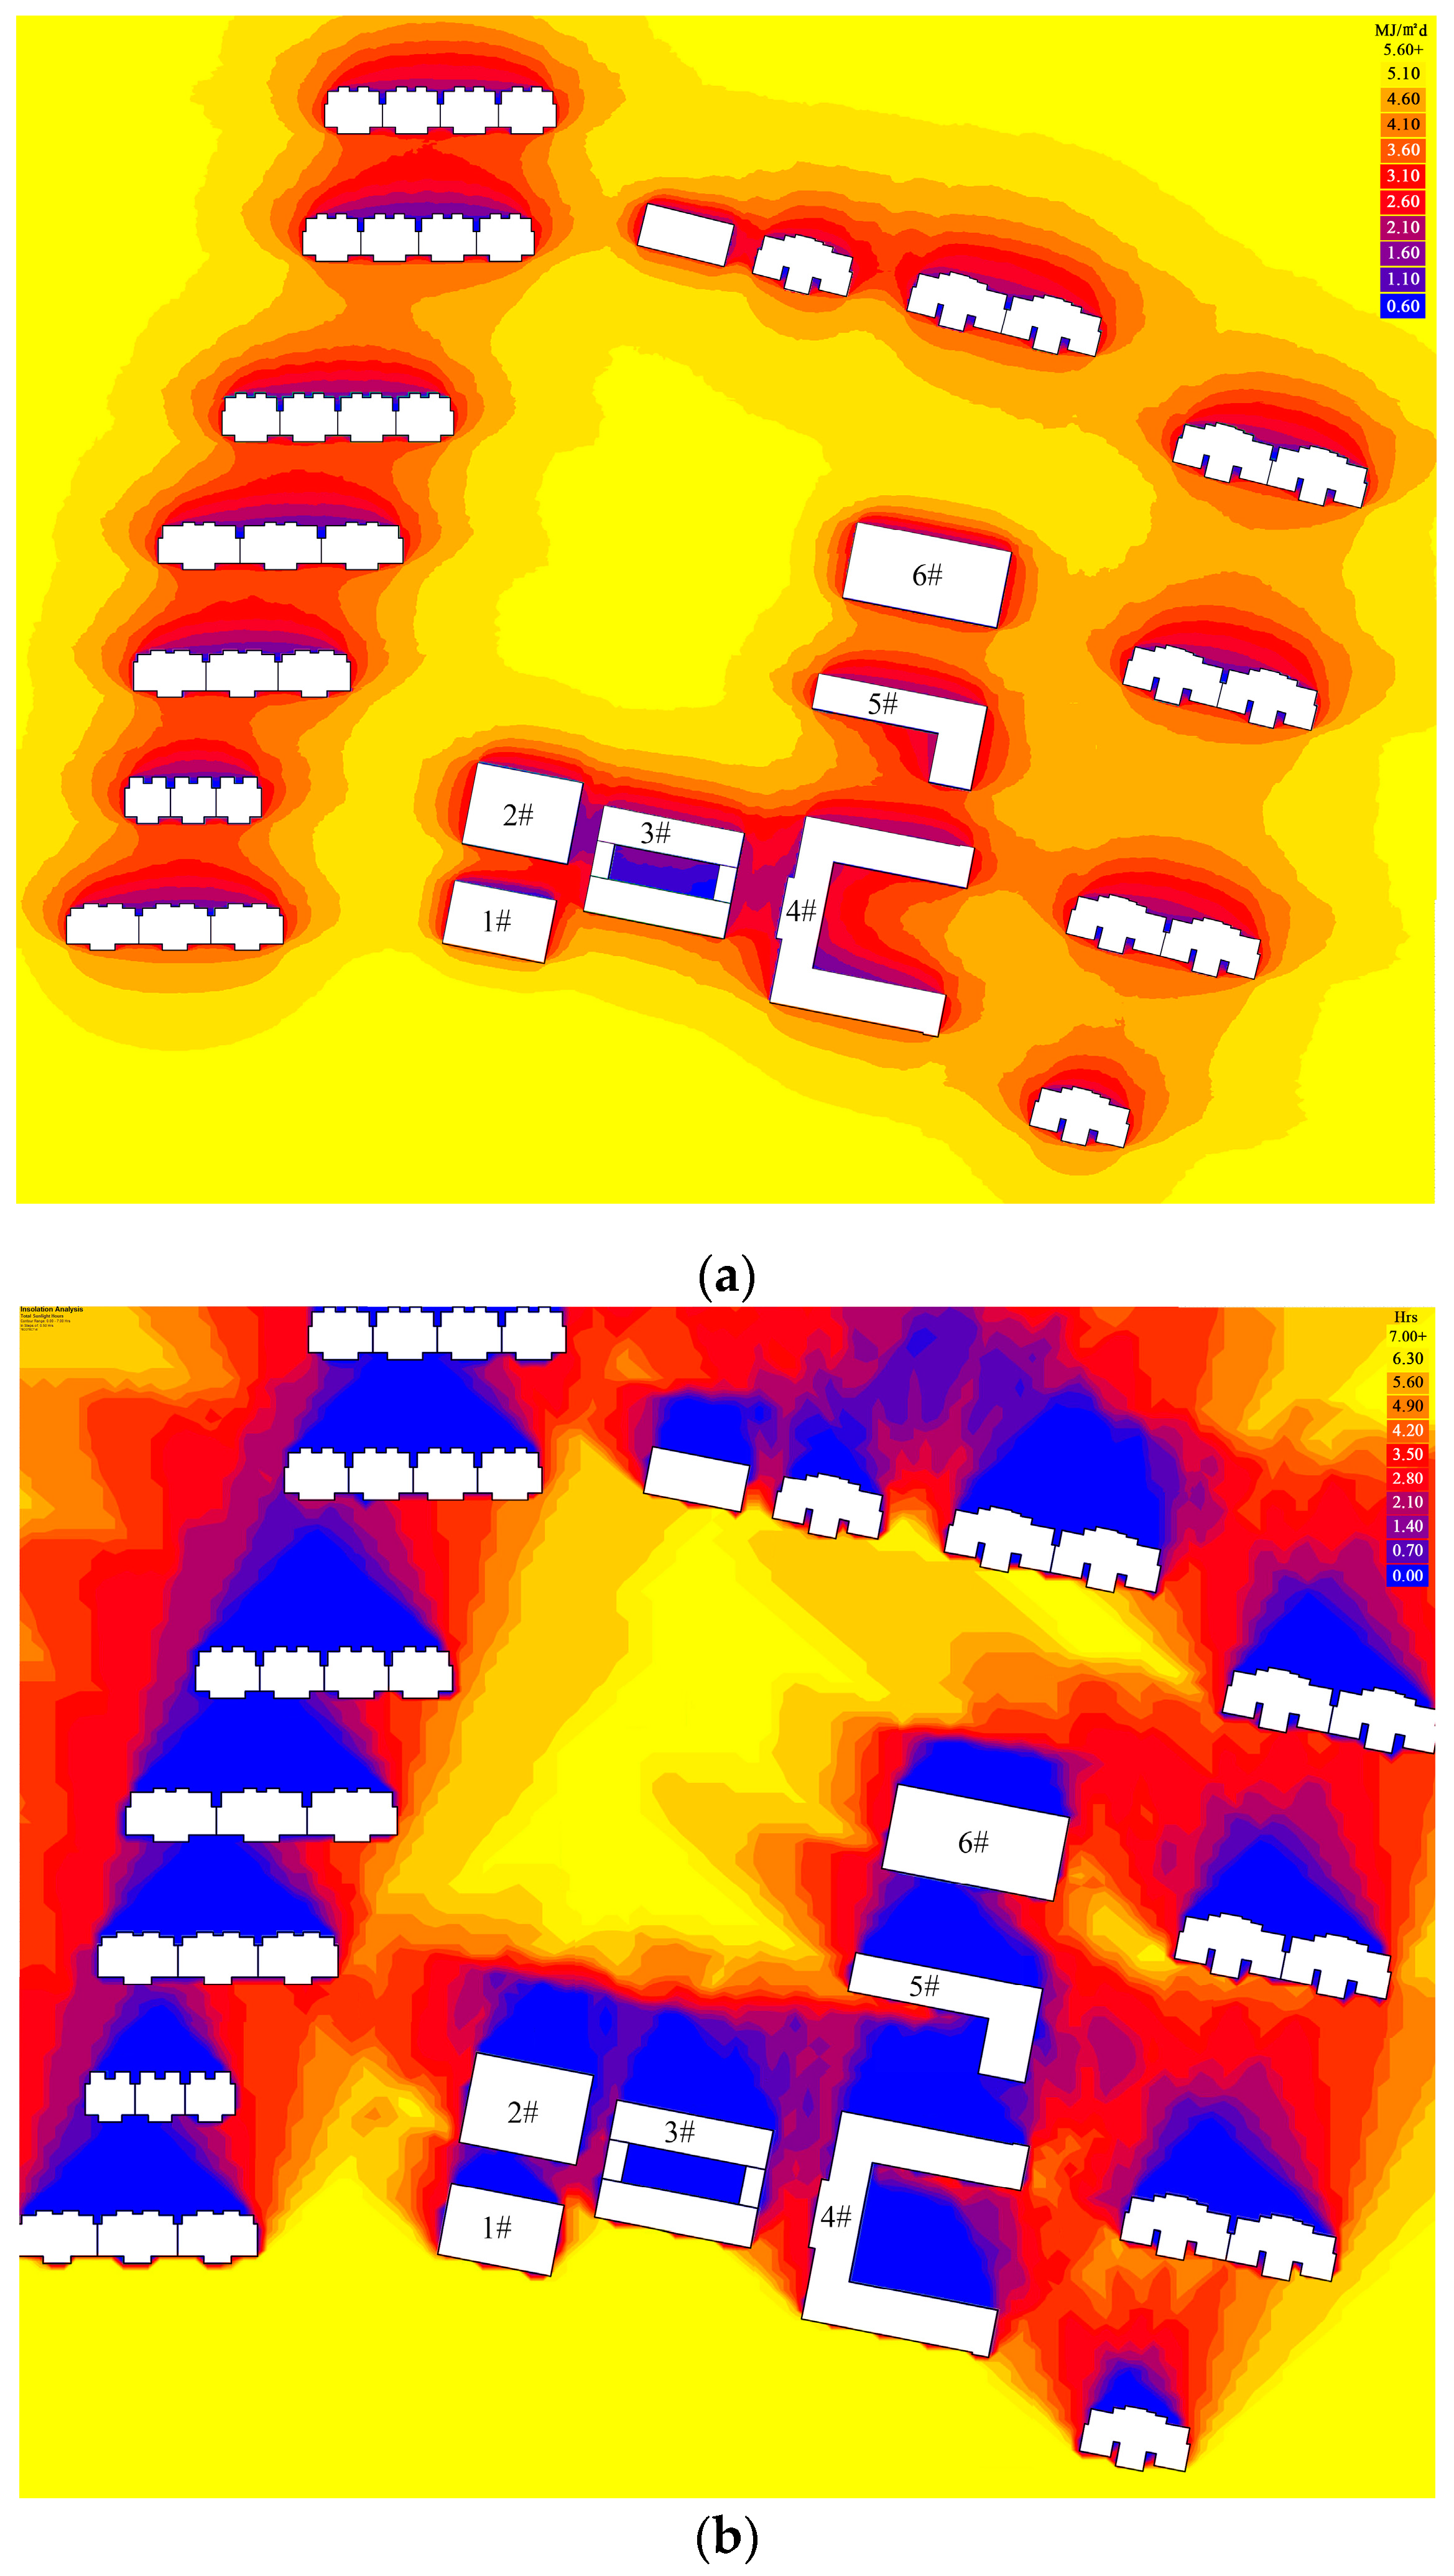
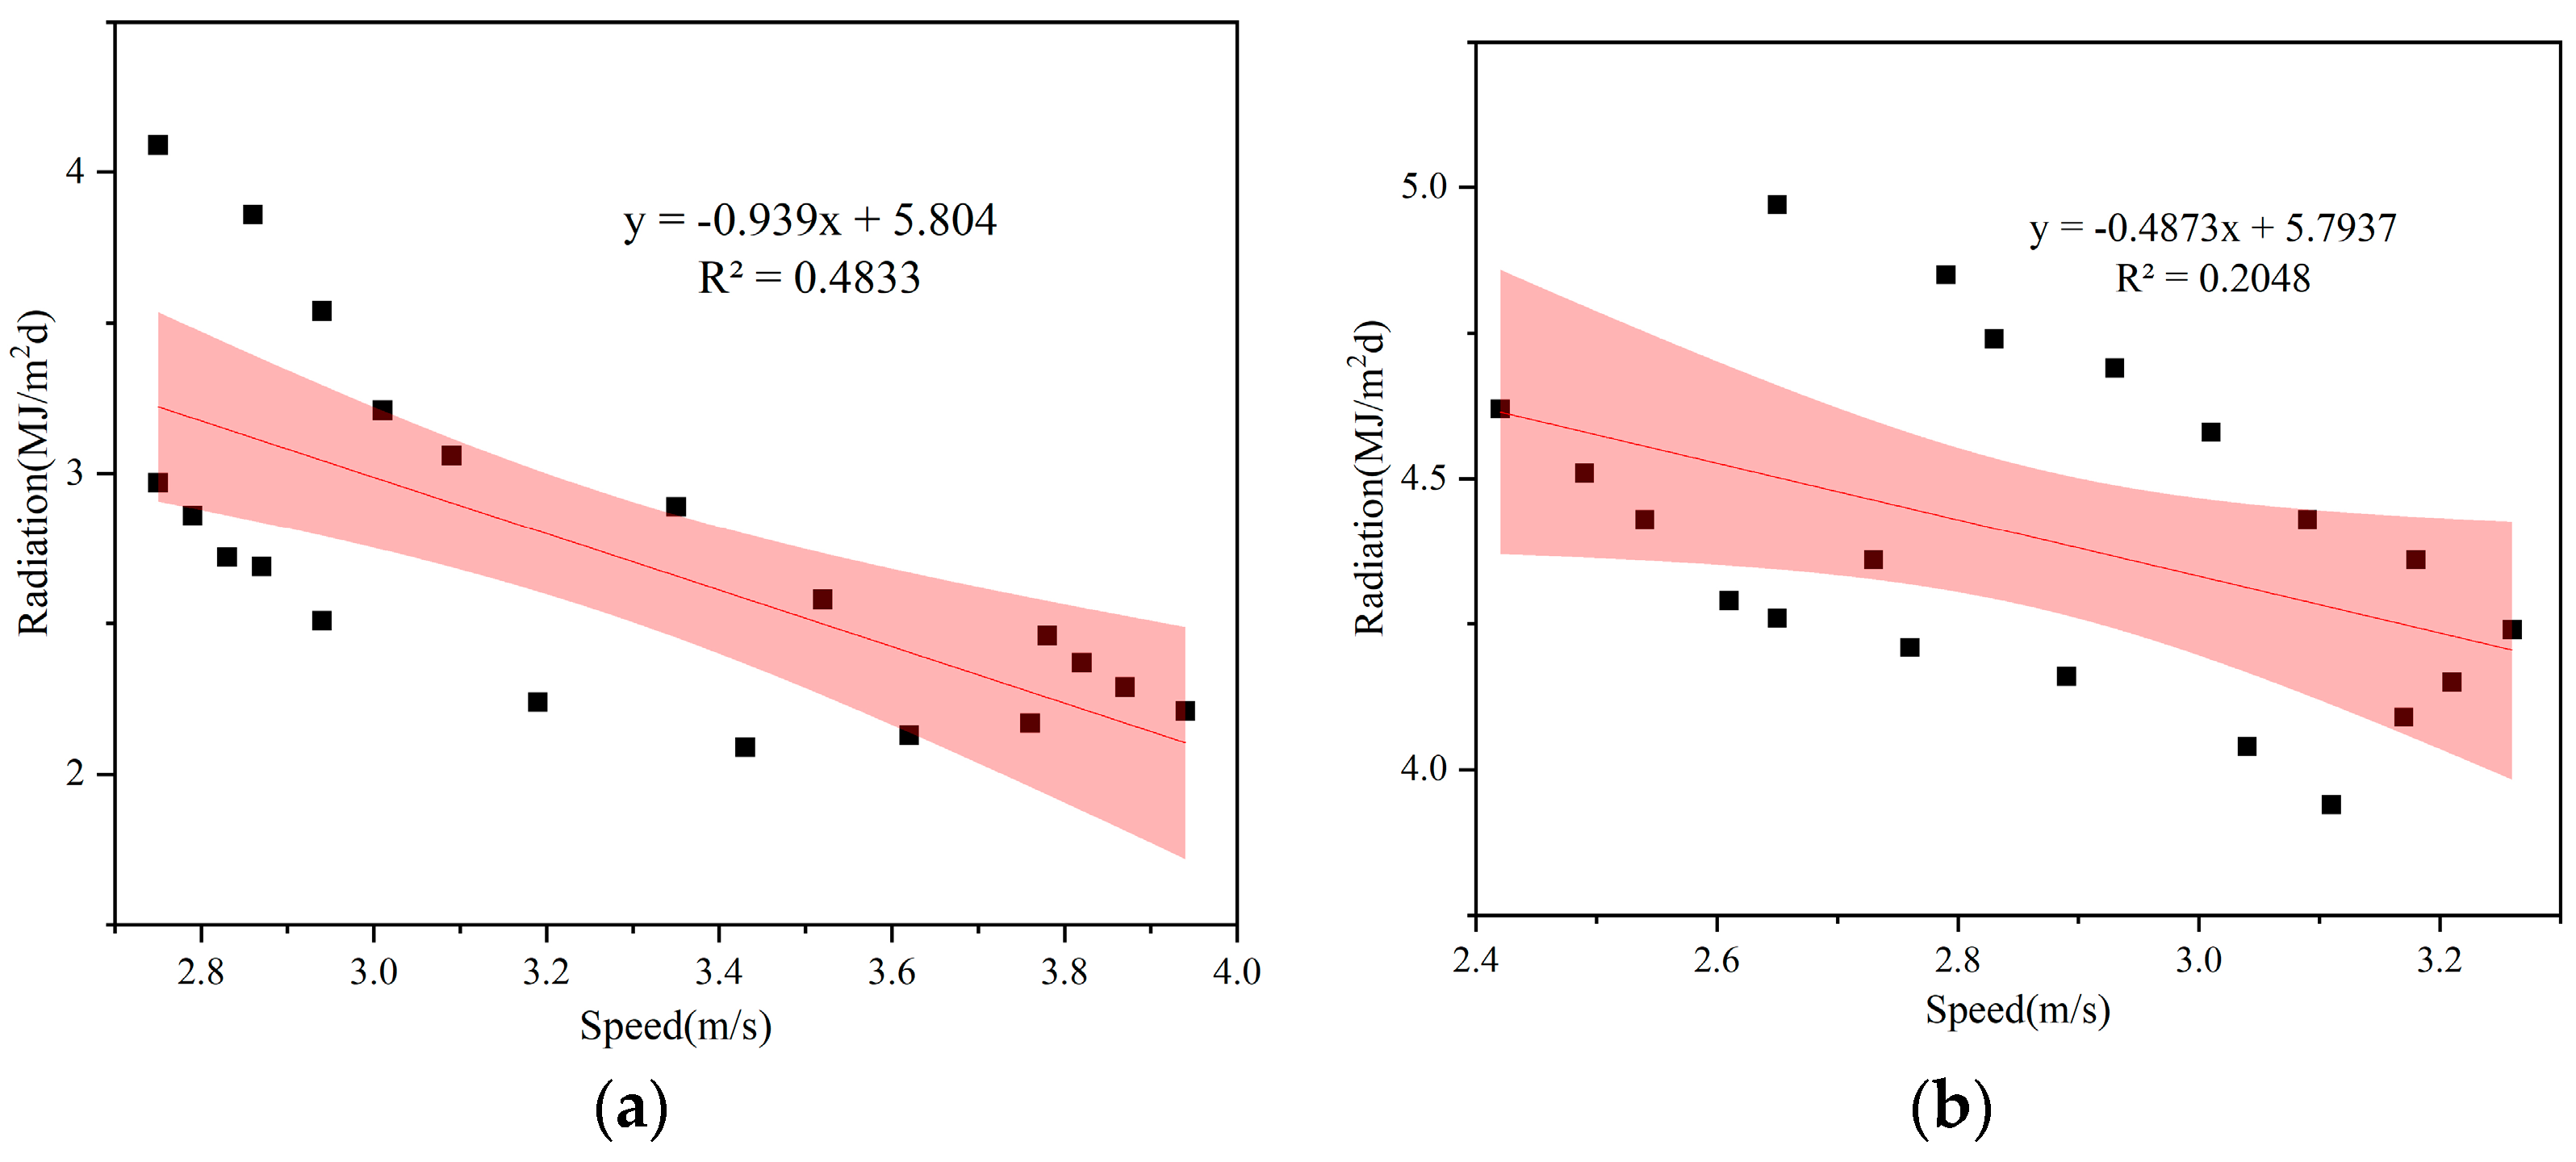
3.3.1. Campus Solar Radiation

Ecotect (2011) software is used to simulate the solar radiation for the entire campus building and its surroundings from 1 April to 31 October. This period is the normal growth cycle of plants, so this solar radiation cycle is particularly important [63,64].
Due to the fact that solar radiation can directly affect the photosynthesis of plants and determines the necessary conditions for normal plant growth, it has an important impact on campus landscape design. Areas with solar radiation energy less than 3 MJ/md are suitable for shade-loving plants, areas with solar radiation energy between 3–6 MJ/m2d are suitable for neutral plants, and areas with solar radiation energy higher than 6 MJ/m2d are suitable for sun-loving plants [65].
From Figure 9, the whole campus is surrounded by high-rise residential buildings, especially those on the right side of the campus. Due to the distance between the buildings, the solar radiation on the right side of the campus buildings is relatively low, mainly concentrated at 4.1 MJ/m2d. Since the solar radiation around the No. 5 building is affected by the No. 4 building and its floor height, the solar radiation between the two buildings is below 3 MJ/m2d, indicating that this area is suitable for shade-tolerant plants. The solar radiation in the middle of the No. 3 building is almost absent, and from an overall view, the overall campus has relatively low solar radiation, and only the southernmost side of the building and the sports field have sufficient solar radiation.

3.3.2. Campus Sunlight

The sunlight in different areas determines the growth habits of plants, such as sun-loving plants, shade-tolerant plants, and plants with different growth habits [66]. Through the simulation of the campus sunlight on cold days, it is concluded that the solar insolation around the No. 5 building is relatively poor due to the influence of building height and building spacing. Especially in the area between the south side of No. 5 and No. 4 buildings, there is no sunlight throughout the year, which directly affects the activities of people, plant landscape design, and plant growth in the area.

3.4. Analysis of UTCI Thermal Comfort Assessment with Superimposed Wind and Light Simulation Results

Based on the previous simulation of the wind environment and light environment, the simulation results of the existing microclimate of the campus were obtained. Then, the superposition analysis of the wind environment and light environment of the existing campus was performed, especially on the superposition results of wind speed, sunlight, and solar radiation (Figure 10).
According to Table 4, the comfort level of the leeward side of the UTCI is better than that of the windward side, with a difference of 9.7–22.9%. The largest difference appears in the layout pattern and the height of the west side. The amount of space with high comfort exceeds 70% and the leeward side exceeds 85%, indicating that natural ventilation can improve space comfort. However, 17.8–28% of the outdoor space in the No. 5 building is located in a stress area that lacks solar radiation and is slightly cooler. It is necessary to reduce wind speed by increasing vegetation to improve the thermal comfort of the relevant area.
The solar radiation simulation results showed that the UTCI in most areas of the campus outdoor activity space shaded by the building was −13–0 °C, indicating these areas were under moderate cold stress. These areas are mainly distributed in the middle area of the No. 4 building, the activity passage between No. 4–No. 5 buildings, the passage between No. 5–No. 6 buildings, and the corner flow area on the windward side of the No. 6 building. The outdoor activity space without building shading was +9–0 °C, mainly under slight cold stress. These areas are mainly distributed in the space area of the activity square and playground in front of No. 1, No. 2, and No. 3 buildings. At the same time, the average radiation temperature was significantly affected by vegetation shading and building shadow area, showing obvious differences in outdoor space.
According to the distribution ratio of UTCI in the outdoor space of the campus, as shown in Table 5, in the wind environment, the distribution ratio of the comfort level of each activity area between +3.5–21 °C varies obviously. The highest is more than 60%. No. 1, No. 3, and No. 4 buildings have a relatively high distribution of comfort zones in the activity areas in front of them, reaching 81.43–83.67%. The lowest proportion of the comfort zone is concentrated in the passages before and after the No. 5 building and the activity space in the corner flow area of the No. 6 building. The proportions of the comfortable zone in these areas are 28.15%, 22.31%, and 25.48%, respectively.
Through the evaluation results of the superposition of the wind and thermal environment of the campus outdoor activity space, as shown in Figure 5, it can be obtained that the activity area between the No. 4–No. 5 building passages has the lowest thermal comfort in the entire campus outdoor activity space. The wind speed in this area is the highest in the whole wind environment, reaching an instantaneous wind speed of 5.5 m/s and resulting in the worst microclimate environment in this area. Meanwhile, except for the lowest value in the middle area of the No. 3 building, the solar radiation value in this area is relatively low, generally below 3MJ/m2d. The values in the area near the buildings are even lower, and the value in the corner flow area north of the No. 5 building is second only to the solar radiation value in the cross-flow area. On that basis, three major disadvantageous areas in the campus environment are identified (Figure 10), which provides the basis for the proposed optimization strategy.

4. Optimization Strategy of Campus Microclimate Landscape Layout

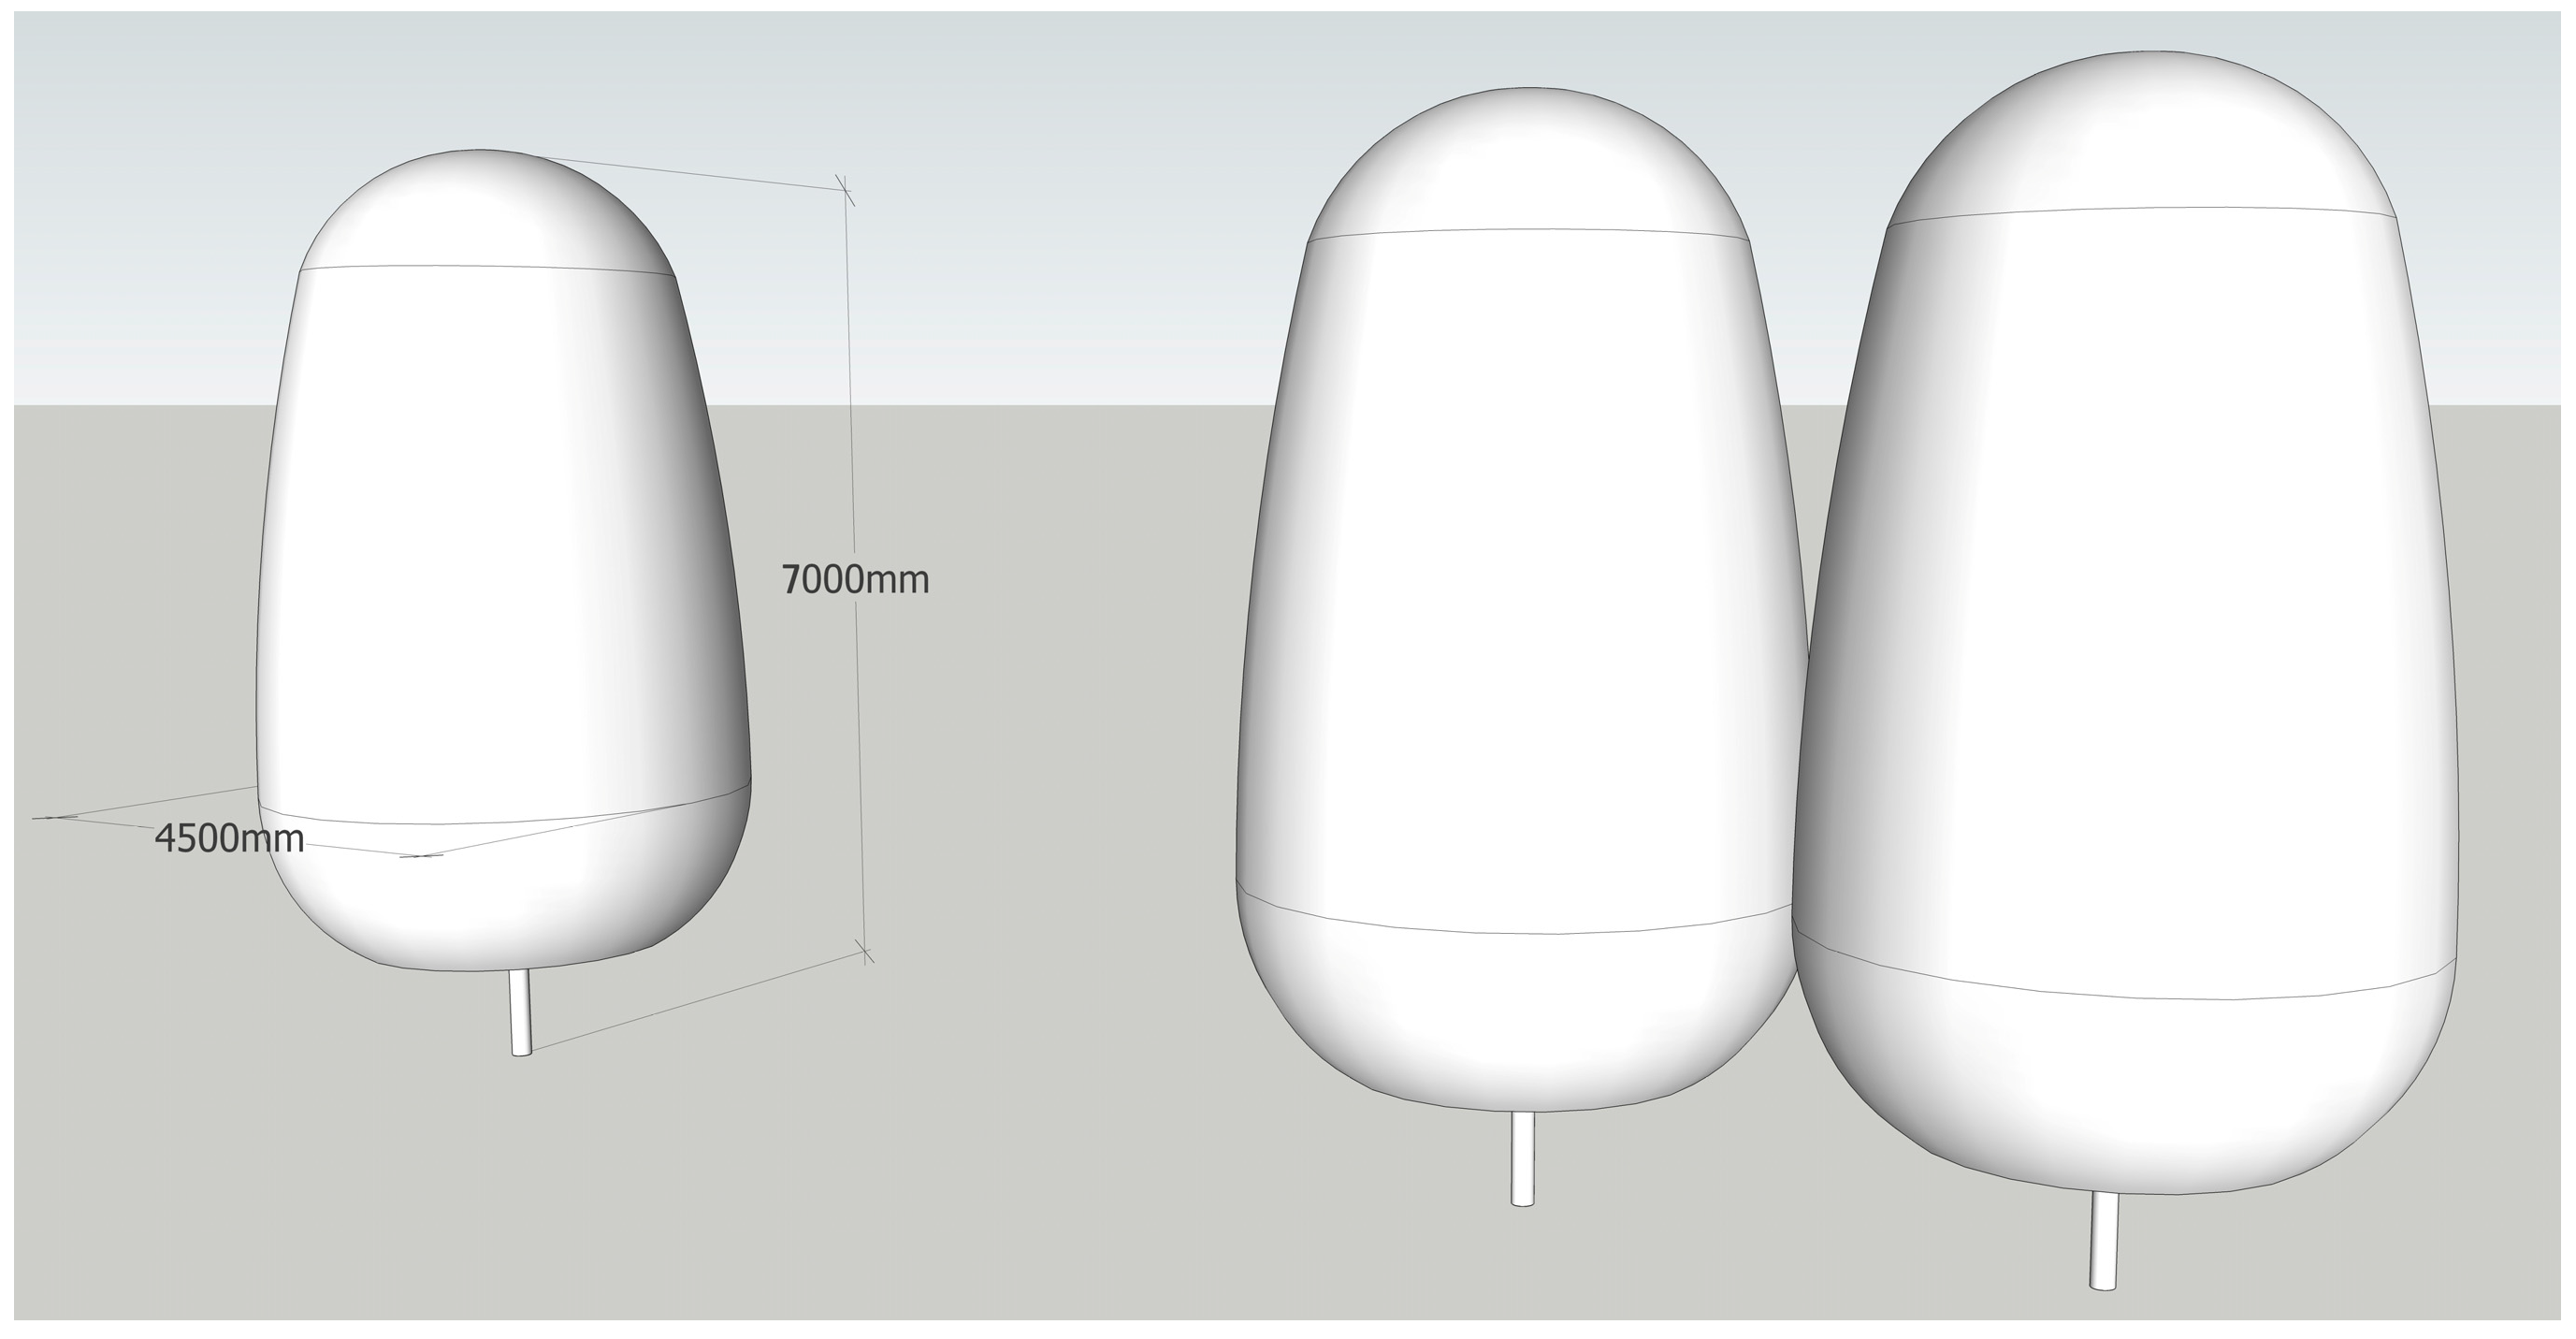
4.1. Setup of the Landscape Layout Simulation Model

Through actual measurement and simulation analysis, the disadvantageous areas of wind environment and light environment impact under winter weather and related characteristics were identified, and then the optimization strategy of campus landscape layout was formulated. Existing research proves that plants have a good effect on reducing the wind speed in the wind field. Especially in the range of 3–5 times tree height downwind of the tree group, the wind speed can be significantly reduced by nearly 35% [67].
Since this simulation experiment is mainly aimed to investigate the influence of plant layout and canopy on the wind environment, the attributes of plants were determined as shade-tolerant attributes. For this reason, the shade-tolerant plants suitable for the climate conditions of Xuzhou City were selected (Table 6). Meanwhile, the corresponding simplification was carried out according to the shape of the tree canopy of the shade-tolerant plants. The simplified model not only meets the experimental requirements but also is simple and convenient for modeling and simulation calculation. Therefore, the single plant in this simulation experiment was set to be oval (Figure 11), the crown height was set to 5.5 m, and the trunk height was set to 1.5 m. Several plant combinations were set, in which the distance between the combined crowns was 1 m, and the crown void ratio was set to 0.5 [68].

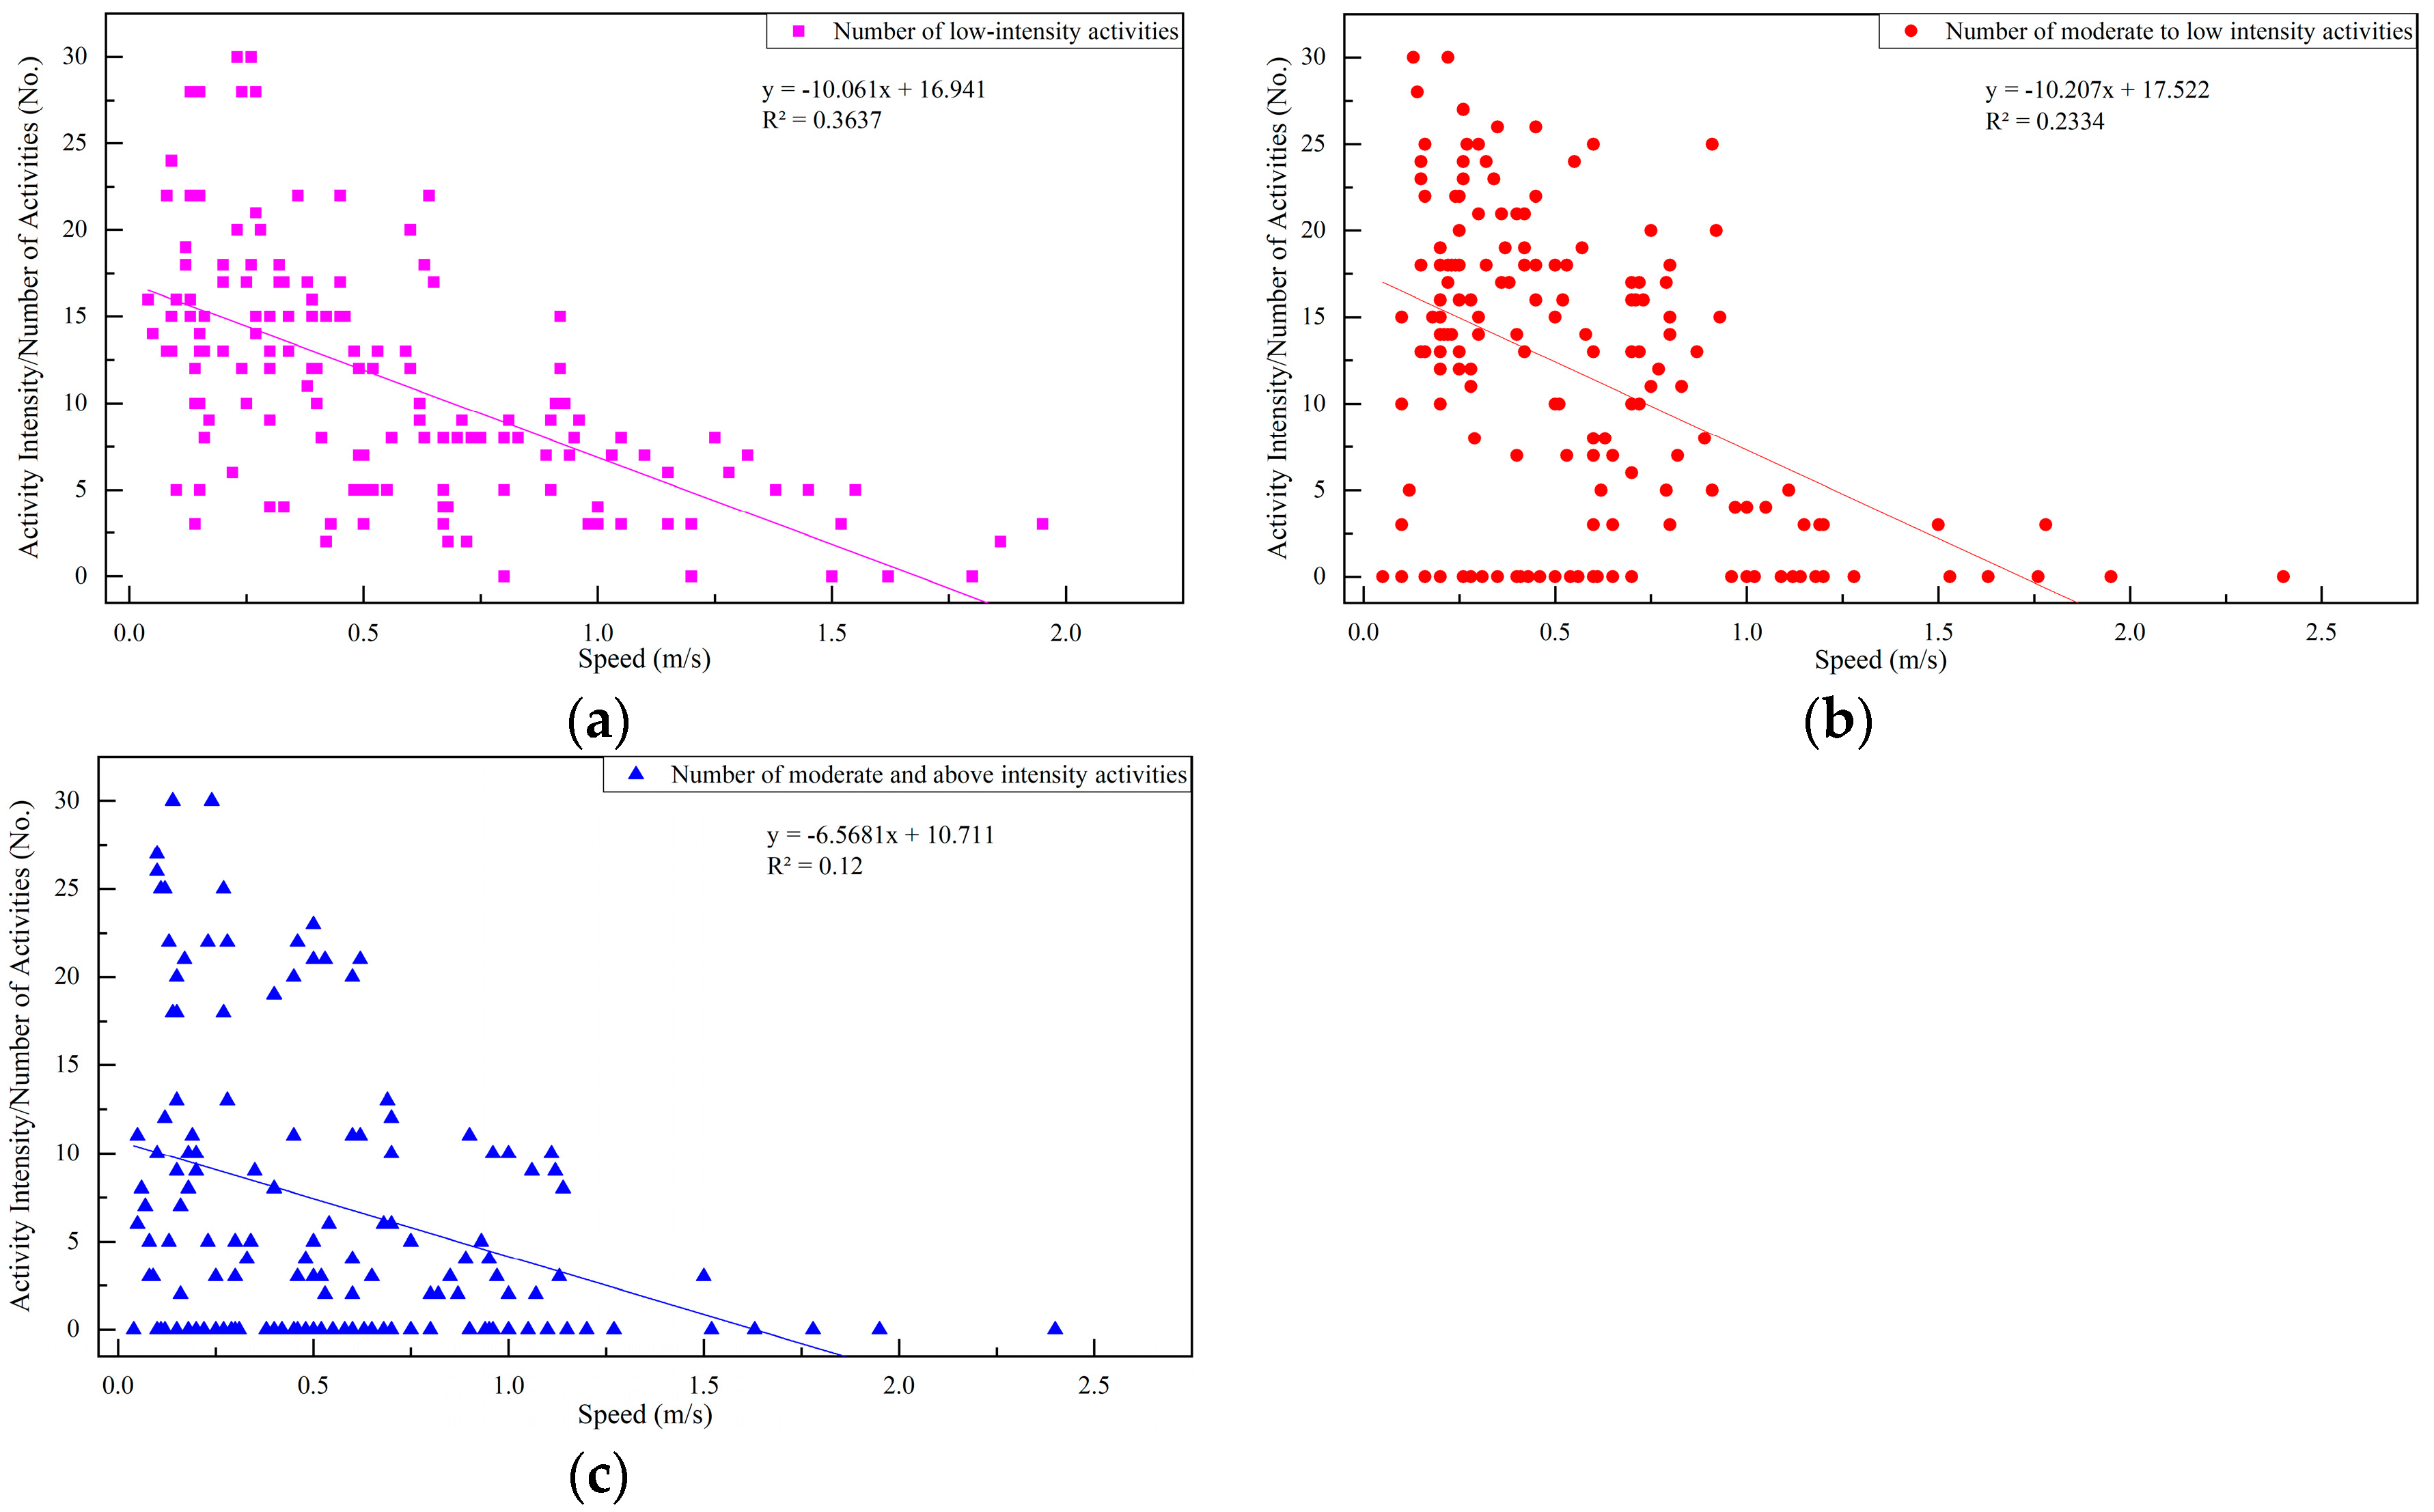
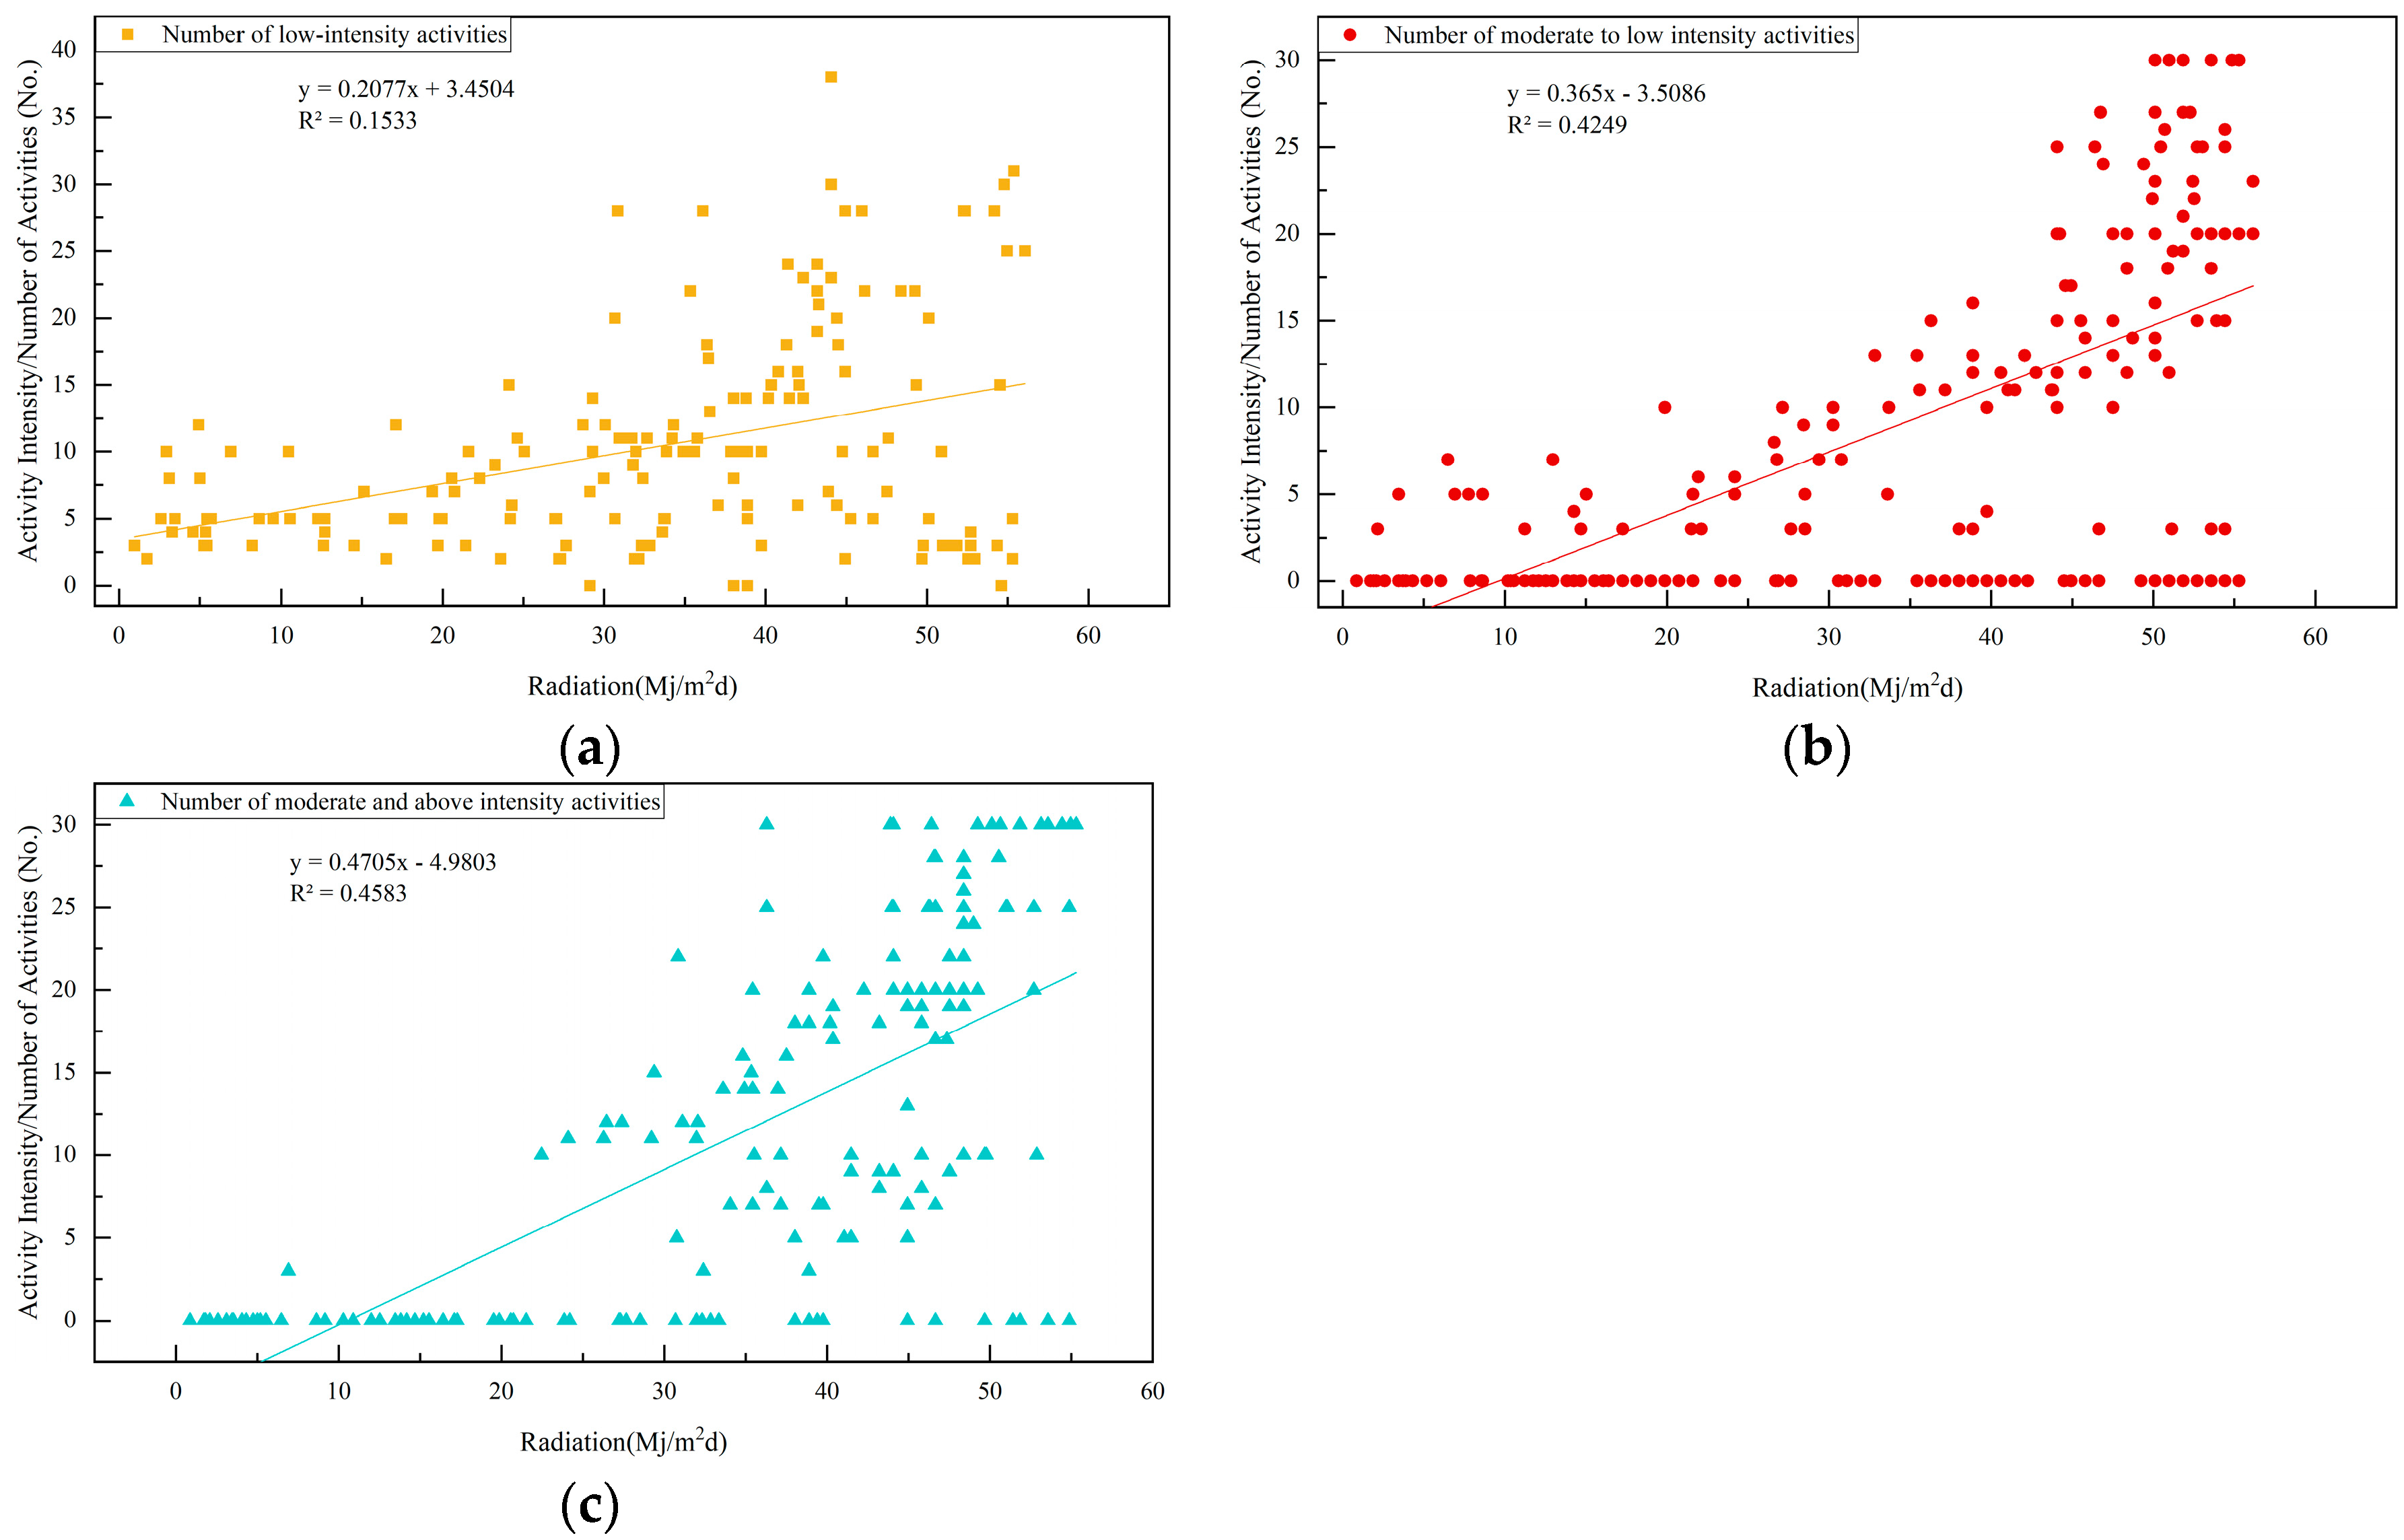
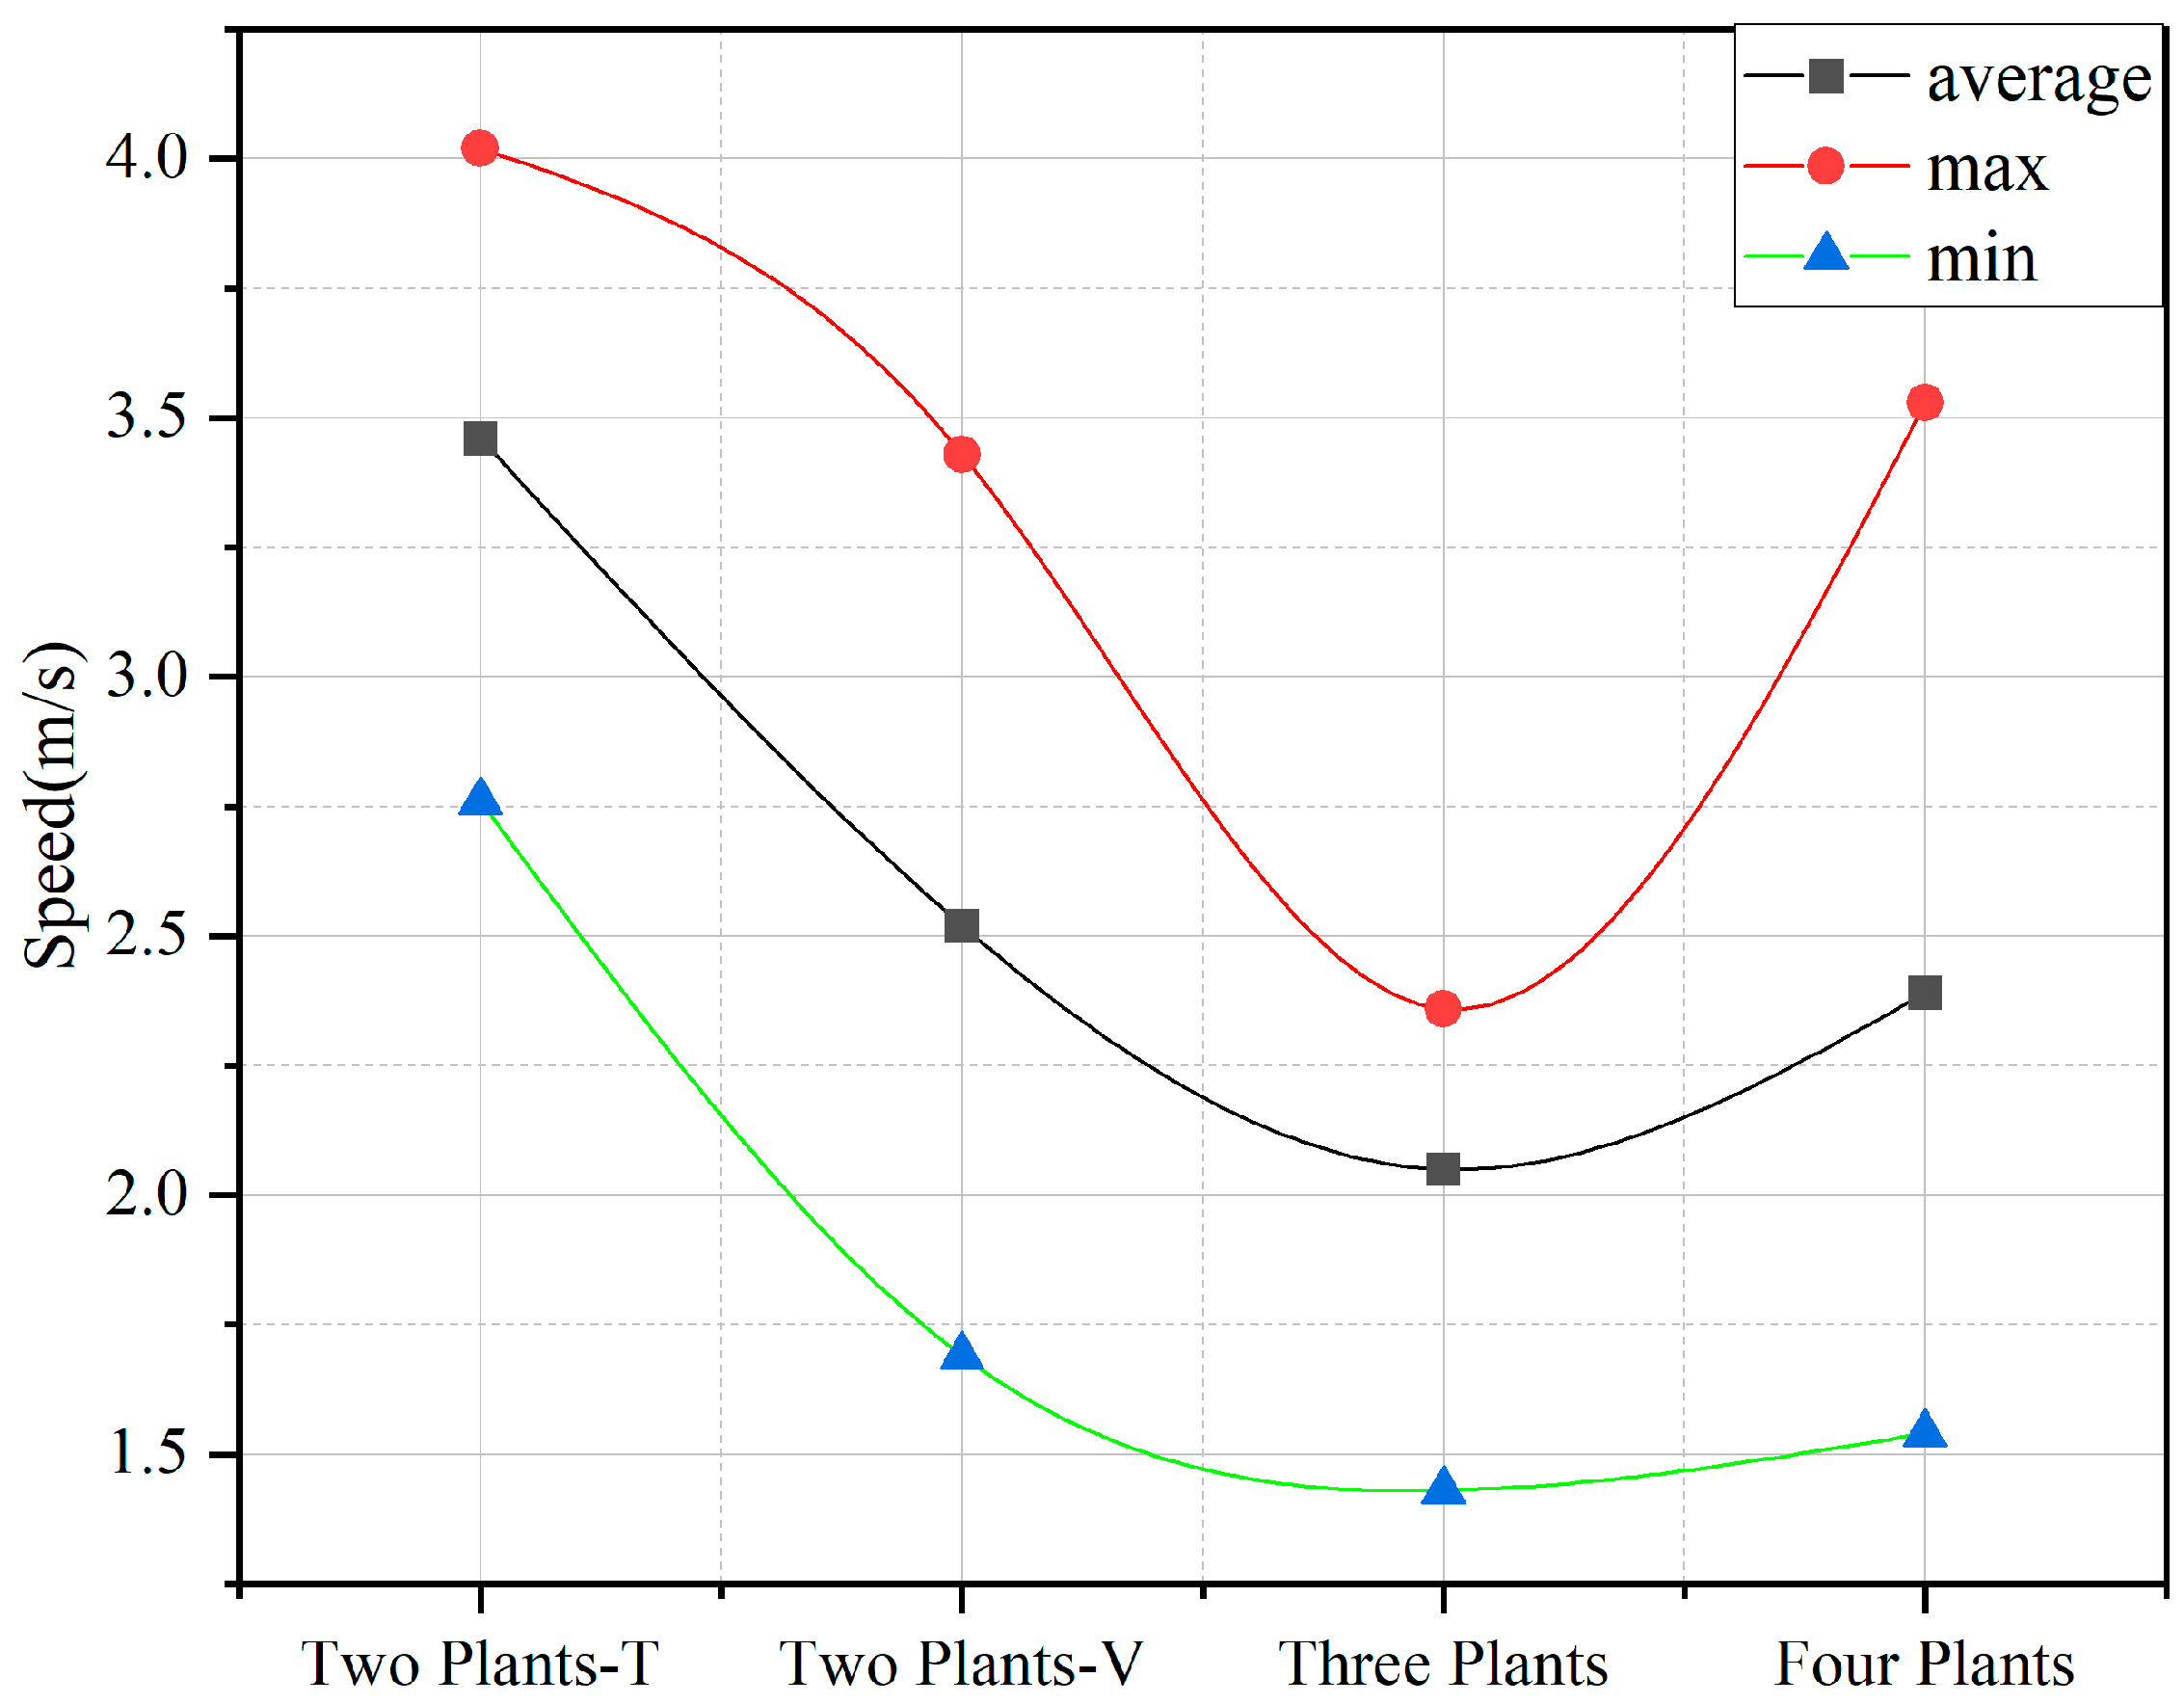
4.2. Microclimate Data Simulation for Optimization of Green Space Layout

The results obtained by superimposing the actual measurements with the simulations of wind and light environment determined the campus outdoor disadvantageous comfort zone and identified the attributes of the plants in this region as shade-tolerant plants. The use of plant canopy gaps can both block strong winds and allow a portion of airflow to pass through without damaging the wind field, thus achieving the effect of creating a good wind environment.
The passage area between the north side of the No. 4 building and the south side of the No. 5 building.
The passage area between the north side of the No. 5 building and the south side of the No. 6 building.
Corner flow area in the north of the No. 6 building.
Based on the simulation experiment with different plant layouts, the layout of campus green space was optimized to improve the wind environment under the premise of meeting normal pedestrian travel as well as fire codes. The final layout strategy was obtained by increasing the rational layout of plants in three areas and the upwind direction of the disadvantaged areas (Figure 12).
In the passage area between the north side of the No. 4 building and the south side of the No. 5 building, due to the insufficient shielding of solar radiation by the No. 4 building, the solar radiation will not be reduced after the layout of the workshop is increased. Therefore, in this area, plants shielding solar radiation will not affect thermal comfort, and the thermal comfort adjustment is mainly affected by the wind environment. Comparing the four layouts of different plants, i.e., three plants, four plants, two plants in transverse, and two plants in vertical, the ideal wind environment in this area was obtained, that is, three plants in a group. By staggering this type of plant layout in this area, the wind speed in this area was effectively reduced, the maximum wind speed of 5.5 m/s was reduced to 2.4 m/s, and good results were obtained (Figure 13).
In the passage area between the north side of the No. 5 building and the south side of the No. 6 building, two plants were placed in the turbulent area generated at the intersection of the two corner flow areas to weaken the flow field of the turbulent area, thereby effectively slowing down the wind speed in this area. The maximum instantaneous wind speed dropped from 3.6 m/s to 1.7 m/s.
In the corner flow area on the north side of the No. 6 building, four plants were arranged in a right-angle shape to effectively slow down the strong airflow in the corner flow area, which dropped the maximum instantaneous wind speed from 5.0 m/s to 2.0 m/s (Figure 14 and Figure 15).

5. Discussions

In the traditional fields of architecture and landscape design, the experience of designers is often vague, and there is no specific threshold range, so it is difficult to use this experience as a basis for judging whether the design is accurate. The built environment microclimate model of the campus, the student behavior model, and the regularity of periodic activities can be superimposed to reduce data errors. The built environment microclimate model of the campus includes wind and thermal environment information. The method proposed in this study of superimposing the microclimate model of the built environment of the campus, the student behavior model, and the periodic activity pattern can clarify the superior and inferior areas in the space and propose targeted optimization strategies according to the characteristics of the relevant areas. This will help to provide a reference for plant layout for future campus construction and renovation of primary and middle schools in cold winter areas and improve the comfort of campus outdoor space.

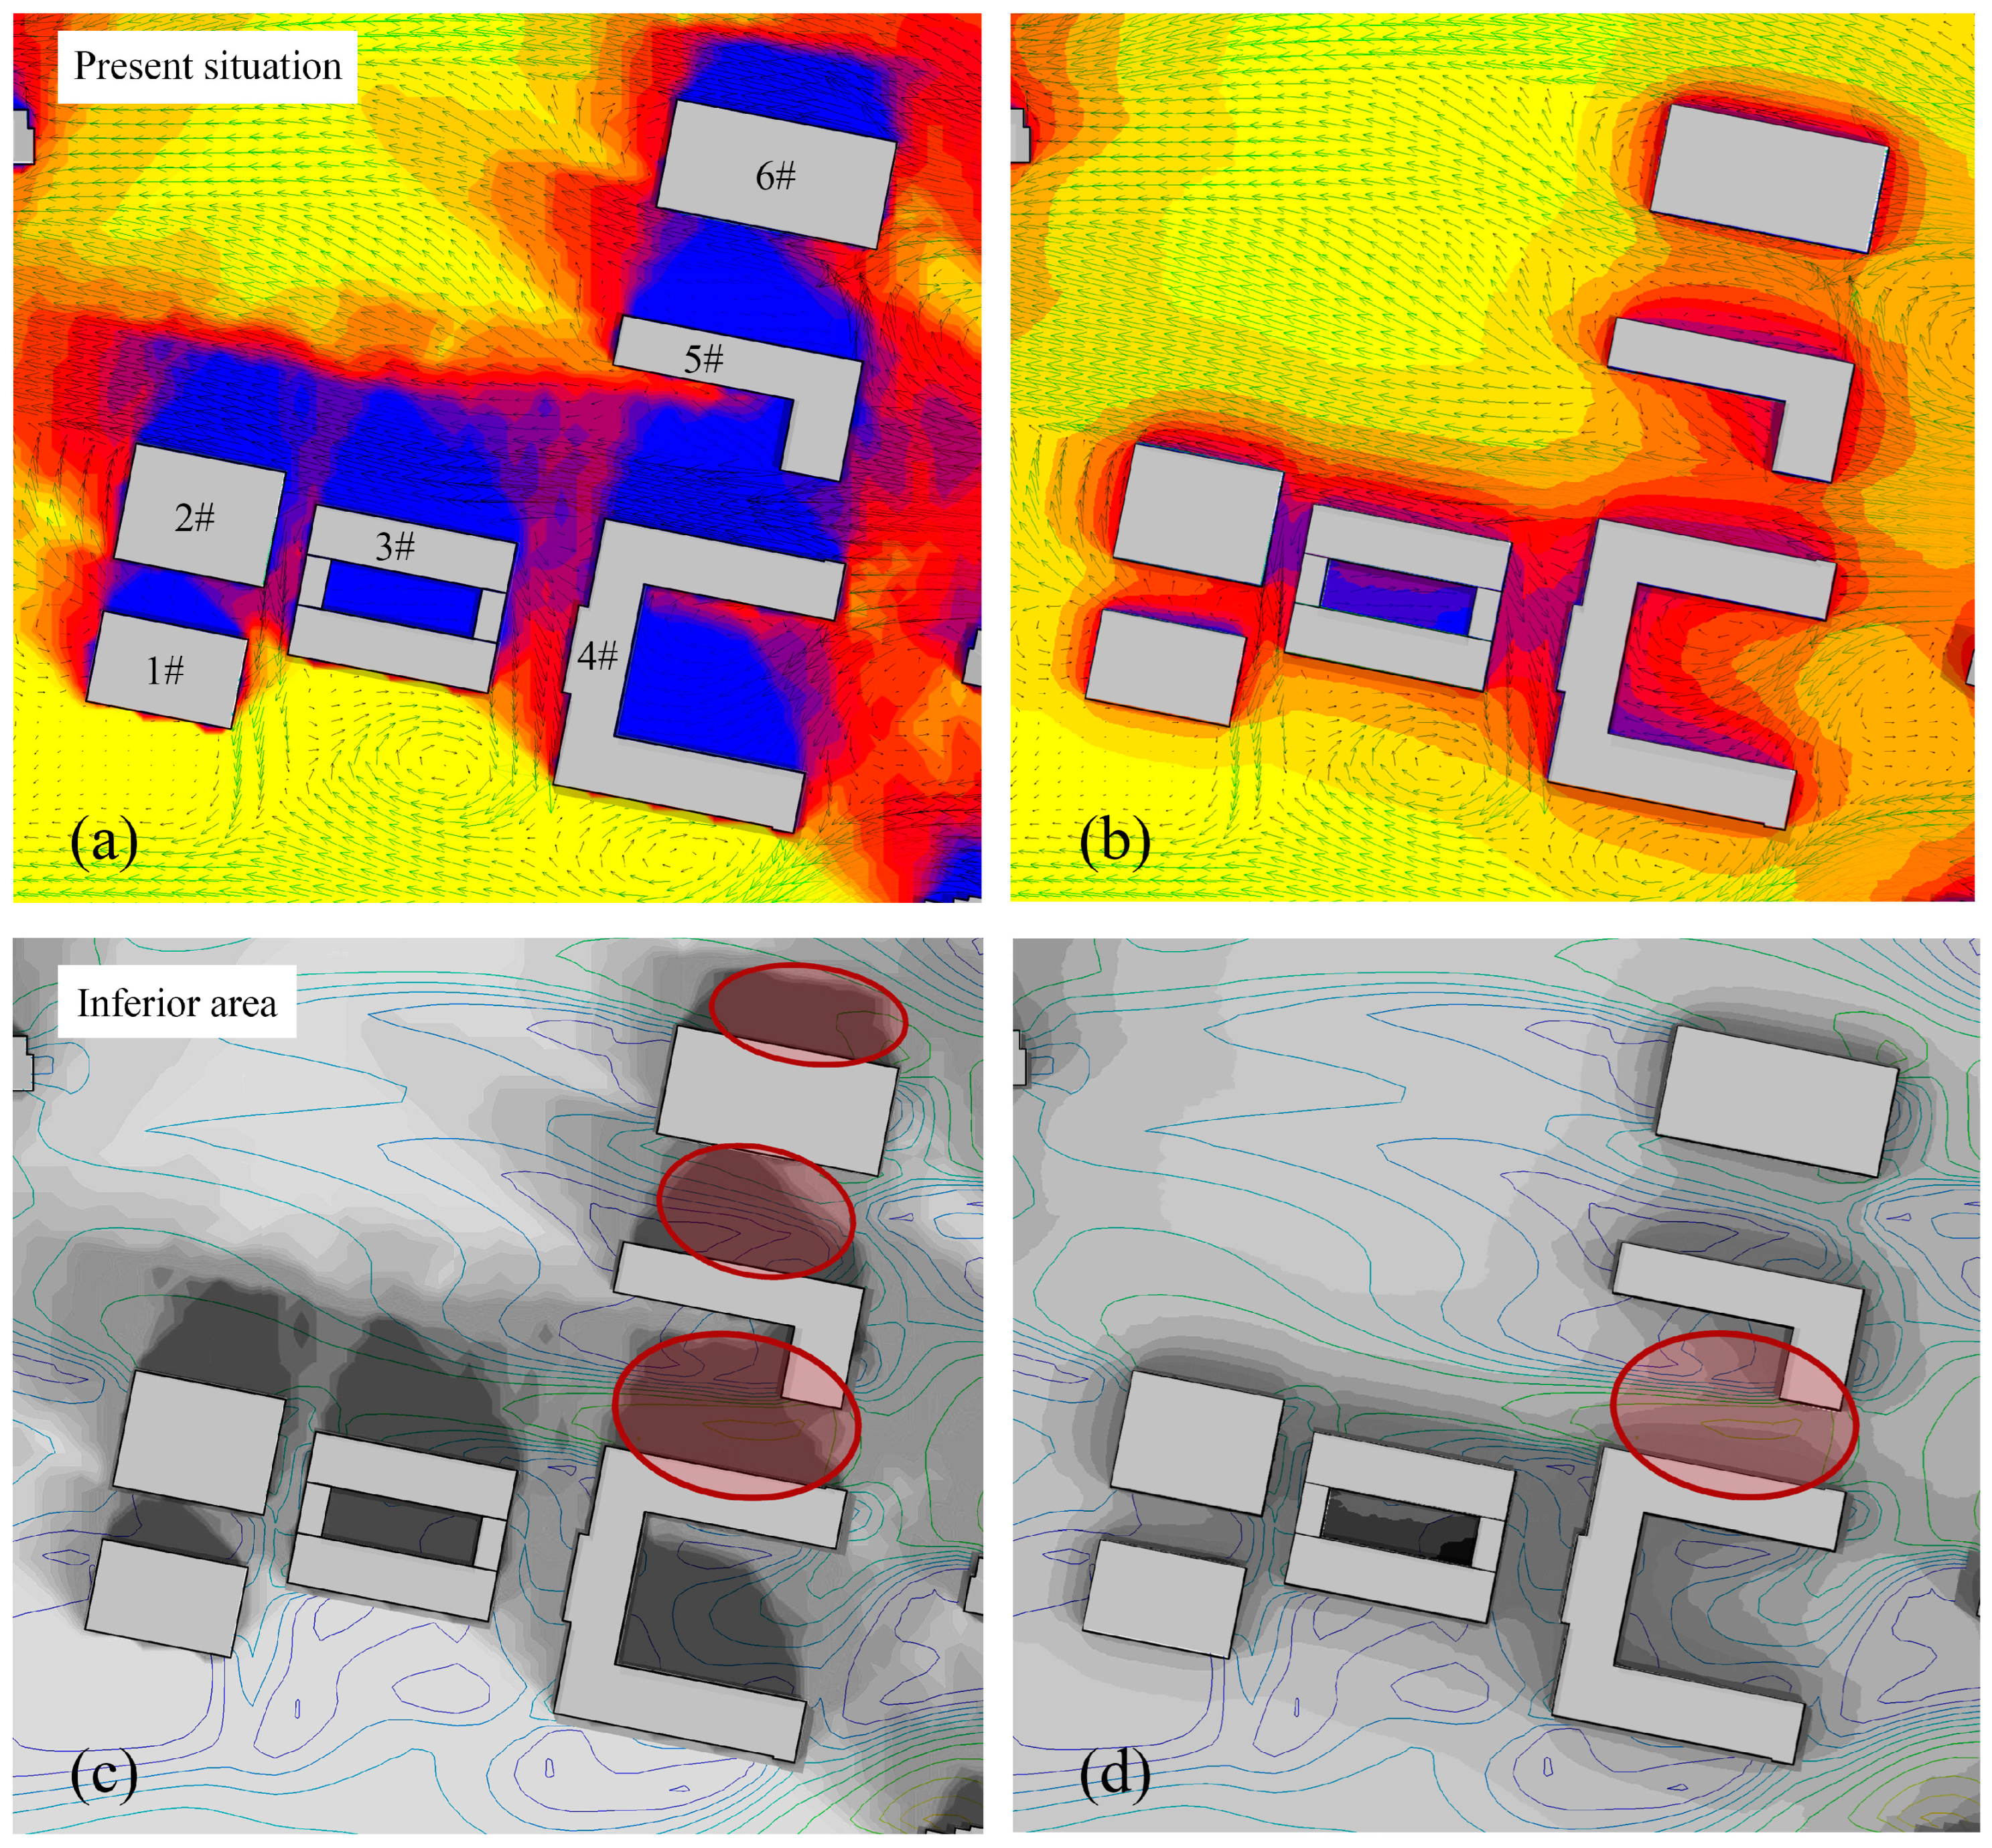
5.1. Analysis of Key Areas

Through continuous research, the comfort level of the urban campus area has been improved. In the urban campus design stage, the simulation of the wind and light environment of the campus space layout can improve the accuracy of the design and verify the impact of lighting and natural ventilation in the campus area on the real environment. The built environmental microclimate model evaluation can be combined with CFD simulation and campus regional thermal environment simulation to evaluate the current situation, determine the problem generation and result from analysis in different areas, and simulate various possibilities, thus providing more comprehensive data support for designers’ decision-making.
In the whole campus space, the thermal environment and wind environment have an important influence on the overall space landscape layout. Therefore, during the preliminary design planning, it is necessary to consider not only the natural lighting requirements of the building, but also the influence of solar light and radiation on plant growth after the building shading. The results showed that the extreme wind and light environments distributed in the key areas (cross-flow area and corner flow area) had a negative correlation (Figure 14), and the correlation intensity is in the following order: cross-flow area (R2 = 0.4833) > corner flow area (R2 = 0.2048) (Figure 16). It can be determined that the plants in key areas should be shade-tolerant trees, and now the plant ratio in the entire campus space area is more reasonable. These results provide a scientific basis for the proportion of plants in key areas of campus space in the future, and also lay a foundation for the analysis of thermal comfort in outdoor spaces with three-dimensional information models in the future, making the research more widely applicable.

5.2. Comfort Evaluation Analysis

The purpose of the research is to identify the key areas that affect the comfort of the campus, superimpose the built environment microclimate model of the campus with the student behavior model and the regularity of periodic activities, and finally obtain the optimal solution for the site planning of the disadvantaged areas of the campus. The results of this study can also be used to guide the design of primary and middle school campuses, to develop scientific design plans at the design stage, to reasonably plan students’ activity spaces, and to guide actual engineering. In addition, the results of this study can optimize the outdoor comfort of the completed campus spaces through the layout of plants and provide a comfortable campus outdoor landscape environment for students and teachers.
The outdoor microclimate of the campus is a key factor in ensuring the safety, comfort, and health of the activity areas for students and faculty. Through correlation significance analysis; the total number of outdoor activities was significantly and positively correlated with solar radiation and temperature while negatively correlated with wind speed. The correlation intensity was in the following order: solar radiation (R2 = 0.4583) > wind speed (R2 = 0.3637) (Figure 17 and Figure 18). The average activity of microclimate factors is as follows: the air temperature is concentrated at 6–10 °C; the solar radiation is 2.6–5.1 MJ/m2d; the wind speed is 0.5–1.5 m/s. The wind resistance of low-intensity activities is remarkable, and the maximum difference can reach 3.1 m/s; when the temperature rises above 12 °C and the solar radiation amount is greater than 6 MJ/m2d, the number of outdoor activities at low and medium intensity increases significantly.
The effects of different vegetation spatial arrangements on the winter wind prevention efficiency in the disadvantaged cross-flow area are as follows: with the increase in the number of vegetation and the evolution of the layout, the wind prevention efficiency in winter gradually presents a parabola, and the wind prevention efficiency can be increased by 39.4% and can be reduced to 1.43 m/s (Figure 19). Therefore, the greater number of plants does not represent a better arrangement of vegetation. Instead, the arrangement of three plants in a group has the best effect on wind prevention in winter, which is conducive to improving the comfort of the community.

6. Conclusions and Future Work

This study proposes a method of superimposing the microclimate model of the campus-built environment, the student behavior model, and the periodic activity law, so as to obtain the optimal comfort solution for the campus winter outdoor activity space, especially the disadvantaged area. PHOENICS and Ecotect software were used to simulate the wind and thermal environment of the campus. The influence of different plant layouts on the comfort level in the disadvantaged areas of the campus was compared and analyzed, and the following conclusions were obtained:
A series of simulations were conducted aimed at the outdoor comfort of the campus. The results of these simulations were used to optimize the outdoor spatial environment of the campus, to determine the changes in airflow organization and light and heat environments in the key areas of the campus, and thus to recommend the design of vegetation types and layouts. Meanwhile, a large amount of valuable data on the determination method and airflow organization, wind pressure distribution, thermal radiation, and light value of the key areas of the campus were obtained. In addition, we explored the causal relationship between the microclimate regulation effect of vegetation communities and the intensity of leisure and physical activities by linear regression and single-factor variance mathematical statistics based on the simulation results of ventilation efficiency, human comfort, and plant adaptation type and layout. These results provide a basis for designers to make scientific decisions on vegetation layout to improve the comfort of the campus.
Therefore, in the process of campus comfort optimization, the key areas of the wind and thermal environment of the site were clarified through the evaluation of UTCI comfort by using the microclimate of the built environment on the campus as a medium. The relationship between campus microclimate and outdoor activity intensity was further determined, i.e., outdoor activities were significantly positively correlated with solar radiation and temperature, and negatively correlated with wind speed. Outdoor activities of the same intensity have migratory and aggregative nature with microclimatic changes. Therefore, under the same type of climatic conditions, the suitable sun-loving properties of plants and the staggered layout of three plants can improve the wind prevention efficiency of the outdoor space and control the wind speed within a comfortable wind speed range of 1–3.4 m/s. The vegetation community structure and morphological characteristics have a significant microclimate regulation effect and can improve human thermal comfort in the outdoor activity space of the campus.
In future research work, this research will be extended to the overall planning layout of campus buildings and landscape plant design choices. Based on these data, the wind and thermal environment of buildings on campus can be considered to predict the comfort of different activity scenarios. This data is necessary to guarantee an improvement in overall comfort in the campus area. These additional simulation data will be provided by specialized companies, which will allow for more realistic simulations. Future research will focus on combining 3D real-time landscape models with microclimate simulations to shorten the time-consuming process of generating, inputting, and computing microclimate 3D models. At the same time, in the future, the use of cloud-based services can reduce computing time and achieve results sharing, thereby guiding the urban middle school campus landscape more scientifically.

Author Contributions

Conceptualization, B.S., H.Z., L.Z. and H.Y.; data curation, H.Y., W.L. and K.Q.; formal analysis, H.Z. and K.Q.; funding acquisition, B.S.; methodology, H.Y., H.Z. and Z.Z.; resources, B.S., H.Z., H.Y., W.L. and Z.Z.; software, B.S. and K.Q.; supervision, B.S.; validation, B.S.; visualization, B.S., W.L. and L.Z.; writing–original draft, H.Z., B.S., Z.Z. and L.Z.; writing–review & editing, B.S. and L.Z. All authors have read and agreed to the published version of the manuscript.

Funding

This research was funded by Research on Key Technologies of Data Collection, Analysis and Application of Housing Quality Optimization based on Internet of Things (Grant No. 2021-K-107).

Institutional Review Board Statement

Not applicable.

Informed Consent Statement

Not applicable.

Data Availability Statement

Not applicable.

Conflicts of Interest

The authors declare no conflict of interest.

References

  1. Han, B.; Luo, Z.; Liu, Y.; Zhang, T.; Yang, L. Using Local Climate Zones to investigate Spatio-temporal evolution of thermal environment at the urban regional level: A case study in Xi’an, China. Sustain. Cities Soc. 2022, 76, 103495. [Google Scholar] [CrossRef]
  2. Meyer, R. Finding the true value of US climate science. Nature 2012, 482, 133. [Google Scholar] [CrossRef]
  3. Liu, B.; Si, R. The Landscape Adaptability Strategy of Residential Wind Environment Based on Measured Data and CFD Simulation—A Case Study of Zhangwu Road Dormitory Area of Tongji University. Chin. Landsc. Archit. 2018, 2, 24–28. (In Chinese) [Google Scholar]
  4. Hosseinzadeh, A.; Keshmiri, A. Computational Simulation of Wind Microclimate in Complex Urban Models and Mitigation Using Trees. Buildings 2021, 11, 112. [Google Scholar] [CrossRef]
  5. Ai, Z.T.; Mak, C.M. CFD simulation of flow in a long street canyon under a perpendicular wind direction: Evaluation of three computational settings. Build. Environ. 2017, 114, 293–306. [Google Scholar] [CrossRef]
  6. Hong, B.; Qin, H.; Jiang, R.; Xu, M.; Niu, J. How Outdoor Trees Affect Indoor Particulate Matter Dispersion: CFD Simulations in a Naturally Ventilated Auditorium. Int. J. Environ. Res. Public Health 2018, 15, 2862. [Google Scholar] [CrossRef]
  7. Zhao, Y.; Chen, Y.; Li, K. A simulation study on the effects of tree height variations on the facade temperature of enclosed courtyard in North China. Build. Environ. 2022, 207 Pt B, 108566. [Google Scholar] [CrossRef]
  8. Zeng, S.; Tian, J.; Zeng, J. A study on ventilation efficiency and optimal layout of typical residential modules based on CFD simulation. Archit. J. 2019, 2, 24–30. (In Chinese) [Google Scholar]
  9. Wang, W.; Deng, Z.J.; Hu, C. Comparison and evaluation of wind environment simulation of mixed settlements in hefei. Ind. Constr. 2018, 48, 54–59. (In Chinese) [Google Scholar]
  10. Huang, W.F.; Zhou, T.; Chen, X. Wind environment assessment of typical building groups by using CFD numerical simulation. J. Hefei Univ. Technol. Nat. Sci. 2019, 42, 415–421. (In Chinese) [Google Scholar]
  11. Ashare Standard 55-2017; Thermal Enviromentla Conditions for Human Occupancy. American Society of Heating, Refrigerating and Air-Conditioning Engineers: Atlanta, GA, USA, 2017.
  12. Morakinyo, T.E.; Lam, Y.F.N. Simulation study on the impact of tree-configuration, planting pattern and wind condition on street-canyon’s micro-climate and thermal comfort. Build. Environ. 2016, 103, 262–275. [Google Scholar] [CrossRef]
  13. Hirashima, S.Q.D.S.; Katzschner, A.; Ferreira, D.; De Assis, E.S.; Katzschner, L. Thermal comfort comparison and evaluation in different climates. Urban Clim. 2018, 23, 219–230. [Google Scholar] [CrossRef]
  14. Ali, S.B.; Patnaik, S. Thermal comfort in urban open spaces: Objective assessment and subjective perception study in tropical city of Bhopal, India. Urban Clim. 2018, 24, 954–967. [Google Scholar] [CrossRef]
  15. Xu, X.; Sun, S.; Liu, W.; García, E.H.; He, L.; Cai, Q.; Xu, S.; Wang, J.; Zhu, J. The cooling and energy saving effect of landscape design parameters of urban park in summer: A case of Beijing, China. Energy Build. 2017, 149, 91–100. [Google Scholar] [CrossRef]
  16. Klemm, W.; Heusinkveld, B.G.; Lenzholzer, S.; Van Hove, B. Street greenery and its physical and psychological impact on thermal comfort. Landsc. Urban Plan. 2015, 138, 87–98. [Google Scholar] [CrossRef]
  17. Xu, H.H.; Chen, H.; Zhou, X.F.; Wu, Y.N.; Liu, Y. Research on the relationship between urban morphology and air temperature based on mobile measurement: A case study in Wuhan, China. Urban Clim. 2020, 34, 100671. [Google Scholar] [CrossRef]
  18. Liu, C.; Dong, B.B. Optimization of architectural form in Shenzhen Vanke residence based on wind environment. J. Qingdao Univ. Technol. 2016, 4, 35–40. (In Chinese) [Google Scholar]
  19. Lin, T.P.; Matzarakis, A.; Hwang, R.L. Shading effect on long-term outdoor thermal comfort. Build. Environ. 2010, 45, 213–221. [Google Scholar] [CrossRef]
  20. Liu, B.Y.; Mei, Y.; Kuang, W. Experimental Research on Correlation between Microclimate Element and Human Behavior and Perception of Residential Landscape Space in Shanghai. Chin. Landsc. Archit. 2016, 32, 5–9. (In Chinese) [Google Scholar]
  21. Kenjere, S.; Kuile, B.T. Modelling and simulations of Turbulent flows in urban areas with vegetation. J. Wind Eng. Ind. Aerodyn. 2013, 123, 43–55. [Google Scholar] [CrossRef]
  22. Mahmoud, A. Analysis of the microclimatic and human comfort conditions in an urban park in hot and arid regions. Build. Environ. 2011, 46, 2641–2656. [Google Scholar] [CrossRef]
  23. Milošević, D.D.; Bajšanski, I.V.; Savić, S.M. Influence of changing trees locations on thermal comfort on street parking lot and footways. Urban For. Urban Green. 2017, 23, 113–124. [Google Scholar] [CrossRef]
  24. Morakinyo, T.E.; Lau, K.K.-L.; Ren, C.; Ng, E. Performance of Hong Kong’s common trees species for outdoor temperature regulation, thermal comfort and energy saving. Build. Environ. 2018, 137, 157–170. [Google Scholar] [CrossRef]
  25. Cheung, P.K.; Fung, C.K.W.; Jim, C.Y. Seasonal and meteorological effects on the cooling magnitude of trees in subtropical climate. Build. Environ. 2020, 177, 106911. [Google Scholar] [CrossRef]
  26. Massetti, L.; Petralli, M.; Napoli, M.; Brandani, G.; Orlandini, S.; Pearlmutter, D. Effects of deciduous shade trees on surface temperature and pedestrian thermal stress during summer and autumn. Int. J. Biometeorol. 2019, 63, 467–479. [Google Scholar] [CrossRef]
  27. Ooka, R.; Chen, H.; Kato, S. Study on optimum arrangement of trees for design of pleasant outdoor environment using multi-objective genetic algorithm and coupled simulation of convection, radiation and conduction. J. Wind Eng. Ind. Aerodyn. 2008, 96, 1733–1748. [Google Scholar] [CrossRef]
  28. National Meteorological Information Center. Special Meteorological Data Set for Building Thermal Environment Analysis in China; China Architecture & Buildings Press: Beijing, China, 2005. (In Chinese) [Google Scholar]
  29. Zhang, T.; Hong, B.; Su, X.; Li, Y.; Song, L. Effects of tree seasonal characteristics on thermal-visual perception and thermal comfort. Build. Environ. 2022, 212, 108793. [Google Scholar] [CrossRef]
  30. Hong, B.; Lin, B. Numerical study of the influences of different patterns of the building and green space on micro-scale outdoor thermal comfort and indoor natural ventilation. Build. Simul. 2014, 7, 525–536. [Google Scholar] [CrossRef]
  31. Cong, Y.; Zhu, R.; Yang, L.; Zhang, X.; Liu, Y.; Meng, X.; Gao, W. Correlation Analysis of Thermal Comfort and Landscape Characteristics: A Case Study of the Coastal Greenway in Qingdao, China. Buildings 2022, 12, 541. [Google Scholar] [CrossRef]
  32. Ma, X.; Fukuda, H.; Zhou, D.; Wang, M. Study on outdoor thermal comfort of the commercial pedestrian block in hot-summer and cold-winter region of southern China-A case study of The Taizhou Old Block. Tour. Manag. 2019, 75, 186–205. [Google Scholar] [CrossRef]
  33. Lai, D.; Lian, Z.; Liu, W.; Guo, C.; Liu, W.; Liu, K.; Chen, Q. A comprehensive review of thermal comfort studies in urban open spaces. Sci. Total Environ. 2020, 742, 140092. [Google Scholar] [CrossRef] [PubMed]
  34. Lai, D.; Liu, W.; Gan, T.; Liu, K.; Chen, Q. A review of mitigating strategies to improve the thermal environment and thermal comfort in urban outdoor spaces. Sci. Total Environ. 2019, 661, 337–353. [Google Scholar] [CrossRef] [PubMed]
  35. Gulwadi, G.B.; Mishchenko, E.D.; Hallowell, G.; Alves, S.; Kennedy, M. The restorative potential of a university campus: Objective greenness and student perceptions in Turkey and the United States. Landsc. Urban Plan. 2019, 187, 36–46. [Google Scholar] [CrossRef]
  36. Ghaffarianhoseini, A.; Berardi, U.; Ghaffarianhoseini, A.; Al-Obaidi, K. Analyzing the thermal comfort conditions of outdoor spaces in a university campus in Kuala Lumpur, Malaysia. Sci. Total Environ. 2019, 666, 1327–1345. [Google Scholar] [CrossRef]
  37. Srivanit, M.; Hokao, K. Evaluating the cooling effects of greening for improving the outdoor thermal environment at an institutional campus in the summer. Build. Environ. 2013, 66, 158–172. [Google Scholar] [CrossRef]
  38. Alheji, A.K.; Guo, J.l.; Guan, N.Y.; Liu, H.B. Numerical Simulation of Natural Ventilation in a Zero-Energy Building. Build. Energy Effic. 2014, 10, 13–17. [Google Scholar]
  39. Lin, Z. Effective draft temperature for evaluating the performance of stratum ventilation. Build. Environ. 2011, 46, 1843–1850. [Google Scholar] [CrossRef]
  40. Lu, M.; Song, D.; Shi, D.; Liu, J.; Wang, L. Effect of High-Rise Residential Building Layout on the Spatial Vertical Wind Environment in Harbin, China. Buildings 2022, 12, 705. [Google Scholar] [CrossRef]
  41. Xuan, W. Research on Reducing Carbon Consumption in Residential Community Spaces as Influenced by Microclimate Environments. J. Urban Plan. Dev. 2021, 9, 147. [Google Scholar]
  42. Li, X.; Wang, J.; Eftekhari, M.; Qi, Q.; Jiang, D.; Song, Y.; Tian, P. Improvement Strategies Study for Outdoor Wind Environment in a University in Beijing Based on CFD Simulation. Adv. Civ. Eng. 2020, 2020, 8850254. [Google Scholar] [CrossRef]
  43. Li, J.; Liu, J.; Srebric, J.; Hu, Y.; Liu, M.; Su, L.; Wang, S. The Effect of Tree-Planting Patterns on the Microclimate within a Courtyard. Sustainability 2019, 11, 1665. [Google Scholar] [CrossRef]
  44. Xu, X.; Luo, F.; Wang, W.; Hong, T.; Fu, X. Performance-Based Evaluation of Courtyard Design in China’s Cold-Winter Hot-Summer Climate Regions. Sustainability 2018, 10, 3950. [Google Scholar] [CrossRef]
  45. CHAM. Case Studies. Available online: http://www.cham.co.uk/casestudies.php (accessed on 21 February 2022).
  46. Mochida, A.; Tominaga, Y.; Murakami, S.; Yoshie, R.; Ishihara, T.; Ooka, R. Comparison of various k-ε model and DSM applied to flow around a high-rise building—Report on AIJ cooperative project for CFD prediction of wind environment. Wind Struct. Int. J. 2002, 5, 227–244. [Google Scholar] [CrossRef]
  47. Tominaga, Y.; Mochida, A.; Yoshie, R.; Murakami, S.; Ishihara, T.; Ooka, R. AIJ guidelines for practical applications of CFD to pedestrian wind environment around buildings. J. Wind Eng. Ind. Aerodyn. 2008, 96, 1749–1761. [Google Scholar] [CrossRef]
  48. Mou, B.; He, B.J.; Zhao, D.X.; Chau, K.W. Numerical simulation of the effects of building dimensional variation on wind pressure distribution. Eng. Appl. Comput. Fluid Mech. 2017, 11, 15–27. [Google Scholar] [CrossRef]
  49. JGJ/T 449-2018; Standard for Green Performance Calculation of Civil Buildings. The Standardization Administration of China: Beijing, China, 2018.
  50. Lin, Z.; Yao, T.; Chow, T.; Fong, K.; Chan, L. Performance evaluation and design guidelines for stratum ventilation. Build. Environ. 2011, 46, 2267–2279. [Google Scholar] [CrossRef]
  51. Kato, S.; Yang, J.H. Study on in-haled air quality in a personal air-conditioning environment using new scales of ventilation efficiency. Build. Environ. 2008, 43, 494–507. [Google Scholar] [CrossRef]
  52. Launder, B.E.; Spalding, D.B. Lectures in Mathematical Models of Turbulence; Academic Press: London, UK, 1972. [Google Scholar]
  53. Lu, R.; Gen, H.X.; Li, Z.; Hu, Y.K. Research on Projection Occlusion Analysis and Optimization of Public Seat Layout—Taking Beijing Wangfujing Pedestrian Street as an Example. Chin. Landsc. Archit. 2021, 37, 39–44. (In Chinese) [Google Scholar]
  54. Terjung, W.H. Physiologic climates of the conterminous united states: A bioclimatic classification based on man. Ann. Assoc. Am. Geogr. 2015, 56, 141–179. [Google Scholar] [CrossRef]
  55. China Academy of Building Research; Shanghai Research Institute of Building Sciences (Group) Co, Ltd. Assessment Standard for Green Building; JGJ286-2013; China Architecture & Building Press: Beijing, China, 2019; pp. 1–35. [Google Scholar]
  56. Tan, L.W. Simulation of Outdoor Wind Environment in Residential Area Based on Reasonable Static Wind Rate. Master’s Thesis, Chongqing University, Chongqing, China, 2017. [Google Scholar]
  57. Xi, R. Study on Residential Area Layout Based on Reasonable Silent Area a Case Study of Residential District in Xi’an. Master’s Thesis, Chongqing University, Chongqing, China, 2017. [Google Scholar]
  58. Heilongjiang Province Academy of Cold Area Building Research. Assessment Standard for Green Building of Heilongjiang Province; DB23/T 1642-2020; Harbin Institute of Technology Press: Harbin, China, 2020; pp. 1–113. [Google Scholar]
  59. Nie, H.S.; Qin, Y.G. Chinese Ecological Residential Assessment Manual; China Architecture & Building Press: Beijing, China, 2002; pp. 1–52. [Google Scholar]
  60. Silva, T.J.V.; Hirashima, S.Q.S. Predicting urban thermal comfort from calibrated UTCI assessment scale—A case study in Belo Horizonte city, southeastern Brazil. Urban Clim. 2020, 36, 100652. [Google Scholar] [CrossRef]
  61. The National Climatic Data Center (NCDC) Public FTP Server. Available online: ftp://ftp.ncdc.noaa.gov/pub/data/noaa/isdlite/ (accessed on 26 February 2022).
  62. Zhi, D.Y. Research on Design Strategy of University’s Teaching Buildings Based on Outdoor Thermal Comfort. Master’s Thesis, Harbin Institute of Technology, Harbin, China, 2019. [Google Scholar]
  63. Zhao, Y.; Ding, Q.Q.; Yang, Z.M.; Chen, Y.Q. Renewal of Age-friendliness Landscape in Old Community Based on Ecotect Analysis. For. Inventory Plan. 2021, 11, 190–195. [Google Scholar]
  64. Zhao, L.; Zhang, H.; Wang, Q.; Wang, H.; Dede, T. Digital-Twin-Based Evaluation of Nearly Zero-Energy Building for Existing Buildings Based on Scan-to-BIM. Adv. Civ. Eng. 2021, 2021, 6638897. [Google Scholar] [CrossRef]
  65. Xiao, X.; Lu, J.; Huang, X.T.; Chen, G.; Cai, Y.N. Study on Ecological Design Strategy of Industrial Heritage Park for Urban High-Density Community. Ind. Constr. 2022, 4, 1–13. [Google Scholar]
  66. Chen, R.Z.; Fu, X.Y. Study on the Simulation of Improving Street Wind Environment in Old Communities with Plants of Old Community by Plants. Urban. Archit. 2022, 3, 190–194. [Google Scholar]
  67. Wu, S.j.; Dong, L.; Jia, P.Y. Review on Urban Green Space Cooling and Humidifying Effect and Outdoor Thermal Comfort Based on CFD. Landsc. Archit. 2019, 26, 79–84. [Google Scholar]
  68. Evgrafova, A.; Sukhanovskii, A. Impact of complex relief on heat transfer in urban area. Urban Clim. 2022, 43, 101177. [Google Scholar] [CrossRef]
Figure 1. The location of Tangfang Middle School.
Buildings 12 01375 g001
Figure 2. Typical analysis diagram of horizontal flow field. (This is a schematic diagram of the wind flow area for an idealized group of buildings).
Buildings 12 01375 g002
Figure 3. Layout of wind environment test points on the campus.
Buildings 12 01375 g003
Figure 4. Wind speed record at the test point on the campus.
Buildings 12 01375 g004
Figure 5. The computational domain.
Buildings 12 01375 g005
Figure 6. Linear regression diagram of the average wind speed of the measured and simulated points on the campus.
Buildings 12 01375 g006
Figure 7. (a) Wind speed contour map at Z = 1.5 m, (b) Wind speed vector diagram at Z = 1.5 m.
Buildings 12 01375 g007
Figure 8. (a) Windward wind pressure in winter, (b) Leeward wind pressure in winter, (c) Wind pressure in winter.
Buildings 12 01375 g008
Figure 9. (a) Solar radiation value on Major Cold day, (b) Sunlight value on Major Cold day.
Buildings 12 01375 g009
Figure 10. Superposition of wind and light simulation results: (a) Superposition of sunlight and wind speed vector diagram on Major Cold day; (b) Superposition of solar radiation and wind speed vector diagram on Major Cold day; (c) The three red circles are mainly cold weather sunshine and wind speed cloud maps superimposed on unfavorable areas; (d) A red circle is a cloud map of solar radiation and wind speed from the Big Cold superimposed on the disadvantage area.
Buildings 12 01375 g010
Figure 11. Simulation experiment of a single plant.
Buildings 12 01375 g011
Figure 12. Experiment on wind environment with different plant layouts and Simulation monitoring point distribution.
Buildings 12 01375 g012
Figure 13. Wind speed at 1.5 m for different plant layouts in the cross-flow area.
Buildings 12 01375 g013
Figure 14. Wind speed at 1.5 m for different plant layouts in the cross-flow area and Simulation monitoring point distribution.
Buildings 12 01375 g014
Figure 15. The wind environment of the disadvantaged area after optimization, 4#–5# disadvantaged area (a), 5#–6# disadvantaged area (b), 6# disadvantaged area (c).
Buildings 12 01375 g015
Figure 16. Negative correlation between solar radiation and wind speed in cross-flow area (a) and corner flow area (b).
Buildings 12 01375 g016
Figure 17. The significance analysis of the correlation between the number of activities and the wind speed (a) Number of low-intensity activities (b) Number of moderate to low-intensity activities (c) Number of moderate and above intensity activities.
Buildings 12 01375 g017
Figure 18. The significance analysis of the correlation between the number of activities and solar radiation (a) Number of low-intensity activities (b) Number of moderate to low-intensity activities (c) Number of moderate and above intensity activities.
Buildings 12 01375 g018
Figure 19. Comparison of wind prevention efficiency under different plant layouts.
Buildings 12 01375 g019
Table 1. Types of student activities.
NumberType of ActivityType of Crowd QuantitySpecific Contents
1EntertainmentDynamic discretePlayfulness, walking, etc.
Stagnant discreteReading magazines, etc.
Stagnant aggregatePlaying games, throwing sandbags, playing shuttlecock, etc.
2ExerciseDynamic discreteRunning, sprinting, etc.
Stagnant discreteExercise with equipment, etc.
Stagnant aggregateRadio gymnastics, etc.
3RestDynamic discreteEnjoying the landscape while walking, etc.
Stagnant discreteSitting, thinking, reading extracurricular books, etc.
4CommunicationStagnant aggregateSitting and chatting, meeting, discussing problems, etc.
Stagnant discreteWalking, etc.
Table 2. Types of student activities.
NumberBoundary TypeSpecific Contents
1Calculation domain size1436 × 908 × 561 m
2Core Area grid size0.3 × 0.3 × 0.3 m
3Turbulence ModelStandard k-ε turbulence model
4Entrance InterfaceAn average wind speed of 3.6 m/s at the windward side, and the wind direction is ENE
5Exit BoundaryFree outflow
6Side BoundaryWall
7Top surface boundaryWall
8Roughness of underlying surfaceα = 0.22
9Convergence conditionconvergence precision 10−4
Table 3. Evaluation standard for the correlation between air velocity and comfort.
Wind LevelAir Velocity Range (m/s)Effects on the Human Body
00 < V ≤ 0.1Stuffy
10.1 < V ≤ 1Imperceptible
21 < V ≤ 2.1Light breeze
32.1 < V ≤ 3.4Disheveled hair
43.4 < V ≤ 5Excessive dust
55 < V ≤ 6.7Tolerable limit for onshore wind
66.7 < V ≤ 8.6Difficulty walking and holding an umbrella
Table 4. UTCI original standard and cold region modified standard.
UTCI (°C) RangeCold Land UTCI (°C) Range Correction [62]Stress Category on the Human Body
+38 to +46+39 to +45Very strong heat stress
+32 to +38+33 to +39Strong heat stress
+26 to +32+21 to +33Moderate heat stress
+9 to +26+3.5 to +21No thermal stress
+9 to +0+3.5 to −4Slight cold stress
0 to −13−4 to −11Moderate cold stress
−13 to −27−11 to −18Strong cold stress
Table 5. Distribution table of UTCI ratio of outdoor space on campus.
UTCI (°C)The Proportion of UTCI Distribution (%)
1#-S3#-S4#-S4#–5#5#–6#6#-CO
+38 to +460.000.000.000.000.000.00
+32 to +380.000.000.000.000.000.00
+26 to +320.000.000.000.000.000.00
+9 to +2683.6781.4382.7971.8577.6974.52
+9 to +016.3318.5717.2128.1522.3125.48
0 to −130.000.000.000.000.000.00
−13 to −270.000.000.000.000.000.00
Table 6. Configuration table of shade-tolerant plants.
Plant NameTypeFamily NameShade Tolerance LevelApplicationSize and ShapePhysical Photo
Cryptomeria fortunei Hooibrenk ex Otto et DietrEvergreen treeTaxodiaceae4Vacant spaceGenerally 6 m in height, about 3 m in crown width, conical Buildings 12 01375 i001
Podocarpus macrophyllus (Thunb.) D. DonEvergreen treePodocarpaceae2North side of the building, forest edge, sparse forestGenerally 6 m in height, about 2.5–3 m in crown width, conical Buildings 12 01375 i002
Magnolia grandiflora LEvergreen treeMagnoliaceae4Vacant space, north side of the buildingGenerally 5 m high, crown width about 2–2.6 m, oval Buildings 12 01375 i003
Photinia serrulata Lindl.Evergreen treeRosaceae3Forest edge, vacant space, outside of viaductGenerally 2–3.5 m high, about 1.5–2.5 m in crown width, obround Buildings 12 01375 i004
Ilex chinensis SimsEvergreen treeAqifolilceae4North side of the building, sparse forestGenerally 2–25 m high, about 1.2–1.8 cm in crown width, spherical Buildings 12 01375 i005
Acer palmatum Thunb.Evergreen treeMaple family3Forest edgeGenerally 1.5–2.5 m high, about 1.5–2 m in crown width, oval Buildings 12 01375 i006
Acer truncatum BungeEvergreen treeMaple family2North side of the building, forest edgeGenerally 8–10 m high, about 4.5–6 m in crown width, oval Buildings 12 01375 i007
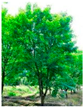
Sapium discolor
(Champ. ex Benth.)
Muell.-Arg.
Evergreen treeEuphorbiaceae3Forest edge, north side of the buildingGenerally 3–12 m high, about 3.5–3.8 m in crown width, oval Buildings 12 01375 i008
Edgeworthia chrysantha.Deciduous shrubThymeleaceae2Sparse forest, forest edgeGenerally 0.7–1.5 m high, about 0.7–0.8 m in crown width, obround Buildings 12 01375 i009
Publisher’s Note: MDPI stays neutral with regard to jurisdictional claims in published maps and institutional affiliations.

