Article

Investigation into the Large Deformation Mechanism and Control Technology of Variable Cross-Section Tunnel in Layered Mudstone Stratum

1
School of Civil Engineering, Xi’an University of Architecture and Technology, Xi’an 710055, China
2
Shaanxi Key Laboratory of Geotechnical and Underground Space Engineering, Xi’an 710055, China
*
Author to whom correspondence should be addressed.
Buildings 2023, 13(1), 110; https://doi.org/10.3390/buildings13010110
Submission received: 9 December 2022 / Revised: 26 December 2022 / Accepted: 27 December 2022 / Published: 31 December 2022
(This article belongs to the Section Building Structures)

Abstract

:
Buildings (structures) with various structural forms are becoming increasingly prevalent and are encountering more challenging engineering issues. Field investigations, laboratory tests, and numerical simulations were used to study the disaster-causing mechanism and the control technology for a variable cross-section tunnel passing through layered, expansive mudstone stratum. The deformation and stress characteristics of the surrounding rock and supporting structure were examined by both numerical simulation and field monitoring. The results indicated that the stress was more complex at different section positions; the rock and supporting structure underwent substantially more deformation and stress in the broadened sections. The mean values of the surrounding rock’s horizontal convergence and vault settlement in the broadened section were 15.71% and 16.36% higher than those in the general section, respectively, and the value of lining stress was 35.51% higher. Additionally, the simulation results under the improved construction measures matched the measured results. The maximum deformation and stress of the surrounding rock were reduced by 16.95% and 40.04%, respectively, under the improved scheme, while the lining stress was reduced by 45.38%. The stress state of the secondary lining was significantly improved; in particular, the tensile stress in the lining structure under the original construction scheme was converted into a compressive state under the new measures, fully utilizing the bearing effect. Finally, the rationality and effectiveness of the adopted reinforcement measures were evaluated, and the experiences and lessons learned were summarized to provide insights for preventing similar incidents from reoccurring.

Graphical Abstract

1. Introduction

Increasingly more special-shaped or variable-section buildings are being built to fulfill specialized requirements [1,2,3,4,5]. In addition, there are increasingly complex geological and construction issues in rock mass engineering, such as high geostress, rock large deformation and construction of variable section structures [6,7,8,9]. In particular, the surrounding rock is particularly susceptible to significant deformation and cracking under high geostress and geological eccentric compression in regions where joint structures have been developed [10,11,12,13]. Kou et al. [14] have investigated the asymmetric deformation of the surrounding rock and the unequal stress characteristics of the supporting structure of the Dongmachang tunnel in an active fault zone. It was discovered that the fundamental causes of asymmetric deformation of the surrounding rock and asymmetric damage of secondary lining were the soft and hard inclined contact of broken dolomite limestone and high geostress. The findings of this study have important significance for the prevention of failure of secondary linings under eccentric compression. Manh et al. [15] created a closed-form solution for stresses and displacements around deep tunnels with arbitrary cross-sections. For various tunnel cross-section shapes, the proposed analytical solution was consistent with the results of the numerical program FLAC3D, which is of great significance to accurately evaluate the stress and displacement around the underground cavern. Li et al. [16] suggested a prediction approach concerning surface movement and settling for tunnels with changing cross-sections based on the stochastic medium theory. Combined with practical engineering, this method could more accurately predict the change law of stratum movement and settlement in various structure sections. With an increase in the ratio of rock major effect angle to buried depth (tanβ/H) and the span, R, the slope of the surface settlement curve at variable cross-sections increased. The unified analytical solution for stress and displacement in deep tunnels with arbitrary sections formed under a disturbance load was reported by Chen et al. [17]. In this study, a typical section of a horseshoe tunnel was used as an example to examine the impact of the form of tunnel section on the response of tunnel parameters in orthotropic rock. The effectiveness of the method was verified by a comparison with the finite element calculation results and results in the literature. The pressure and displacement of surrounding rock were significantly impacted by the construction of variable cross-section tunnels, which resulted in higher requirements for surrounding rock supporting systems. Taking tunnel engineering as an example, Qiao et al. [18] explored the surrounding rock support characteristics of a normal section and a widening section under the influence of different excavation methods, buried depth and span, combined with a numerical simulation and field monitoring. The findings indicated that the variation in section span and construction methods have a significant impact on the stability of the surrounding rock. At the same time, the complex stress of layered rock will also contribute to the unequal pressure in the surrounding rock.
Reasonable excavation and supporting methods are crucial for the stability of the surrounding rock and construction safety. To prevent surrounding rock deformation and structural damage, prompt and suitable supporting structures should be built following tunneling in soft stratum [19,20,21,22,23]. Engineering reinforcing techniques are primarily empirical design, theoretical analysis and field monitoring for controlling rock deformation of tunnels under a large buried depth, high geostress circumstances and soft rock strata [24,25,26,27]. Guan et al. [28] presented a numerical method based on finite strain theory for a strain-softening rock mass around a highly deformed circular opening. This method took into account the influence of axial in situ stress by introducing the initial axial stress into the elastic constitutive equations, and it realized axial plastic flow by redefining the plastic internal variable and considering various stress distributions in the plastic zone. As a result, the numerical method allowed for a more logical and accurate estimate of the potential for rock deformation and compression. Yang et al. [29] conducted physical experiments and numerical simulations to model tunnel excavation in slanted upper-soft and lower-hard strata. The final failure model clearly exhibited asymmetrical deformation, with the soft rock portion experiencing block dropping and roof collapse while the hard rock area merely exhibited shrinkage deformation. In order to determine the cause and course of large deformations at the Dongsong hydropower station in Sichuan Province, Zhu et al. [30] conducted physical rock and mechanical experiments and field monitoring. The results revealed that the main causes of rock large deformation were the dilatancy effect under conditions of high geostress and relaxation deformation with weak supports. In addition, timely application of a secondary lining can effectively limit the future development of stress and deformation of the initial support. By combining the impacts of anchoring length, pretension, bolt length and spacing into 16 different schemes, Wang et al. [31] performed a methodical numerical experiment to determine the distribution characteristics of stress in the surrounding rock. Furthermore, a new, fully anchoring method with pretension and matching technology was presented, along with an analytical method for calculating the active and passive strengthening index of the anchored surrounding rock. Soft rock stratum with high geostress frequently experienced rock large deformations during tunnel excavation. Sun et al. [32] used a discrete element numerical model to examine the failure mechanisms and the control technology of soft rock tunnels based on the Muzhailing tunnel. To control rock large deformations, the authors presented a novel system of high, constant resistance anchor cable support. The findings demonstrated that the novel support could successfully convert the large deformations and uneven stress in the surrounding rock into smaller deformations and uniform stress, which can serve as a model for support design in deep underground engineering. The aforementioned investigations have provided the groundwork for researching soft rock deformation under increasingly complicated geological conditions, while more research is still required to understand the deformation of the surrounding rock and lining cracking in soft rock strata.
This paper aims to analyze the disaster-causing mechanisms and evaluate the comprehensive reinforcement techniques to the surrounding rock deformation and secondary lining cracking in variable cross-section tunneling in expansive, layered mudstone stratum. Based on tunnel no.1 in the China–Tajikistan natural gas pipeline, the main works of this study are as follows:
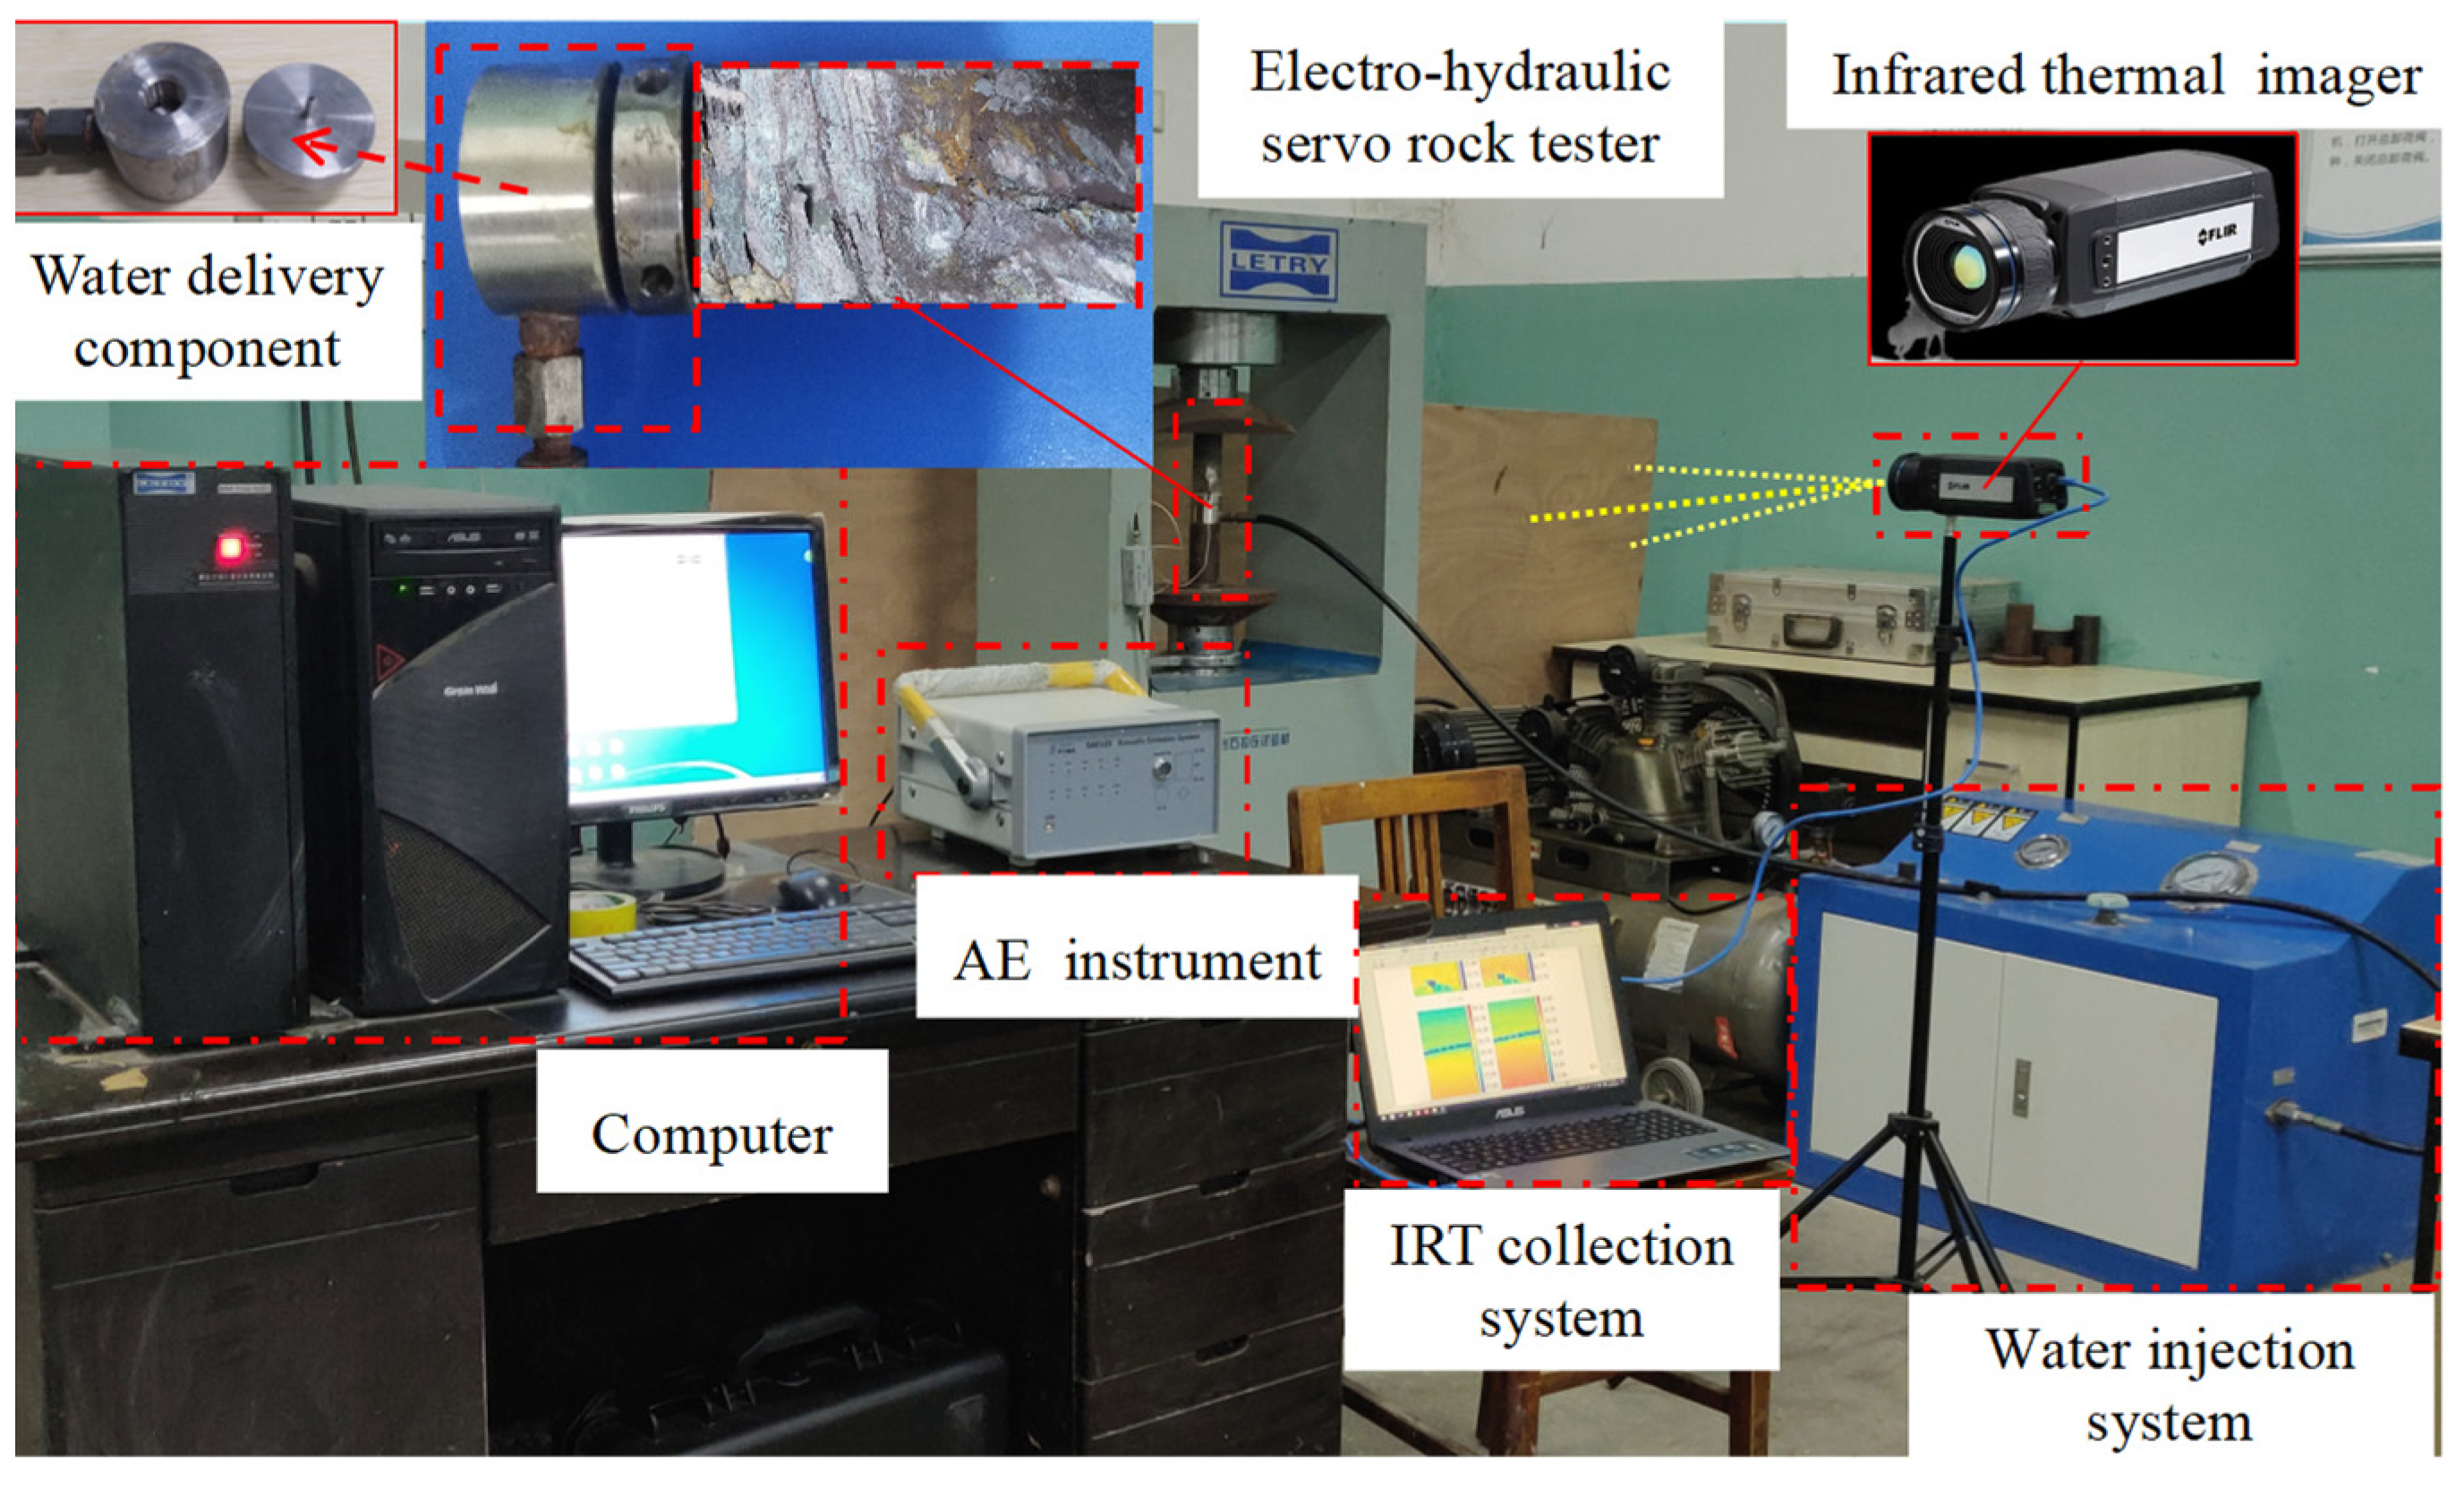
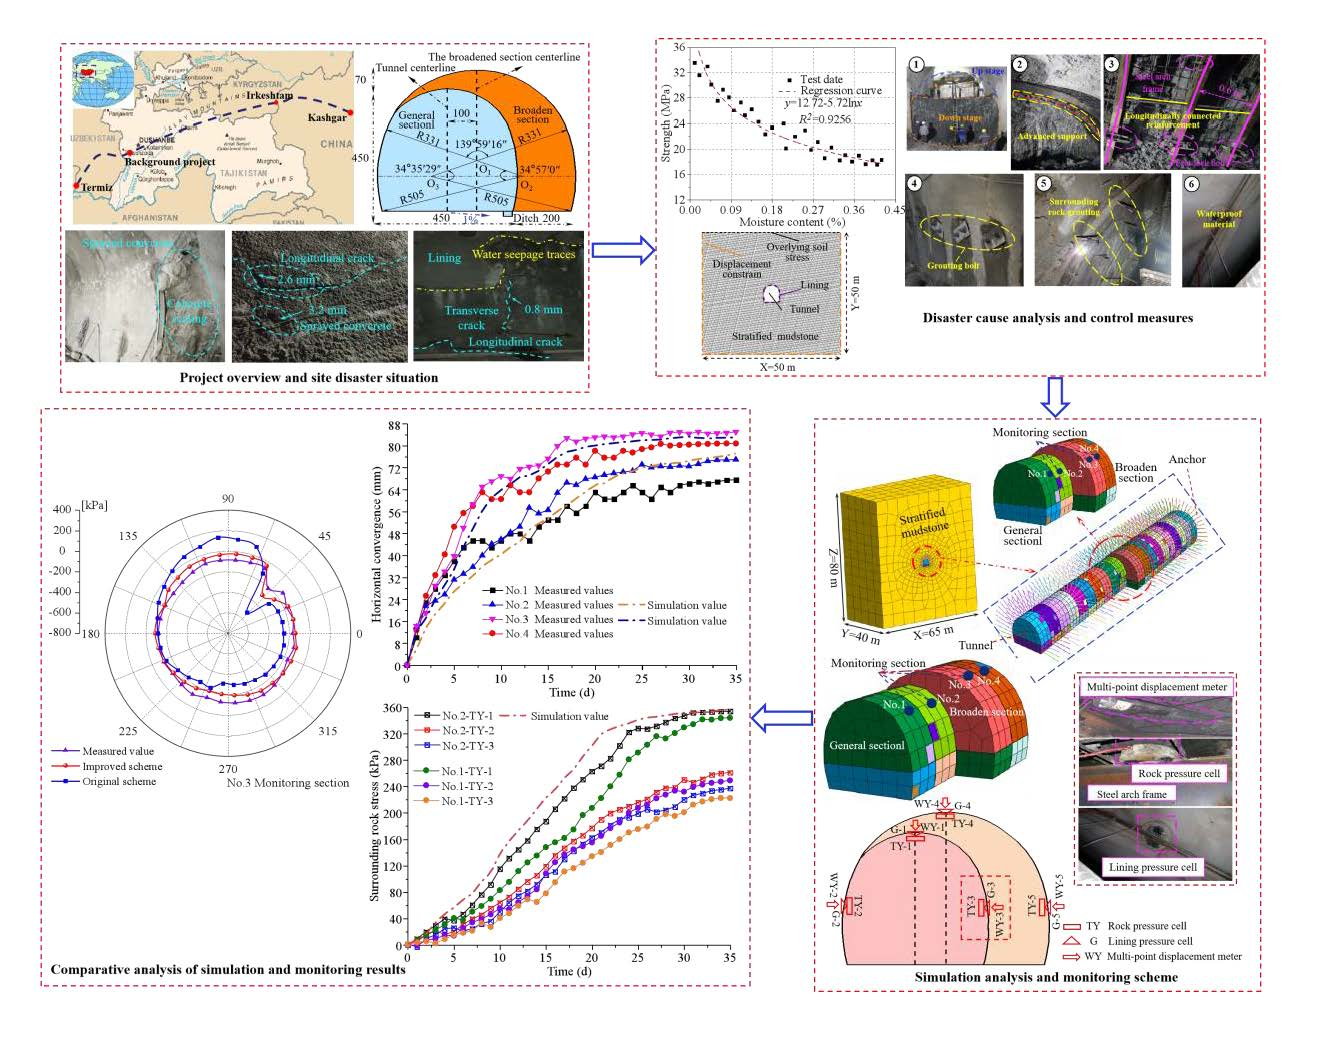
  • To analyze the disaster features, disaster-causing mechanisms and comprehensive reinforcement techniques for a variable cross-section tunnel in layered mudstone stratum combining a field investigation, laboratory tests and numerical simulations;
  • To analyze the control effect of reinforcement measures on the deformation and stress response characteristics of surrounding rock for the original and improved supporting structure constructions;
  • To evaluate the rationality and effectiveness of the modifications adopted in this study; in addition, the lessons learned are summarized to provide insights to prevent similar incidents from reoccurring in the future.

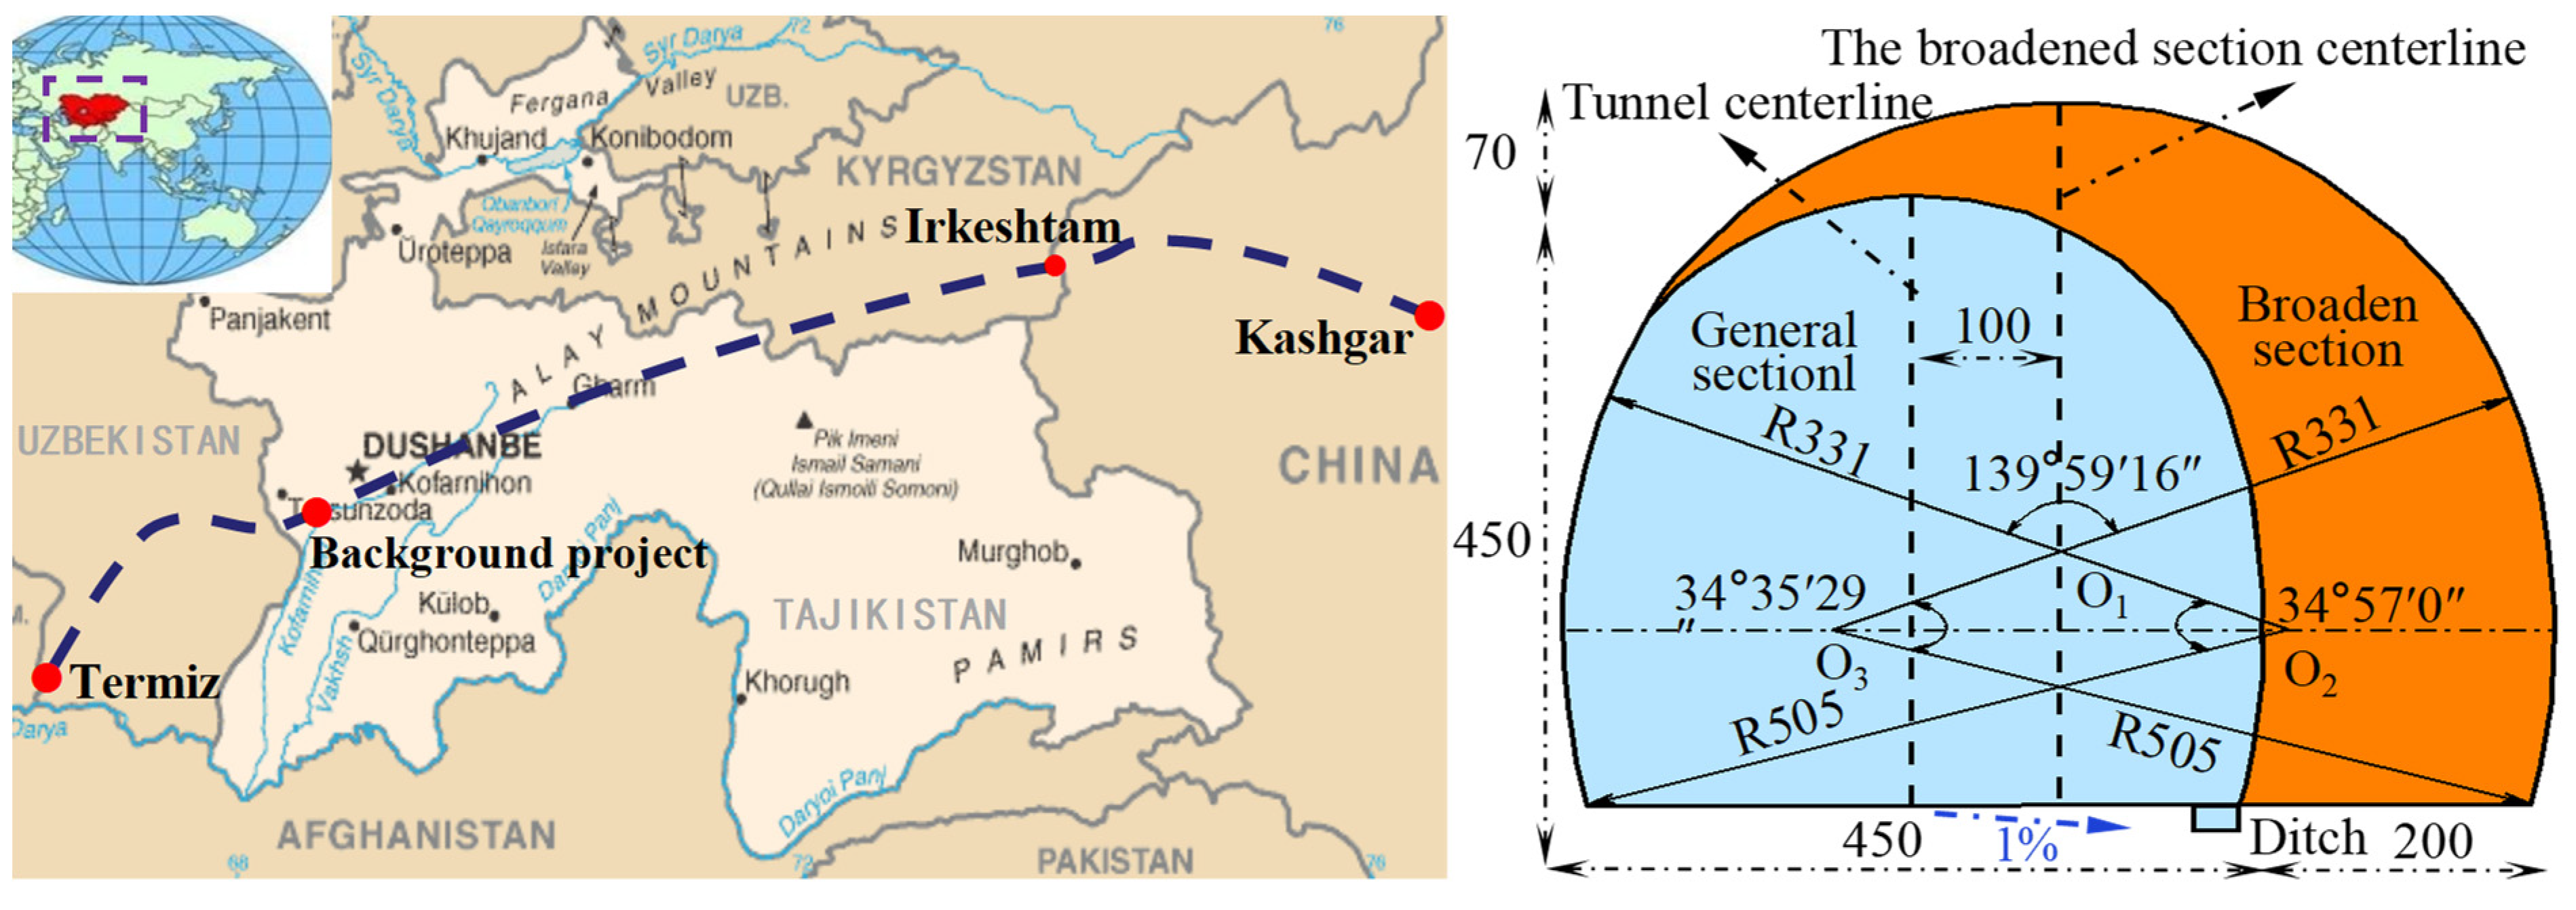
2. Project Introduction

2.1. Project Overview

Turkmenistan is the starting point of the China–Tajikistan natural gas pipeline tunnel, which travels from west to east through Uzbekistan, Tajikistan and Kyrgyzstan before arriving in Kashgar, China. The tunnel’s overall length of the tunnel is 1860 m with a one-way slope of 10.48% uphill from the entrance to the exit, and its maximum buried depth is 260 m. To ensure the normal passage of transport vehicles, a widened section with a length of 15 m was built every 200 m. The width × height of the general section is 4.5 m × 4.5 m, and for the broadened section it is 6.5 m × 5.2 m. The tunnel was excavated from the general section to create the broadened section. According to the design data, the general location of the gas pipeline and a schematic diagram of the tunnels cross-section are depicted in Figure 1.

2.2. Geology and Hydrological Characteristics

The terrain of the tunnel area is high in the north-west and low in the south-east, belonging to the middle mountain landform with structural erosion. With a thickness of 1–20 m, the overlying soil layer mainly includes Quaternary residual slope soil and silty clay, accompanied by a large number of surface gullies. The majority of the lower soil is weathered mudstone with a developed joint structure and fractures. A gradual slope with silty clay of the loess type and a small amount of gravel leads to the tunnel entrance. The exit is situated at the base of a mountain, and the soil there is mostly silty clay with a little gravel. Pore and bedrock fissure water make up the majority of the groundwater in the tunnel site region, and it is mostly refilled by precipitation and by glacier melt water. The concrete and steel bars are mildly corroded, caused by the groundwater. The stratum distribution (as depicted in Figure 2) and soil mechanical parameters (shown in Table 1) of the tunnel site were obtained according to the geological survey results and laboratory loading tests.

3. Analysis of Cracking Characteristics and Disaster-causing Mechanism

3.1. Cracks Distribution Characteristics

To ensure the normal passage of transport vehicles, a widened section was built every 200 m. During the construction, cracks appeared in the shotcrete and lining on both sides of the variable section. Longitudinal cracks with widths of 1–5 mm were distributed asymmetrically in the shotcrete during K1 + 875 ~ K1 + 915, accompanied by concrete scaling. On both sides of the secondary lining, there were transverse cracks that were about 0.5–2 mm wide. Some of these cracks have allowed a tiny quantity of groundwater to flow out. Tensile fractures with widths of 1–2 mm have begun to form at vaults in the general section, some of these cracks had a significant depth. According to the field investigation data, the cracking situation of the tunnel on-site is shown in Figure 3.

3.2. Disaster-Causing Mechanism Analysis

This work primarily examined the surrounding rock deformation and lining cracking mechanisms following the geological causes and construction quality, in accordance with prior research [33].
(1)
High Geostress
Surrounding rock strength is a crucial design factor in tunnel engineering, since it directly affects the load borne by the supporting structure and the overall stability of the tunnel. The maximum buried depth of tunnel No.1 is 260 m, and the mudstone in the area was mostly grades V and VI due to weathering. The uniaxial saturated compressive strength of the surrounding rock was 11.8–24.2 MPa based on laboratory tests and field surveys, and the maximum horizontal primary stress and vertical stress were around 3.0-3.6 MPa and 4.1–5.1 MPa, respectively. The surrounding rock stress was not uniform due to a strength–stress ratio of 4.0–5.9, and some areas were impacted by high geostress [20,34].
(2)
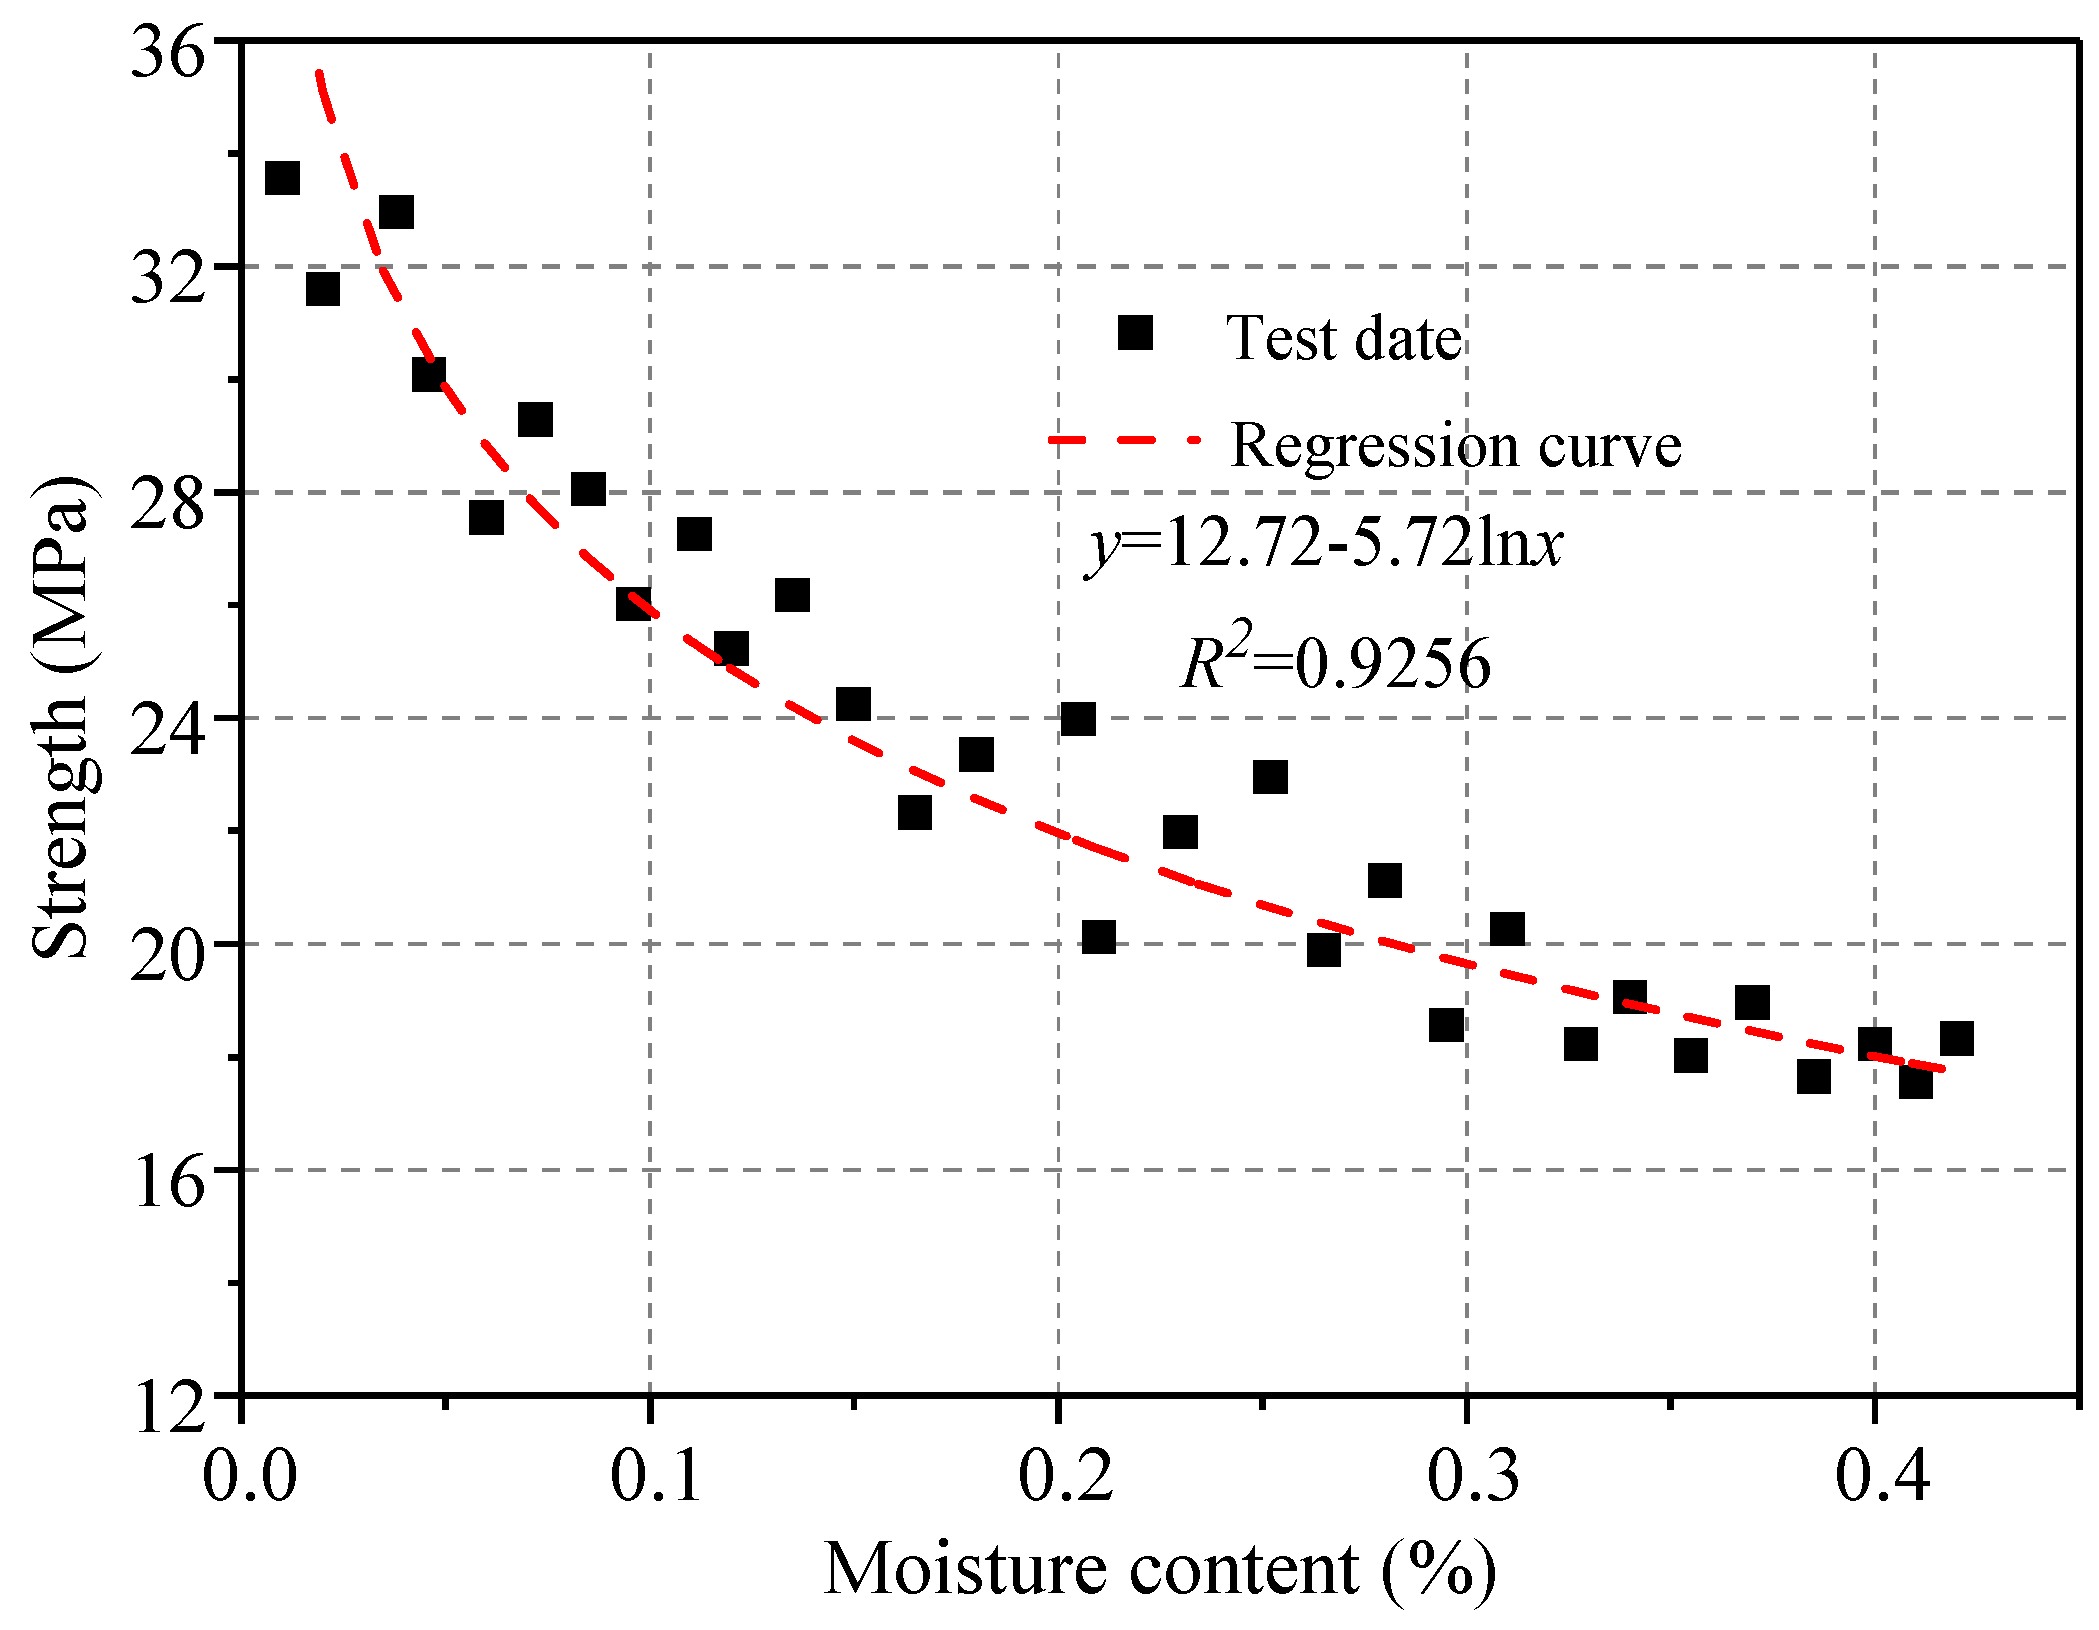
Surrounding Rock Expansive Property
In the dry season, the groundwater runoff modulus was 2.28–7.32 L/s/km2, while in the rainy season, it was 4.85–9.58 L/s/km2. Field research revealed that the comparatively developed layered structure and fissures in the tunnel site served as a seepage channel for groundwater. The volume of surrounding rock can expand, and its strength deteriorates due to the rock–water physicochemical reaction, which can easily induce large deformations in the surrounding rock and the cracking of the lining concrete [35,36]. On both sides of the damaged tunnel section, four cores were drilled for laboratory experiments to determine the mineral composition and expansion [37,38]. The equipment for water injection into the specimen and the loading system is shown in Figure 4. The mineral composition and dilatability results are displayed in Table 2, while Figure 5 displays the degradation characteristics of mudstone, i.e., the uniaxial compressive strength (UCS) with different masses of water content.
According to Table 2, the mineral compositions of the mudstones were essentially the same. The clay minerals were mainly illite, followed by kaolinite, chlorite and montmorillonite, which are easily capable of causing mudstone expansion. The laboratory test results showed that the expansion rate of the four cores were 8.96%, 6.59%, 4.27% and 4.56%, respectively, which are not conducive to the stability of the surrounding rock. Figure 5 shows that the strength of mudstone steadily decreased with the increase in the moisture content. When the moisture content was less than 0.05, the strength was close to the dry strength. The strength tended to be stable when the moisture content was greater than 0.3, and the mudstone’s average strength dropped by 41.18%. Thus, the stability of the surrounding rock and the safety of the tunnel could be threatened as a result of groundwater cause swelling in the rock and damaging the strength of the mudstone.
(3)
Layered Joint Structure
The majority of the surrounding rock was moderately weathered mudstone with developed joints and layered structures, which intensified the stress inhomogeneity of the surrounding rock on both sides. It was easy to cause slippage and significant rock deformation along the joint surface during construction. Additionally, the surrounding rock with a layered structure had the tendency to slide and separate along the joint’s surface under the influence of high geostress, which aggravated the risk of the asymmetric distribution of surrounding rock deformations and lining cracking [19,22,39]. The deformation distribution and development features of the stratified surrounding rock were calculated and analyzed using the discontinuous deformation analysis (DDA) algorithm. There were primarily two sets of joints in the tunnel site region, as evidenced by the rock composition determined through geological inquiry and construction (see Table 3 for joint parameters). Table 4 displays the mechanical parameters of the block and interface in the model. The model dimensions were X × Y = 70 m × 70 m, to consider the full extent of tunnel excavation disturbance. The initial stress applied to the upper boundary of the model was chosen from the weight of the overlying soil. The upper boundary was treated as a free boundary during calculation, while the horizontal displacement of left and right boundary and the vertical and horizontal displacement of the bottom boundary were constrained. The model is depicted in Figure 6.
Figure 7 depicts the deformation development in the surrounding rock and lining with the calculation stage (S). In order to intuitively observe the evolution of lining and surrounding rock deformations with the increase in calculation steps (S), Figure 7b–f only shows the deformations in the lining and surrounding rock contained in the red box in Figure 7a.
Figure 7 shows that the rock block sliding and extrusion along the joint plane and the block caving of the lining structure were the primary manifestations of the instability of the tunnel structure. With the increase in calculation steps (S), the deformation of the surrounding rock and lining increased gradually. The surrounding rock block had not moved in the initial state, and the rock and tunnel were in a stable state, as shown in Figure 7a. The block system has no displacement, and the overall deformation of the surrounding rock and lining was small when S = 300. As shown in Figure 7c, the side walls of the tunnel, which were affected by the layer joint structure, clearly displayed an asymmetric distortion on both sides. The block on the right side wall first loosened when S = 600. The rock and lining block surrounding the right spandrel began to loosen as the calculation step (S) increased due to the slipping and spalling of the block at the side wall position (see Figure 7d). The deep rock blocks started sliding along the joint plane as construction progressed, and the rock deformation around the tunnel rose quickly. The rock mass on both sides clearly exhibited asymmetric deformation, and the lining blocks around the spandrel spall under the extrusion action of the rock blocks (see Figure 7e). When S = 1500, the surrounding rock deformation tended to stabilize. The overall displacement of the rock mass was largest on right side, which induced an instability in a wide range of the rock block and a spalling of the lining block. On the contrary, the overall deformation on the left side of the tunnel was small, and there was no obvious slip or collapse between the surrounding rock and lining structure block. Finally, the maximum horizontal displacement of the right side wall reached 235 mm, which was 40 mm larger than the left side wall. This leads the lining displaying asymmetric deformation and cracking on both sides, which fits with the actual disaster situation in the field.
(4)
Construction Deficiency in Supporting Structure and Lining
It was discovered that the steel arch frames were arranged in a non-uniform way with larger spacing in the area of the disaster, which caused an unequal stiffness and deformation along the longitudinal of the tunnel. Field measurements revealed that the thickness of the concrete lining in the disaster zone was 0.05–0.08 m thinner than the design value, resulting in the insufficient strength and uneven stress of the lining structure, which was a major factor in the lining cracking.

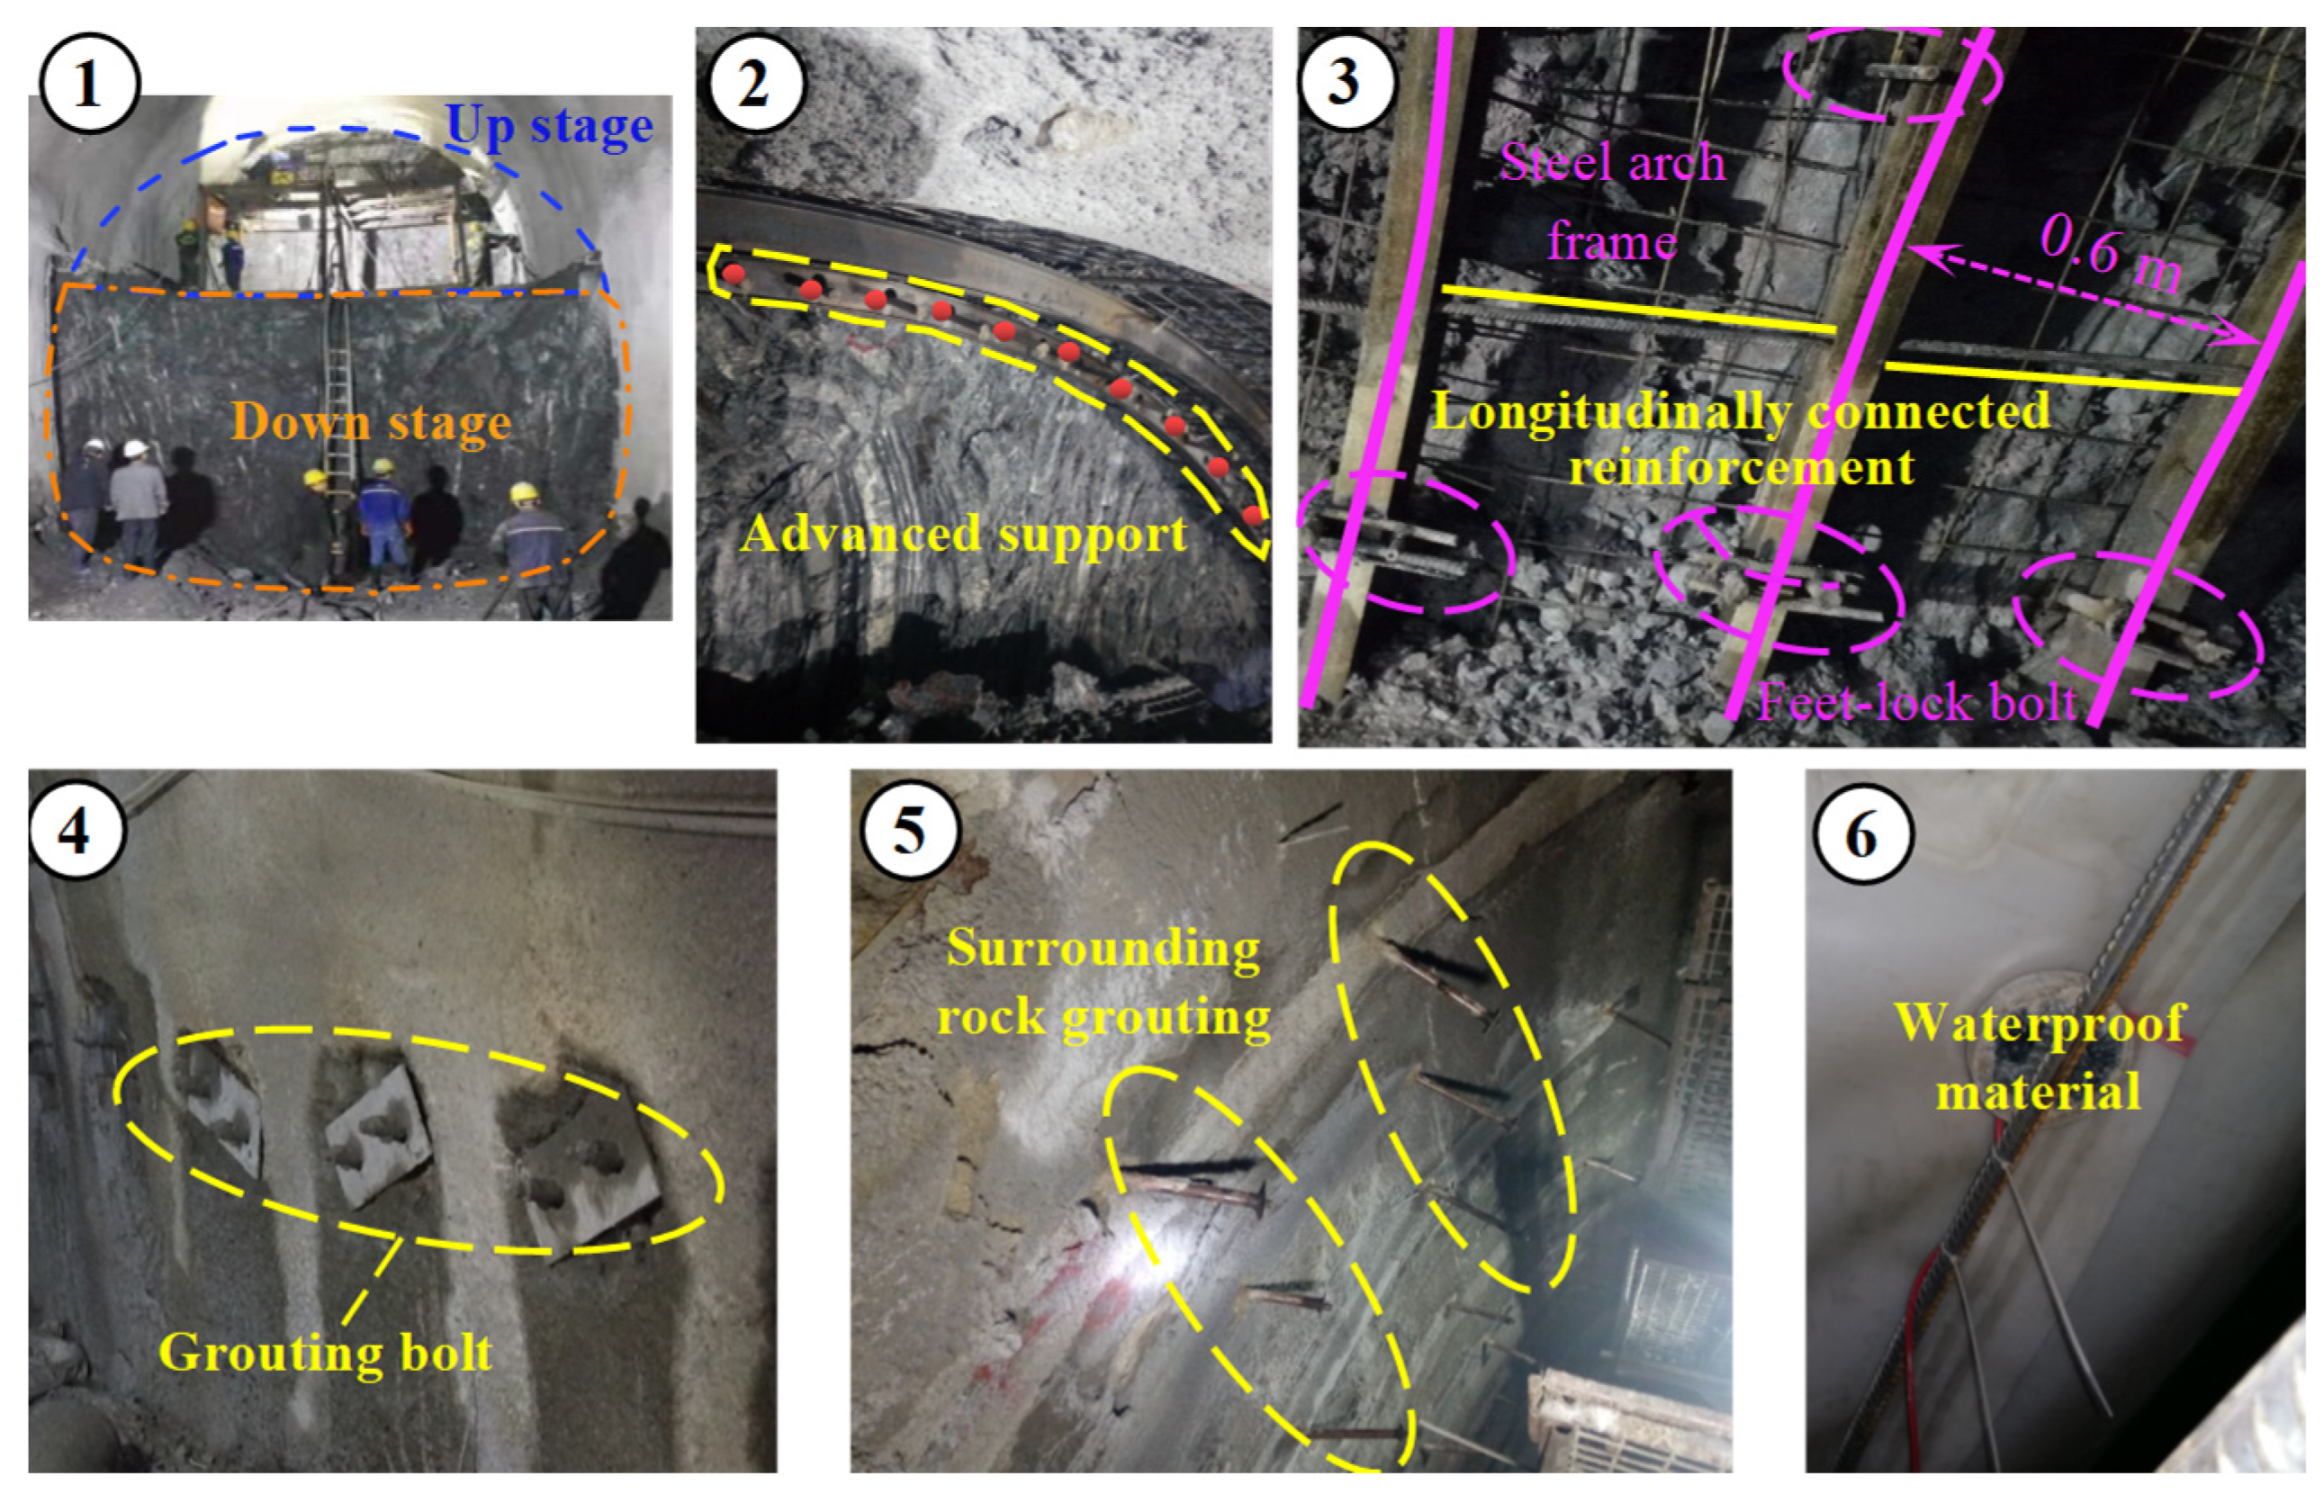
3.3. Control Measures

The following specific control measures were suggested in conjunction with an analysis of the disaster-causing mechanisms in the engineering literature: (1) According to the existing engineering experience [40,41,42], the full-section excavation should be converted into a bench excavation with a bench length, L, of 4 m. (2) To increase the integrity of the surrounding rock, advanced support techniques such as grouting pipe sheds should be used. (3) To increase the overall stiffness and stability of support structure, the space between the steel arches should be reduced from 1 m to 0.6 m, and locking bolts and longitudinal reinforcement bars should be added. (4) The grouting bolt should be positioned vertically to the layered joint surface to enhance the integrity of the surrounding rock. (5) To improve the bonding between the joint surface and the integrity of the rock mass, the surrounding rock should be grouted with a grouting pressure of 2 MPa. (6) Waterproof material should be laid before pouring the lining structure to prevent pore water from seeping into the secondary lining concrete. Meanwhile, the lining concrete should be poured following the design exactly, and subsequent maintenance should be performed correctly. The surrounding rock reinforcement and supporting structure construction on-site are shown in Figure 8.

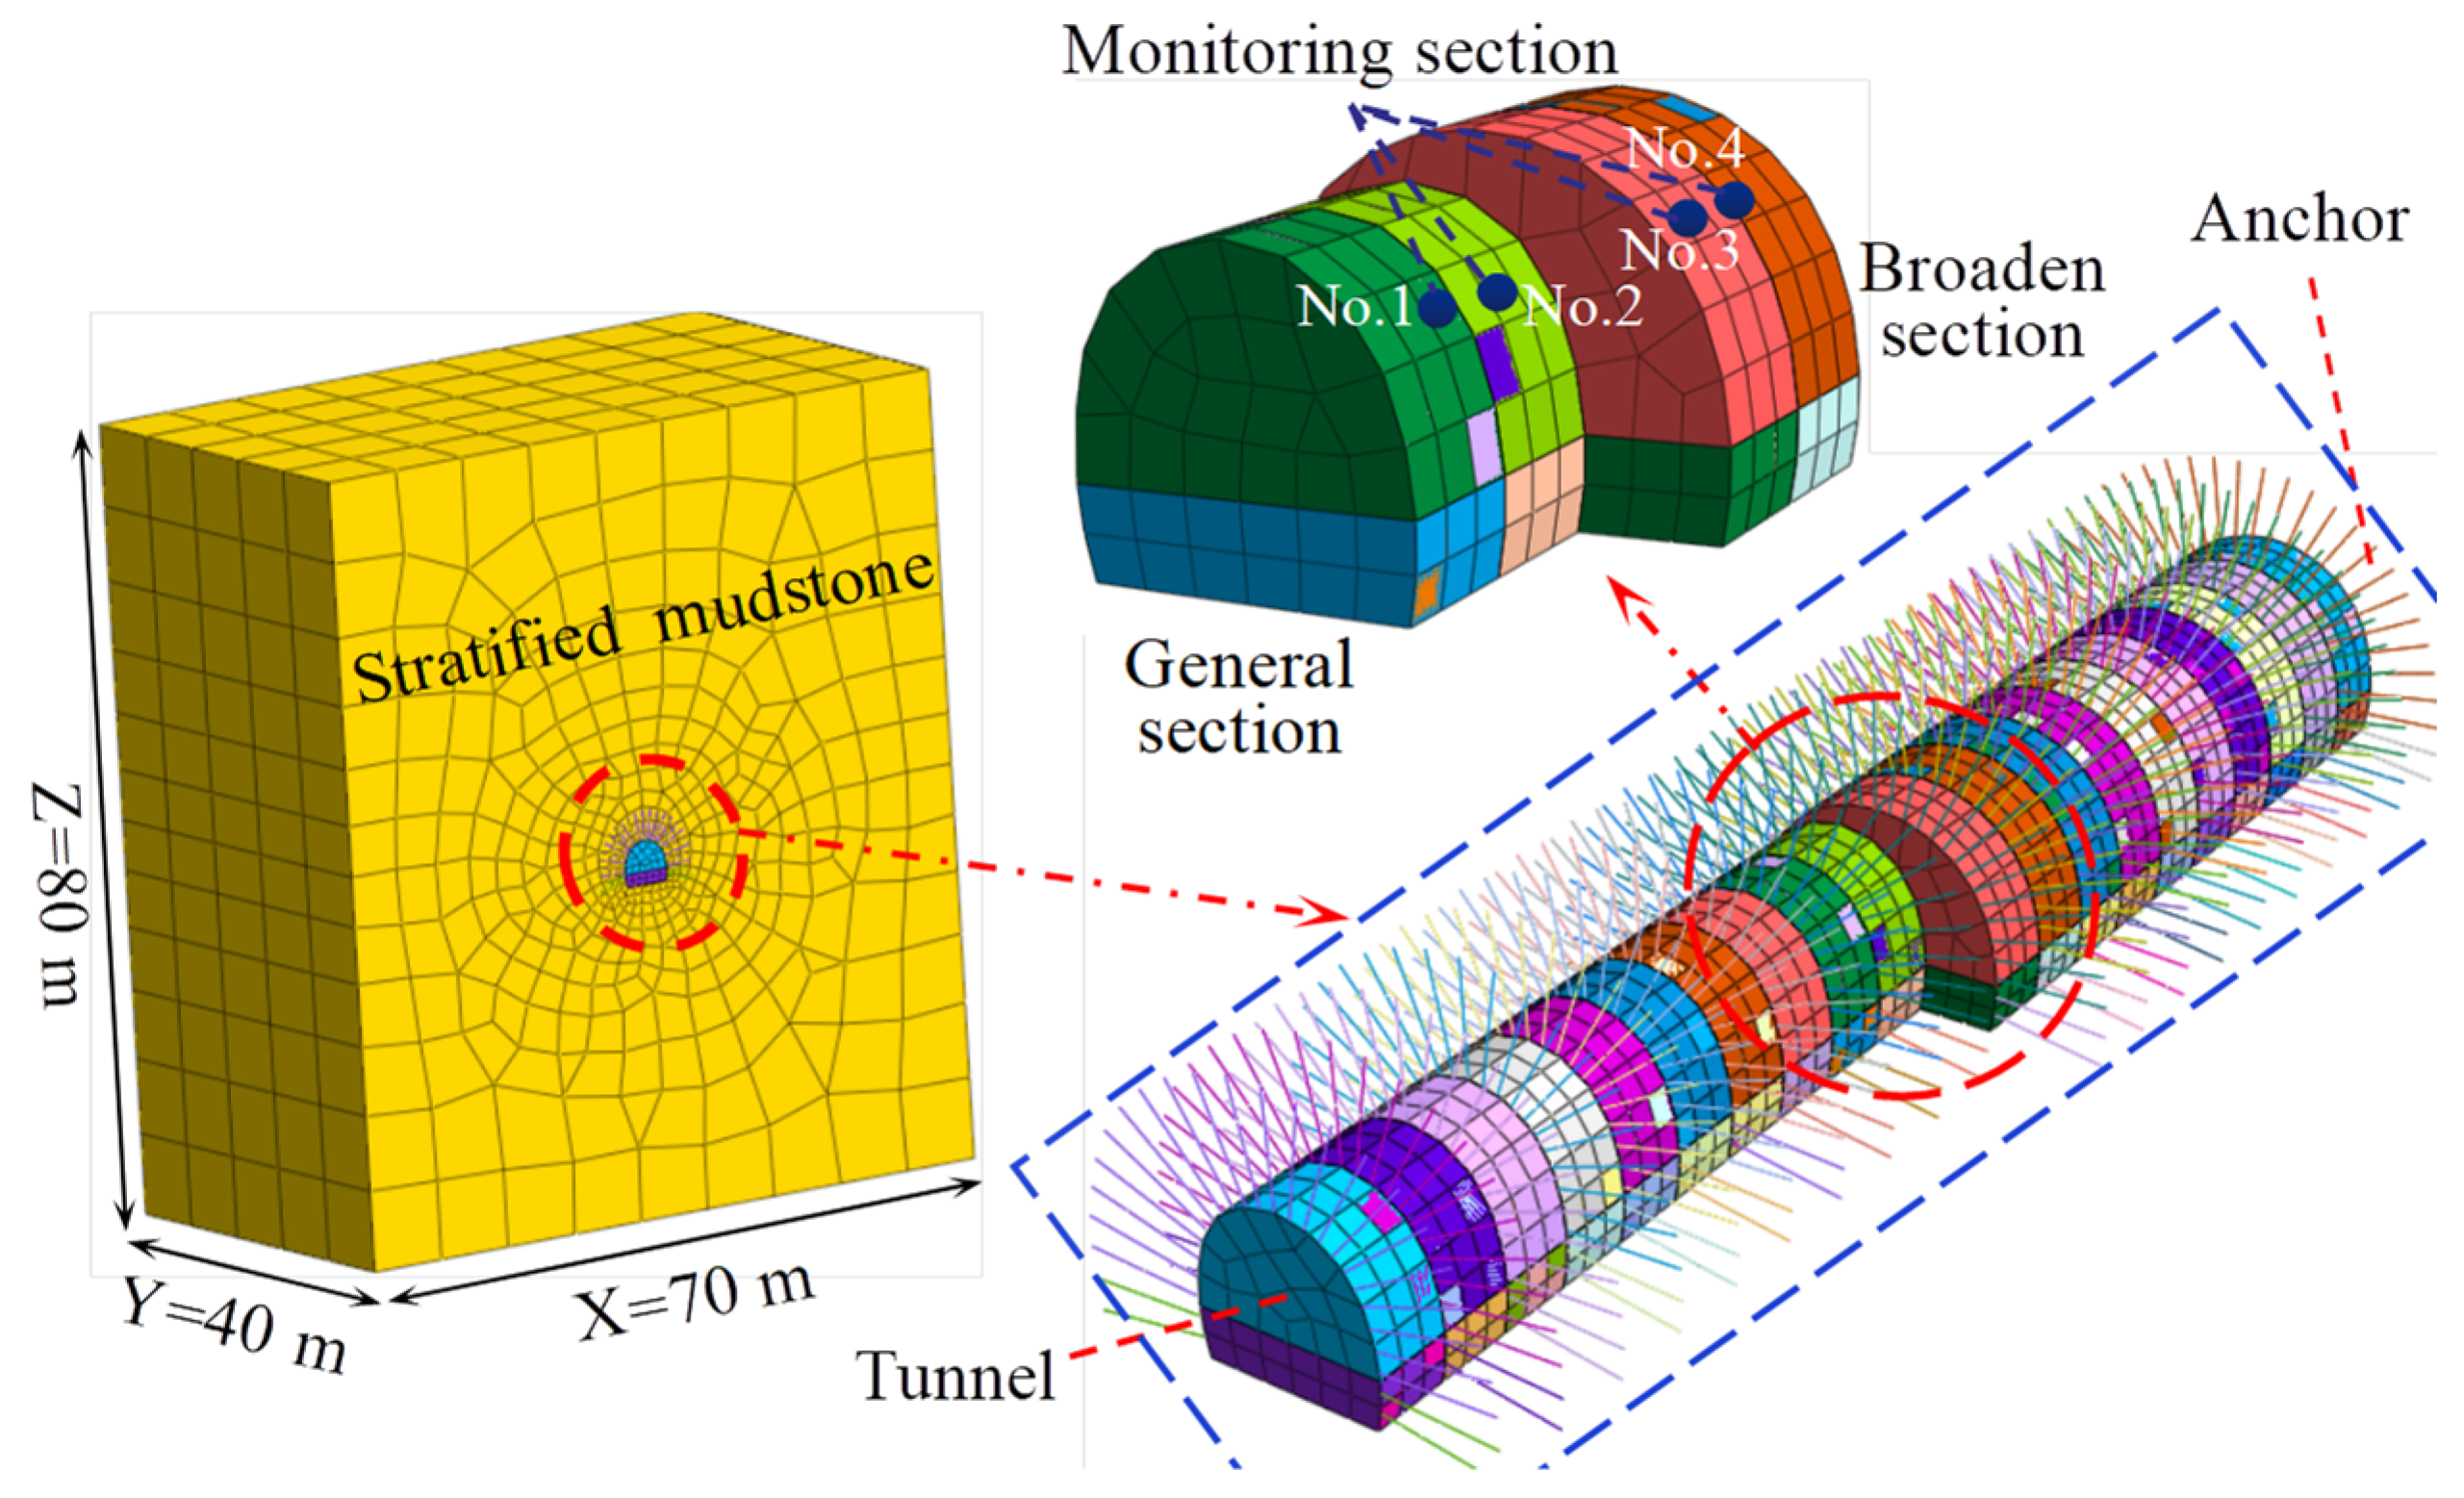
4. Numerical Modeling

4.1. Model Building and Parameters

Targeted control measures were suggested in this study together with the disaster characteristics and the disaster-causing mechanism analysis discussed above. To verify the effectiveness of the proposed measures, the deformation and stress of the surrounding rock and secondary lining under the reinforcing scheme were simulated and analyzed through the Midas GTS/NX software, a specialized finite element program in geotechnical engineering [43]. Fully considering the influence range of the tunnel excavation to guarantee the accuracy and effectiveness of the calculation results, the specific model dimensions were X = 70 m, Y = 40 m and Z = 80 m, which were divided into 80543 units and 53286 nodes. Mixed hexahedron mesh elements were used for the simulation of the surrounding rock, while elastic plate elements were used to model the initial support and secondary lining, as shown in Figure 9. The upper boundary was treated as a free boundary during calculations, while the horizontal displacement of the left and right boundary and the vertical and horizontal displacement of the bottom boundary were constrained. During the calculation process, a deformation criterion (1 × 10⁻⁶ m) was used to ensure the finite element calculation results were converged. After the calculation, the deformation and stress evolution laws of the surrounding rock and supporting structure were analyzed. In addition, the finite element software used in this study had GPU acceleration options, the computer processor was i7-8700 3.20 GHz and the graphics card model was NVIDIA GeForce GTX 1050 Ti, which could meet the calculation requirements of the numerical model. The soil parameters were obtained through laboratory testing and data from geological surveys (see Table 1), and the parameters of the reinforcement material are displayed in Table 5.

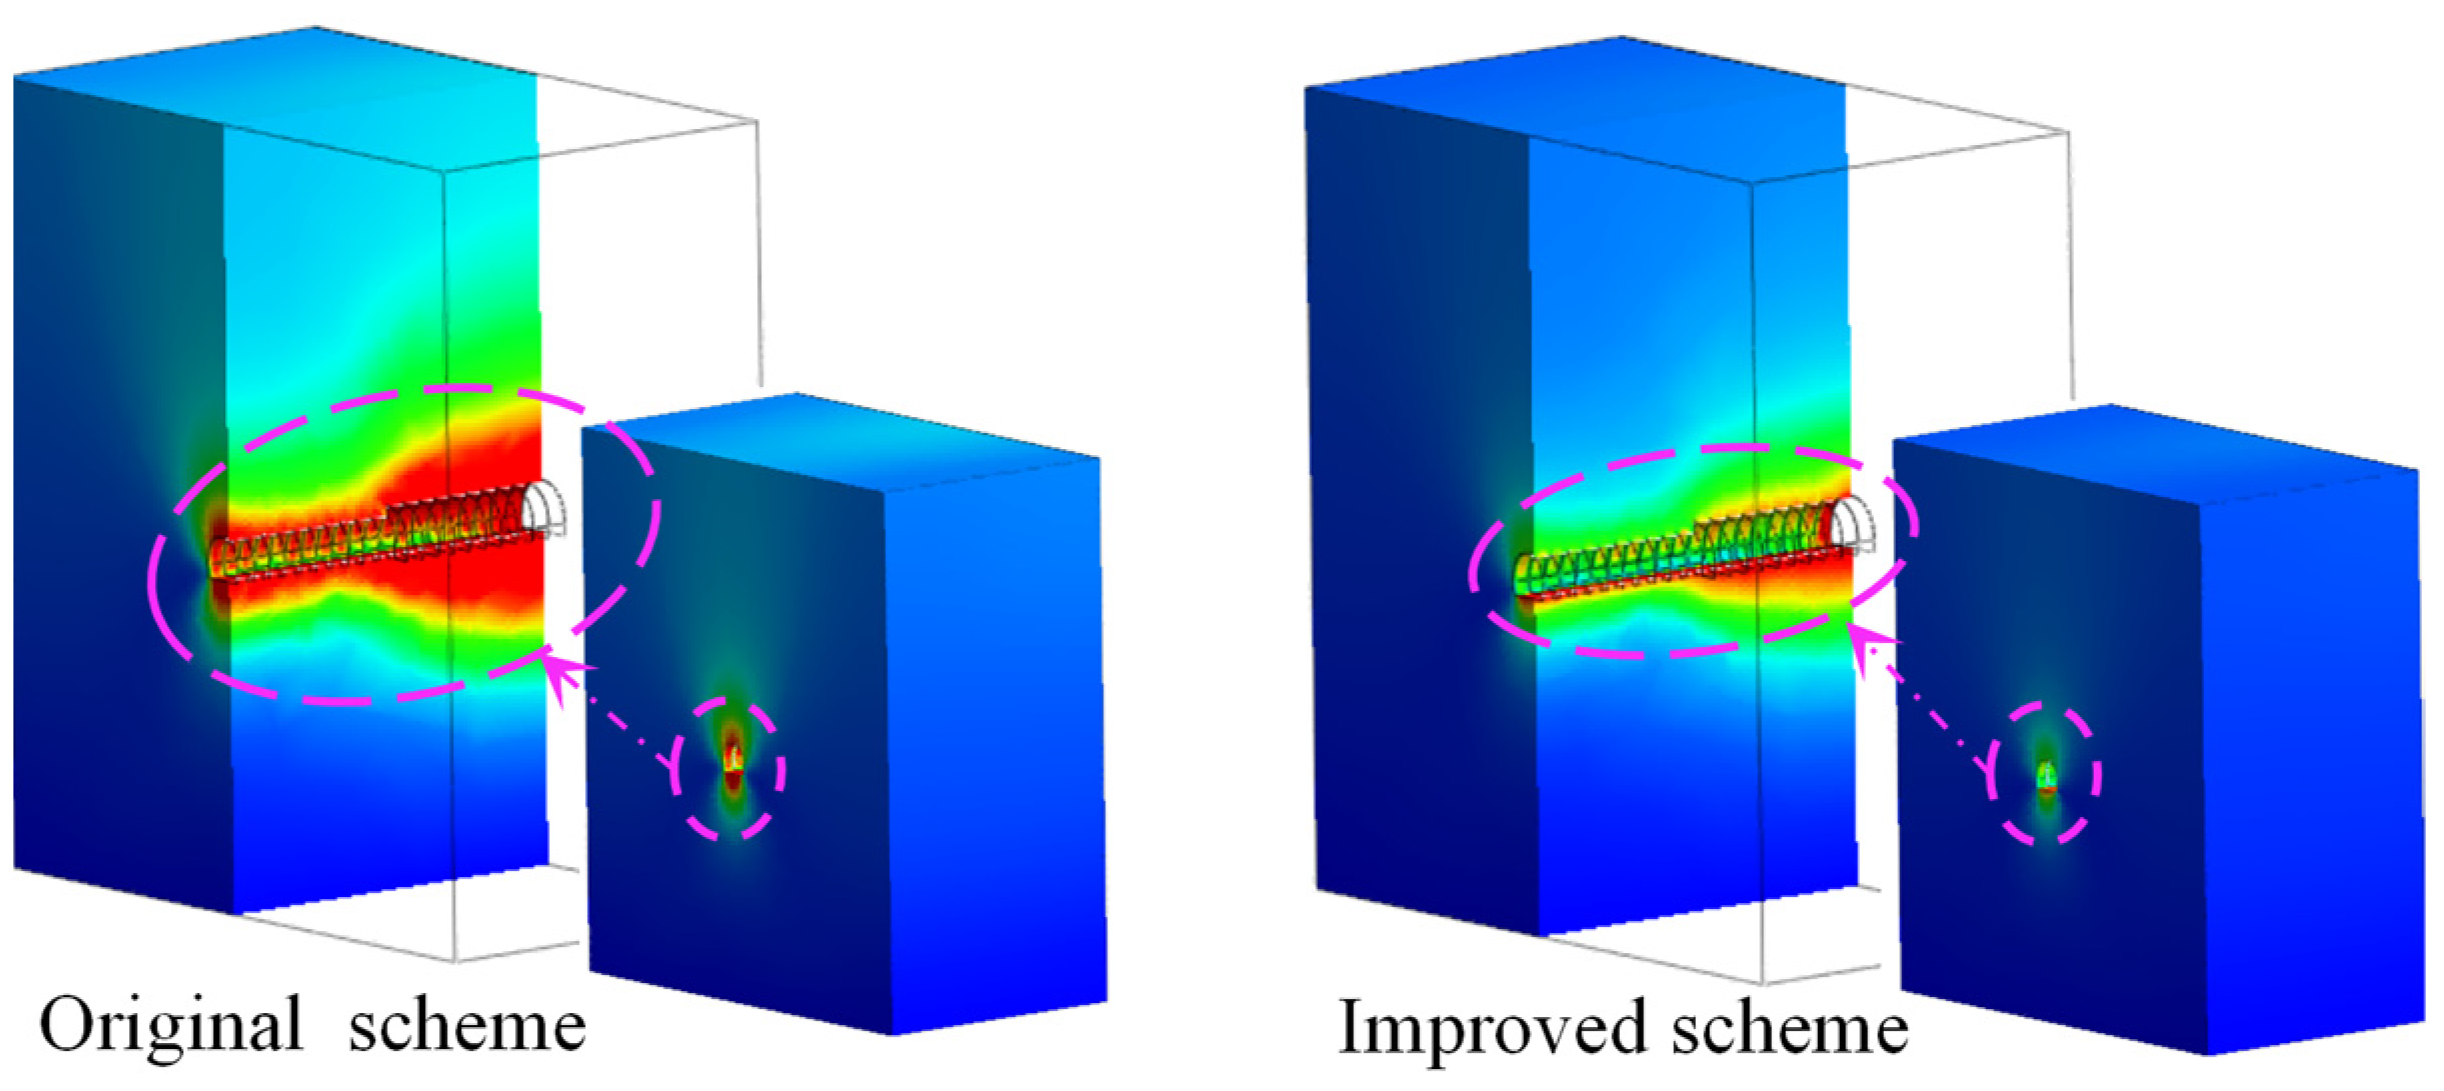
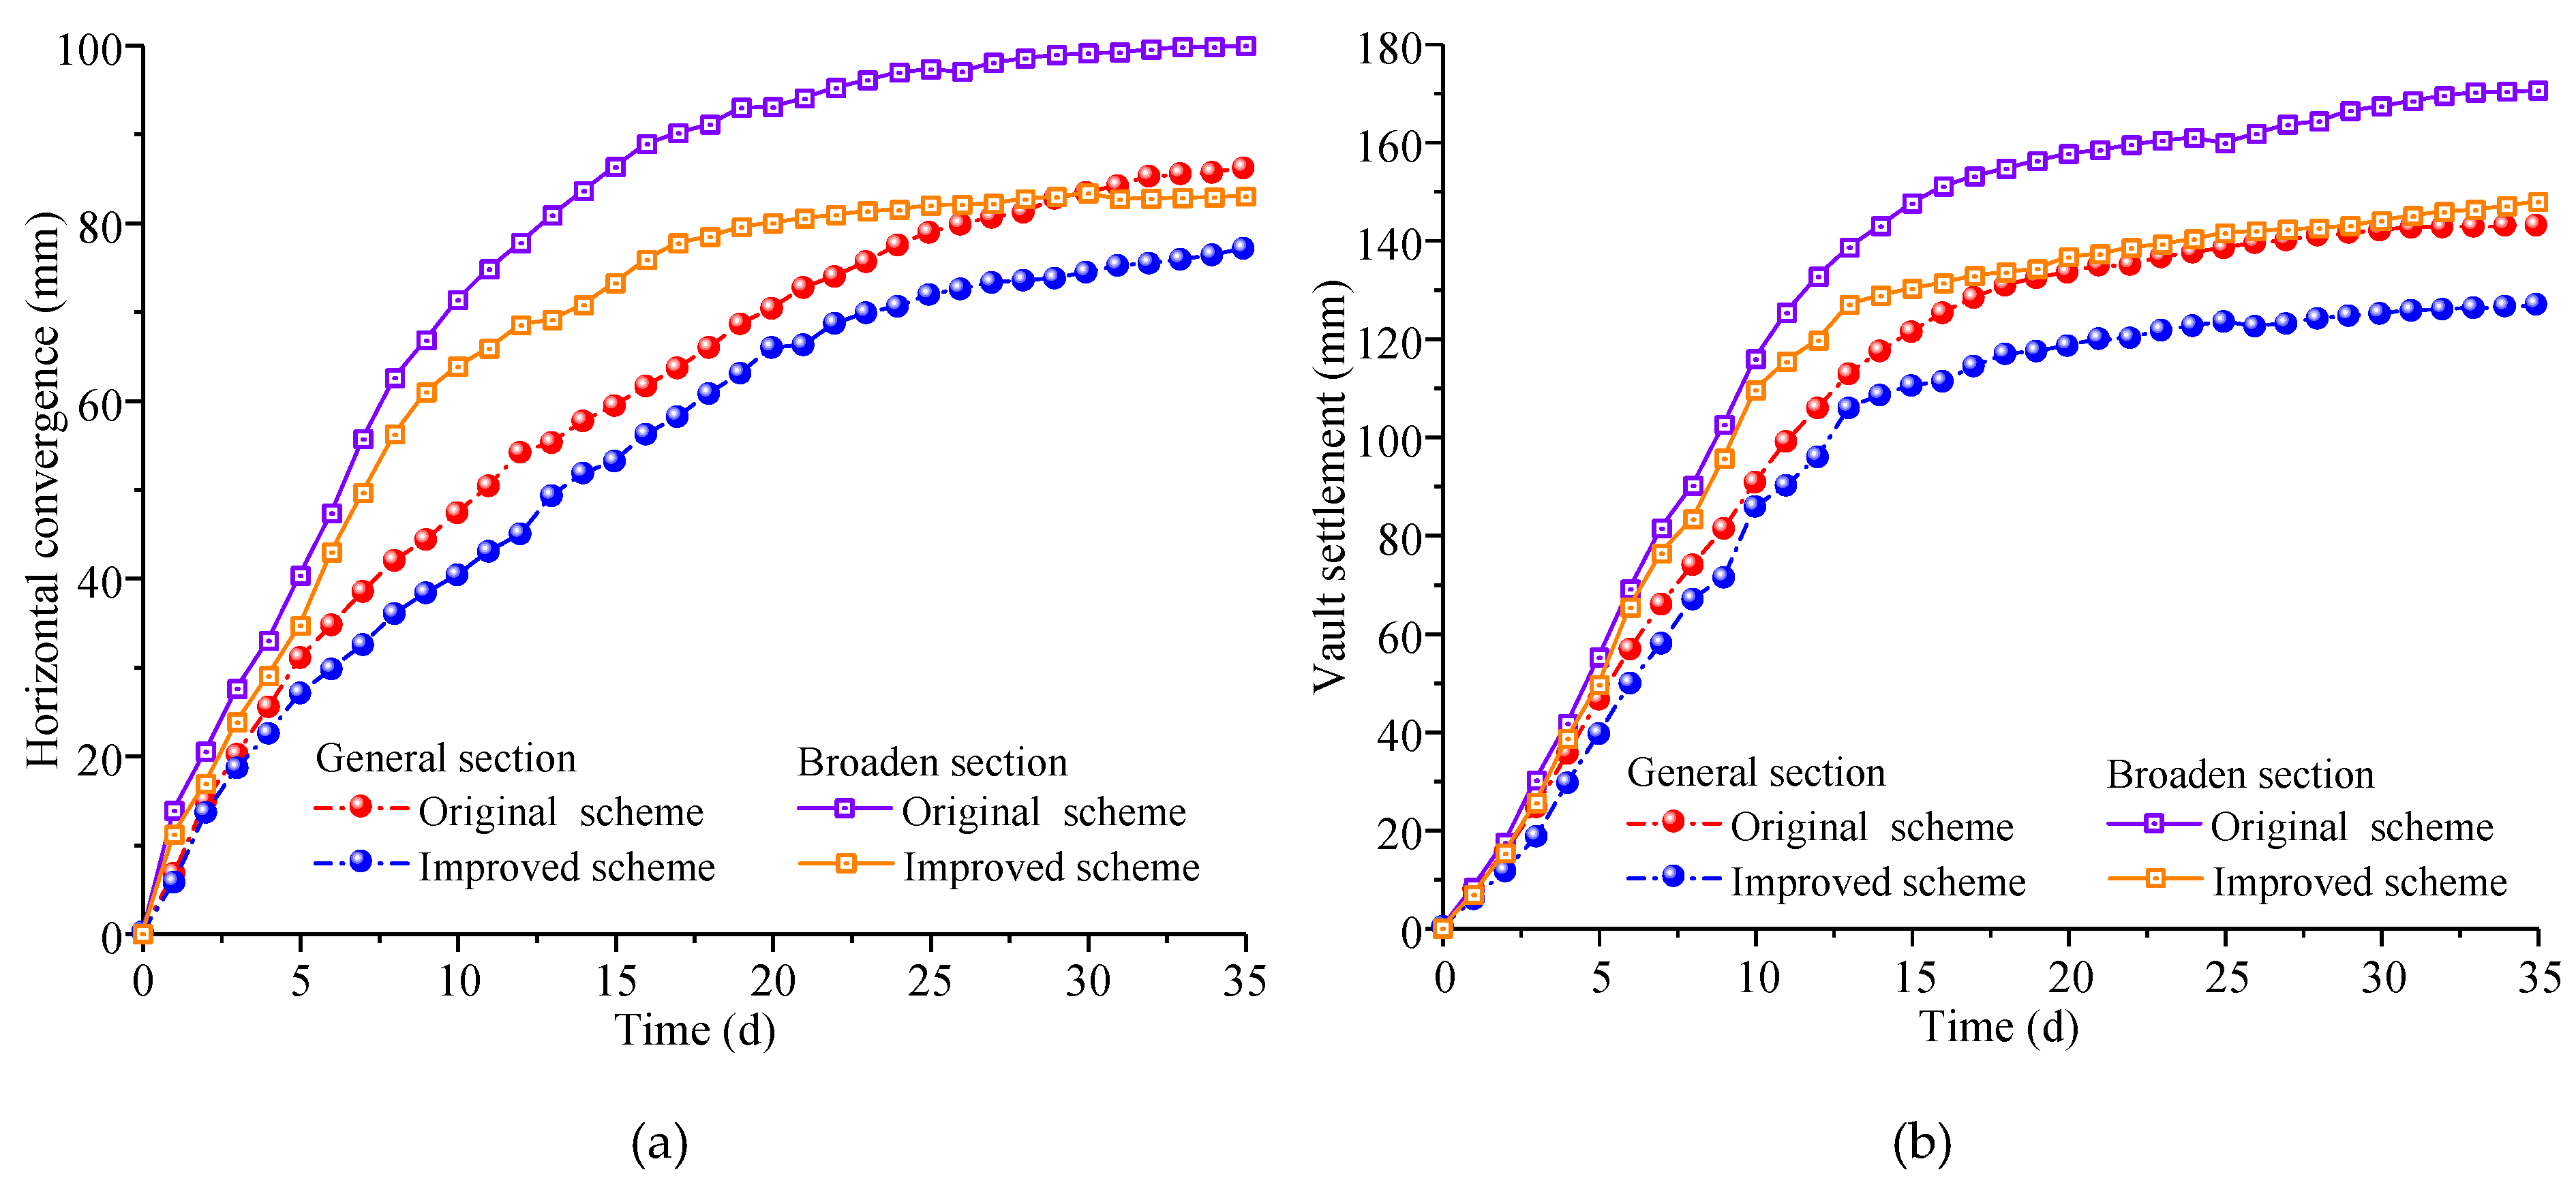
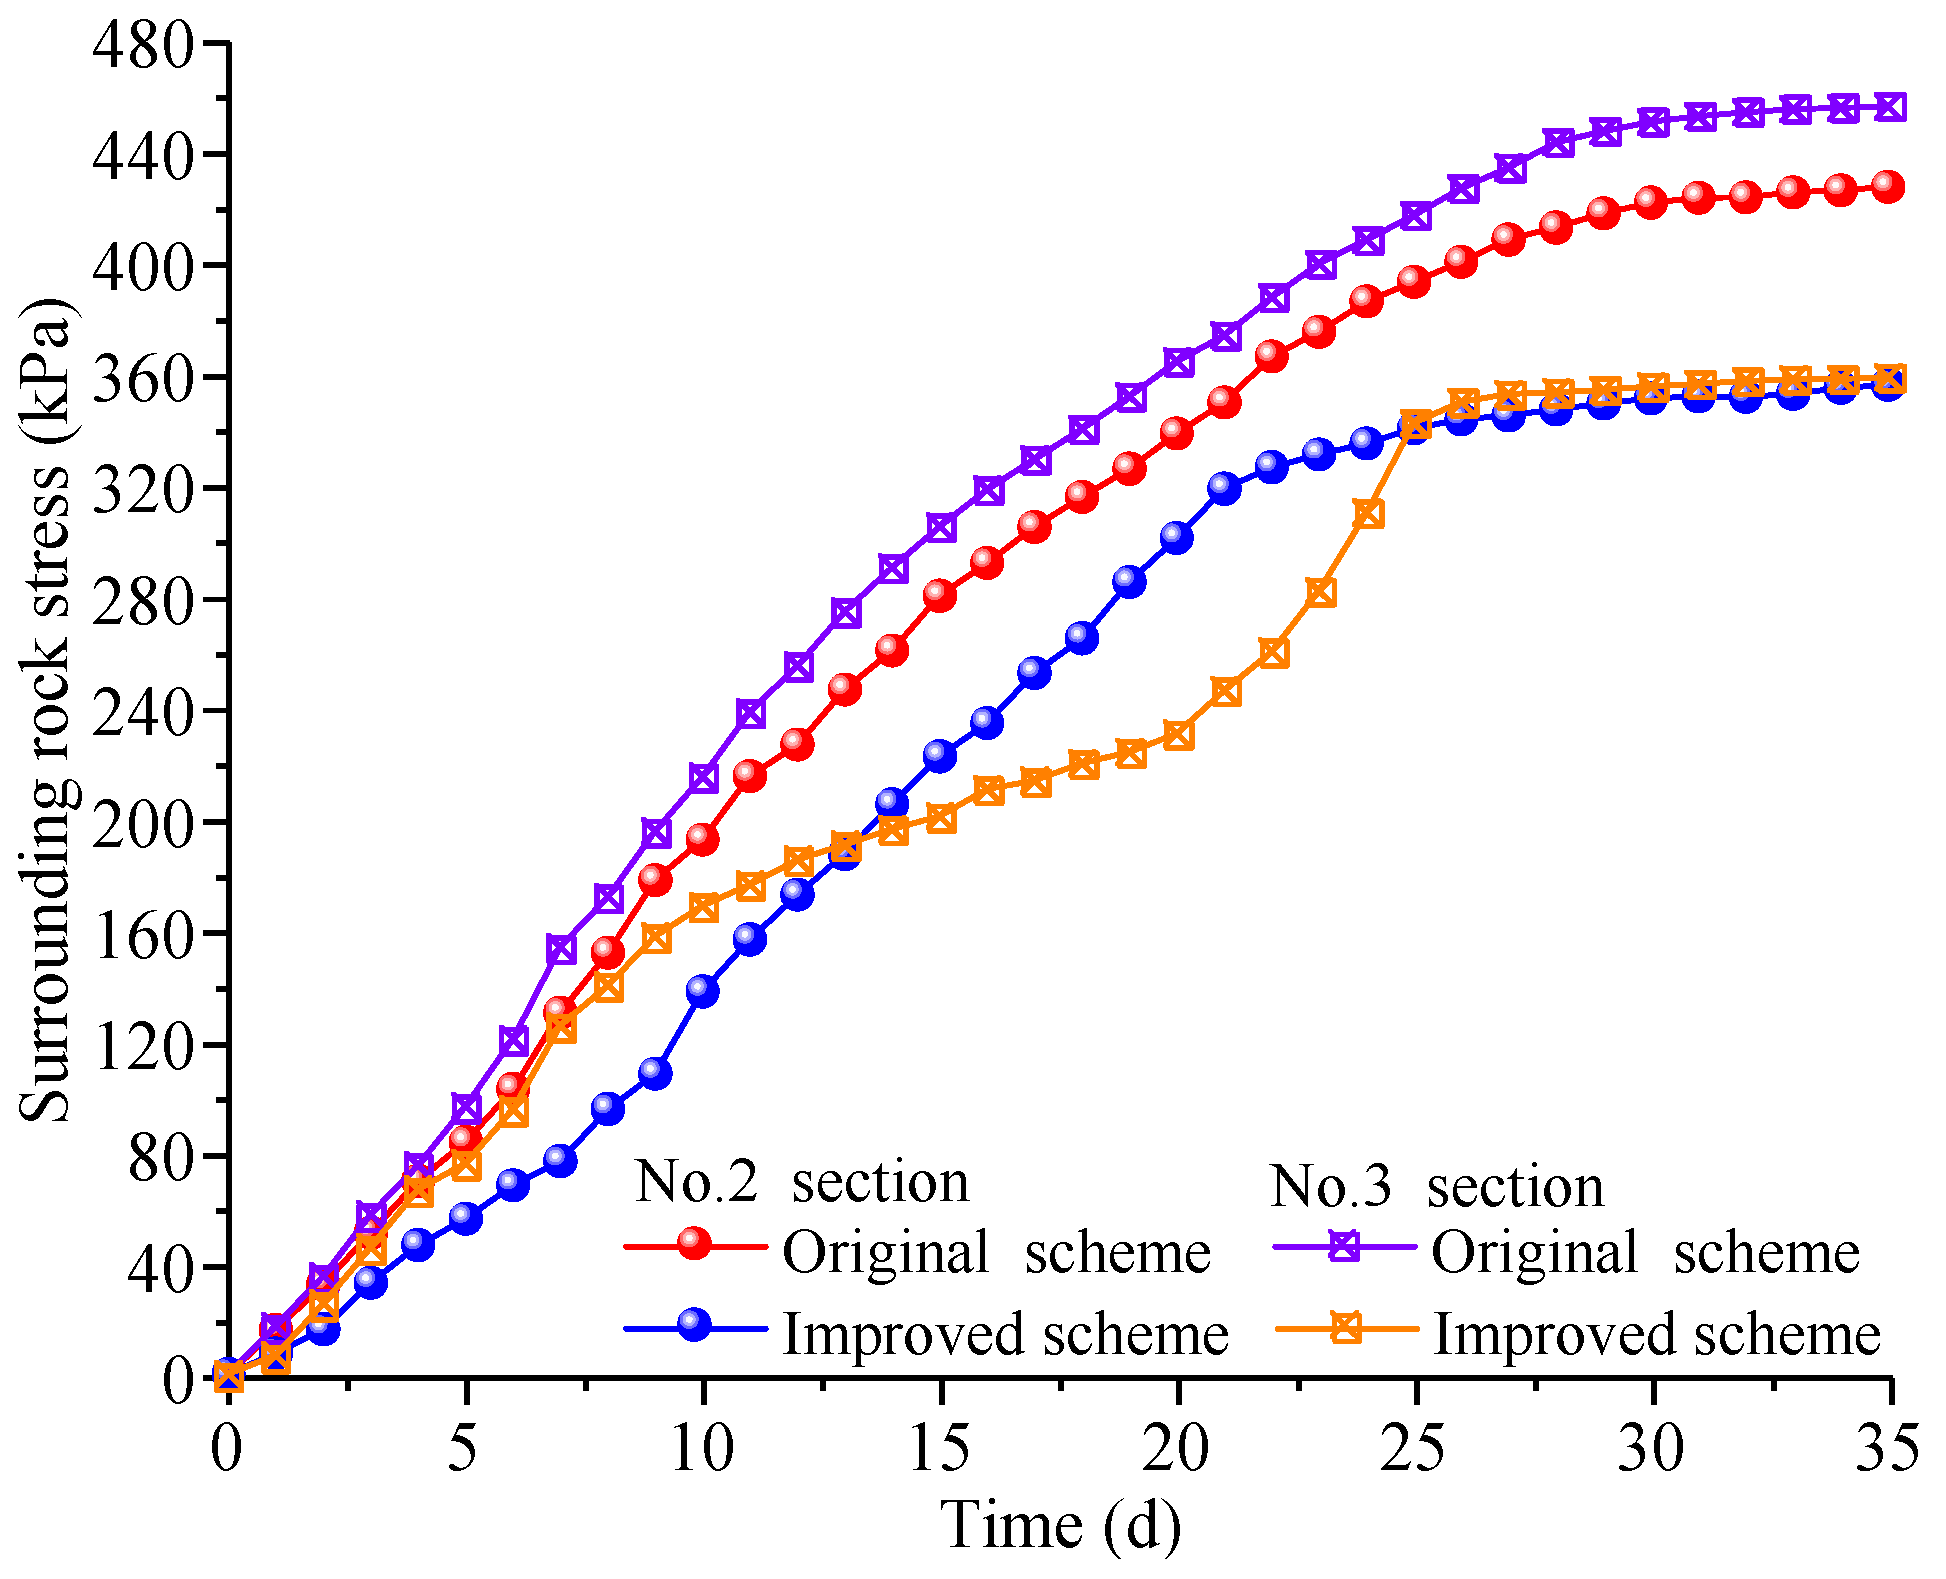
4.2. Results Analysis

(1)
Analysis of Surrounding Rock Deformation
The plastic zone was the area where the shear stress exceeded the rock shear strength. Figure 10 displays the plastic zone cloud charts of the surrounding rock. The simulation results of horizontal convergence and vault settlement about the surrounding rock is depicted in Figure 11.
By comparing Figure 10 and Figure 11, it was discovered that the development of the plastic zone and deformation under the two schemes were similar, and the deformation value dropped under the improved construction scheme. Figure 10 shows that the deformation response region significantly decreased, particularly in the broadened section, and the plastic zone at the vault was tightly controlled. According to Figure 11, the improved building strategy resulted in a large reduction in the cumulative deformation, whereas the surrounding rock deformation increased sharply in the early stages. The deformation rate and cumulative value of the two kinds of deformation rose during the excavation of the broadened section as the tunnel was excavated from the general section in the direction of the broadened section. It was shown from Figure 11a that the cumulative convergence of the two kinds of section in the first 10 days under the improved construction scheme were 40.27 mm and 63.82 mm, respectively. These values decreased by 14.81% and 10.53%, respectively, compared to those of the original scheme. Similarly, the cumulative vault settlement in the first 10 days was 85.66 mm and 109.54 mm, respectively, this value dropped by 5.52% and 5.49%, respectively, compared to those of the original scheme (see Figure 11b). After the excavation, the rock deformation first tended to remain stable under the improved scheme due to the improvement in the surrounding rock integrity and support structure strength. Finally, the cumulative convergence deformation of the two kinds of section under the improved scheme were 77.11 mm and 82.99 mm, respectively, and the values of cumulative settlement were 126.98 mm and 147.89 mm, respectively. The two deformations in the broadened section were greater than those in the general section. Additionally, compared to the original construction scheme, the convergence deformation of the two sections was reduced by 10.53% and 16.95% under the improved construction measures. Additionally, the values of vault settlement were 11.28% and 13.29%, respectively. Two kinds of deformations both demonstrated that the construction improvement strategies suggested in this study could efficiently reduce the significant deformation of the surrounding rock in tunnels in layered soft rock stratum.
(2)
Analysis of Surrounding Rock Stress
From the analysis in Section 4.2, (1), it was known that the deformation of surrounding rock near the variable section was more significant. According to the monitoring section marked in Figure 9, the variation in the maximum surrounding rock stress with time at monitoring section No. 2 and No. 3 was selected for analysis. The results are shown in Figure 12.
Figure 12 shows that the surrounding rock stress at the two monitoring sections continues to increase rapidly under the original construction scheme, and the cumulative value in the broadened section was noticeably higher than that in the general section. After the construction measures were improved, the surrounding rock stress increased rapidly in the first 12 days. When the support measures took effect and began to bear the load, they slowed the rate of the deformation and stress increase in the surrounding rock. The cumulative stress of the two sections on the 12th day, after the enhancement in the construction measures, was 72.68% and 73.96%, respectively, of the values under the original construction scheme. The stress continued to increase under the disturbance of the subsequent construction in the broadened section, while the rate of increase decreased after the supporting structure was applied. When construction was completed, the surrounding rock stress stabilized gradually under the improved scheme, whereas it progressively increased under the original scheme. Finally, the total stress at the two monitoring sections reached 356.51 kPa and 359.14 kPa, respectively under improved scheme, a decrease of 40.04% and 21.36%, respectively, compared to the original construction scheme.
(3)
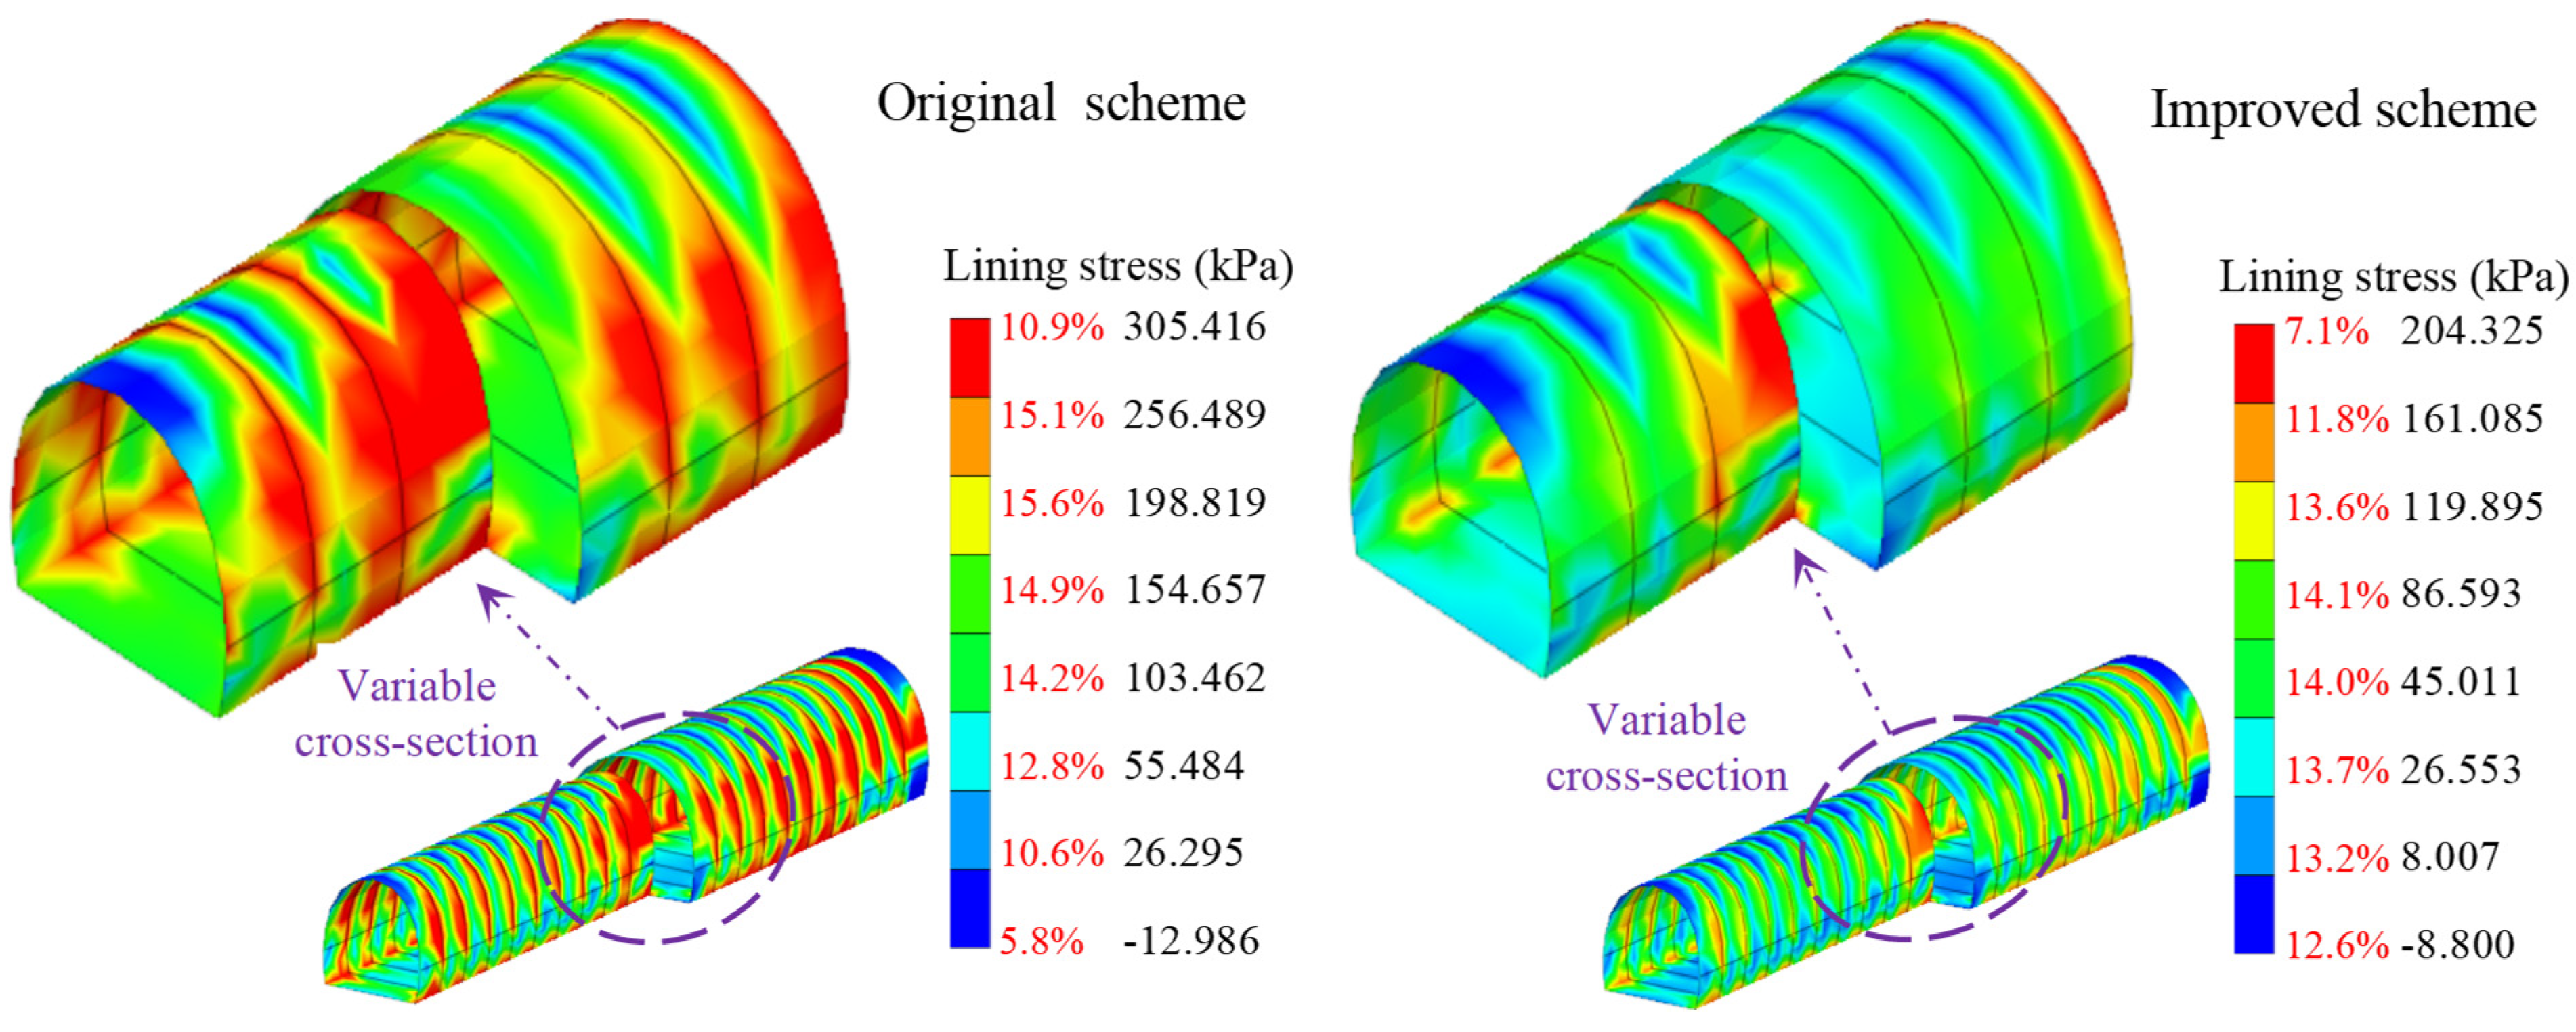
Analysis of Secondary Lining Stress
Figure 13 displays the stress cloud charts of the secondary lining under the two construction schemes.
Excavation unloading caused stress redistribution in the surrounding rock; Figure 13 shows that the stress distribution of the secondary lining was similar under the two construction schemes, while the stress obviously decreased after adopting the improved scheme. The vault was mostly subjected to tensile stress as a result of pressure from the surrounding rock, whereas the arch shoulder and arch waist were mainly subjected to compressive stress. Meanwhile, due to the geological eccentric compression and the excavation disturbance generated by different construction steps, there was an asymmetric distribution in the lining stress along the tunnel. In addition, the concentration of stress occurred at the variable cross-section, whereas the lining stress changed obviously, increasing the possibility of lining deformation and cracking. After excavation was completed, the maximum stress of the lining under the improved construction scheme was reduced by 33.16% compared with the original scheme, ensuring the safety of the secondary lining.

5. Monitoring

5.1. Arrangement of Measuring Points

Four monitoring positions were selected at 2 m and 6 m away the variable cross-section in both sections, where an earth pressure cell and multi-point displacement meter were embedded to monitor the stress and deformation of the surrounding rock. The layout of the monitoring stations, monitoring points and the installation of the components on-site are shown in Figure 14. During the tunnel construction, the stress and deformation of the surrounding rock and support structure were strictly monitored to ensure the construction safety.

5.2. Results Analysis

(1)
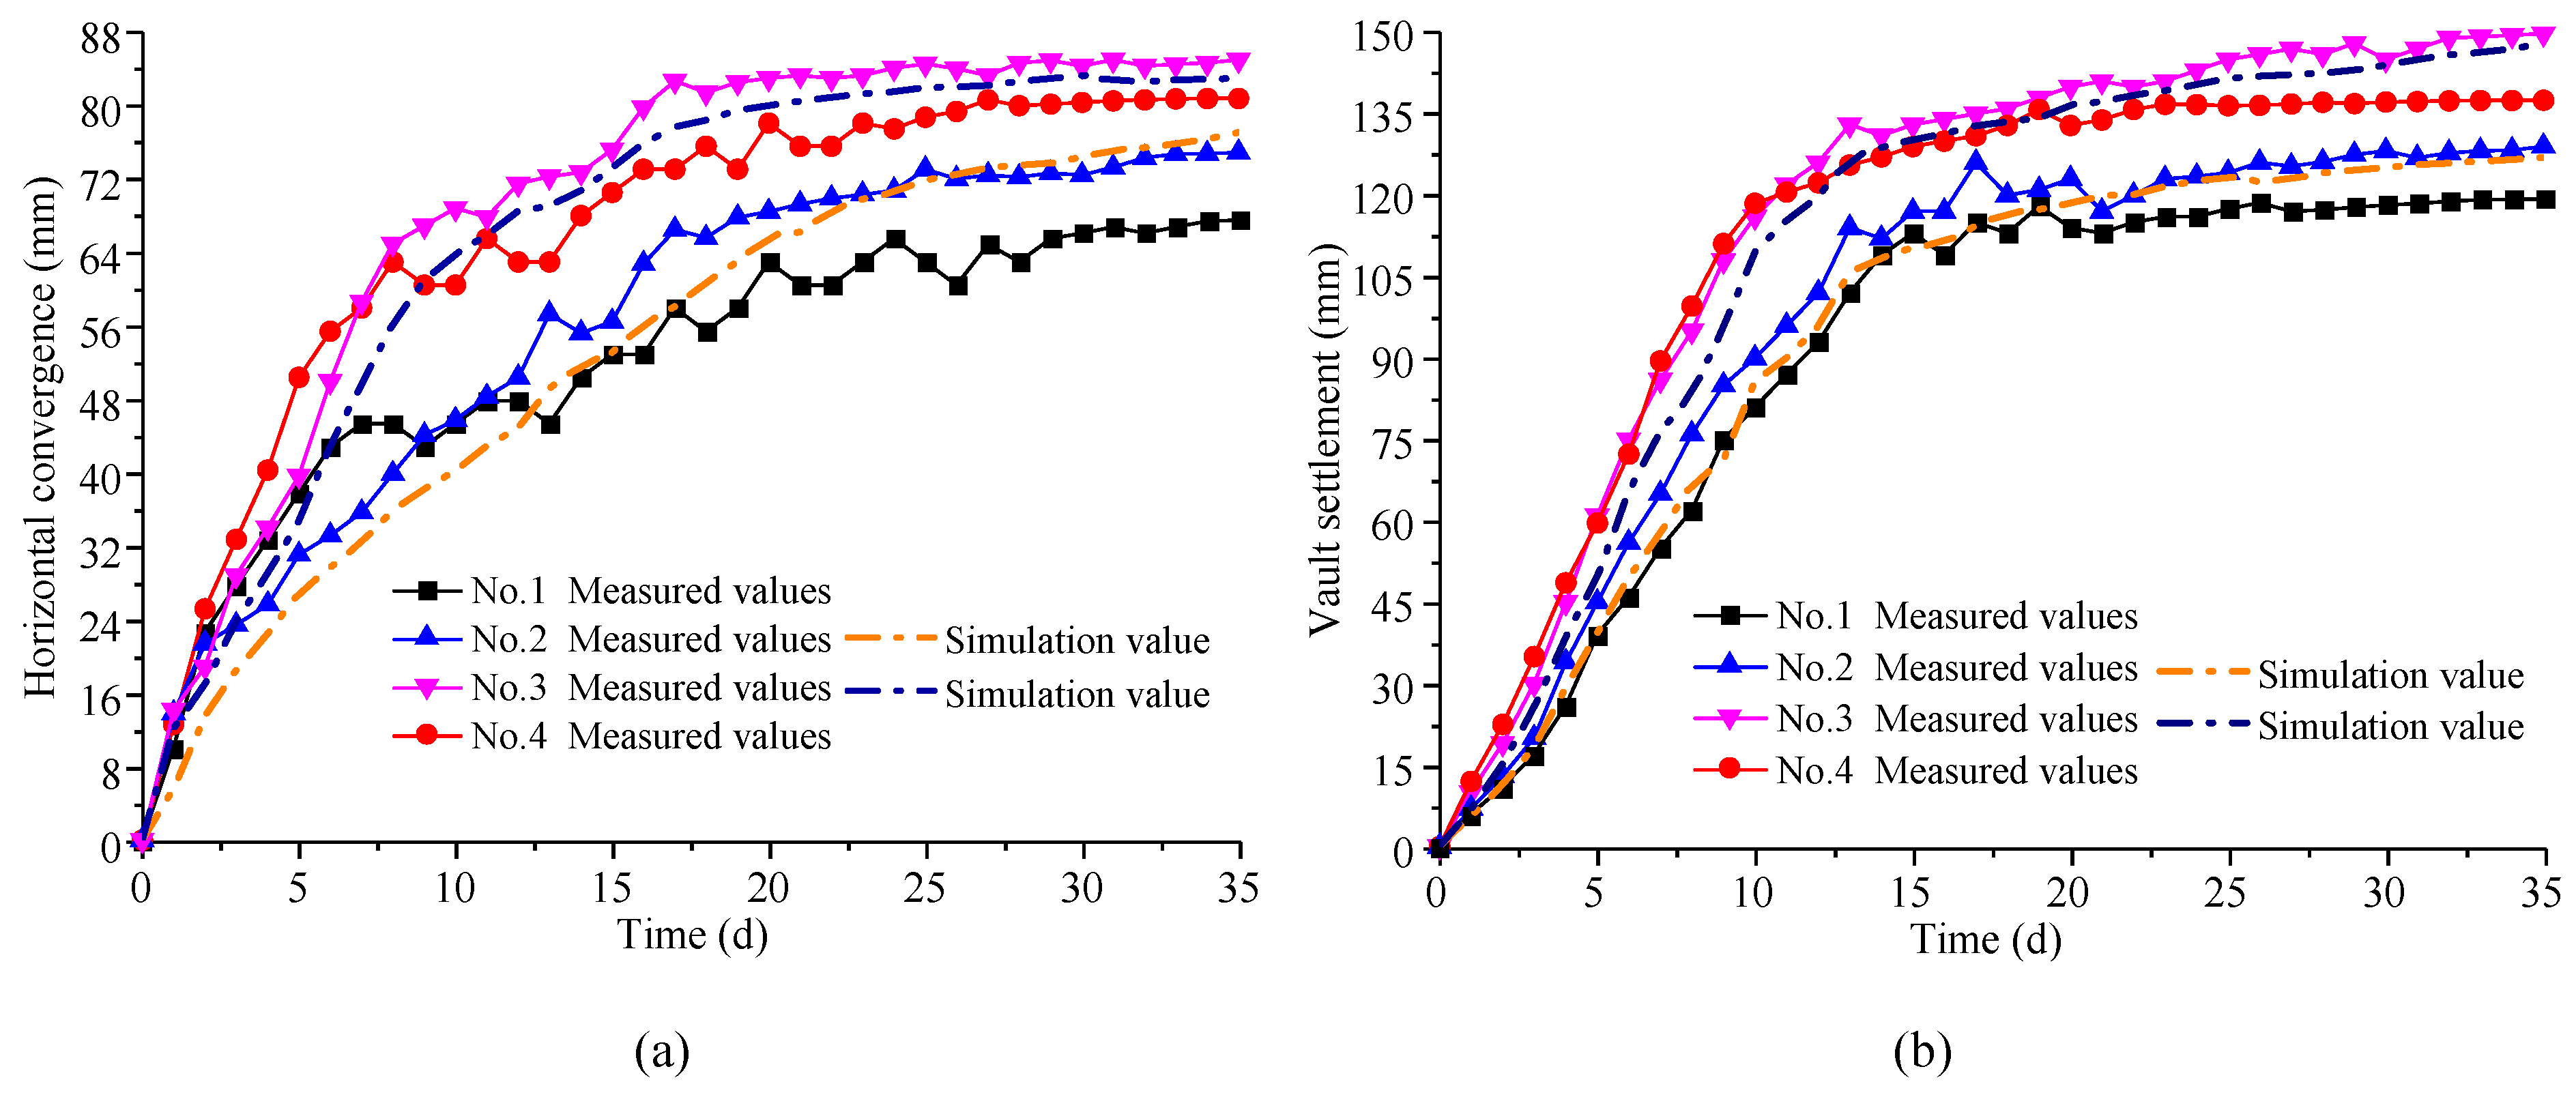
Surrounding Rock Deformation Analysis
The measured results of cumulative deformation about horizontal convergence and vault settlement are shown in Figure 15.
Figure 15a shows that the surrounding rock underwent a convergent deformation mainly in the early stages of construction and the deformation rate was comparatively high. In the first 10 days, the cumulative deformation at four monitoring positions accounted for 64.20%, 61.11%, 80.98% and 73.05% of the total deformation, respectively. At the same time, the deformation of the general section was smaller than that of the broadened section, and the deformation of the surrounding rock closer to the variable section was greater. The value at monitoring positions 2 and 3 were 45.78 mm and 68.83 mm, and the value in the broaden sectioned was 50.35% larger than the general section. The variation in vault settling was similar to the horizontal convergence, as shown in Figure 15b. In the first 10 days, the cumulative settlement deformation accounted for 67.90%, 69.77%, 77.44% and 86.18% of the total deformation, respectively. Similarly, the average settlement deformation of the broadened section was 37.13% greater than the general section. The variation in the two types of deformation were found to be similar when the simulation results of the monitoring positions 2 and 3 under improved construction measures were compared with the measured data. The measured results were greater than the simulated values as a result of the differences between the actual building conditions and the simulation environment, with the largest difference between the two types of results being 13.68% and 5.91%, respectively.
After the construction of the supporting structure, the deformation rate dropped while the cumulative deformation continued to increase. In the course of 11-20 days, the convergence deformation of each monitoring segment increased by 22.08%, 25.27%, 9.75% and 17.12%, respectively. Furthermore, the values of vault settlement were 27,66%, 24,03%, 16,02% and 10,47%, respectively. After the inverted arch was applied to create a closed ring with the initial support, the deformation was controlled and tended to be stable. Finally, the total convergence deformations of No.1–No.4 monitoring positions were 67.54 mm, 74.91 mm, 85.00 mm and 80.79 mm, respectively. The values of vault settlement were 119.36 mm, 129.01 mm, 149.83 mm and 137.52 mm, respectively. Both deformations demonstrated that the surrounding rock was more deformed in the broadened section than in the general section. During the actual construction, the deformation monitoring of the broadened section should be increased. Comparing the simulation results at No.2 and No.3 monitoring positions with the measured results, it was found that the variation in the two deformations was consistent. The differences in convergence deformation at the two monitoring sections were 2.21 mm and 2.12 mm, and the values of vault settlement were 2.02 mm and 1.82 mm. The above analysis results demonstrated the importance of experimental and numerical analysis in this study, which had a significantly guided the construction.
(2)
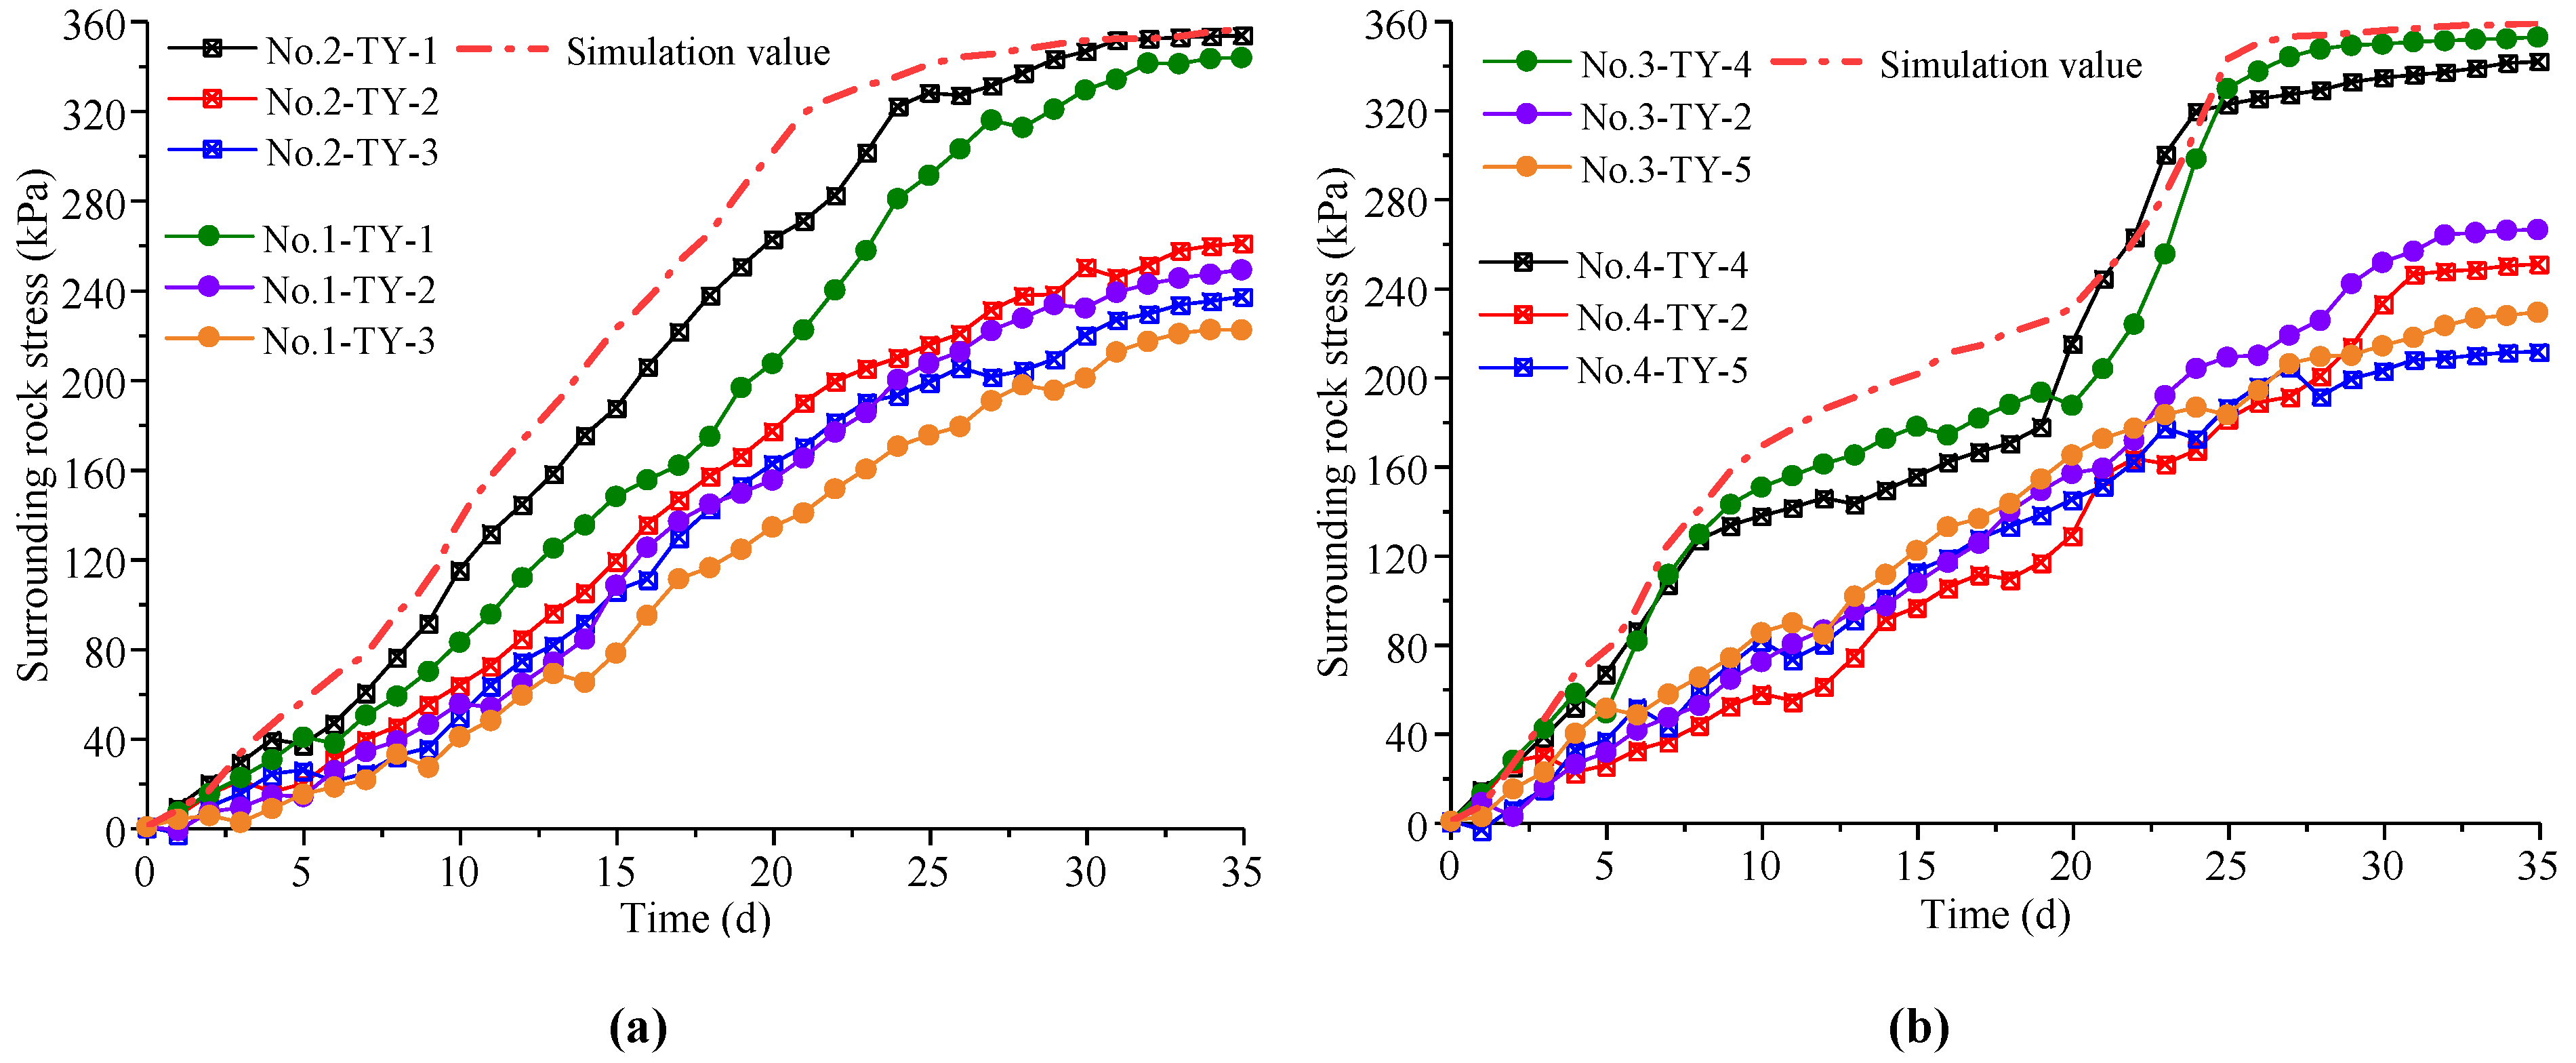
Surrounding Rock Stress Analysis
The data was presented in terms of the evolution of the surrounding rock stress with time, as shown in Figure 16.
It can be seen from Figure 16 that the distribution of the surrounding rock pressure in the two sections was similar, with the pressure at the vault being higher and the pressure at the arch waist on both sides being smaller. Additionally, the general section underwent less deformation than the broadened section, so the stress of surrounding rock closer to the variable section was greater. On the 10th day, the maximum surrounding rock pressures at the No.1–No.4 positions were 82.46 kPa, 114.84 kPa, 150.31 kPa and 137.48 kPa, respectively. Meanwhile, the average pressure in the broadened section was 45.86% greater than that in general section. By comparing the simulated and measured results of the maximum surrounding rock stress at the No.2 and No.3 monitoring positions, it was found that the variation in the two values were consistent. The measured value was lower than the simulated result in actual construction because the control measures were implemented promptly and quickly, indicating that the measures adopted could effectively prevent the deformation and stress increase in the surrounding rock. The surrounding rock pressure at the vault reached 84.83%, 92.72%, 93.21% and 94.18% of the total stress, respectively, on the 25th day. The average pressure at the arch waist reached 83.10%, 81.28%, 79.09% and 79.61% of the total stress, respectively. After the inverted arch was built and merged with the initial support, the pressure on the surrounding rocks tended stabilized. Finally, the surrounding rock pressure at the vault was the highest, with values of 343.84 kPa, 353.74 kPa, 352.95 kPa and 341.91 kPa, respectively. Meanwhile, the simulated results of the maximum stress at monitoring positions 2 and 3 under the improved construction measures were close to the actual measured results, with a difference of 2.76 kPa and 6.23 kPa, respectively. The results demonstrated that the control measures adopted in this study can effectively control the growth in surrounding rock stress, and the numerical analysis means and results were good guides for the construction.
(3)
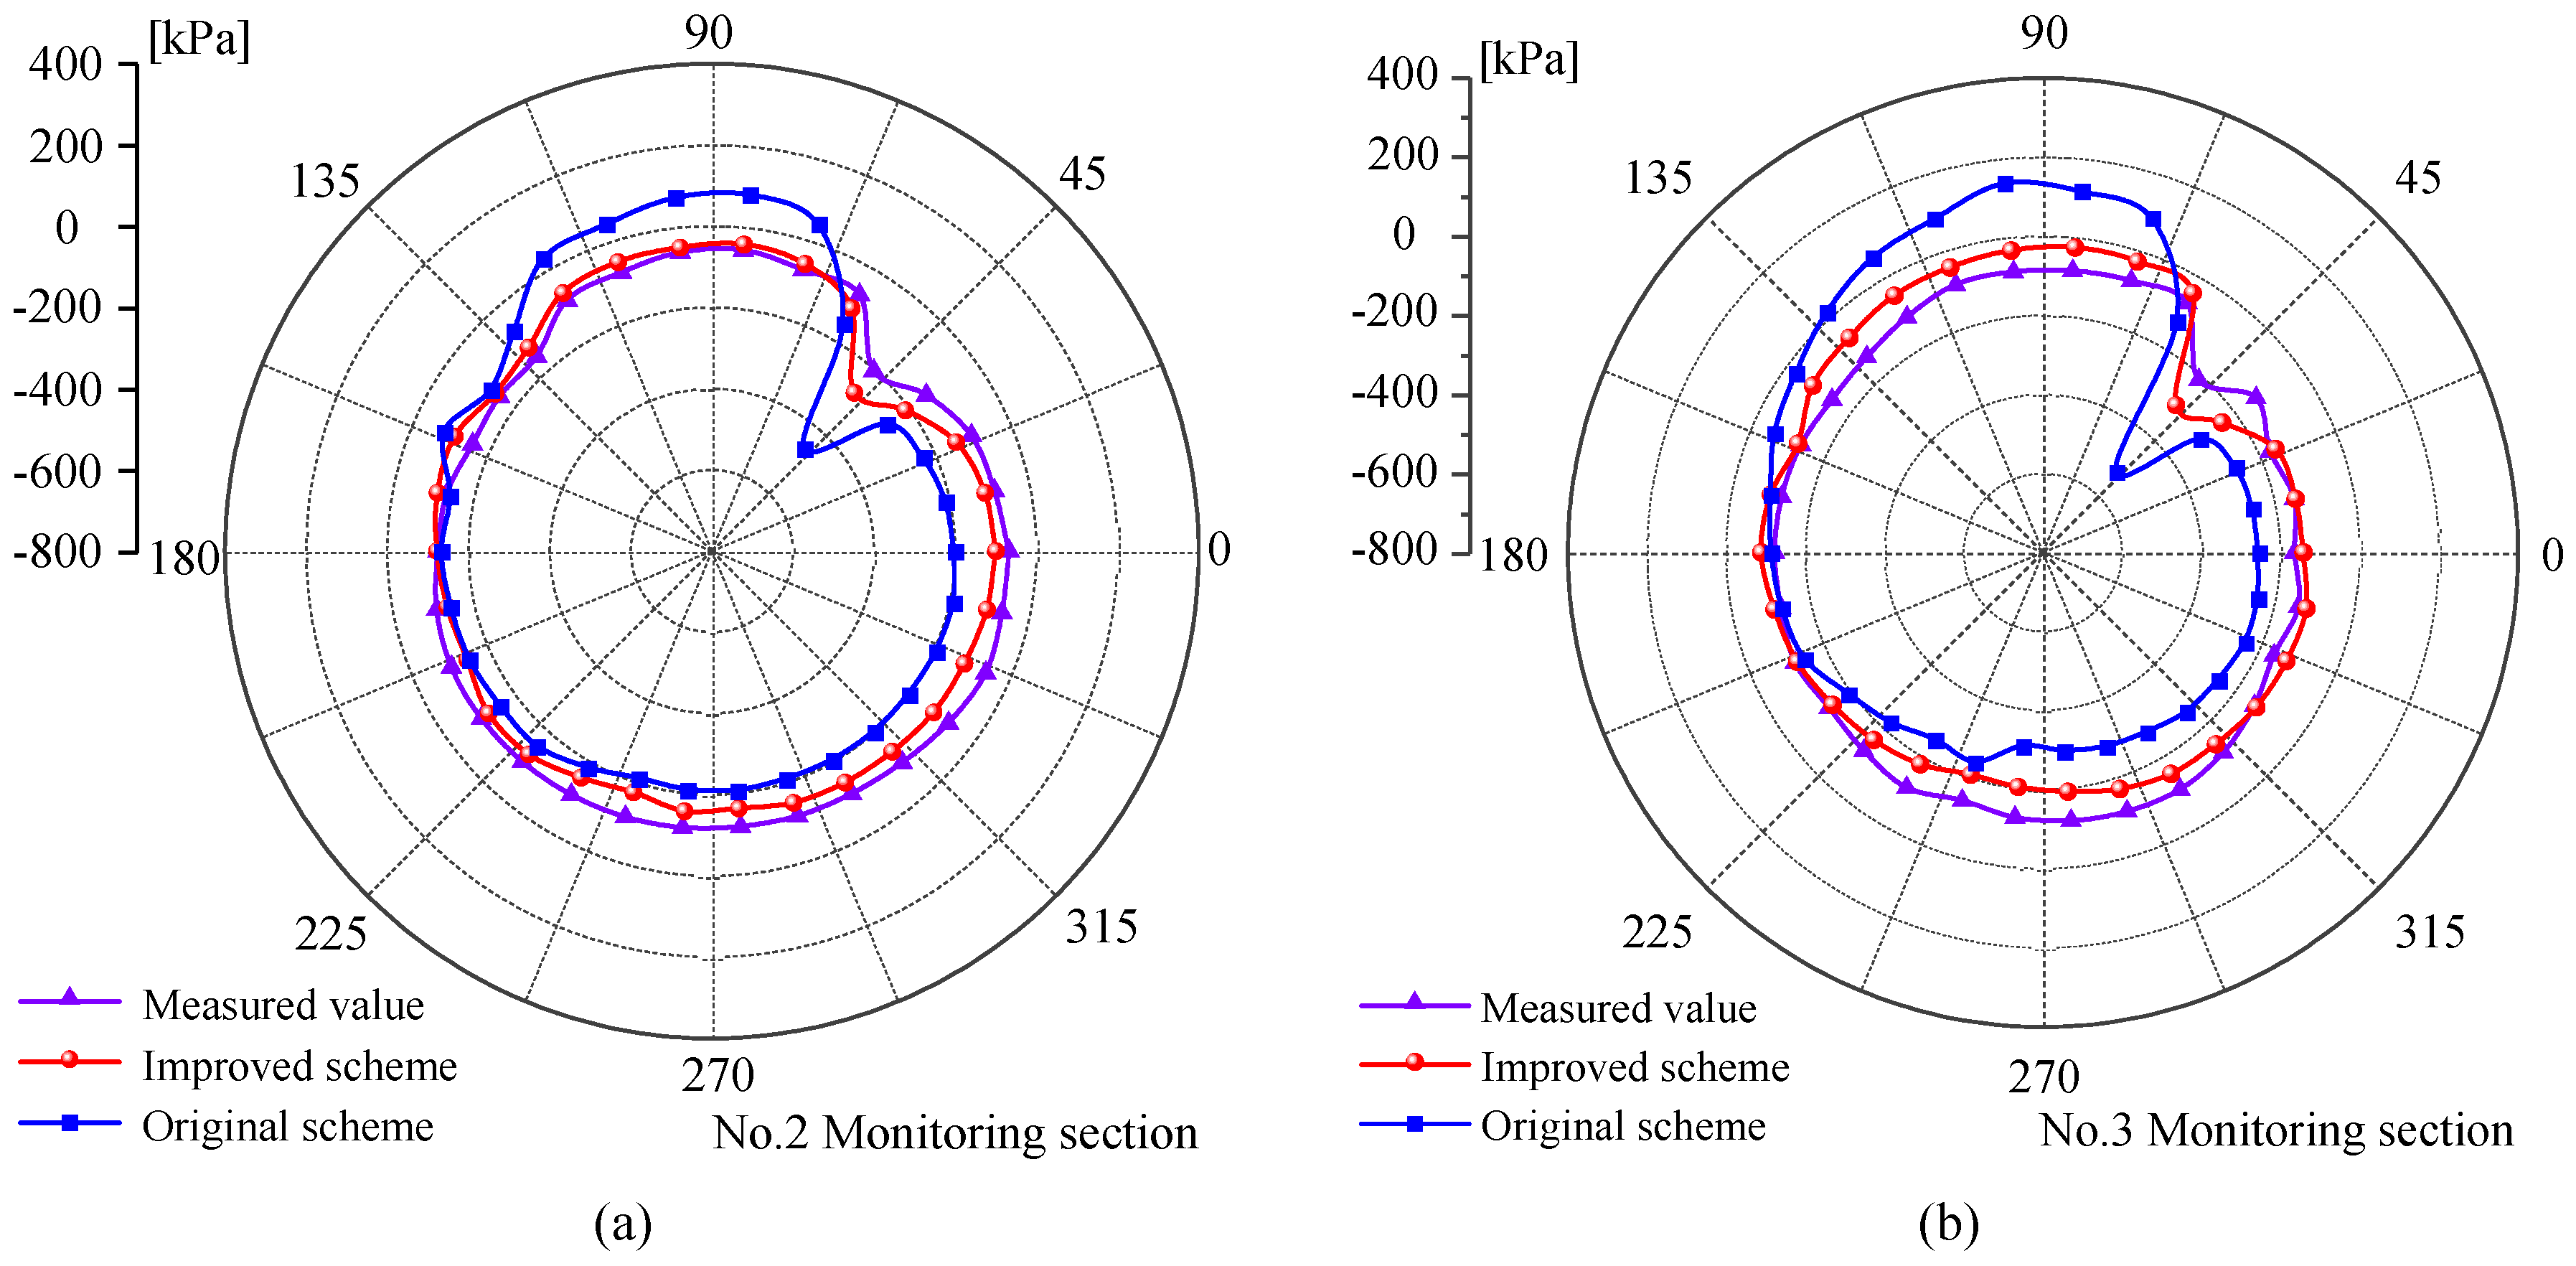
Stress Analysis of Secondary Lining
The stress evolution results in the secondary lining at monitored positions 2 and 3 are shown in Figure 17.
Figure 17 shows that the stress response and variation in the secondary lining at two monitoring positions. Due to the deformation and extrusion of layered joints in the surrounding rock, the lining stress under the original construction scheme was the largest and presented obvious uneven distribution characteristics. Affected by the deformation and stress redistribution in the surrounding rock, the right arch foot and side wall mainly bore compressive stress, while the vault and left spandrel mainly bore tensile stress. Additionally, the stress distribution was more complicated and the lining stress in the broadened section was higher. Different stress states on both sides can easily cause cracking and instability of the lining structure, which was consistent with the phenomena observed in the field.
The stress in the secondary lining was greatly improved after the construction measures were modified. In particular, the tensile stress in the secondary lining under the original construction scheme was transformed into a compressive state in the new scheme, fully utilizing the bearing function of lining structure. In addition, the overall stress distribution of the lining structure tended to be uniform and reasonable. The maximum stress in both sections was reduced by 35.38% and 45.38% compared to the original construction scheme, which can ensure the stability and safety of the tunnel structure. At the same time, the deformation and stress in surrounding rock were controlled effectively after implementing the improved measures suggested in this paper, and the lining stress in both sections was obviously reduced. The measured results were consistent with the simulated values of the improved scheme, with the differences in both sections of 24.98 kPa and 30.10 kPa, respectively, indicating the reliability of the numerical simulation results. The entire lining bore compressive stress and the stress distribution was more uniform, which could fully utilize the bearing and protection of the lining construction. The above analysis indicated that the reinforcement measures proposed in this study can effectively control the deformation of the surrounding rock and ensure the stability of the tunnel structure.

6. Discussion

Mudstone expansion and high ground stress aggravated the sliding deformation of layered rock mass along the joint plane, which was the main reason for the non-uniform and asymmetric deformation in the original structure. In addition, the deformation and stress in the surrounding rock in the widened section increased significantly, which increased the possibility of tunnel instability and deformation in layered mudstone strata. By improving the integrity of the surrounding rock and the overall stiffness and stability of the support structure, the deformation and stress of the surrounding rock and the secondary lining were improved significantly. The maximum deformation and stress of surrounding rock were reduced by 16.95% and 40.04%, and the value of secondary lining stress was 33.16% lower, ensuring the safety of the rock mass and secondary lining structure. Additionally, the measured results were consistent with the simulation values under the improved scheme. The maximum deformation differences in the surrounding rock at monitoring positions 2 and 3 were 2.21 mm and 2.12 mm, respectively, and the stress differences were 2.76 kPa and 6.23 kPa, respectively. Moreover, the stress in the secondary lining was greatly improved after modifying the construction. In particular, the tensile stress in the secondary lining under the original construction scheme was transformed into a compressive state with the new measures, fully utilizing the bearing function of lining structure. In addition, the overall stress distribution in the lining structure tended to be uniform and reasonable. All results demonstrated that the control measures adopted in this study could effectively control the increase in surrounding rock stress, and the numerical analysis results could provide accurate data to choose suitable construction measures. The experience and lessons learned from this study are summarized for providing insights to prevent similar incidents from reoccurring in the future.

7. Conclusions

Based on the variable cross-section construction in tunnel No.1 of the China–Tajikistan natural gas pipeline, crossing the layered mudstone stratum with the developed jointed structure, the mechanism that caused the surrounding rock deformation and lining cracking was studied and analyzed. Combining a numerical simulation and field monitoring results, the effectiveness of the reinforcement measures was evaluated. Through the analysis, the following conclusions can be drawn:
(1)
The developed layered structure, mudstone expansion, the span of the excavation section, the construction methods and an unsuitable supporting structure will all influence the surrounding rock deformation and lining cracking. Meanwhile, the deformation difference of the layered rock on both sides of tunnel was the reason behind the asymmetric distribution of cracks in the secondary lining.
(2)
The deformation and stress in the surrounding rock in the broadened section were greater than those in the general section. Additionally, the section span had the most obvious influence on the vault settlement deformation of the surrounding rock. Finally, the convergence deformation and vault settlement in the broadened section were 7.63% and 16.47% higher than those in the general section, and the stress difference was 6.76%.
(3)
The deformation and stress in the surrounding rock can be effectively controlled with the improved measures. The maximum deformation and stress in the surrounding rock were reduced by 16.95% and 40.04%, respectively, in comparison to the original construction scheme, and the value of lining stress was 45.35% lower. In particular, the tensile stress area in the secondary lining was transformed into a compressive state, fully utilizing the bearing function of lining structure.
(4)
The measured results were consistent with the simulation values for the improved construction scheme. This indicated that by considering the influence of the surrounding rock integrity, section size, excavation method and support strength in a method that combines laboratory experiments, numerical calculations and field monitoring can effectively improve the deformation and stress of tunnel structures, ensuring the safety of tunnel construction and operation.

Author Contributions

Conceptualization and methodology S.F. and Z.S.; numerical simulations and data curation S.F., X.L. and Y.Z.; field monitoring X.L. and L.L.; writing—review and editing S.F., Z.S., Y.Z. and L.L. All authors have read and agreed to the published version of the manuscript.

Funding

The authors are grateful for the support of the National Natural Science Foundation of China (No. 52178393; No. 51578447), the Science and Technology Innovation Team of Shaanxi Innovation Capability Support Plan (No. 2020TD005), the Science and Technology Development Program of Shaanxi Provincial Department of Housing and Urban-rural Construction (No. 2019-K39) and the Special Project of Shaanxi Provincial Education Department (No. 20JK0709). Financial support is gratefully acknowledged and the data are available in the journal.

Data Availability Statement

The data used to support the findings of this study are available from the corresponding author on reasonable request.

Conflicts of Interest

The authors declare no conflict of interest.

References

  1. Du, D.C.; Lei, D.; Liu, K.Q.; Dias, D. Design of quasi-rectangular tunnel built in the rock masses following Hoek-Brown failure criterion. Buildings 2022, 12, 1578. [Google Scholar] [CrossRef]
  2. Lawongkerd, J.; Shiau, J.; Keawsawasvong, S.; Seehavong, S.; Jamsawang, P. Design equations for predicting stability of unlined horseshoe tunnels in rock masses. Buildings 2022, 12, 1800. [Google Scholar] [CrossRef]
  3. Fang, Q.; Liu, X.; Zhang, D.L.; Lou, H.C. Shallow tunnel construction with irregular surface topography using cross diaphragm method. Tunn. Undergr. Space Technol. 2017, 68, 11–21. [Google Scholar] [CrossRef]
  4. Mohsenian, V.; Nikkhoo, A.; Hajirasouliha, I. Estimation of seismic response parameters and capacity of irregular tunnel-form buildings. Bull. Earthq. Eng. 2019, 17, 5217–5239. [Google Scholar] [CrossRef]
  5. Wang, S.H.; Jierula, A.; Wang, P.Y.; Zhao, Y. Mechanical behaviors of “easy cracking zones” of precast rectangular utility tunnels. Case Stud. Constr. Mater. 2021, 15, e00648. [Google Scholar] [CrossRef]
  6. He, Y.P.; Sun, X.; Zhang, M.X. Investigation on the deformation of segment linings in cross-fault tunnel considering the creep behavior of surrounding rock during construction-operation period. Buildings 2022, 12, 1648. [Google Scholar] [CrossRef]
  7. Cheng, Y.; Song, Z.P.; Yang, T.T.; Han, J.J.; Wang, B.W.; Zhang, Z.K. Investigating the aging damage evolution characteristics of layered hard sandstone using digital image correlation. Constr. Build. Mater. 2022, 353, 128838. [Google Scholar] [CrossRef]
  8. Fan, S.Y.; Song, Z.P.; Zhang, Y.W.; Liu, N.F. Case study of the effect of rainfall infiltration on a tunnel underlying the roadbed slope with weak inter-layer. KSCE J. Civ. Eng. 2020, 24, 1607–1619. [Google Scholar] [CrossRef]
  9. Fan, S.Y.; Song, Z.P.; Xu, T.; Wang, K.M.; Zhang, Y.W. Tunnel deformation and stress response under the bilateral foundation pit construction-a case study. Arch. Civ. Mech. Eng. 2021, 21, 109. [Google Scholar] [CrossRef]
  10. Kaya, A.; Karaman, K.; Bulut, F. Geotechnical investigations and remediation design for failure of tunnel portal section: A case study in northern Turkey. J. Mt. Sci. 2017, 14, 1140–1160. [Google Scholar] [CrossRef]
  11. Tian, X.X.; Song, Z.P.; Zhang, Y.W. Monitoring and reinforcement of landslide induced by tunnel excavation: A case study from Xiamaixi tunnel. Tunn. Undergr. Space Technol. 2021, 110, 103796. [Google Scholar] [CrossRef]
  12. Shi, X.W.; Feng, X. Numerical assessment of the structural damage of a composite lining water conveyance tunnel subjected to reverse fault conditions. Buildings 2022, 12, 1647. [Google Scholar] [CrossRef]
  13. Chen, L.; Wu, S.C.; Jin, A.B.; Li, X. The evolution regularity and influence factor analysis of zonal disintegration around deep jointed rock mass: A numerical study based on DEM. Bull. Eng. Geol. Environ. 2022, 81, 37. [Google Scholar] [CrossRef]
  14. Kou, H.; He, C.; Yang, W.B.; Wu, F.Y.; Zhou, Z.H.; Meng, W.; Xiao, L.G. Asymmetric deformation characteristics and mechanical behavior for tunnels in soft-hard inclined contact strata under high geo-stress: A case study. Bull. Eng. Geol. Environ. 2022, 81, 289. [Google Scholar] [CrossRef]
  15. Manh, H.T.; Sulem, J.; Subrin, D. A closed-form solution for tunnels with arbitrary cross section excavated in elastic anisotropic ground. Rock Mech. Rock Eng. 2015, 48, 277–288. [Google Scholar] [CrossRef]
  16. Li, T.; Wang, Y.B.; Yu, Z.W.; Liu, B. Prediction of soil movement and settlement of excavated surface soil of variable section tunnel. J. Cent. South Univ. 2020, 51, 433–444. [Google Scholar]
  17. Chen, G.; Yu, H.T.; Bobet, A. Analytical solution for seismic response of deep tunnels with arbitrary cross-section shape in saturated orthotropic rock. Rock Mech. Rock Eng. 2022, 55, 5863–5878. [Google Scholar] [CrossRef]
  18. Qiao, S.F.; Cai, Z.Y. Study on the characteristics of surrounding rock-support in variable cross section construction of Extra-long highway tunnel. Chin. J. Undergr. Space Eng. 2021, 17, 275–282. [Google Scholar]
  19. Wang, F.; Qian, D.L. Difference solution for a circular tunnel excavated in strain-softening rock mass considering decayed confinement. Tunn. Undergr. Space Technol. 2018, 82, 66–81. [Google Scholar] [CrossRef]
  20. Liu, N.F.; Li, N.; Xu, C.B.; Li, G.F.; Song, Z.P.; Yang, M. Mechanism of secondary lining cracking and its simulation for the Dugongling tunnel. Rock Mech. Rock Eng. 2020, 53, 4539–4558. [Google Scholar] [CrossRef]
  21. Zhou, Y.Y.; Xu, D.P.; Liu, K.; Chen, D.F. Understanding the failure mechanism of a large underground cavern in steeply dipping layered rock mass using an enhanced ubiquitous-joint model. Bull. Eng. Geol. Environ. 2021, 80, 4621–4638. [Google Scholar] [CrossRef]
  22. Hu, S.; Cai, H.B.; Yuan, Z.; Cheng, L.K. Performance comparison test of new sprayed engineered cementitious composites and C25 sprayed concrete. Case Stud. Constr. Mater. 2022, 16, e01139. [Google Scholar] [CrossRef]
  23. Zhu, M.; Xia, C.Q.; Chen, D.W.; Chen, W.; Hao, K.; Chen, X.S. Influence of grouting sequence on the correction effect of horizontal tunnel displacement by grouting in granite residual soil. Buildings 2022, 12, 1655. [Google Scholar] [CrossRef]
  24. Cao, Y.; Wu, A.X.; Hou, Y.Q.; Wang, S.Y. Calculation model of shotcrete support thickness based on elastic thin plate theory. Case Stud. Constr. Mater. 2022, 17, e01232. [Google Scholar]
  25. Feng, X.D.; Jimenez, R.; Zeng, P.; Senent, S. Prediction of time-dependent tunnel convergences using a Bayesian updating approach. Tunn. Undergr. Space Technol. 2019, 94, 103118. [Google Scholar] [CrossRef]
  26. Yu, K.P.; Ren, F.Y.; Puscasu, R.; Lin, P.; Meng, Q.G. Optimization of combined support in soft-rock roadway. Tunn. Undergr. Space Technol. 2020, 103, 103502. [Google Scholar] [CrossRef]
  27. Tian, M.L.; Han, L.J.; Yang, X.X.; Feng, Q.; Meng, Q.B.; Xie, Y.Y.; Li, W.S.; Ma, C. Asymmetric deformation failure mechanism and support technology of roadways under non-uniform pressure from a mining disturbance. Bull. Eng. Geol. Environ. 2022, 81, 211. [Google Scholar] [CrossRef]
  28. Guan, K.; Zhu, W.C.; Wei, J.; Niu, L.L.; Wang, X.R. A finite strain numerical procedure for a circular tunnel in strain-softening rock mass with large deformation. Int. J. Rock Mech. Min. 2018, 112, 266–280. [Google Scholar] [CrossRef]
  29. Yang, S.Q.; Chen, M.; Fang, G.; Wang, Y.C.; Meng, B.; Li, Y.H.; Jing, H.W. Physical experiment and numerical modelling of tunnel excavation in slanted upper-soft and lower-hard strata. Tunn. Undergr. Space Technol. 2018, 82, 248–264. [Google Scholar] [CrossRef]
  30. Zhu, Y.M.; Chen, L.; Zhang, H.; Zhou, Z.L.; Chen, S.G. Physical and mechanical characteristics of soft rock tunnel and the effect of excavation on supporting structure. Appl. Sci. 2019, 9, 1517. [Google Scholar] [CrossRef] [Green Version]
  31. Wang, H.T.; Li, S.C.; Wang, Q.; Wang, D.C.; Li, W.T.; Liu, P.; Li, X.J.; Chen, Y.J. Investigating the supporting effect of rock bolts in varying anchoring methods in a tunnel. Geomech. Eng. 2019, 19, 485–498. [Google Scholar]
  32. Sun, X.M.; Zhao, C.W.; Tao, Z.G.; Kang, H.K.; He, M.C. Failure mechanism and control technology of large deformation for Muzhailing Tunnel in stratified rock masses. Bull. Eng. Geol. Environ. 2021, 80, 4731–4750. [Google Scholar] [CrossRef]
  33. Li, Y.Y.; Jin, X.G.; Lv, Z.T.; Dong, J.G.; Guo, J.C. Deformation and mechanical characteristics of tunnel lining in tunnel intersection between subway station tunnel and construction tunnel. Tunn. Undergr. Space Technol. 2016, 56, 22–33. [Google Scholar] [CrossRef]
  34. Yang, J.P.; Chen, W.Z.; Zhao, W.S.; Tan, X.J.; Tian, H.M.; Yang, D.S.; Ma, C.S. Geohazards of tunnel excavation in interbedded layers under high in situ stress. Eng. Geol. 2017, 230, 11–22. [Google Scholar] [CrossRef]
  35. Zhang, Q.G.; Fan, X.Y.; Chen, P.; Ma, T.S.; Zeng, F.T. Geomechanical behaviors of shale after water absorption considering the combined effect of anisotropy and hydration. Eng. Geol. 2020, 269, 105547. [Google Scholar] [CrossRef]
  36. Zhu, H.B.; Fu, Z.H.; Yu, F.; Li, S. Study on deterioration characteristics of uniaxial compression performance and microstructure changes of red-bed mudstone during gaseous water sorption. Buildings 2022, 12, 1399. [Google Scholar] [CrossRef]
  37. Zhao, H.B.; Zhang, L.; Ren, J.L.; Wang, M.; Meng, Z.Q. AdaBoost-based back analysis for determining rock mass mechanical parameters of claystones in goupitan tunnel, China. Buildings 2022, 12, 1073. [Google Scholar] [CrossRef]
  38. Fransson, A.; Viola, G. Bentonite rock interaction experiment: A hydro-structural-mechanical approach. Eng. Geol. 2021, 281, 105985. [Google Scholar] [CrossRef]
  39. Ding, X.L.; Niu, X.Q.; Pei, Q.T.; Huang, S.L.; Zhang, Y.T.; Zhang, C.H. Stability of large underground caverns excavated in layered rock masses with steep dip angles: A case study. Bull. Eng. Geol. Environ. 2019, 78, 5101–5133. [Google Scholar] [CrossRef]
  40. Xu, D.P.; Feng, X.T.; Chen, D.F.; Zhang, C.Q.; Fan, Q.X. Constitutive representation and damage degree index for the layered rock mass excavation response in underground openings. Tunn. Undergr. Space Technol. 2017, 64, 133–145. [Google Scholar] [CrossRef]
  41. Zhou, Y.Y.; Xu, D.P.; Gu, G.K.; Liu, K.; Wan, L.P.; Wang, T.L.; Yang, J.B. The failure mechanism and construction practice of large underground caverns in steeply dipping layered rock masses. Eng. Geol. 2019, 250, 45–64. [Google Scholar] [CrossRef]
  42. Zheng, W.X.; Guo, Y.J.; Zhi, G.J.; Bao, X.K.; Sun, M.; Ren, R.P.; Duan, Z.J.; Gao, Z.D. Stability analysis and control measures of large-span open-off cut with argillaceous cemented sandstone layered roof. Math. Probl. Eng. 2021, 2021, 8744081. [Google Scholar] [CrossRef]
  43. Komu, M.P.; Guney, U.; Kilickaya, T.E.; Gokceoglu, C. Using 3d numerical analysis for the assessment of tunnel-landslide relationship: Bahce-nurdag tunnel (south of turkey). Geotech. Geol. Eng. 2020, 38, 1237–1254. [Google Scholar] [CrossRef]
Figure 1. Location of the gas pipeline and a schematic diagram of the tunnel cross-section.
Buildings 13 00110 g001
Figure 2. Geomorphology and stratum profile: (a) geomorphology (b) stratum profile.
Buildings 13 00110 g002
Figure 3. Cracking of initial support and secondary lining.
Buildings 13 00110 g003
Figure 4. Schematic diagram of experimental system.
Buildings 13 00110 g004
Figure 5. Strength variation in mudstone with moisture content.
Buildings 13 00110 g005
Figure 6. Numerical model of layered jointed surrounding rock.
Buildings 13 00110 g006
Figure 7. The deformation of the surrounding rock and lining.
Buildings 13 00110 g007
Figure 8. Improved excavation and reinforcement schemes.
Buildings 13 00110 g008
Figure 9. 3D numerical model.
Buildings 13 00110 g009
Figure 10. The plastic zone cloud charts of the surrounding rock.
Buildings 13 00110 g010
Figure 11. The simulation results of surrounding rock deformation: (a) horizontal convergence and (b) vault settlement.
Buildings 13 00110 g011
Figure 12. Surrounding rock stress.
Buildings 13 00110 g012
Figure 13. Stress cloud charts of the secondary lining structure.
Buildings 13 00110 g013
Figure 14. Layout of monitoring sections, monitoring points and monitoring components installation on-site.
Buildings 13 00110 g014
Figure 15. The measured results of surrounding rock deformation: (a) horizontal convergence and (b) vault settlement.
Buildings 13 00110 g015
Figure 16. The variation in the surrounding rock stress: (a) general section and (b) broadened section.
Buildings 13 00110 g016
Figure 17. Stress of secondary lining: (a) general section and (b) broadened section.
Buildings 13 00110 g017
Table 1. Geotechnical parameters.
Soil LayerE (MPa)γ (kN/m3)μc (kPa)ϕ (°)
Residual slope deposit2.5217.50.181220
Silty clay3.21190.351822
Mudstone485.96230.2611225
E is elastic modulus; γ is unit weight; μ is Poisson’s ratio; c is cohesion; ϕ is friction angle.
Table 2. The composition and dilatability analysis results of mudstone.
Rock CoreClay Minerals (%)ContentDetrital Minerals Content (%)Dilatability
MontmorilloniteIlliteChloriteKaoliniteQuartzDolomiteCalciteZeolite
L153581260205328.96%
L2632101058226916.59%
R132646393551024.27%
R222945403241234.56%
Table 3. Parameters of the layered joint structure.
No.Tendency (°)Inclination (°)Thick (m)Average Length (m)
1220780.54
2310580.56
Table 4. The mechanical parameters of the blocks and interface.
BlocksInterface
E (GPa)γ (kN/m3)μc (kPa)ϕ (°)σt (MPa)
5230.2610280.002
σt is tensile strength.
Table 5. Material parameters of the supporting structure.
MaterialUnit TypeE (GPa)γ (kN/m3)μ
AnchorTruss unit21078.50.3
Initial supportBoard unit29.5230.2
Steel archBoard unit20078.50.3
Secondary liningBoard unit30250.25
Grouting reinforcementPhysical unit35.526.30.34
E is elastic modulus; γ is unit weight; μ is Poisson’s ratio.
Disclaimer/Publisher’s Note: The statements, opinions and data contained in all publications are solely those of the individual author(s) and contributor(s) and not of MDPI and/or the editor(s). MDPI and/or the editor(s) disclaim responsibility for any injury to people or property resulting from any ideas, methods, instructions or products referred to in the content.

