Article

Development of Building Energy Performance Benchmark for Hospitals

1
Department of Architecture, Engineering Research Institute, Ajou University, Suwon 16499, Republic of Korea
2
Center for Public Healthcare Policy, National Medical Center, Seoul 04564, Republic of Korea
3
Department of Architecture, Ajou University, Suwon 16499, Republic of Korea
*
Author to whom correspondence should be addressed.
Buildings 2023, 13(1), 12; https://doi.org/10.3390/buildings13010012
Submission received: 7 October 2022 / Revised: 24 November 2022 / Accepted: 15 December 2022 / Published: 21 December 2022
(This article belongs to the Topic Building Energy Efficiency)

Abstract

:
The energy consumption of existing buildings depends on their physical features, climatic conditions, and business activities, such as operating hours and occupancy characteristics. It is necessary to perform a fair assessment of building energy performance considering the business activities. It has become especially necessary to collect and manage information on business activities in hospitals since hospitals operate continuously throughout the year, treating patients and using various medical equipment. This study aimed to develop a benchmark that considers business activities and to perform building energy performance assessments in hospitals using the developed benchmark. Initially, the necessary data from hospitals for assessing energy performance and developing an energy benchmark were identified. Then, survey items regarding the business activities and energy consumption of buildings were designed, and a survey was conducted at 48 general hospitals. Secondly, multiple linear regression was used to identify and normalize the major business activities affecting energy use and to develop a benchmark for energy performance assessment. Thereafter, the Energy Efficiency Ratio (EER), the result of comparing the actual energy consumption with the benchmark, was used as an index for the energy performance assessment. Thirdly, additional general hospitals were surveyed to validate the benchmark. The EER of the additional surveyed hospitals was calculated with the developed benchmark. The Energy Use Intensity (EUI) and EER of buildings were reviewed, and analysis was performed to identify why some buildings had a similar EUI but a different EER. Finally, a method to improve the benchmark is presented, and the improved benchmark model is compared with the existing model.

1. Introduction

With growing interest in reducing energy consumption and greenhouse gas emissions in the building sector worldwide, energy performance assessments have become increasingly relevant for improving and continuously maintaining building energy efficiency. To improve the energy performance of new and existing buildings, many countries have implemented various policies to limit physical features or to assess and manage energy performance. For new buildings, energy efficiency is first considered in the design phase, which should comply with the evolving legal standards [1,2,3,4]. However, existing buildings are relatively vulnerable in terms of energy efficiency owing to energy performance degradation caused by the aging envelope and equipment. In Korea, the proportion of existing buildings increases every year, and by 2020, 2.82 million (~38.95%) out of the existing 7.24 million buildings were more than 30 years old [5,6], indicating the growing importance of collecting and assessing energy performance data for managing the existing buildings across the country [7,8].
The energy consumption of existing buildings is not only affected by their physical features but also by business activities (e.g., operating hours, number of workers, and climate) [9,10]. Particularly, business activities should be taken into account to evaluate the energy performance of existing buildings properly. Operational Rating (OR) is a method to assess building energy performance by considering business activities. This method evaluates the building energy performance by comparing the actual energy consumption of the building with a benchmark, which represents the energy performance of a peer group with attributes similar to those of a given building, such as building use [11,12,13,14,15]. Business activities are normalized, and energy performance levels are assessed by comparing them with similar buildings. The results are compared to benchmarks, which can provide information to determine the energy performance level and to motivate energy retrofits [16].
In many studies, benchmarks based on business activities have been developed for the OR of existing buildings. Monts and Blissett [17] have discussed the aforementioned limitations in using the simple normalized Energy Use Intensity (EUI) for commercial buildings and have used a simple linear regression model to assess the energy-use performance of commercial buildings. Hong et al. [12] compared the percentile calculation value of EUI with the benchmark derived through the Artificial Neural Network (ANN) method using energy consumption data from British schools in the Display Energy Certificates (DEC) dataset. Information such as construction year, school type (primary/elementary or secondary/high school), and the number of students were used to derive the benchmark. Chung et al. [18] have developed a regression equation using the climate, building age, the annual number of visitors, indoor setting temperature, internal floor area, and annual operating hours for supermarkets as a benchmark model. Dahlan et al. [19] have developed a multiple regression equation using nine variables, including total floor area, number of outpatients, and medical devices for energy performance evaluation in Malaysian hospitals. Existing studies have collected required business activity information and have developed benchmarks according to the characteristics of building use.
In national-level research, data collection and utilization for OR of existing buildings have also been carried out. The Department of Energy and Climate Change of the UK assessed the energy consumption of non-residential buildings by observing energy sources and measuring their efficiency using occupant activity, indoor area, and building components (e.g., insulation and equipment) through the Display Energy Certificates (DEC) [20,21] scheme. The Environmental Protection Agency (EPA) of the United States uses the Energy Star system [9,10], which assesses energy performance through the Commercial Building Energy Survey (CBECS) [22] that periodically surveys the physical features, business activities, and energy consumption of buildings. In addition, the Energideklaration [23] of Sweden and Commercial Building Disclosure (CBD) of Australia [24] collected and utilized physical features and operational characteristic data to assess the energy performance of existing buildings. In addition to the abovementioned countries, business activities are being considered in Germany’s Verbrauchsausweis [25] and India’s Building Energy Efficiency (BEE) Star Rating [26].
In Korea, energy performance data of existing buildings have been collected and analyzed. The Ministry of Land, Infrastructure, and Transport (MOLIT) have operated the “National Building Energy Database (NBED)” which integrates building features, such as gross area and height, and energy consumption data [27,28]. The MOLIT has used these data to conduct statistical analyses, energy performance assessments, and disclosure. Moreover, MOLIT implemented various policies to improve the energy performance of existing buildings [29,30,31]. However, cases that collect data on business activities in actual buildings in relation to building energy performance assessments do not exist.
In response to the aforementioned information, this study aims to develop a benchmark that considers business activities and to perform building energy performance assessments in hospitals using the developed benchmark. Hospitals operate 24 h a day; in addition, high-energy medical equipment such as MRI (magnetic resonance imaging) and CT (computed tomography) is used for medical services, including diagnosis and surgery [32,33]. For these reasons, general hospitals with intensive energy use were set as targets for analysis. Initially, survey items, sampling methods, and benchmark development considerations of the existing benchmarking systems were analyzed to collect data on appropriate business activities from samples that represent the general hospital population. Second, appropriate survey items were set up based on the results of the case analysis, and according to sampling, 48 hospitals were surveyed. Third, variables of major business activities that affect energy consumption were selected through descriptive statistical analysis and single regression analysis of each survey item. A multiple regression equation, which describes energy consumption based on the business activities of the actual general hospitals, was then derived. This equation was used as a benchmark for calculating the expected energy consumption for each hospital, and it was used to perform an energy assessment by Energy Efficiency Ratio (EER), the result of comparing the actual energy consumption with the benchmark. Finally, new hospital data were collected, and energy performance was assessed to validate the calculated benchmark value. The calculated EER was validated by a new method comparing the relationship with Energy Use Intensity (EUI). Even if the EER reflects operational characteristics that are not considered in the EUI, it is necessary to review the validity of the assessment results if the difference between EUI and EER is too large. Therefore, we visited some buildings where energy performance was evaluated well or excessively poorly to examine whether objective assessments were performed. The objectivity of the assessment was examined during the energy performance assessment, and the need to improve the benchmark was confirmed. Accordingly, a new regression equation was derived as a benchmark to improve the model, which was confirmed by comparing the energy performance assessment results between the existing and modified benchmarks. The significance of our study lies in the systematization of the survey items and sampling methods for hospitals in Korea. Moreover, we reviewed the appropriateness of the benchmark through actual building visits and proposed an improved benchmark.

2. Overview of the Energy Performance Benchmarking System

Energy benchmarking refers to measuring a building’s energy use and comparing it with the energy consumption of similar buildings. For benchmarking, it is necessary to collect information on ‘business activities’ and develop a benchmark. Therefore, the state-of-the-art features of the methods for collecting data on business activities and for developing building energy performance benchmarks were reviewed.

2.1. Survey Items and Sampling Method

Investigating business activities in buildings that are related to energy use is an essential task to collect analytics data for determining key factors affecting energy consumption and construct statistical information related to buildings in the long term. Moreover, setting initial survey items is necessary for reliable statistical information and the determination of influence factors. In this study, for analysis of valid survey items, survey cases related to building energy use that has been conducted in four countries and related systems were analyzed as presented in Table 1.
The analysis of the survey or system was limited to the hospital (non-residential), which is the subject of this study. Type A is a case that collects data regarding the status of energy use in buildings and provides basic statistical data. Type B represents a case wherein survey items are used to assess and disclose the energy performance of buildings. In Cases 1, 7, and 8, the survey items were organized based on commercial or overall building usages, including hospitals, and Cases 2–6 correspond to cases where a survey or performance assessment particularly focused on hospitals was conducted.
Survey items were categorized through the analysis of surveys, and each survey item was examined to determine the items with a higher frequency of utilization in surveys and systems as more important items. Table 2 presents the types of survey items and the analysis results of the utilization of each item used in the surveys and systems (No. 1–8 in Table 1).
As general hospitals typically have several buildings in operation, survey items were divided into those for the entire hospital and those for the physical features of each individual building in the hospital. The survey items for the entire hospital include general data, such as the built/opening year and building management method; business activity data, such as the number of beds and the total number of inpatients/outpatients; and information on the energy consumption of the entire building. The survey items related to individual buildings primarily consist of information on the physical features of the building envelope and equipment and on the area or ratio of space for each building.
The data on occupancy or operation were comprehensively surveyed on weekdays and weekends, and the total number of inpatients/outpatients and number of operating rooms were added as survey items. As it was difficult to obtain accurate data on the physical features or equipment of existing buildings, the type and number of equipment were surveyed in most cases rather than the detailed performance of equipment. In the case of building data, detailed on-site diagnostic investigations, such as the thermal transmittance, solar heat gain coefficient, and window-to-wall ratio, were almost impossible to obtain. Thus, the main material, insulation type, and thickness of exterior walls, in addition to the window–wall ratio, were surveyed based on the judgment of the investigator. Furthermore, it was impossible to consider all the changes in the schedule of cooling/heating operations and occupancy. Therefore, information that is distinct and relatively easy to obtain, such as the average heating/cooling set temperature, was primarily composed.
Similarly, as it was difficult to survey the detailed medical area of each individual building, the ratio of the medical area compared to the total floor area was surveyed. The ratio of each department, such as the outpatient department and ward department, was also investigated. Finally, the items such as the number of beds, which was directly related to the size of the hospital, as well as the number of medical equipment and operating rooms, which consumed a large amount of energy, were included.
After the survey items were determined, the sample size was required to be defined. Although it is ideal for surveying the entire population, the time and manpower required for such a task are very high. Therefore, the sample size that can effectively represent the population was required to be determined. The sampling methods used in domestic and overseas surveys were examined to determine a method for extracting samples that represented the entire population. Table 3 summarizes the sample design methods in the published cases.
The results from the examination of the overseas cases showed that the measurements were divided into layers based on similarity so that the variations in the population could be reflected for objective sampling. Moreover, the cases generally applied the proportional stratified sampling (PPS) method that extracted samples in proportion to the number of measurements in each layer. Stratified sampling facilitated the construction of a sample group that represented the population, and the selection of stratification variables to divide layers was important [37]. The application of stratified sampling allowed random sampling for a homogeneous group in the same layer and decreased the overall sampling error and increased representativeness due to the combination of the samples extracted from each layer. Briefly, important groups could be included in samples, and it was easy to analyze the characteristics of the samples because the characteristics of each layer could be estimated and compared.

2.2. Benchmark Development Method

Benchmark is an index used for fair energy performance assessment. To identify the aspects of building activity that are significant drivers of energy use and normalize these factors, statistical analysis of the peer building population is usually performed. To develop a benchmark, it is necessary to consider the assessment item (e.g., CO2 and primary energy), normalization variables, methods, etc.
Benchmarks can be developed based on bills or monitored energy consumption and building information. Bill-based energy consumption data generally consists of electricity, gas, and district heating. On the other hand, end-use energy consumption data such as heating and cooling can be obtained through monitoring data. It is possible to identify the physical information of buildings in detail. Hospital Energy Benchmarking Guidance of Lawrence Berkeley National Laboratory (LBNL) [38] and Healthcare Energy End-Use Monitoring of National Renewable Energy Laboratory (NREL) [39] are cases of energy benchmark development by analyzing the end-use energy consumption.
In this study, benchmark development considerations were analyzed for the operating policy systems that actually developed the benchmarks for energy performance assessment, disclosure, and certification at the national level using utility bill data. Table 4 summarizes the cases of benchmark development by country.
The Display Energy Certificate (DEC) [20,21] of the UK and Ireland was an energy consumption certification system implemented for existing public buildings. In the case of DEC in the UK, CO2 emissions from a target building were compared with the standard CO2 emissions that represented the general level for each building with the purpose of assigning seven grades from A to G. In Ireland, 15 grades from A1 to G were assigned using the primary energy consumption. For the standard CO2 emissions and primary energy consumption used as benchmarks, the CIBSE TM46 Energy Benchmarks were used. These are the standards for the electricity, thermal energy consumption, and CO2 emissions of 29 building purposes presented by the Chartered Institution of Building Services Engineers (CIBSE) [40]. The benchmarks corresponded to the median values of CO2 emissions and primary energy consumption for each purpose when the standard operating time was applied according to the building purpose under a balance point temperature of 15.5 °C and 2021 days. During the energy performance assessment, when the climate or operating time of the target building was different from the standard condition, the benchmark value was calibrated through a calibration formula, and a grade was assigned after comparing the actual CO2 emissions and primary energy consumption with the calibrated benchmark.
Sweden’s Energideklaration [23], a part of the Energy Declaration Act introduced by the Ministry of Enterprise and the Ministry of Environment in 2006 to improve energy use and the environment, used a building energy performance assessment system to disclose the energy performance information of buildings when they were sold or rented. The benchmark used the energy consumption level of new buildings required by the Swedish Building Code and assigned seven grades from A to G according to the energy performance (EP), which represented the energy consumption level compared to the benchmark.
The Energy Star of the United States [9,10], an energy performance assessment and benchmarking system based on the results of surveys on the status of energy use, such as the Building Energy Consumption Survey (CBECS) [22], has been performed using the Energy Star Portfolio Manager (ESPM). The ESPM is an assessment method and benchmarking program developed by the EPA, a federal government agency. It operated in a way that each local government established and implemented specific policy details, such as whether it was mandatory, implementation targets, the verification method and target, sanctions in case of non-compliance, and incentives. In many cities, including New York, Chicago, and Philadelphia, an energy performance assessment was mandatory for residential and commercial buildings above a certain scale, and the Energy Star assessment results were applied to them. The benchmark used a regression equation that calculated the generally used source energy consumption according to the heating/cooling degree days, operation for each building purpose, or business activities that referred to occupancy characteristics. As the characteristic information of each individual building was entered into the equation during energy performance assessments, different benchmark values were obtained for each building. The energy efficiency ratio (EER) was calculated by comparing that value with the actual source energy.
The Department of Resources, Energy and Tourism of Australia enacted the Building Energy Efficiency Disclosure Act 2010 as a policy to improve the energy efficiency of commercial buildings and has used the CBD program [24]. CBD is a benchmarking and assessment program to improve national energy efficiency. The benchmark calculates CO2 emissions based on the energy consumption billing data of all buildings by the purpose for 12 months. The average value of the benchmark factor (BF), representing the adjusted CO2 emissions when the conditions of 50-h operation per week by region and an equipment density of 8 W/m2 were set as standards, was used. For the energy performance assessment, NABERS Star Rating was assigned based on the comparison results between the BF of individual buildings and the benchmark. Three stars were then assigned to average-level buildings and five stars to excellent buildings.

3. Hospital Survey and Analysis

In Section 2, survey items, sampling methods, and benchmark development considerations of the existing benchmarking systems were analyzed. Regarding the survey items, it was found that not only basic building information of general hospitals but also business activity information was collected and used for energy use characteristics analysis. Sampling was generally found to extract the characteristics of the population evenly using the PPS method. In addition, by analyzing various benchmark development cases, it was confirmed that benchmark development considering the assessment item, indicator type, and normalization variable and method was necessary. In Section 3, the survey design was performed with the survey items and sampling method of the Korean General Hospital based on the contents of Section 2, and a benchmark was developed based on benchmark considerations.

3.1. Survey Design

To obtain business activity items and develop benchmarks for energy performance assessment of hospitals, survey items, sampling, and survey methods were established based on the existing benchmarking systems, and surveys were conducted on hospitals in Korea.

3.1.1. Survey Items

As this study analyzes energy use characteristics based on business activities in buildings using survey items and develops an energy performance benchmark, it is necessary to set survey items focusing on the factors related to business activities that may influence energy use. In addition, survey items must be set so that the survey can be easily conducted with the cooperation of the target hospitals. Accordingly, based on the survey items used for domestic and overseas general hospitals, a preliminary survey was conducted for some sample hospitals to enable efficient information collection from several hospitals. The final survey items were selected as presented in Table 5 based on the frequency of utilization of each survey item in the cases of different countries analyzed in Section 2.1 and the results of the preliminary survey.
Survey items were divided into three parts: the entire hospital part that collects information related to business activities that are utilized in the analysis of energy use characteristics; the survey part for each operating department, such as outpatient and ward departments; and the individual building survey part that collects information on the performance of buildings.
The survey items for the entire hospital included general hospital information, retrofit history, occupancy information related to workers and patients, number of beds and operating rooms directly related to the operation, and number of medical devices. For the information on occupancy characteristics, the survey item was changed to the number of total workers during the preliminary survey. The number of emergency patients or the number of outpatients was also changed to the number of inpatients/outpatients per year, which can be surveyed. For the operating department, as the equipment operation method varied depending on the department, the items related to the proportion of the department area compared to the total hospital and heating/cooling operation were set as survey items. The operating department area was divided according to the 8-h and 24-h operations; however, the survey item was adjusted so that the area could be recorded based on the operation purpose because a clear distinction between operating departments was impossible during the preliminary survey. The survey items for individual buildings were set to assess the envelope and equipment characteristics of each building. The insulation standards for windows, roofs, and walls were adjusted to follow legal standards in the absence of information on insulation materials. Building geometry and orientation were excluded from survey items in the preliminary survey.

3.1.2. Sampling

First, the list of hospitals in the Korean Hospital Association (KHA) [41] that contained information on all general hospitals in Korea was examined for sampling. As of 2018, which was the time of sampling in this study, 338 hospitals that corresponded to general hospitals with more than 100 beds were set as the initial population. Fifteen large general hospitals with more than 1000 beds were excluded from the surveys due to the high proportion of facilities other than medical spaces, such as dormitories and research facilities. Finally, 323 general hospitals were set as the population.
Next, stratified sampling was performed. Information on the area and number of beds for each hospital, which was associated with energy use characteristics, was collected to apply the proportional stratified sampling methods to the population of the 323 general hospitals. The total floor area and the number of beds, which could represent the scale of a general hospital, were closely associated with energy use. However, as shown in Figure 1, there was a strong relationship between them, and the representativeness of each group decreased when both items were set as stratification variables because the frequency of data for each layer decreased. Therefore, in this study, the “number of beds”, which was related to the business activities of general hospitals, was set as a stratification variable to reflect the variations in energy use characteristics.
For proportional sampling by class, the sample size was set for 323 hospitals. As the sample size increased compared to the population, the representativeness of the samples increased. However, when the sample size was extremely large, the survey efficiency decreased. Therefore, to calculate the appropriate sample size, the minimum sample size was calculated using the following sampling error formula [42,43].
Sample   Size = ( z 2 × p ( 1 p ) e 2 ) 1 + ( z 2 × p ( 1 p ) e 2 × N )
In this formula, N is the size of the population, e is the error bound, and z is the standard score obtained by dividing the deviation by the standard deviation. A confidence level of 90% and a sampling error of <10% were applied to the size of the population (323 hospitals). In this study, z was set to 1.65, which corresponds to a confidence level of 90%, and the error bound, e, was set to 0.1, which corresponds to the sampling error standard. The p-value was set to 0.1 based on a confidence level of 0.9. The calculation results showed that the minimum required sample size was 56 hospitals. Thus, the sample size was set to 100 hospitals, which was approximately twice as large as the minimum sample size. The sample size of each class was then set by multiplying the ratio of each class in terms of the number of beds by 100. Finally, based on 100 beds, a total of nine classes were divided for stratified sampling, as presented in Table 6.

3.1.3. Survey Method

For the efficient and reliable collection of information on survey items, a preliminary survey and an on-site survey were conducted. In the preliminary survey, public information, such as building ledgers and hospital websites, was examined, and information that could be obtained from hospitals was collected. A questionnaire was distributed to hospital facility managers, and they were requested to fill in the possible information. The questionnaire was collected after two weeks. Data on drawings, equipment lists, and energy bills were collected with the questionnaire. Based on the collected questionnaire and the data provided by hospitals, an expert investigator examined the information about the area or equipment type. The investigator examined the information filled in the questionnaire and filled in additional information. The errors or changes in the information were verified and corrected through an interview with the person in charge during the on-site survey stage. Information on items that were difficult to acquire was collected during the on-site survey stage through interviews or on-site examinations.

3.2. Survey Result Analysis and Energy Use Key Factors in Survey Result

The survey was conducted for approximately three months to collect information suitable for the designed sample size. The survey was conducted by giving priorities within the 100 candidate hospitals considering the accessibility to the site, survey efficiency, and cooperation from the hospital. Finally, 54 general hospitals responded to the survey. Among them, six hospitals were excluded from the final samples due to the lack of energy data, dropout, and data errors. Thus, information on 48 general hospitals was collected. The final sample size of 48 samples is smaller than the minimum required sample size number of 56. However, these 48 samples can satisfy a confidence level of about 87% and a sample error of less than 10%. Table 7 presents the surveyed number of samples for the 100 survey candidates.
Before developing a benchmark, a single regression analysis of continuous variables among the survey items and the mean analysis by the group for discrete variables were conducted to derive major key factors that were related to the basic statistical analysis and energy consumption of the surveyed items. The R statistics software (version 3.6.1) [44] was used for the statistical analysis. Table 8 presents the results of the single regression analysis, and Table 9 presents the results of analyzing the average energy consumption according to the characteristics of the discrete variables.
To derive variables that are highly related to energy use, the hospital information was set as an independent variable. The total energy consumption and the energy use intensity (EUI) were obtained by dividing the total energy consumption by the total floor area as dependent variables, and then a single regression analysis was conducted. The total energy consumption was an indicator that could also evaluate the influence of the scale of the general hospital, and EUI, that is, the “energy consumption per unit area (kWh/m2)” enabled the analysis, excluding the influence of the scale. The total energy consumption included the final annual energy, such as the electricity, city gas, and district heating used in each hospital. Considering environmental impacts, such as carbon emissions, analysis by converting to primary energy could be favorable. However, in Korea, the current energy consumption-based assessment is not active; thus, general energy consumers have a higher understanding of final energy consumption directly used in buildings than primary energy consumption. Therefore, the final energy was used because it could be intuitively evaluated by hospital stakeholders. EUI was calculated by dividing the total energy consumption by the total floor area.
The items that had a significant relationship with the total energy consumption were summarized below in descending order of the coefficient of determination. The variables that represent the scale of medical facilities, such as the “total floor area”, “number of licensed beds”, and “number of staffed beds”, exhibited a close relationship with the “total energy consumption.”
-
Total floor area (m2), R2 = 0.850
-
Number of elevators (Unit), R2 = 0.782
-
Number of staffed beds (bed), R2 = 0.716
-
Number of licensed beds (bed), R2 = 0.699
-
Total number of outpatients per year, R2 = 0.645
-
Total number of staff, R2 = 0.670
-
Number of operating rooms, R2 = 0.624
-
Number of MRI, R2 = 0.504
-
Total number of inpatients per year, R2 = 0.398
-
Number of CT, R2 = 0.347
-
Total number of emergency room patients per year, R2 = 0.347
-
Total floor area per licensed bed (m2/bed), R2 = 0.284
-
Number of buildings in hospital, R2 = 0.249
-
Number of X-rays, R2 = 0.191
Among the variables, “total floor area” had the highest explanatory power, exhibiting 85% of explanatory power for the “total energy consumption”. Evidently, the energy consumption increased by 343 MWh whenever the total floor area increased by 1000 m2. When single regression analysis was conducted using each variable as an independent variable and the “energy consumption per total floor area” as a dependent variable, the influence of each survey item on the “energy consumption per total floor area” was found to be insignificant. This implies that the explanatory power of other variables is low when the influence of the “total floor area”, which exhibits high explanatory power for the “total energy consumption”, is excluded.
Table 9 presents the analysis results for the discrete variables. It presents the results of analyzing the ratio of each survey item and the difference in the average value for energy consumption per total floor area. For the analysis items of the discrete variables, (1) the operating entity, (2) number of beds, (3) air-conditioning method, (4) main heating/cooling heat source, and (5) main heating/cooling and hot water supply fuel were selected. Although the number of beds was a continuous variable, classes were divided to determine whether there was a significant difference in energy use, which was the level that increased the number of treatment subjects, enabled the installation of intensive care units, and increased the severity of medical practices. ANOVA was conducted to analyze statistically significant differences depending on the groups of the discrete variables. The results showed that there was no significant difference in the energy consumption of all discrete variables at a significance level of 95%. This is likely because the operating entity or the number of beds was divided according to the main operating entity, heat source, and fuel rather than being divided into groups, rendering it difficult to divide energy use characteristics. There was also no significant difference in energy use characteristics because the degree of the increase in the number of treatment subjects or the severity of medical practices varied with the hospital.

4. Benchmark Development and Improvement

4.1. Benchmark Development

Table 10 presents the analysis procedure and contents of multiple regression analysis.
Items are primarily representing the area information, operation information, and occupancy information among the key factors derived above, excluding the building performance information for energy performance improvement, which was utilized as independent variables for developing a benchmark model. Therefore, among the main influencing variables derived through a single regression analysis in Section 3.2, the total floor area was used as representative area information, and the number of elevators was excluded. In addition, hospital operation-related variables selected as influence variables in the single regression analysis were selected as input variables. For the independent variables, the information obtained by combining the characteristics of variables or by processing the characteristics of variables, such as the number of beds per unit area, was additionally examined rather than examining only the surveyed individual items. In addition, based on the distribution characteristics of the variables, the variables obtained by adjusting the variance of the survey items, such as natural logarithms, were examined. The total energy consumption (MWh) that exhibited the highest explanatory power through single regression analysis with the survey items was selected as a dependent variable. As the purpose of this study was to provide information to the stakeholders of general hospitals, the final energy consumption was used as a dependent variable.
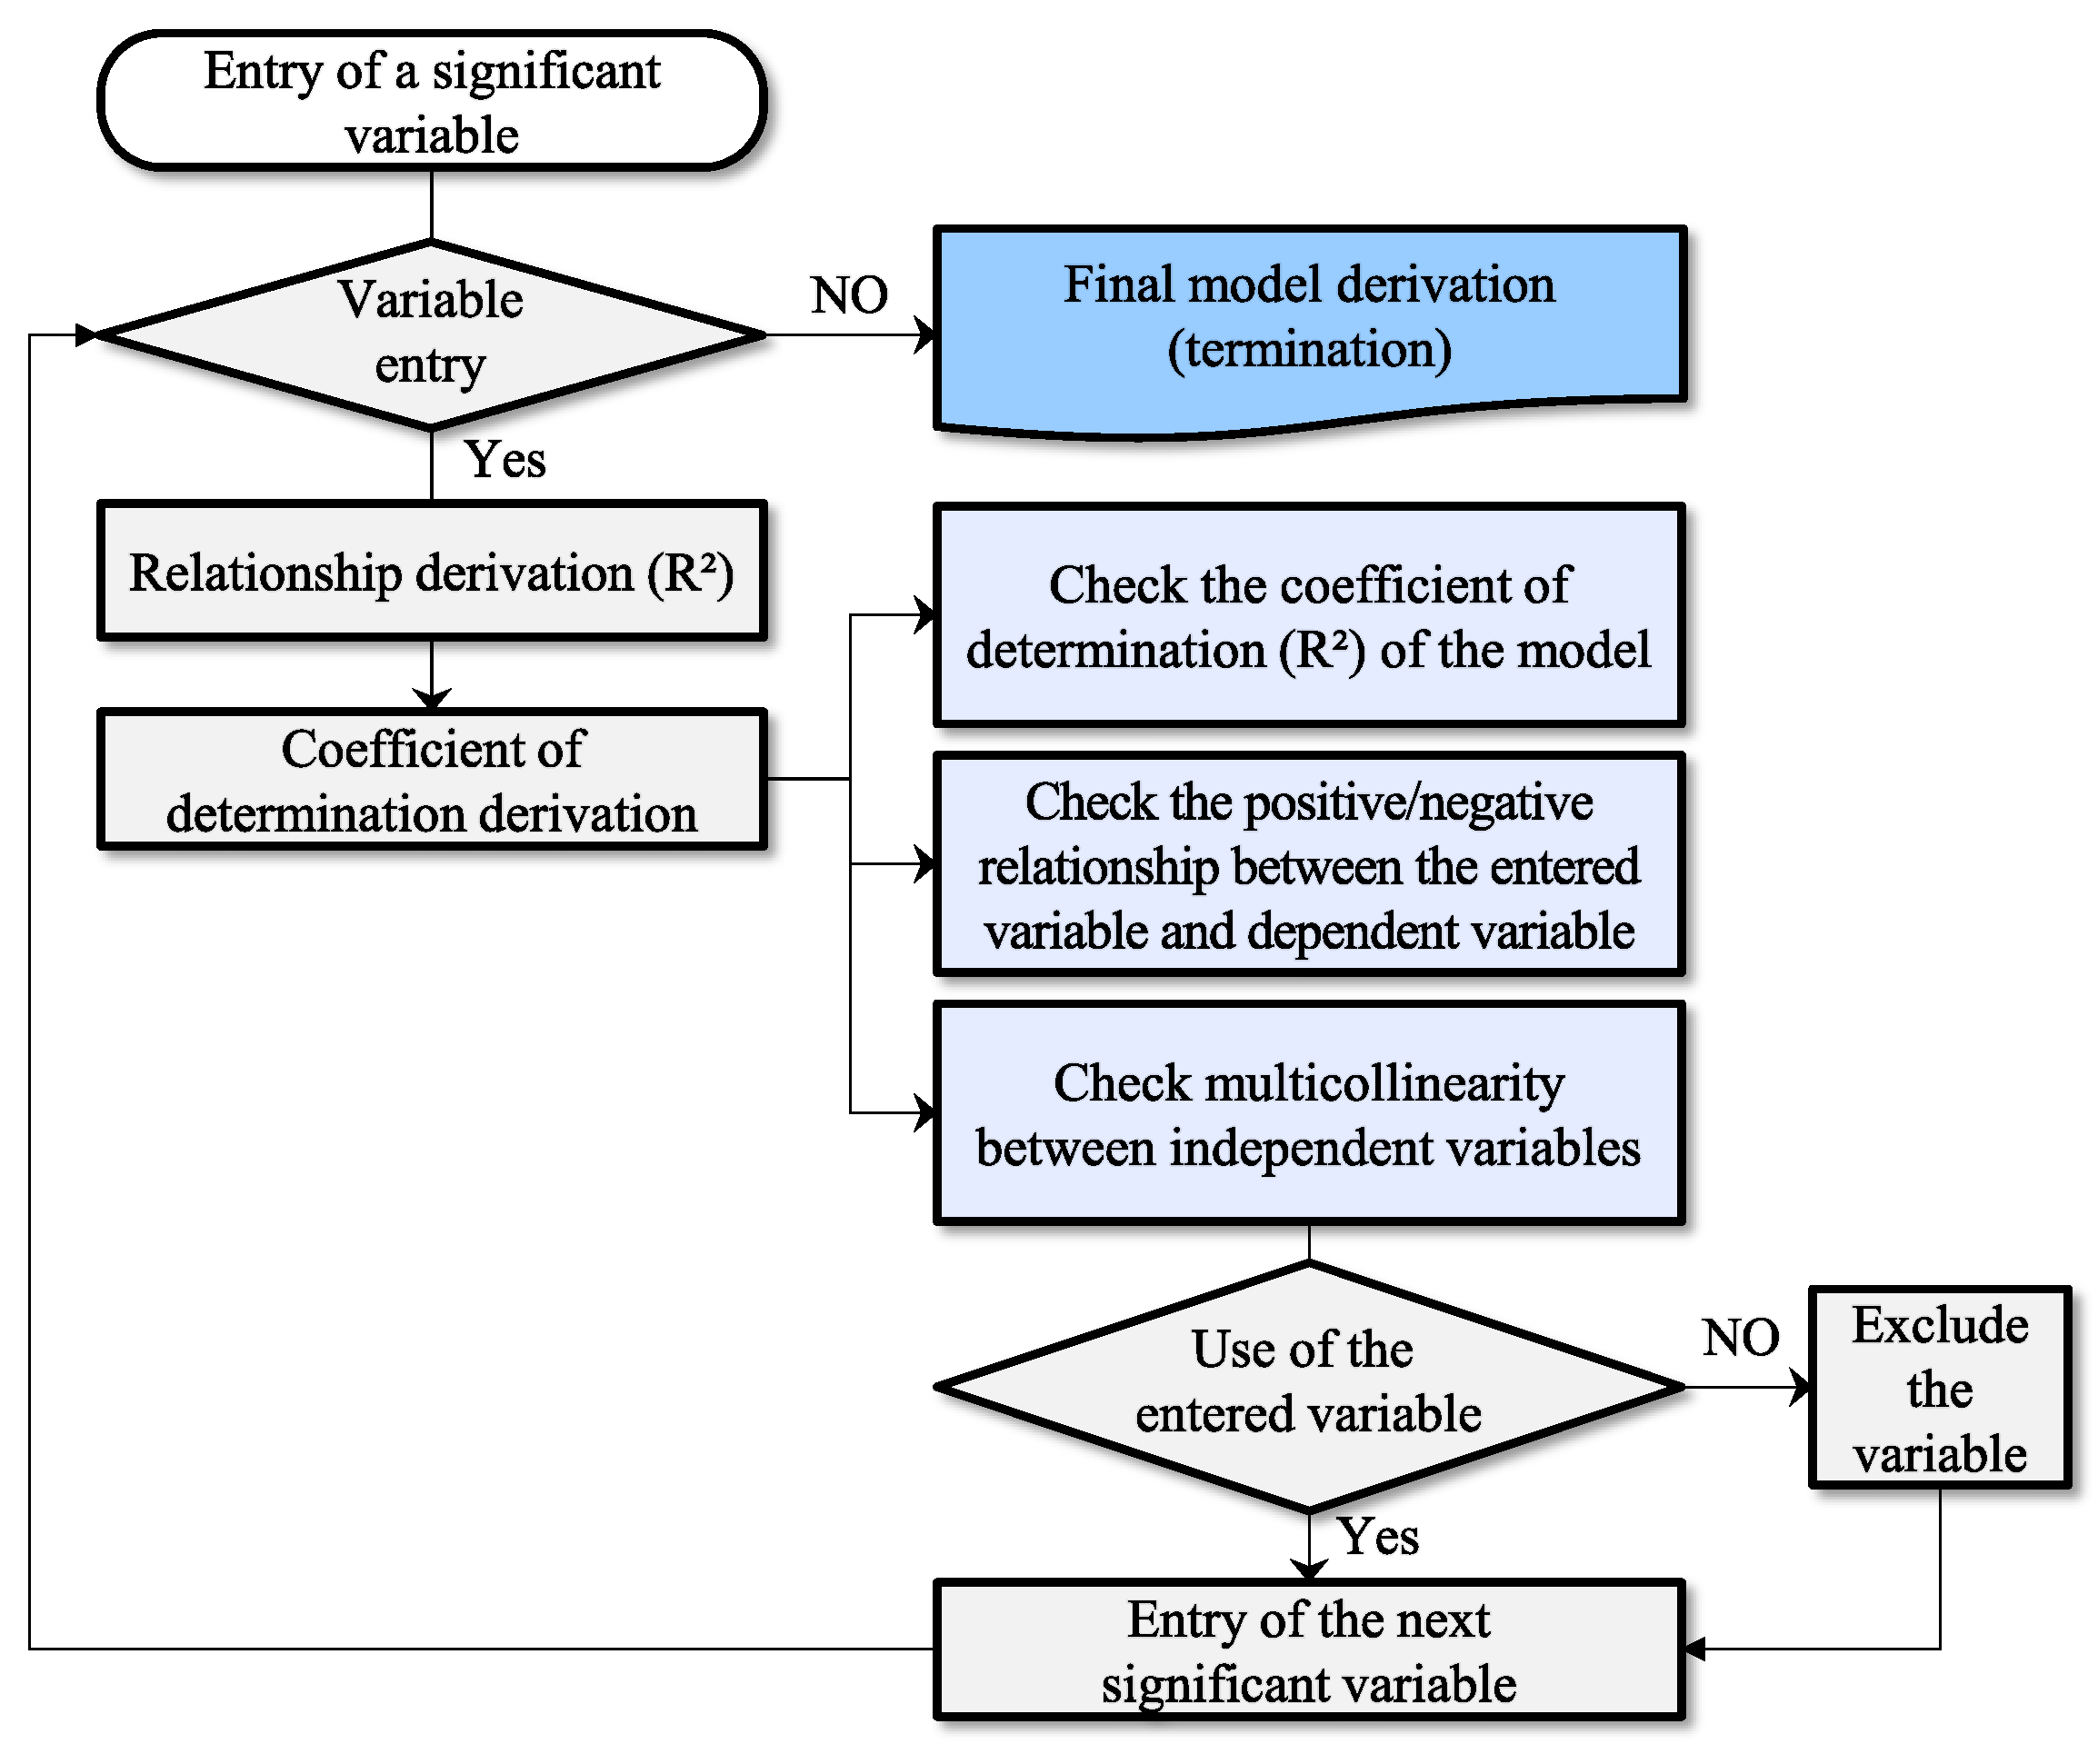
For the multiple regression analysis, the least squares regression of the independent variables was applied for the dependent variable. The step-wise method was applied for the input variables [45]. This method involved deriving a model that could best explain the dependent variable, and variables that could significantly improve the explanatory power among the entered independent variables were added to the regression model one by one. The entry of a variable was terminated when the dependent variable could no longer be explained by the input variable. Figure 2 shows the process of deriving a multiple regression equation using the step-wise method.
In addition to the statistical analysis of the dependent variable collinearity and significance of multiple regression analysis, the suitability of the derived model was examined for hospital stakeholders, and a benchmark according to the number of staffed beds, number of operating rooms, and number of CT was derived at the level of R2 0.86.
The independent variables were adjusted by centering relative to the mean [46,47]. The adjustment method involves subtraction of the mean value of the variable from the true value of each independent variable. This is expressed as a negative constant value after the variable used in Step 5 of Table 10.
For example, if the number of staffed beds is 400, the adjusted number is 54 (400−346 = 54). The difference between the values of the actual independent variable and the adjusted values is the intercept (constant value). The coefficients in the regression equation are the same. Using the adjusted values of the independent variables, the intercept is made equal to the mean value of final energy consumption (MWh) in the population. That is, adjusting the true values of the independent variable to the mean is useful in that the intercept of the regression equation can be adjusted to the mean value of the population.
The number of staffed beds indicated the scale of the medical service of the hospital. The number of operating rooms represented a medical practice that intensively used energy, such as performing checkups using medical devices from the preparation process. An increase in the number of operating rooms indicated that there were many surgeries or large-scale operations. CT was likely introduced as a significant variable as it used standby power for 24 h and a large amount of energy for imaging.

4.2. Improvement of the Benchmark Model through Test Data

The pilot assessment of energy performance was conducted using the developed benchmark to examine whether the derived benchmark model appropriately reflected the tendency of the population and to improve and upgrade the model for comprehensive energy performance assessment. Pilot assessment targets were collected for more than a month through publicity in the hospital association and medical journals. Table 11 presents general hospital samples for the development of the existing benchmark and the frequency of additional pilot assessment target hospitals.
The benchmark should perform an objective assessment even when the year of energy use changes or the information of a hospital other than the samples is entered. Hence, the pilot assessment was conducted in 2019, a year after the development of the benchmark model. The energy consumption data for two years from 2017 to 2018, when the existing benchmark model had been developed, were collected. For survey items for the hospital information, only major key factors and basic heat source and fuel data were collected among the existing survey items considering the efficiency of the survey. In this study, as both the operation and occupancy information varied with the year, the information in 2017 and 2018 were collected.
To validate the benchmark based on the collected information, EER was calculated and examined for the existing surveyed samples and the pilot assessment targets using the benchmark model. EER assesses whether energy is efficiently used by comparing the energy consumption expected under the operating conditions as reflected in the benchmark model with the actual energy consumption as shown in the following equation:
Energy   Efficiency   Ratio   ( EER ) = Actual   energy   consumption Expected   energy   consumption   ( Using   benchmark   model )
When EER is <1 and closer to zero, it implies that less energy was used compared to the expected energy. When EER is >1, it indicates that more energy was used than the expected energy. An EER value closer to 1 can be considered a general energy consumption level.
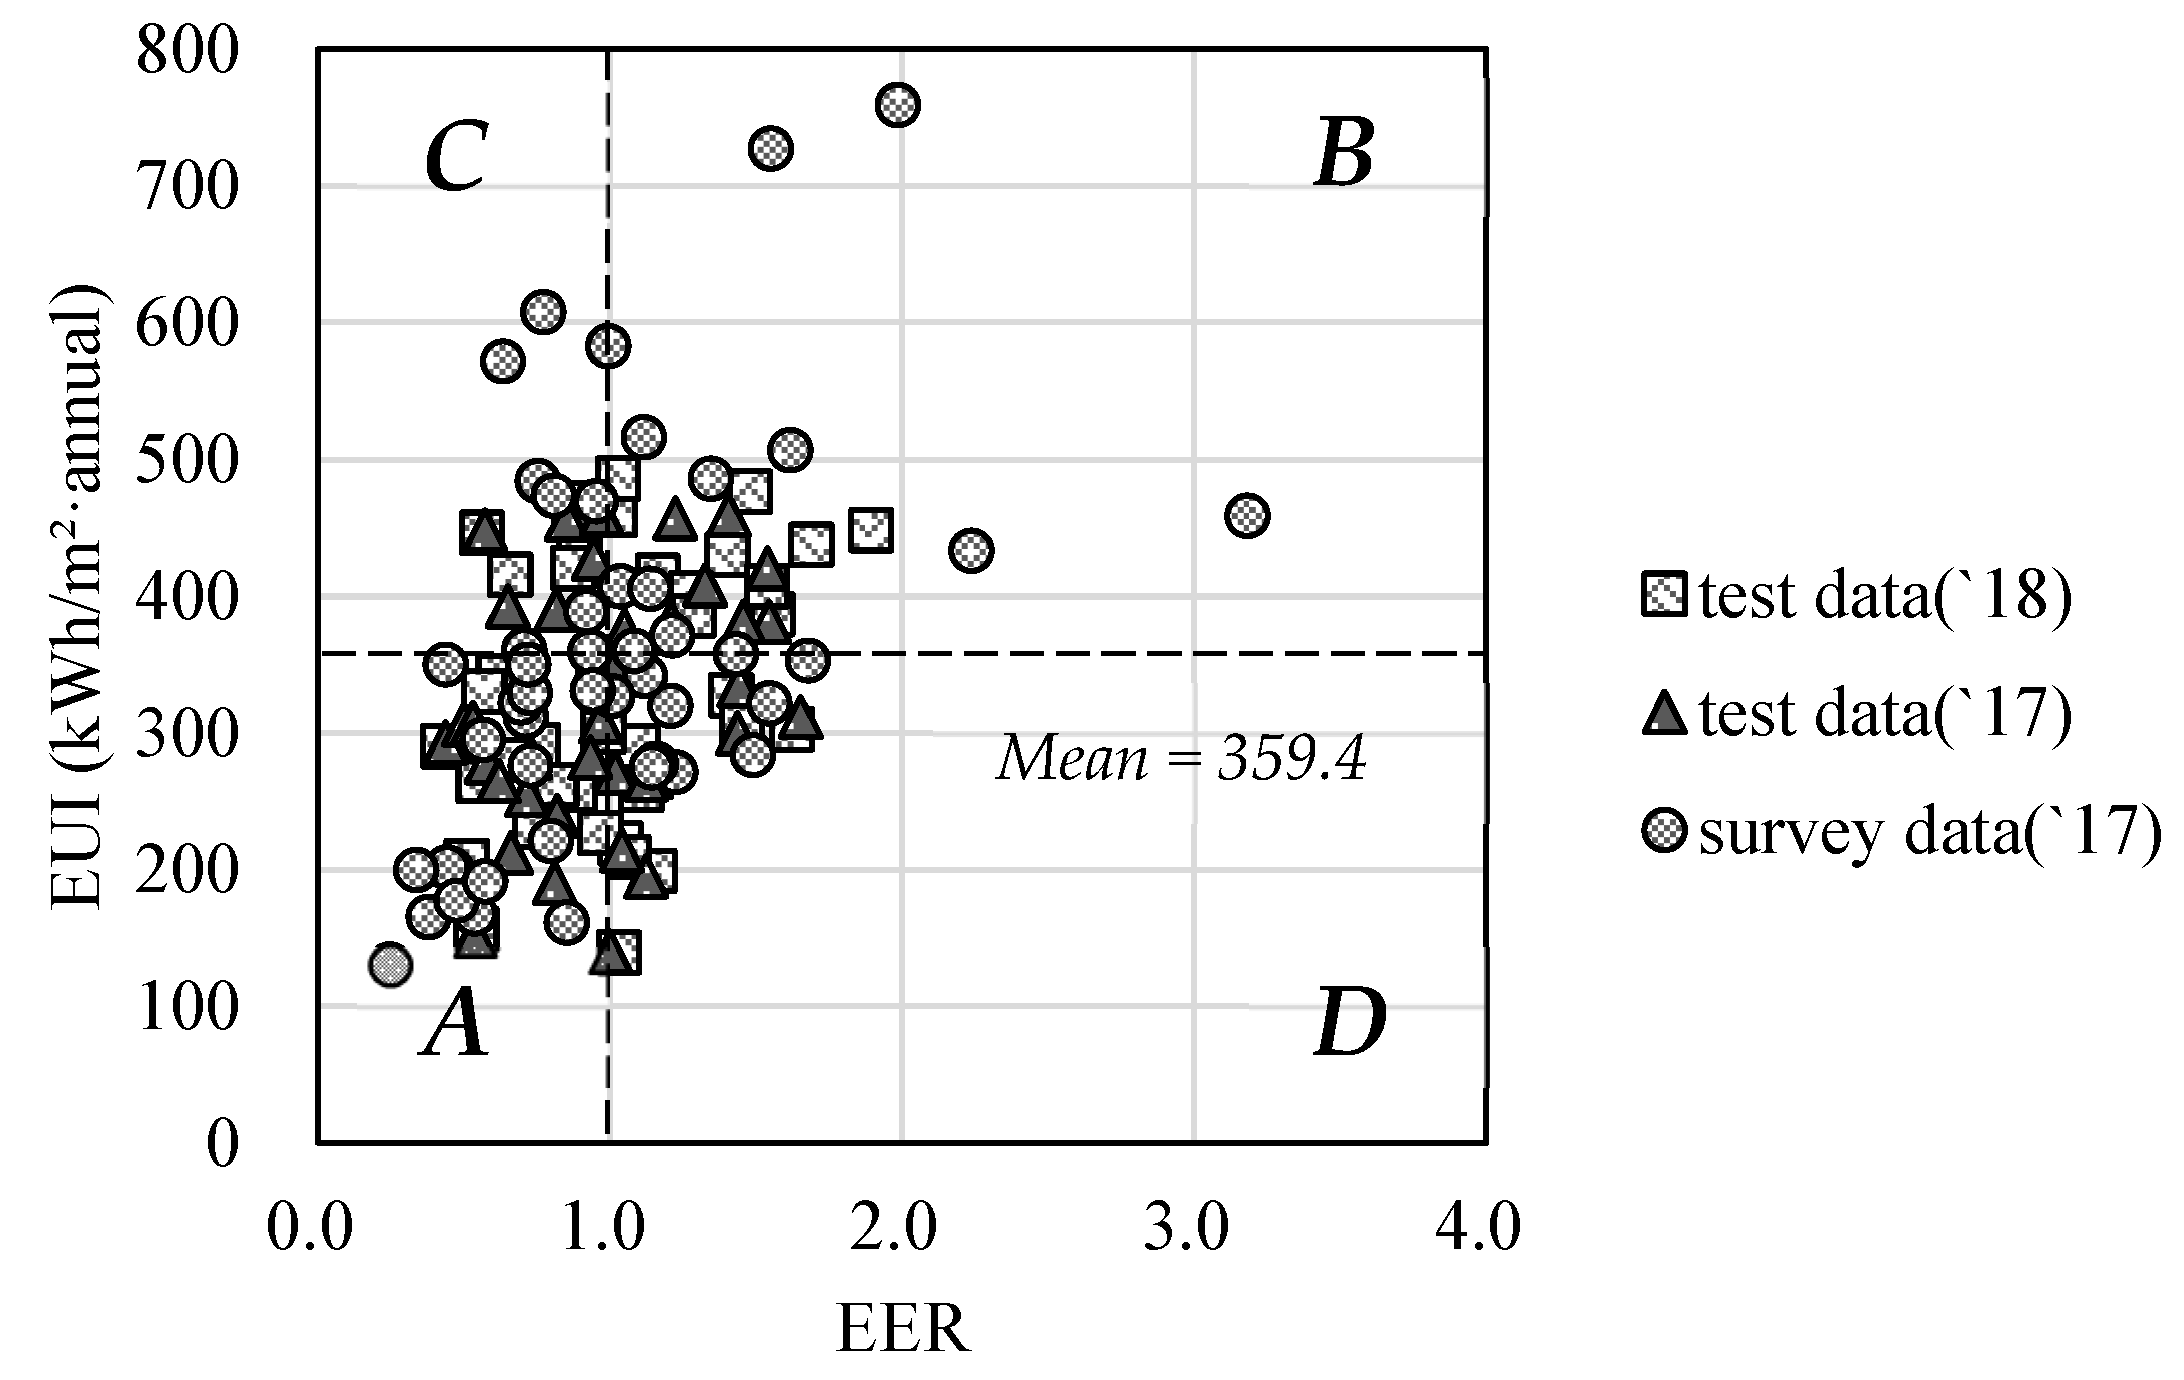
The benchmark model was validated by performing a field survey on hospitals that exhibited similar EUI results but different EER assessment results among the pilot assessment. Figure 3 compares the EUI and EER assessment results between the surveyed samples and the pilot assessment targets in 2017 and 2018.
EUI (kWh/m2) is generally used to assess the energy performance of a building. For new buildings with standard business activities (operation and occupancy characteristics), energy performance assessment using EUI is possible. However, in the case of existing buildings, the assessment of energy consumption that reflected various business activities cannot be considered an objective assessment.
Assuming that the assessment was performed only based on EUI, hospitals that corresponded to areas B and C in Figure 3 could be evaluated as inefficient buildings because their EUI values were higher than the mean EUI. However, hospitals in areas A and C could be evaluated as energy-efficient buildings considering that EER was <1, whereas hospitals in areas B and D corresponded to buildings with high energy consumption rates because the EER was >1.
To validate the developed energy performance benchmark model, several energy-efficient hospitals were selected based on the EER evaluation results in 2017 and 2018, and whether they have any distinct common features in terms of business activities compared to the hospitals that used energy inefficiently was investigated. Briefly, factors that may hinder objectivity in terms of energy performance assessment were examined. For hospitals with high energy efficiency, those in the top 15% in terms of EER that have EUI values lower than the mean value both in 2017 and 2018 were selected below in Table 12.
Field survey hospitals were selected to be of similar sizes to reduce the uncertainty in energy use that can arise due to the differences in the size of the building. The field survey results showed that although hospital A, with the lowest EER, had three CT scanners, the operation rate (number of CT scans) was low. Hospital E had the highest EER and only one CT scanner; however, it had the highest CT operation rate (the largest number of CT scans) among all the hospitals. This indicates that there may be a risk in evaluating the difference in energy consumption using the number of equipment alone if the operation rate is not considered.
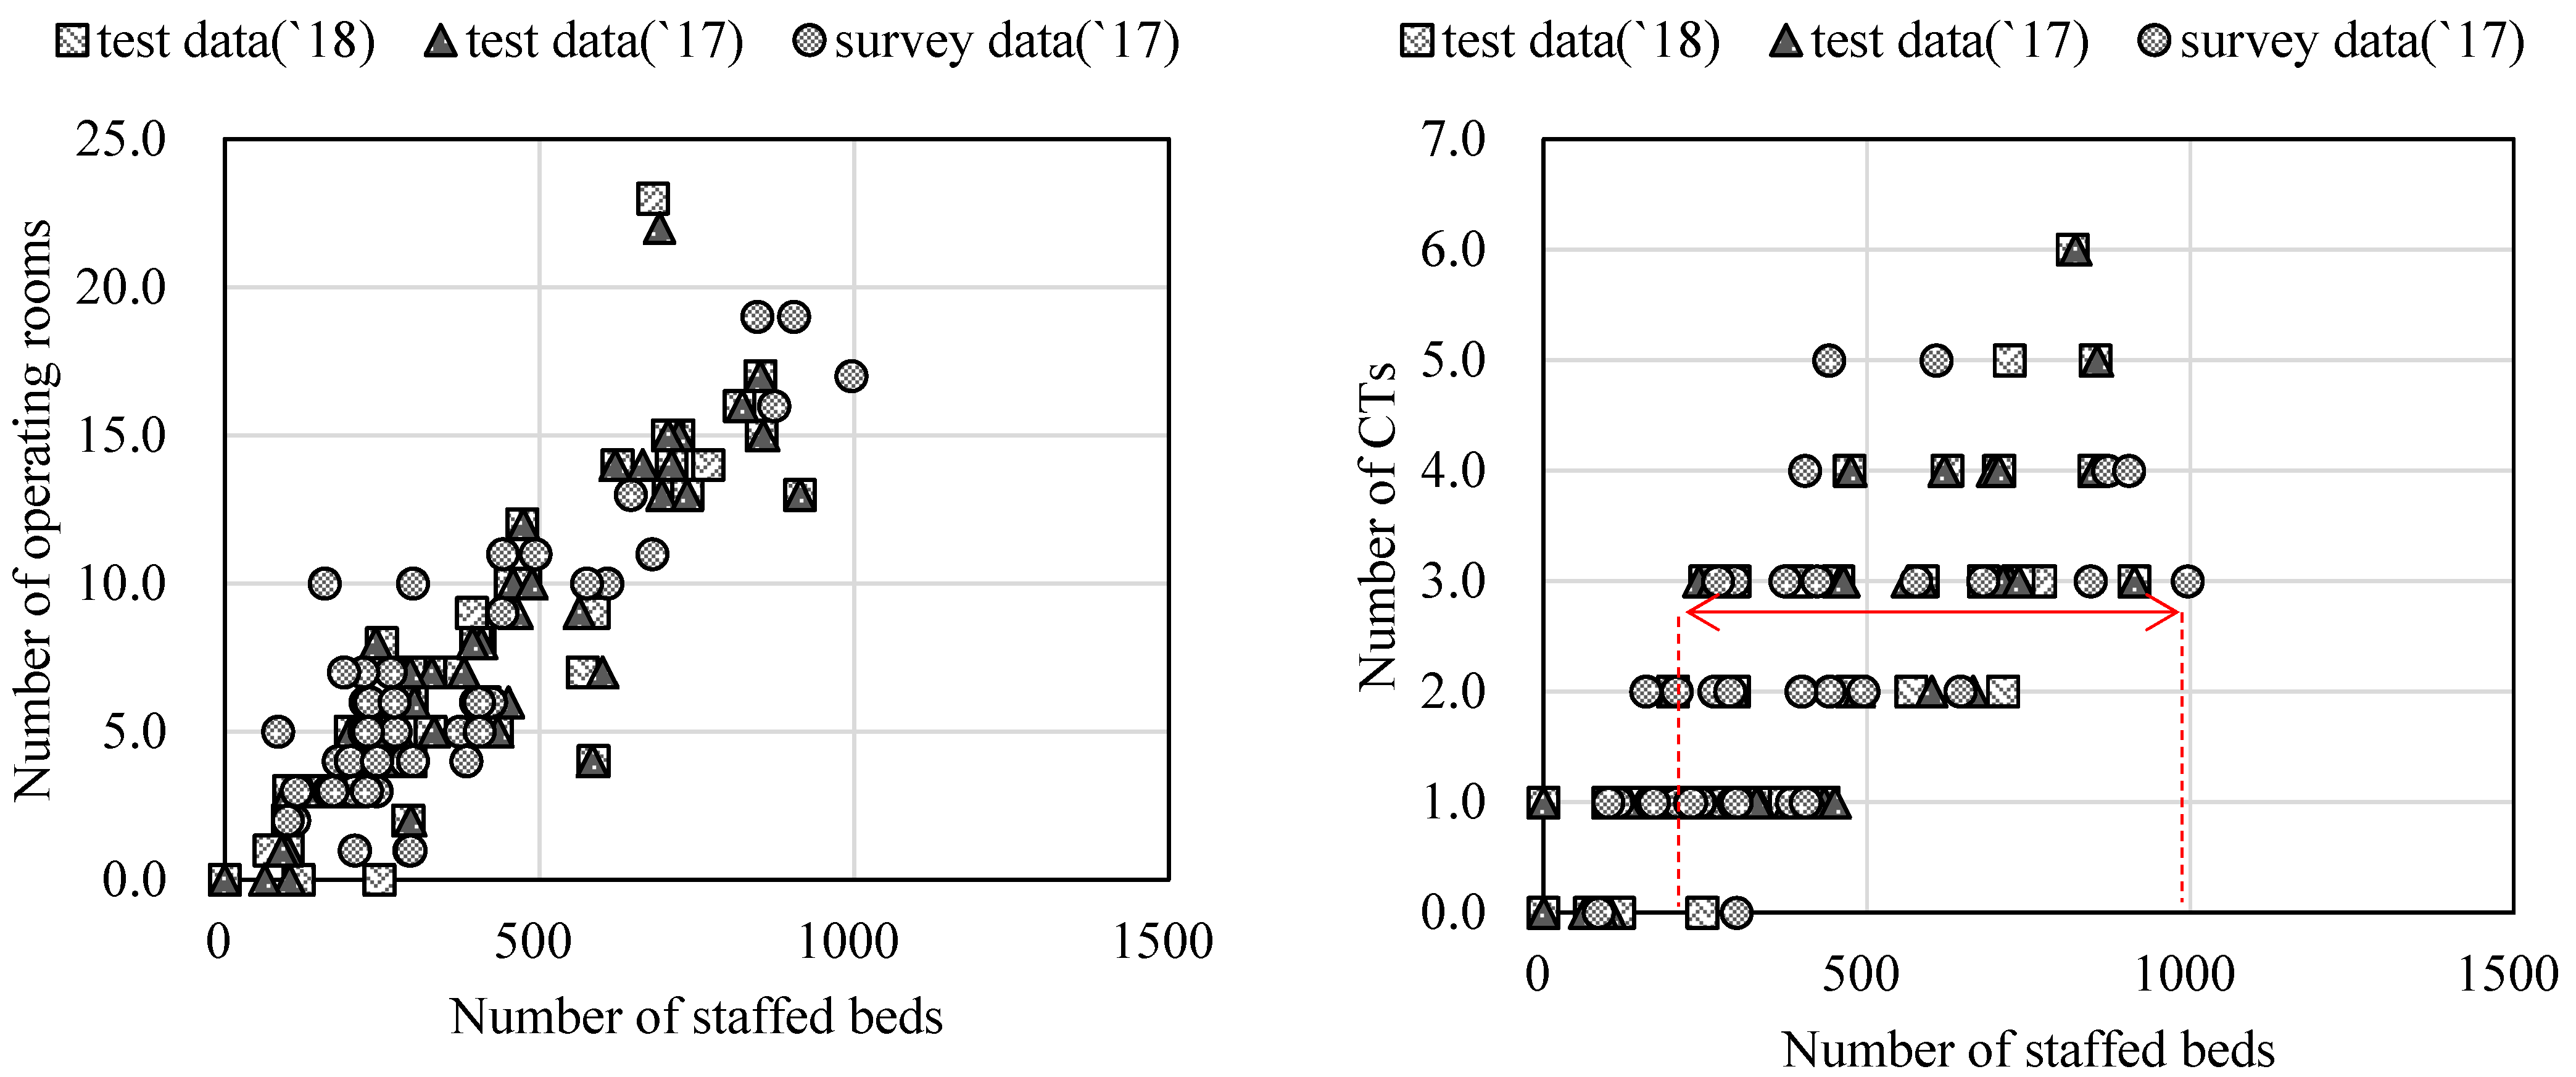
Evidently, the same number of CTs were used despite a large difference in scale (number of beds) in many cases, as shown in Figure 4. However, the number of operating rooms evidently showed an increasing tendency alongside the increase in the number of staffed beds, and there was no significant deviation compared to CT. This indicates that hospitals with a large number of beds could have a high operation rate with a small number of CT scanners.
Based on the energy performance benchmark model, the expected energy consumption increases by 13 MWh per staffed bed, 771 MWh per operating room, and 1666 MWh per CT scanner. This means that the increase in each variable is associated with the increase in the size of the general hospital, which is consequently directly related to the increase in energy. In other words, as the size of the general hospital increases, the number of staffed beds increases gradually, and then when the hospital becomes larger than a certain size, the number of CT scanners increases by one. Therefore, an increase in the number of CT scans causes a large difference in expected energy consumption. However, this leads to distorted energy performance assessment if it is difficult to additionally consider the operation rate confirmed earlier in the field survey. The benchmark model estimates the expected energy consumption considering the business activities, and thus, the assessment is meaningful as it can supplement the parts that can be evaluated favorably or unfavorably with the EUI assessment. However, the model cannot perfectly calibrate the operation, such as the detailed schedule, because it is a statistical model. Briefly, the benchmark model is required to use input variables to maximize statistical representativeness and is required to not reduce representativeness due to excessively large variance. Accordingly, the benchmark model was revised for the existing survey data, excluding the number of CTs, to perform a fair assessment for most of the assessment targets, and the results are presented in Table 13.
For the modified energy performance benchmark model, the influence of the number of beds increased as an indicator that can represent the hospital scale and the operation rate, whereas that of the number of operating rooms decreased. This allowed large-scale hospitals, such as university hospitals, to have lower EER values than before. Briefly, it appears that the influence of the number of staffed beds, which can reflect the operation rate, increased. However, the assessment results for the section of 100–150 beds increased from less than 1 point to more than 1 point. Thus, assessment using the existing model increased EER because it was difficult to consider the operation rate for large-scale hospitals, and assessment using the modified model increased the EER of small hospitals because the equipment used in small hospitals was not sufficiently considered. Apparently, the characteristics of general hospitals, which were significantly affected by variables related to beds and medical services, were assessed differently at both extremes of the scale depending on whether the equipment was included or not.
Based on the distribution of general hospitals by class in terms of the number of beds, the distribution of the number of hospitals with 100–200 beds showed a small proportion compared to the number of hospitals with more than 200 beds. Among them, a significant score change occurred for hospitals with <150 beds. Thus, a direction was set to exclude hospitals with <150 beds from the assessment targets when the modified model was applied.
Figure 5 shows the difference in EER assessment results between the existing and modified benchmark models. When the assessment was performed using the existing model, EER values with a high outlier level of more than 2 points were observed compared to the general distribution. However, when an assessment was conducted using the modified model, the distribution deviation of the EER score decreased.
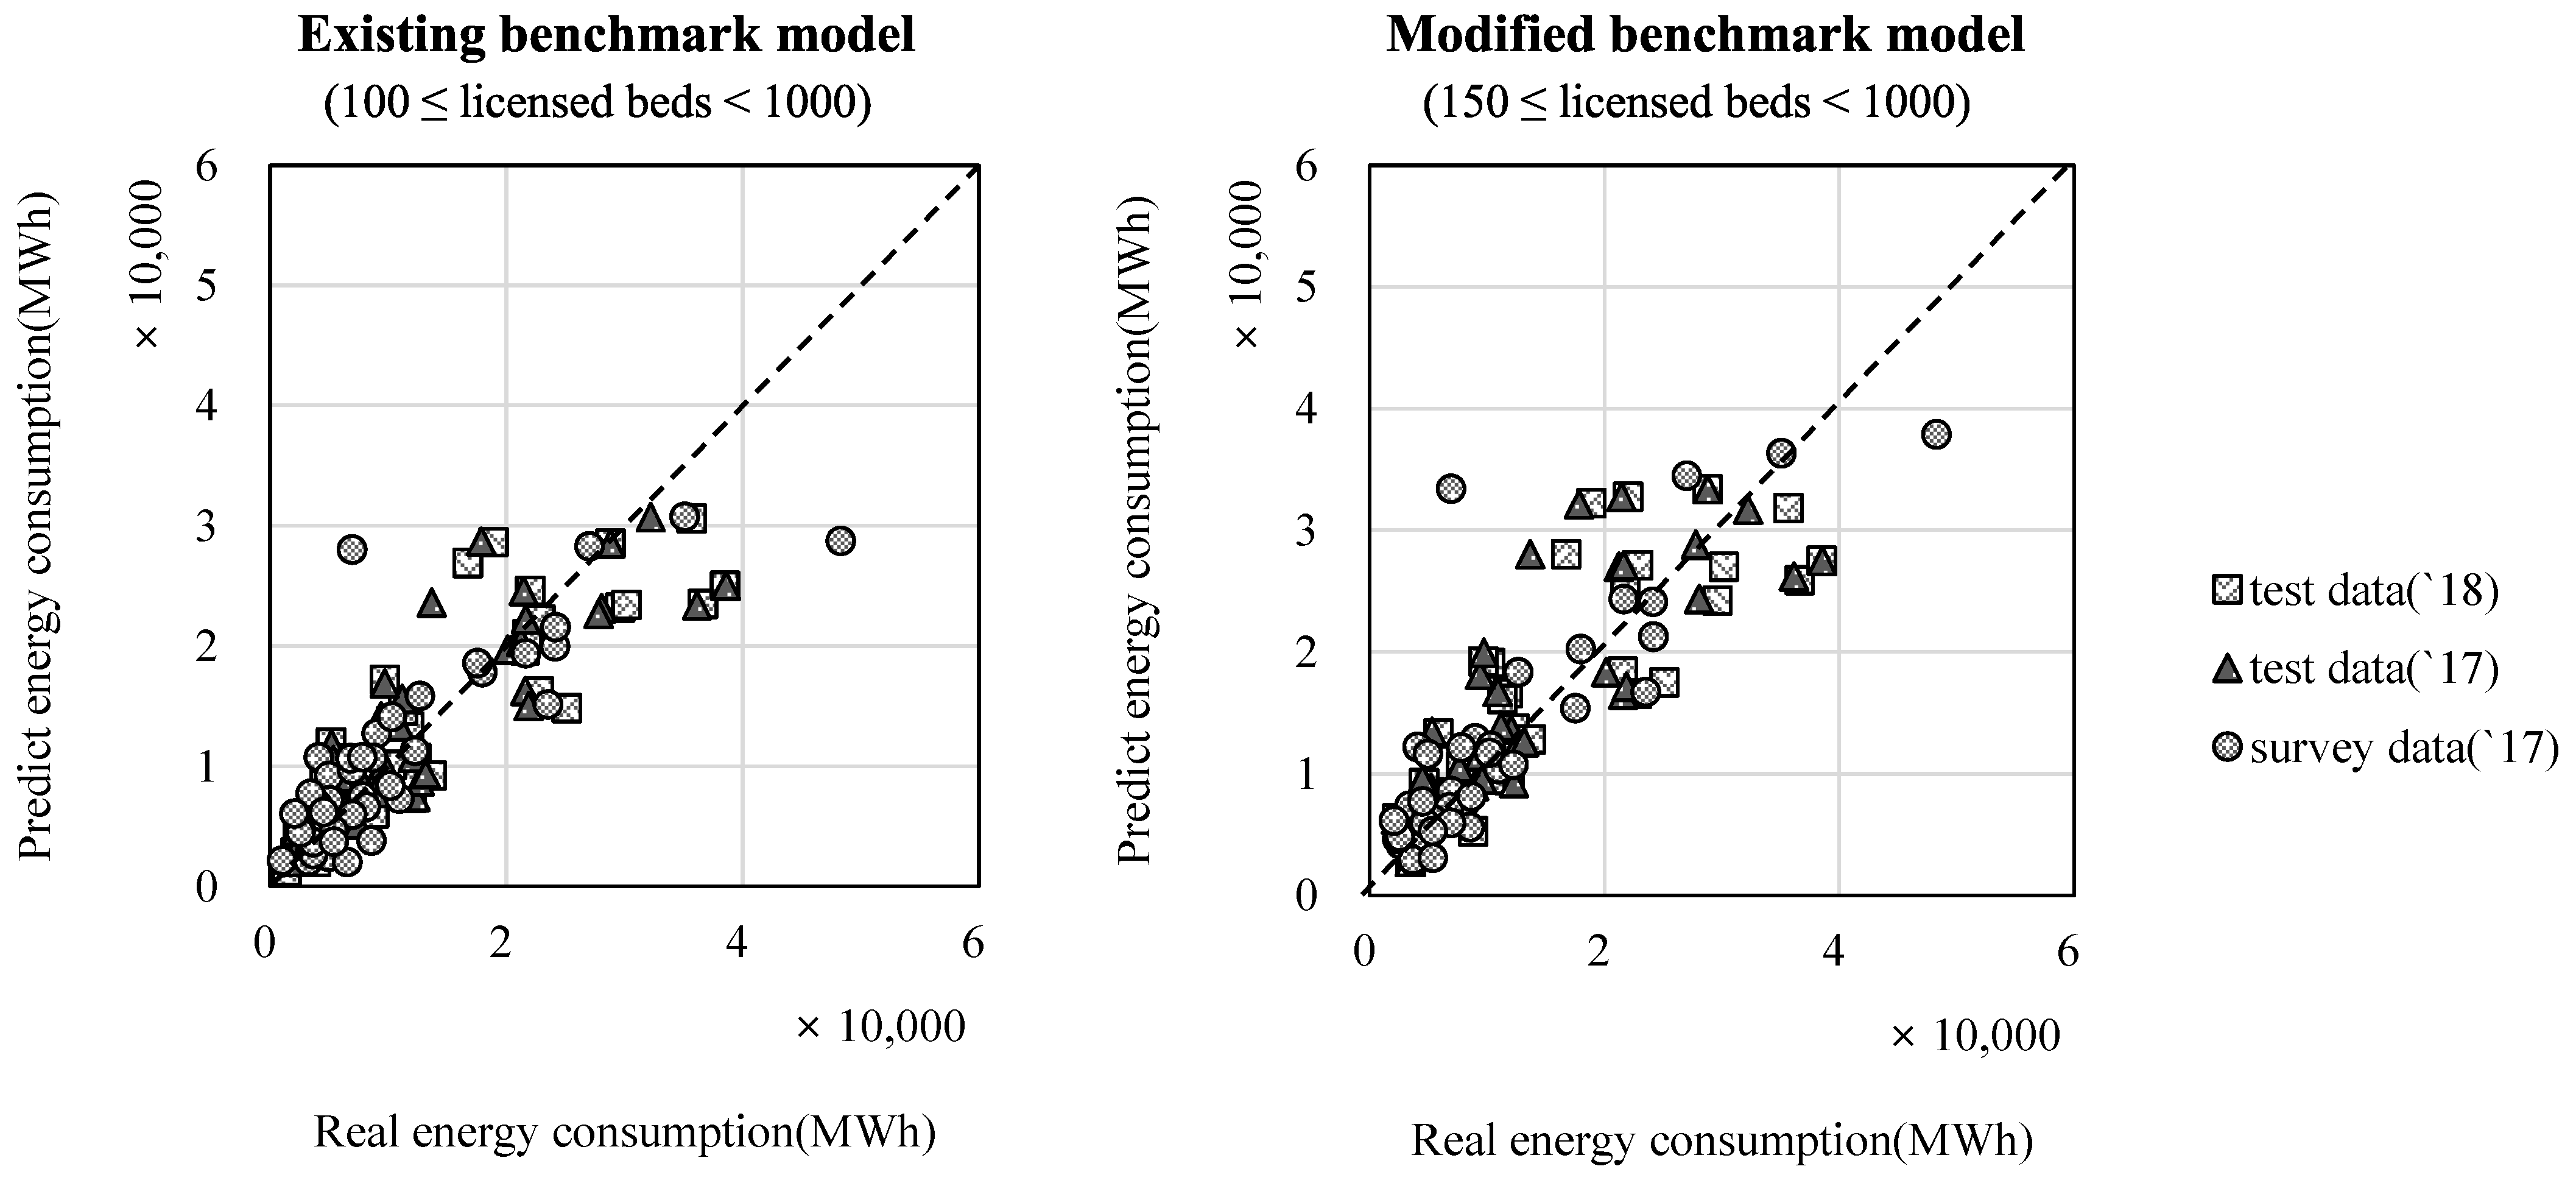
The reason for the decrease in EER score distribution deviation can be confirmed by comparing the trend of the expected energy consumption with that of the actual energy consumption, as shown in Figure 6. The diagonal line corresponds to the case where the expected energy consumption coincides with the actual energy consumption, and the results closer to the diagonal line imply that the expected energy consumption was similar to the actual energy consumption. When the modified benchmark model was applied, the expected and actual energy consumption of the hospital group with high energy consumption was closer to the diagonal line than when the existing benchmark model was applied. This was likely because the influence of the number of staffed beds was considered more significant for large hospitals with high energy consumption, and the expected energy consumption was calculated to be higher than before by excluding the number of CT scans from variable entries.

4.3. Energy Performance Assessment by Applying the Improved Benchmark Model

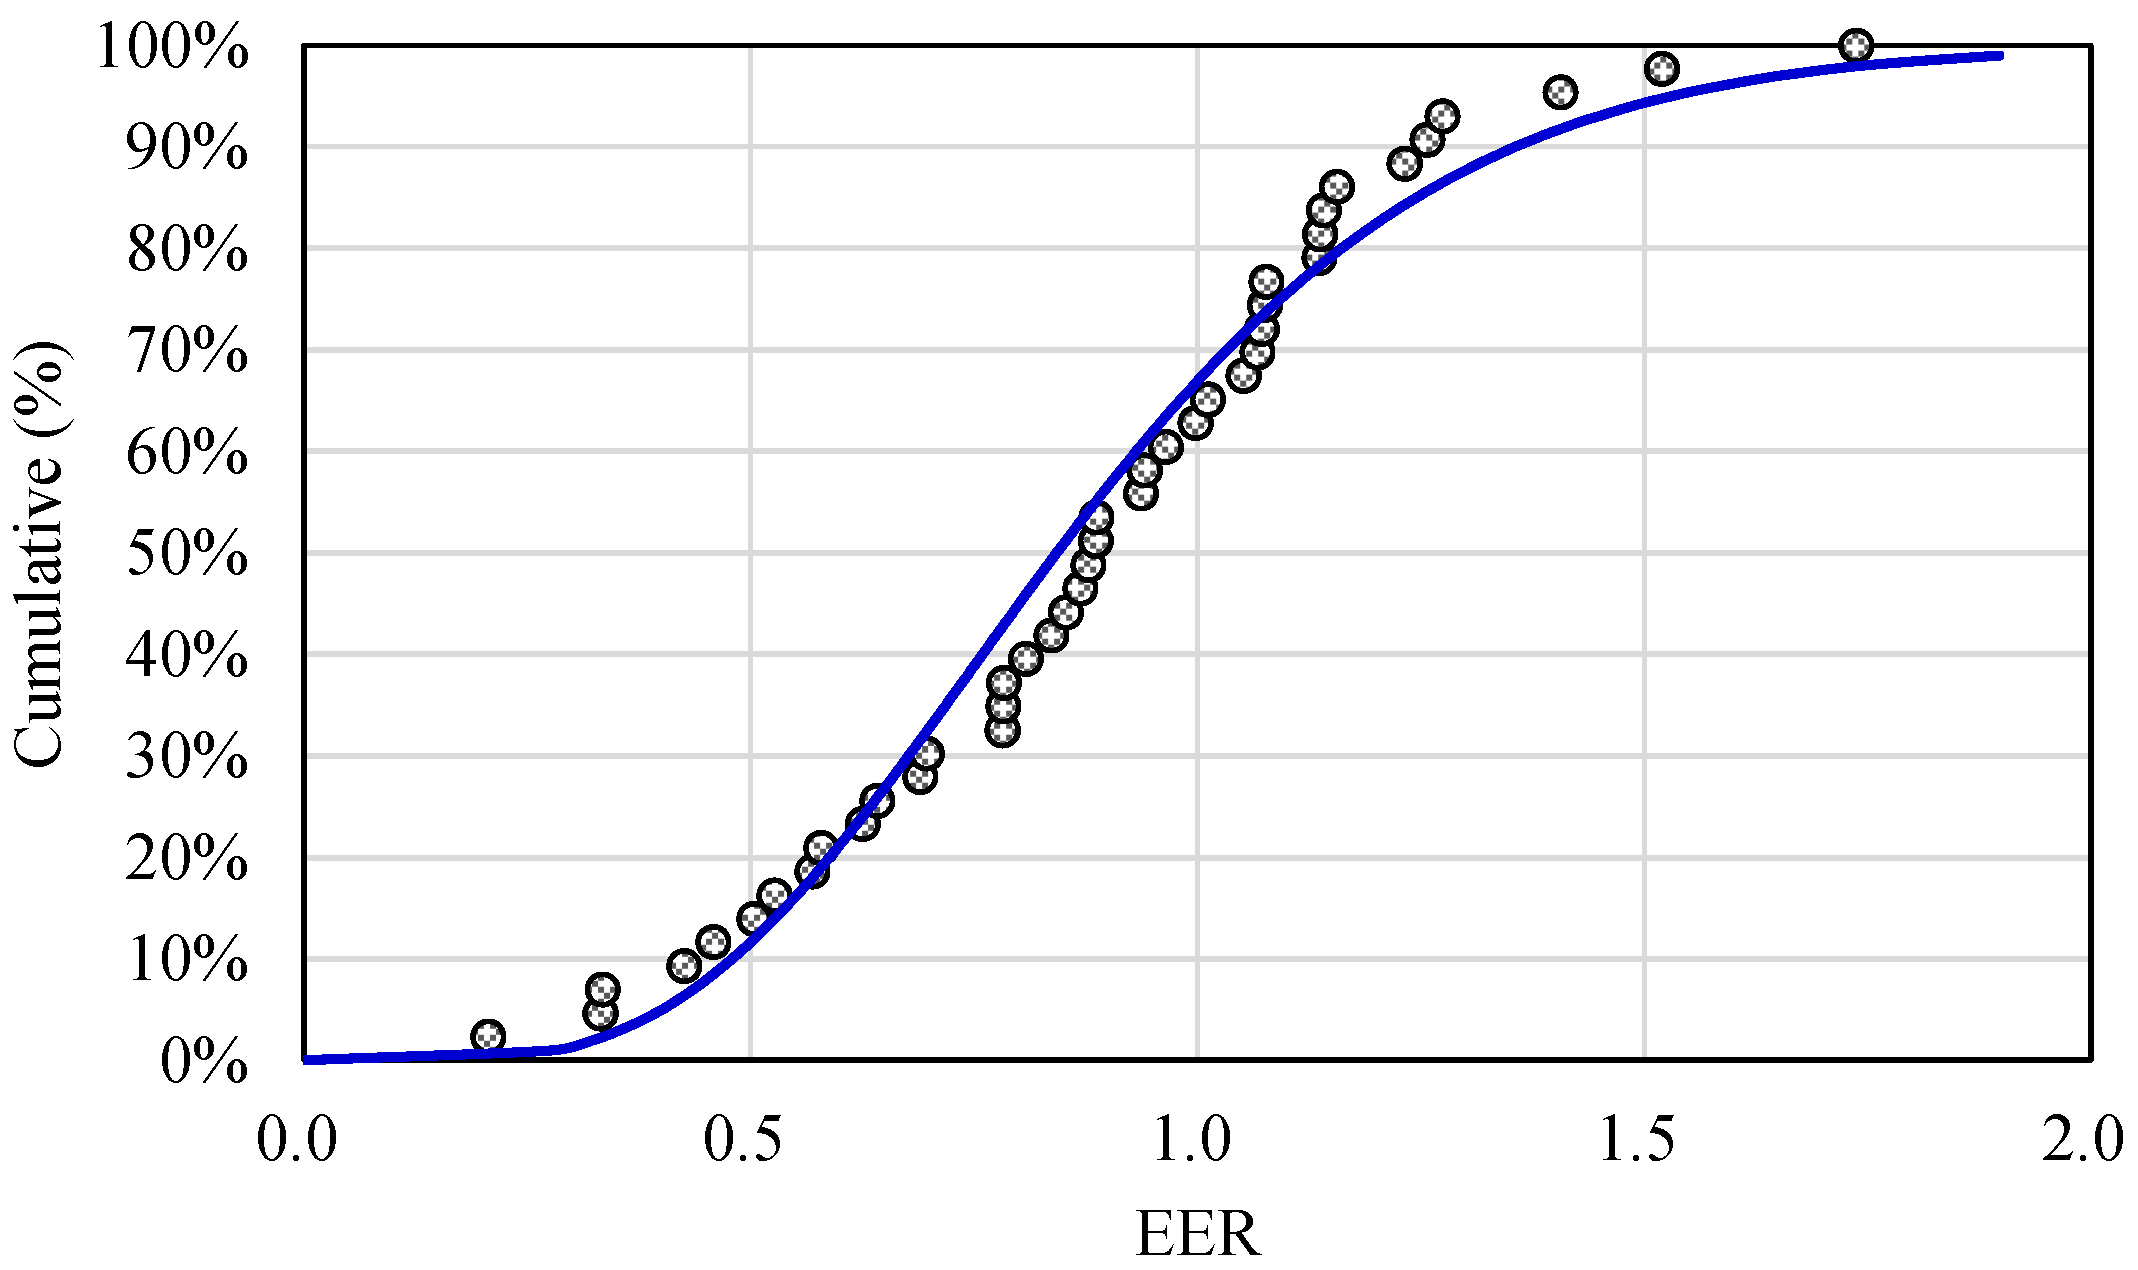
The EER score was converted into a scale of 1–100 points referred to by the US Energy Star System. [9,10]. First, as shown in Figure 7, the cumulative distribution of EER that utilized the modified benchmark model was applied to the previously surveyed 48 general hospitals, and the optimal gamma curve was identified from the data using the gamma distribution and minimizing the sum of squares of the differences.
As the curve is mathematically defined by a specific equation, it is possible to calculate EER at a given percentage using the curve. Table 14 presents the score conversion look-up table derived based on the EER calculation results of the survey data.
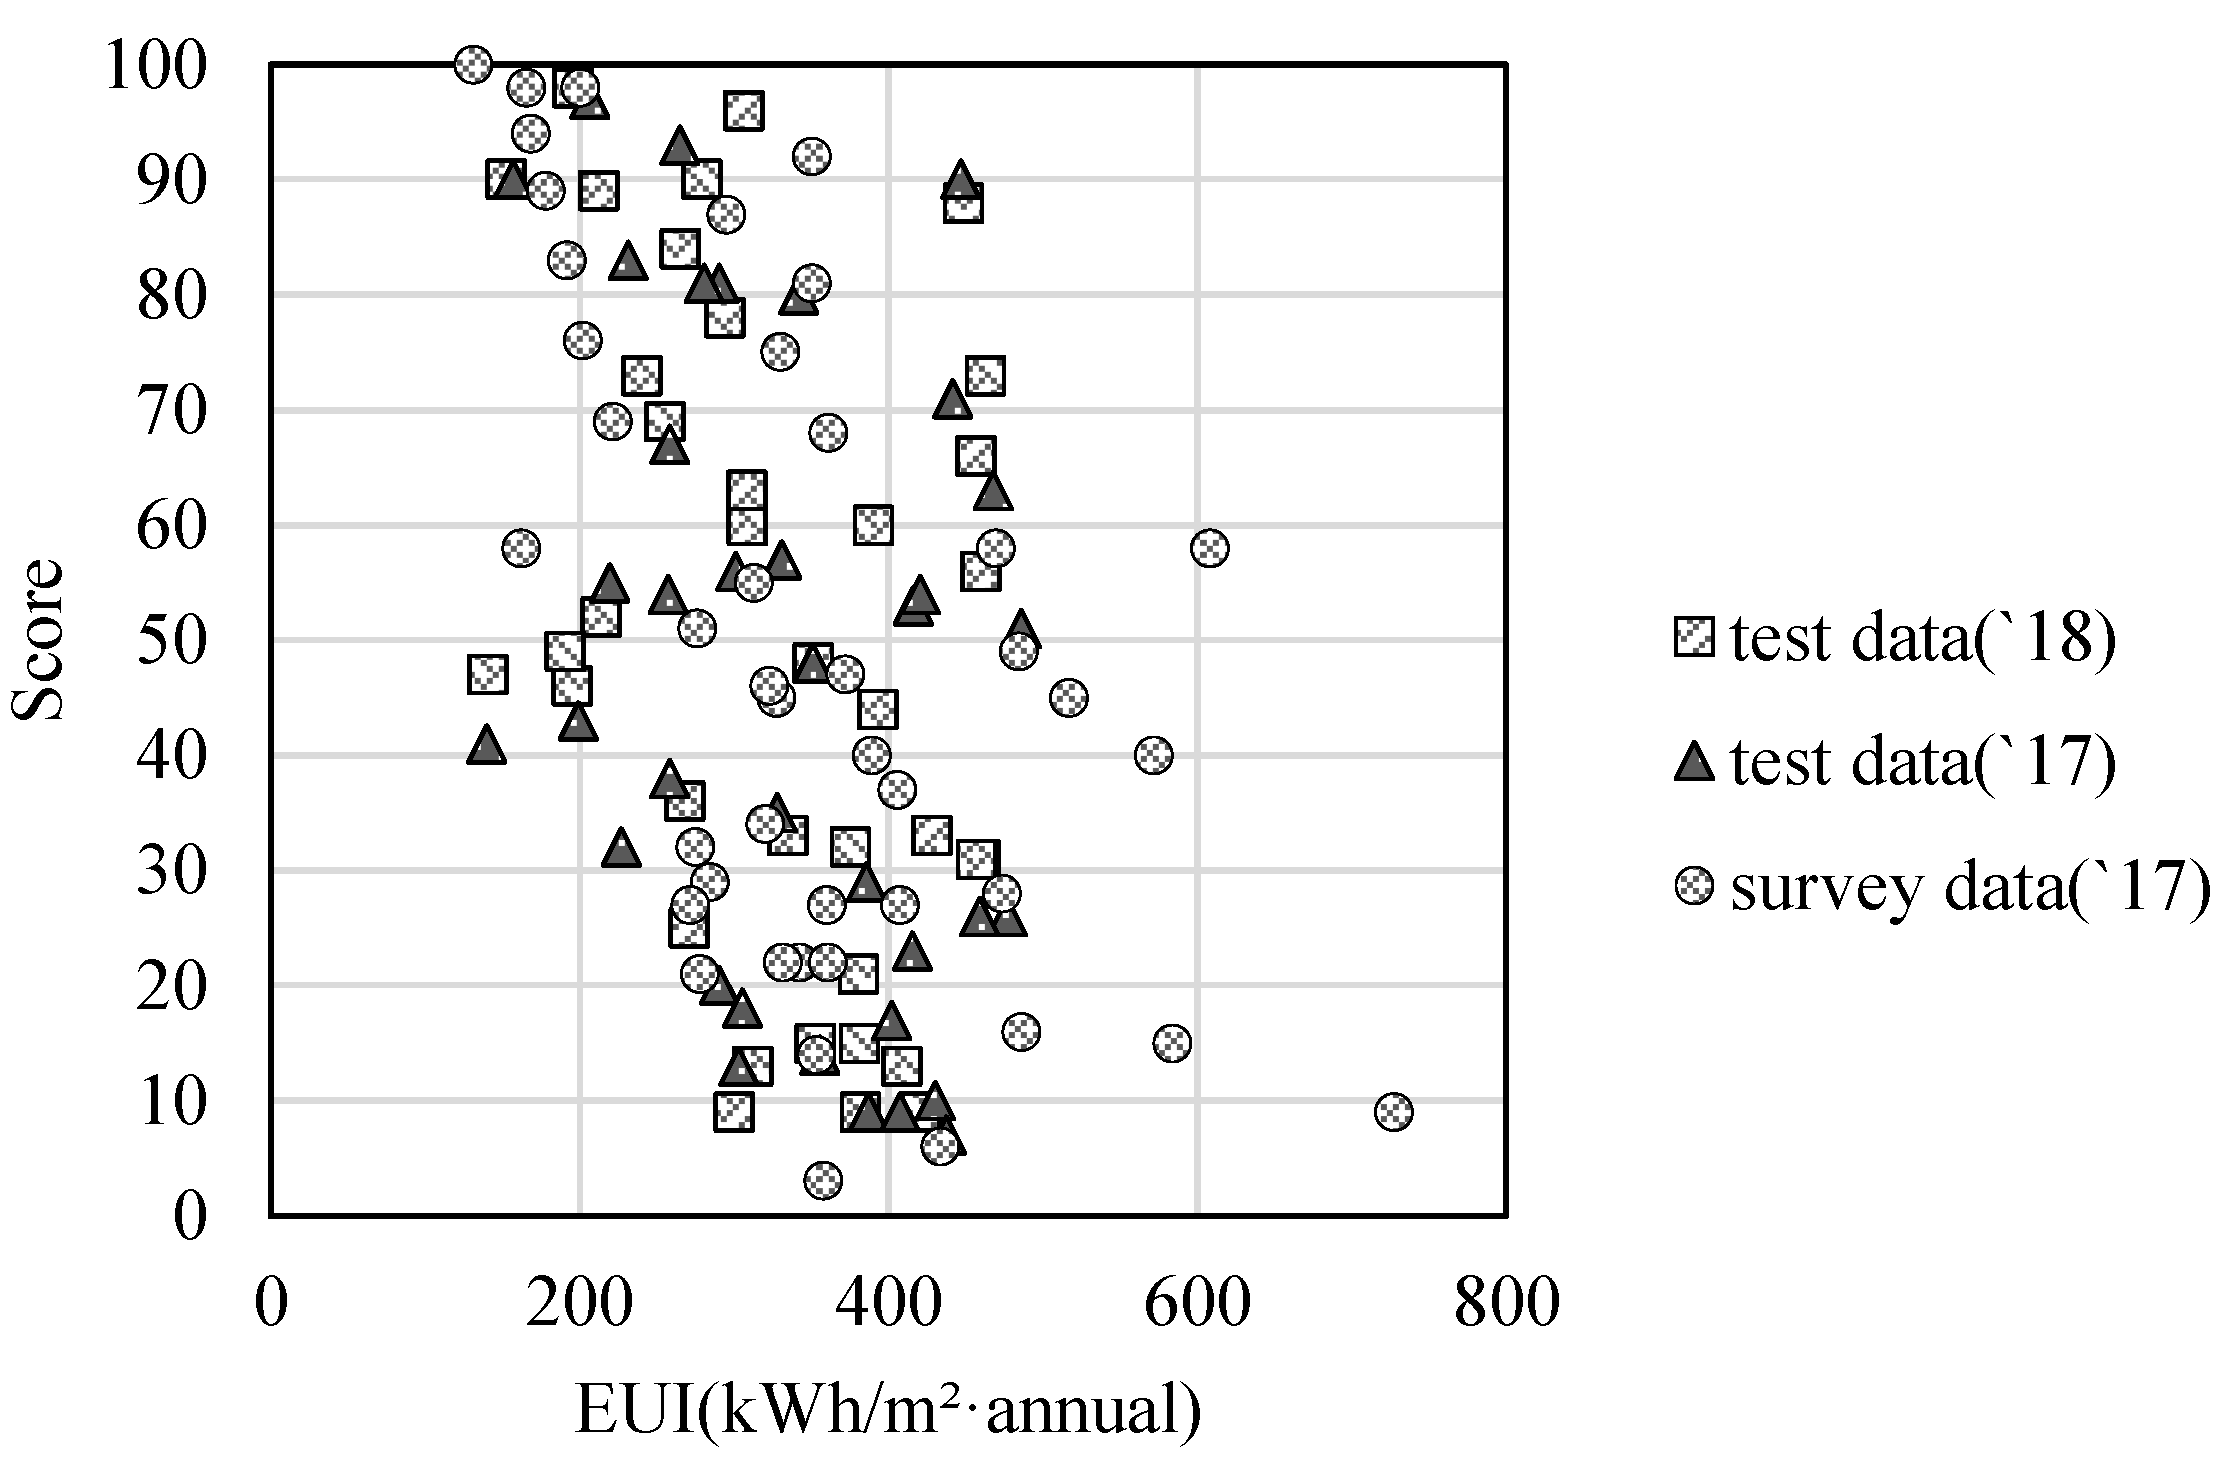
The energy performance scores of general hospitals were calculated based on the look-up table and compared with EUI, as shown in Figure 8. As EUI increased, the energy performance score showed a tendency to decrease. When the score was very high, EUI converged to ~100 kWh/m2. When EUI was higher than ~500 kWh/m2, the performance score was generally lower than 40 points. However, the energy performance score was generally evenly distributed according to EUI. Briefly, energy performance assessments only based on EUI may lead to distorted results that fail to consider operation or occupancy variables.
Benchmarks can be used to identify buildings with low scores and determine if energy efficiency needs to be improved. The benchmark developed in this study can evaluate the energy performance level and identify buildings with problems; however, additional investigations are required to analyze the causes. Identifying buildings that require additional investigations is important, and they can be identified based on the energy performance assessment through the developed benchmark.

5. Conclusions

In this study, a benchmark was developed to assess the energy performance of hospitals in Korea objectively. A benchmark for calculating the predicted energy of the hospital was derived using multiple regression analysis, and the benchmark was improved via a pilot test.
The survey items of business activities and a survey method were established based on domestic and overseas cases, and benchmark model development and improvement were performed. First, a sample survey was conducted on a total of 48 hospitals. The number of staffed beds, which is a representative indicator related to the operating scale of the hospital, and the number of operating rooms and the number of CT scans, which are related to the surgical equipment and electricity use of the hospital, were included as major independent variables. However, via pilot assessment, it was found that the number of CTs was a factor that could advantageously assess the energy performance of small hospitals. Therefore, a multiple regression analysis model for the total energy consumption was established by excluding the number of CTs.
When reassessment was performed using the improved benchmark, the difference between predicted and actual energy consumption decreased generally. However, in the case of hospitals with under 150 beds, EER increased rather excessively, likely because the CTs used in small hospitals were not considered. Therefore, the benchmark for hospitals with more than 150 beds with significantly reduced errors was derived. These findings indicate that even statistically reasonable benchmarks need to check actual operational details. It is necessary to clearly identify what benchmarks can be used as assessment criteria and to review whether there can be buildings that are undervalued continuously.
This study proposed the need for validation and improvement of benchmarks through actual building visits rather than simply using statistically meaningful benchmarks. However, for a fair energy evaluation that can comprehensively consider the size of the hospital, further research is required that considers the utilization rate for energy-intensive devices. In addition, it is necessary to review the usability of the surveyed items to derive improvement measures for buildings with poor scores according to the assessment results. To this end, future research needs to be performed on Asset Rating (AR) to assess energy performance under standard operating conditions based on the physical performance information of buildings and to compare it with EER results.

Author Contributions

Conceptualization, H.G.K. and S.S.K.; methodology, H.G.K. and S.S.K.; formal analysis, H.G.K., S.J.K. and D.W.J.; investigation, H.G.K., S.J.K. and D.W.J.; writing—original draft, H.G.K.; writing—review and editing, S.J.K. and S.S.K.; supervision, S.S.K.; project administration, S.S.K. All authors have read and agreed to the published version of the manuscript.

Funding

This study was supported by the Basic Science Research Program through the National Research Foundation of Korea (NRF), funded by the Ministry of Science, ICT & Future Planning (grant number NRF2020R1A2C110303311) and the Korea Institute of Energy Technology Evaluation and Planning (KETEP) and the Ministry of Trade, Industry & Energy (MOTIE) of the Republic of Korea (No. 20202020800360).

Institutional Review Board Statement

Not applicable.

Informed Consent Statement

Not applicable.

Data Availability Statement

Not applicable.

Conflicts of Interest

The authors delare no conflict of interest.

References

  1. Kim, H.G.; Kim, H.J.; Jeon, C.H.; Chae, M.W.; Cho, Y.H.; Kim, S.S. Analysis of energy saving effect and cost efficiency of ECMs to upgrade the building energy code. Energies 2020, 13, 4955. [Google Scholar] [CrossRef]
  2. Managan, K.; Araya, M.; Layke, J. Driving Transformation to Energy Efficient Buildings: Policies and Actions; Institute for Building Efficiency: Milwaukee, WI, USA, 2012. [Google Scholar]
  3. Wang, X.; Feng, W.; Cai, W.; Ren, H.; Ding, C.; Zhou, N. Do residential building energy efficiency standards reduce energy consumption in China?—A data-driven method to validate the actual performance of building energy efficiency standards. Energy Policy 2019, 131, 82–98. [Google Scholar]
  4. O’Brien, W.; Tahmasebi, F.; Andersen, R.K.; Azar, E.; Barthelmes, V.; Belafi, Z.D.; Berger, C.; Chen, D.; De Simone, M.; Simona d’Oca; et al. An international review of occupant-related aspects of building energy codes and standards. Build. Environ. 2020, 179, 106906. [Google Scholar] [CrossRef]
  5. Ministry of Land, Infrastructure, and Transport (MOLIT), e-Architectural Information System (e-AIS). Available online: https://cloud.eais.go.kr/ (accessed on 1 October 2022).
  6. Ministry of Land, Infrastructure, and Transport (MOLIT), Statistics on Buildings. Available online: http://www.molit.go.kr/USR/NEWS/m_71/dtl.jsp?id=95085286/ (accessed on 1 October 2022).
  7. Ye, Y.; Zuo, W.; Wang, G. A comprehensive review of energy-related data for U.S. commercial buildings. Energy Build. 2019, 186, 126–137. [Google Scholar] [CrossRef]
  8. Dascalaki, E.G.; Droutsa, K.; Gaglia, A.G.; Kontoyiannidis, S.; Balaras, C.A. Data collection and analysis of the building stock and its energy performance—An example for Hellenic buildings. Energy Build. 2010, 42, 1231–1237. [Google Scholar] [CrossRef]
  9. Environmental Protection Agency (EPA); Department of Energy (DOE). Energy Star Performance Ratings: Technical Methodology; US Environmental Protection Agency: Washington, DC, USA, 2011.
  10. Environmental Protection Agency (EPA). Benchmark with EPA’s ENERGY STAR Portfolio Manager. Available online: https://www.energystar.gov/buildings/facility-owners-and-managers/existing-buildings/use-portfolio-manager/ (accessed on 1 October 2022).
  11. Burman, E.; Hong, S.-M.; Paterson, G.; Kimpian, J.; Mumovic, D. A comparative study of benchmarking approaches for non-domestic buildings: Part 2—Bottom-up approach. Int. J. Sustain. Built Environ. 2014, 3, 247–261. [Google Scholar] [CrossRef] [Green Version]
  12. Hong, S.M.; Paterson, G.; Burman, E.; Steadman, P.; Mumovic, D. A comparative study of benchmarking approaches for non-domestic buildings: Part 1—Top-down approach. Int. J. Sustain. Built Environ. 2013, 2, 119–130. [Google Scholar] [CrossRef] [Green Version]
  13. Mathew, P.; Mills, E.; Bourassa, N.; Brook, M. Action-oriented benchmarking: Using the CEUS database to benchmark commercial buildings in California. Energy Eng. 2008, 105, 6–18. [Google Scholar] [CrossRef] [Green Version]
  14. Wang, S.; Yan, C.; Xiao, F. Quantitative energy performance assessment methods for existing buildings. Energy Build. 2012, 55, 873–888. [Google Scholar] [CrossRef]
  15. Chung, W. Review of building energy-use performance benchmarking methodologies. Appl. Energy 2011, 88, 1470–1479. [Google Scholar] [CrossRef]
  16. Luis, P.L.; José, O.; Rocío, G.; Ismael, R.M. A review of benchmarking, rating and labelling concepts within the framework of building energy certification schemes. Energy Build. 2009, 41, 272–278. [Google Scholar]
  17. Monts, J.K.; Blissett, M. Assessing energy efficiency and energy conservation potential among commercial buildings: A statistical approach. Energy 1982, 7, 861–869. [Google Scholar] [CrossRef]
  18. Chung, W.; Hui, Y.V.; Lam, Y.M. Benchmarking the energy efficiency of commercial buildings. Appl. Energy 2006, 83, 1–14. [Google Scholar] [CrossRef]
  19. Dahlan, N.Y.; Mohamed, H.; Kamaluddin, K.A.; Abd Rahman, N.M.; Reimann, G.; Chia, J.; Ilham, N.I. Energy Star based benchmarking model for Malaysian Government hospitals—A qualitative and quantitative approach to assess energy performances. J. Build. Eng. 2022, 45, 103460. [Google Scholar] [CrossRef]
  20. Department for Communities and Local Government (DCLG). The Government’s Methodology for the Production of Operational Ratings, Display Energy Certificates and Advisory Reports; Communities and Local Government Publications: Wetherby West Yorkshire, UK, 2008.
  21. Sustainable Energy Authority of Ireland (SEAI): Display Energy Certificate (DEC). Available online: https://www.seai.ie/business-and-public-sector/display-energy-certificate/ (accessed on 1 October 2022).
  22. Energy Information Agency. Commercial Buildings Energy Consumption Survey. 2018. Available online: https://www.eia.gov/consumption/commercial/ (accessed on 1 October 2022).
  23. Rodin, C. Energideklaration för John Mattson Fastighets AB: Energibesparing med bibehållen kundkvalitet; Department of Technology and Society, Mälardalens University: Västerås, Sweden, 2011. [Google Scholar]
  24. Australian Government Department of Industry, Science, Energy and Resources. Commercial Building Disclosure (CBD). Available online: http://cbd.gov.au/ (accessed on 1 October 2022).
  25. Bundesministerium für Wirtschaft und Energie und Bundesministerium des Innern, für Bau und Heimat. Bekanntmachung der Regeln für Energieverbrauchswerte und der Vergleichswerte im Nichtwohngebäudebestand; Bundesministerium für Wirtschaft und Energie und Bundesministerium des Innern, für Bau und Heimat: Berlin, Germany, 2015. [Google Scholar]
  26. Bureau of Energy Efficiency. Scheme for Star Rating of Hospital Buildings; Ministry of Power, Government of India Publications: New Delhi, India, 2014.
  27. Ministry of Land, Infrastructure and Transport (MOLIT). Green Together. Available online: https://www.greentogether.go.kr/ (accessed on 1 October 2022).
  28. Ministry of Land, Infrastructure and Transport (MOLIT). Building Data Open System. Available online: http://open.eais.go.kr/main/main.do/ (accessed on 1 October 2022).
  29. Korea Energy Agency (KEA). Energy Audit One-Stop Civil Service. Available online: https://bea.kemco.or.kr/bd/hp/index/ (accessed on 1 October 2022).
  30. Jung, H.K.; Yu, K.H.; Jeong, Y.S. Energy performance analysis on the design conditions of high-rise apartment houses in South Korea. Adv. Mater. Res. 2014, 1025–1026, 1099–1102. [Google Scholar] [CrossRef]
  31. Park, D.; Yu, K.; Yoon, Y.; Kim, K.; Kim, S. Analysis of a building energy efficiency certification system in Korea. Sustainability 2015, 7, 16086–16107. [Google Scholar] [CrossRef] [Green Version]
  32. Jain, N.; Burman, E.; Stamp, S.; Shrubsole, C.; Bunn, R.; Oberman, T.; Barrett, E.; Aletta, F.; Kang, J.; Raynham, P.; et al. Building performance evaluation of a new hospital building in the UK: Balancing indoor environmental quality and energy performance. Atmosphere 2021, 12, 115. [Google Scholar] [CrossRef]
  33. Vaziri, S.M.; Rezaee, B.; Monirian, M.A. Utilizing renewable energy sources efficiently in hospitals using demand dispatch. Renew. Energy 2020, 151, 551–562. [Google Scholar] [CrossRef]
  34. American Hospital Association (AHA). AHA Annual Survey Database. Available online: https://www.ahadata.com/aha-annual-survey-database/ (accessed on 1 October 2022).
  35. American Society for Healthcare Engineering (ASHE). ASHE: Energy & Water Survey. Available online: www.ashe.org/energysurvey/ (accessed on 1 October 2022).
  36. Korea Energy Economics Institute; Korea Energy Agency. 2016 Energy Consumption Survey; Ministry of Trade, Industry and Energy (MTIE): Sejong, Korea, 2017. [Google Scholar]
  37. Trost, J.E. Statistically nonrepresentative stratified sampling: A sampling technique for qualitative studies. Qual. Sociol. 1986, 9, 54–57. [Google Scholar] [CrossRef]
  38. Singer, B.C. Hospital Energy Benchmarking Guidance-Version 1.0 (No. LBNL-2738E); Lawrence Berkeley National Lab. (LBNL): Berkeley, CA, USA, 2009. [Google Scholar]
  39. Sheppy, M.; Pless, S.; Kung, F. Healthcare Energy End-Use Monitoring (No. NREL/TP-5500-61064); National Renewable Energy Lab. (NREL): Golden, CO, USA, 2014. [Google Scholar]
  40. The Chartered Institution of Building Services Engineers (CIBSE). Energy Benchmarks CIBSE TM46; CIBSE: London, UK, 2008. [Google Scholar]
  41. Korean Hospital Association (KHA). 2016 List of Hospitals; Korean Hospital Association (KHA): Seoul, Korea, 2017. [Google Scholar]
  42. Myers, J.L.; Well, A.D.; Lorch, R.F., Jr. Research Design and Statistical Analysis; Routledge: London, UK, 2013. [Google Scholar]
  43. Scheaffer, W.; Mendenhall, R.L., III; Ott, K.G. Gerow, Elementary Survey Sampling; Cengage Learning: Mason, OH, USA, 2011. [Google Scholar]
  44. Ihaka, R.; Gentleman, R. R: A Language for Data Analysis and Graphics. J. Comput. Graph. Stat. 1996, 5, 299–314. [Google Scholar]
  45. Thompson, B. Stepwise regression and stepwise discriminant analysis need not apply here: A guidelines editorial. Educ. Psychol. Meas. 1995, 55, 525–534. [Google Scholar] [CrossRef]
  46. Environmental Protection Agency (EPA). ENERGY STAR Performance Ratings Technical Methodology; US Environmental Protection Agency: Washington, DC, USA, 2010.
  47. Environmental Protection Agency (EPA). ENERGY STAR Performance Ratings Technical Methodology for Hospital (General Medical and Surgical); US Environmental Protection Agency: Washington, DC, USA, 2011.
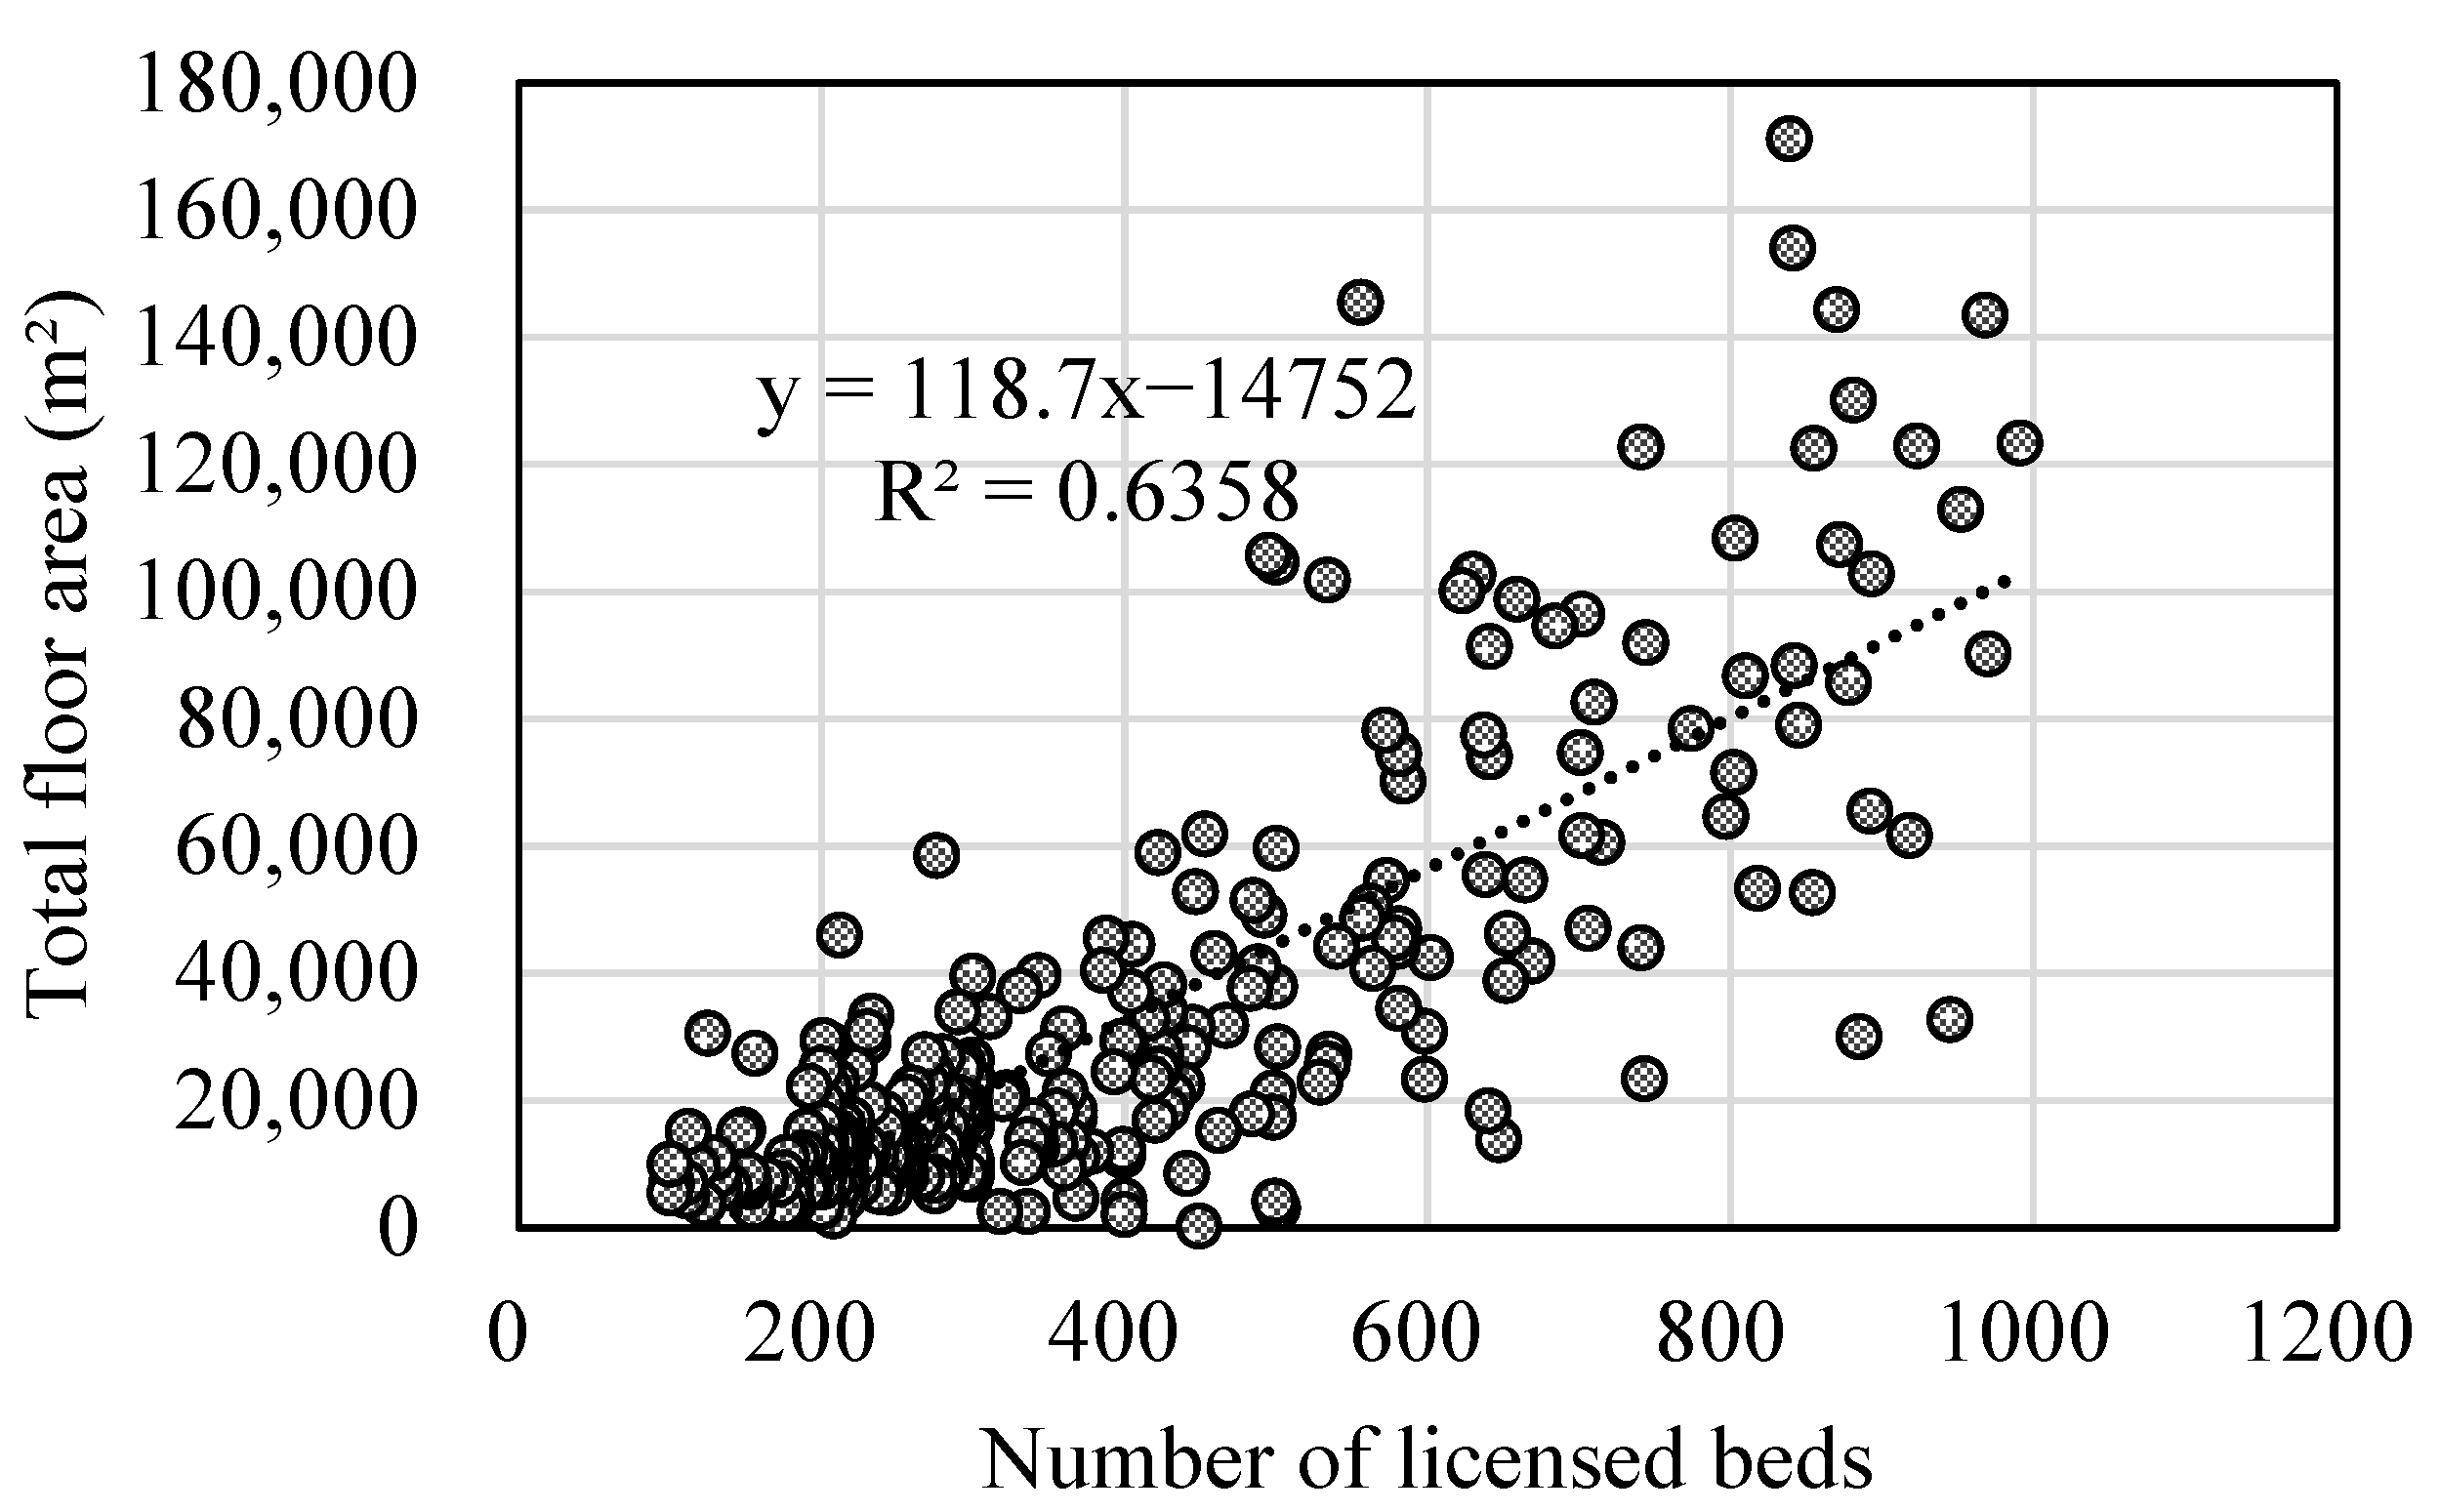
Figure 1. Relationship between the number of licensed beds and total floor area.
Buildings 13 00012 g001
Figure 2. Process of deriving a multiple regression equation (step-wise method).
Buildings 13 00012 g002
Figure 3. EUI and EER comparison of survey and pilot assessment hospitals. The A–D area was classified based on the hospital’s average EUI and EER 1 point.
Buildings 13 00012 g003
Figure 4. Trend and variance of the number of CT and operating rooms according to the number of staffed beds.
Buildings 13 00012 g004
Figure 5. EER and EUI relationship according to the benchmark model.
Buildings 13 00012 g005
Figure 6. Real and predicted energy consumption relationship according to the benchmark model.
Buildings 13 00012 g006
Figure 7. Gamma distribution of EER for Hospitals.
Buildings 13 00012 g007
Figure 8. EUI and EER score relationship.
Buildings 13 00012 g008
Table 1. Energy use-related surveys or systems for hospitals by country.
CountryNo.Survey or System NameType *
U.S.1Commercial Building Energy Consumption Survey (CBECS) [22]A
2EnergyStar (Portfolio Manager) [9,10]B
3American Hospital Association (AHA) Survey [34]A
4American Society for Healthcare Engineering (ASHE): Energy & Water Survey [35]A
Germany5Verbrauchsausweis [25]B
India6Building Energy Efficiency (BEE) Star Rating [26]B
Korea7Energy Consumption Survey [36]A
8National Building Energy Database (NBED) [27,28]A
* Type A: Case of building operation survey (including data collection). Type B: Case which used the operation survey results.
Table 2. Survey items and the utilization of each item.
CategorySurvey Item12345678
Hospital informationGeneral
information
Name, Address
Heating/cooling degree days
Built/opening year
Hospital type (public/private)
Survey respondents’ information
Building management method
Number of buildings in institutions
Total floor area/Total floor area above the ground
RetrofitRetrofit history
Business activityOperationNumber of beds (licensed, staffed)
Bed operation rate
Number of operating rooms
OccupancyTotal number of staff
Total number of inpatients (or) outpatients
Number of regular/temporary workers
Equipment for
business activity
Number of medical equipment (e.g., MRI and CT.)
Features of individual buildingBasic informationName of each building
Building geometry
Building orientation
Building height
Floors above the ground, basement floors, total floors
AreaTotal floor area
Ratio of medical area
Space ratio for medical service
Parking area in building
EnvelopeWindow-to-wall ratio (WWR)
Exterior wall/roof/windows thermal transmittance
EquipmentHeating
and
cooling
production
SystemMain heating/cooling system
SourceMain heating/cooling energy source
System controlOperating days of heating/cooling system
Operating times of heating/cooling system
Heating/cooling set temperature
Automatic controlBAS (Building Automation System) and EMCS (Energy Management Control System) information
Emergency power
system
Emergency power system
(UPS capacity, emergency generator)
HVACType of HVAC system
Hot waterHot water system
TransportElevator, escalator etc.
LightingApplication rate of LED in buildings
Lighting control methods
Energy
consumption
MeteringMetering methods (each building or whole building)
Utility billsMonthly or annual energy consumption
Table 3. Sampling methods in surveys or systems by country.
CountryNamePopulationSample ListSample DesignStratification
Variables
Distribution
U.S.Commercial Building Energy Survey (CBECS)
[22]
Commercial buildingsList of commercial buildings in the CBECS survey areaStratified samplingArea
Administrative district
Number of commercial buildings in the block
Probability proportional to size
(PPS)
EnglandDisplay Energy Certificate (DEC) [20,21]Non-residential buildingsDEC database, CaRB2 model—UCL, etc.Detailed use and total floor area PPS
KoreaEnergy Consumption Survey
[36]
Nationwide buildingsCensus on establishments and population housing census.Subdivision of businesses to small and medium sizes and the number of employeesCompromised allocation
Table 4. Benchmark development method by countries.
CategoryUKIrelandSwedenUSAAustralia
System OverviewSystem nameDEC [20]DEC [21]Energideklaration [23]Energy Star [9,10]CBD [24]
Implementation entityDepartment of Energy and Climate ChangeSustainable Energy Authority of IrelandMinistry of Enterprise, Ministry of EnvironmentEnvironment Protection AgencyDepartment of Resources, Energy and Tourism
Target BuildingBuilding typeExisting/publicExisting/publicNew/existingExistingExisting
Building useNon-residentialNon-residentialResidential/non-residentialResidential/non-residentialCommercial
Benchmark development methodAssessment itemCO2 emissionsPrimary energy consumptionFinal energy consumption
(before 2019),
primary energy consumption
(from January 2019)
Primary energy consumptionCO2 emissions
Indicator type (calculation method)Statistics
(median by building use)
Statistics
(median by building use)
Absolute value
(based on new buildings)
Statistics
(predicted primary energy consumption)
Statistics
(average by building use)
Normalization variableHeating degree days,
operating time
Heating degree days,
operating time
Climate (51 classifications)Cooling/heating degree days,
business activity-related variables
Climate,
operating time,
total floor area,
equipment density
Normalization methodCalibration formulaCalibration formulaCalibration factorRegression equation (regression coefficient)Calibration factor
Normalization targetBenchmarkBenchmarkActual energy consumptionBenchmarkBenchmark and actual energy consumption
Table 5. Established survey items in this study.
CategorySub-CategorySurvey ItemUnit
Part 1
Total hospital
General informationHospital name-
Address of hospital-
Survey respondents’ information-
Number of buildings in institutions (hospital)-
Total floor area (TFA)m2
TFA above the groundm2
Building use period (year)Years
Building management method-
RetrofitRetrofit history-
Business activity Number of workers (staff)-
Total number of inpatients per year-
Total number of outpatients per year-
Total number of emergency patients per year-
M&E
information
Number of operating rooms-
Number of MRI-
Number of CT-
Number of X-ray-
Number of PET-
Number of licensed beds-
Number of staffed beds-
Bed operation rate%
Part 2
Operating department
General informationArea by operating department
(e.g., outpatient department and inpatient department.)
m2
Area ratio to total floor area%
Equipment operationSet-point temperature by operating department°C
Heating/cooling days by operating departmentDays/year
Heating/cooling times by operating departmenth/day
Part 3
Individual building
BuildingExterior wall thermal transmittanceW/m2K
Roof thermal transmittanceW/m2K
Windows thermal transmittanceW/m2K
EquipmentMain heating/cooling system-
Main heating/cooling source-
Hot water source-
HVAC system-
Number of elevators-
Application rate of LED in buildings%
Table 6. Population by class for stratified sampling.
Class100–200200–300300–400400–500500–600600–700700–800800–900900–1000Total
Population401333336241613208323
Percentage (%)1241101175462100
Table 7. Surveyed number of samples for the 100 survey candidates by class.
Class100–200200–300300–400400–500500–600600–700700–800800–900900–1000Total
Population401333336241613208323
Minimum required sample size723664323156
Planned sample1241101175462100
Surveyed sample723452302248
Table 8. Results of the single regression analysis.
CategoryIndependent VariablesFreq.MeanAverage by
Number of Beds
Dependent Variable
100–300
Beds
300–500
Beds
Over 500 BedsTotal Energy
Consumption per Year (MWh)
Total Energy Consumption per Total Floor Area (kWh/m2)
n= 30n = 9n = 9Coeff.R2Coeff.R2
General
information
Building use period (year)4821.120.825.417.7−98.80.0162.370.040
Total floor area (m2)4828,56914,78332,78970,3010.343 ***0.850 ***−0.0010.018
Total floor area per
licensed bed (m2/bed)
4874.066.678.593.9180.6 ***0.284 ***−0.9680.036
Number of licensed beds (bed)48360.2225.8421.3747.036.0 ***0.699 ***−0.0740.013
Number of staffed beds (bed)47346.0210.6408.0735.935.9 ***0.716 ***−0.0610.009
Bed operation rate (%)4883.382.783.185.878.50.006−3.110.041
M&E
information
Application rate of LED in buildings (%)4852.453.853.247.1−58010.031−16.40.001
Number of elevator (Unit)488.25.210.216.31377 ***0.782 ***−1.020.002
Architectural informationNumber of buildings in hospital482.41.83.43.62500 ***0.249 ***−0.0000.005
Roof thermal transmittance (W/m2K)480.40.30.40.3−31200.001343.50.064
Exterior wall thermal transmittance (W/m2K)480.50.50.50.528700.00097.10.003
Windows thermal transmittance (W/m2K)482.82.62.43.886100.2881.80.000
Operating
information
Total number of staff48660.9358.2794.7153614.7 ***0.670 ***−0.0040.000
Total number of emergency room patients per year4821,94515,18325,74140,6870.350 ***0.347 ***0.0000.000
Total number of outpatients per year48342,016198,733366,074795,5660.026 ***0.645 ***−0.0000.013
Total number of inpatients per year4886,55242,78688,468230,5210.061 ***0.398 ***−0.0000.001
Number of operating rooms486.54.36.4141649 ***0.624 ***1.920.004
Number of MRI481.61.21.72.78125 ***0.504 ***22.60.017
Number of CT481.81.22.63.24586 ***0.347 ***−11.60.010
Number of X-ray487.64.711.913.1585 **0.191 **0.3770.000
Energy
consumption
Total energy
consumption per year (MWh)
489800491211,71424,178--0.0030.035
Total energy consumption per total floor area
(kWh/m2)
48359.4365.3356.4343.012.40.035--
Total energy consumption per
licensed bed (kWh/bed)
4825,85132,83428,38231,9980.437 ***0.333 ***--
Total energy consumption per staffed bed (kWh/bed)4727,50623,40727,85232,4840.370 ***0.257 ***--
p < 0.5, ** p < 0.01, *** p < 0.001.
Table 9. Results of the average energy consumption by the characteristics of discrete variables.
CategoryVariableTypeFreq.RatioAverage of EUI *CategoryVariableTypeFreq.RatioAverage of EUI
General informationHospital typePrivate4083%343.1M&E
information
HVAC systemCentral2654%370.3
Public817%441.0Individual1327%345.9
Total48100%-Mixed510%337.0
Hospital sizeUnder 300 beds3063%356.5No AHU48%361.0
Over 300 beds1838%364.3Total48100%-
Total48100%-Main heating sourceGas (LNG)2960%363.5
M&E informationMain heating systemAbsorption chiller–heater1838%368.4Electricity1327%369.1
District heating510%316.7
Steam boiler1123%370.3LPG12%329.4
EHP817%342.7Total48100%-
District heating510%316.7Main cooling sourceGas (LNG)2552%357.3
Others613%370.3Electricity2246%369.1
Total48100%-District heating12%200.1
Main cooling systemAbsorption chiller–heater1940%373.5Total48100%-
Hot water sourceGas (LNG)3879%365.0
Absorption chiller1123%352.7Electricity510%364.1
District heating48%308.3
EHP1123%340.3LPG12%329.4
Others715%361.8Total48100%-
Total48100%-
* Average total energy consumption per total floor area (kWh/m2).
Table 10. Multiple regression analysis process using business activity data of hospital.
StepContents
1Independent variableHeating/cooling degree days,
number of buildings,
total floor area,
area for floor area ratio calculation
Number of operating rooms,
number of beds (licensed and operating),
number of workers **
Number of emergency patients per year **,
number of outpatients per year **, number of inpatients per year **,
bed operation rate
Number of MRI *,
number of PT *,
number of PET *,
number of X-rays *,
number of imaging devices *
2Dependent variableFinal energy consumption (total amount in 2017, MWh)
3 Multiple regression analysis (step input, N = 48): Considering independent variable collinearity/significance judgment (statistical examination) and whether the model is understood by hospital stakeholders
4R2 examinationR2 = 0.86 (86%)
5Model derivationPredicted energy (MWh)
= 13.187 (V1 − 346) + 770.862 (V2 − 6.5) + 1665.844 (V3 − 1.8) + 10,033.81
V1: Number of staffed beds
V2: Number of operating rooms
V3: Number of CT
* Total numbers, per area, per bed, ** Total numbers, per area, per bed, per worker.
Table 11. Number of surveyed and pilot assessment hospital samples by licensed bed group.
Class100–200200–300300–400400–500500–600600–700700–800800–900900–1000Total
Population401333336241613208323
Surveyed sample723452302248
Pilot assessment313 (4)*4 (1)*5 (1)*4 (1)*336041 (7)*
Surveyed + pilot
assessment
1032795638282
(*) Number of hospitals that participated in the survey for the development of the existing benchmark among the pilot assessment targets.
Table 12. Business activities and EUI and EER information of field survey hospital.
Hospital NameNumber of Staffed BedsNumber of
Operating Rooms
CTEUIEER
Hospital A240 8 3 2910.44
Hospital B394 8 1 3060.50
Hospital C284 7 1 1520.54
Hospital D295 2 1 1960.48
Hospital E333 5 1 3121.65
Table 13. Comparison of existing benchmark model and modified benchmark model.
Existing Benchmark ModelModified Benchmark Model
Number of observations4843
Independent
variables
Number of staffed beds (V1)
Number of operating rooms (V2)
Number of CT (V3)
Number of staffed beds (V1)
Number of operating rooms (V2)
Model
equation
13.187 (V1 − 346) + 770.862 (V2 − 6.5) + 1665.844 (V3 − 1.8) + 10,033.8131.245 (V1 − 360) + 644.764 (V2 − 7) + 10,621.697
R20.860.86
Application targetHospitals with more than 100 beds and less than 1000 bedsHospitals with more than 150 beds and less than 1000 beds
Table 14. Look-up table based on EER for hospitals.
ScoreCumulative
Percentage (%)
EERScoreCumulative
Percentage (%)
EER
< <
10000.000 0.278 89110.4920.504
9910.2780.32388120.5040.516
9820.3230.35487130.5160.527
9730.3540.37986140.5270.538
9640.3790.40085150.5380.548
9550.4000.41984160.5480.559
9460.4190.43683170.5590.569
9370.4360.45182180.5690.578
9280.4510.46581190.5780.588
9190.4650.47980200.588 0.634
90100.4790.49240600.9310.941
Disclaimer/Publisher’s Note: The statements, opinions and data contained in all publications are solely those of the individual author(s) and contributor(s) and not of MDPI and/or the editor(s). MDPI and/or the editor(s) disclaim responsibility for any injury to people or property resulting from any ideas, methods, instructions or products referred to in the content.