1. Introduction
The release of the 2021 report from the Intergovernmental Panel on Climate Change (IPCC) [
1] states that human-induced activity is responsible for the warming of the atmosphere, ocean and land. Globally, the building sector accounts for 37% of the total final energy consumption, and 55% of the electricity consumption [
2,
3]. At the United Nations (UN) climate change conference (COP21) in Paris in 2015, 196 countries committed to complying with the Paris agreement. The agreement establishes a framework for keeping the global average temperature well below 2.0 °C, preferably to 1.5 °C compared to pre-industrial levels to mitigate the impacts of climate change and achieve a climate neutral world by 2050 [
4]. In 2015, the Norwegian government set out to reduce emissions by 40% in 2030 compared to 1990 emission levels. Today, the goal is expanded to at least a 50% reduction by the year 2030, and a 90–95% emission reduction by the year 2050 [
5,
6,
7]. The building and household sectors are the largest contributors to the total energy use in the European Union (EU) at approximately 40%, and accounts for 36% of the associated GHG emissions [
2,
8,
9,
10]. The EU has set forth a ambitious program to achieving climate neutrality by 2050 [
11]. Part of this is the Energy Performance of Buildings Directive (EPBD) aiming for all new buildings to meet nearly zero-energy building (nZEB) standard [
12]. In December 2021, a recast of EPBD was proposed, wherein one of the changes was to move from zero-energy buildings to zero-emission buildings. Improving energy efficiency in buildings is one of the paths to achieving climate and energy goals [
9,
12].
The environmental assessment of local and on-site renewable energy conversion systems and the GWP and GHG emission reduction potential of nZEBs with various different energy systems were previously assessed in the literature [
13,
14,
15,
16,
17,
18,
19,
20,
21]. The authors of [
16] investigated the contribution of nZEB standards to China’s CO
emission reduction targets by 2060. The authors suggested that nZEBs should be promoted for both new and retrofit buildings in order to achieve emission targets. The authors of [
17] performed the LCA of an nZEB with integrated solar PV systems with and without energy storage for different climates. The authors highlighted the importance of achieving a balance between energy savings and renewable energy integration. The author of [
18] investigated the potential environmental impact of residential rooftop solar PV systems at 76 different locations in Europe. The author investigated how the location and local electricity mix affects the environmental impact of the analysed PV system. The author of [
19] considered a pre-existing detached single-family house which was converted into net zero-energy building, and performed an LCA of the solar PV system used for the conversion. The authors concluded that the impact of the analysed PV system is considerably less than that of the substituted conventional energy systems.
The EPBD set goals on the nZEB standard for new buildings in the EU. The requirements applies from 31 December 2018 for public buildings, and all other buildings from 31 December 2020 [
12,
21]. When performing the major renovation of older buildings, the same requirements for energy efficiency apply. According to EPBD, all new buildings should be nZEBs [
22]. Member states are required to define numerical threshold values to achieve a “very high energy performance” and define local nZEB requirements based on the local situation [
23]. Additionally, the EU directive 2018/844, amending 2010/31/EC states that, due to the high energy consumption in the building sector, each member state should seek to renovate buildings, to promote energy efficiency as well as considering the integration of renewable energy sources to reach the goals put forth by the Paris agreement. Furthermore, the implementation of nZEBs is listed as important for the transition to a more sustainable energy supply system [
24]. Renewable energy will play a key role in low-emission buildings and in the transition to a sustainable energy system.
The purpose of this paper is to conduct an analysis of the emissions associated with the energy systems of an existing nearly zero-energy university building in a Norwegian use case scenario. The aim of this was to identify environmental impacts and potential challenges to utilising alternative energy resources as a means to achieve nZEB status in a public building. This analysis was performed by assessing annual electricity demand and heat consumption from both energetic and environmental perspectives. In order to evaluate the GWP and GHG emissions of the studied system, the software SimaPro was used. Lastly, the finding will be used to try to highlight the potential challenges associated with justifying the nZEB status by the integration of alternative energy sources, which has become a trend. In Norway, it has become common to install solar PV on public buildings in order to present the buildings as nZEBs. The building operators feel the pressure to present their buildings as green. The studied building in this case was built as a passive house, and the installation of solar PV was performed with the motive to achieve nZEB status. This has been the main cause which triggered the motivation for this study. To the best of our knowledge, there is no study that highlights these challenges related to Norwegian conditions. It is by no means not the intention of the authors to oppose the installation of solar PV, but rather to highlight the issues of uncritically justifying the installation of solar PV without considering the environmental aspects and emissions from a life cycle perspective. We believe that solar energy holds great potential in combatting the energy crisis and global warming.
The remainder of this paper is organised as follows:
Section 1 provides an introduction by presenting relevant background information underlining the motivation and main objective of this study.
Section 2 describes the different definitions of zero-emission buildings and nearly zero-emission buildings relevant to this study as well as renewable energy in nearly zero-energy buildings and the Norwegian energy mix.
Section 3 gives information on the building of which the study is focused and describes the energy system in the building.
Section 4 describes the methodology for conducting the study, and the collection and analysis of building and energy data. The life cycle assessment of solar PV, the assessment of district heating (DH) and imported electricity.
Section 5 gives an overview of the results of the energy analysis, and the environmental performance of solar PV, DH, and imported electricity.
Section 6 discusses the results, and
Section 7 provides a conclusion.
2. Definitions of ZEB and nZEBs
The European Union encourages energy efficiency and renewable energy production to achieve carbon neutrality by 2050. Improving the energy efficiency and utilising renewable energy in buildings is one of the paths to achieving climate and energy goals [
25]. In Europe, the EPBD 2010/31/EU states that and after 31 December 2018, all new buildings owned by public authorities are nZEBs, and by 31 December 2020 all new buildings are nZEBs [
12]. A uniform strategy for implementing nZEBs is not established in EPBD, and the member states must develop their own nZEB definition based on variations in primary energy sources utilised for electricity generation, national, regional or local conditions [
12,
25]. In a report from the European Commission in 2020, it was stated that 23 of the member countries defined the requirements for nZEBs, while the remaining four were in the process of developing or revising the definitions [
26,
27]. Most definitions include the requirements for primary energy use, or the share of energy covered by renewable sources. Some definitions also include requirements for the thermal transmittance (u-value) for walls, roofs, floors, windows and doors [
26]. Due to variations in local climate throughout the European member states, there is a need for individual definitions of energy efficiency. The indicators for determining the local nZEB definitions are not comparable due to variations in energy performance calculations and variations in the inclusion of different non-mandatory energy sources, e.g., lighting and appliances [
28].
In December 2021, the European Commission proposed a recast of EPBD with new standards for energy performance to decarbonise the building sector by reducing GHG emissions and energy consumption, and new nZEB definitions. The new nZEB definition refers to the term “nearly zero-emission building” [
29]. Zero-emission buildings will replace nearly zero-energy buildings as the standard for new buildings from 1 January 2030, and as of 1 January 2027, for all renovated buildings [
30]. According to the redefined directive proposal, a zero-emission building is defined as a building with very-high-energy performance, with a very low amount of energy still required which is fully covered by energy from renewable sources and without on-site carbon emissions from fossil fuels [
29]. Although Norway is not an EU member state, as part of the European Economic Area (EEA) agreement, Norway is obliged to comply with EU directives and participate in the adoption of the directive on energy performance for buildings (EPBDs) [
23]. The Norwegian building code “Regulations on technical requirements for construction works” (TEK17) [
31] was last updated in 2017. The inclusion and definition of nZEBs in Norway are expected in the next version of the building code.
2.1. Zero-Energy Buildings (ZEBs)
Zero-energy buildings (ZEBs) are grid-connected energy-efficient buildings that balance their total annual energy consumption by utilising the on-site generation of electricity [
32]. The definition of on-site or locally produced renewable energy includes, among others, wind, solar, hydropower, biomass, etc. [
26]. A summary of relevant ZEB terminology is given in
Table 1.
2.2. Net Zero-Energy Buildings (Net ZEBs)
The term “net” refers to the annual balance of primary energy based on the supplied and exported thermal and electric energy. Net zero-energy buildings are defined as grid-connected buildings with a very high energy performance, meaning that the primary energy usage is less than or equal to zero. In other words, this means that a net ZEB produces the same amount of energy from renewable sources as the energy required for its operation [
32,
33].
2.3. Nearly Zero-Energy Buildings (nZEBs)
The EPBD defines a “nearly zero-energy building” as a building that has very high energy performance. It also states that the nearly zero or very low amount of energy required should be covered to a very significant extent by energy from renewable sources, including energy from renewable sources produced on-site or nearby [
12]. A definition of “very high energy performance” and “a very significant extent by energy from renewable sources” as well as “nearby” must be defined by each member state. The energy performance is the required energy needed to meet the energy demand associated with the typical use of the building, including energy for heating, cooling, ventilation, hot water and lighting [
28]. It is up to every member state to define its requirements for nZEBs based on national, regional, or local conditions, including a numerical indicator of primary energy use expressed in kWh/m
per year [
34].
2.4. Zero-Emission Buildings (ZEBs) (Proposed)
As part of the Fit for 55 packages, the European Commission proposed a recast of the EPBD in 2021 moving from assessing the energy performance in nearly zero-energy buildings (nZEBs) to also including the emissions. The proposed recast introduced the new term “zero-emission building”. By aligning the energy performance requirement for new buildings to the longer-term climate neutrality goal and “energy efficiency first principle”, the main goal of the revised EPBD is the reduction in operational greenhouse gas emissions and final energy consumption. Zero-emission buildings include the calculated life-cycle GWP and its disclosure through the energy performance certificate of the building. The new definition and requirements apply from 1 January 2030 for all new buildings, and as of 1 January 2027 for new public buildings [
10,
30].
2.5. Norwegian ZEB and nZEB Definitions
Norway has defined specific criteria for passive house and low-energy buildings; however, a definition of the nZEB requirements are yet to be determined. The current building code (TEK17) states that the net annual energy demand should not exceed the requirements for passive houses. The minimum requirements for the total net energy demand in the current building code are 125 kWh/m
usable heated floor space area per year for Norwegian university buildings [
31].
A passive house in a Norwegian context is often described as a building with high quality, a good indoor climate, and low energy demand. It is claimed that passive houses consume up to 80% less energy than traditional buildings in Europe [
35]. The basic components of any passive house are excellent thermal insulation, the avoidance of thermal bridges, and low heat loss from windows. Airtight building envelope, ventilation system with heat recovery and the passive use of solar energy [
36]. There are also specific requirements for different types of buildings related to the heat loss from transmission and infiltration, heating and cooling demand-based, and u-value requirements for building components [
31,
37,
38]. In comparison, ZEBs and nZEBs will require even less energy than low-energy buildings and passive houses. Due to the lack of formal nZEB requirements in the current Norwegian building code, unofficial definitions have been conceived by building developers, among others. A proposal for Norwegian nZEB definition and target values for energy use was presented in [
39], which was carried out by Rambøll and LINK on behalf of the Norwegian Building Authority. The proposed target for nZEB states that a Norwegian nZEB should have a reduction of 70% of the energy use compared to the previous Norwegian building code TEK10 at 160 kWh/m
. The Research Centre on Zero Emission Buildings (ZEB Lab) in Norway defines ZEBs as zero-emission buildings [
40,
41]. In this definition, the energy balance is measured in terms of GHG emissions in CO
-eq during the buildings’ life cycle rather than direct energy demand. In the following report [
42], the authors based their definition of nZEBs on the work of [
39], and used the current building code as a reference for determining the energy requirement for different categories of buildings. For university buildings, the energy requirement is determined to be 40 kWh/m
per year.
Some examples of Norwegian ZEB pilot projects in Norway include Powerhouse Kjørbo in Sandvika, the ZEB lab in Trondheim, Ydalir Living Lab in Elverum, and Zero Village in Bergen [
43,
44,
45,
46,
47].
Table 1.
Summary of ZEB terminology.
Table 1.
Summary of ZEB terminology.
| Case | Description | Reference |
|---|
| ZEB in EU | Used to describe a building which uses little to no energy | [26] |
| ZEB in Norway | No formal definition. Unofficial definitions have proposed using emissions as unit. | [32] |
| Net ZEB | A building that generates the same amount of energy from on-site renewable energy sources in order to achieve net zero-energy balance. | [32,33] |
| nZEB in EU | A building that uses little energy, and where the energy that is used are being produced on-site or locally from renewable sources. Member countries specify its own requirements based on national, regional or local conditions. | [12,28,34] |
| nZEB in Norway | No formal definition. Different definitions and targets have been proposed using current legislation as a reference. Highly energy-efficient building, using on-site or local energy generation. | [39,40,41,42] |
| New proposed ZEB in EU | Zero-emission building. A building with very high energy performance. The very low amount of energy required shall be fully covered by local or on-site renewable energy sources. Consider emissions and global warming potential (GWP) | [10,30] |
2.6. Renewable Energy Sources in nZEBs
As stated in
Table 1, a part of the European Commission’s recommendations for achieving nZEB criteria is implementing the on-site production of renewable energy. This was also promoted in proposals for a Norwegian nZEB definition by the Norwegian Building Authority [
48]. Solar PV panels are among the options for on-site energy generation and can be integrated into pre-existing buildings. Solar thermal systems can be utilised for water and space heating. Depending on the PV systems and energy demand, the building may export electricity during periods where the PV production exceeds the electricity demand and import electricity when the demand is higher than production. In Norway, electricity demand is typically at its highest during winter when the solar conditions are most challenging. However, this paper only considers the environmental assessment of the energy system of the building and not grid-technical aspects such as these. The authors of [
49] reviewed a representative sample size of nZEBs across Europe, where 60% of the analysed nZEBs used a single system for heating (ventilation, hot water, or space heating). The authors found that, for cold climate conditions, heat pumps (31%), boilers (21%), and DH (25%) were the most common means of meeting the heating demand. Furthermore, the authors found that, for the implementation of renewable energy sources, 15% had photovoltaic (PV) panels, 18% had solar thermal, 18% had PV and solar thermal, and 41% had no PV or solar thermal systems for cold-climate nZEBs. A Norwegian study on the impact of solar PV in residential ZEB pilots found that PV contributes to a relatively large share of material emissions. Furthermore, when the emissions from the PV system were compared with the emissions from the Norwegian hydropower, it was found that the PV system does not compensate for these emissions within 30 years [
50]. This result is supported by the findings of [
51], wherein the author found that PV technology installed in Norway had the least potential of the 31 studied locations. These findings are also supported by an International Energy Agency (IEA) report [
52], which stated that Norway has the lowest potential for CO
mitigation among OECD countries.
2.7. Norwegian Energy Mix
Norway has a high share of renewable energy incorporated in its energy system. Historically, electricity production has mainly been based on hydropower. In recent years, the trend has shifted, and an increase in wind power has been developing [
53]. In the year 2020, a total of 154,197 GWh of electric energy was produced. In which hydro-power production made up 91.8%, wind power made up 6.4% and thermal-power production made up 1.7% [
54]. The total hydropower production was 143,699 GWh in 2021, the total production from wind power was 11,768 GWh, and the total electricity production from thermal power plants was 1646 GWh in 2021 [
54]. In Europe, France and Germany are the main exporters of energy and are central participants within the European power market. Within Europe, most energy is transported over the shortest distances. Norway has predominantly imported energy from Sweden, Germany, and other smaller exporters [
55]. As such, power exchange with Europe is an integral part of the Norwegian central grid. Cables are between Norway and Germany, Denmark, England, the Netherlands, Finland, and Russia. In 2020, the net exchange was 20,472 GWh, the total exported energy was 24,968 GWh, and the total imported energy was 4496 GWh. For the year 2021, the exchange was 17,584 GWh, the amount imported 8235 MWh, and the exported amount was 25,819 MWh [
54]. Norway has a cold climate and the annual energy use in households and commercial sectors are approximately 80 TWh, around half of which is used for space heating [
56]. In Norway, the electricity production mix is based mainly on renewable sources. The authors of [
46] explained how Ecoinvent processes may be representative of Norwegian material production lines, and overestimate the total associated embodied GHG emissions due to a European or global electricity mix based on fossil fuels [
46,
57].
3. Description of the Smaragd Building and Its Energy System
The Smaragd-building opened on campus Gjøvik in 2017. The building is 4980 m
divided over five floors and includes offices, laboratories, auditoriums, and a coffee shop. The total heated area is of 4775 m
[
58]. The building is considered to be an nZEB building according to the building operator’s own definition. Even though there is no formal definition from the Norwegian government to date, this label is justified by using a modified version of the original nZEB proposal, described in
Section 2.5. In the case of Smaragd, the criteria to establish nZEB conditions were set to an energy demand which was 25% lower than the passive house standard. The building was therefore planned as a passive house, but through the installation of solar PV the building was considered to be nZEBs. An overview of the established criteria from the builder can be seen in
Table 2. The negative sign of PV indicates that it is to be subtracted from the energy budget. To achieve the passive house criteria, a specific energy target was established, which is equal to 78.1 kWh/m
. This is the reason that solar PV was added to the building. The production was estimated to be approximately 70 MWh per year.
3.1. Energy System in the Smaragd-Building
The following energy sources are used in the building: electricity from the grid, on-site production of electricity from the solar PV system, bio-based DH, and air-to-water cooling system. The cooling system is not considered in this work, due to data limitations.
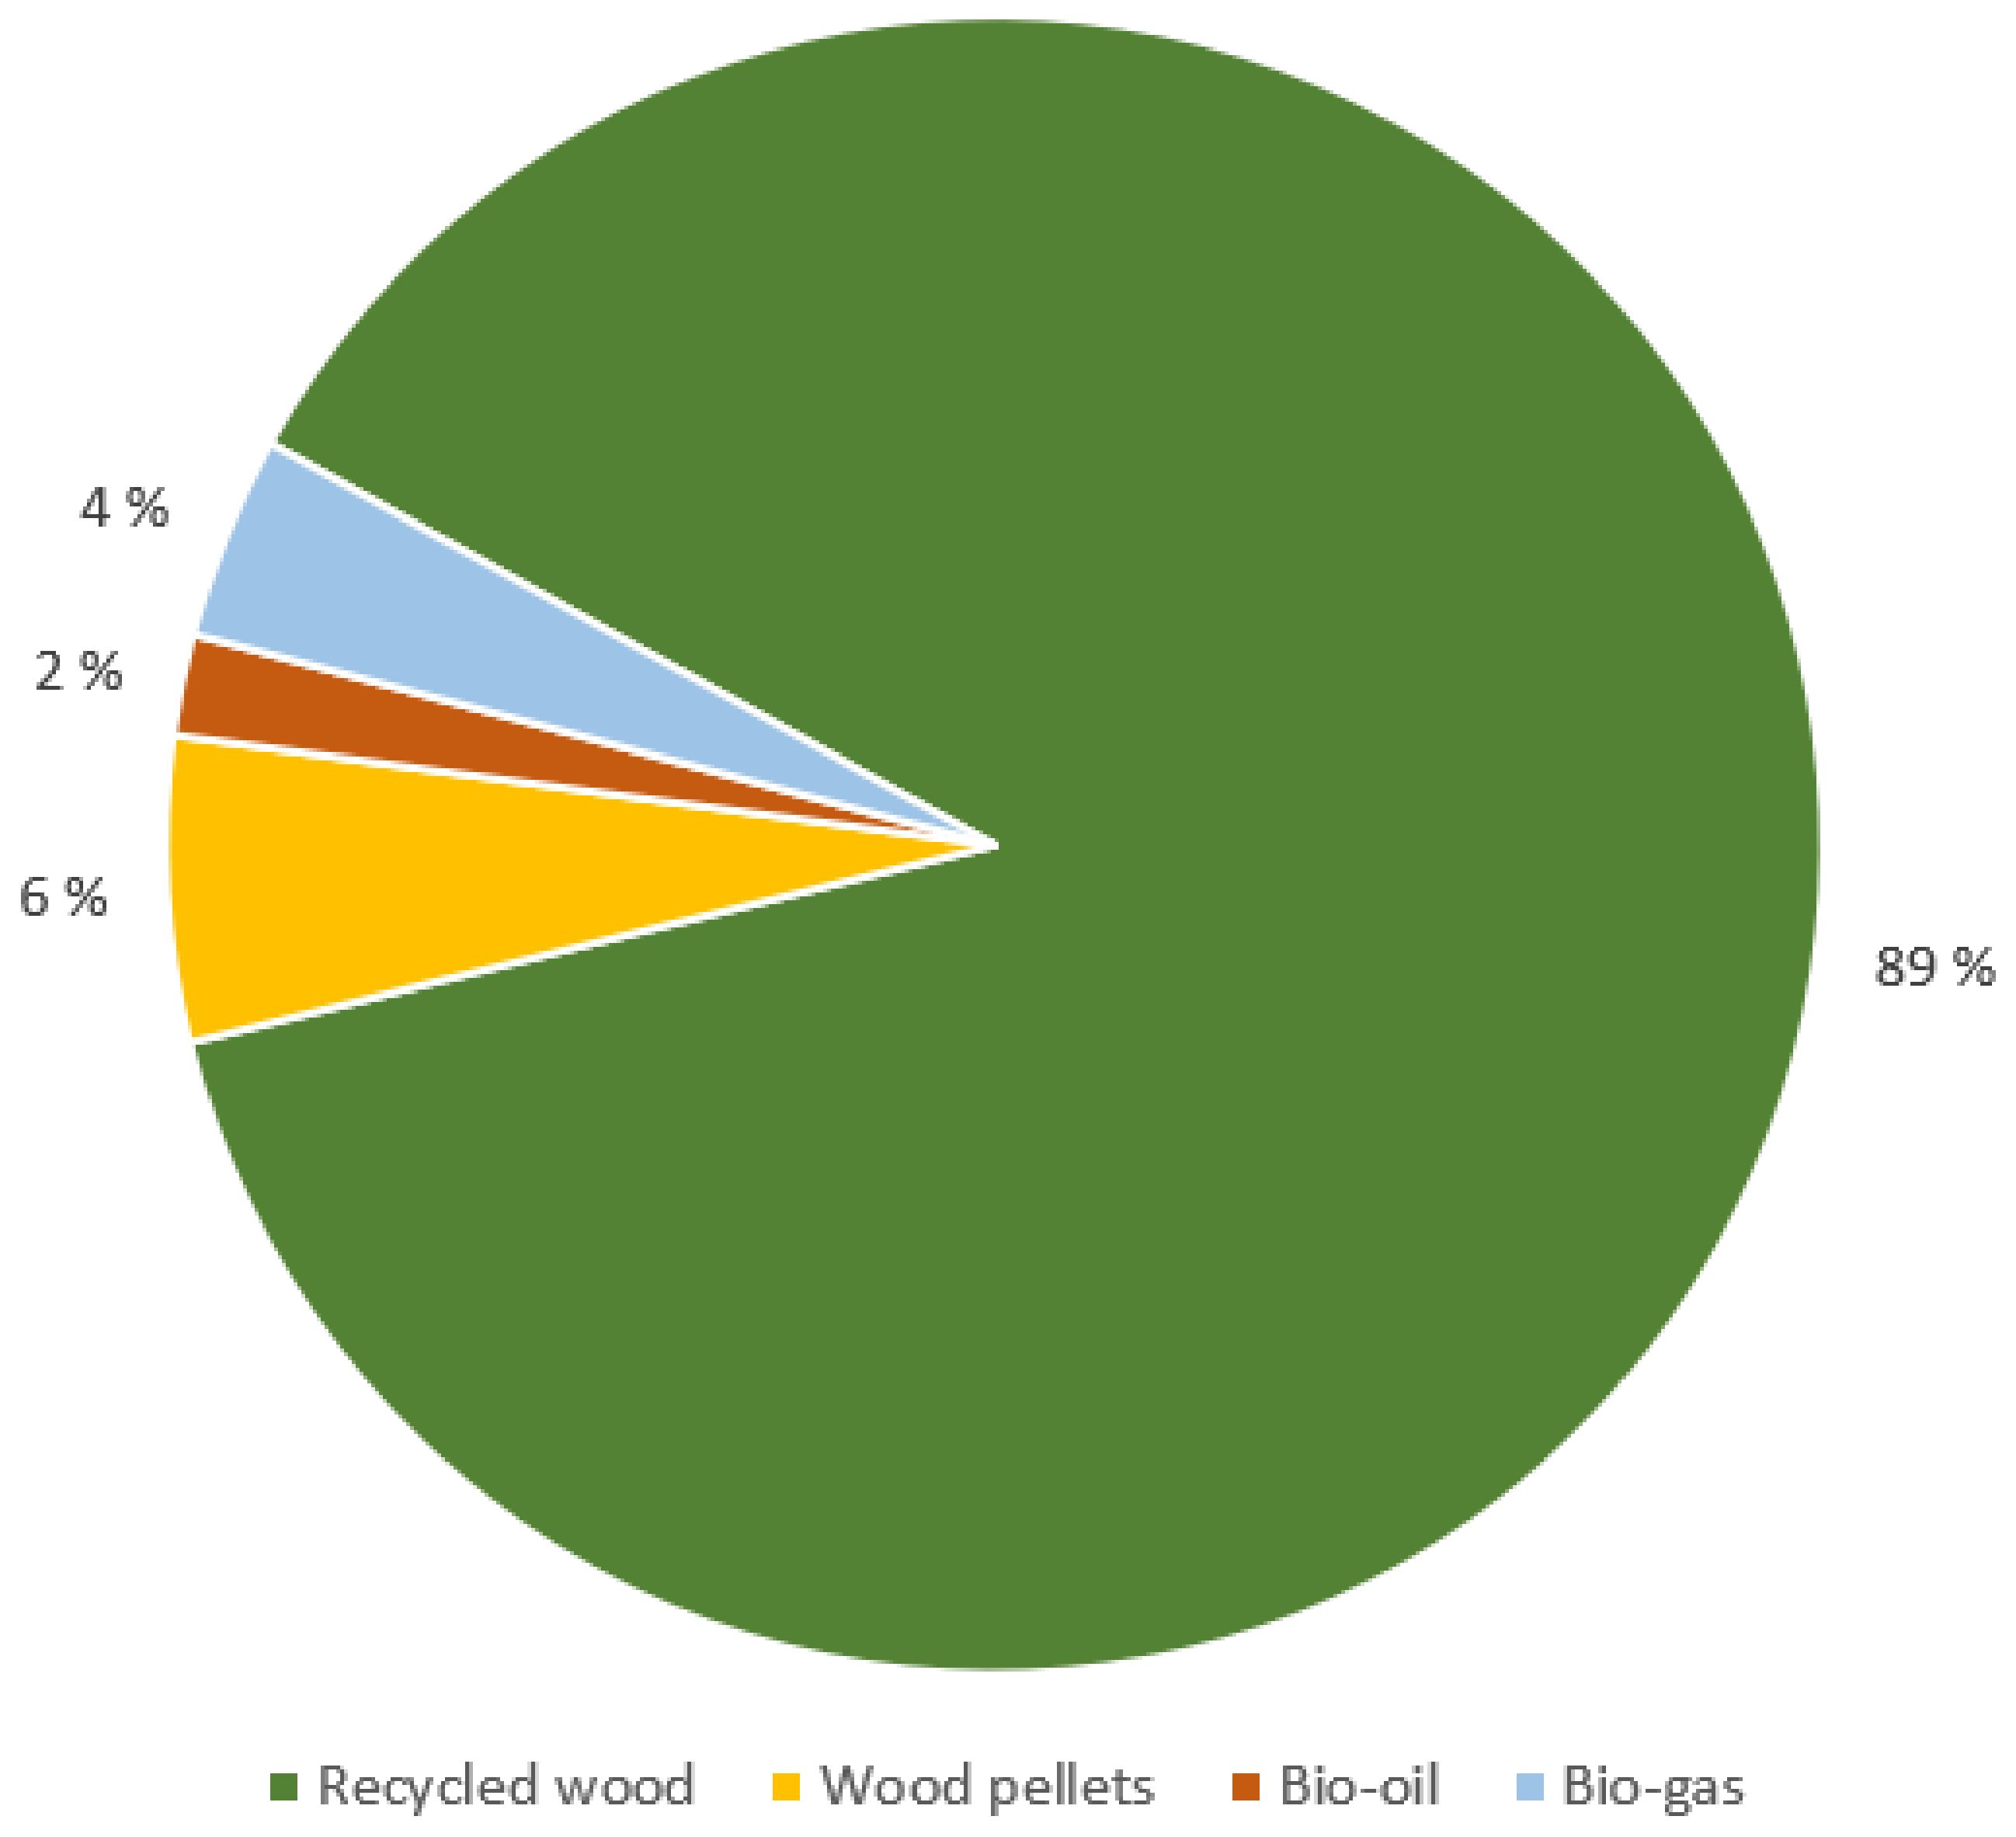
3.1.1. District Heating
In the building, DH is used for space heating, tap water heating, and snow melting at the entrances [
59]. The heat production plant is located approximately 1.5 km from the university campus. The fuel distribution of heat conversion is illustrated in
Figure 1 [
60].
With respect to the annual heating demand from the DH to the building (0.523% of total energy production), the calculated annual fuel distribution is as follows: 103.368 tonnes of recycled wood, 5.413 tonnes of wood pellets, 0.527 tonnes of bio-oil, and 2.244 tonnes of biogas. The values are derived with system efficiency and fuel heating values with a mean moisture content. The recycled wood used for the production of DH comes from local recycling stations. Based on data obtained from Gjøvik DH central, the plant has an estimated total efficiency of 88%. The reported annual distribution net losses were given as 13%, and the recycled wood with an average moisture content of approximately 35%.
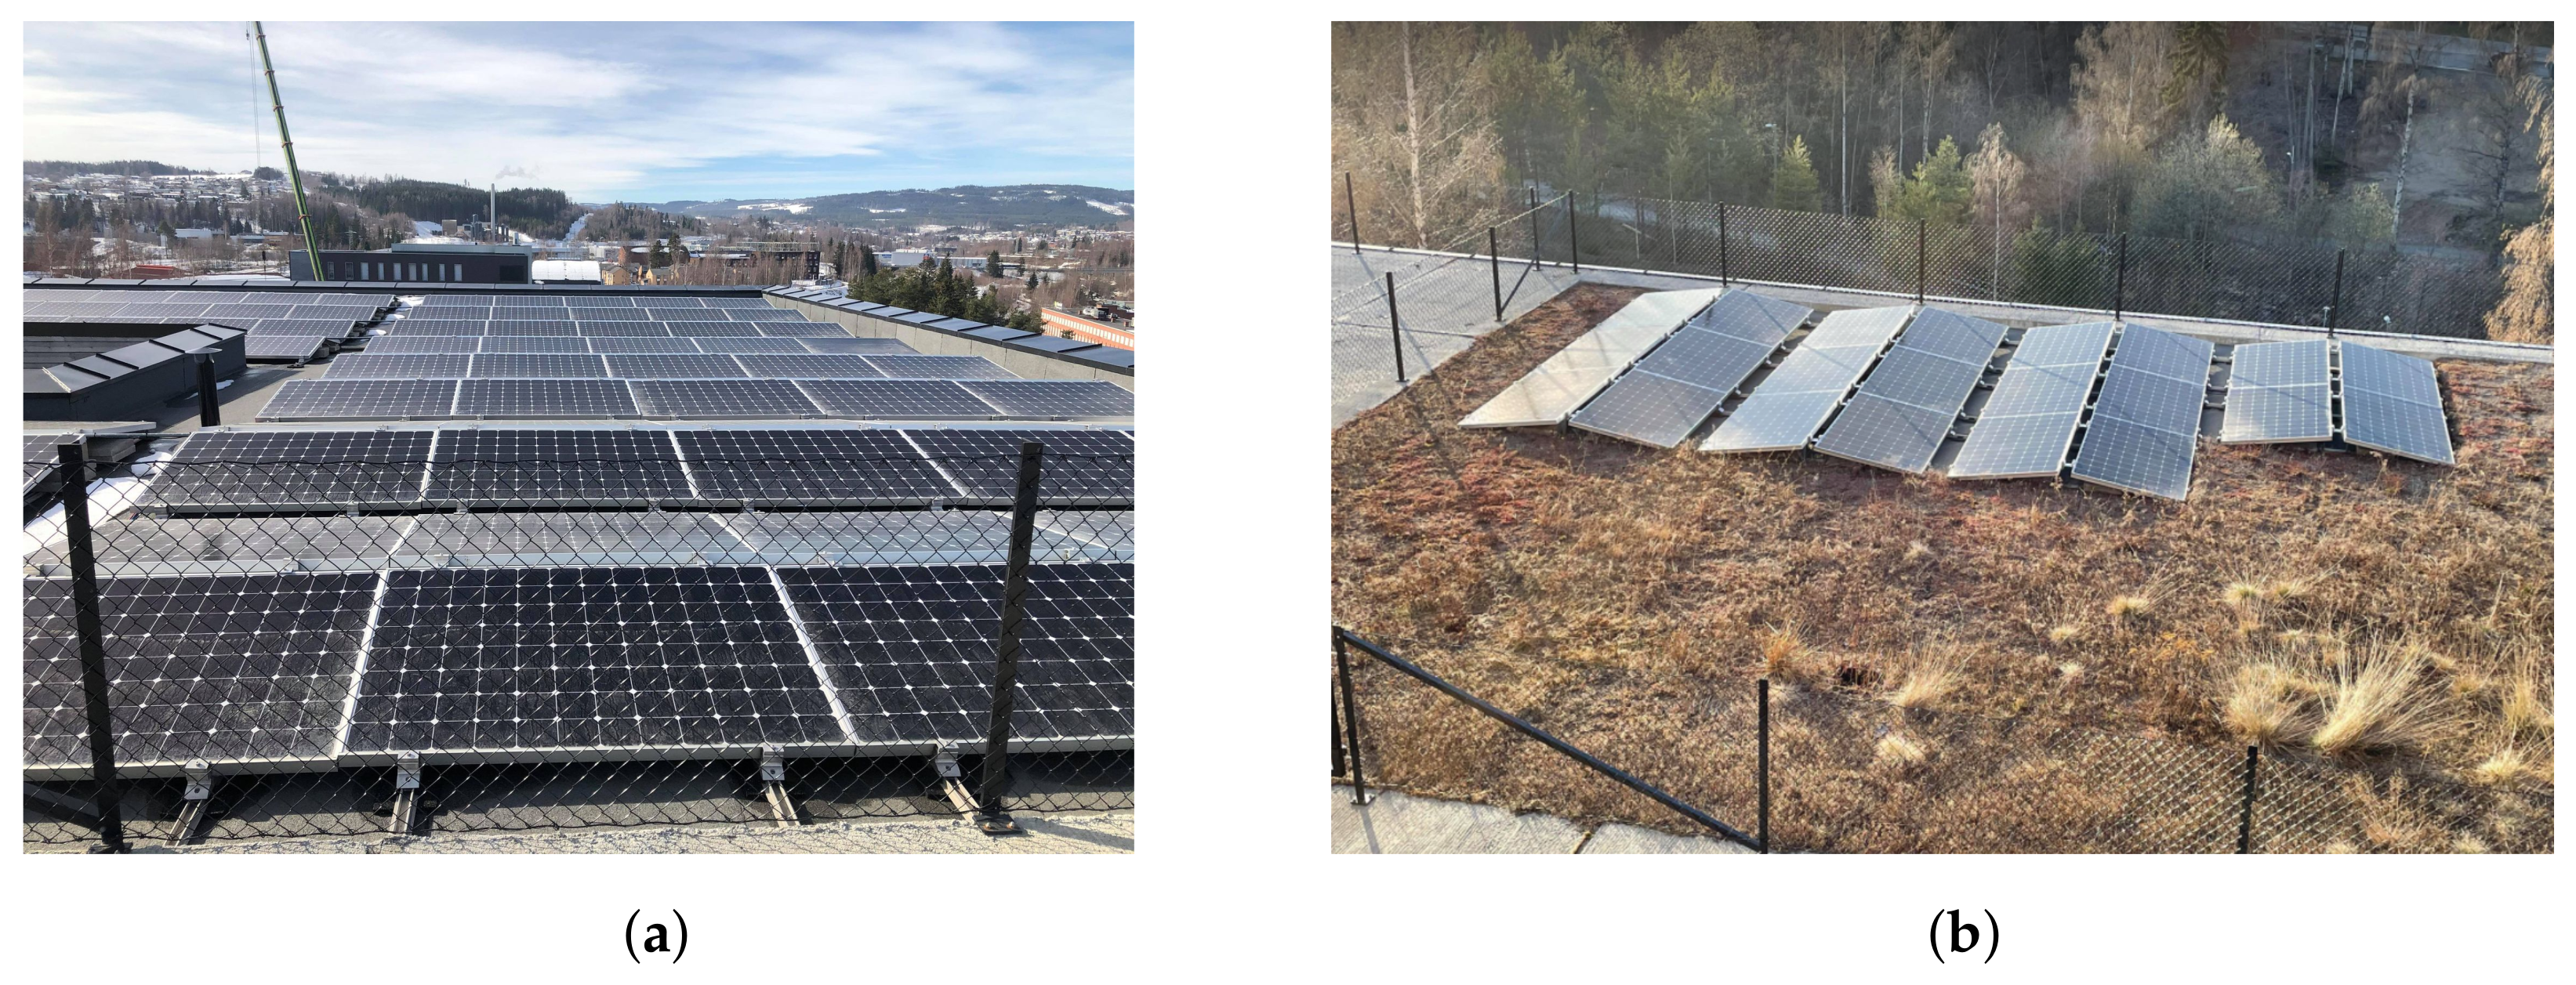
3.1.2. Solar PV
A PV system is installed to reduce the grid energy demand as a measure to achieve the nZEB energy requirement [
61]. The panels used on the system are of type SunPower X20-327-COM and can be seen in
Figure 2. Each panel consists of 96 mono-crystalline cells. The PV system consists of 280 modules divided into six arrays, mounted on a flat roof. A total of 258 modules are located on the fifth-floor roof, and 22 modules are on the lower level. The inclination is 10
, and the azimuth angles are 50
and −130
. The total peak power of the system is estimated to be 91.56 kWp. The orientation of each array can be seen in
Table 3. The area of each panel is 1.63 m
, and it has a mass of 18.6 kg. In total, the total PV is area 456.6 m
and the total is mass 5200 kg.
4. Methodology and Data
A combination of a cradle-to-gate LCA assessment on solar PV used for on-site generated power production and data analysis for electricity and heating demand was conducted. This study was conducted in two parts. The first part is energy mapping, and the second part consists of a cradle-to-gate LCA of the PV system. A shorter assessment of the use phase of the DH plant was also conducted. Due to limitations in the available data, the fuel distribution of the DH was based on approximations. In order to establish the energy flow used in the environmental assessment, hourly data were organised to represent the imported electricity and heating demand. In the following paragraphs, the methodology applied during this study was presented.
4.1. Collecting Building Data
Energy use in the building was registered and logged since its opening in 2017. Measurements are registered every hour and include the DH inlet and outlet temperature at the substation, solar PV electricity generation, electricity consumption as well as outdoor temperature. As the first task, relevant building features were compiled, such as the heating system, energy generation system and gross floor area.
4.2. Collection and Analysis of Energy-Use and Generation Data
Electricity and DH consumption were compiled with an hourly resolution for the year 2020. The measurement data are a combination of the instantaneous values and cumulative values that depend on the type of measurement. The energy data used in the mapping were collected as raw data from the sensors of the building’s internal energy monitoring system. Data for on-site electricity generation were collected as hourly raw data and were confirmed by the building manager, who is responsible for building maintenance. The amount of electricity fed to the grid was requested but was unavailable. Therefore, this was calculated by determining the surplus with respect to the production and demand for each hour of the year. This made it possible to calculate the amount of electricity from the grid for 2020. The building has its own separate DH substation where the heat from the network is further distributed to the building.
4.3. Environmental Assessment of Energy System
To conduct the environmental assessment, the Simapro version 9.1.1 and Ecoinvent 3 database were chosen for the inventory and the results database of the impact assessment. SimaPro is a tool that is used to perform LCA studies on different systems which was developed by Pré Sustainability [
62]. Simapro offers a selection of different modelling approaches for different parameters and is a part of the results database. In this paper, the ReCiPe-a hierarchical (H) mid- and endpoint model was used, in addition to the IPCC 2013 GWP over a period of 100 years for the modelling of global warming potential. More information about these modelling approaches can be found in the literature. The cradle-to-gate analysis used ISO 14040 and ISO 14044 as the bases for the methodology [
63,
64] together with the methodology presented by the authors of [
65] for solar PV. Further PV-technical parameters were based on [
14,
66,
67]. The analysis of the DH demand and imported electricity was calculated based on the fuel consumption and local data. The entire energy system was viewed over a period of 30 years, and the PV system was considered from cradle to gate, whereas the DH and imported electricity were analysed from the use phase only. The results of the PV system LCA are related to the specific electricity mix of the country. The authors of [
18] assessed the overall impact of the cradle-to-grave LCA of a PV system in 76 European locations over 100 years. The results indicate that, in countries with a high penetration of renewable energy sources in the energy mix, the net environmental impact of PV systems applied to buildings might be negative if the production is not substantial. In countries where electricity production is based on fossil fuels, PV systems can be considered environmentally friendly [
17,
18].
4.4. System Boundaries
Figure 3 and
Figure 4 give an illustration of the system boundaries of the PV and the DH system. The figures are colour-coded to show that the life cycle inventory is organised. Included in the system boundaries of the PV system are the extraction and processing of raw materials, the manufacturing of panels, transportation, and installation. The outputs from the system are emissions to air and water and energy. The DH system boundaries include the production of wood pellets and biogas, transportation of fuels to DH plant, incineration of fuels and transportation of waste. The associated outputs are emissions to air and water and heat. DH from biomass is commonly viewed as climate neutral due to the carbon storage in organic material. Therefore, the emission of CO
was considered to be net zero in this paper. The PV cells are set to manufacturing in Malaysia and module assembly in Mexico, and are stored in Germany and Norway before being shipped to the installation location. DH includes the delivery of fuel and transportation of fly ash.
6. Discussion
This section discusses the obtained findings from the energy and LCA analysis of the building’s energy system. The energy system under consideration for this building consists of solar PV, grid supply, and DH. As mentioned earlier, the main reason for the installation of solar PV on the roof of the studied building is to balance the building’s energy budget and achieve a nZEB status, as defined in
Section 3. The premise of local and on-site energy production, which was also included in a Norwegian nZEB proposal as described in
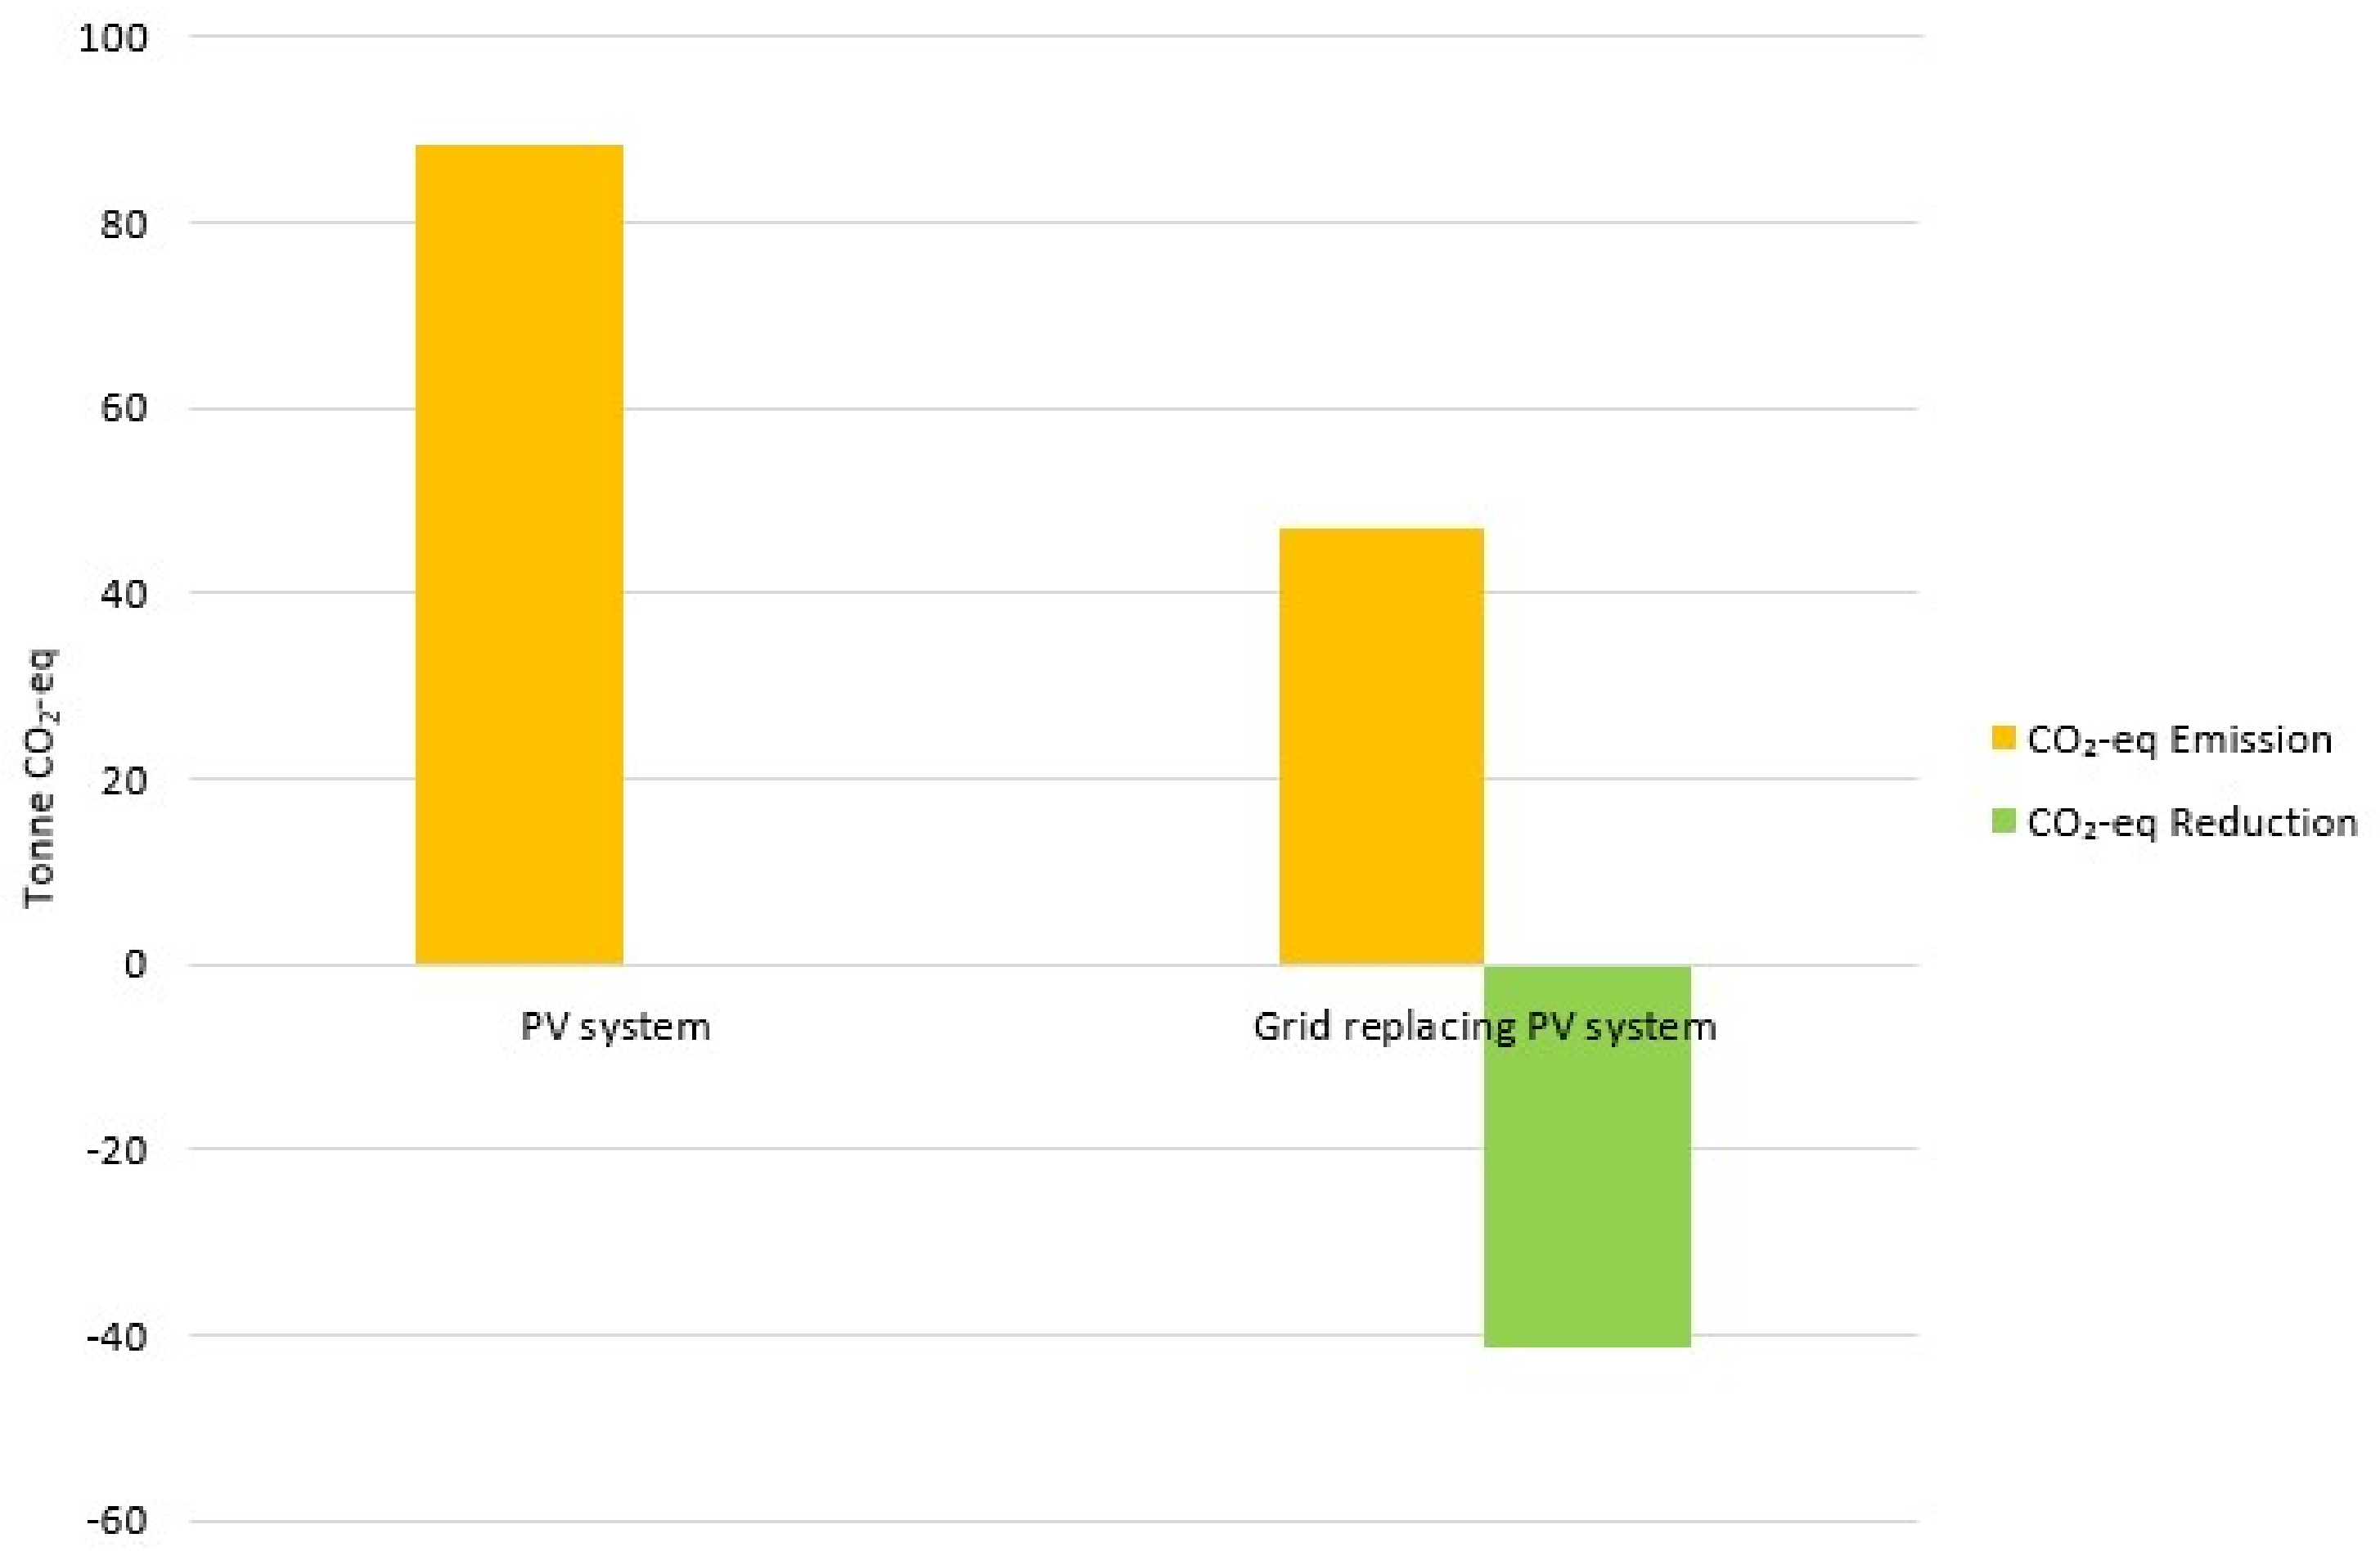
Section 2.5, is a commonly accepted approach to nZEBs. Although locally generated electricity can reduce the amount of imported/purchased electricity, this should be seen in comparison with a wider system perspective. The purpose of nZEB regulation is to reduce emissions from the building sector. A common denominator of nZEBs is a building with low energy demand and local energy production. When using energy as a measurement, real emissions can be misinterpreted. Using local energy production such as solar PV has the potential to reduce grid-imported electricity. The problem arises when local energy production has a higher emission factor from a life cycle perspective than the alternative, in this case, grid-imported electricity. When looking at a net “reduction” in energy, the environmental impact of the case study is low compared to conventional buildings. However, as it is illustrated in this paper, the reduction in imported or purchased energy does not necessarily mean the reduction in emissions from a life cycle perspective.
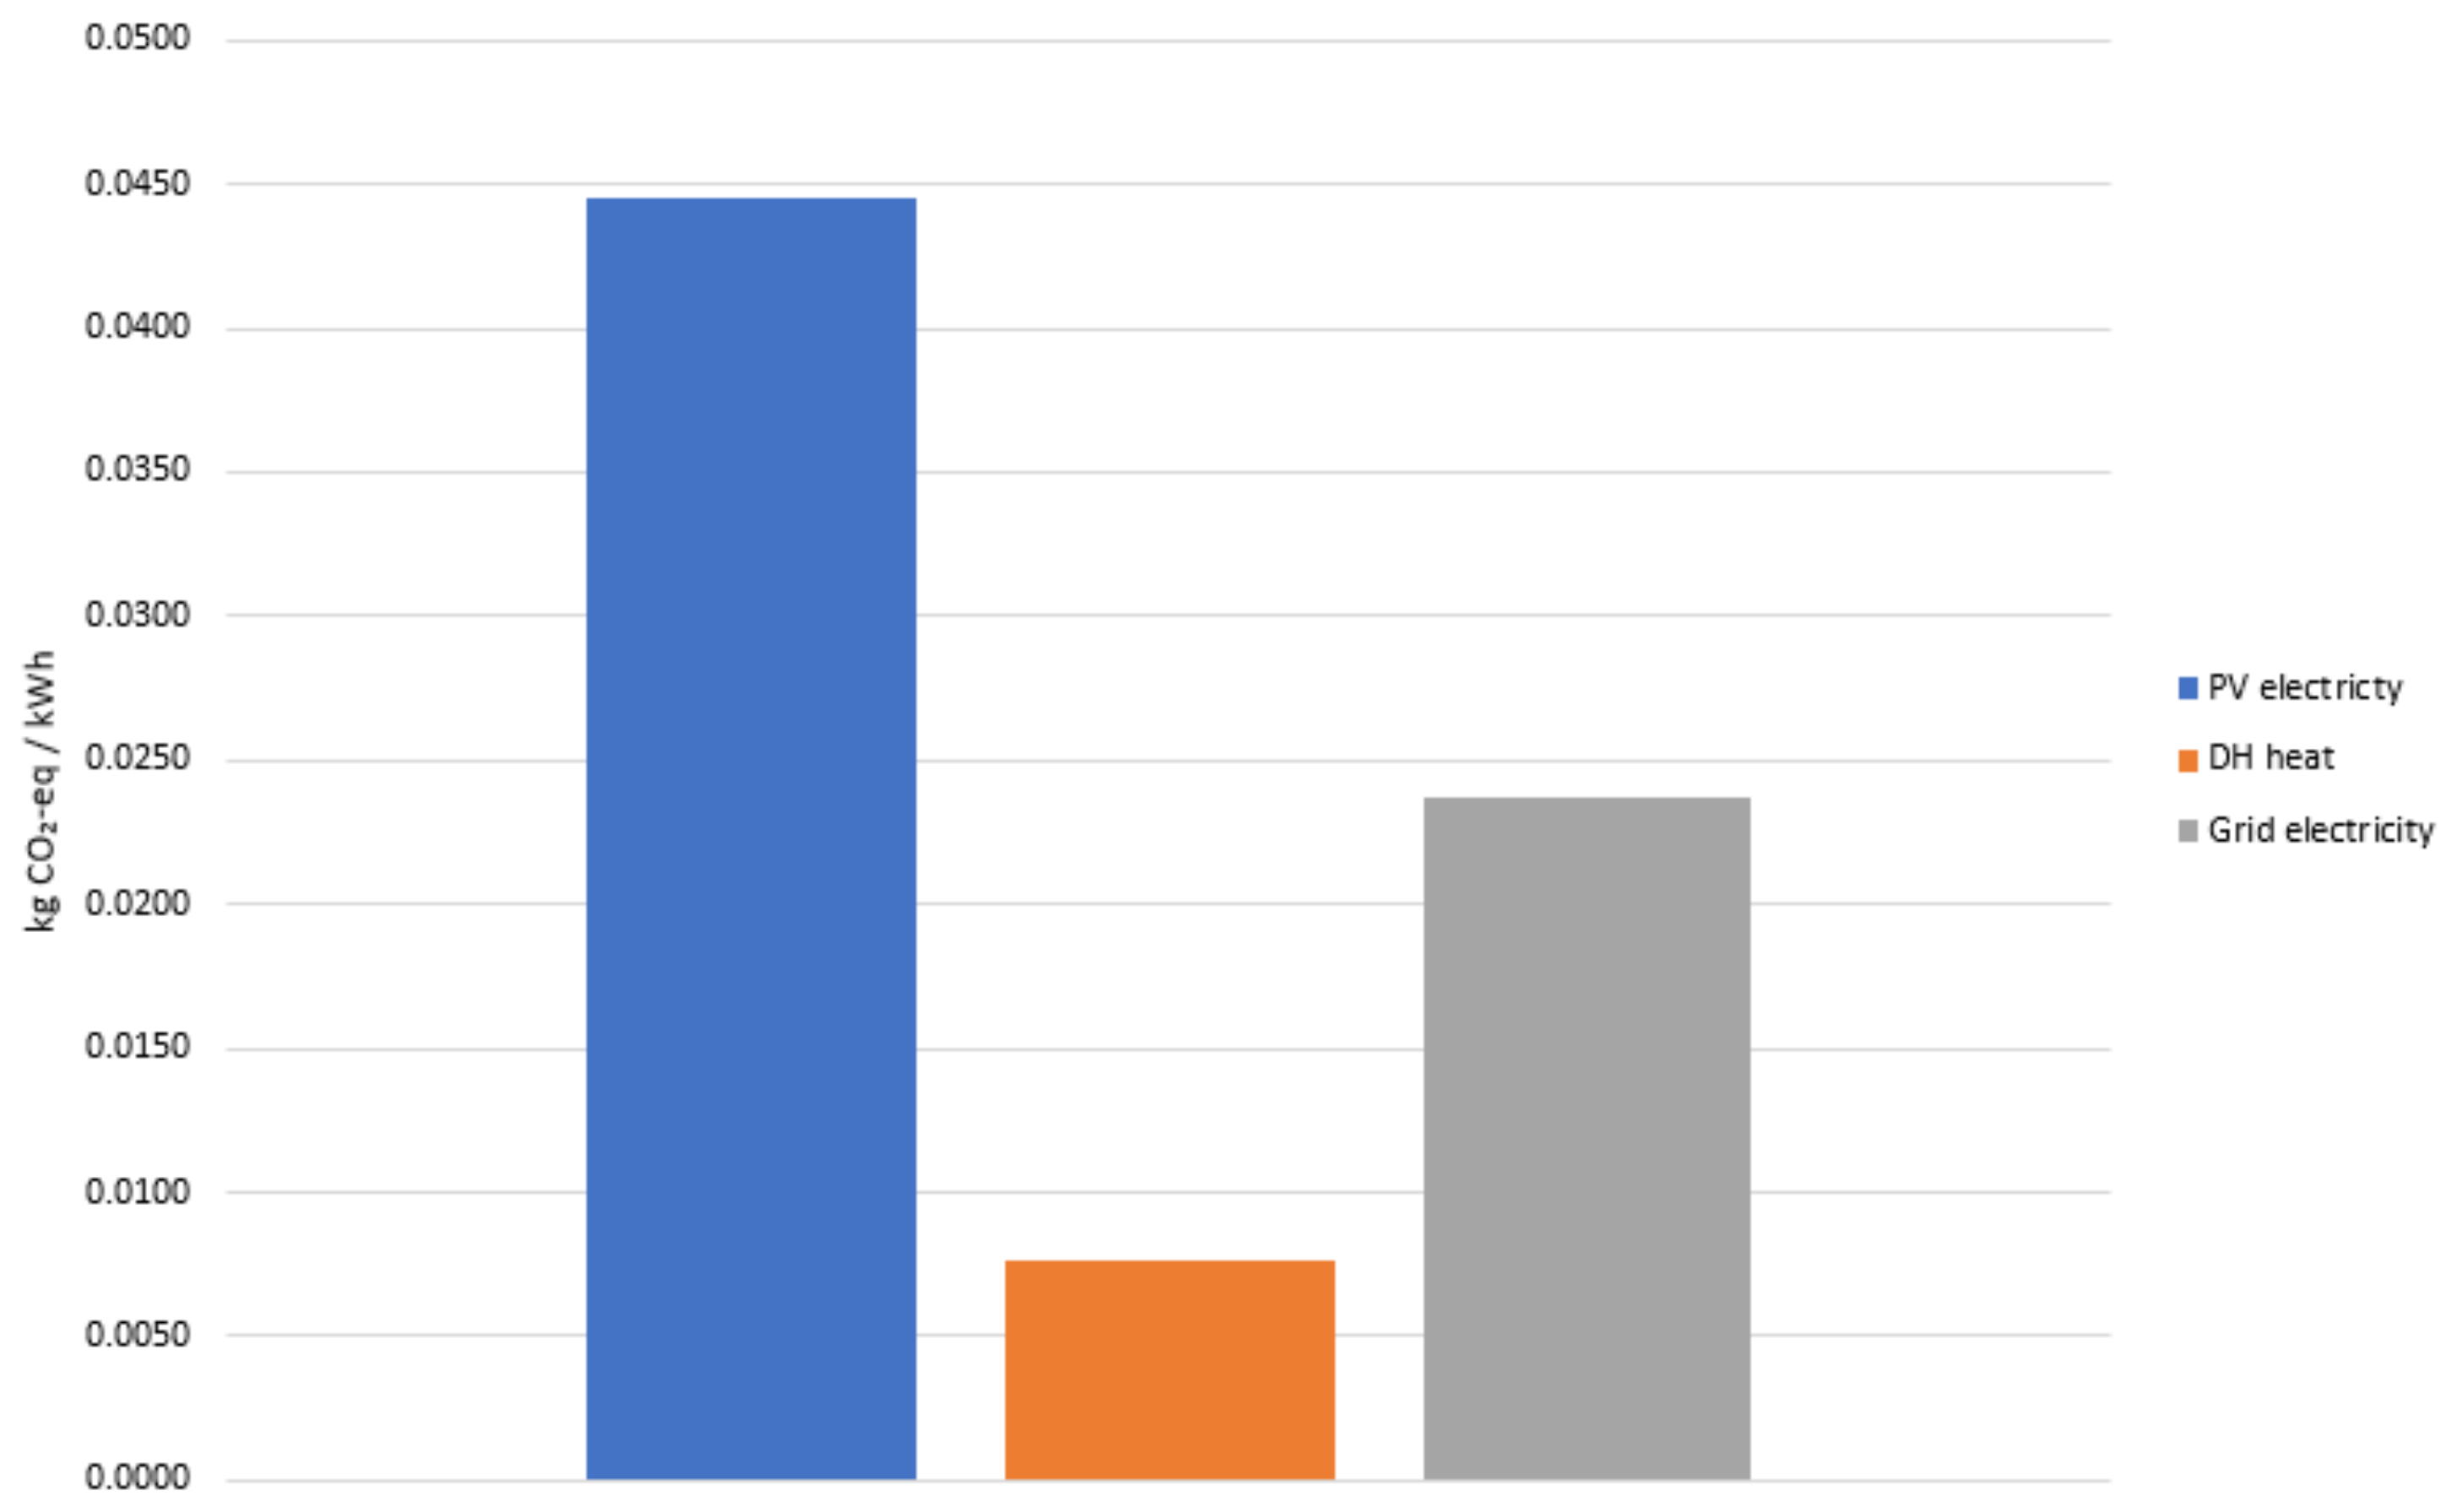
The results from
Figure 9 show that solar PV panels, which in this case are produced in Malaysia (with a predominantly fossil fuel-based power production mix), have higher emission levels per kWh produced than the electricity bought from the national power grid. If the emission factor of an energy conversion technology such as solar PV exceeds the current country’s electricity production mix, the net contribution from the PV can be negative. In general terms, the cleaner the original energy mix becomes, the more important is it to thoroughly assess the overall climate impact. This is the reason that, if the criteria for nZEBs is solely dependent on energy requirements, it can be misleading in terms of actual environmental impact. This exact scenario can be argued in this paper. Using imported grid electricity in contrast to the installed solar PV would lead to a GHG emission reduction, given the reference frame used in this work. It is therefore also important to assess emissions in connection with the building, which will be part of the revised EPBD. To assume that local energy production is always the better alternative can be misleading. However in this case, if the manufacturing of the solar PV panels was placed in a country with a cleaner energy supply mix, the emission levels would be decreased. This was also the conclusion from the study [
18], where the author concluded that even though solar PV is considered “clean”, the environmental impact is dependent on the amount of renewable energy in the electricity production mix as well as the PV systems’ annual production. Therefore, environmental performance should be also considered as a criteria in nZEB legislation. This is also supported by the proposed recast of the EPBD from 2021. Since Norway is considered to have a “clean” energy mix, it is perhaps more appropriate to assess emission factors instead of energy needs. As illustrated in this paper, a so-called low energy demand does not necessarily translate into lower emissions.
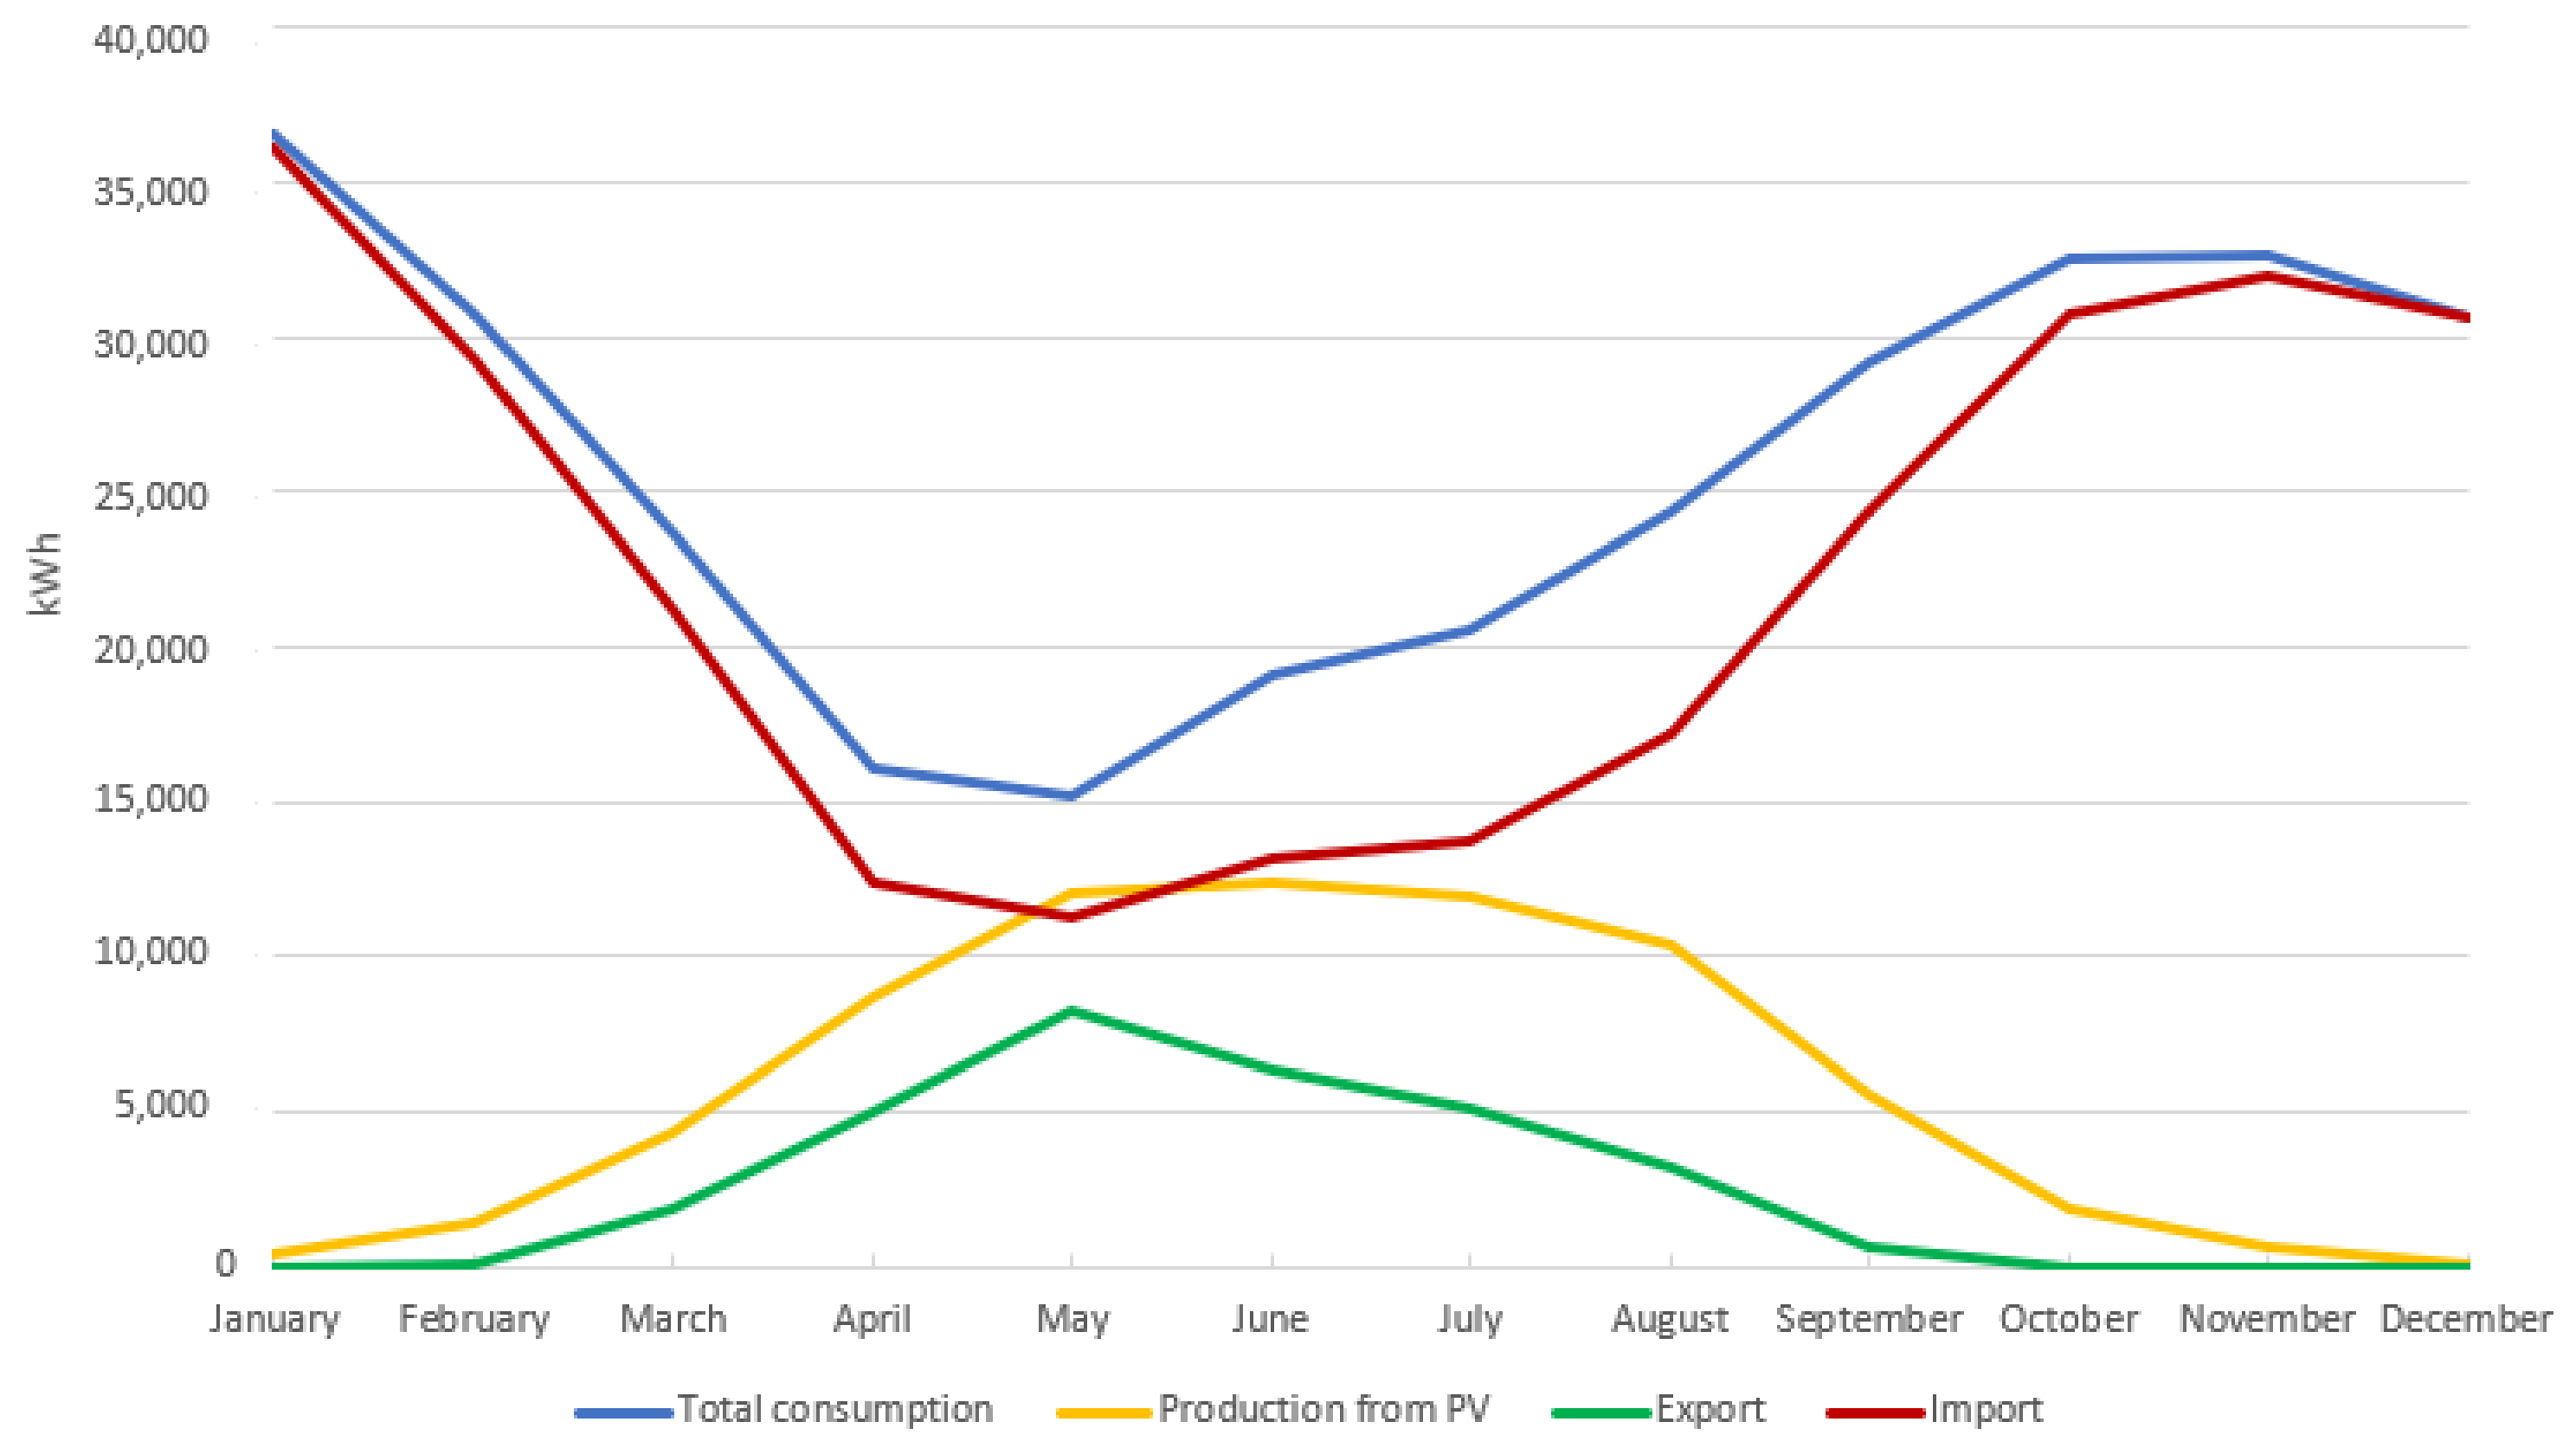
Furthermore, the total energy demand for the building for the year 2020 amounts to 570 MWh, of which the electric energy demand accounts for about 55%, while the remaining 45% is heating. In this case, solar power production of 70 MWh is also included. As characterised in
Figure 5 and
Table 4, it appears that the heating demand exceeds the energy demand for a passive house (although this is unknown due to insufficient data), and therefore the proposed nZEB definition. However, it is difficult to make any conclusion regarding the source of high heating demand in 2020. It should also be mentioned that the campus grounds were closed for periods of time during the year 2020, starting in March due to the COVID-19 pandemic. It is due to this that the energy demand in previous and subsequent years can be higher than what was investigated in this paper.


