
Numerical Simulation Study on the Constitutive Model of Fully-Graded Concrete Based on Statistical Damage Theory
Abstract
:1. Introduction
2. Experimental Study on the Mechanical Properties of Fully-Graded Concrete
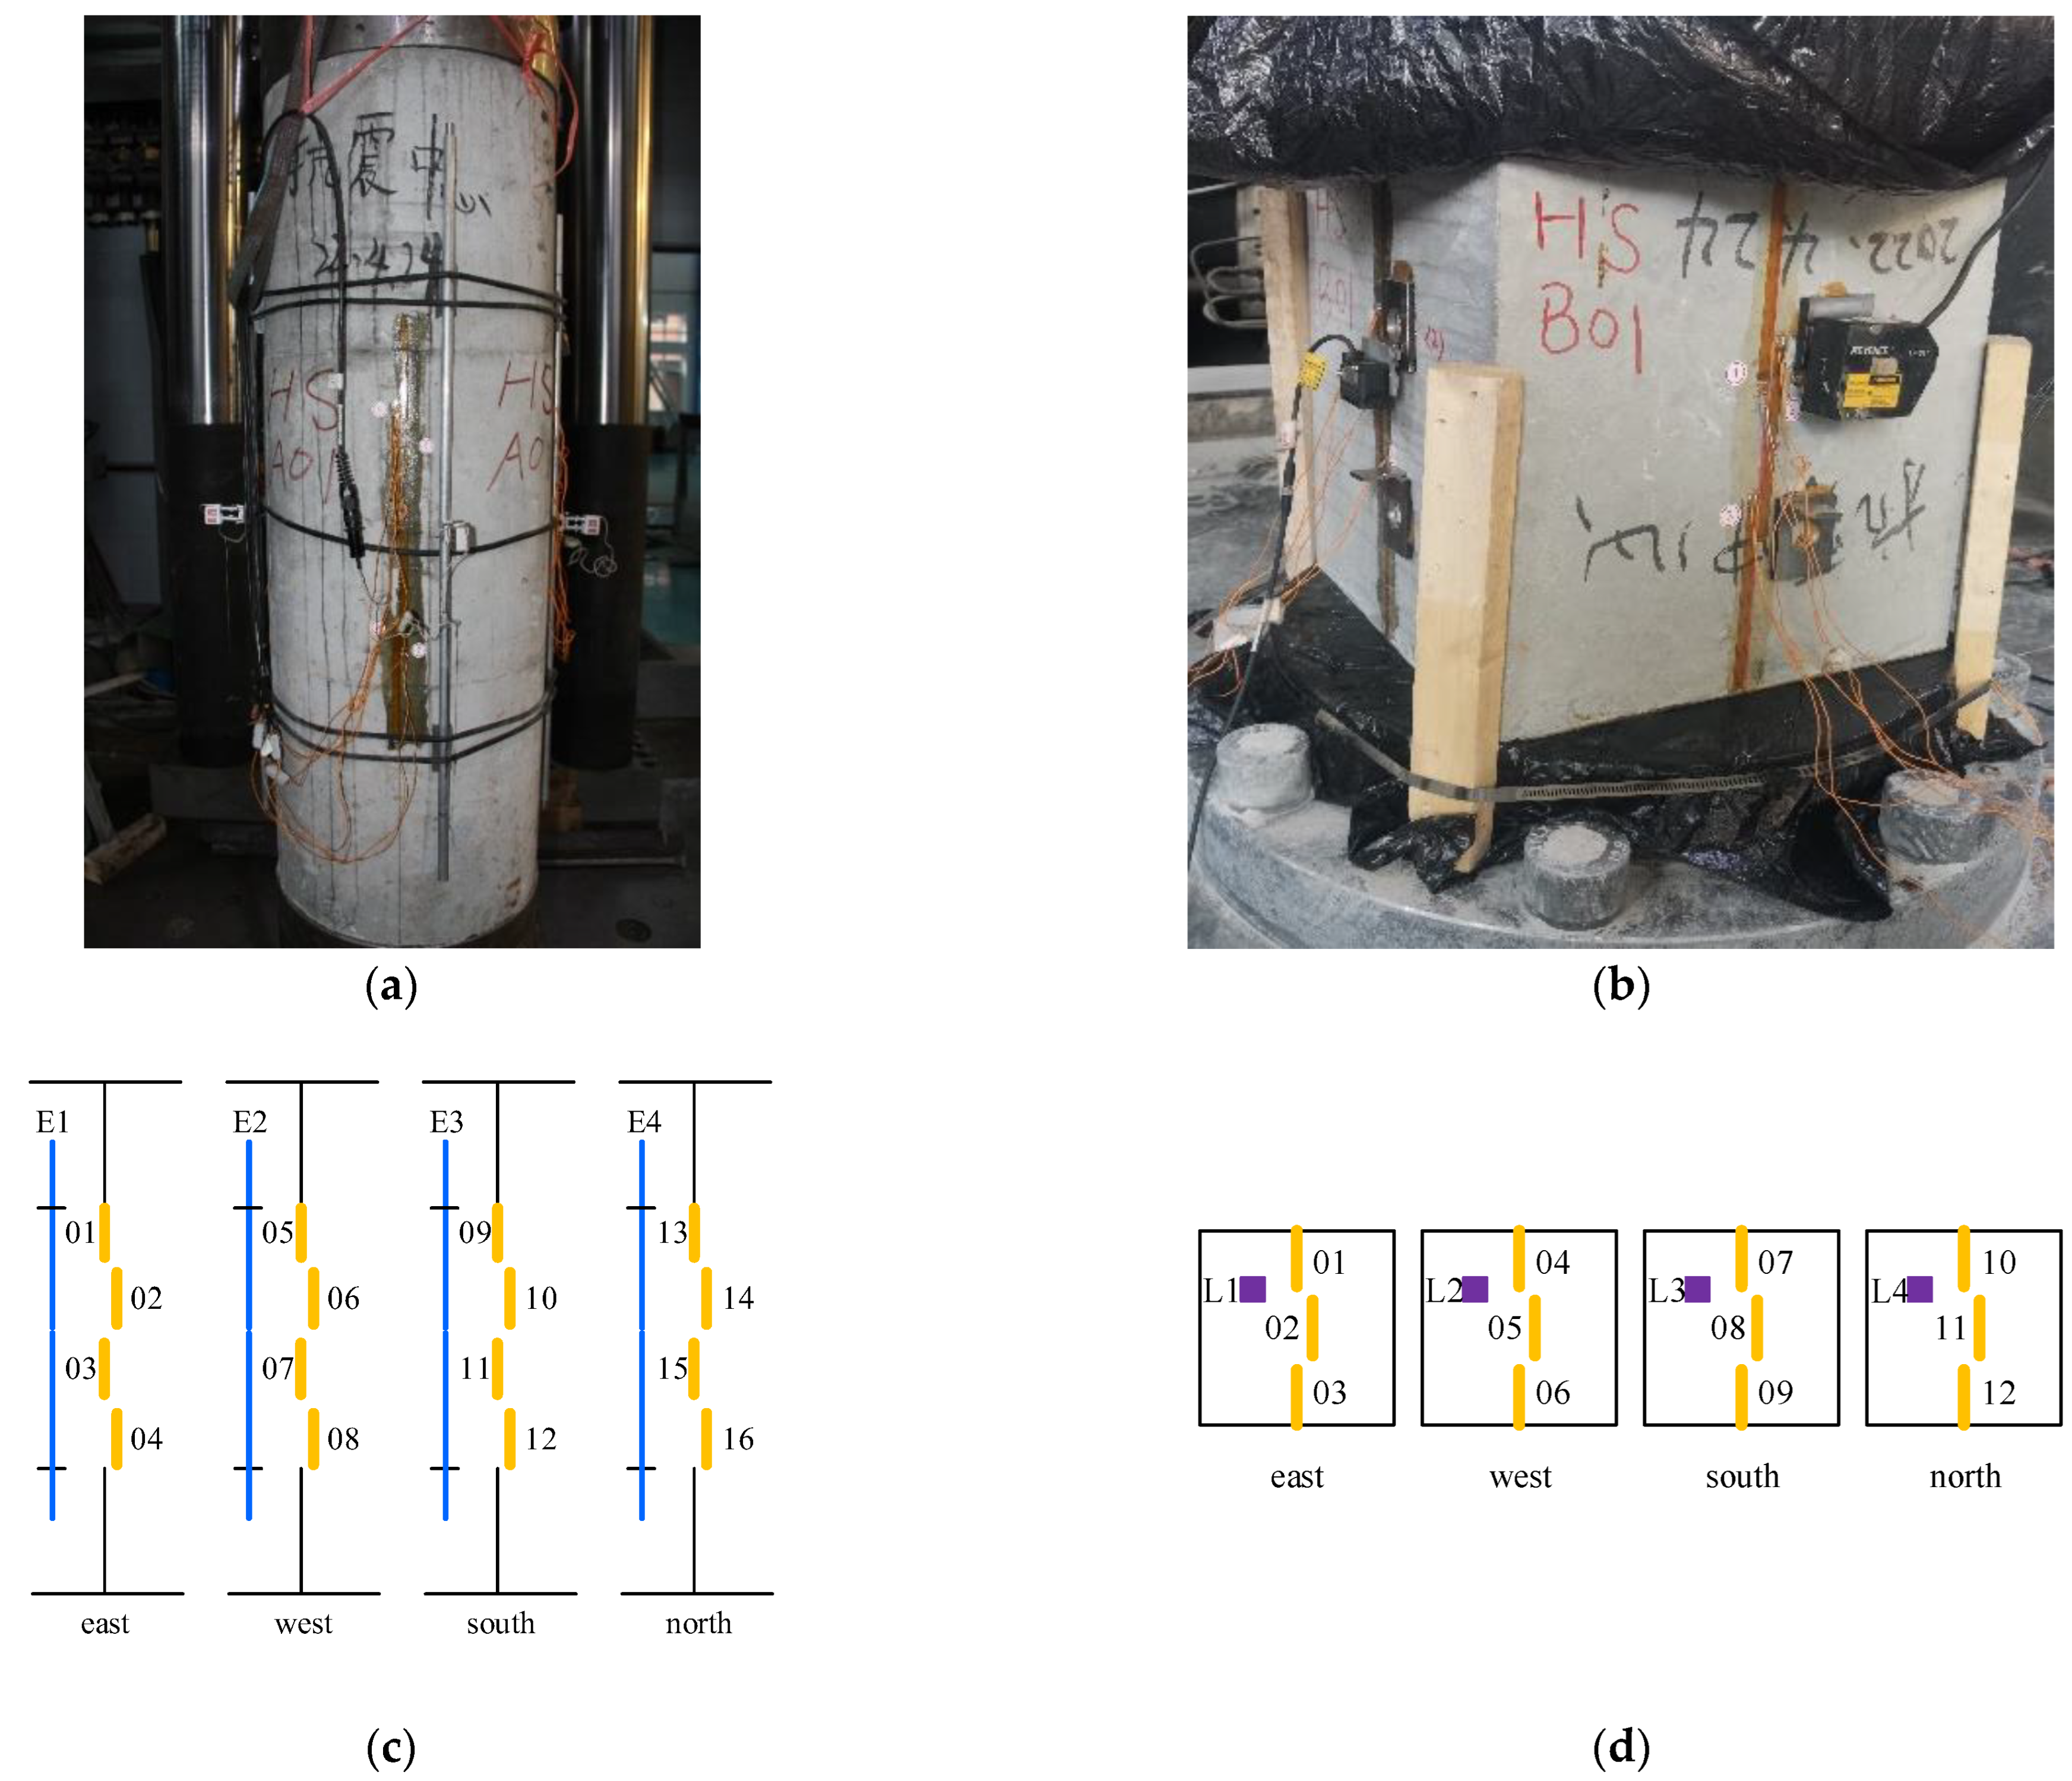
2.1. Fully-Graded Concrete Specimens
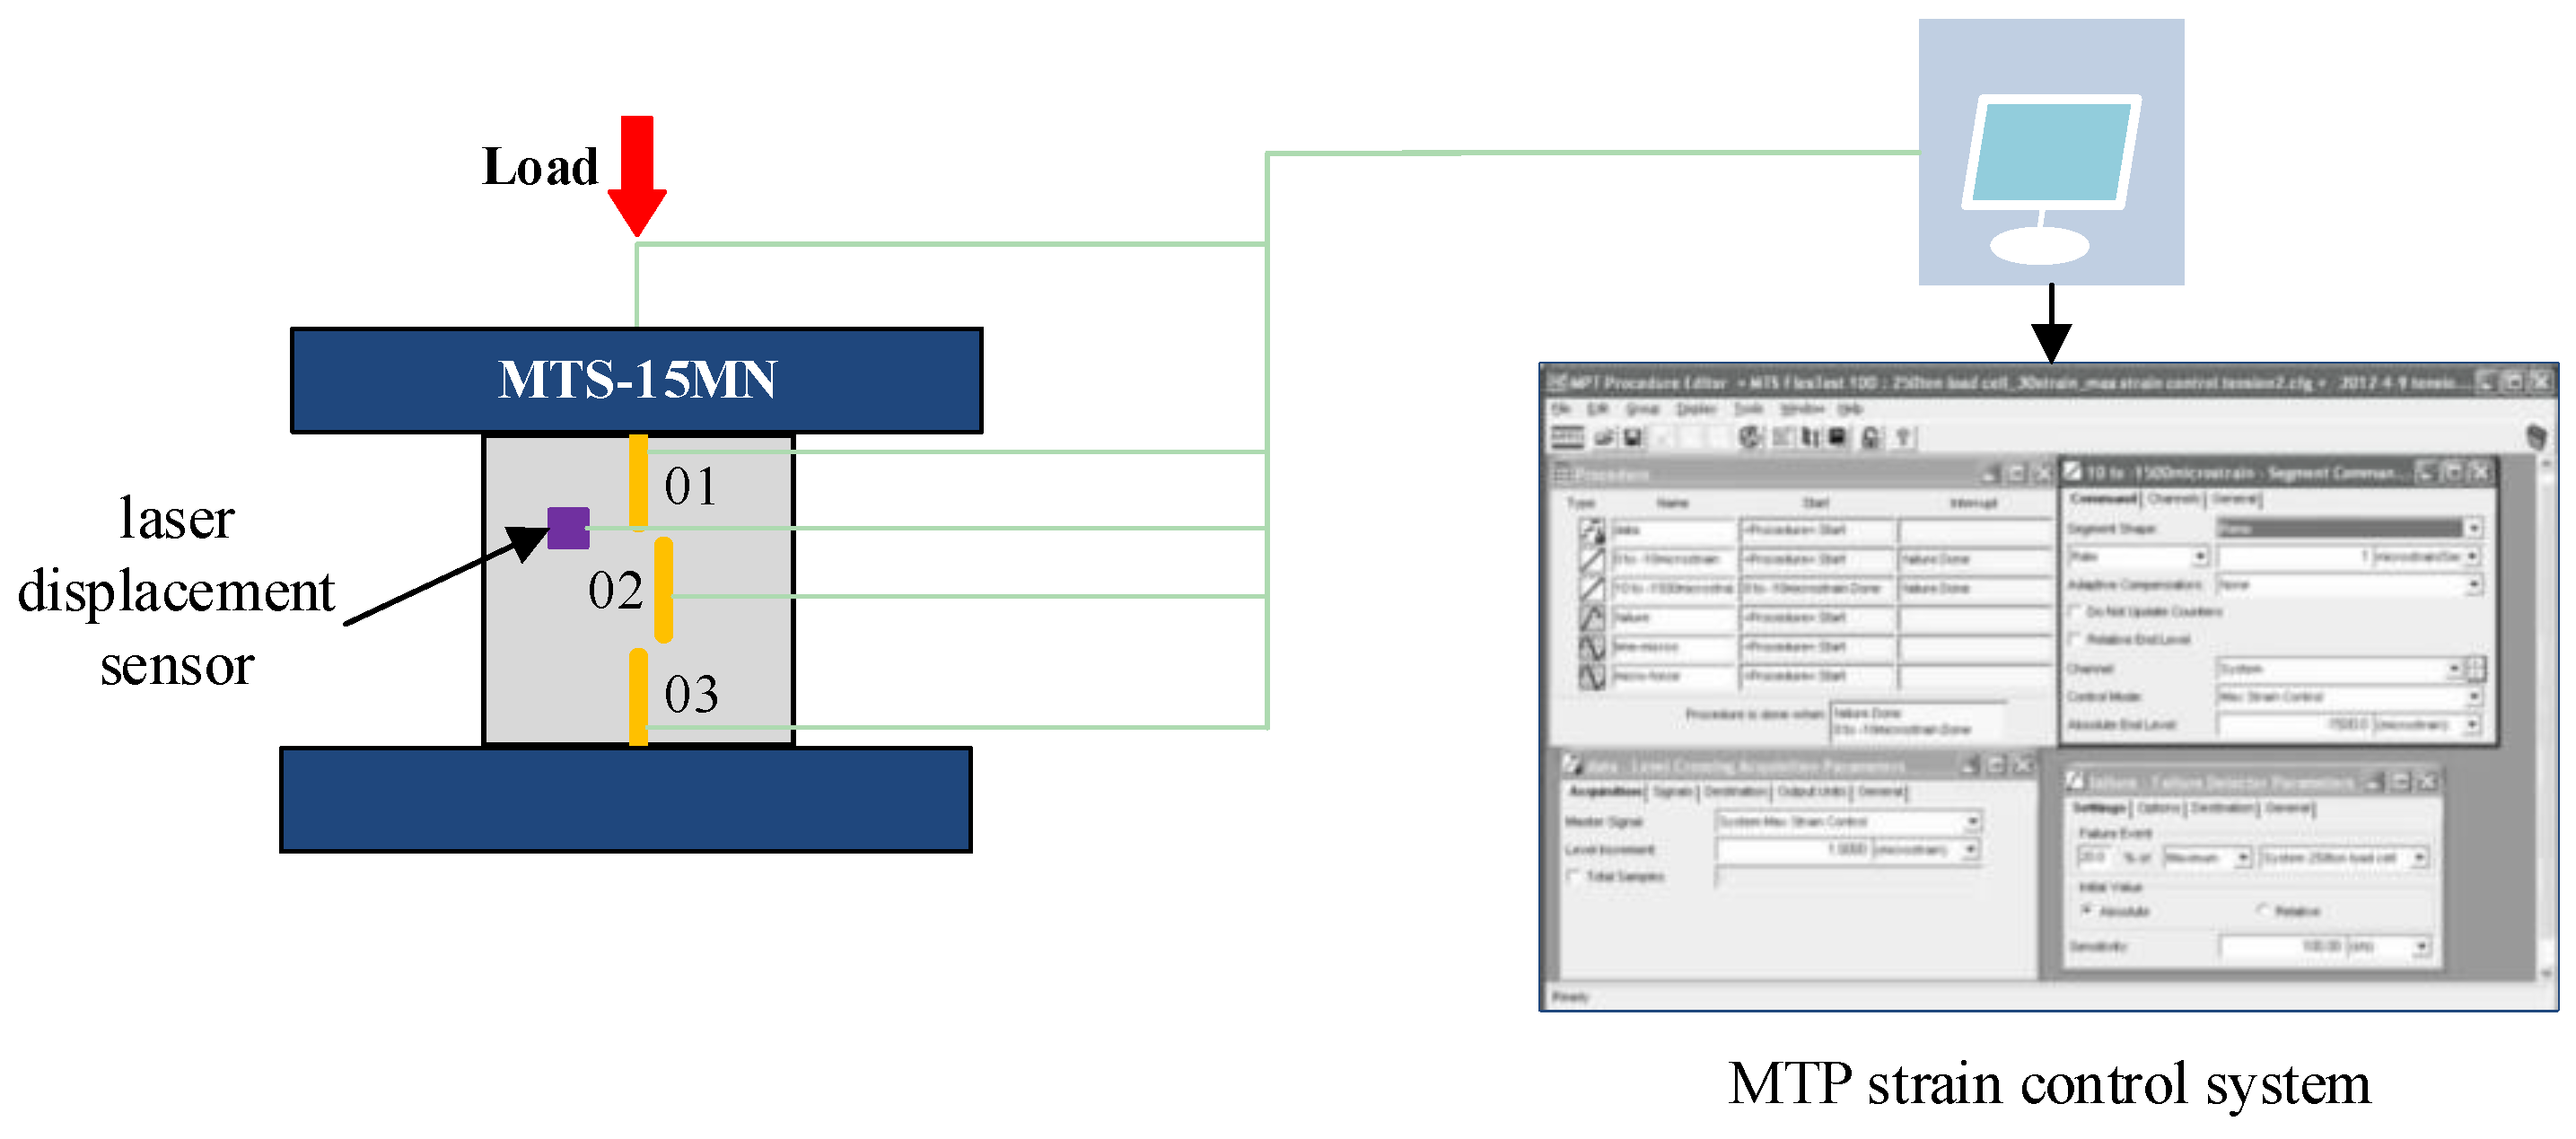
2.2. Test Equipment and Loading
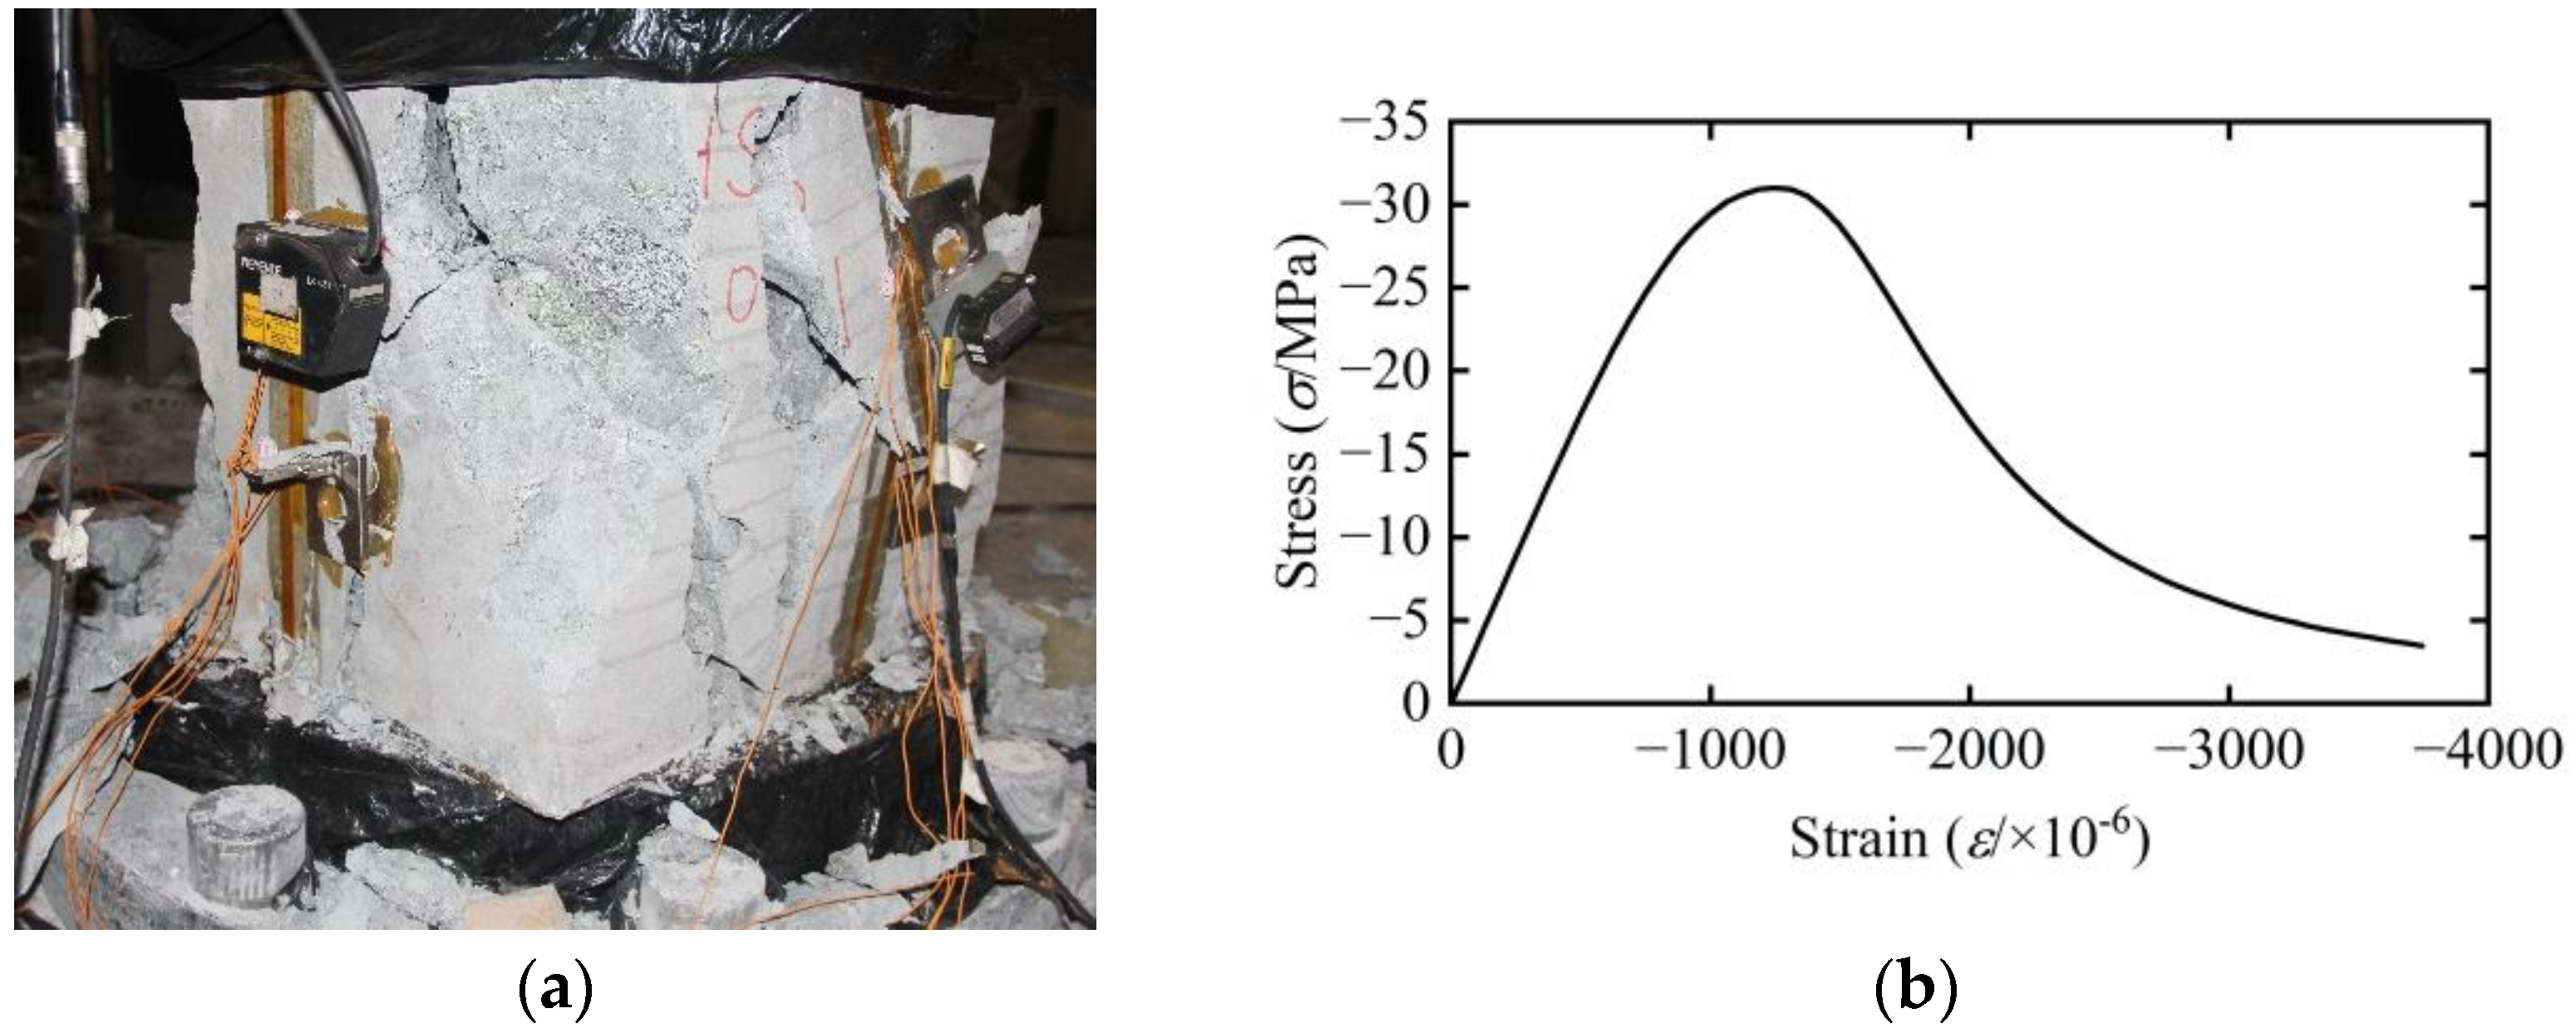
2.3. Test Results
3. SDM of Fully-Graded Concrete
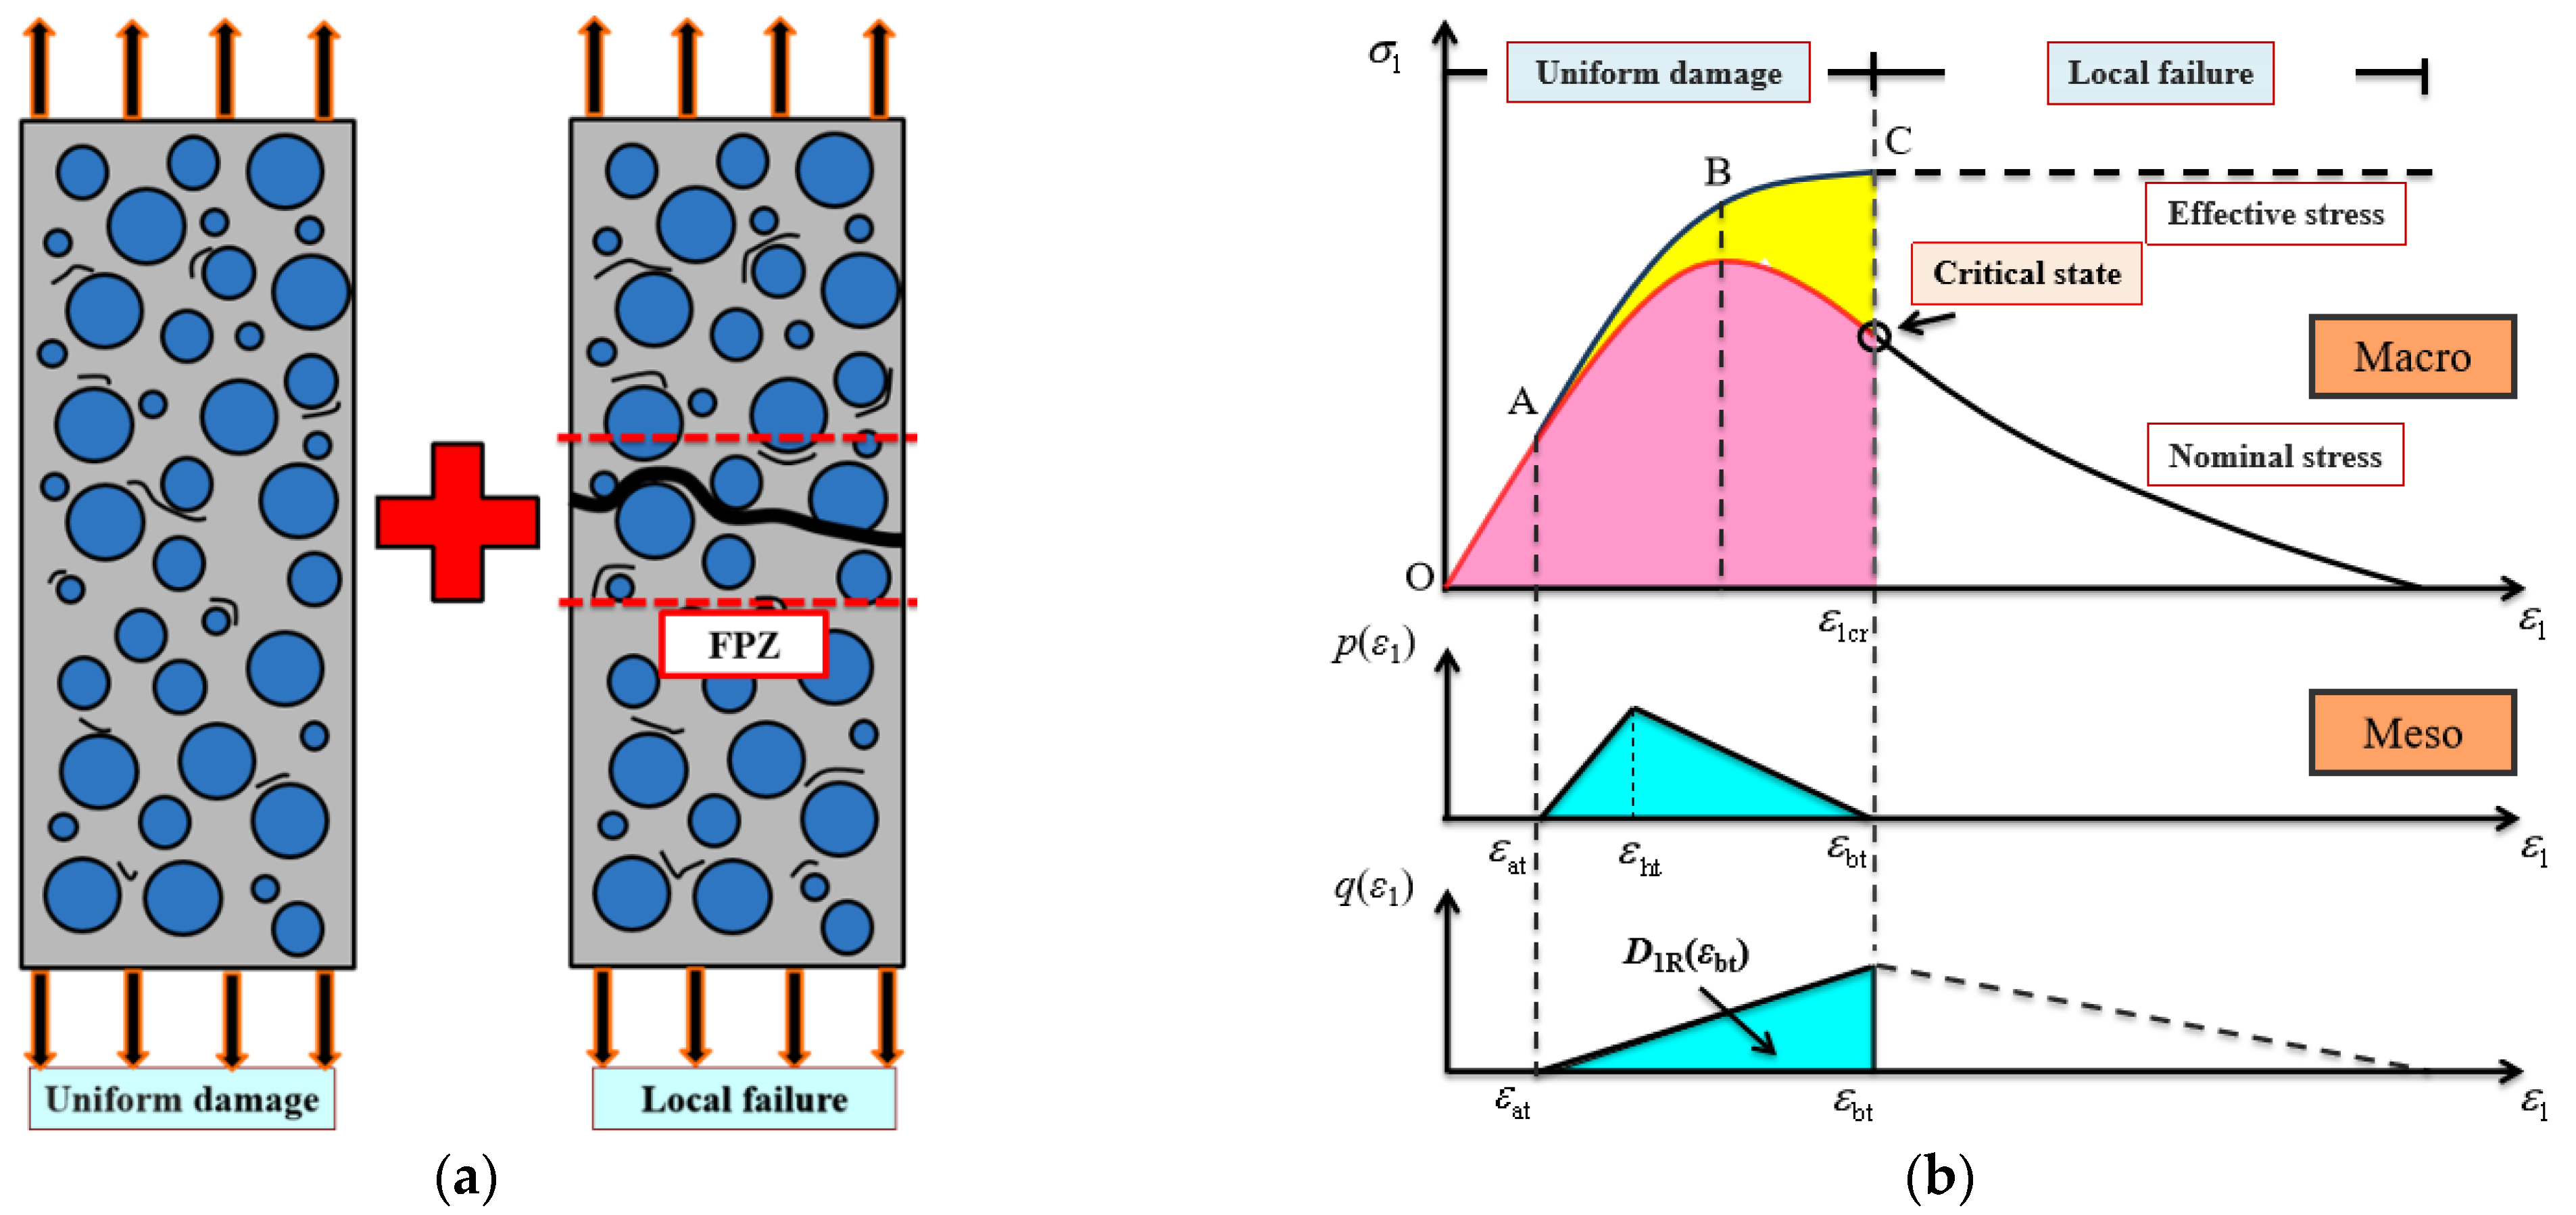
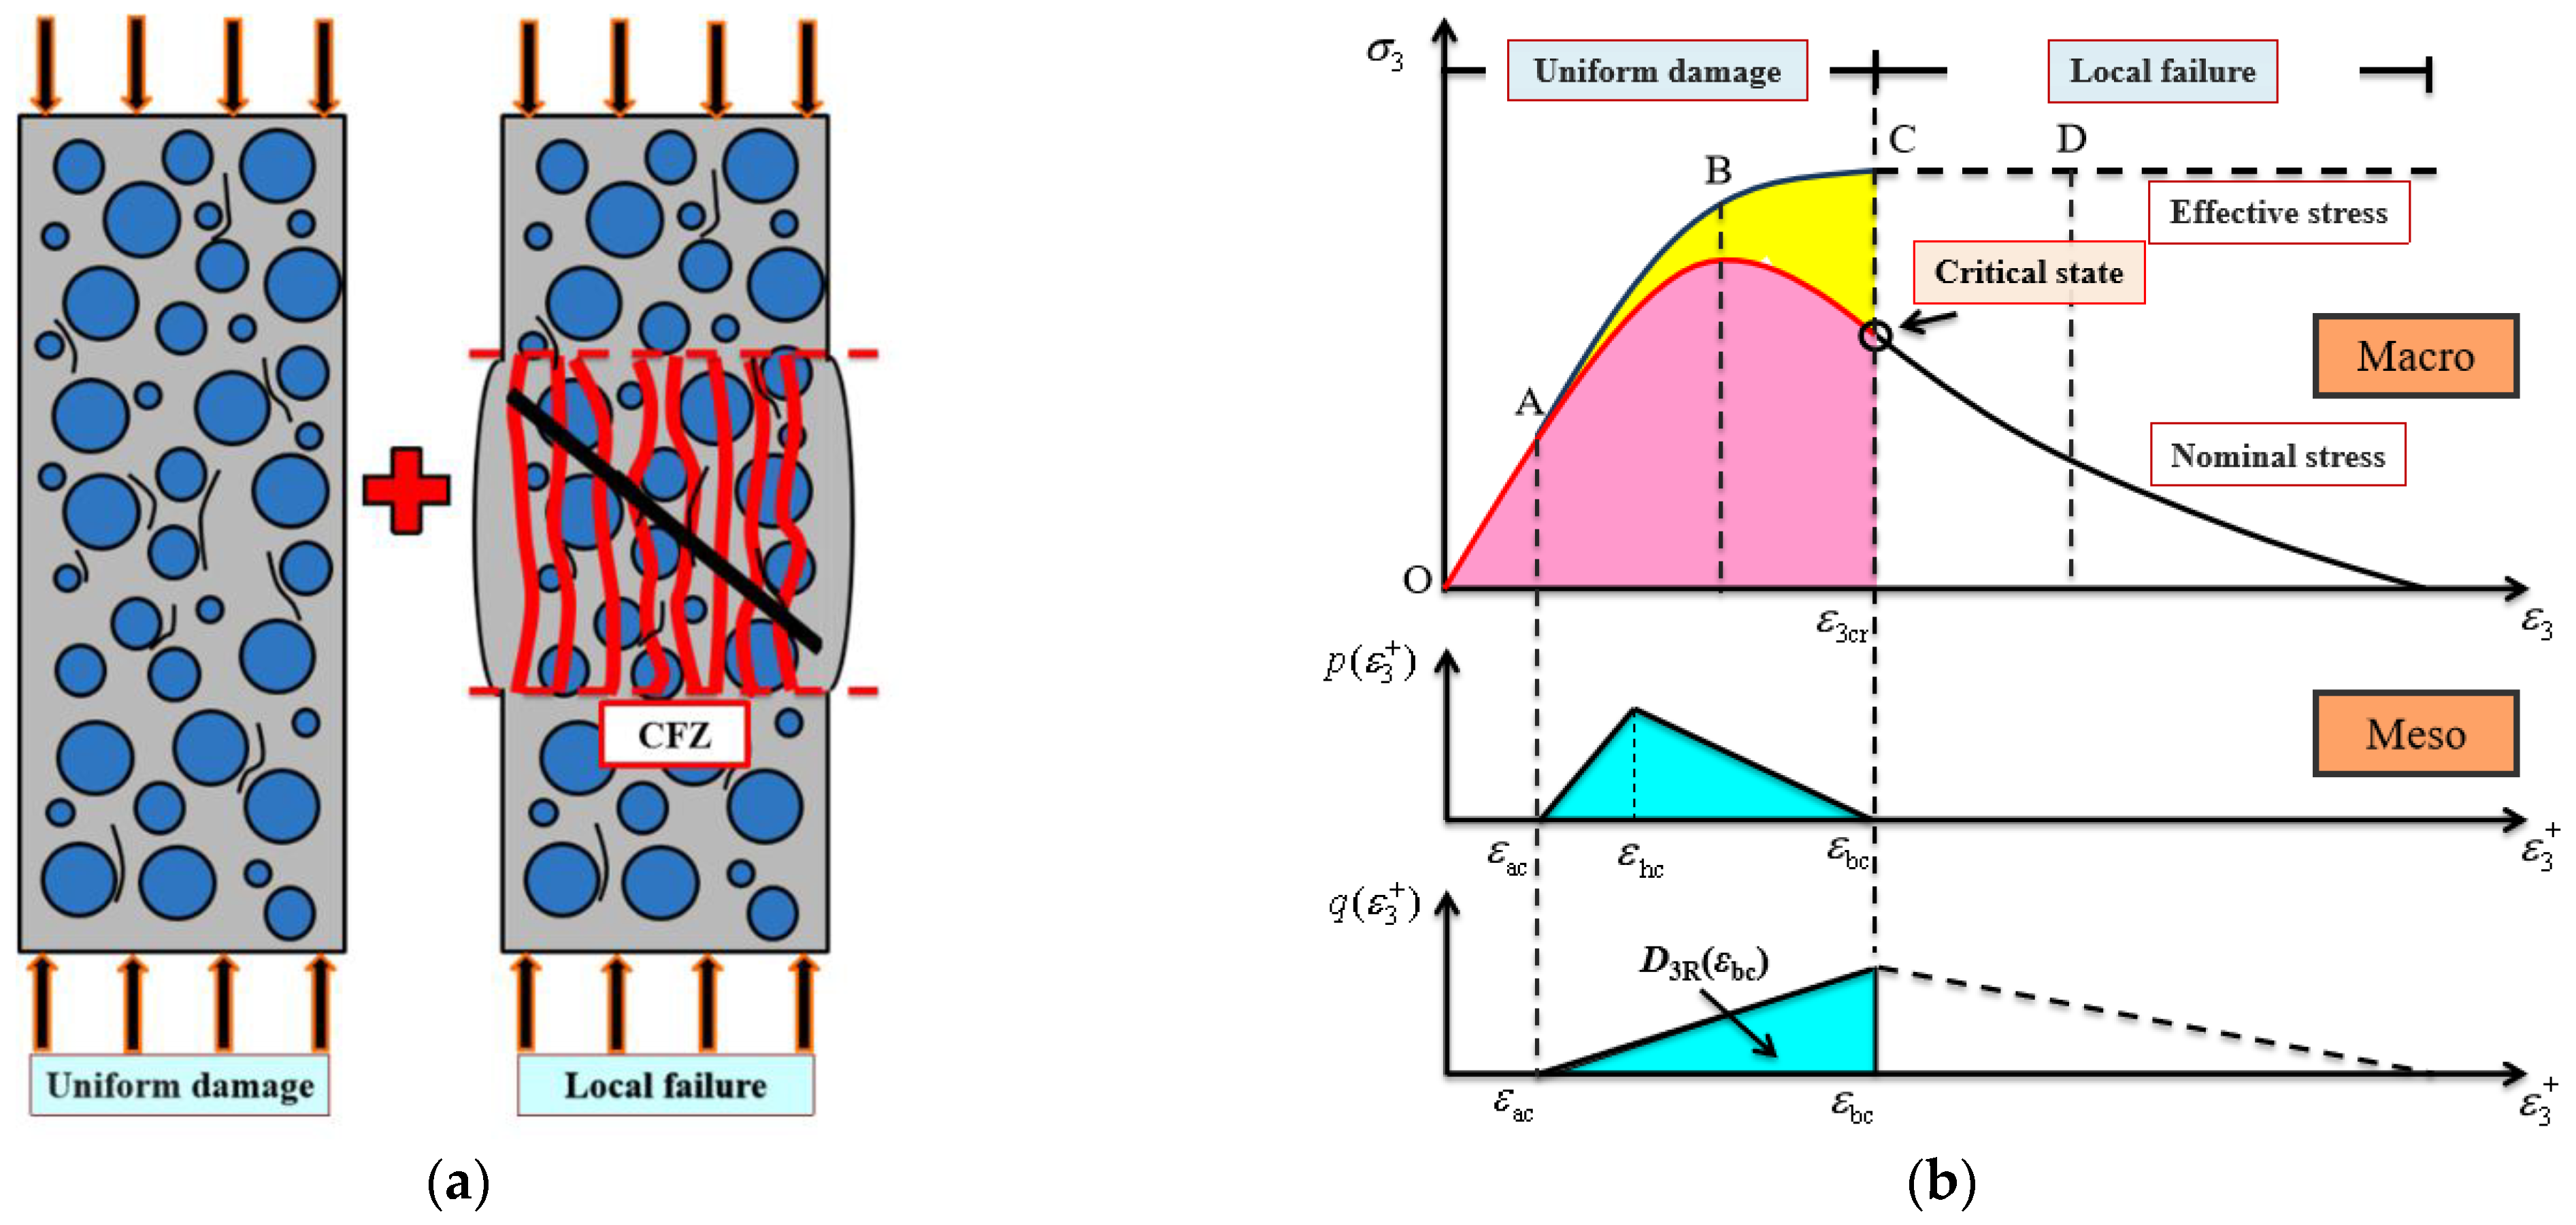
3.1. Mesoscopic Damage Mechanism and Macroscopic Constitutive Behavior
3.2. Statistical Damage Constitutive Model
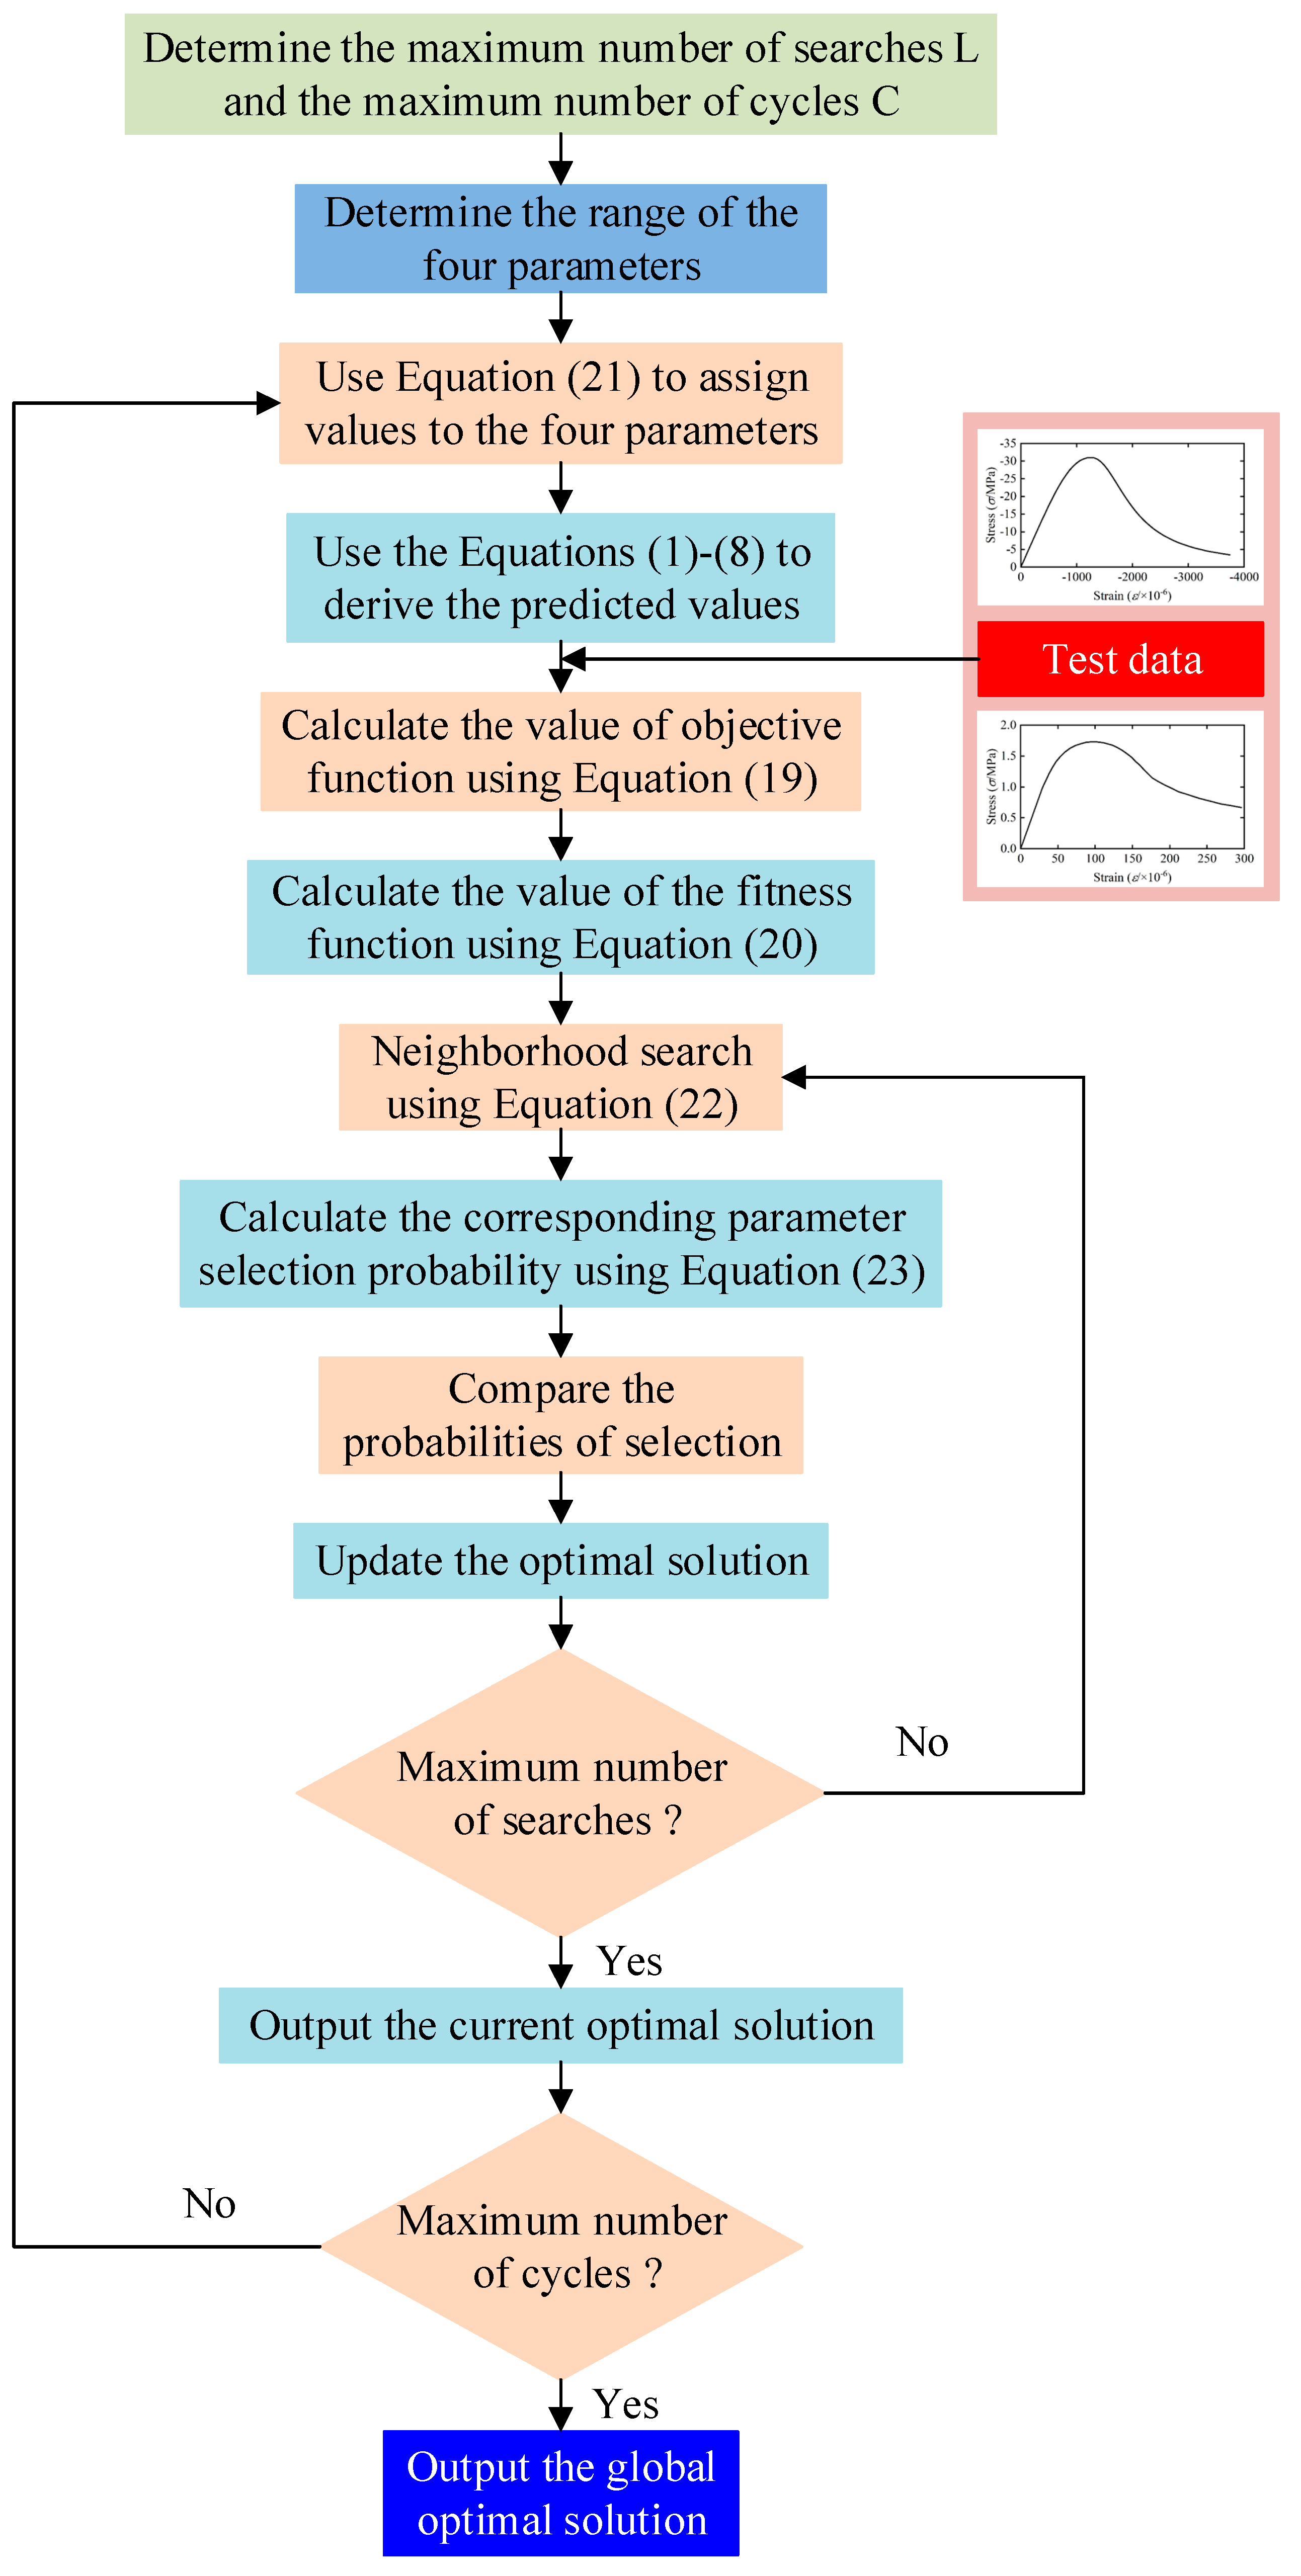
3.3. Parameterization Method Based on ABC
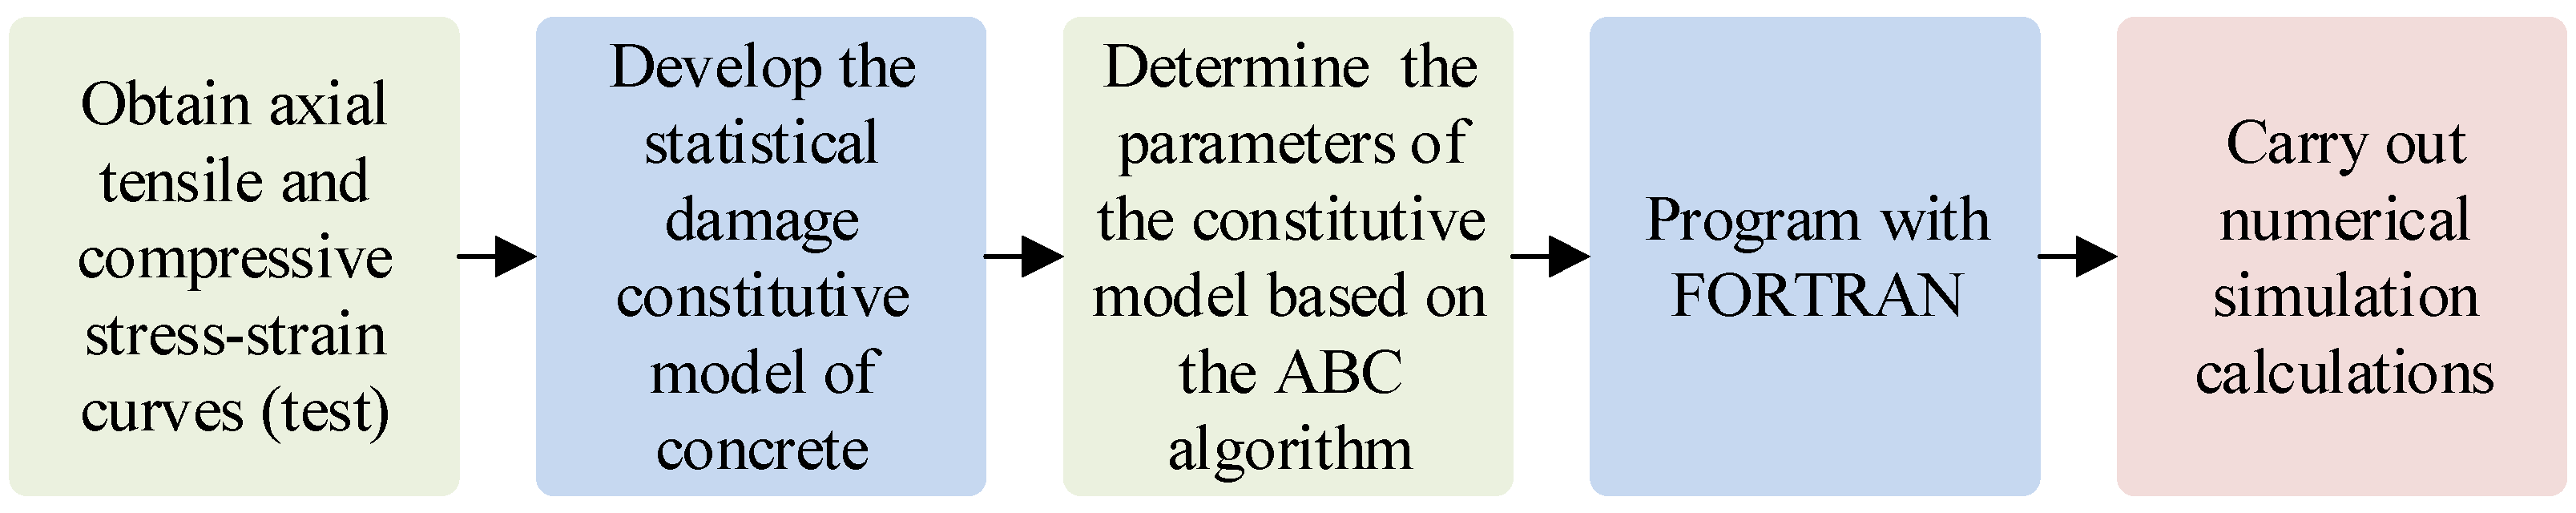
4. Numerical Implementation of SDM
5. Results
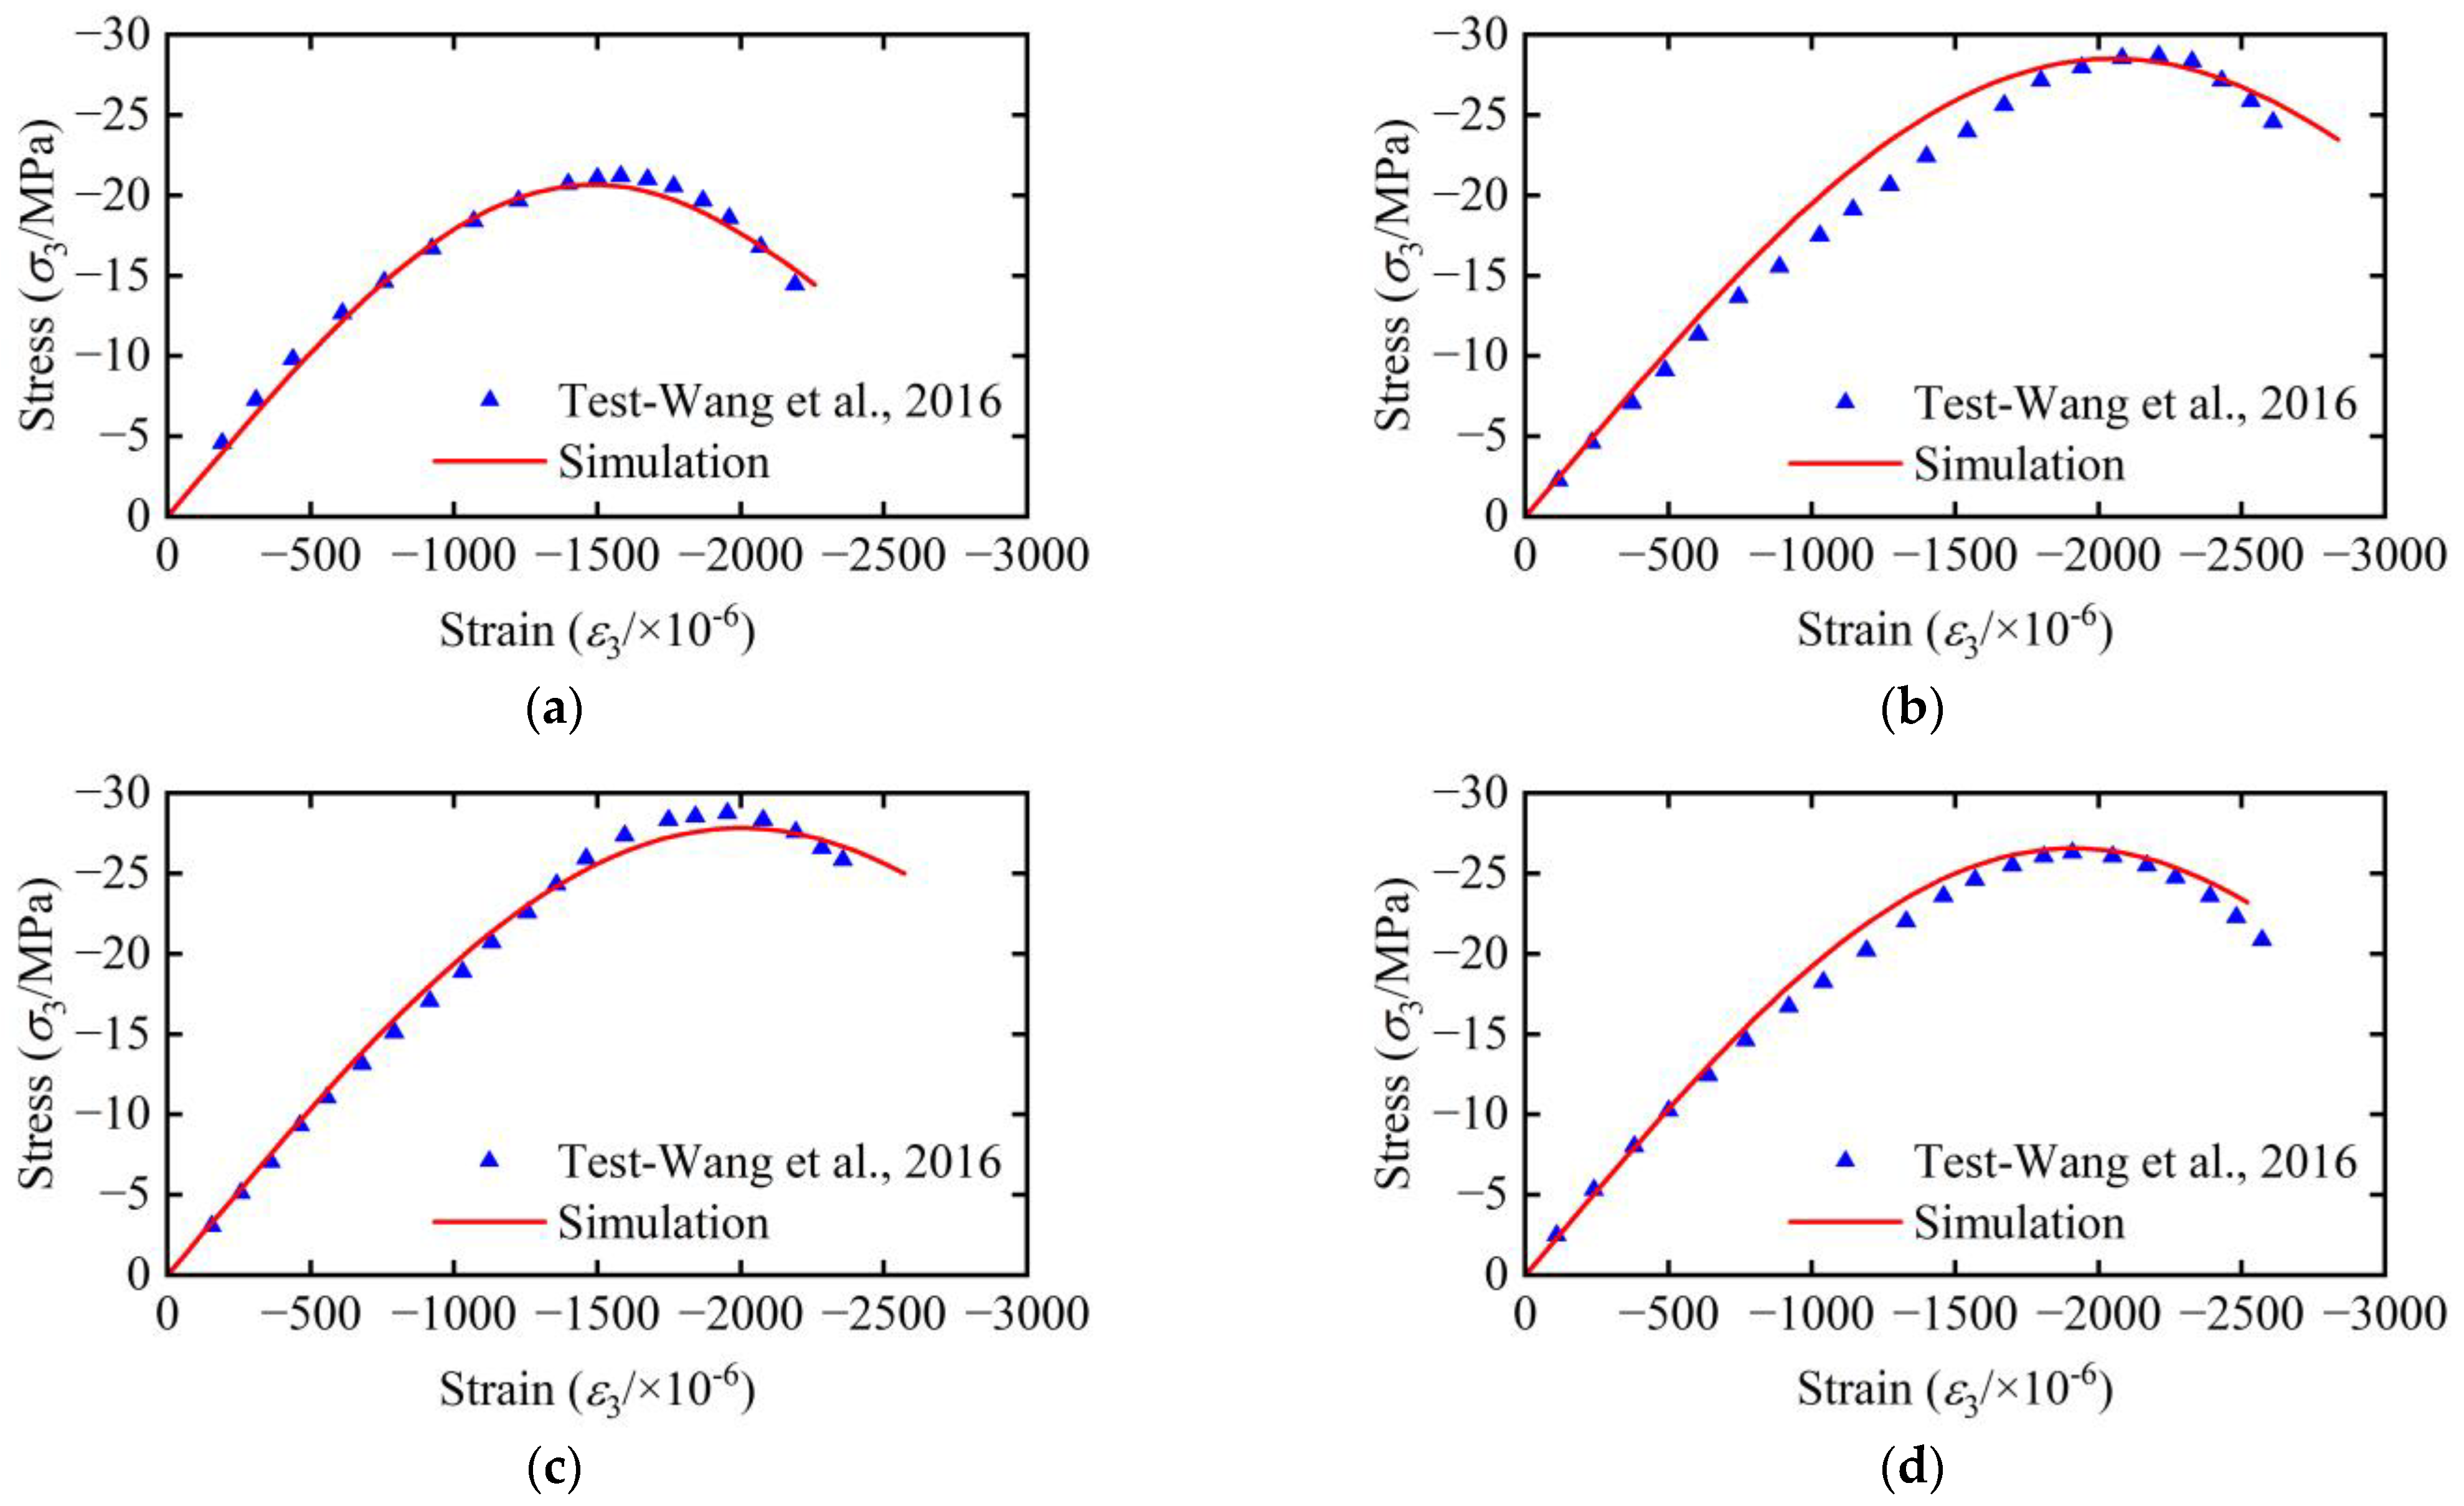
5.1. Numerical Simulation of Uniaxial Force
5.2. Numerical Simulation of Biaxial Forces
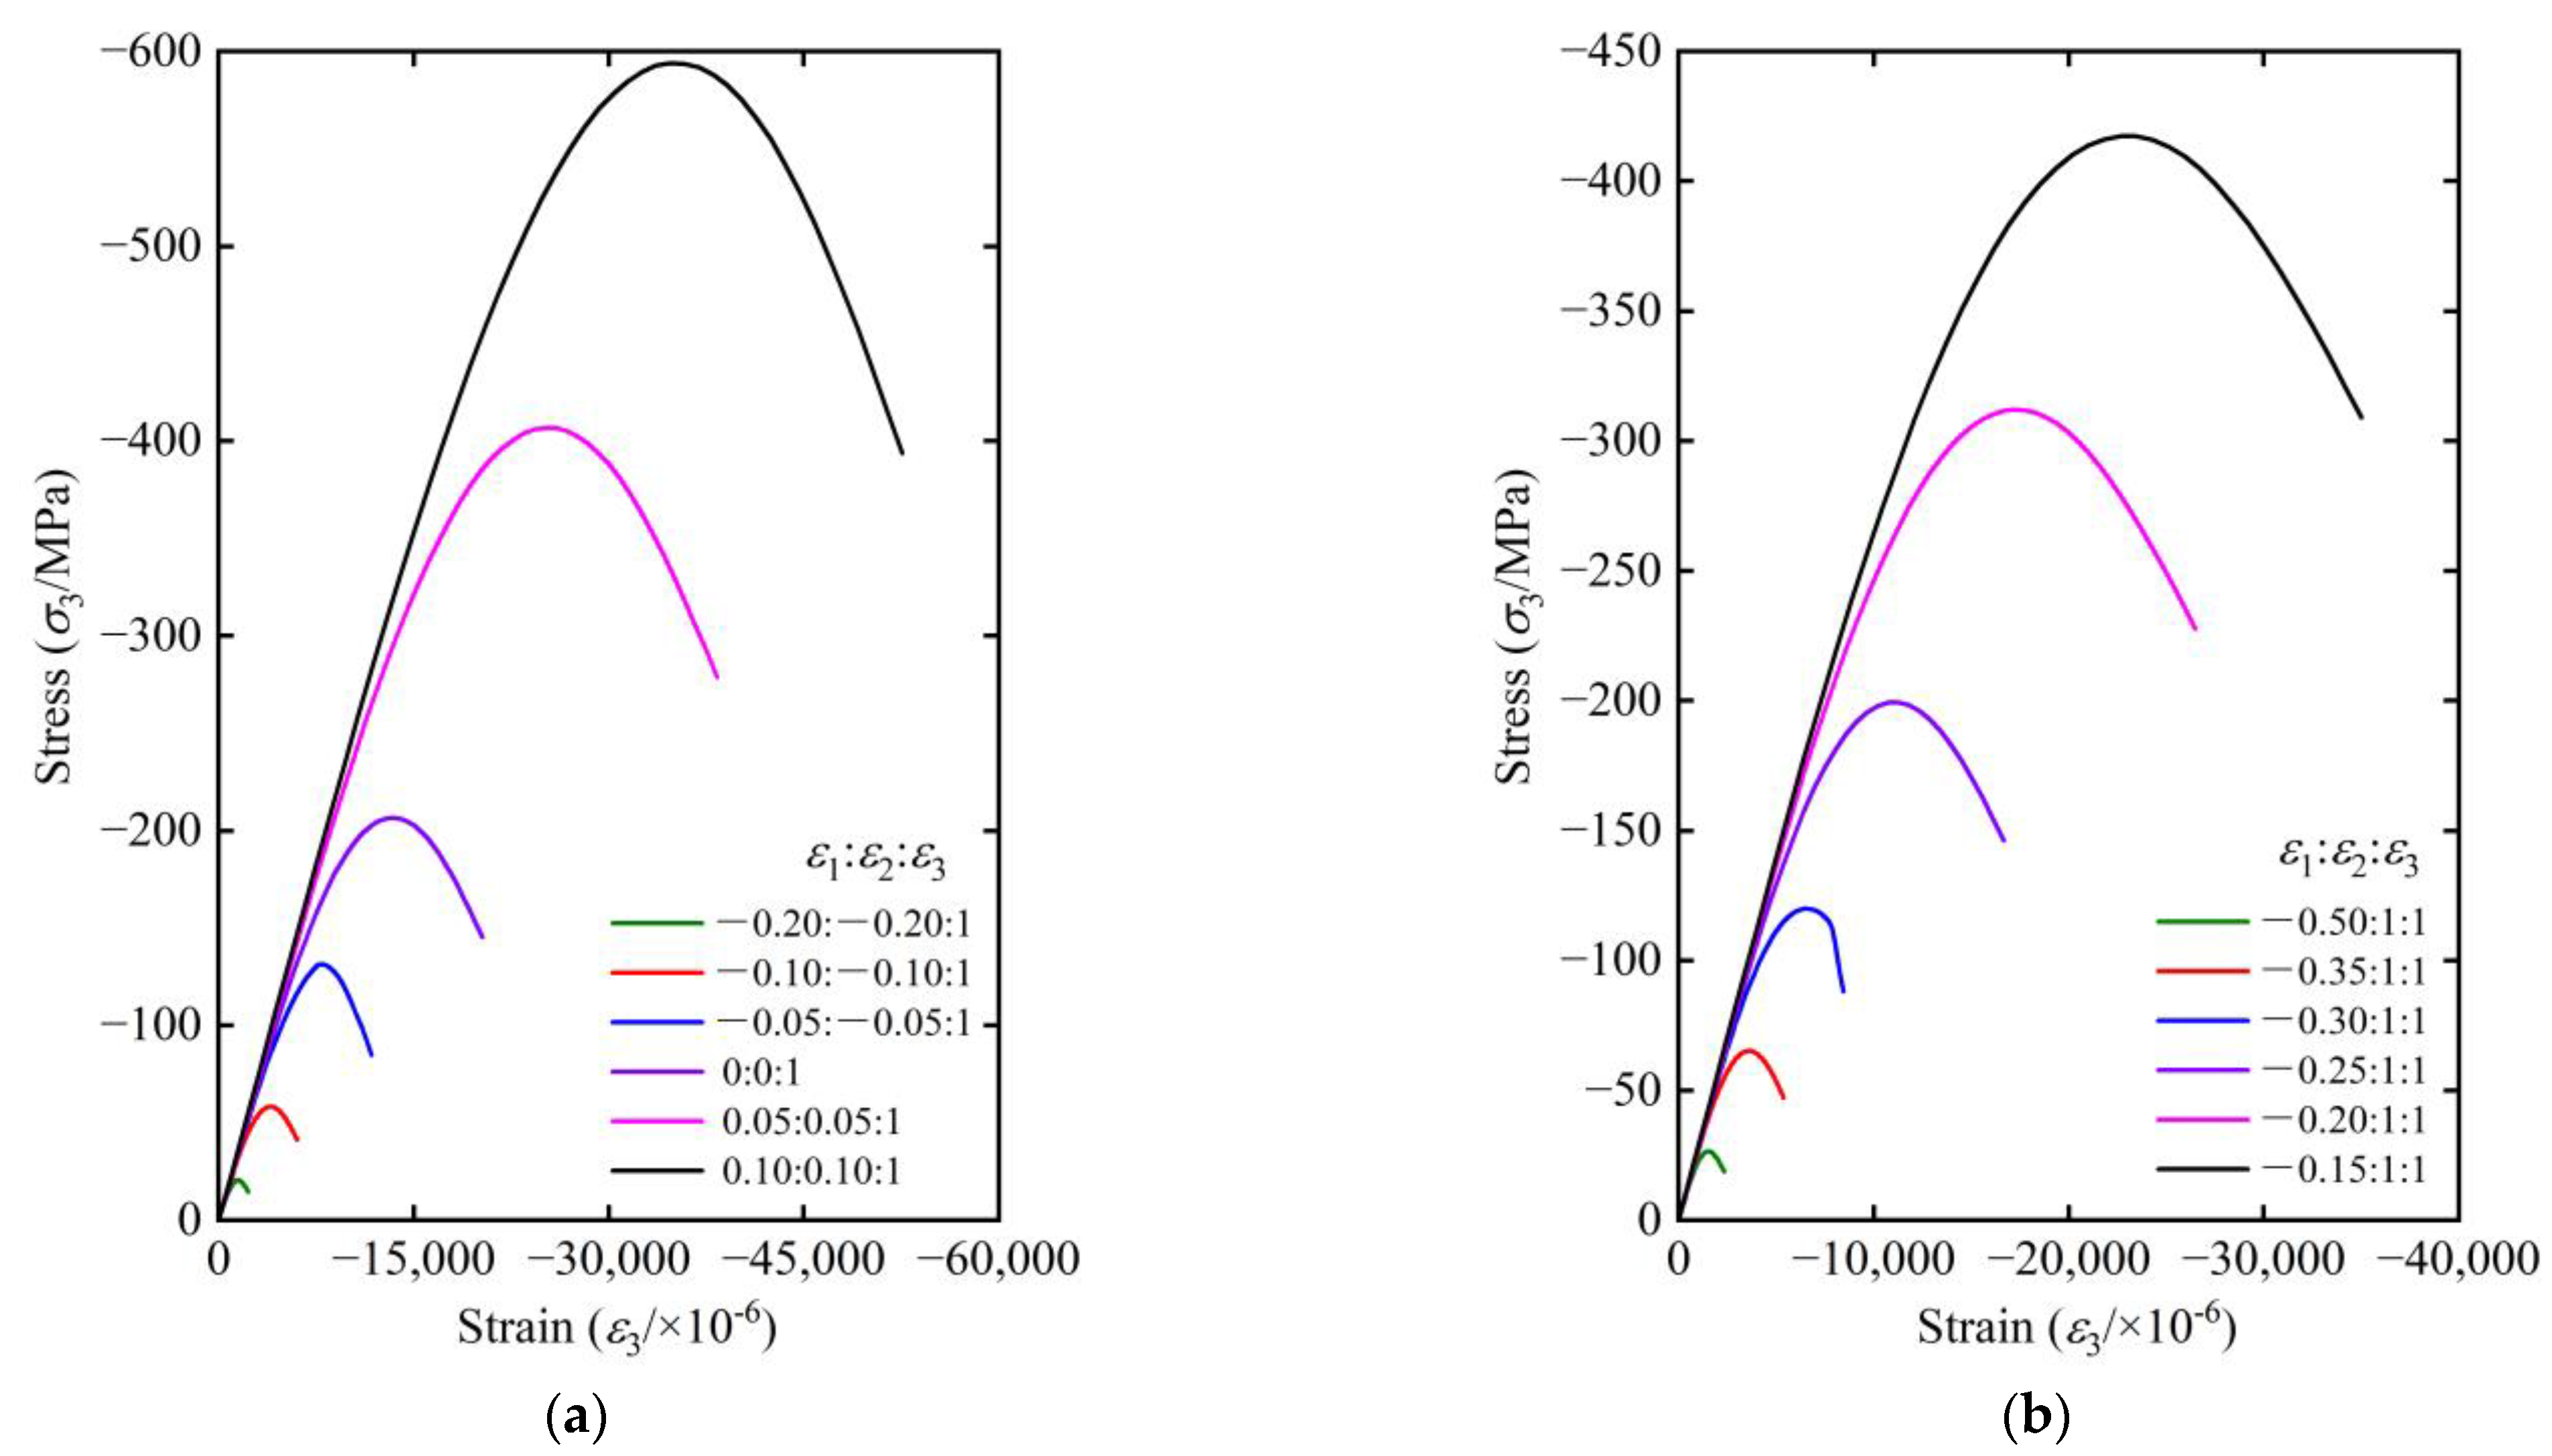
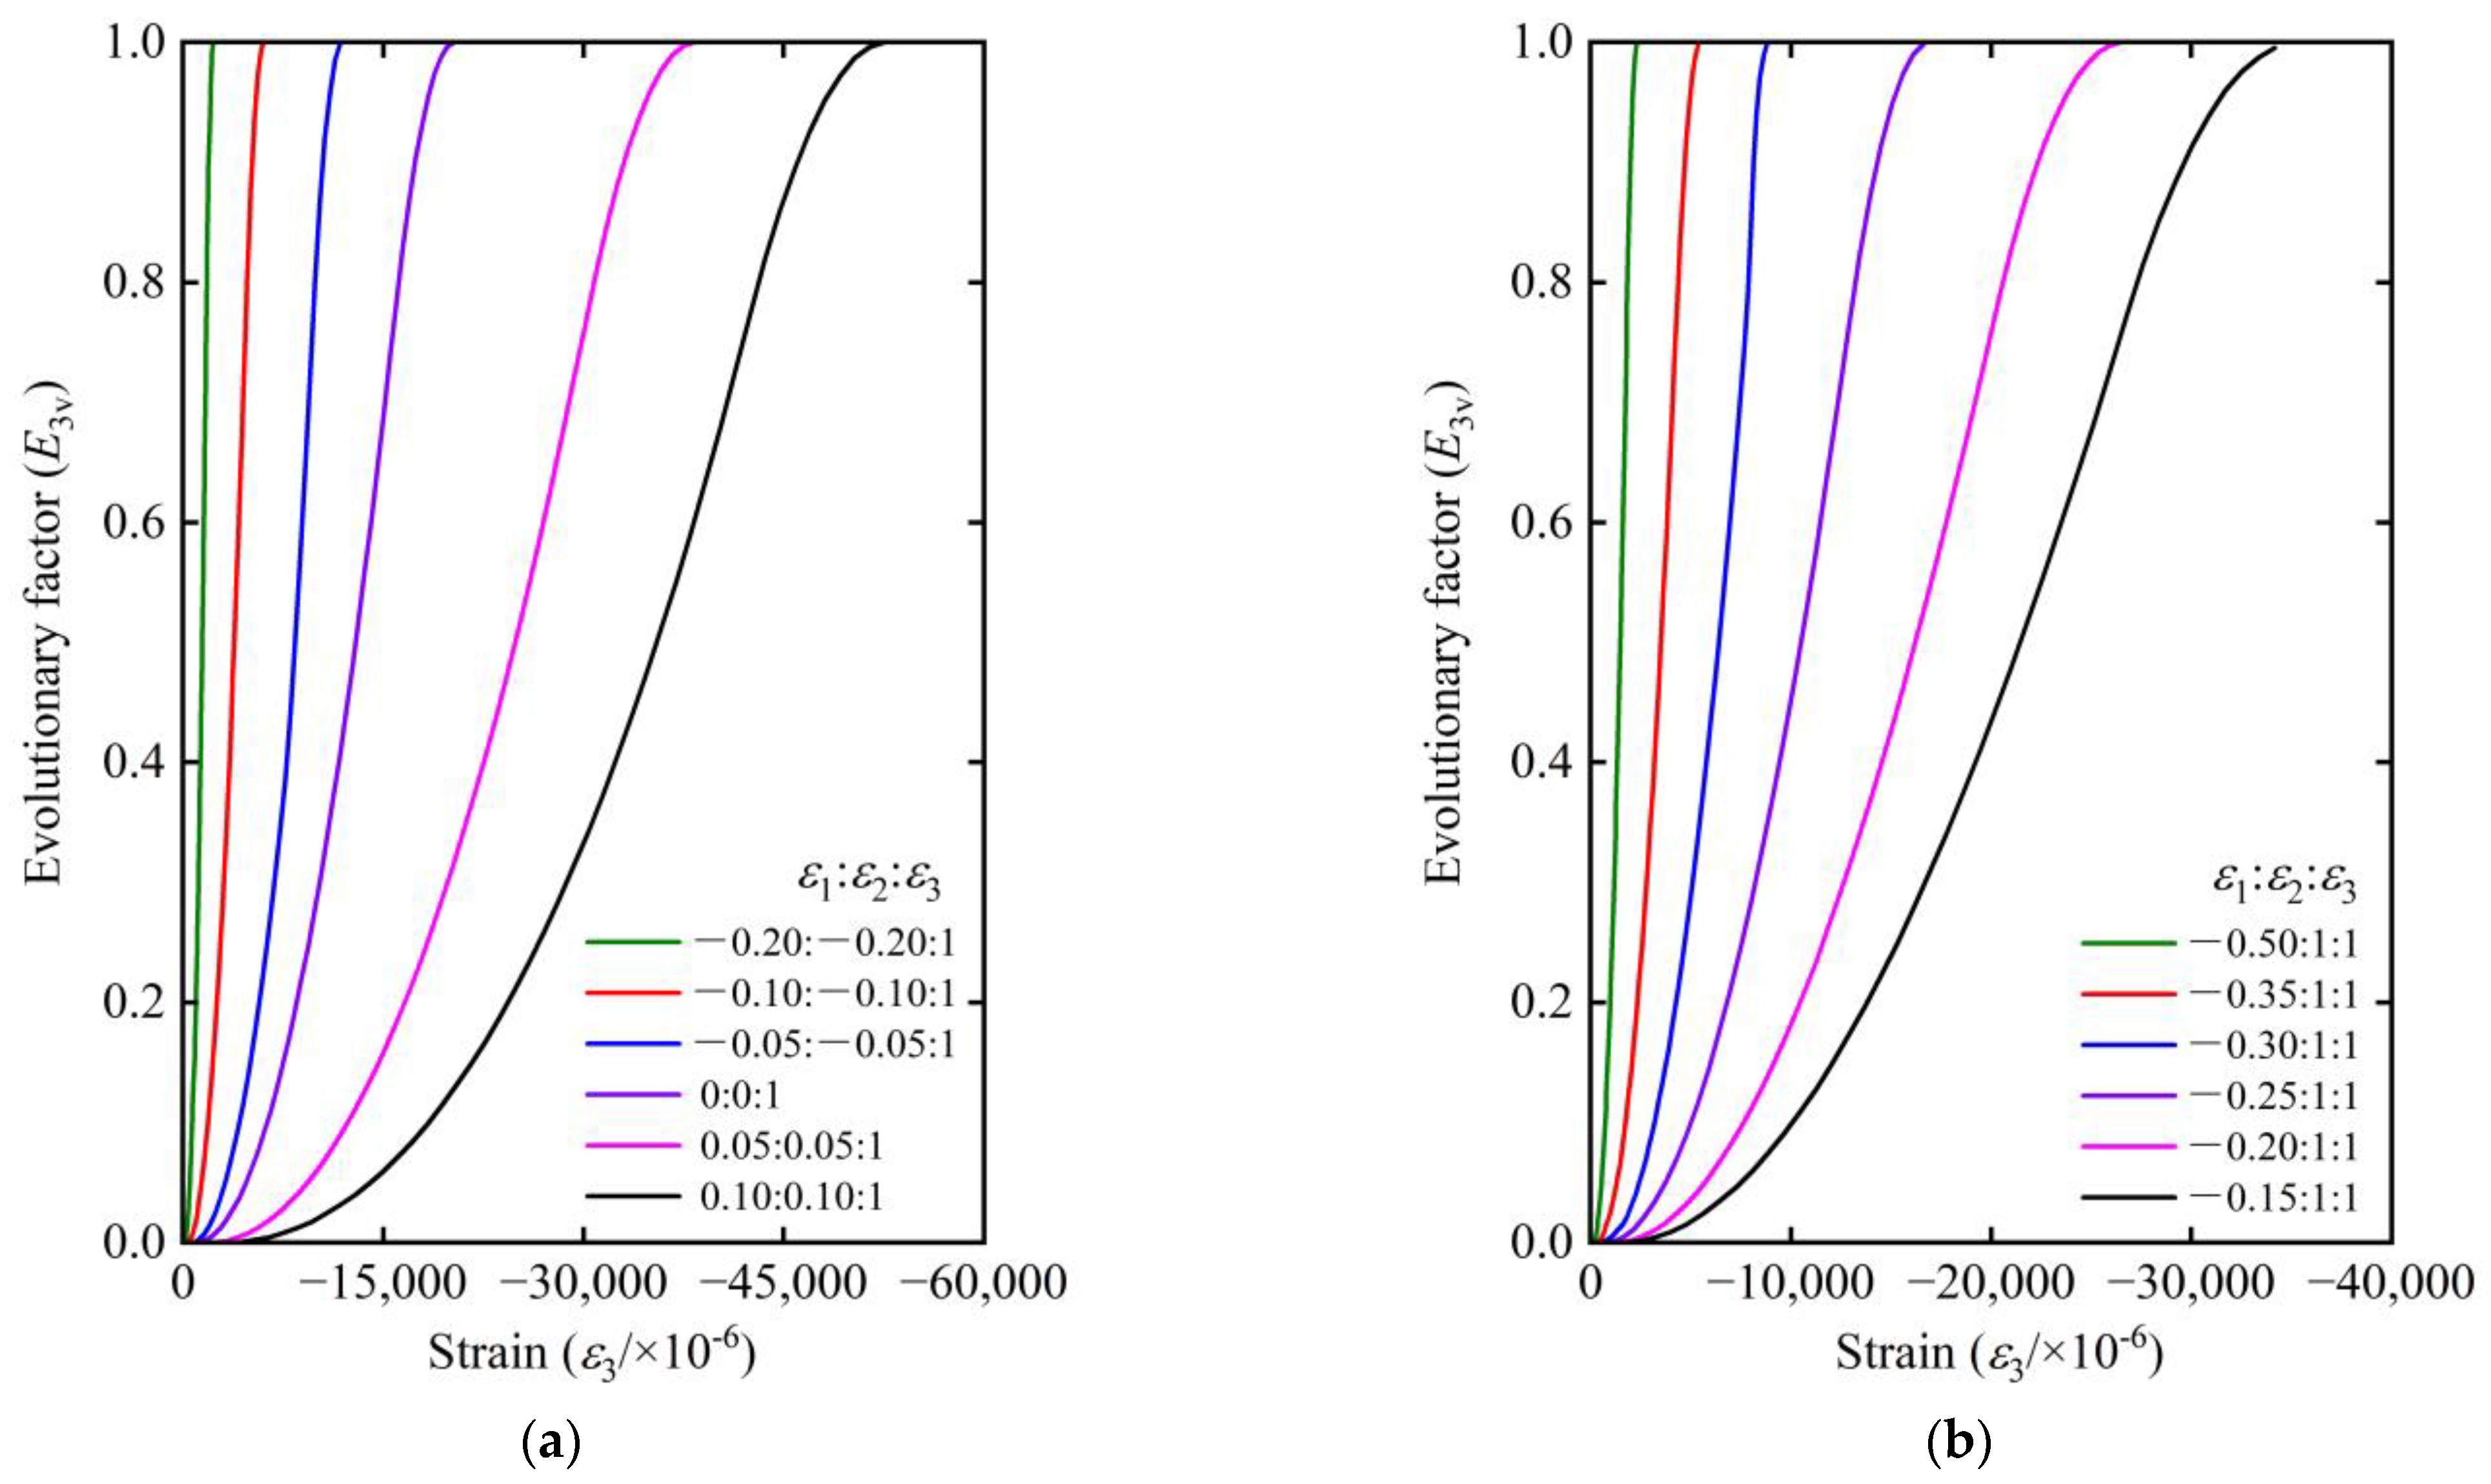
5.3. Numerical Simulation of Triaxial Forces
6. Discussion
7. Conclusions
- 1.
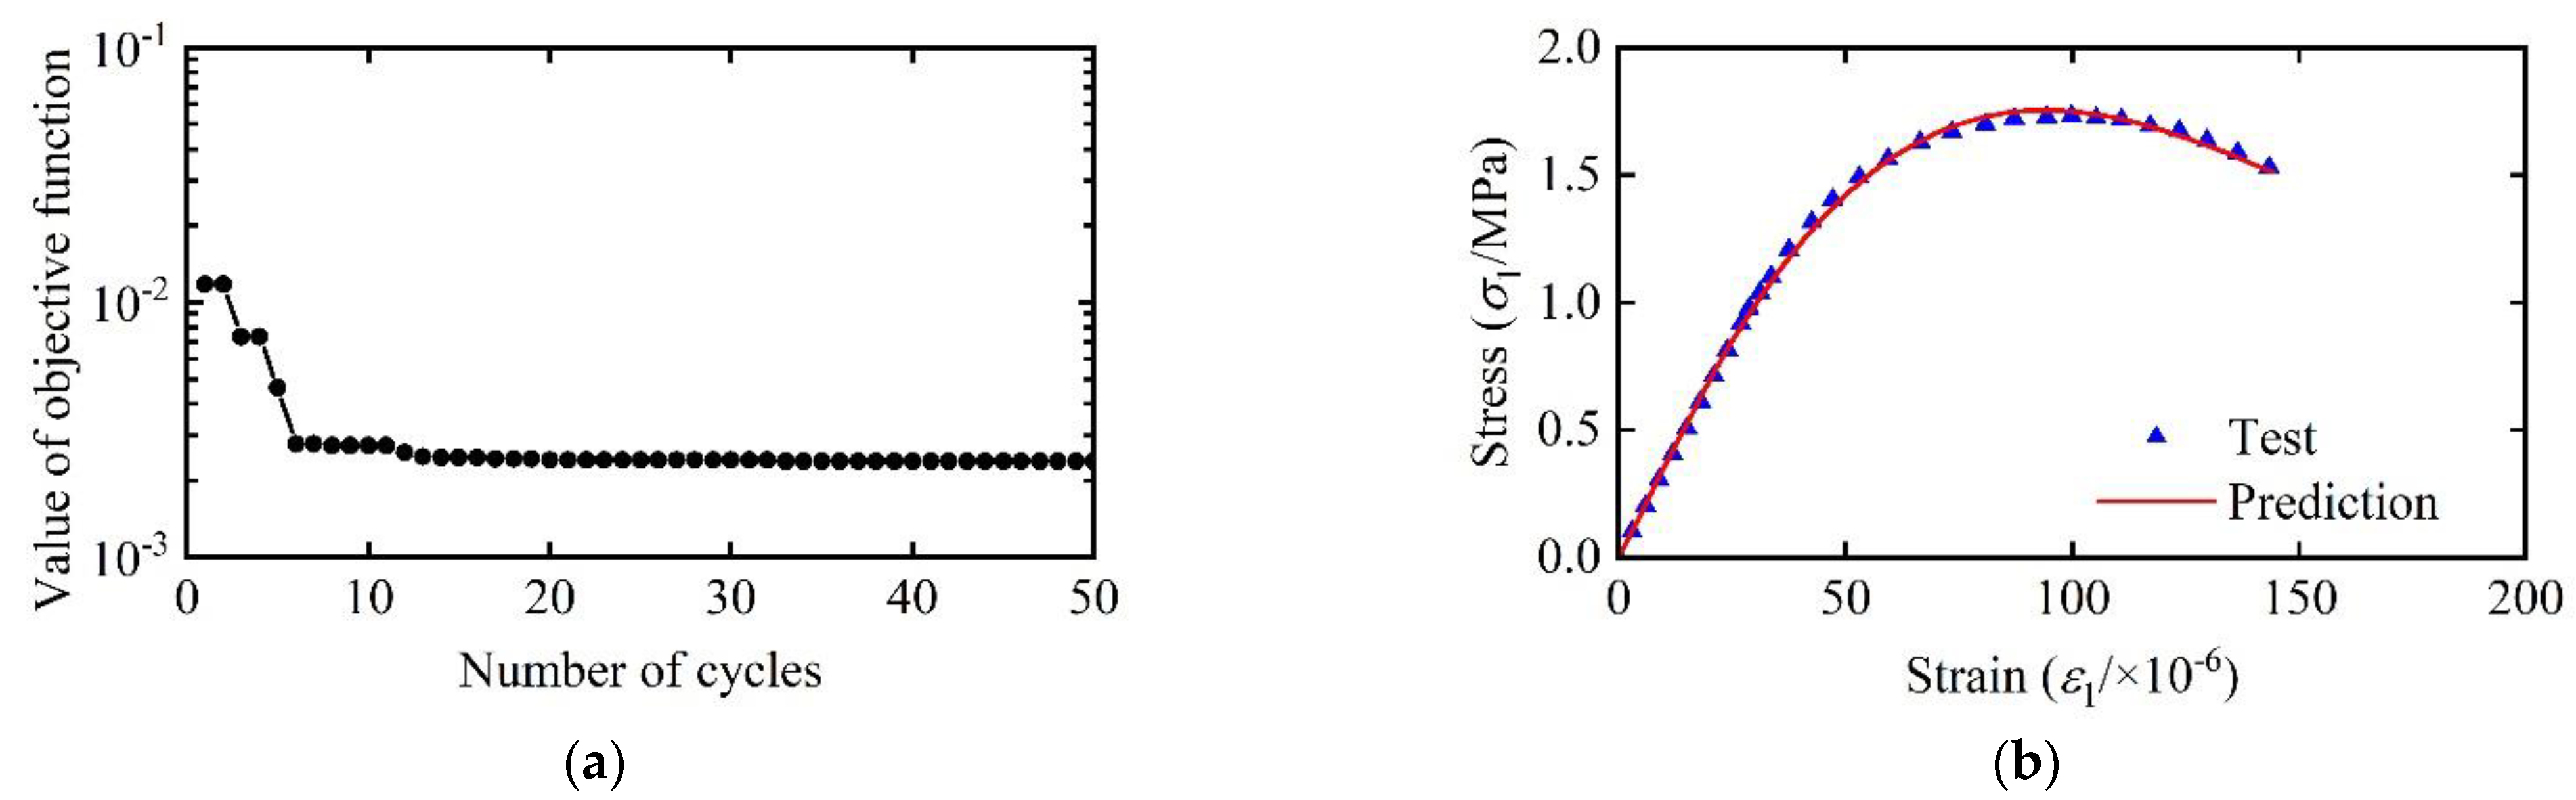
- The axial tensile and compression tests of fully-graded concrete are the basis for establishing SDM. The determination of , , and parameters is significant for establishing the constitutive relationship of fully-graded concrete. The ABC method is able to converge to the optimal parameters very quickly, and the nominal stress–strain curves predicted by the model are in good agreement with the experimental curves.
- 2.
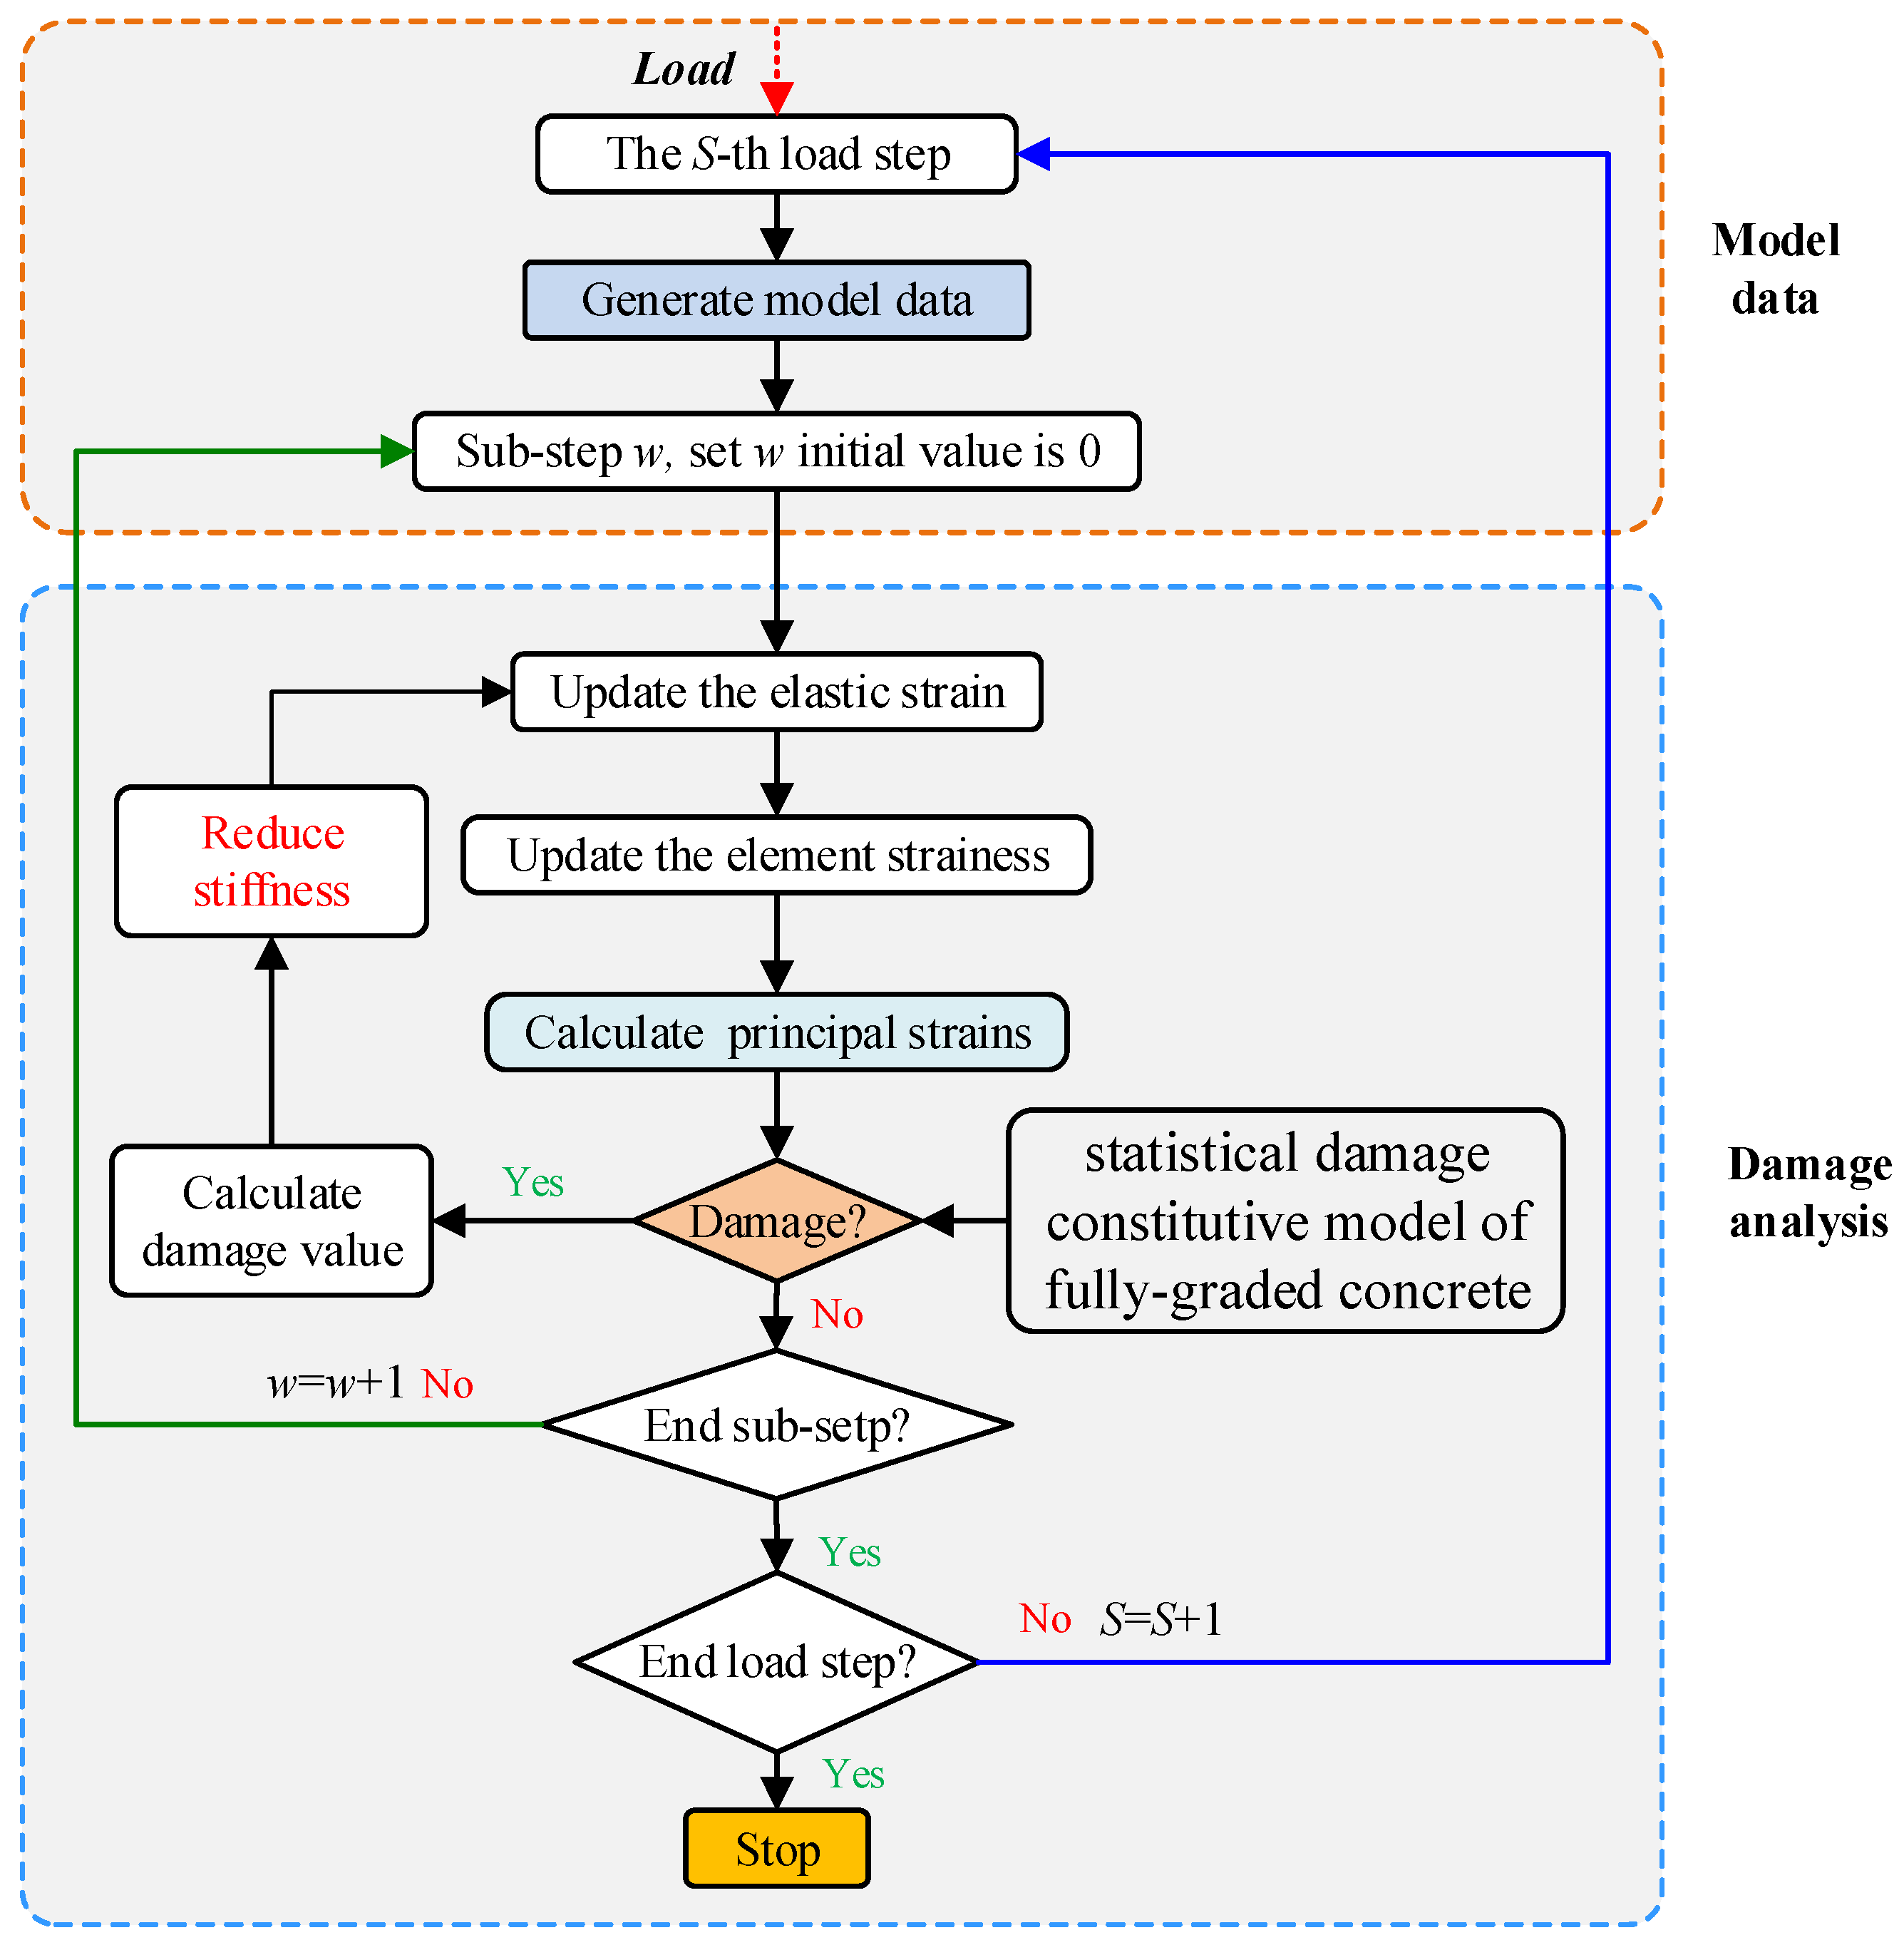
- The numerical simulation model of SDM was proposed through FORTRAN programming. In the calculation process, the impact of damage is reflected by reducing stiffness. The whole process is to embed the FORTRAN program into the finite element software to analyze the damage evolution characteristics of the structure.
- 3.
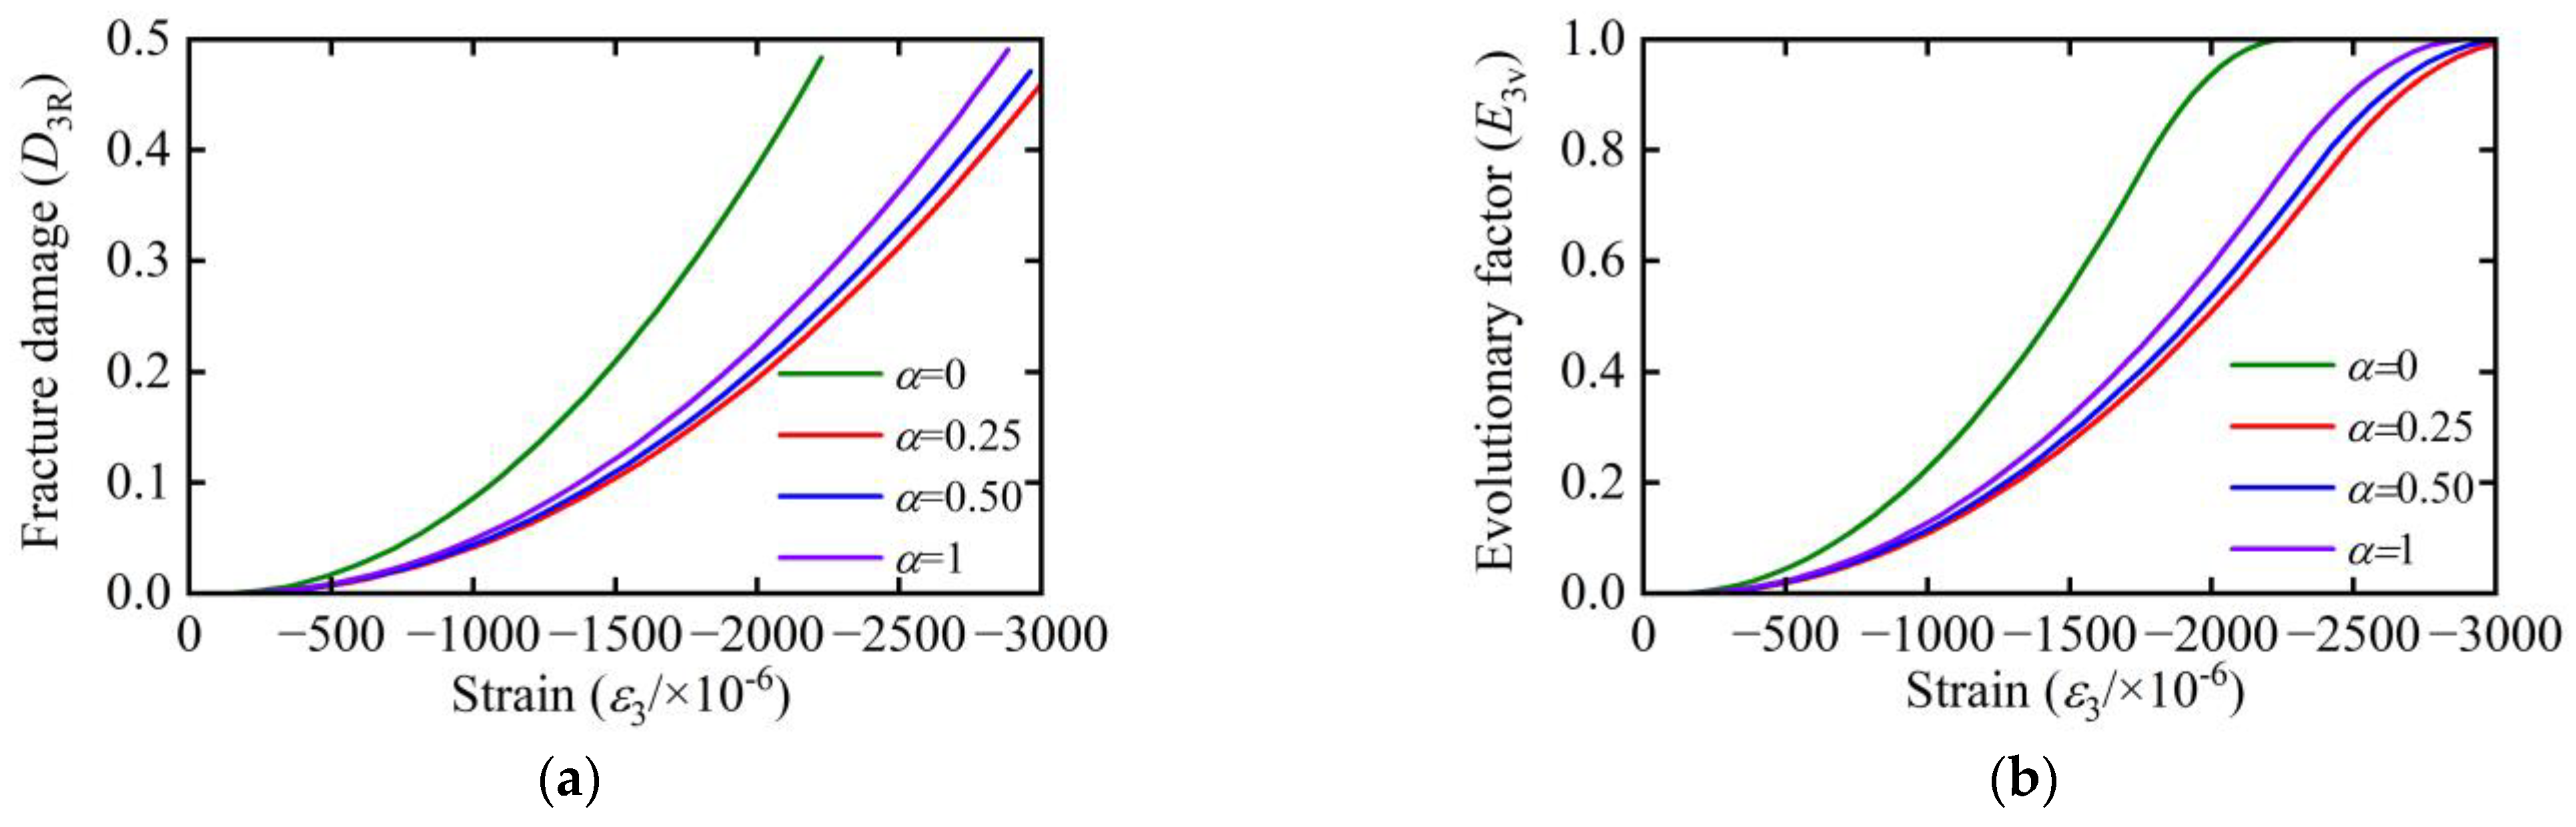
- Under the same strain, the degree of optimization and adjustment of microstructure effective stress skeleton for axial compression is lower than that for axial tension. For the biaxial compression-compression state with stress ratio varying from 0.25 to 1, under the same strain, the larger the stress ratio, the density of microcracks is greater; meanwhile, the critical state of the concrete is relatively forward when the stress ratio is larger, resulting in a reduction of its deformation capacity. The triaxial stress state is complex, and the stress characteristics are different under different strain ratios.
Author Contributions
Funding
Data Availability Statement
Conflicts of Interest
Nomenclature
| Symbol | Meaning |
| Probability density function of mesoscopic fracture for axial tension | |
| Probability density function of mesoscopic yield damage for axial tension | |
| Damage variable related to mesoscopic fracture for axial tension | |
| Initial damage strain for axial tension | |
| for axial tension | |
| Maximum yield damage strain for axial tension | |
| Critical state strain for axial tension | |
| Equivalent transfer tensile damage strain for axial compression | |
| Poisson ratio | |
| Probability density function of mesoscopic fracture for axial compression | |
| Probability density function of mesoscopic yield damage for axial compression | |
| Initial damage strain for axial compression | |
| for axial compression | |
| Maximum yield damage strain for axial compression | |
| Critical state strain for axial compression | |
| Damage variable related to mesoscopic fracture for axial compression | |
| Nominal stress | |
| Effective stress | |
| Strain | |
| Initial elastic modulus | |
| Damage variable related to mesoscopic fracture damage | |
| Damage variable related to yield damage | |
| Reinforcement factor related to microscopic yield damage | |
| Fracture damage value for the critical state | |
| Principal directional strain | |
| Strain components generated by the elastic stresses in the , and directions in the direction | |
| Tensile damage strain corresponding to the direction when subjected to tension in direction ) | |
| Equivalent tensile strain in the direction due to the Poisson effect when the and directions are pressurized | |
| Equivalent transfer tensile strain in the direction when the direction is pressurized () | |
| Coefficient of influence of the strain component associated with the tension damage | |
| Coefficients of influence of the strain component related to the compression damage | |
| induced by the Poisson effect in the and directions | |
| Objective function | |
| Number of experimental data | |
| The n-th experimental data | |
| The n-th predicted value | |
| Fitness function | |
| Positive integer | |
| The t-th solution in the space of random parameter variations of | |
| The domain parameters obtained from the m-th parameter neighborhood search performed based on | |
| Positive integer | |
| A random number in the range [−1, 1] | |
| Selection probability | |
| The number in the corresponding range |
References
- Guo, J.; Lin, W.; Qin, X.; Xu, Y.; Dong, K. Mesoscopic study on fracture behavior of fully graded concrete under uniaxial tension by using the phase-field method. Eng. Fract. Mech. 2022, 272, 108678. [Google Scholar] [CrossRef]
- Wang, H.; Wang, L.; Song, Y.; Wang, J. Influence of free water on dynamic behavior of dam concrete under biaxial compression. Constr. Build. Mater. 2016, 112, 222–231. [Google Scholar] [CrossRef]
- Shi, L.; Wang, L.; Song, Y.; Shen, L. Dynamic multiaxial strength and failure criterion of dam concrete. Constr. Build. Mater. 2014, 66, 181–191. [Google Scholar] [CrossRef]
- Shi, L.; Wang, L.; Song, Y.; Shen, L. Dynamic properties of large aggregate concrete under triaxial loading. Mag. Concr. Res. 2015, 67, 282–293. [Google Scholar] [CrossRef]
- Bai, W.; Zhang, S.; Guan, J.; Chen, J. Orthotropic statistical damage constitutive model for concrete. Shuili Xuebao 2014, 45, 607–618. (In Chinese) [Google Scholar]
- Li, J.; Ren, X. Stochastic damage model for concrete based on energy equivalent strain. Int. J. Solids Struct. 2009, 46, 2407–2419. [Google Scholar] [CrossRef]
- Yang, G.D.; Fan, Y.; Wang, G.H.; Cui, X.Z.; Leng, Z.D.; Lu, W.B. Blast resistance of air-backed RC slab against underwater contact explosion. Def. Technol. 2022, in press. [Google Scholar] [CrossRef]
- Yang, G.; Fan, Y.; Wang, G.; Cui, X.; Li, Q.; Leng, Z.; Deng, K. Mitigation effects of air-backed RC slabs retrofitted with CFRP subjected to underwater contact explosions. Ocean Eng. 2023, 267, 113261. [Google Scholar] [CrossRef]
- Yang, G.; Fan, Y.; Wang, G.; Cui, X.; Li, Q.; Leng, Z. Experimental and numerical investigation on dynamic behavior of RC orifice targets subjected to underwater explosions. Eng. Struct. 2023, 279, 115541. [Google Scholar] [CrossRef]
- Yang, G.; Wang, G.; Fan, Y.; Deng, K.; Lu, W.; Zhao, J. Dynamic response and performance of submarine tunnel subjected to surface explosions. Mar. Struct. 2021, 80, 103091. [Google Scholar] [CrossRef]
- Yang, G.; Fan, Y.; Wang, G.; Gao, Q.; Deng, K.; Wang, F. Numerical study on dynamic response of submerged tunnel subjected to underwater explosion. Soil Dyn. Earthq. Eng. 2022, 156, 107216. [Google Scholar] [CrossRef]
- Evans, R.H.; Marathe, M.S. Microcracking and stress-strain curves for concrete in tension. Matériaux Et Constr. 1968, 1, 61–64. [Google Scholar] [CrossRef]
- Du, C.; Chen, X.; Yang, Y.; Chen, Y.; Jiang, S. Experimental study on the complete tensile stress-deformation curve of fully graded concrete. Exp. Tech. 2018, 42, 491–497. [Google Scholar] [CrossRef]
- Zhang, Y.H.; Hu, X.; Yang, C.; Li, C.L.; Zhu, H.; Jiao, J. Dynamic axial tension test on the fully-graded concrete. Shuili Xuebao 2014, 45, 720–727. (In Chinese) [Google Scholar]
- Wu, J.Y.; Li, J.; Faria, R. An energy release rate-based plastic-damage model for concrete. Int. J. Solids Struct. 2006, 43, 583–612. [Google Scholar] [CrossRef]
- Krajcinovic, D. Selection of damage parameter–Art or science? Mech. Mater. 1998, 28, 165–179. [Google Scholar] [CrossRef]
- Hillerborg, A.; Modéer, M.; Petersson, P.E. Analysis of crack formation and crack growth in concrete by means of fracture mechanics and finite elements. Cem. Concr. Res. 1976, 6, 773–781. [Google Scholar] [CrossRef]
- Bažant, Z.P.; Oh, B.H. Crack band theory for fracture of concrete. Matériaux Et Constr. 1983, 16, 155–177. [Google Scholar] [CrossRef]
- Du, X.; Si, Z.; Li, Y.; Huang, L.; Si, Z.; Wen, L. Dynamic compressive behavior of freeze–thaw damaged roller-compacted concrete and establishment of constitutive model. Constr. Build. Mater. 2023, 365, 130095. [Google Scholar] [CrossRef]
- Gou, Y.J.; Zhang, L.H.; Zhang, H.P.; Wei, C.; Yang, H.; Zhai, S.T.; Liu, L.B. Investigation of freeze-thaw mechanism for crumb rubber concrete by the online strain sensor. Measurement 2021, 174, 109080. [Google Scholar] [CrossRef]
- Liu, M.; Liu, D.; Qiao, P.; Sun, L. Characterization of microstructural damage evolution of freeze-thawed shotcrete by an integrative micro-CT and nanoindentation statistical approach. Cem. Concr. Compos. 2021, 117, 103909. [Google Scholar] [CrossRef]
- Suzuki, T.; Nishimura, S.; Shimamoto, Y.; Shiotani, T.; Ohtsu, M. Damage estimation of concrete canal due to freeze and thawed effects by acoustic emission and X-ray CT methods. Constr. Build. Mater. 2020, 245, 118343. [Google Scholar] [CrossRef]
- Li, S.; Chen, X.; Zhang, J. Acoustic emission characteristics in deterioration behavior of dam concrete under post-peak cyclic test. Constr. Build. Mater. 2021, 292, 123324. [Google Scholar] [CrossRef]
- Bažant, Z.P.; Tabbara, M.R.; Kazemi, M.T.; Pijaudier-Cabot, G. Random particle model for fracture of aggregate or fiber composites. J. Eng. Mech. 1990, 116, 1686–1705. [Google Scholar] [CrossRef]
- Schlangen, E.; Van Mier, J.G.M. Simple lattice model for numerical simulation of fracture of concrete materials and structures. Mater. Struct. 1992, 25, 534–542. [Google Scholar] [CrossRef]
- Xu, W.; Han, Z.; Tao, L.; Ding, Q.; Ma, H. Random non-convex particle model for the fraction of interfacial transition zones (ITZs) in fully-graded concrete. Powder Technol. 2018, 323, 301–309. [Google Scholar] [CrossRef]
- Ma, H.; Xu, W.; Li, Y. Random aggregate model for mesoscopic structures and mechanical analysis of fully-graded concrete. Comput. Struct. 2016, 177, 103–113. [Google Scholar] [CrossRef]
- Qin, X.; Gu, C.; Shao, C.; Fu, X.; Vallejo, L.; Chen, Y. Numerical analysis of fracturing behavior in fully-graded concrete with oversized aggregates from mesoscopic perspective. Constr. Build. Mater. 2020, 253, 119184. [Google Scholar] [CrossRef]
- Xu, L.; Jiang, L.; Huang, Y.F.; Ren, Q.W. An efficient approach for mesoscale fracture modeling of fully-graded hydraulic concrete. Water Sci. Eng. 2022, 15, 337–347. [Google Scholar] [CrossRef]
- Xu, L.; Jiang, L.; Shen, L.; Dong, Y.; Ren, Q. 3D mesostructure generation of fully-graded concrete based on hierarchical point cloud and aggregate coarsening. Constr. Build. Mater. 2022, 350, 128790. [Google Scholar] [CrossRef]
- Wang, G.; Wang, Y.; Lu, W.; Yu, M.; Wang, C. Deterministic 3D seismic damage analysis of Guandi concrete gravity dam: A case study. Eng. Struct. 2017, 148, 263–276. [Google Scholar] [CrossRef]
- Wang, G.; Wang, Y.; Lu, W.; Zhou, C.; Chen, M.; Yan, P. XFEM based seismic potential failure mode analysis of concrete gravity dam–water–foundation systems through incremental dynamic analysis. Eng. Struct. 2015, 98, 81–94. [Google Scholar] [CrossRef]
- Chen, D.H.; Yang, Z.H.; Wang, M.; Xie, J.H. Seismic performance and failure modes of the Jin’anqiao concrete gravity dam based on incremental dynamic analysis. Eng. Fail. Anal. 2019, 100, 227–244. [Google Scholar] [CrossRef]
- Krajcinovic, D.; Silva, M.A.G. Statistical aspects of the continuous damage theory. Int. J. Solids Struct. 1982, 18, 551–562. [Google Scholar] [CrossRef]
- Breysse, D. Probabilistic formulation of damage-evolution law of cementitious composites. J. Eng. Mech. 1990, 116, 1489–1510. [Google Scholar] [CrossRef]
- Kandarpa, S.; Kirkner, D.J.; Spencer Jr, B.F. Stochastic damage model for brittle materials subjected to monotonic loading. J. Eng. Mech. 1996, 122, 788–795. [Google Scholar] [CrossRef]
- Bai, W.; Shen, J.; Guan, J.; Wang, J.; Yuan, C. Study on compressive mechanical properties of recycled aggregate concrete with silica fume at different strain rates. Mater. Today Commun. 2022, 31, 103444. [Google Scholar] [CrossRef]
- Bai, W.; Song, Z.; Yuan, C.; Guan, J.; Xie, C.; Huang, H.; Ma, Y. Study on mechanical properties and damage mechanism of recycled concrete containing silica fume in freeze–thaw environment. Constr. Build. Mater. 2023, 375, 130872. [Google Scholar] [CrossRef]
- Bai, W.; Lu, X.; Guan, J.; Huang, S.; Yuan, C.; Xu, C. Stress–strain behavior of FRC in uniaxial tension based on mesoscopic damage model. Crystals 2021, 11, 689. [Google Scholar] [CrossRef]
- Bai, W.; Lu, X.; Guan, J.; Yuan, C. Experimental study on uniaxial compression mechanical properties of recycled concrete with silica fume considering the effect of curing age. Constr. Build. Mater. 2022, 350, 128758. [Google Scholar] [CrossRef]
- Bai, W.; Li, W.; Guan, J.; Wang, J.; Yuan, C. Research on the mechanical properties of recycled aggregate concrete under uniaxial compression based on the statistical damage model. Materials 2020, 13, 3765. [Google Scholar] [CrossRef] [PubMed]
- Bai, W.; Wang, W.; Guan, J.; Wang, J.; Yuan, C. Compressive stress-strain relationships of concrete exposed to elevated temperatures based on mesoscopic damage method. Int. J. Damage Mech. 2022, 31, 1420–1447. [Google Scholar] [CrossRef]
- SL/T 352-2020; Test Code for Hydraulic Concrete. Ministry of Water Resources of the People’s Republic of China: Beijing, China, 2020. (In Chinese)


| Cement | FLY Ash | Sand | Small Stone | Medium Stone | Large Stone | Extra Large Stone |
|---|---|---|---|---|---|---|
| 315 | 230 | 266 | 272 | 273 | 274 | 276 |
Disclaimer/Publisher’s Note: The statements, opinions and data contained in all publications are solely those of the individual author(s) and contributor(s) and not of MDPI and/or the editor(s). MDPI and/or the editor(s) disclaim responsibility for any injury to people or property resulting from any ideas, methods, instructions or products referred to in the content. |
© 2023 by the authors. Licensee MDPI, Basel, Switzerland. This article is an open access article distributed under the terms and conditions of the Creative Commons Attribution (CC BY) license (https://creativecommons.org/licenses/by/4.0/).
Share and Cite
Yuan, C.; Li, C.; Huang, H.; Bai, W.; Xie, Y. Numerical Simulation Study on the Constitutive Model of Fully-Graded Concrete Based on Statistical Damage Theory. Buildings 2023, 13, 2412. https://doi.org/10.3390/buildings13102412
Yuan C, Li C, Huang H, Bai W, Xie Y. Numerical Simulation Study on the Constitutive Model of Fully-Graded Concrete Based on Statistical Damage Theory. Buildings. 2023; 13(10):2412. https://doi.org/10.3390/buildings13102412
Chicago/Turabian StyleYuan, Chenyang, Chunlei Li, Hao Huang, Weifeng Bai, and Yunfei Xie. 2023. "Numerical Simulation Study on the Constitutive Model of Fully-Graded Concrete Based on Statistical Damage Theory" Buildings 13, no. 10: 2412. https://doi.org/10.3390/buildings13102412