Article

Research and Implementation of Three-Dimensional Spatial Information Characterization and Visualization of Fractures in Deteriorated Sandstone

1
School of Architecture and Civil Engineering, Xihua University, Chengdu 610039, China
2
College of Environment and Civil Engineering, Chengdu University of Technology, Chengdu 610059, China
*
Author to whom correspondence should be addressed.
Buildings 2023, 13(10), 2418; https://doi.org/10.3390/buildings13102418
Submission received: 11 August 2023 / Revised: 8 September 2023 / Accepted: 20 September 2023 / Published: 22 September 2023
(This article belongs to the Section Building Structures)

Abstract

:
Primary fractures significantly impacted the stability of surrounding rock in underground projects. Therefore, it is vital to find a solution for the problem of performing a non-destructive detection of rocks and extracting the internal three-dimensional (3D) data field of rocks for visualization analysis. To address this problem, this paper proposed a method of 3D reconstruction for complex cracks in deteriorated sandstone and developed a program based on MATLAB. This work carried out image recognition on the CT scan images of deteriorated sandstone, then implemented a surface reconstruction technique based on object cross-section information, a contour reconstruction technique based on object contour information, a point cloud reconstruction technique for extracting point cloud data of internal cracks in deteriorated sandstone, and a Graphical User Interface (GUI) control system that combines these three reconstruction techniques. The results showed that the 3D reconstruction techniques and the GUI control system proposed in this paper were capable of precisely marking the location of the cracks on a 3D coordinate system and accurately describing their shape with a vector. With only 10 CT scan images, the point cloud reconstruction technique constructed the digital core, and the digital core can quantitatively characterize the influence of primary fractures on the stability of surrounding rock. Additionally, the calculated results of the proposed method were very close to that of Avizo. This method realized the visualization and quantitative characterization of the internal structure of rocks and offered a model for analyzing the stress-fracture-seepage field change during excavation.

1. Introduction

Since Wilhelm Conrad Röntgen discovered the X-ray in the Institute of Physics at the University of Würzburg in 1895, it has been widely used in medicine and industry. Many non-destructive detecting techniques based on X-rays have since been developed, including medical X-ray computed tomography (CT) equipment [1,2,3,4,5], angiography equipment [6,7,8,9,10], industrial X-ray CT equipment [11,12,13,14,15], industrial X-ray detectors [16,17,18,19,20], and so on. However, non-destructive testing technology is widely used in medical and industrial fields and is equally essential in construction. In construction, especially in building foundation excavation and subway tunnel engineering, it plays a vital role, especially in the stability of bedrock, which has attracted significant attention.
In building engineering, the stability of bedrock is significant for the design and construction of tunnels, bridges, and high-rise buildings. This is because foundation excavation and subway tunnel engineering need to consider the physical properties of underground rock or soil and their evolution laws. Therefore, how to quickly, accurately, and efficiently realize the visualization of underground 3D scalar field data has become the leading research direction in architecture. In this context, CT scanning technology is famous for its ability to collect the gray value of the three-dimensional data field of the scanned object as a variable. In addition, with the introduction of 3D laser scanners and photographic scanners, 3D point cloud reconstruction has also made remarkable progress, which provides a powerful tool for solving the challenges in foundation engineering and subway tunnel engineering in construction. Huang [21] studied the distribution of minerals in the rock core using an X-ray diffraction technique combined with CT scan data. Fang [22] made a 3D reconstruction of the coal pore network via CT scan data, which provides a theoretical basis for the study of digital rock physics. Zhao [23] proposed a new method to reconstruct digital rock based on depth-wise convolution by collecting CT image information. Zhou [24] improves the computational efficiency of rock reconstruction and numerical analysis by collecting CT image parameters combined with a hierarchical fractal approach. Lei [25] proposed a new method to simulate the internal pores of rocks by combining CT scanning and a multiple-point geostatistics algorithm (MPGA). Lin [26] put forward a multi-scale digital rock reconstruction method by combining CT scanning images and scanning electron microscope (SEM). Gou [27] explored the factors affecting the crack propagation behavior of carbonate rocks by obtaining a CT scan for 3D reconstruction. Sun [28] studied the patterns of porosity evolution during the bearing failure of CPB by combining the CT scanning technique with the uniaxial compression test. Wang [29] improved the efficiency and accuracy of the existing methods of rock point cloud registration based on local invariants. Hu [30] improves the reliability and stability of automatic registration of rock point clouds via plane detection and polygon matching. DiFrancesco [31] determined that the optimal 3D volume calculation approach is a hybrid methodology comprised of the Power Crust reconstruction and the Alpha Solid reconstruction. Engin [32] obtained the point cloud data of blasting rock piles using a terrestrial laser scanner for surface reconstruction and determined the size distribution of fragments, which effectively evaluated the blasting results. Voumard [33] performed a 3D point cloud reconstruction with the image set acquired from street view imagery (SVI), which can more clearly identify landslide deformation and estimate the fallen volumes. Zhang [34], using the uniaxial compression test of the CT scanning technique, defines the statistical variable of rock mass damage based on CT number and establishes the damage evolution equation related to each loading stage. Yang [35] based on the CT scanning data, the damage characteristics of full-size tunnel lining under high temperature and impact are evaluated. Wang [36] the homogenization classification and mechanism of microcracks in cement concrete are studied by employing X-ray tomography (X-ray CT).
In summary, CT scanning technology has been widely used in visualization research, but few studies implement 3D reconstruction based on CT scan images using MATLAB (R2020b). While many point cloud reconstruction techniques mainly use scanners to acquire point cloud data, research on extracting feature information of defined areas of two-dimensional (2D) images and transforming them into point cloud data is rare. Three-dimensional reconstruction techniques are mainly based on CT scan images. Thus, extracting feature information from CT scan images is necessary, and different feature information will generate different reconstruction effects. Since the spatial structure inside an object dominates the stability of the object, the presence or absence of primary cracks inside the same rock mass is the cause of different strength characteristics. Thus, visualizing the internal spatial structure of an object is of great research value for understanding the essential properties of an object and the evolution law of its internal space. As a result, this study looks at the deteriorated sandstone on which CT scans were performed. MATLAB is used as a processing tool for the information acquisition and 3D reconstruction of CT scan images to decide whether the reconstruction result is feasible.

2. Specimen and Equipment

A uniaxial compression test of the complete sandstone specimen was carried out using the SAM-2000 electro-hydraulic servo rock three-axis loading system to generate internal cracks. The CT scanning experiment of deteriorated sandstone was completed using GE phoenix v|tome|x s 240 industrial CT scanning equipment (Youerhongxin testing Base in Chengdu City, Sichuan Province, China). The two pieces of equipment and specimens are the same as those used in the authors’ previous “Study on Microscopic Characteristics of Spatial Distribution of Fractures in Deteriorated Sandstone”, and the sandstone specimens used are the standard cylindrical specimens with a height of 100 mm and a diameter of 50 mm, as prescribed by the International Society of Rock Mechanics. The sandstone specimens are from the Ping’an Tunnel in Maoxian County, Aba Tibetan, and Qiang Autonomous Prefecture, Sichuan Province, China [37]. The specific experimental equipment is shown in Figure 1 [38]. The geographic information and geological information of the sandstone specimens are shown in Figure 2.

3. MATLAB-Based Visual Analysis

Along with the rapid advancement of AI technology, data visualization has become one of the critical technologies for many sectors. It is crucial in studying the developing laws of the internal state of a physical object. In this study, the 2D CT scan images of the deteriorated sandstone were processed using autonomous programming based on MATLAB to extract the cross-section, contour, and crack point cloud information. These three datasets were used to carry out 3D reconstruction individually, and a GUI control system was used to combine the three reconstruction techniques.

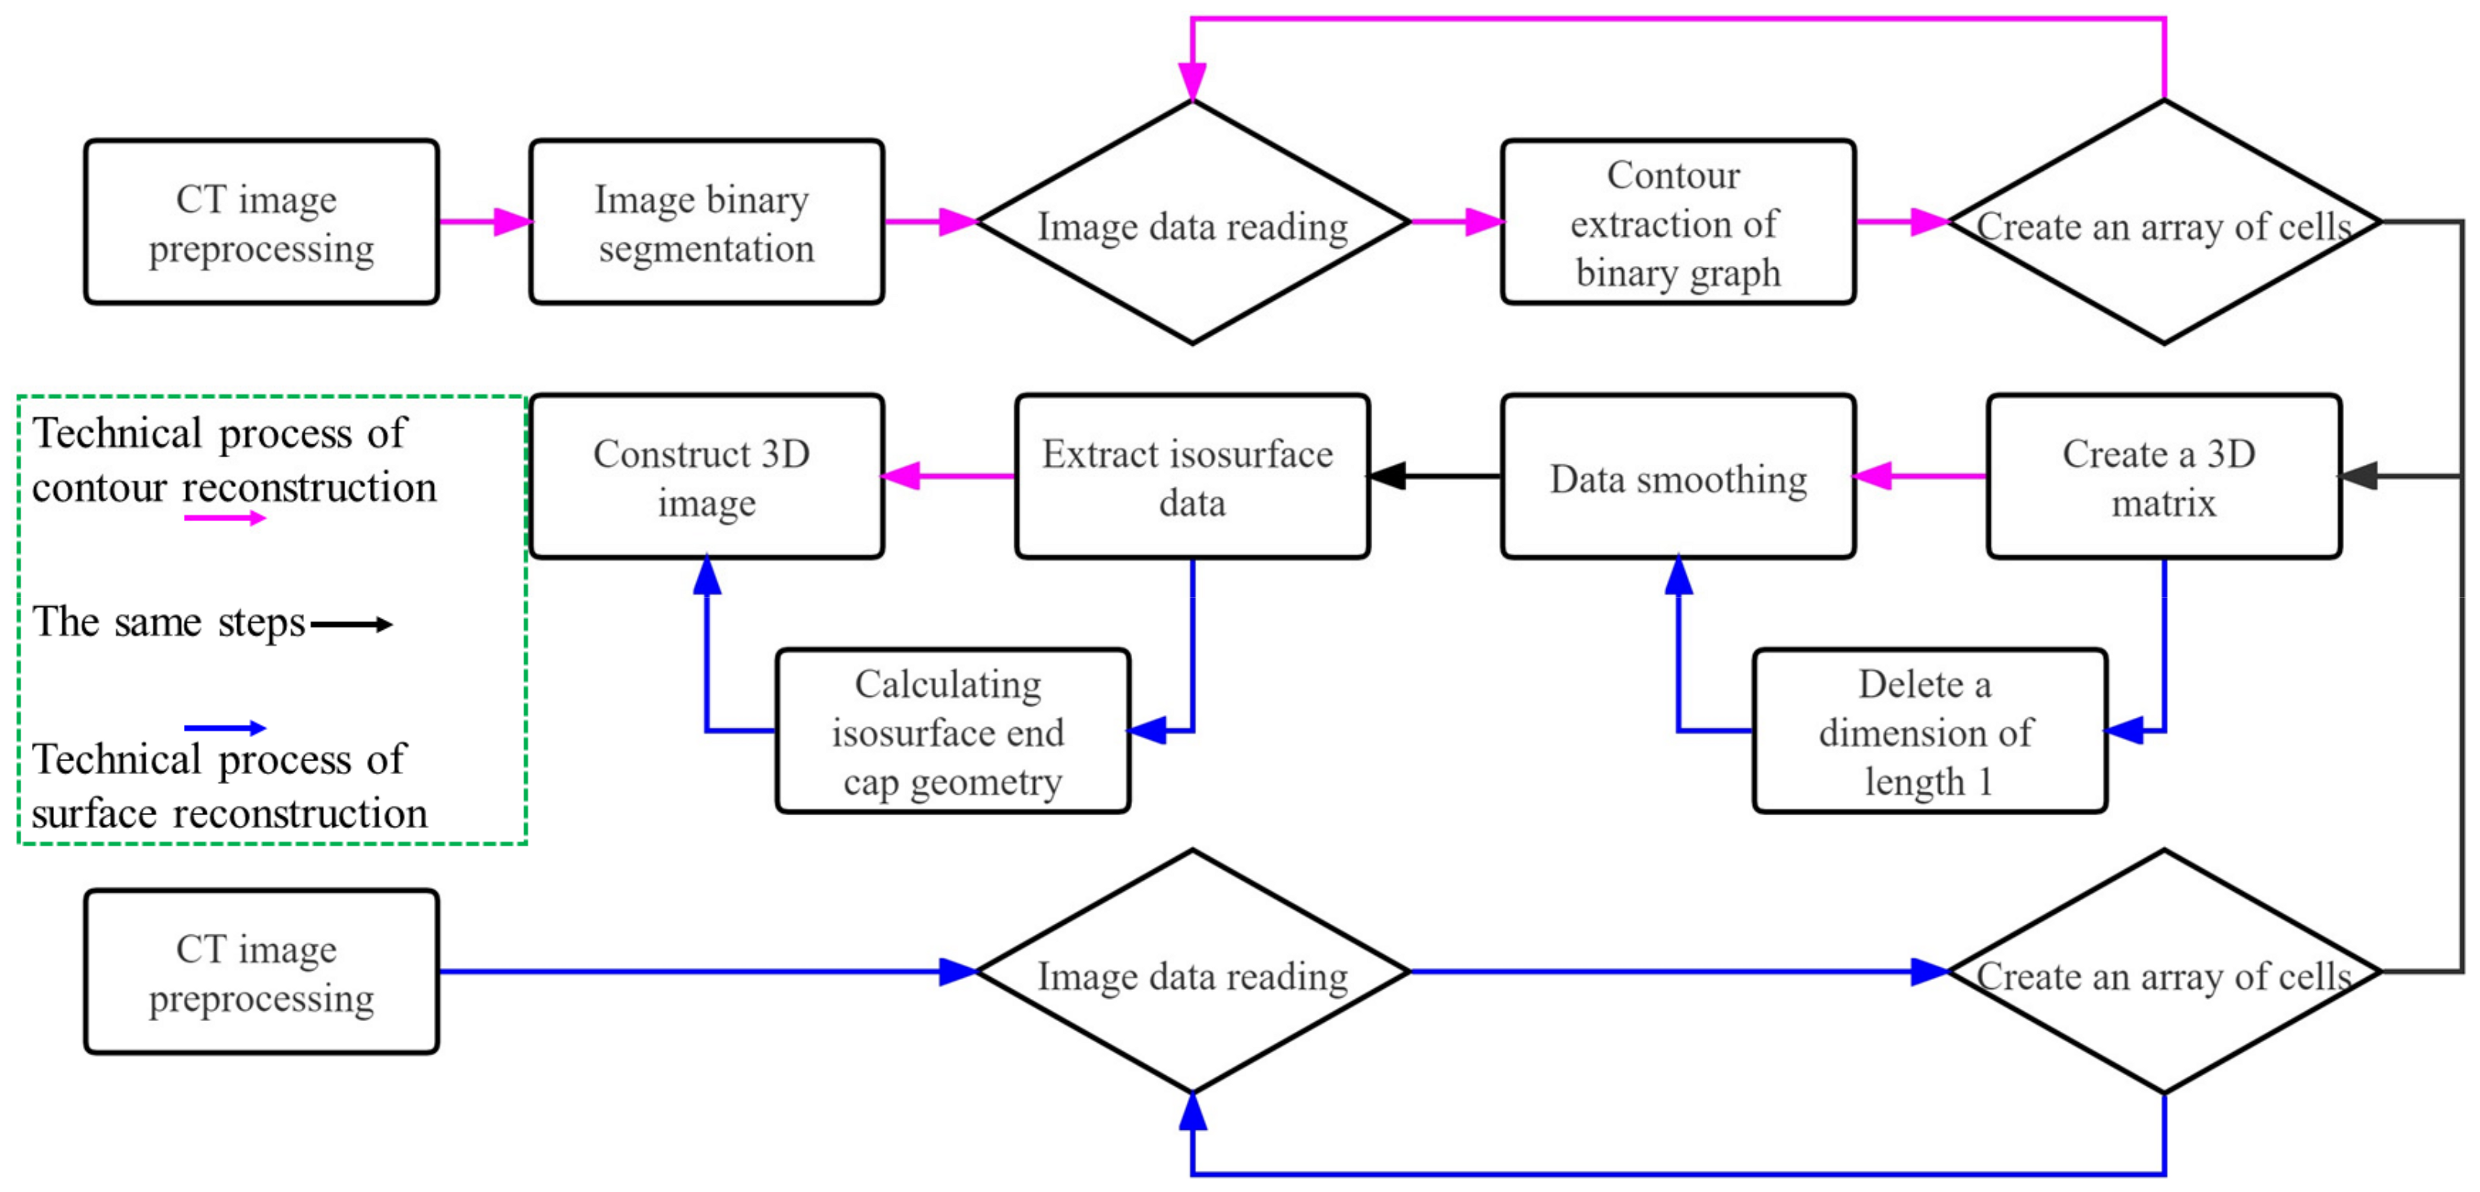
3.1. Three-Dimensional Reconstruction Technology Based on Object Cross-Section Information and Contour Information

Methods for an object’s 3D scalar field data visualization mainly include surface rendering and volume rendering. Surface rendering mainly samples data from the cross-section of objects, while the occlusion effect in 3D environments prevents the 3D data field inside the object from being visualized for analysis with the surface rendering results. Volume rendering, including indirect and direct volumes, can visualize the 3D data field inside an object. However, it necessitates extensive data collecting and intricate programming. Therefore, to better visualize the sandstone, we performed the 3D reconstruction by extracting the cross-section information and contour information of the object by combining surface reconstruction technology and contour reconstruction technology. It should be noted that a pixel is defined as a unit of measurement for the coordinate value of both the surface reconstruction technology and contour reconstruction technology, denoted as p.

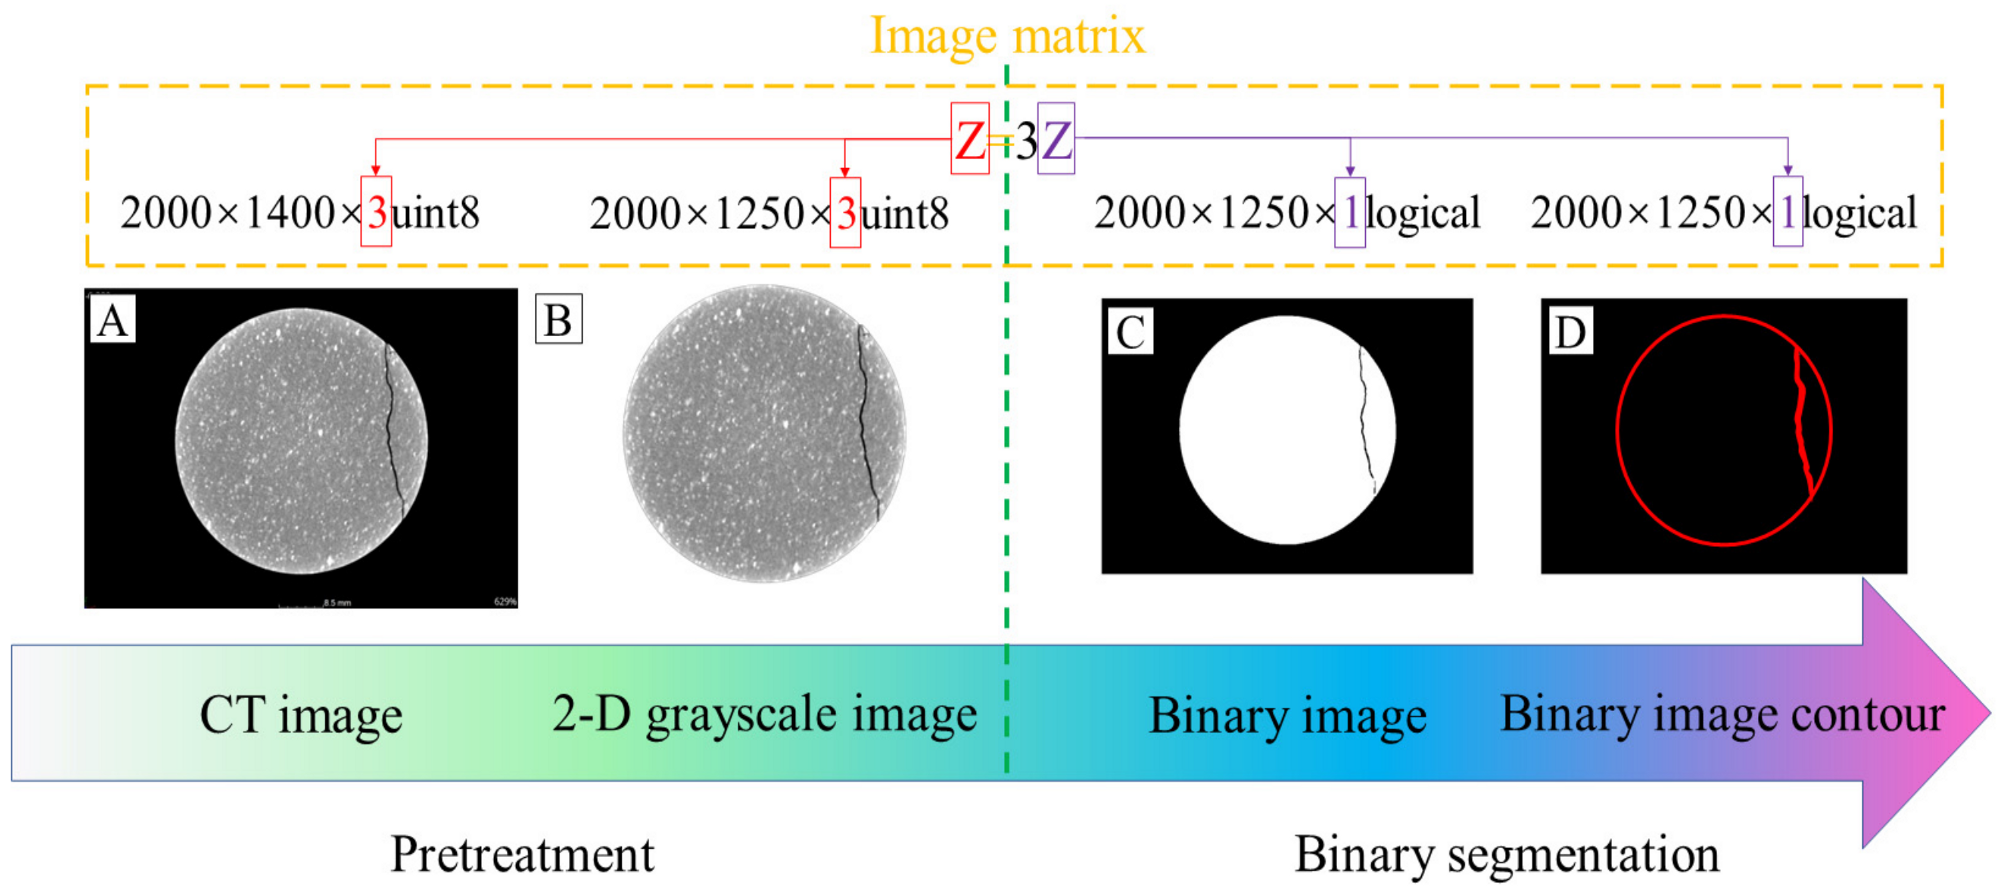
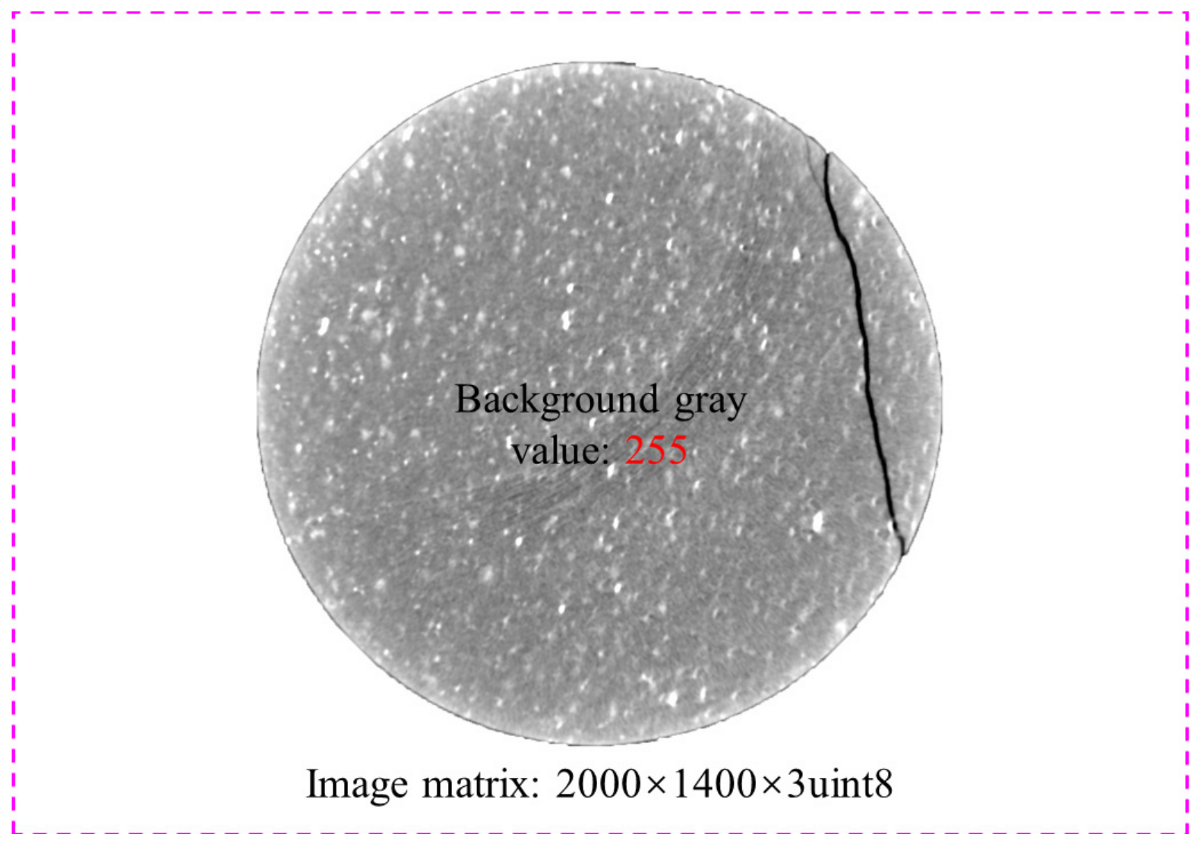
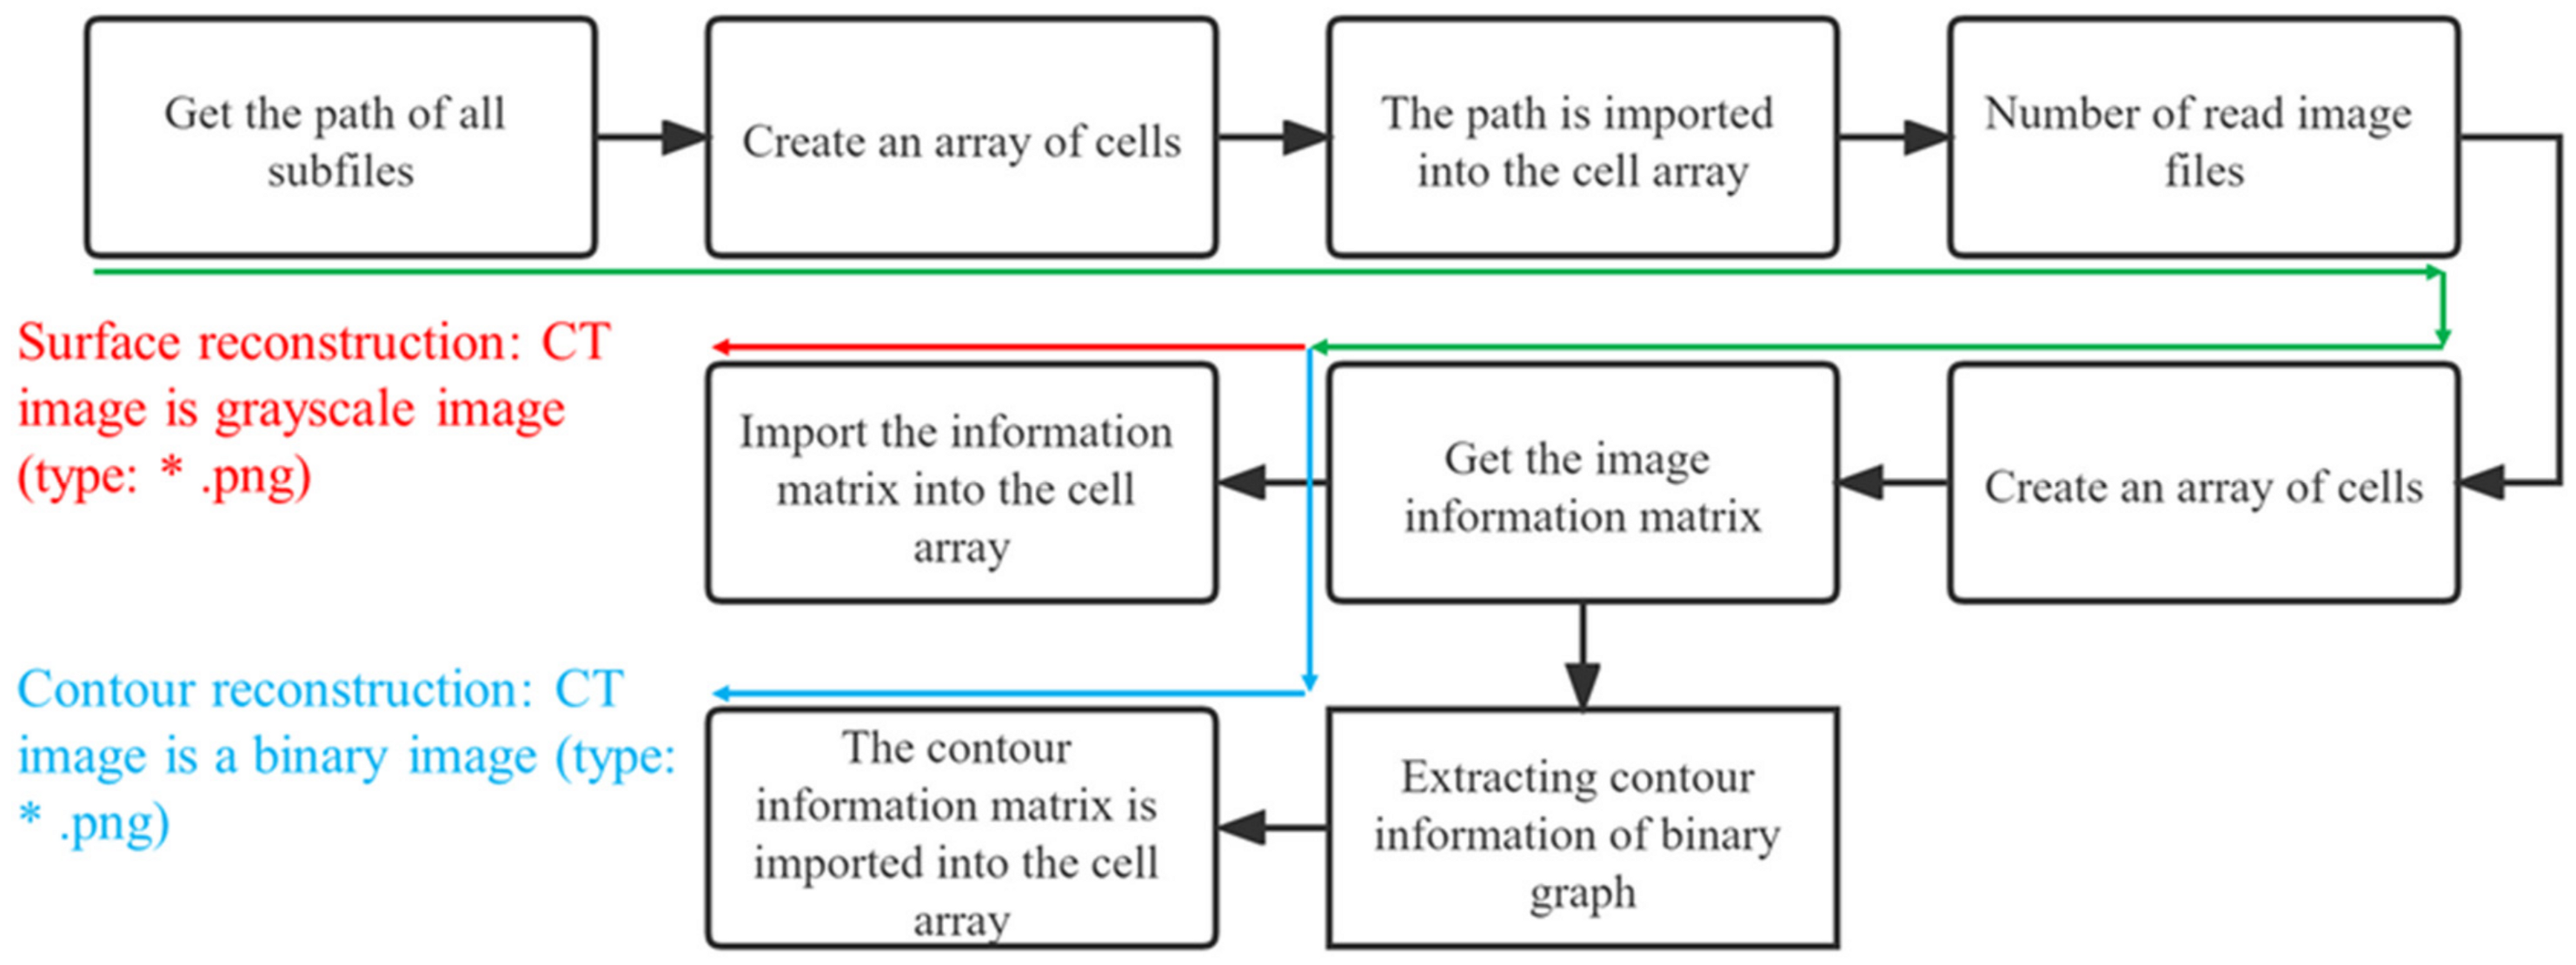
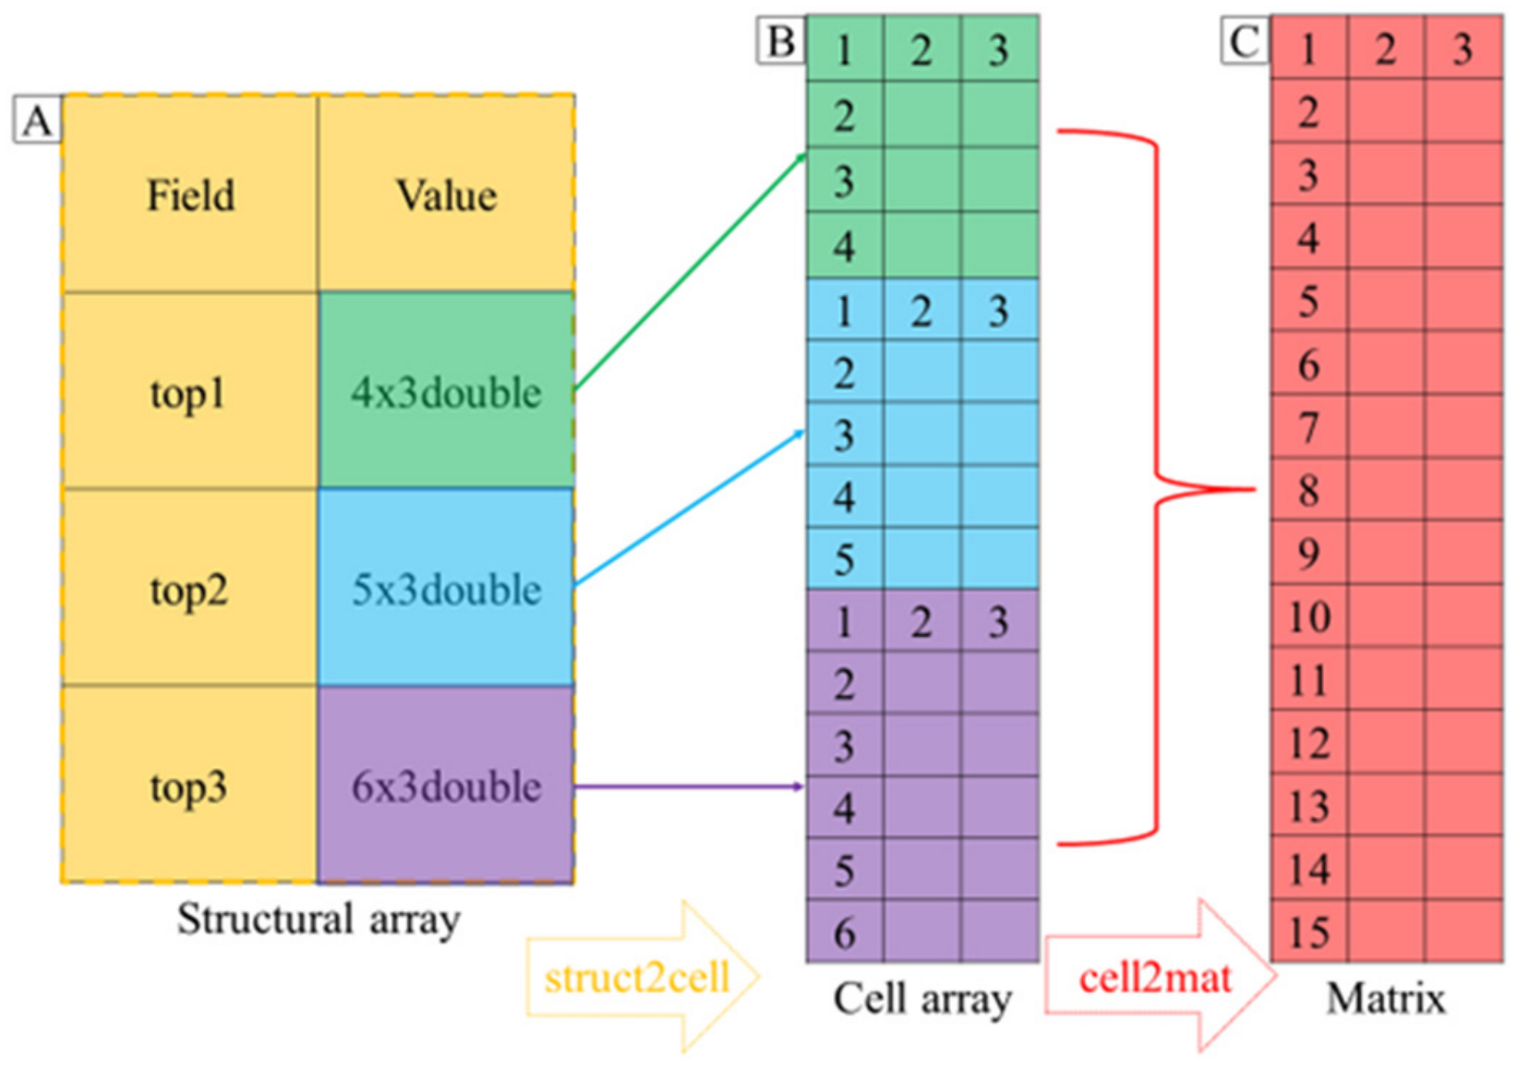
3.1.1. CT Image Preprocessing and Binary Graph Contour Representation

Before constructing a 3D image, it is necessary to extract the features of the CT scan image and eliminate the backgrounds. The image background preprocessing results of surface reconstruction technology and contour reconstruction technology are shown in Figure 3. Then, a binary segmentation of the processed CT scan image is implemented, and the binary contour is extracted, which can help reduce the amount of data to be collected. This is an essential step in contour reconstruction technology. Then, determining the optimal threshold remains the most critical problem for image binary segmentation. Here, we present the relevant calculation methods for determining the optimal threshold values.
Suppose the grayscale of a picture is [1, 2,…, H]. L1 represents the mean pixel value of an image with a gray level of [1, 2,…, h]. L2 represents the mean pixel value of an image with a gray level of [h + 1, h + 2,…, H]. The cumulative mean of gray level h is G. The global mean of the image is L. According to the theory of probability distribution, it is assumed that the probability of pixel distribution at a gray level of [1, 2, h] is K1. The probability of pixel distribution in the grayscale [h + 1, h + 2,…, H] is K2. So, there are the following functions:
K 1 = i = 1 h K i , K 2 = i = h + 1 H K i
G = i = 1 h iK i , L = i = 1 H iK i
L 1 = G K 1 , L 2 = L G K 2
According to the principle of variance and the above functional relationship, the following conclusions can be obtained:
δ 2 = ( i = 1 h iK i i = 1 H iK i i = 1 h K i ) 2 i = 1 h K i ( 1 i = 1 h K i )
δ 2 ( h Δ ) = max 1 h < L δ 2 ( h )
In the formula, δ 2 is the maximum between-class variance, and h Δ is the optimal threshold.
The optimal threshold of the preprocessed image is automatically determined using the above formula, and the binary segmentation of the 2D grayscale image is completed with the optimal threshold. In order to increase the computing speed, the perimeter pixels of the binary image should be returned to extract the binary image contour. The specific effect is shown in Figure 3.

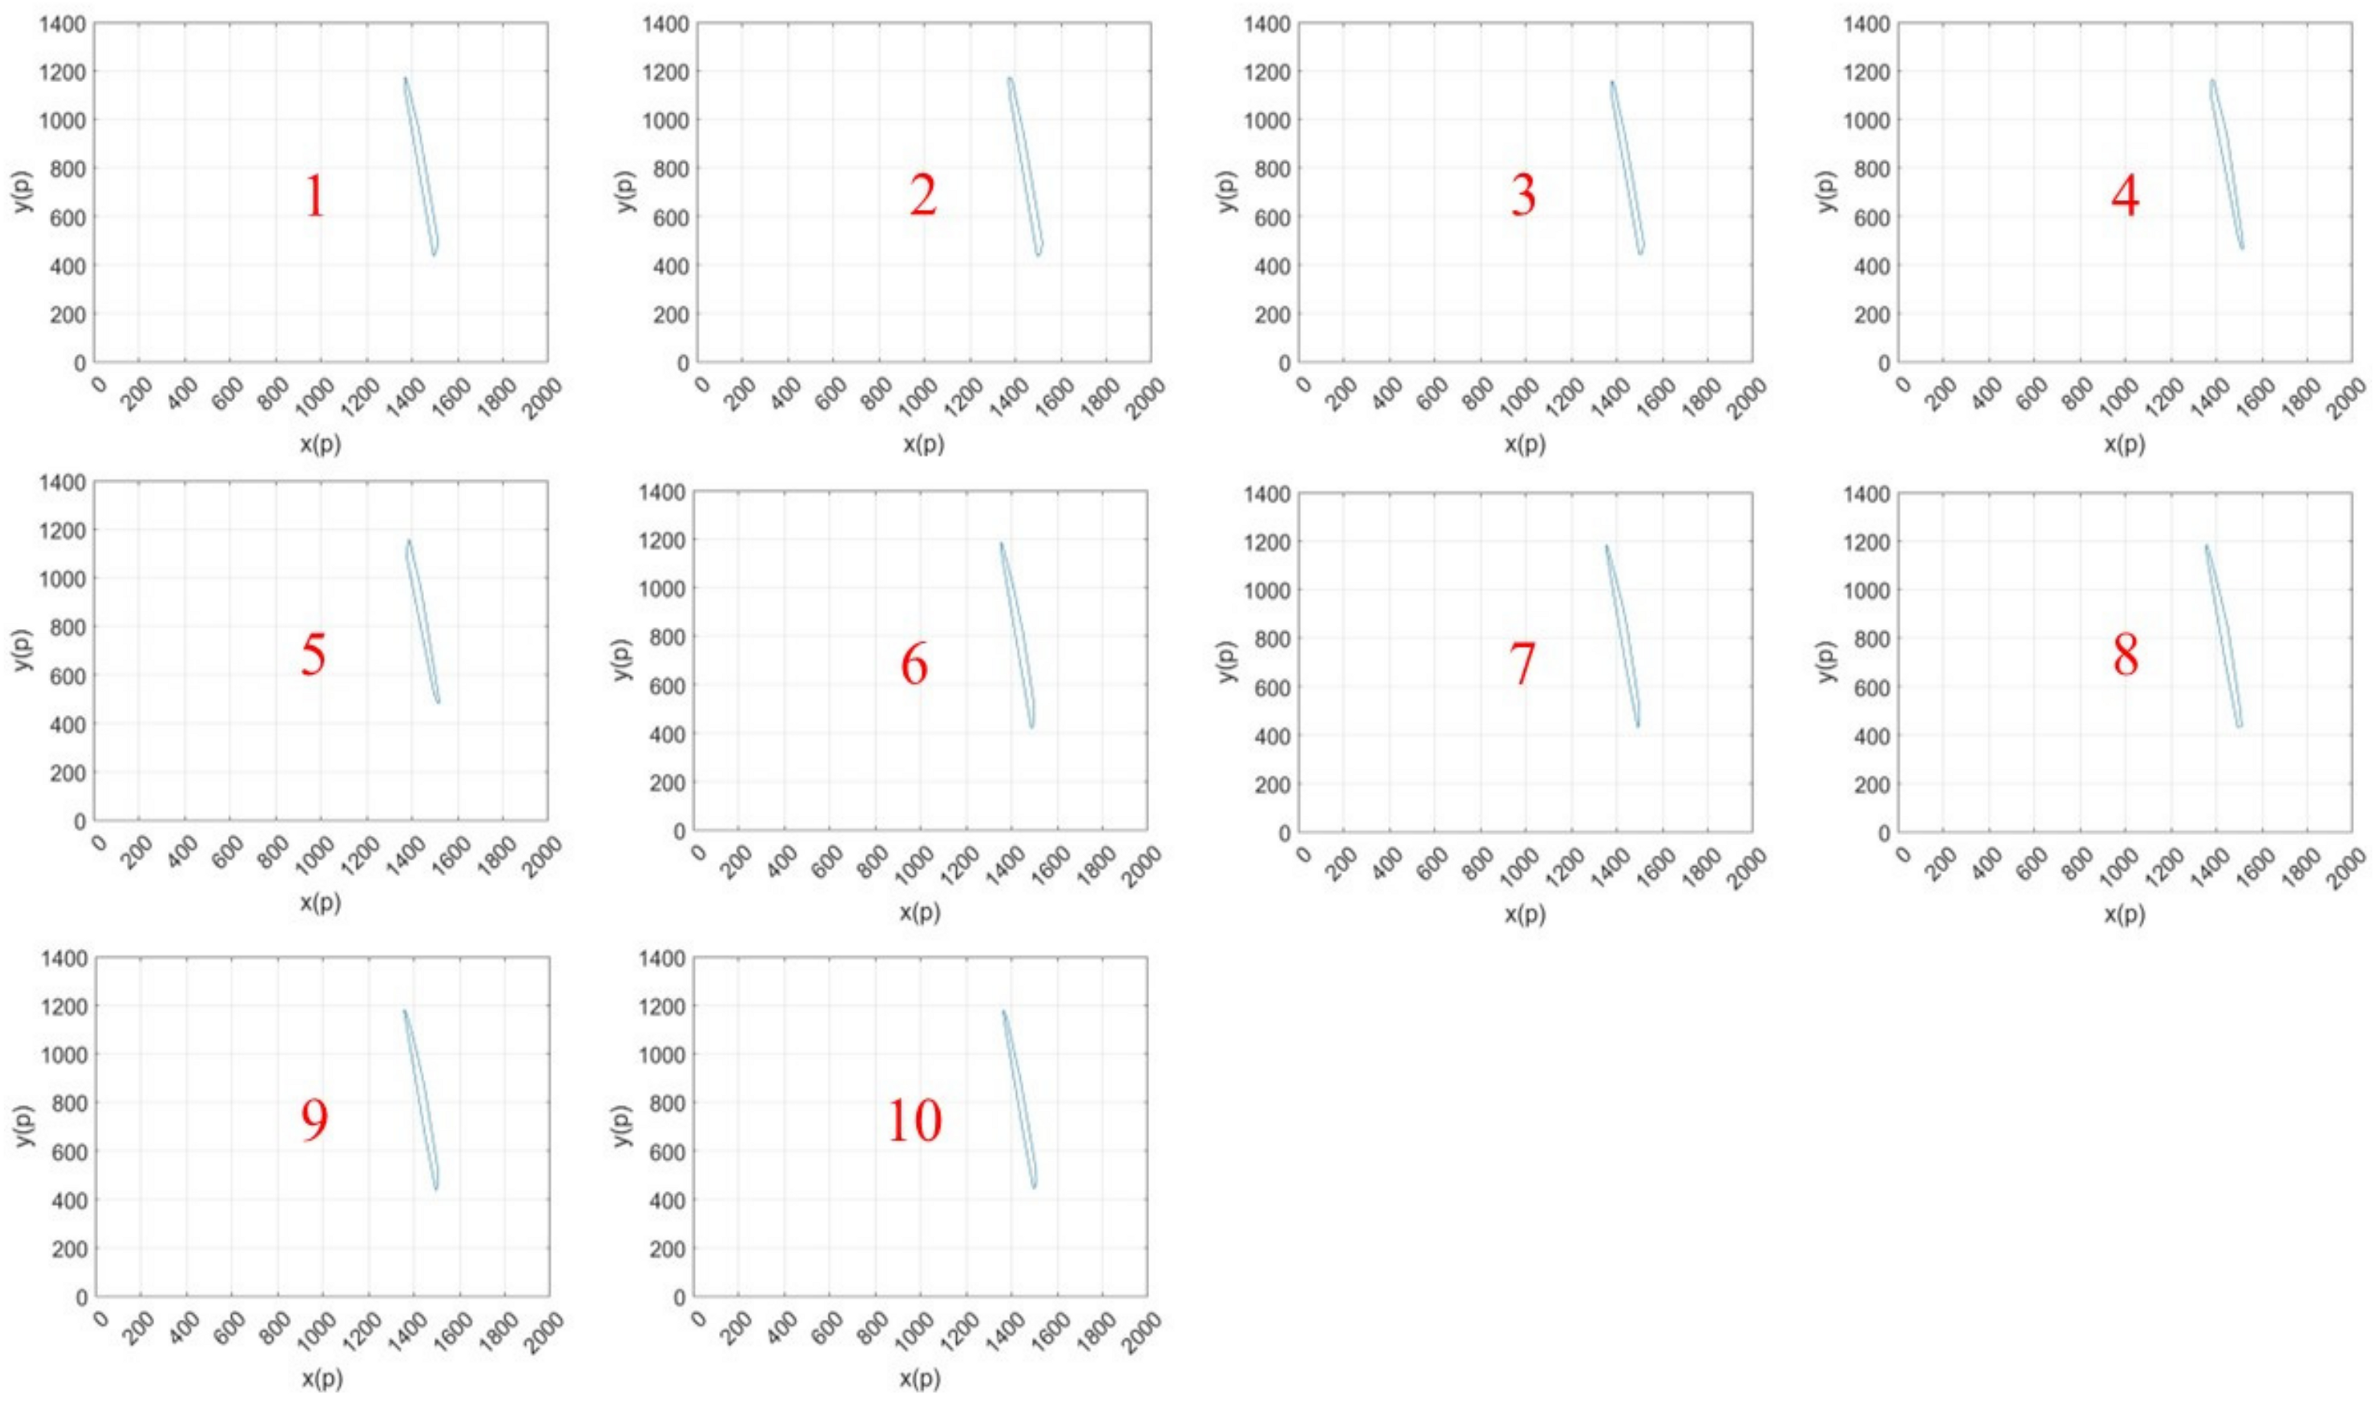
3.1.2. Analysis of 3D Reconstruction Results Based on Cross-Section Information and Contour Information

There are more than 1600 CT scan images of deteriorated sandstone, and the time for reading the image data in MATLAB is too long. Therefore, this reconstruction experiment only continuously extracted 91 CT scan images. The technical process is shown in Figure 4.
A 2D grayscale image and a binary graph contour were obtained using the image preprocessing technique. However, surface reconstruction and contour reconstruction techniques need to continuously extract 91 CT scan images. Therefore, a loop was established for the surface reconstruction technique to extract the cross-section information from the 2D grayscale image, and another loop was established for the contour reconstruction technique to extract contour information from the binary graph. As for the problem of information data storage and retrieval, the grayscale image file needs to be read, and the length of the most extensive array dimension in the read data to be returned. In this way, we define a loop variable for the storage of subsequent data. To store a large amount of information data, both two techniques create a cell array as an indexed data container for information data. The storage type of cross-section information data in the cell is X × Y × 3uint8, and the storage type of contour information data in the cell is X × Y × 1logical.
Technically, the construction of 3D images is based on 3D matrices. Therefore, it is necessary to index the information data and connect all the matrices, and the matrix was extended in the Z-direction. Finally, the 3D image was constructed using the isosurface data. The 3D reconstruction results are shown in Figure 5.
Figure 5 demonstrates that the combination of surface reconstruction technology and contour reconstruction technology can help better visualize the 3D data field of deteriorated sandstone, with which the location of the cracks in the deteriorated sandstone can be precisely marked on a 3D coordinate system and their shape can be accurately described with a vector. Combining the two techniques allows for the realization of visualization and quantitative characterization of the internal crack propagation laws. Figure 3 shows that the pixel value of the Z-axis of the 2D grayscale image is three times that of the Z-axis of the binary graph contour. Therefore, extracting data from 91 identical CT scan images, the Z-axis value of the surface reconstruction result should be 273p, and the Z-axis value of the contour reconstruction result should be 91p (Figure 5). After realizing the visualization of the 3D data field of deteriorated sandstone, the next step is to explore the cross-sectional area and space volume of the internal cracks of deteriorated sandstone.

3.2. Three-Dimensional Reconstruction Technology for Extracting Point Cloud Data of Internal Cracks in Deteriorated Sandstone

Point clouds are collections of individual points representing the 3D data field of object surface space. The primary tools that are used to capture point cloud data are the 3D laser scanner, photogrammetry scanner, and the reverse engineering approach. However, only a tiny amount of study has been carried out on feature information extraction from particular regions of a 2D image and its conversion to point cloud data. Therefore, we suggest a 3D reconstruction technology for extracting point cloud data and visualizing deteriorated sandstone CT scan images. The unit of measurement for coordinate value in point cloud reconstruction technology is also a pixel, denoted as p.

3.2.1. CT Scan Image Preprocessing and the Required Number of Images

The CT scan image does not require binary segmentation except for extracting the feature information of the specific region of the image and assigning the maximum gray scale value for the background. The size of all images changed to the same after preprocessing. Deteriorated sandstone specimens used in the experiment are standard cylinder specimens specified by the International Society for Rock Mechanics with a height of 100 mm and a diameter of 50 mm. The CT scanning interval is 0.06 mm, which thus generated more than 1600 CT scan images. We only extracted 10 CT scan images for reconstruction calculation in order to reduce the amount of data. The reconstruction height is 5.4 mm because there is a 0.6 mm interval between each image. The preprocessing results are shown in Figure 6.

3.2.2. Extracting Point Cloud Data and 3D Reconstruction

The specific technical process of extracting feature information from the internal cracks of deteriorated sandstone, its conversion to point cloud data, and carrying out 3D reconstruction is shown in Figure 7.
Reading image information into the matrix is the basis for the subsequent work of 3D reconstruction. The first and foremost step is to convert the image matrix to a grayscale image for extracting the feature values of cracks because the identification signal of the crack characteristic value is the minimum gray-scale value. Since the CT scans have the same pixel size, the length and width of the CT scans are used as the 2D coordinate axes and one pixel as a unit of measurement. Based on the above conditions, the coordinate data of cracks was extracted and converted into a point cloud by finding indices and values of non-zero elements. The effect is shown in Figure 8.
We assumed that the sandstone specimen only has the volume expansion of its crack before and after the fracture, ignoring the deformation component of the sandstone. Based on the above conditions, the sandstone cross-sectional area can be used as a reference value for calculating the area of the crack. The formula is as follows.
First, the function of the image pixel area is
S = ap bp
In the formula, S is the pixel area of the image, a is the number of pixels on the X-axis, and b is the number of pixels on the Y-axis.
Then, the function relationship between the sandstone cross-sectional area and image area is as follows:
S ¯ = S   A ¯ A
In the formula,   S ¯ is the area of the image,   A ¯ is the cross-sectional area of the sandstone, and A is the pixel area of the sandstone cross-section.
Similarly, the function relationship between the crack area and the image area is
  B ¯ = B   S ¯ S
In the formula,   B ¯ is the crack area, and B is the crack pixel area.
Combining Formulas (7) and (8), the function relationship between the crack area and sandstone cross-sectional area is as follows:
  B ¯ = B   A ¯ A
The method of extracting fracture point cloud data is used to extract point cloud data from the cross-section of degraded sandstone. The primary purpose of this process is to obtain the reference value of the area. The cross-sectional area parameters of deteriorated sandstone are shown in Table 1.
The 2D convex hull of the crack point cloud data and the pixel area can be bounded by the convex hull by calculating the 2D crack point cloud matrix. Combined with Formula (9), the crack pixel area (B) can be converted to the crack area ( B ¯ ). The results are shown in Table 2 and Figure 9.
In the process of converting 2D point cloud data to 3D point cloud data, the height unit should be bounded. In this part, 0.06 mm is used as a pixel unit (p). Since the reconstruction height of the crack is 5.4 mm, the height of the Z-axis direction of the spatial Cartesian coordinate system is 0p to 90p. With reference to the calculation method of crack area given by Formula (9), the formula for calculating crack volume is
V B = V b V A V a
V B = 5 . 4   A ¯ 90 A · V b
In the formula, V B is the volume of crack, V b is the pixel volume of crack, V A is the volume of sandstone, V a is the pixel volume of sandstone, A ¯ is the cross-sectional area of sandstone (mm2), and A is the pixel area of sandstone cross-section.
Then, the 3D crack point cloud matrix is calculated to create a 3D convex hull, and the convex hull volume of the 3D point cloud data is returned. The results are shown in Figure 10.
Based on the above conditions, the crack volume can be calculated with the obtained crack pixel volume by using Formula (11) and Table 1. The results are shown in Table 3.
In summary, it is feasible to convert the internal cracks of deteriorated sandstone to 3D point cloud data and perform visualization analysis via the point cloud reconstruction technology proposed in this research. This technology can not only visualize the spatial location of cracks but also calculate the cross-sectional area and the spatial volume of cracks, which offered a model for quantitative characterization of the influence of primary cracks on the stability of surrounding rock with only 10 CT scan images, considerably reducing the number of images that needed to be read and maximizing efficiency.

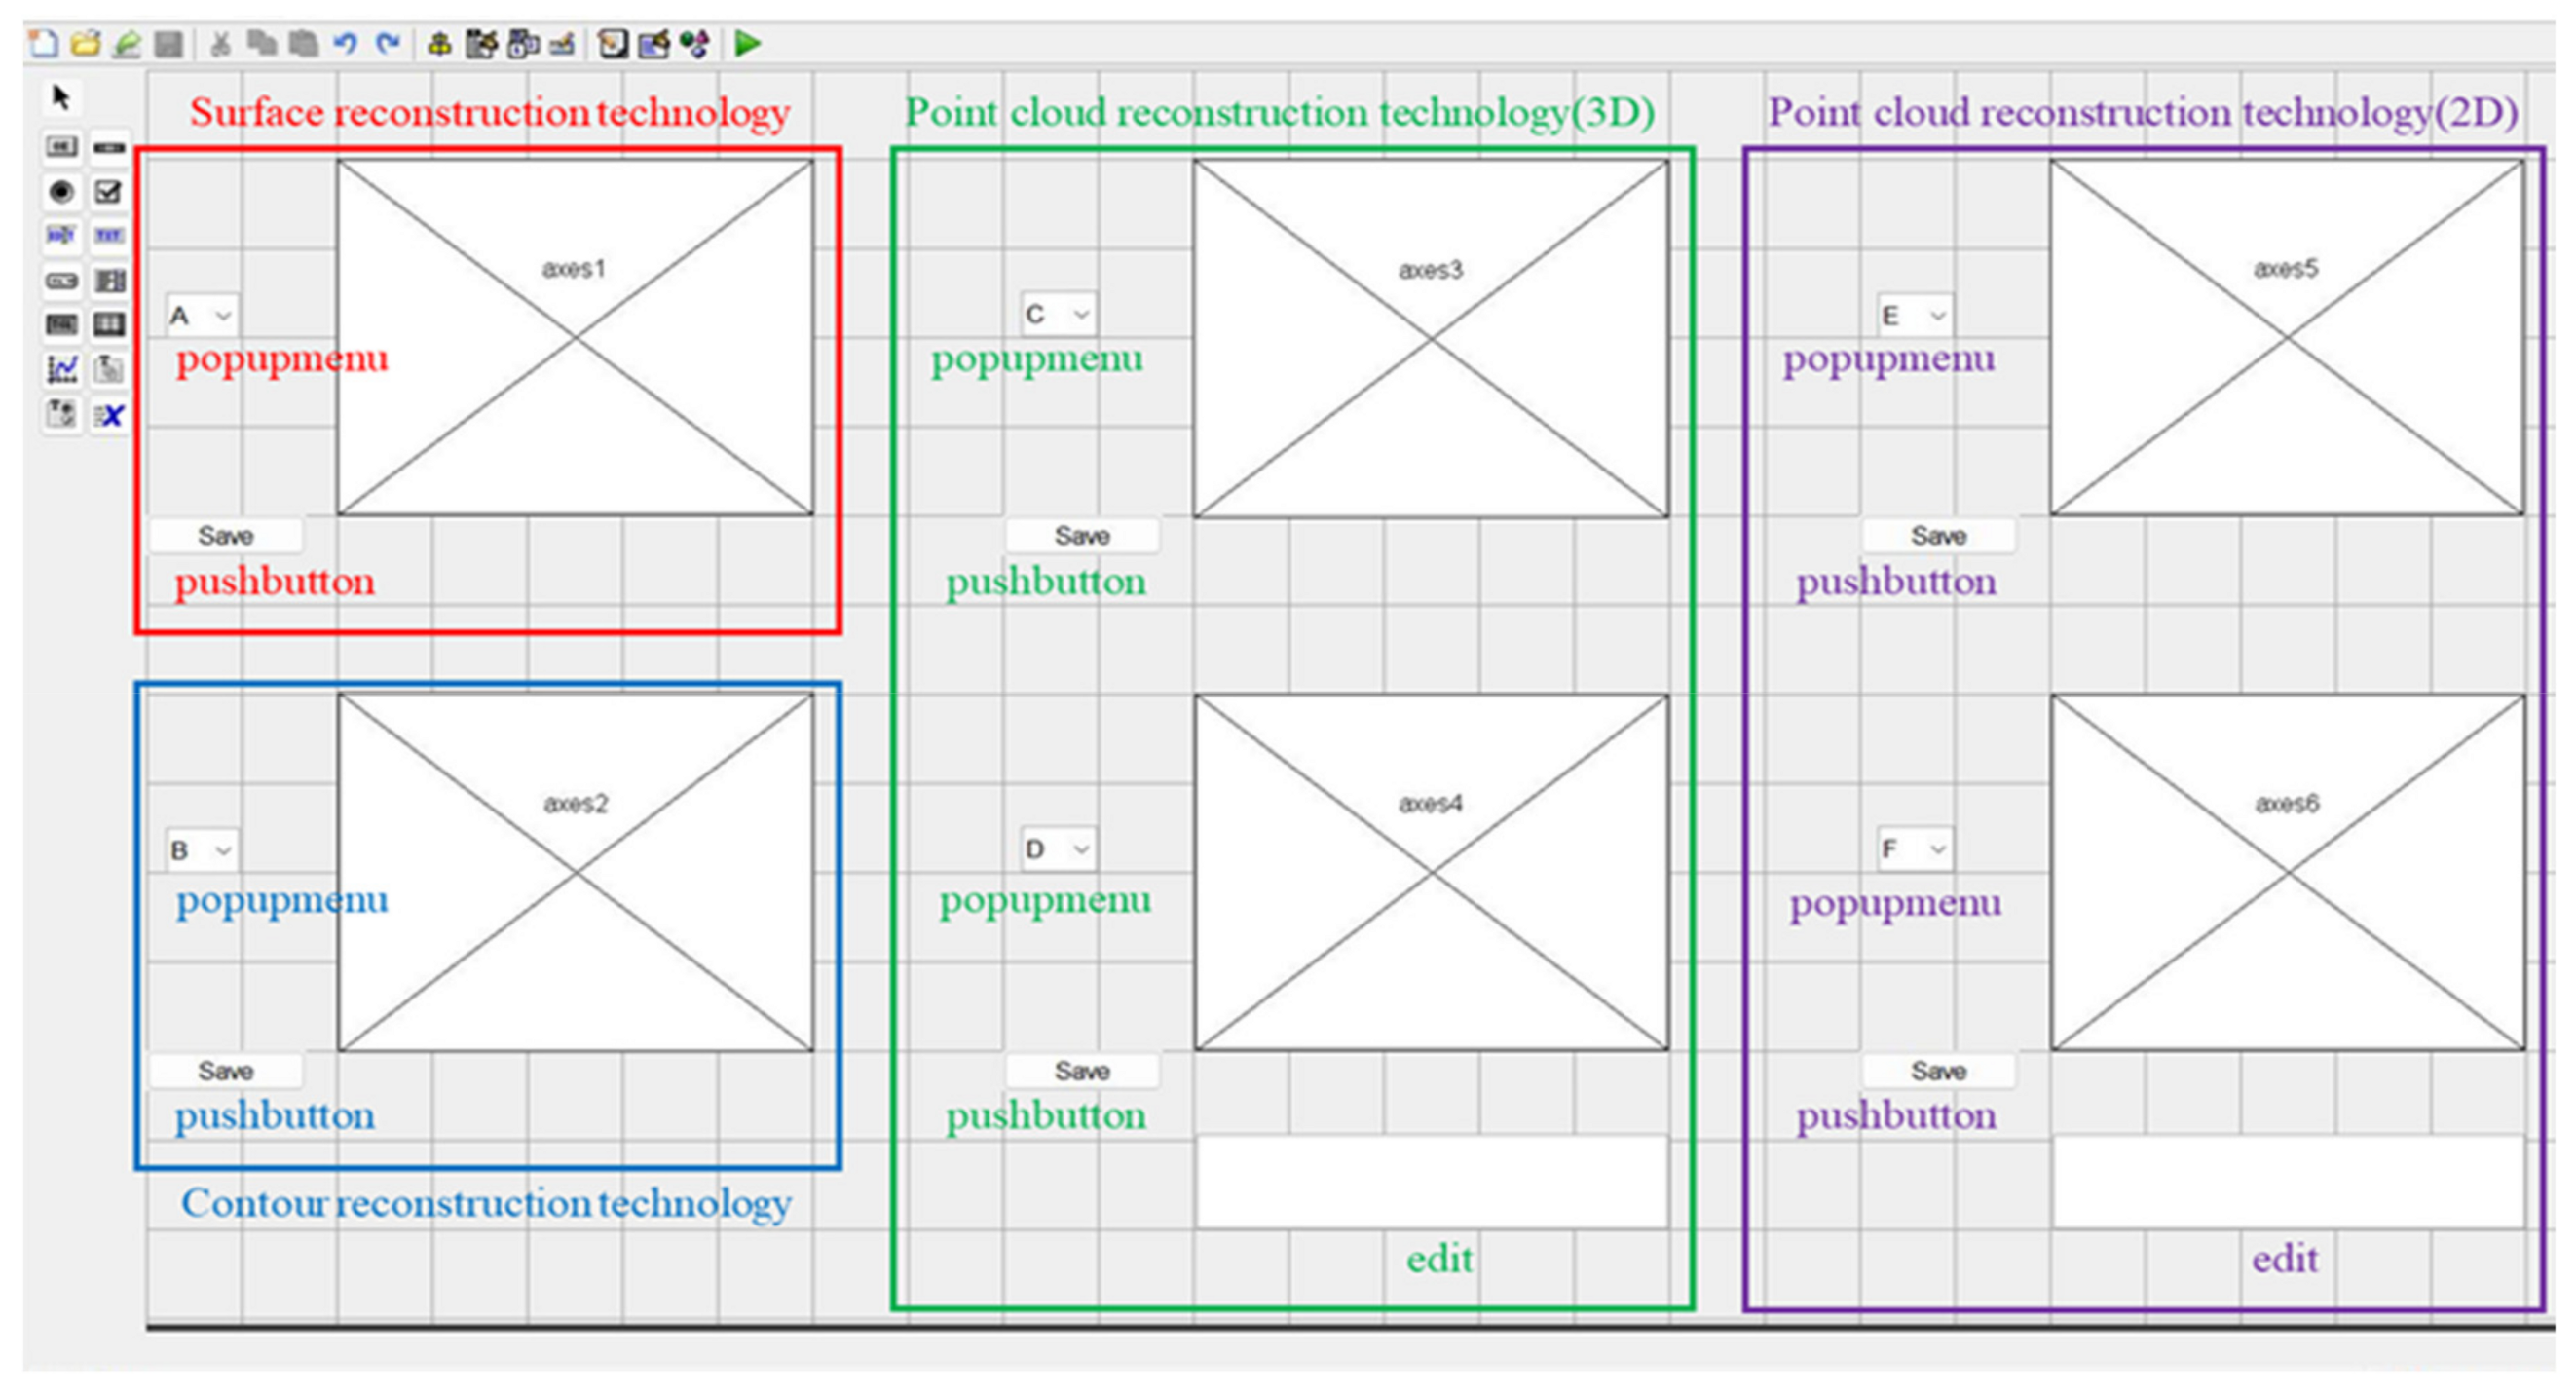
3.3. Visualization Analysis via GUI Control System

Surface reconstruction, contour reconstruction, and point cloud reconstruction technology all have advantages and disadvantages. In order to improve the overall effect of visualization analysis of deteriorated sandstone, this part created a GUI control system with MATLAB to combine the three technologies.
A complete main program is the precondition for creating a GUI control system. The data-collecting method in the running programs of the three reconstruction technologies is essential to the proper operation of the main program. The CT images are used as the data source for both surface reconstruction technology and contour reconstruction technology, which means that both technologies use the same data acquisition technique. The data file should be added to the path chosen for data reading in the MATLAB environment. This reduces the time required for data reading and results in faster running speed, but it restricts the search scope of GUI. Finding the paths to all sub-files under the image is required before performing a global search for CT image files. The paths are stored in the form of strings, and cell arrays are created. In order to retrieve the paths to the image folder and all sub-files and import them into the cell arrays, a for loop calculation is performed using the string length as the loop step size. The for loop takes the cell array length as the loop step size to read the number of image files and creates a cell array. When reading the image data from all image files and storing it as matrices, the number of image files is used as a loop step size in the if loop and for a loop. Finally, the matrix is imported into the cell array. The above is the method of collecting image data via surface reconstruction technology, and the difference between surface reconstruction technology and contour reconstruction technology in terms of image data acquisition methods is shown in Figure 11.
The data file read via the point cloud reconstruction technology is a MAT file. The MAT file is an array of structures in which point cloud data exists in the form of variables. The data file the point cloud reconstruction technology reads is a MAT file. The MAT file is an array of structures where point cloud data exists as variables. Therefore, when reading the point cloud data, the point cloud reconstruction technology does not need to perform a global search but only needs to load variables from the file to the workspace. The reconstruction technology does not need to perform a global search but only loads variables from the file to the workspace. However, visualization analysis cannot be performed on an array of structures directly, directly on an array of structures, and point cloud reconstruction technology can only read matrices. Therefore, the array of structures will be converted to a cell array, and the cell array will be converted into a matrix. The conversion is shown in Figure 12.
In the GUI interface, the surface reconstruction technology is mainly composed of a popup menu, axes, and pushbutton, and the contour reconstruction technology is also made up in the same way. Moreover, point cloud reconstruction technology has two categories: point cloud reconstruction technology (3D) and point cloud reconstruction technology (2D). The components of the visualization process of the point cloud reconstruction technology are the same as that of the surface reconstruction technology, but the volume operation part and the area operation part of the point cloud reconstruction technology are added with the edit to output the calculation results, which are the pixel volume and pixel area. The main difference between the surface reconstruction technology and the contour reconstruction technology is that the main program of the surface reconstruction removes dimensions of length one and uses the gradient of the data to calculate the normal of the isosurface vertex from the vertex list. At the same time, a patch program is added to compute the geometry of the isosurface end-cap. The GUI design interface is shown in Figure 13.
The data sources of the surface reconstruction technology and contour reconstruction technology are 91 CT images, 10 images were extracted from which, with an interval of 9 CT images between the 10 CT images. These 10 CT images serve as data sources for the point cloud reconstruction technology. The structural relation of the callback function and the reconstruction results of the GUI are shown in Figure 14.
Figure 14 shows that the GUI proposed in this paper can execute surface reconstruction, contour reconstruction, and point cloud reconstruction at the same time. The surface reconstruction technology can visualize the spatial information of the surface of deteriorated sandstone. Contour reconstruction technology can visualize the spatial information of the contour of deteriorated sandstone. With the use of point cloud reconstruction technology, cracks’ spatial information can be shown, as well as their pixel volume and pixel area. The GUI suggested in this study is compared to Avizo in terms of reconstruction results in order to demonstrate its viability.
Avizo counts the number of voxels to obtain the volume, while point cloud reconstruction technology counts the number of pixels. Thus, Avizo and GUI are comparable in terms of calculating the volume. In this research, 91 identical CT images were used for reconstruction, each with a pixel size of 2000p × 1400p. In Avizo, the voxel size is set to 1 μm × 1 μm × 1 μm, and the physical size is from (0, 0, 0) [μm] to (1999, 1399, 90) [μm]. Therefore, the volume of one pixel is equal to one voxel. The specific results are shown in Figure 15 and Figure 16.
In this part, with reference to the reconstruction results of Avizo, the comparison between GUI and Avizo revealed that the effect of surface reconstruction technology and contour reconstruction technology is close to that of Avizo. As for the point cloud reconstruction technology, the number of point clouds of 2D cracks is 1.176 times that of Avizo, which is very close to the calculated result of Avizo. In this part, the area of the convex hull is 3.293 times that of Avizo, and the volume of the convex hull is 4.142 times that of Avizo (Figure 15 and Figure 16). This shows that point cloud reconstruction technology has an excellent ability to identify cracks. In general, the GUI control system integrates the strengths of the three 3D reconstruction technologies, which essentially promotes the 3D visualization of rock internal space.

4. Conclusions

This paper proposed surface reconstruction technology, contour reconstruction technology, and point cloud reconstruction technology based on the CT scan of deteriorated sandstone. The three technologies are combined by the GUI control system and then compared with Avizo. The conclusions are as follows:
(1)
The combination of surface reconstruction technology and contour reconstruction technology can help better visualize the 3D data field of deteriorated sandstone, with which the location of the cracks in the deteriorated sandstone can be precisely marked on a 3D coordinate system, and their shape can be accurately described with a vector. The combination of the two technologies allows for the realization of visualization and quantitative characterization of the internal crack propagation laws. It offers a visualization model for exploring the developing laws of primary fractures.
(2)
We converted the internal cracks of deteriorated sandstone to 3D point cloud data and performed visualization analysis via point cloud reconstruction technology. At the same time, the crack cross-sectional area and crack space volume were obtained using the area and volume conversion formula. The average area of the point cloud reconstruction crack cross-section is 35.8022 mm2, and the average pixel area is 19,318p. The space volume of the point cloud reconstruction crack is 238.921 mm3, and the pixel volume is 2,148,600p. This method offered a model for the quantitative characterization of the influence of primary cracks on the stability of surrounding rock with only 10 CT scan images, considerably reducing the number of images that needed to be read and maximizing efficiency.
(3)
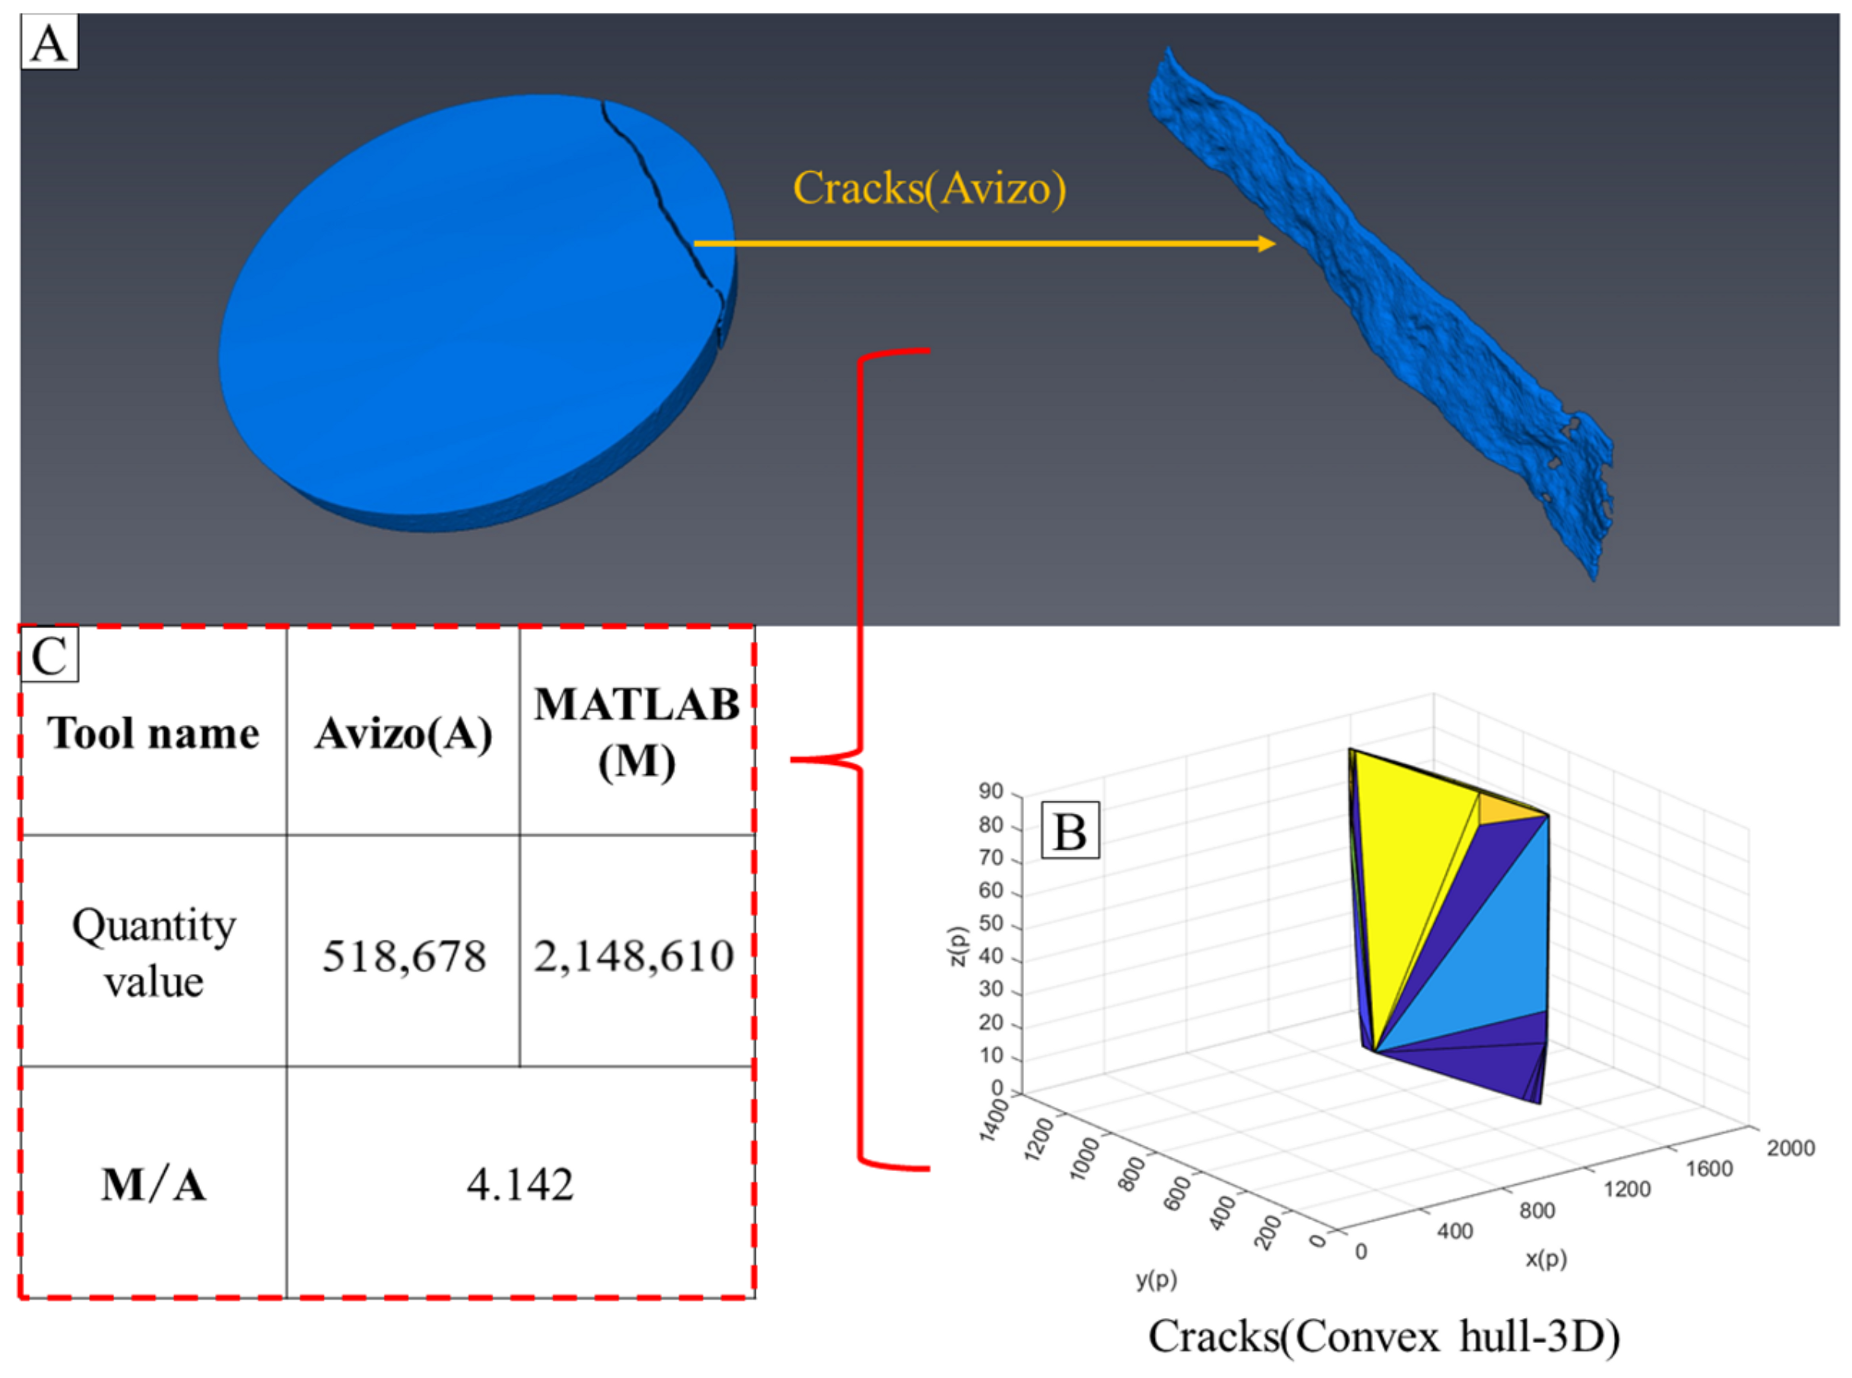
The GUI control system is developed with MATLAB, and the GUI was also used to combine surface reconstruction technology, contour reconstruction technology, and point cloud reconstruction technology. Comparing the reconstruction results obtained using GUI with that of Avizo, the reconstruction effect of surface reconstruction technology and contour reconstruction technology is found to be very close to that of Avizo. The number of point clouds of 2D cracks counted via point cloud reconstruction technology is quite close to the calculated result of Avizo, which is 1.176 times that of Avizo. This shows that point cloud reconstruction technology has an excellent ability to identify cracks. The convex hull area of point cloud reconstruction technology is 3.293 times that of Avizo, and the convex hull volume is 4.142 times that of Avizo. The GUI control system integrates the strengths of the three 3D reconstruction technologies, which essentially promotes the 3D visualization of rock internal space.

Author Contributions

Conceptualization, X.Z.; Methodology, X.Z. and Z.F.; Software, W.Z.; Validation, X.Z., W.Z., T.L., Z.W. and L.J.; Formal analysis, T.L.; Investigation, Z.F., W.Z., T.L., Z.W. and L.J.; Resources, Z.W. and L.J.; Data curation, Z.F.; Writing—original draft, Z.F.; Writing—review & editing, X.Z., W.Z., T.L., Z.W. and L.J.; Supervision, X.Z.; Project administration, X.Z.; Funding acquisition, X.Z. All authors have read and agreed to the published version of the manuscript.

Funding

This work was supported by the Key Project of Xihua University (Z201036), the Graduate Innovation Fund Project of Xihua University of China (YCJJ2021075), and the Undergraduate Innovation and Entrepreneurship Training Project of the Sichuan Province in 2019 (S201910623016).

Data Availability Statement

Data will be made available upon request.

Conflicts of Interest

The authors declare no conflict of interest.

References

  1. Sun, Y.S.; Fei, T.; Zhang, L.Y.; Liu, X.P.; Zhang, J.Y. Improving Medical CT Image Blind Restoration Algorithm Based on Dictionary Learning by Alternating Direction Method of Multipliers. Autom. Control Comput. Sci. 2018, 52, 49–59. [Google Scholar] [CrossRef]
  2. Jin, Y. Quality of Service Aware Medical CT Image Transmission Anti-collision Mechanism Based on Big Data Autonomous Anti-collision Control. Curr. Bioinform. 2019, 14, 676–683. [Google Scholar] [CrossRef]
  3. Zhao, W.; Wang, L.N. Research on 3D Reconstruction Algorithm of Medical CT Image Based on Parallel Contour. IEEE Sens. J. 2020, 20, 11828–11835. [Google Scholar] [CrossRef]
  4. Nie, Q.; Zou, Y.B.; Lin, J.C.W. Feature Extraction for Medical CT Images of Sports Tear Injury. Mob. Netw. Appl. 2021, 26, 404–414. [Google Scholar] [CrossRef]
  5. Ma, M.J.; Xia, H.Y.; Tan, Y.M.; Li, H.S.; Song, S.X. HT-Net: Hierarchical context-attention transformer network for medical ct image segmentation. Appl. Intell. 2022, 52, 10692–10705. [Google Scholar] [CrossRef]
  6. Cimen, S.; Gooya, A.; Grass, M.; Frangi, A.F. Reconstruction of coronary arteries from X-ray angiography: A review. Med. Image Anal. 2016, 32, 46–68. [Google Scholar] [CrossRef]
  7. Xu, Z.W.; Bartrina-Rapesta, J.; Blanes, I.; Sanchez, V.; Serra-Sagrista, J.; Garcia-Bach, M.; Munoz, J.F. Diagnostically lossless coding of X-ray angiography images based on background suppression. Comput. Electr. Eng. 2016, 53, 319–332. [Google Scholar] [CrossRef]
  8. Iyer, K.; Najarian, C.P.; Fattah, A.A.; Arthurs, C.J.; Soroushmehr, S.M.R.; Subban, V.; Sankardas, M.A.; Nadakuditi, R.R.; Nallamothu, B.K.; Figueroa, C.A. AngioNet: A convolutional neural network for vessel segmentation in X-ray angiography. Sci. Rep. 2021, 11, 18066. [Google Scholar] [CrossRef]
  9. Marcell, G.; Márton, B.; Csaba, C.N.; Dávid, S.; Viktor, Ó.I.; István, G.; János, K.P.; Veres, D.S.; Krisztián, S.; Szabolcs, O.; et al. Digital variance angiography allows about 70% decrease of DSA-related radiation exposure in lower limb X-ray angiography. Sci. Rep. 2021, 11, 21790. [Google Scholar]
  10. Kim, J.; Yoo, S.; Kim, J.; Kim, H.K. Towards subtraction angiography using a multi-layered X-ray detector. Phys. Med.-Eur. J. Med. Phys. 2022, 95, 32–40. [Google Scholar] [CrossRef] [PubMed]
  11. Zhang, Y.; Verwaal, W.; van de Ven, M.F.C.; Molenaar, A.A.A.; Wu, S.P. Using high-resolution industrial CT scan to detect the distribution of rejuvenation products in porous asphalt concrete. Constr. Build. Mater. 2015, 100, 1–10. [Google Scholar] [CrossRef]
  12. Jiang, H.N. Defect Features Recognition in 3D Industrial CT Images. Inform.—J. Comput. Inform. 2018, 42, 477–482. [Google Scholar] [CrossRef]
  13. Tang, B.W.; Gao, S.; Wang, Y.G.; Liu, X.M.; Zhang, N. Pore structure analysis of electrolytic manganese residue based permeable brick by using industrial CT. Constr. Build. Mater. 2019, 208, 697–709. [Google Scholar] [CrossRef]
  14. Liang, C.Y.; Wang, Y.H.; Tan, G.J.; Zhang, L.D.; Zhang, Y.T.; Yu, Z.H. Analysis of Internal Structure of Cement-Stabilized Macadam Based on Industrial CT Scanning. Adv. Mater. Sci. Eng. 2020, 2020, 5265243. [Google Scholar] [CrossRef]
  15. Wang, D.K.; Zeng, F.C.; Wei, J.P.; Zhang, H.T.; Wu, Y.; Wei, Q. Quantitative analysis of fracture dynamic evolution in coal subjected to uniaxial and triaxial compression loads based on industrial CT and fractal theory. J. Pet. Sci. Eng. 2020, 196, 108051. [Google Scholar] [CrossRef]
  16. Jandejsek, I.; Jakubek, J.; Jakubek, M.; Prucha, P.; Krejci, F.; Soukup, P.; Turecek, D.; Vavrik, D.; Zemlicka, J. X-ray inspection of composite materials for aircraft structures using detectors of Medipix type. J. Instrum. 2014, 9, C05062. [Google Scholar] [CrossRef]
  17. Janeczek, K.; Arazna, A.; Futera, K.; Koziol, G. Failure analysis of epoxy molded IC packages. Microelectron. Int. 2016, 33, 94–101. [Google Scholar] [CrossRef]
  18. Kim, K.; Park, S.; Kim, G.; Cho, H.; Je, U.; Park, C.; Lim, H.; Lee, H.; Lee, D.; Park, Y.; et al. Industrial X-ray inspection system with improved image characterization using blind deblurring based on compressed-sensing scheme. Instrum. Sci. Technol. 2017, 45, 248–258. [Google Scholar] [CrossRef]
  19. Pfeifer, M.P.P.; Simerl, N.; Strahler, R.; Casburn, J.T.T.; Porter, J.; McNeil, W.J.J.; Bahadori, A.A.A. Methods for estimating X-ray machine output through measurement and simulation. Appl. Radiat. Isot. 2022, 183, 110125. [Google Scholar] [CrossRef]
  20. Valdiande, J.J.; Rodriguez-Cobo, L.; Cobo, A.; Lopez-Higuera, J.M.; Mirapeix, J. Spectroscopic Approach for the On-Line Monitoring of Welding of Tanker Trucks. Appl. Sci. 2022, 12, 5022. [Google Scholar] [CrossRef]
  21. Huang, C.Z.; Zhang, X.D.; Liu, S.; Li, N.Y.; Kang, J.; Xiong, G. Construction of pore structure and lithology of digital rock physics based on laboratory experiments. J. Pet. Explor. Prod. Technol. 2021, 11, 2113–2125. [Google Scholar] [CrossRef]
  22. Fang, H.H.; Xu, H.J.; Sang, S.X.; Liu, S.Q.; Song, S.L.; Liu, H.H. 3D reconstruction of coal pore network and its application in CO2-ECBM process simulation at laboratory scale. Front. Earth Sci. 2022, 16, 523–539. [Google Scholar] [CrossRef]
  23. Zhao, J.Y.; Wang, F.Y.; Cai, J.C. 3D tight sandstone digital rock reconstruction with deep learning. J. Pet. Sci. Eng. 2021, 207, 109020. [Google Scholar] [CrossRef]
  24. Zhou, X.P.; Xiao, N. A hierarchical-fractal approach for the rock reconstruction and numerical analysis. Int. J. Rock Mech. Min. Sci. 2018, 109, 68–83. [Google Scholar] [CrossRef]
  25. Lei, Y. Reconstruction and Analysis of Tight Sandstone Digital Rock Combined with X-Ray CT Scanning and Multiple-Point Geostatistics Algorithm. Math. Probl. Eng. 2020, 2020, 9476060. [Google Scholar] [CrossRef]
  26. Lin, W.; Li, X.; Yang, Z.; Manga, M.; Fu, X.; Xiong, S.; Gong, A.; Chen, G.; Li, H.; Pei, L.; et al. Multiscale Digital Porous Rock Reconstruction Using Template Matching. Water Resour. Res. 2019, 55, 6911–6922. [Google Scholar] [CrossRef]
  27. Gou, B.; Zhan, L.; Guo, J.C.; Zhang, R.; Zhou, C.L.; Wu, L.; Ye, J.X.; Zeng, J. Effect of different types of stimulation fluids on fracture propagation behavior in naturally fractured carbonate rock through CT scan. J. Pet. Sci. Eng. 2021, 201, 108529. [Google Scholar] [CrossRef]
  28. Sun, W.; Hou, K.P.; Yang, Z.Q.; Wen, Y.T. X-ray CT three-dimensional reconstruction and discrete element analysis of the cement paste backfill pore structure under uniaxial compression. Constr. Build. Mater. 2017, 138, 69–78. [Google Scholar] [CrossRef]
  29. Wang, Y.B.; Xiao, J.; Liu, L.P.; Wang, Y. Efficient Rock Mass Point Cloud Registration Based on Local Invariants. Remote Sens. 2021, 13, 1540. [Google Scholar] [CrossRef]
  30. Hu, L.; Xiao, J.; Wang, Y. An automatic 3D registration method for rock mass point clouds based on plane detection and polygon matching. Vis. Comput. 2020, 36, 669–681. [Google Scholar] [CrossRef]
  31. DiFrancesco, P.M.; Bonneau, D.A.; Hutchinson, D.J. Computational Geometry-Based Surface Reconstruction for Volume Estimation: A Case Study on Magnitude-Frequency Relations for a LiDAR-Derived Rockfall Inventory. ISPRS Int. J. Geo-Inf. 2021, 10, 157. [Google Scholar] [CrossRef]
  32. Engin, I.C.; Maerz, N.H.; Boyko, K.J.; Reals, R. Practical Measurement of Size Distribution of Blasted Rocks Using LiDAR Scan Data. Rock Mech. Rock Eng. 2020, 53, 4653–4671. [Google Scholar] [CrossRef]
  33. Voumard, J.; Abellan, A.; Nicolet, P.; Penna, I.; Chanut, M.A.; Derron, M.H.; Jaboyedoff, M. Using street view imagery for 3-D survey of rock slope failures. Nat. Hazards Earth Syst. Sci. 2017, 17, 2093–2107. [Google Scholar] [CrossRef]
  34. Zhang, Y.; Chen, C.; Yin, X.; Chen, J. Subarea Description and Breakage Constitutive Model of Rock Mass Based on CT Test. Buildings 2022, 12, 1232. [Google Scholar] [CrossRef]
  35. Yang, Z.; Linbing, W. Fractal Analysis of Tunnel Structural Damage Caused by High-Temperature and Explosion Impact. Buildings 2022, 12, 1410. [Google Scholar] [CrossRef]
  36. Wang, R.; Wu, H.; Zhao, M.; Liu, Y.; Chen, C. The Classification and Mechanism of Microcrack Homogenization Research in Cement Concrete Based on X-ray CT. Buildings 2022, 12, 1011. [Google Scholar] [CrossRef]
  37. Luo, C.; Zhang, Z.; Lin, D.; Tang, Z. Study of the Impact of Single-and Double-tube Tunnel Systems on Rockburst in Deep-buried Extra-long Tunnelling. Mod. Tunn. Technol. 2022, 59, 28–37. [Google Scholar]
  38. Zhong, W.; Zhang, X.; Li, T.; Yang, X.; Deng, W.; Shi, J. Study on Microscopic Characteristics of Spatial Distribution of Fractures in Deteriorated Sandstone. Geofluids 2022, 2022, 7895498. [Google Scholar] [CrossRef]
Figure 1. (A) SAM-2000 electro-hydraulic servo rock three-axis loading system; (B) GE phoenix v|tome|x s 240 industrial CT scanner.
Buildings 13 02418 g001
Figure 2. (A) The geographical location of Sichuan Province in China; (B) the geographical location of Aba Tibetan and Qiang Autonomous Prefecture in Sichuan Province; (C) the geographical location of Maoxian County in Aba Tibetan and Qiang Autonomous Prefecture; (D) digital elevation map of Maoxian County (2D); (E) digital elevation map of Maoxian County (3D); (F) Ping’an Tunnel; (G) sandstone core; (H) deteriorated sandstone after uniaxial compression; (I) longitudinal section image of passing area of Ping’an Tunnel, its specific location is marked by yellow dotted line in E; and (J) geological Information of the Location of Ping’an Tunnel in Maoxian County.
Buildings 13 02418 g002
Figure 3. (A) CT image of deteriorated sandstone; (B) 2D grayscale image of deteriorated sandstone; (C) binary image of deteriorated sandstone; (D) binary image contour of deteriorated sandstone.
Buildings 13 02418 g003
Figure 4. Surface reconstruction technical process and contour reconstruction technical process.
Buildings 13 02418 g004
Figure 5. (A) Result of surface reconstruction technology based on MATLAB (2D); (B) result of surface reconstruction technology based on MATLAB (3D); (C) result of contour reconstruction technology based on MATLAB (2D); (D) result of contour reconstruction technology based on MATLAB (3D).
Buildings 13 02418 g005
Figure 6. CT image preprocessing result.
Buildings 13 02418 g006
Figure 7. Three-dimensional reconstruction technical process of extracting sandstone internal crack point cloud data.
Buildings 13 02418 g007
Figure 8. (A) Identifying cracks in deteriorated sandstone CT images via MATLAB; (B) extracting the information of cracks via MATLAB; (C) the reconstruction result of two-dimensional point cloud based on MATLAB point cloud reconstruction technology.
Buildings 13 02418 g008
Figure 9. Two-dimensional convex hull of crack point cloud data.
Buildings 13 02418 g009
Figure 10. (A) Three-dimensional point cloud of cracks; (B) 3D convex hull of cracks.
Buildings 13 02418 g010
Figure 11. The specific differences between surface reconstruction technology and contour reconstruction technology in GUI design.
Buildings 13 02418 g011
Figure 12. (A) Structural array; (B) cell array; (C) matrix.
Buildings 13 02418 g012
Figure 13. GUI design interface.
Buildings 13 02418 g013
Figure 14. (A) The structural relation of callback function; (B) running results of GUI.
Buildings 13 02418 g014
Figure 15. (A) Avizo’s reconstruction result for cracks; (B) three-dimensional convex hull reconstruction result of cracks based on MATLAB point cloud reconstruction technology; (C) comparison between the quantity value of pixels of 3D convex hull obtained by point cloud reconstruction technology based on MATLAB and the quantity value of voxels obtained via Avizo.
Buildings 13 02418 g015
Figure 16. (A) The reconstruction result of two-dimensional point cloud based on MATLAB point cloud reconstruction technology; (B) the reconstruction result of two-dimensional convex hull based on MATLAB point cloud reconstruction technology; (C) comparison result of two-dimensional point cloud and two-dimensional convex hull; (D) two-dimensional cracks created using Avizo; (E) comparison of the quantity value of pixels of two-dimensional convex hull and two-dimensional point cloud obtained via MATLAB-based point cloud reconstruction technology with the quantity value of voxels obtained via Avizo. 6. Patents.
Buildings 13 02418 g016
Table 1. Deteriorated sandstone cross-sectional area parameters.
A: Pixel Area of Sandstone Cross-Section (p) A ¯ : Area of Sandstone Cross-Section (mm2)
1,059,4561963.495
Table 2. Crack area.
Drawing NumberB: Crack Pixel Area (p) B ¯ : Crack Area (mm2)
117,513.532.458
218,906.535.04
318,346.534.002
421,628.540.084
520,02337.109
617,133.531.754
719,26235.698
820,84838.638
918,97435.165
1020,54438.074
Average value19,31835.8022
Table 3. Crack volume.
A ¯ : Area of Sandstone Section (mm2)A: Pixel Area of Sandstone Section (p) V b : Pixel Volume of Crack (p) V B :   Volume   of   Crack   ( mm 3 )
1963.4951,059,4562,148,600238.921
Disclaimer/Publisher’s Note: The statements, opinions and data contained in all publications are solely those of the individual author(s) and contributor(s) and not of MDPI and/or the editor(s). MDPI and/or the editor(s) disclaim responsibility for any injury to people or property resulting from any ideas, methods, instructions or products referred to in the content.

