Article

Aesthetic Assessment of Free-Form Space Structures Using Machine Learning Based on the Expert’s Experiences

1
Faculty of Architecture and Urbanism, Tabriz Islamic Art University, Tabriz 5164736931, Iran
2
Faculty of Design, Tabriz Islamic Art University, Tabriz 5164736931, Iran
*
Author to whom correspondence should be addressed.
Buildings 2023, 13(10), 2508; https://doi.org/10.3390/buildings13102508
Submission received: 28 July 2023 / Revised: 26 August 2023 / Accepted: 2 October 2023 / Published: 3 October 2023
(This article belongs to the Special Issue Intelligent and Computer Technologies Application in Construction II)

Abstract

:
Parametric form findings of free-form space structures and qualitative assessment of their aesthetics are among the concerns of architects. This study aims to evaluate the aesthetic aspect of these structures using ML algorithms based on the expert’s experiences. First, various datasets of forms were produced using a parametric algorithm of free-form space structures written in Grasshopper. Then, three multilayer perceptron ANN models were adjusted in their most optimal modes using the results of the preference test based on the aesthetic criteria including simplicity, complexity, and practicality. The results indicate that the ANN models can quantitatively evaluate the aesthetic value of free-form space structures.

1. Introduction

Free-form space structures, a new generation of space-frame structures, are surfaces with double curvature that have no dependence on conventional geometric forms and therefore have a high visual appeal. These structures usually cover large-scale areas without intermediate columns like museums, amphitheaters, mosques, and stadiums. In the last decades, free-form space structures have been considered by architects and structural engineers, due to their high flexibility, great variety, and beauty. Since the function, structure, and form strongly influence each other, both structural engineers and architects must have some degree of communication with each other. Architects can take advantage of the form of these structures for both structural and architectural purposes, especially aesthetic criteria. Aesthetic is a qualitative criterion, and various methods have been used to evaluate such qualitative criteria in architecture. Nowadays, artificial intelligence and machine learning techniques are used in the field of qualitative design. The core capability of machine learning is to discover and reconstruct complex relationships between input and output data from a relatively large data set [1]. Therefore, it can be very useful in both the form-finding of spatial structures and evaluating their aesthetic criteria.
Mirra and Pugnale [2] investigated design spaces created using artificial intelligence and compared their outputs with human-designed spaces. A dataset of 800 maps obtained from 3D models of shell structures was used to train the system. The comparison shows that optimization based on design spaces created by artificial intelligence leads to a greater variety of design outputs than solutions provided by optimization based on human-designed spaces. Furthermore, AI solutions include structural configurations that would not be possible to find in a human-designed space. This indicates one of the main advantages of using artificial intelligence in structural design: the possibility of providing design options beyond those created by human intelligence [3]. Zheng et al. [4] produced a shell structure using graphic statics and then by dividing the force graph and its polyhedral cells using different rules achieved various new structures with different load-bearing capacities and the same boundary conditions. By training an artificial neural network, the model can predict the relationship between input data (subdivision rules) and structural performance and construction constraints. This alternative use of machine learning models to enable rapid exploration of design spaces is one of the important efforts to improve human-machine collaboration. Fuhrimann et al. [5] combined form-finding with machine learning techniques using combinatorial equilibrium modeling (CEM) and self-organizing maps (SOMs). The objective of these studies is to locate a diverse and intricate range of solutions that can be handled more easily by designers. These investigations have emphasized the essential ability of machine learning to detect intricate connections between input and output data and identify correlations between the structure’s form and its performance. Once these correlations are established, structural optimization becomes simpler. [1]. In recent years, machine learning techniques in structural optimization have also increased due to overcoming long-term and complex computations. Aksöz and Preisinger [6] describe a method to optimize free-form spatial structures using machine learning. They designed arbitrary space frame structures and trained the artificial neural network to implement the optimal geometry for each structural node parallel to a given load. Koronaki et al. [7] used machine learning algorithms to determine the requirements of the fabrication process of space-frame structures and then optimize the structure geometrically. Es-Haghi et al. proposed a machine-learning algorithm for the optimization of large-scale space frames in real size with high speed and accuracy.
Machine learning algorithms can assist with the structural design process in more ways than just complex calculations. They can also be used to quantify subjective criteria, such as aesthetics, that are difficult to measure using traditional methods. Belém et al. [8] After discussing the important techniques and areas of machine learning that have been used successfully, finally concluded that aesthetic evaluation is based on culture and changes over time, so it is difficult to achieve with current machine learning techniques. Zheng [9] proposed a method to evaluate polyhedral structures using machine learning and find the highest-scoring forms based on the results of architects’ preference tests. He produced polyhedral structures using the 3DGS method and then asked the architects to select their favorite form from the set of forms several times. After training the machine through the test result, the neural network evaluates the new input form and estimates how much the designers are interested in that form. Petrov et al. [10] employed machine learning methods to investigate how the geometric dimensions of free-form surfaces relate to their aesthetic properties. In addition to structures, research has also been conducted in the field of using machine learning to evaluate the qualitative characteristics of various architectural designs. McCormack and Lomas [11] used Convolutional Neural Networks trained on an individual artist’s previous aesthetic evaluations to assist them in finding more appropriate phenotypes. Li and Chen [12] propose a feature extraction framework for evaluating the visual aesthetic quality of digital images of paintings. They trained the computer to make an identical decision on the visual aesthetic quality of a painting to that created by the bulk of people. Ciesielski et al. [13] found images with high aesthetic value using feature extraction methods from machine learning based on two image databases rated by humans. A number of research studies, referenced as [14,15,16,17,18,19], have been carried out concerning machine learning in relation to free-form surface structures. Some of these articles have emphasized aesthetics as their main area of interest. Although these studies that are related to using machine learning for aesthetic evaluation and structural engineering exist due to the potential to integrate machine learning techniques in different fields of research and the importance of this, there has been no research on the commonality of these three issues. Therefore, the motivation for conducting this research is to develop a methodology for evaluating free-form space frame structures based on the subjective preferences of architectural experts. Free-form space frames are complex structures that require a balance between form and function, making it challenging to find an optimal design. The subjective nature of aesthetic preferences further complicates this process, as architects and designers must balance their personal preferences with functional requirements. The rationale for this research is to provide a data-driven approach to design free-form space frame structures that meet both functional requirements and aesthetic preferences. By collecting data on the subjective preferences of architectural experts, the study aims to develop a methodology for evaluating these structures and streamlining the form selection process. The use of machine learning techniques can further improve the efficiency of this process by predicting the scores that an expert would assign to a given form. Artificial neural networks (ANNs) are one of the most well-known techniques of machine learning for different evaluations and it has been successfully employed in several pieces of research related to aesthetic evaluation based on human experiences [9,11]. But none of them provide sufficient information about the configuration and parameters of the ANN. Therefore, this study will present the procedure to set up an artificial neural network model and its parameters. This study, to the best of the authors’ knowledge, is the first to offer a comprehensive analysis of selecting ANN parameters for the purposes of form finding and evaluating free-form space structures. The study provides guidance on how to set these parameters.
This paper is structured as follows: Section 2 presents the form-finding process of free-form space structures and also the design of the questionnaire related to the preference test based on aesthetic criteria; this section also details the sample and data collection. Section 3 introduces the ANN. In the Section 4, the detailed process of designing and configuring an ANN model is presented. Section 5 includes the discussion about testing the ANN. Section 6 contains the conclusion, the limitations of the study, and an exploration of possible subjects for future research.

2. Research Methodology

The research will utilize a survey methodology to investigate the aesthetic assessment of free-form space structures using machine learning based on experts’ experiences. The study will employ an exploratory approach to identify the parameters required for the machine learning algorithm to evaluate the aesthetic appeal of free-form space structures. Data will be collected through an online survey. The study will use a purposive sampling technique to recruit participants. The participants will be selected based on their expertise in architecture, structural engineering, and aesthetic evaluation. The information obtained from the questionnaire will be used as input data to train the artificial neural network. The artificial neural network will be trained in a step-by-step manner and, finally, it will be tested with the test data. Scheme 1 demonstrates the steps of the proposed method.

2.1. Form Finding of Free-Form Space Structures

Space structures are a very important category of structural system that have been technically developed in recent decades. One of the important features of spatial structures is their geometry. Typically, structures are designed with regular geometry, which offers advantages such as modularity, lower costs, and shorter construction periods. However, regular forms are not always intended. In the modern era, curved forms are more desirable. Therefore, as the order decreases, the cost and construction time increase. In such cases, the geometry of the structure usually becomes more complex, with the overall form containing smaller or free-form components [20]. These innovative forms are called “free form” and are created from the interaction of the structures’ functional requirements and the designers’ art and creativity [21]. In the definition of free forms, if there is no simple mathematical definition to draw the desired form, it is called free form. The new group of space structures possesses the following three characteristics:
  • Great variety of ideals in terms of architecture.
  • The novel behavioral concepts incorporated into these structures capture how uncertain forms affect the structure.
  • The intricate and diverse connection geometry of these structures can create difficulties during their construction [22].
To overcome the complex and interesting geometry of free-form spatial structures, using a mathematical framework with graphic capabilities can be of great help. “Formex Algebra” [23] is a suitable mathematical framework for generating forms according to their geometric properties, and was created by Professor Nooshin and Peter Disney in 1975 [24]. “Formian 2.2” software is used to design two-dimensional and three-dimensional forms based on Formex Algebra and Formian programming language [19].
The three articles published in the International Journal of Space Structures on “Formex Configuration Processing” [23,25,26] are the basic documents on Formex algebra and Formian software. These articles also provide useful information regarding methods of creating space structure configurations. Also, in his article Space Structures and Configuration Processing [27], Professor Nooshin provides useful information about space structures, their types, and their configuration in Formex algebra. The main sources for the design of freeform structures are two papers on Formex Formulation of Freeform Structural Surfaces and Novational Transformations [21,28]. These studies introduce two Formex concepts of “novation” and “pellevation” that are important to produce free forms, and then illustrate the design process of free forms using examples. Learning the Formian programming language is required to use Formex algebra, which can make it challenging to utilize. Nevertheless, the implementation of computer technologies in designing spatial structures enables architects and designers to use more accessible and user-friendly methods. Grasshopper is a parametric design tool and graphical algorithm editor that operates in conjunction with the Rhino 3D modeling program [29]. Due to its graphical interface, it does not need to learn more programming languages. Also, Grasshopper can interface with many other design software and plugins that have already been created [30]. For this reason, Grasshopper for Rhino 6.0 is a suitable environment for converting known coordinate systems from Formex algebra. The combination of Formex algebra and Grasshopper’s parametric workflow makes it possible to easily and quickly design free-form spatial structures in the most optimal state. The paper on Formex Algebra Adaptation into Parametric Design Tools and Rotational Grids describes the adaptation focusing on the applied mathematical solutions [31].
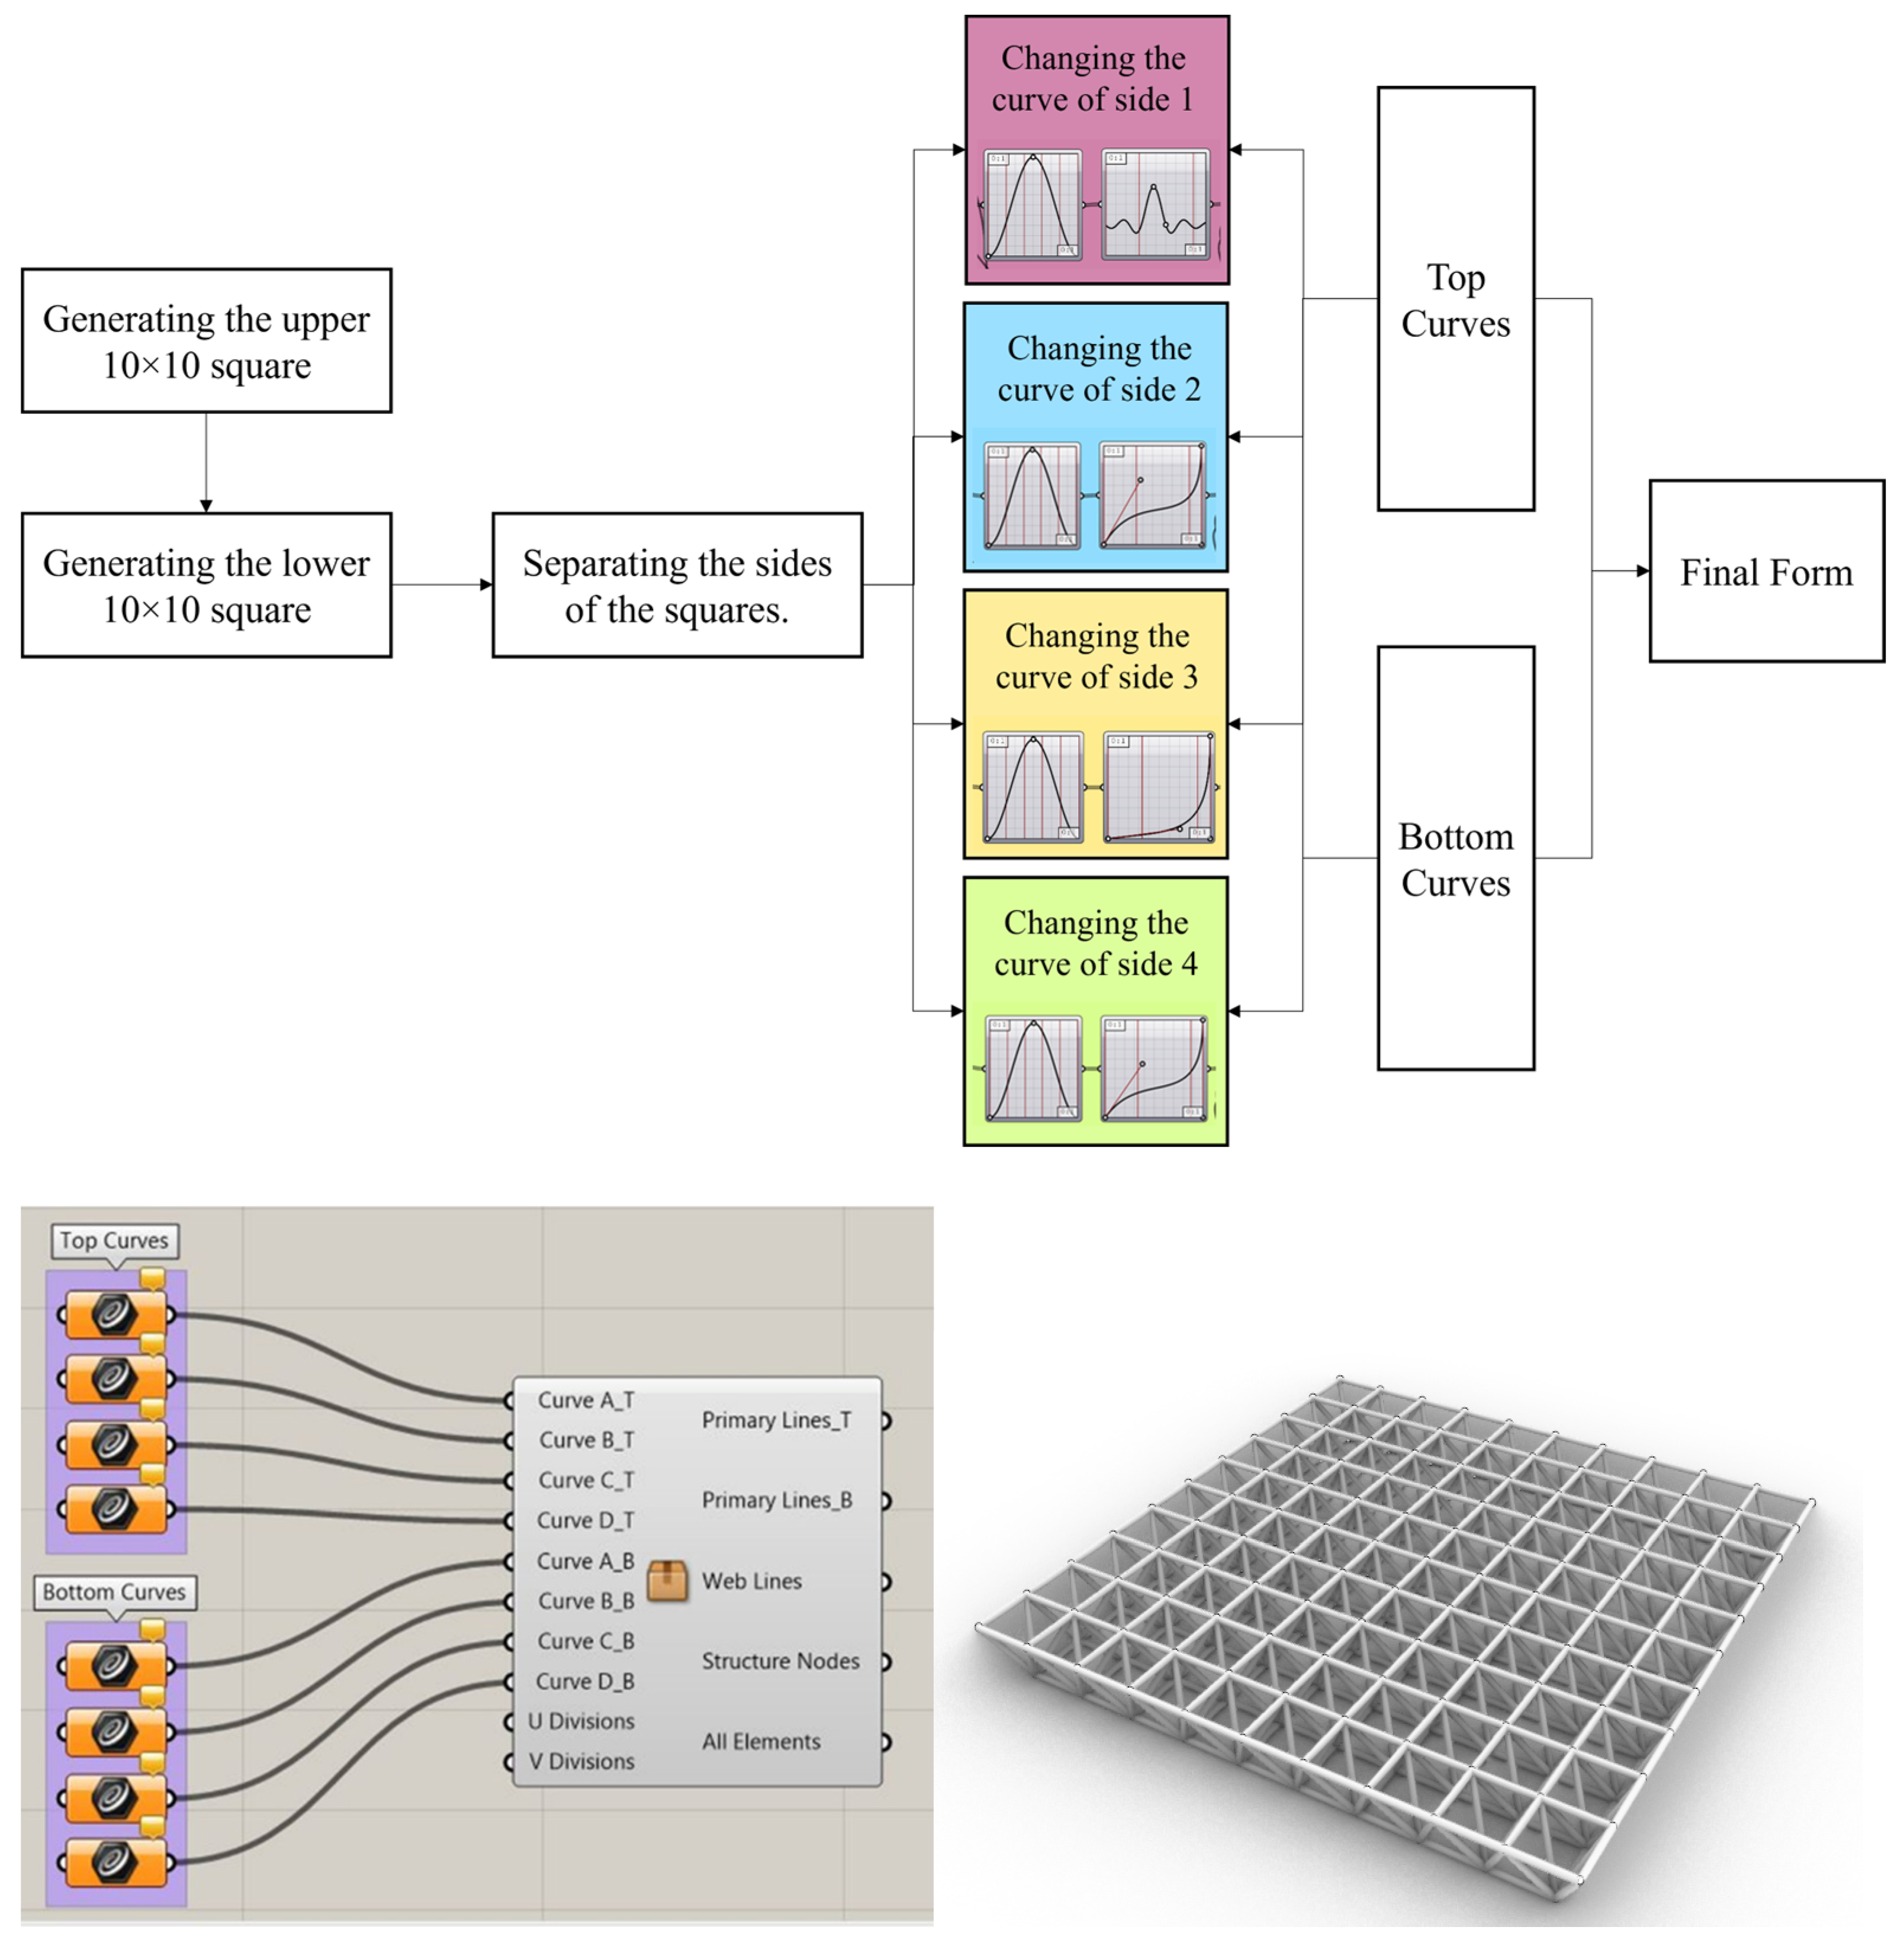
In this research, the parametric design of free-form space structures was carried out using Grasshopper. Since most of the space structures can be obtained from a square-on-square grid space structure, first, a two-layer square-on-square space structure with dimensions of 10 × 10 and 220 nodes was produced as the basic form. A parametric code was written that can assign a curve to each side of the upper and lower square perimeter to generate a new desired form (Figure 1).
The next forms produced based on the basic form are created in two different general states: in the first state, only the square sides of the upper layer can be changed and the lower layer is fixed (Figure 2). In the second case, both layers change simultaneously and parallel to each other (Figure 3). These two categories are also divided into four categories: forms with one curved side, two curved sides, three curved sides, and, finally, four curved sides. In addition to changing forms by curves, it is possible to create various forms by removing nodes in different states or the deformation of nodes. The coding of these changes was also carried out in the Launch Box plugin and applied to previously created forms (Figure 4 and Figure 5).

2.2. Visual Aesthetics and Preference Test

The term “aesthetics” has its roots in the Greek word “aesthesis”, which means sensory perception [32]. As a branch of philosophy, aesthetics is concerned with the nature of beauty and its manifestation in art and the natural world. However, providing a precise and comprehensive definition of aesthetics is challenging. Aesthetic awareness encompasses various interests, feelings, ideals, tastes, perspectives, concepts, and theories. Generally speaking, aesthetics has two components: the “emotional component” and the “intellectual component”. The emotional component is highly subjective, while the intellectual component is less so. The emotional component is the indefinable aspect of our personality that enables us to perceive an object emotionally, while the intellectual component, as a rational aspect, allows us to understand things through reasoning by considering their conditions, limitations, functions, characteristics, and so on [33].
Every day we judge and make decisions about aspects of the world around us based on our internal aesthetic responses [34]. However, beauty is a relative concept. A phenomenon may be beautiful to some people and others may not see it as beautiful. But since the human tendency is always toward beauty, architects and designers have always been trying to present an expression of beauty by using aesthetic criteria in their designs. Order, symmetry, balance, diversity and contrast, repetition, simplicity, complexity, etc., are considered to be aesthetic criteria. Also, because the matching of form and function is always of special importance in architecture, practicality is considered one of the criteria of aesthetics. Since space frame structures are discussed in this research, the criteria of simplicity, complexity, and practicality, which are most related to structures and are easier to evaluate with common sense, were selected. These criteria are defined as below in Scheme 2:
Once a range of free-form space frame structures have been produced, it is necessary to assess them based on expert opinions. Architects take into account visual effects and subjective aesthetic qualities, which are challenging to quantify using a formula. However, machine learning techniques can be utilized to teach the computer to identify connections between various data sets, including the correlation between the forms and scores that reflect the architect’s personal preferences. To train the system and evaluate a form, a survey was created, and architectural experts were asked to complete it to gather training data sets for the artificial neural network.
To prepare the questionnaire, first, a set of 130 free-form space frame structures produced in the previous section were selected for evaluation. However, it can be a challenging and time-consuming task to ask an expert to rate every single one of them. Therefore, instead of asking the respondent to rate 130 forms, the forms were divided into sixty-five categories, each category containing 6 forms (Figure 6). This method allowed participants to focus on a smaller set of forms, reducing the cognitive load of rating a large number of designs. Since three components of aesthetics were considered, this questionnaire had also three categories of questions for each component. There were sixty-five groups consisting of six forms in each category. For each category, the person was asked to choose the desired form among six forms, and for each answer, a score of 0.33 was added to that form. Since each form was shown equally three times (65 × 6 = 390; 390 ÷ 130 = 3), after completing the test, each form had a score of 0, 0.33, 0.66, or 1, which indicated the person’s preference. Each form was shown an equal number of times, ensuring that the rating process was fair and balanced.
To demonstrate the feasibility of machine learning in predicting scores at the following stage, a questionnaire in the form of three sets of questions was given to each respondent. In the first part, candidates were asked to choose the simplest form from their point of view, while in the second part, they were requested to select the most intricate form instead. Then, in the third part, the choice of the most practical form was questioned. The purpose of conducting these three comparative tests was to simplify personal preferences to a degree that made them easier to evaluate using common sense. If the machine learning algorithm accurately assigns a higher score to simple forms in the first part, complex forms in the second part, and practical forms in the third part, it proves the feasibility of the approach.

2.3. Sample and Data Collection

One hundred and forty-one architects and structural engineers answered the questionnaire, and this sample size is sufficient for this research. An examination of the participants’ profiles reveals that the proportion of women in the sample (80.86%) was significantly greater than that of men (19.14%). The participants had a range of educational backgrounds in architectural and structural engineering, with varying levels of familiarity with space structures. The field of study of all participants was architectural and structural engineering in different subfields. For the level of education, respondents with a master’s degree made up 68.10% of the total sample, followed by 21.27% of the total sample with a bachelor’s degree, and the remaining 10.63% had a doctorate. About 29.78% of the participants stated that they were entirely familiar with space structures, 51.08% of the total sample had a large amount of knowledge about space structures, and 19.14% of them had moderate information in this field.
To collect data, the participants were asked to select their preferred form in each category using the method mentioned in the previous section. The participants had a time limit of 30 min to complete the questionnaire. After completing the questionnaire, each participant’s scores for each form regarding the criteria of simplicity, complexity, and practicality were calculated and recorded. Finally, the scores of all participants for the 130 designed structures were collected in an Excel file. These scores were the input data for training the artificial neural network in the next stage.

3. Artificial Neural Networks (ANNs)

ANNs are a commonly used artificial intelligence tool for modeling complex interactions between inputs and outputs. ANNs are widely used in the field of machine learning and have proven to be effective in solving complex problems such as pattern recognition, classification, regression, and optimization [37,38]. At a high level, an ANN consists of interconnected artificial neurons, also known as nodes or units. As depicted in Figure 7, these neurons are organized into layers: an input layer, one or more hidden layers, and an output layer. The input layer receives the raw input data, such as images, text, or numerical values. The output layer produces the final results, which could be predictions, classifications, or any desired output [39,40]. An artificial neuron’s learning ability is obtained by altering the weights in line with the specified learning algorithm [41].
ANNs can be classified into different types based on their architectural characteristics and applications. Some common classifications of artificial neural networks include: feed-forward neural networks (FNNs), Recurrent Neural Networks (RNNs), Convolutional Neural Networks (CNNs), Radial Basis Function Networks (RBFNs), self-organizing maps (SOMs), deep neural networks (DNNs), Modular Neural Networks, Spiking Neural Networks (SNNs), and Autoencoders [41,43,44,45]. In line with the objectives of this study, as in [9], a feed-forward backpropagation multilayer perceptron was used as a model for the basal artificial neural network. Pixel-based CNN and voxel-based three-dimensional CNN, among other neural networks, are not well-suited for learning free-form space structures. A two-dimensional representation is inadequate for these structures, and only a three-dimensional representation can effectively describe them. Each network layer is made up of nodes (neurons) that communicate with neurons in the following layers via synaptic weights that can be adjusted. The signal flow in feed-forward networks is strictly in a feed-forward manner, from input to output nodes. The data processing can span many units, but there are no feedback relationships [39]. In supervised learning networks, like MLP, knowledge is acquired by training the system with specified input and output data [46]. The estimation error, which refers to the disparity between the actual and predicted output, is fed back into the network and employed to modify synaptic weights, thereby reducing and eliminating estimation errors [39].
To use a neural network, the first step is to convert the data into a digitally understandable format for the network. In this study, the coordinates of the points of the structure can be used to build an understandable free-form space structure for the network. Considering that the dimensions of the structures are chosen as 10 × 10, each structure consists of 220 nodes, and this means that for each structure, 660 coordinate numbers (3 × 220) will be entered into each network. The target output data related to each structure in each network only contain a real number that shows the score related to the desired component (simplicity, complexity, and practicality) for a form. Therefore, the input and target output of the network for each form will be according to Relation (1), as below:
Input (I) → Output (O)
I = (x1, y1, z1, x2, y2, z2, …, x220, y220, z220)
O = (o1, o2, o3)
In relationship (1), x1 to z220 contains the coordinates of 220 points of each form, and o1 to o3 contains 3 aesthetic criteria. In network training, instead of one 220 × 3 network, three 220 × 1 networks have been used for ease of work. In fact, there is a network for each aesthetic component.

4. ANN Parameters Selection

The ANN model is complicated, and various parameters must be established for the model to be accurate. In general, there are no specific rules for determining and adjusting the parameters of the artificial neural network model. The crucial parameters in determining the effectiveness of an artificial neural network model include determining the number of hidden layers, the number of neurons within each hidden layer, and selecting the appropriate activation functions for the hidden and output layers. One of the paper’s key goals is to outline the process of choosing neural network parameters for these types of investigations and to make suggestions based on these criteria. The selected options of these parameters, as well as how to select them for all three artificial neural networks, will be analyzed in detail.

4.1. The Number of Hidden Layers

The number of hidden layers required in an artificial neural network is determined by the complexity of the problem being tackled. More complicated neural networks allow for more intricate problem modeling, but they come with a higher computing cost and require more data to train and test. Artificial neural networks can be classified as either shallow, with a single hidden layer, or deep, with two or more hidden layers, based on the number of hidden layers they contain [47]. Deep neural networks are particularly effective in addressing complex challenges that involve vast amounts of unstructured and intricate data. However, according to Negnevitsky’s 2011 research, each continuous function may be modeled just by one hidden layer, and discontinuous functions can be modeled by using two hidden layers [48]. Therefore, multilayer perceptron-based neural networks with more than two hidden layers are rarely utilized for typical structured datasets. This is because more complex models necessitate more data for the purpose of training and testing, and they do not necessarily produce superior outcomes [38]. Using the TensorFlow library, three artificial neural networks were created for each component, one with one hidden layer, the other with two hidden layers, and the last network with three hidden layers, following the study’s objectives and analysis of the number of hidden layers selected. For all three models, the other parameters were adjusted to the same level. To enhance the effectiveness of the training, all input and output data were normalized within the [1, 0] range. To prevent the issue of overfitting, a training set consisting of 70% of the sampled data, a validating set consisting of 10% of the sampled data, and a testing set made up of the remaining 20% of the sampled data were employed. The mean square error (MSE) was determined as the error function to assess the performance of network models, and it is provided in Table 1, Table 2 and Table 3 along with the mean training time for all models. The target networks were optimized using the Adam algorithm. The value of learning rate was set to 0.001 and the value of epochs was also considered to be 50.
As can be easily seen in Table 1, for the neural network related to the simplicity component, the model with two hidden layers has lower MSE values for training, validation, and testing. Based on the sample size and complexity of the research model, it can be inferred that for a trained network based on data related to the simplicity component, the inclusion of two hidden layers leads to better network performance and is thus suggested. According to Table 2, it can be concluded that the neural network related to the complexity component has a lower error rate and better performance in the case where it has two hidden layers.
According to Table 3, it can be seen that this network, like the previous two networks, in a state with two hidden layers, despite the high training time, provides the lowest error and the best performance. The weakest performance of the network is related to the case where the network has a hidden layer. When the error rate of the testing and validation sets is higher than that of the training set, it is indicative of overfitting in this scenario.

4.2. The Number of Hidden Neurons

Selecting the number of neurons in the input and output layers is a straightforward task since these values correspond to the count of the independent and dependent variables (predictors and outputs). On the other hand, determining the appropriate number of neurons in the hidden layer can be difficult as there may be multiple factors to consider, such as the neural network architecture (including the number of hidden layers), sample size, neural network training algorithms, or the selected activation function [49]. As there is no universally accepted method for determining this parameter, the typical approach to assess the network’s performance is to modify the number of hidden neurons through trial and error. The number of neurons in the hidden layer typically has a significant impact on the predictive accuracy of the neural network model, but it may also influence the training speed of the artificial neural network model: in theory, a greater number of hidden neurons should result in more accurate models, but this is only true up to a certain point, beyond which the computational load may increase dramatically [48]. Overfitting is another significant concern. If there are too many hidden neurons, the ANN model may recall all of the training examples and lose its ability to generalize and generate accurate predictions when dealing with data that were not included in the training set. In 2021, Kalinić et al. [38] introduced a formula (Relation (2)) to estimate the optimal number of hidden neurons in their study, which is as follows:
The appropriate number of hidden neurons = [Half of the input data] + 1
In this study, we have 660 input data for each structure in each network. Therefore, according to the aforementioned formula, 331 hidden neurons may be an appropriate number for the current neural network. But since this relationship is only for approximate prediction, in addition to using the number obtained from this relationship, the trial-and-error method has also been used with other values so that we can compare the execution related to the predicted number with the rest of the executions. The number of hidden neurons ranged from 5 to 1000, while the other parameters of the neural network remained constant. Subsequently, ten runs were conducted for each neural network, employing a training set that comprised 90% of the sampled data and a test set consisting of the remaining 10% of the sampled data. Table 4, Table 5 and Table 6 and Figure 8, Figure 9 and Figure 10 illustrate the average MSE values for training, validation and testing, as well as the average training time, for each network. As shown in Figure 8, the average MSE values for all three training, validation, and testing sets have a minimum value for 331 hidden neurons. Also, all three sets are very close to each other, which prevents overfitting. As a result, this value was established as the ultimate parameter. Additionally, as depicted in Figure 8, it is apparent that the training time increases with the rise in the number of hidden neurons and, consequently, the model’s complexity.
According to Table 5, unlike the simplicity network, Relation (2) does not apply. This network has the lowest error in the case where the number of hidden neurons is 15. As shown in Figure 9, with the increase in the number of hidden neurons up to 15, the training time of the network is high, then at the number of 15, the learning time is at a minimum and after that, it increases again. Therefore, based on the low values of the average MSE for all three sets (training, validation, and testing), as well as the training time, it can be inferred that the network performs optimally when it has 15 hidden neurons.
Figure 10 shows that the average MSE values for each training and testing set reach their minimum value when the network has 15 hidden neurons. Furthermore, all three sets are in close proximity to one another, which helps prevent overfitting. As a result, this value was established as the final parameter. Additionally, as demonstrated in Figure 10, the training time increases with the number of hidden neurons and, consequently, the model’s complexity. Additionally, a sudden increase is evident in both graphs when the number of neurons increases from 331 to 500. This leap indicates that a number of neurons above 500 are disproportionate for this network.

4.3. Activation Functions

In a neural network, every neuron computes the weighted sum of input signals, which is then transformed into an output signal via the activation function. While there are numerous types of activation functions in theory, only a limited number of them have practical applications [48]. The unit-step transfer activation function is the most basic and is frequently utilized in classification and pattern recognition problems, but it is not applicable to the issues investigated in this study. The sigmoid function is one of the most prevalent activation functions in feedforward networks, but this research also tested and compared two other activation functions: the ReLu function and the hyperbolic tangent function (Table 7). Since there are three computational layers for neurons (two hidden layers and one output layer), it is necessary to define a distinct activation function for all neurons within each layer. As the ReLu and hyperbolic tangent functions can only be applied in the hidden layers, while the sigmoid function is always employed in the output layer, there are nine combinations of training, testing, and validation sets for each network. Ten runs were once again conducted for each combination, with 90% of the sampled data used for training the neural network and the remaining 10% for testing. In the following, we will examine the average MSE values for different combinations of activation functions for all three components. For the simplicity neural network, the average MSE values for diverse combinations of activation functions in the hidden and output layers are obtained, and only the test results are presented in Table 8. The training time for each combination is also included in Table 9. The minimum mean square error value for the test set is observed when the activation function of the first layer is ReLu and the second layer is hyperbolic tangent, and it is lower than the mean square error value for the test set of other combinations. Furthermore, the mean square error values for all three sets are close to one another, which helps prevent overfitting. As a result, in this network, the ReLu and hyperbolic tangent functions were used for the first and second hidden layers, respectively, while the sigmoid function was utilized for the output layer.
The average MSE values for various combinations of activation functions in the hidden and output layers for the complexity component neural network are shown in Table 10. The training time for each combination is also presented in Table 11. The minimum mean square error value for the test set is observed when the activation function of the first layer is ReLu and the second layer is sigmoid, and it is lower than the mean square error value for the test set of other combinations. Additionally, in this combination, the mean square error values for all three sets are close to one another, which helps prevent overfitting. As a result, in this study, the ReLu and sigmoid functions were employed for the first and second hidden layers, respectively, while the sigmoid function was utilized for the output layer.
The average MSE values for various combinations of activation functions in the hidden and output layers for the practicality neural network are shown in Table 12. The training time for each combination is also presented in Table 13. The minimum mean square error value for the test sets is observed when the activation function of both layers is sigmoid, and it is lower than the mean square error value for other combinations. Additionally, in this combination, the mean square error values for all three sets are close to one another, which helps prevent overfitting. Consequently, in this network, the sigmoid function is utilized for both the hidden layer and the output layer.

4.4. Other Parameters and Final Specification of Neural Networks

The neural network training process also necessitates the adjustment of several other parameters which can have a significant impact on the speed and accuracy of the process. These parameters include the optimization method, loss function, learning rate, and the number of epochs. In this research, the Adam optimization algorithm, mean square error loss function, learning rate 0.001, and 50 epochs were used. Finally, after finding the most optimal state of each neural network, the final specifications of all networks are given in Table 14.

5. Discussion and Results

The primary and most critical objective of this study was to address the challenge of assessing the aesthetic aspect of free-form space structures. By utilizing machine learning algorithms and expert preference test results, the researchers aimed to develop a method that could quantitatively evaluate the qualitative characteristics associated with aesthetics. The results of the study have significant implications and shed light on the assessment of the aesthetic aspect of these complex structures.
Through the successful development of a method that combines machine learning algorithms and expert preference test results, the study showcased a breakthrough in the evaluation of aesthetic qualities. By leveraging the power of machine learning, it became possible to analyze and quantify subjective aesthetic preferences, providing a means to objectively assess the aesthetic appeal of free-form space structures.
The findings of the study hold crucial insights for the field of architectural aesthetics. They illustrate that it is indeed feasible to evaluate qualitative characteristics, such as aesthetics, in a quantitative manner. This represents a significant advancement, as it bridges the gap between subjective perception and objective assessment. The successful utilization of machine learning algorithms and expert preference test results demonstrates the potential for developing reliable and accurate methods to assess the aesthetic aspect of architectural designs.
The implications of this study extend beyond the field of architecture. By showcasing the possibility of quantitatively evaluating aesthetic characteristics, the research contributes to a broader understanding of how machine learning can be applied to subjective domains. This has implications for various industries where subjective evaluations play a crucial role, such as product design, marketing, and user experience.
Overall, the study’s results highlight the significance of combining machine learning algorithms and expert preferences in assessing the aesthetic aspect of free-form space structures. The successful development of a method that enables the quantitative evaluation of qualitative characteristics related to aesthetics opens new avenues for objective assessment in the field of architecture and beyond.
Another significant outcome of the study was the detailed analysis and explanation of the parameter settings for the three artificial neural networks used in the research. This comprehensive exploration of the network configurations added novelty and significance to the article, as no previous studies had delved into such depth. The findings consistently indicated that shallow networks with only two hidden layers achieved the best results across all three networks. This observation suggests that a simpler network architecture can effectively capture the aesthetic aspects of free-form space structures.
Following the configuration of the neural networks, their performance was thoroughly tested to assess their ability to evaluate the aesthetic qualities of free-form space structures. For this purpose, four new structures were specifically created and inputted into the networks for evaluation. The outcomes of this assessment are presented in Table 15, providing a clear overview of the scores assigned by each network to each structure.
Each neural network, having learned from the preference test data, assigned a score ranging between 0 and 1 to each evaluated structure. These scores represented the average potential ratings given by the experts for each specific structure. The assignment of scores by the networks allows architects and designers to gain an estimate of the aesthetic quality associated with a particular structure. This quantitative estimation provides valuable insights that can inform architectural decision-making processes.
The inclusion of Table 15, which presents the assessment outcomes and corresponding aesthetic scores assigned by each network, greatly enhances the value and utility of your research findings. This table serves as a vital tool for architects and designers, providing them with a comprehensive and comparative analysis of the aesthetic qualities associated with various free-form space structures.
By presenting the aesthetic scores in a tabulated format, the research offers a clear and structured overview of the subjective assessments conducted by each network. This enables architects and designers to easily identify patterns, trends, and variations in the perceived aesthetic appeal of different structures. They can readily compare and contrast the scores assigned to specific design elements, such as curvature, symmetry, proportion, and spatial composition, among others.
The availability of this comprehensive comparative analysis empowers architects and designers to make informed decisions during the design process. They can refer to the aesthetic scores provided by the model presented in this research to gain valuable insights into the visual appeal and artistic merit of various design alternatives. Armed with this knowledge, architects and designers can evaluate the potential impact of different design choices on the overall aesthetic experience and make conscious decisions that align with their artistic vision and project objectives.
Furthermore, the inclusion of these aesthetic scores in the research findings not only benefits individual architects and designers but also contributes to the broader architectural community. The availability of such empirical data and comparative analysis serves as a valuable resource for future research, enabling researchers to build upon your work and delve deeper into the understanding of aesthetics in free-form space structures. It fosters a more evidence-based approach to architectural design, allowing the advancement of aesthetic theories and the development of innovative design methodologies.
The presentation of the assessment outcomes in Table 15 significantly enhances the practical applicability of the research. Architects and designers can leverage these aesthetic scores to gain a deeper understanding of the aesthetic appeal of different free-form space structures, facilitating more informed and deliberate design decisions. Moreover, the availability of this comparative analysis contributes to the advancement of the architectural field by providing a valuable resource for further research and exploration of aesthetic principles in design.
Overall, the research findings not only expand our knowledge of aesthetics in free-form space structures but also have the potential to shape the future of architectural design, fostering the creation of visually captivating and artistically meaningful built environments.
In summary, the results of the study validate the developed method’s effectiveness in assessing the aesthetic aspect of free-form space structures. The preference-test-trained neural networks successfully assigned scores to evaluate the aesthetic quality of the structures, providing a quantitative estimate that can assist architects in making informed decisions. The findings also emphasize the importance of network architecture, highlighting that shallow networks with two hidden layers consistently achieved the best results across all three networks. These results contribute to advancing the field of architectural aesthetics and provide practical guidance for professionals in the industry.

6. Conclusions, Limitations, and Future Works

This study presents a simple but powerful artificial intelligence model for evaluating the aesthetic value of free-form space frame structures. The well-defined data structure of these structures enables the artificial neural network to easily comprehend their features and evaluate their form. Conversely, the artificial neural network can learn the design priorities of experts through the preference test administered to them. As a result, this method enables the assessment of the aesthetic quality of designed forms in the three components of simplicity, complexity, and practicality based on the preferences of expert designers. The results indicate that the proposed model can evaluate the qualitative concept of aesthetics. Additionally, the current study presents the step-by-step setup method of an artificial neural network model and the selection of its parameters in the field of aesthetic evaluation. However, the research also has limitations. This research includes a limited number of aesthetic components (simplicity, complexity, and practicality). In future works, more components, such as order, symmetry, and coordination, can be investigated. In addition, there are two other limitations regarding the artificial neural network. First, in this study, only a multilayer perceptron is used as an ANN model. In future works, other types of ANNs can be used and the final results can be compared with each other. Second, in this article, only three activation functions, which are the most important, have been used. Indeed, other well-known activation functions can be used in the hidden and output layers, and the outcomes can be compared to the results obtained in this study. This can help to determine which activation functions are most effective for assessing the aesthetic quality of free-form space structures. Finally, the effect of other parameters of the network, such as epoch, learning rate, and optimization algorithm, on the learning speed of the network and its accuracy could be investigated.

Author Contributions

Conceptualization, S.P.; methodology, Y.S. and S.P.; software, M.G. and Y.S.; validation, M.G. and Y.S.; formal analysis, M.G. and Y.S.; investigation, M.G. and Y.S.; resources, M.G.; data curation; writing—original draft preparation, M.G. and Y.S.; review and editing, S.P. and Y.S.; visualization, M.G. and Y.S.; supervision, Y.S. and S.P.; project administration, S.P. and Y.S. All authors have read and agreed to the published version of the manuscript.

Funding

This research received no external funding.

Data Availability Statement

Not applicable.

Conflicts of Interest

The authors declare no conflict of interest.

References

  1. Liu, F.; Jiang, X.; Wang, X.; Wang, L. Machine learning-based design and optimization of curved beams for multistable structures and metamaterials. Extrem. Mech. Lett. 2020, 41, 101002. [Google Scholar] [CrossRef]
  2. Mirra, G.; Pugnale, A. Comparison between human-defined and AI-generated design spaces for the optimisation of shell structures. Structures 2021, 34, 2950–2961. [Google Scholar] [CrossRef]
  3. Mueller, C.T. Computational Exploration of the Structural Design Space; Massachusetts Institute of Technology: Cambridge, MA, USA, 2014. [Google Scholar]
  4. Zheng, H.; Moosavi, V.; Akbarzadeh, M. Machine learning assisted evaluations in structural design and construction. Autom. Constr. 2020, 119, 103346. [Google Scholar] [CrossRef]
  5. Fuhrimann, L.; Moosavi, V.; Ohlbrock, P.O.; D’acunto, P. Data-driven design: Exploring new structural forms using machine learning and graphic statics. In IASS Annual Symposia; International Association for Shell and Spatial Structures (IASS): Boston, MA, USA, 2018. [Google Scholar]
  6. Aksöz, Z.; Preisinger, C. An Interactive Structural Optimization of Space Frame Structures Using Machine Learning. In Impact: Design with All Senses; Springer International Publishing: Cham, Switzerland, 2020. [Google Scholar]
  7. Koronaki, A.; Shepherd, P.; Evernden, M. Fabrication aware optimization of space-frame structures. In Proceedings of the IASS Annual Symposium 2019—Structural Membranes 2019, Barcelona, Spain, 7–10 October 2019. [Google Scholar]
  8. Belém, C.; Santos, L.; Leitão, A. On the Impact of Machine Learning: Architecture without Architects? In Proceedings of the 18th International Conference CAAD Futures 2019: Hello, Culture! Daejeon, Republic of Korea, 26–28 June 2019. [Google Scholar]
  9. Zheng, H. Form Finding and Evaluating Through Machine Learning: The Prediction of Personal Design Preference in Polyhedral Structures. In Proceedings of the 2019 DigitalFUTURES: The 1st International Conference on Computational Design and Robotic Fabrication (CDRF 2019) 1; Springer: Singapore, 2020; pp. 169–178. [Google Scholar]
  10. Petrov, A.; Pernot, J.-P.; Giannini, F.; Véron, P.; Falcidieno, B. Understanding the relationships between aesthetic properties and geometric quantities of free-form surfaces using machine learning techniques. Int. J. Interact. Des. Manuf. 2020, 14, 451–465. [Google Scholar] [CrossRef]
  11. McCormack, J.; Lomas, A. Understanding Aesthetic Evaluation Using Deep Learning. In Artificial Intelligence in Music, Sound, Art and Design; Springer International Publishing: Cham, Switzerland, 2020. [Google Scholar]
  12. Li, C.; Chen, T. Aesthetic Visual Quality Assessment of Paintings. IEEE J. Sel. Top. Signal Process. 2009, 3, 236–252. [Google Scholar] [CrossRef]
  13. Ciesielski, V.; Barile, P.; Trist, K. Finding Image Features Associated with High Aesthetic Value by Machine Learning. In Evolutionary and Biologically Inspired Music, Sound, Art and Design; Springer: Berlin/Heidelberg, Germany, 2013. [Google Scholar]
  14. Park, S.-W.; Kim, S.-H.; Kim, Y.-I.; Lee, I. Hull Form Optimization Study Based on Multiple Parametric Modification Curves and Free Surface Reynolds-Averaged Navier–Stokes (RANS) Solver. Appl. Sci. 2022, 12, 2428. [Google Scholar]
  15. Bakaev, M.; Khvorostov, V. Quality of Labeled Data in Machine Learning: Common Sense and the Controversial Effect for User Behavior Models. Eng. Proc. 2023, 33, 3. [Google Scholar]
  16. Bodini, M. Will the Machine Like Your Image? Automatic Assessment of Beauty in Images with Machine Learning Techniques. Inventions 2019, 4, 34. [Google Scholar] [CrossRef]
  17. Paroiu, R.; Trausan-Matu, S. Measurement of Music Aesthetics Using Deep Neural Networks and Dissonances. Information 2023, 14, 358. [Google Scholar] [CrossRef]
  18. Peng, H.; Hu, J.; Wang, H.; Ren, H.; Sun, C.; Hu, H.; Li, J. Multiple Visual Feature Integration Based Automatic Aesthetics Evaluation of Robotic Dance Motions. Information 2021, 12, 95. [Google Scholar] [CrossRef]
  19. Xu, L.; Liu, K.; Sang, K.; Lin, G.; Luo, Q.; Huang, C.; Giordano, A. Assessment of the Exterior Quality of Traditional Residences: A Genetic Algorithm–Backpropagation Approach. Buildings 2022, 12, 559. [Google Scholar]
  20. Moghimi, M. Formex Configuration Processing of Compound and Freeform Structures; University of Surrey: Surrey, UK, 2006. [Google Scholar]
  21. Nooshin, H.; Moghimi, M. Formex Formulation of Freeform Structural Surfaces. In Proceedings of the 2nd National Conference on Space Structures, Tehran, Iran, 22 March 2007. [Google Scholar]
  22. Chenaghlou, M.R.; Abedi, K.; Esmailnejad, H. Connection geometry evaluation in free form space structures. In IASS Annual Symposia; International Association for Shell and Spatial Structures (IASS): Surrey, UK, 2020. [Google Scholar]
  23. Nooshin, H.; Disney, P. Formex Configuration Processing I. Int. J. Space Struct. 2000, 15, 1–52. [Google Scholar] [CrossRef]
  24. Tedeschi, A.; Lombardi, D. The algorithms-aided design (AAD). In Informed Architecture; Springer: Berlin/Heidelberg, Germany, 2018; pp. 33–38. [Google Scholar]
  25. Nooshin, H.; Disney, P. Formex Configuration Processing III. Int. J. Space Struct. 2002, 17, 1–50. [Google Scholar] [CrossRef]
  26. Nooshin, H. Space structures and configuration processing. Prog. Struct. Eng. Mater. 1998, 1, 329–336. [Google Scholar] [CrossRef]
  27. Nooshin, H.; Albermani, F.; Disney, P. Novational transformations. In An Anthology Of Structural Morphology; World Scientific: Montpellier, France, 2009; pp. 63–81. [Google Scholar]
  28. McNeel, R. Rhino 6 for Windows. 6 October 2020, Rhinoceros. Available online: https://discourse.mcneel.com/t/rhino-6-service-release-29-available/107685 (accessed on 27 July 2023).
  29. Preisinger, C. Linking structure and parametric geometry. Archit. Des. 2013, 83, 110–113. [Google Scholar] [CrossRef]
  30. Sárközi, R.; Iványi, P.; Széll, A.B. Formex algebra adaptation into parametric design tools and rotational grids. Pollack Period. 2020, 15, 152–165. [Google Scholar] [CrossRef]
  31. Bhise, A.A. Aesthetics in Architecture. Int. J. Eng. Res. 2018, 7, 325–328. [Google Scholar] [CrossRef]
  32. Kulasuriya, C. Aesthetics in Structures. Eng. J. Inst. Eng. Sri Lanka 2005, 38, 45–61. [Google Scholar] [CrossRef]
  33. Palmer, S.E.; Schloss, K.B.; Sammartino, J. Visual aesthetics and human preference. Annu. Rev. Psychol. 2013, 64, 77–107. [Google Scholar] [CrossRef]
  34. Saliklis, E.P.; Bauer, M.; Billington, D.P. Simplicity, scale, and surprise: Evaluating structural form. ASCE J. Archit. Eng. 2008, 14, 25. [Google Scholar] [CrossRef]
  35. De Biagi, V.; Chiaia, B. Complexity of Structures: A Possible Measure and the Role for Robustness; International Association of Fracture Mechanics for Concrete and Concrete Structures (IA-FraMCoS), FraMCoS-8: Toledo, Spain, 2013; pp. 726–734. [Google Scholar]
  36. Chong, A.Y.-L. Predicting m-commerce adoption determinants: A neural network approach. Expert Syst. Appl. 2013, 40, 523–530. [Google Scholar] [CrossRef]
  37. Kalinić, Z.; Marinković, V.; Kalinić, L.; Liébana-Cabanillas, F. Neural network modeling of consumer satisfaction in mobile commerce: An empirical analysis. Expert Syst. Appl. 2021, 175, 114803. [Google Scholar] [CrossRef]
  38. Roman Cardell, J. Python-Based Deep-Learning Methods for Energy Consumption Forecasting; Universitat Politècnica de Catalunya: Barcelona, Spain, 2020. [Google Scholar]
  39. Zhang, G.; Patuwo, B.E.; Hu, M.Y. Forecasting with artificial neural networks: The state of the art. Int. J. Forecast. 1998, 14, 35–62. [Google Scholar] [CrossRef]
  40. Abraham, A. Artificial neural networks. In Handbook of Measuring System Design; Syden-ham, P., Thorn, R., Eds.; John Wiley and Sons Ltd.: London, UK, 2005. [Google Scholar] [CrossRef]
  41. Aghaei, S.; Shahbazi, Y.; Pirbabaei, M.; Beyti, H. A hybrid SEM-neural network method for modeling the academic satisfaction factors of architecture students. Comput. Educ. Artif. Intell. 2023, 4, 100122. [Google Scholar] [CrossRef]
  42. Sharma, S.K.; Sharma, H.; Dwivedi, Y.K. A hybrid SEM-neural network model for predicting determinants of mobile payment services. Inf. Syst. Manag. 2019, 36, 243–261. [Google Scholar] [CrossRef]
  43. Ramchoun, H.; Idrissi, M.J.; Ghanou, Y.; Ettaouil, M. Multilayer Perceptron: Architecture Optimization and training with mixed activation functions. In Proceedings of the 2nd international Conference on Big Data, Cloud and Applications, Tetouan, Morocco, 29–30 March 2017. [Google Scholar]
  44. Suzuki, K. Artificial Neural Networks: Methodological Advances and Biomedical Applications; BoD–Books on Demand: Tokyo, Japan, 2011. [Google Scholar]
  45. Goodfellow, I.; Bengio, Y.; Courville, A. Deep Learning; 1 MIT Press: Cambridge, UK, 2016. [Google Scholar]
  46. Orimoloye, L.O.; Sung, M.-C.; Ma, T.; Johnson, J.E. Comparing the effectiveness of deep feedforward neural networks and shallow architectures for predicting stock price indices. Expert Syst. Appl. 2020, 139, 112828. [Google Scholar] [CrossRef]
  47. Negnevitsky, M. Artificial Intelligence: A Guide to Intelligent Systems; Pearson Education: Toronto, ON, Canada, 2011. [Google Scholar]
  48. Sheela, K.; Deepa, S.N. Review on Methods to Fix Number of Hidden Neurons in Neural Networks. Math. Probl. Eng. 2013, 2013, 425740. [Google Scholar] [CrossRef]
  49. Yoo, Y. Hyperparameter optimization of deep neural network using univariate dynamic encoding algorithm for searches. Knowl.-Based Syst. 2019, 178, 74–83. [Google Scholar] [CrossRef]
Scheme 1. The steps of the proposed method.
Buildings 13 02508 sch001
Figure 1. The code for assigning curves to the sides of squares (left), the basic form, square on square offset grid space structure (right).
Buildings 13 02508 g001
Figure 2. Examples of forms obtained by changing the upper layer: (a) one curved side; (b) two curved sides; (c) three curved sides; and (d) four curved sides.
Buildings 13 02508 g002
Figure 3. Examples of forms obtained with the parallel movement of layers: (a) one curved side, (b) two curved sides, (c) three curved sides, and (d) four curved sides.
Buildings 13 02508 g003
Figure 4. The code and example of the form generated by the node removal code.
Buildings 13 02508 g004
Figure 5. The code and example of the form generated by the node deformation code.
Buildings 13 02508 g005
Scheme 2. Definitions of selected aesthetic criteria [35,36].
Buildings 13 02508 sch002
Figure 6. Example of a category containing six forms in the questionnaire: (a) the basic form; (b) and (c) forms generated by the node removal code; (d) form generated by the node deformation code; (e) form obtained by changing the upper layer in two sides; (f) form obtained by changing the upper layer in all sides and the node removal code.
Buildings 13 02508 g006
Figure 7. Architecture of ANN: The input data are fed into the input layer nodes, processed by the hidden layer nodes, and the node in the output layer generates a recommendation [42].
Buildings 13 02508 g007
Figure 8. (a) Training time; (b) mean square error of training, validation, and testing for different values of hidden neurons in the simplicity network.
Buildings 13 02508 g008
Figure 9. (a) Training time; (b) mean an square error of training, validation, and testing for different values of hidden neurons in the complexity network.
Buildings 13 02508 g009
Figure 10. (a) Training time; (b) mean square error of training, validation, and testing for different values of hidden neurons in the practicality network.
Buildings 13 02508 g010
Table 1. Mean square error values for the simplicity neural network for different values of hidden layers.
ANN ModelMSE-TestingMSE-ValidatingMSE-TrainingTraining Time (s)
One hidden layer0.07400.05590.066512.5
Two hidden layers0.03310.03800.029717.5
Three hidden layers0.07400.05010.066530.8
Table 2. Mean square error values for the complexity neural network for different values of hidden layers.
ANN ModelMSE-TestingMSE-ValidatingMSE-TrainingTraining Time (s)
One hidden layer0.01930.01930.01429.3
Two hidden layers0.01910.01820.018911.2
Three hidden layers0.01970.01710.017712.3
Table 3. Mean square error values for the practicality neural network for different values of hidden layers.
ANN ModelMSE-TestingMSE-ValidatingMSE-TrainingTraining Time (s)
One hidden layer0.01580.01680.00609.8
Two hidden layers0.01150.01400.01089.9
Three hidden layers0.01170.01230.01068.5
Table 4. Mean square error values for the simplicity neural network for different values of hidden neurons.
The Number of Hidden Neurons5101525501002003315001000
MSE-testing0.04130.03670.04170.04490.03570.04260.03830.03220.03360.0387
MSE- validating0.03980.03780.04770.04580.04170.04380.03690.02950.03880.0400
MSE-training0.04120.04070.04250.03940.02880.04920.03150.02990.02240.0400
Training time8.49.810.510.910.612.212.912.313.418.5
Table 5. Mean square error values for the complexity neural network for different values of hidden neurons.
The Number of Hidden Neurons5101525501002003315001000
MSE-testing0.04530.01850.01690.01890.01850.01850.01940.01870.02420.0369
MSE-validating0.05300.01800.01790.01980.02120.01120.01330.01850.02460.0261
MSE-training0.03750.01980.01580.01920.02600.02340.01390.01770.02460.0401
Training time12.111.37.19.29.49.79.510.513.616.1
Table 6. Mean square error values for the practicality neural network for different values of hidden neurons.
The Number of Hidden Neurons5101525501002003315001000
MSE-testing0.01240.01400.01150.01600.01680.01970.02490.02510.03530.0474
MSE- validating0.01370.01810.01400.01930.01830.01260.01540.01220.03030.0309
MSE-training0.01050.01670.01080.01350.01860.01880.02660.01950.03690.0383
Training time7.98.29.910.510.510.511.311.216.816.9
Table 7. Equations related to activation functions.
FunctionEquation
Sigmoid f x = 1 1 + e x
ReLu f x = x + = m a x ( 0 , x )
Hyperbolic Tangent f ( x ) = tanh x = 2 1 + e 2 x 1
Table 8. Mean MSE for the testing set of the simplicity network for different combinations of activation functions.
Second LayerSigmoidReLuHyperbolic Tangent
First Layer
Sigmoid0.03770.03980.0443
ReLu0.02980.03220.0216
Hyperbolic Tangent0.02990.02970.0362
Table 9. Training time for different combinations of simplicity network activation functions.
Second LayerSigmoidReLuHyperbolic Tangent
First Layer
Sigmoid10.110.110.9
ReLu14.812.310.6
Hyperbolic Tangent14.112.413.6
Table 10. Mean MSE for the testing set of the complexity network for different combinations of activation functions.
Second LayerSigmoidReLuHyperbolic Tangent
First Layer
Sigmoid0.01690.02020.0181
ReLu0.01600.02400.0179
Hyperbolic Tangent0.01760.02010.0185
Table 11. Training time for different combinations of complexity network activation functions.
Second LayerSigmoidReLuHyperbolic Tangent
First Layer
Sigmoid7.18.78.7
ReLu8.812.98.3
Hyperbolic Tangent10.49.29.5
Table 12. Mean MSE for the testing set of the practicality network for different combinations of activation functions.
Second LayerSigmoidReLuHyperbolic Tangent
First Layer
Sigmoid0.01150.01610.0150
ReLu0.01830.02590.0258
Hyperbolic Tangent0.02090.03000.0340
Table 13. Training time for different combinations of practicality network activation functions.
Second LayerSigmoidReLuHyperbolic Tangent
First Layer
Sigmoid9.99.113.5
ReLu10.68.510.5
Hyperbolic Tangent10.314.68.1
Table 14. Final specifications of artificial neural networks.
ANNHidden LayersHidden NeuronsOptimization AlgorithmActivation FunctionsLoss FunctionLearning RateEpochs
First LayerSecond Layer
Simplicity2331AdamHyperbolic TangentReLuMSE0.00150
Complexity215AdamSigmoidReLuMSE0.00150
Practicality215AdamSigmoidSigmoidMSE0.00150
Table 15. Artificial neural networks scores given to the new input structures.
Free-Form StructuresNetworks
Simplicity
Score
Complexity
Score
Practicality
Score
Buildings 13 02508 i0010.7260.2780.861
Buildings 13 02508 i0020.3350.6520.874
Buildings 13 02508 i0030.2090.7930.616
Buildings 13 02508 i0040.1830.8470.543
Disclaimer/Publisher’s Note: The statements, opinions and data contained in all publications are solely those of the individual author(s) and contributor(s) and not of MDPI and/or the editor(s). MDPI and/or the editor(s) disclaim responsibility for any injury to people or property resulting from any ideas, methods, instructions or products referred to in the content.

