Article

Pavement Condition Index Model for Mechanistic–Empirical Design of Airport Concrete Pavements Considering Environmental Effects

1
Smart City Industry Support Center, Korea Agency for Infrastructure Technology Advancement, Anyang-si 14066, Republic of Korea
2
Department of Airport, Yooshin Engineering Corporation, Seoul 06252, Republic of Korea
3
Department of Smart City Engineering, Inha University, Incheon 22212, Republic of Korea
4
Department of Civil Engineering, Inha University, Incheon 22212, Republic of Korea
*
Author to whom correspondence should be addressed.
Buildings 2023, 13(10), 2512; https://doi.org/10.3390/buildings13102512
Submission received: 30 August 2023 / Revised: 27 September 2023 / Accepted: 2 October 2023 / Published: 3 October 2023
(This article belongs to the Section Building Materials, and Repair & Renovation)

Abstract

:
A transfer function is the main model of a design program that correlates mechanistically calculated damage to a pavement with the actual field distress. In this study, a pavement condition index (PCI) model that reflects environmental and traffic loads was developed as a transfer function for a design program for airport concrete pavements. Seven runways from five airports in Korea, for which design data were available, were selected as target runways, and their design, traffic, and weather data were collected. The minimum tensile stress of the slab generated by environmental loads and the maximum tensile stress induced by combined environmental and traffic loads were calculated by conducting a three-dimensional finite element analysis. The cumulative fatigue damage to the target runways was calculated by substituting the climatic conditions and traffic volume into the fatigue model, which considered the minimum and maximum tensile stresses. The PCI, which was uniformly and varyingly distributed according to pavement age, was adopted as the indicator of actual field distress, whereas the previously used structural condition index was mostly 100 because no structural distress occurred, regardless of the pavement age. The PCI model was established via multi-regression analysis to predict field PCIs using mechanistically calculated cumulative fatigue damage and pavement age as independent variables. The actual and predicted PCIs of the target airports were compared to validate the PCI model.

1. Introduction

Over the last two decades, the method for designing concrete pavements has changed from an empirical to a mechanistic–empirical approach. The mechanistic–empirical design method simultaneously reflects both environmental and traffic effects, whereas the empirical method considers only the traffic effect. The Korean road-pavement design method developed by the Korean Pavement Research Program (KPRP) [1] and the American road-pavement design method described in the Mechanistic–Empirical Pavement Design Guide [2], among others, now involve designing the pavement thickness mechanistically and empirically by considering the environmental and traffic effects.
The maximum tensile stress of a concrete slab was calculated analytically using Westergaard’s edge-loading theory [3]. The FAA rigid and flexible iterative elastic-layered design (FAARFIELD), which the FAA developed for airport pavement design, calculates the maximum tensile stress at the slab bottom using a subprogram finite element analysis (FEA). The FEAFAA can analyze pavement behavior caused by the effects of environmental loading. However, the mechanistic–empirical design methods, AC 150/5320-6E and AC 150/5320-6F [4,5], which use FAARFIELD as the design program, neglect the effects of environmental loading.
FAARFIELD consists of three main stages: start-up, structure, and aircraft, as shown in Figure 1. The first stage (start-up) generates the task and sets up the pavement type. The second stage (structure) determines the composition of pavement layers, their respective thicknesses, and material properties. The third stage (aircraft) determines the weight of the aircraft, traffic volume, and their parameters [5]. Additionally, notes, options, and aircraft data items support the composition of the three main stages. Thus, in the FAARFIELD composition, no stage or item considers the environmental loading effects.
Environmental effects were ignored even in FAA 150/5320-6F, published in 2016, although the FAA recently updated its pavement design method. Therefore, the Incheon International Airport Corporation and Korea Airports Corporation are developing a mechanistic–empirical method for designing airport concrete pavements that simultaneously reflects the environmental and traffic effects [6]. In this study, a pavement condition index (PCI) model was developed as a transfer function for use in pavement design by correlating mechanistically calculated damage with field distress.

2. Data Collection

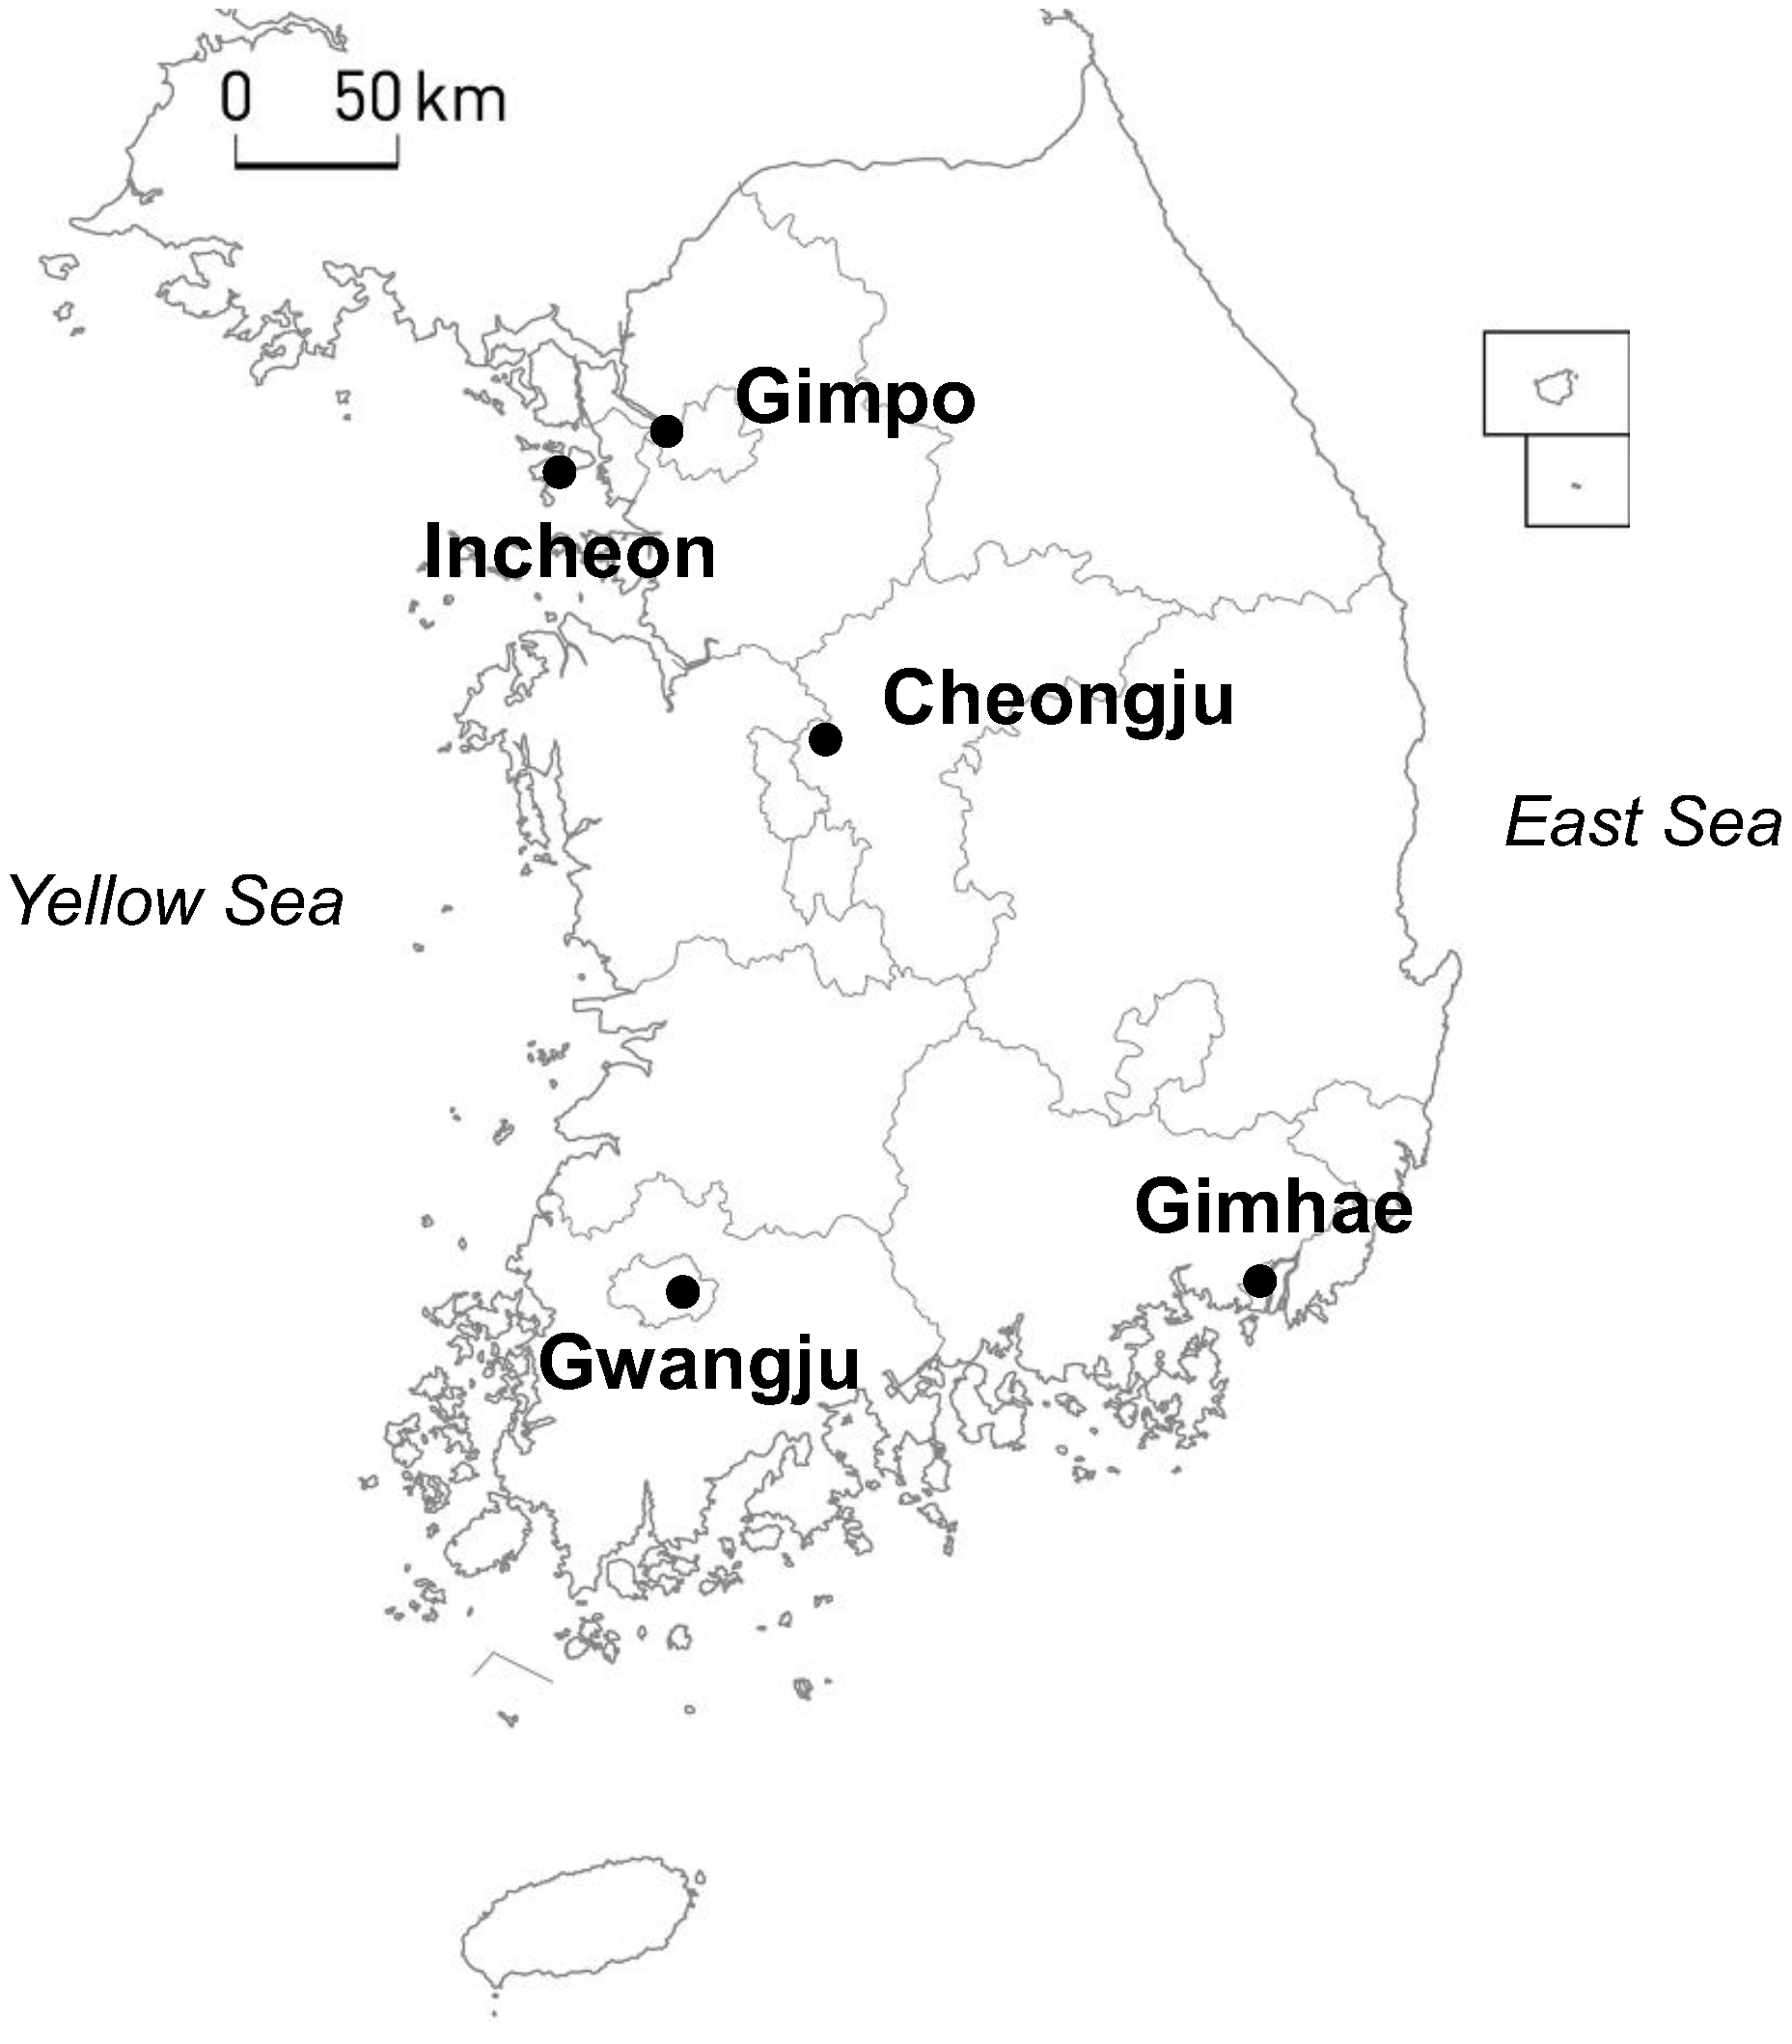
2.1. Determination of Target Airports

The results of a survey of the pavement conditions of civilian airport runways in Korea were collected. In Korea, 15 civilian airports are currently in use, and the pavement conditions of these airports are surveyed every five years. However, most details regarding the pavement design, such as the design aircraft, thickness, and material properties of the pavement layers, are uncertain because most of these airports were constructed before 2000, which was when the pavement management system (PMS) commenced operations. Therefore, among these civilian airports, five were selected as target airports for analysis (Incheon, Gimpo, Cheongju, Gimhae, and Gwangju) because their design information was accessible.
Figure 2 shows the locations of these target airports, and Table 1 lists the information obtained from the pavement condition survey, including the target airports, target runways, survey areas, survey years, and pavement ages. The first and second runways of the Incheon International Airport were analyzed as a single target because they were designed and constructed simultaneously, considering identical features, such as area, pavement structure, thickness, and traffic volume. The old and new runways of Cheongju International Airport were also considered concurrently because they were subjected to similar traffic volumes. The pavement ages of the target runways were widely distributed, from five years for Gwangju International Airport to 34 years for the old runway of Cheongju International Airport; however, the design lifespan of all airports was 20 years.

2.2. Investigation of Pavement Conditions

The Structural Condition Index (SCI) is an indicator used to assess the condition of structures, with its parameters varying based on the characteristics of the structure [7,8]. For airfields, AC 150/5320-6F of the FAA uses the SCI as an indicator of pavement conditions. Figure 3 shows a conceptual scheme of the correlation between the SCI and coverage-expressing traffic volume. Generally, an initial good pavement condition is maintained for a specific period and then rapidly deteriorates from coverage C0. The pavement is damaged when the coverage reaches CF. The FAA has also stated that initial failure occurs in concrete pavements when the SCI decreases to 80 [5].
The FAA recommends that the SCI should be calculated using six types of structural distress from various types of concrete pavement distress, as listed in Table 2.
Conversely, the PCI was calculated using 16 types of concrete pavement distress, as listed in Table 2 [10]. The SCI and PCI were calculated using Equation (1) following the same procedure, although they considered different distress types [4]:
P C I o r   S C I = 100 a i = 1 m j = 1 n f T i , S j , D i j ,
where T i is the deduction value, S j is the severity level of the distress, D i j is the density of the distress, a is an adjustment factor, i is the distress type number, and j is the severity level number.
The survey results should be uniformly and varyingly distributed from good to bad pavement conditions in developing the PCI model, as shown in Figure 3. The distributions of the pavement conditions at the target airports, evaluated based on the SCI and PCI, were compared (Figure 4). The SCI and PCI were calculated for each sample section, generally comprising 20 ± 8 slabs. In this study, the SCI and PCI of 276 sample sections from five target airports were calculated. Among the 276 sample sections, 215 (approximately 80%) yielded an SCI of 100 because they had no structural distress, regardless of the pavement age. Only seven sample sections from the target airport yielded an SCI lower than 80. Conversely, the PCI was relatively distributed uniformly, with 84 sections (approximately 30%) yielding a value lower than 80. Furthermore, experts at the airport PMS verified that the other distress types used for calculating the PCI also affected the deterioration of pavements in addition to the distress types used for calculating the SCI. Therefore, in this study, the PCI was used as an indicator of pavement conditions in developing the PCI model.
Table 3 lists the pavement structure and annual average departures converted to design aircraft for the five target airports. For Cheongju International Airport, no information was provided regarding the design aircraft of the old runway because it was constructed several years ago. However, the two runways at this airport were analyzed as a single target because the pavement thickness, material properties of the pavement layers, traffic volume, and other parameters of the old runway were similar to those of the new runway.
B747, A300, and A330 were used as the design aircraft for the target airports, as listed in Table 3. The main gear type of B747 was double dual tandem (DDT), as shown in Figure 5a,b, and those of A300 and A330 were dual tandem (DT), as shown in Figure 5c,d.
The PCI values for Incheon, Gimpo, and Cheongju International Airports, designed using a B747 with a DDT gear as the design aircraft, were compared based on the converted traffic volume, as shown in Figure 6. The PCI of all the airports decreased as the traffic volume increased. Incheon and Gimpo International Airports, which had similar pavement ages (12–17 years), yielded similar PCI values. This was because the Incheon International Airport had a thicker slab and narrower joint spacing, resulting in a relatively lower maximum tensile stress, although its converted traffic volume was approximately 20 times larger than that of Gimpo International Airport (Table 3). In contrast, Cheongju International Airport, which had the smallest traffic volume, yielded the lowest PCI among the three airports. The runways at Cheongju International Airport were the oldest target runways, as listed in Table 1. Therefore, these runways deteriorated more because of prolonged exposure to the environment. Thus, the PCI of the airport concrete pavements was influenced by various conditions, such as the pavement structure, environmental conditions, pavement age, and traffic volume.

3. Development of PCI Model

A model for predicting the PCI of airport concrete pavements was established, considering various conditions such as the pavement structure, environmental conditions, pavement age, and traffic volume. The procedure for the PCI model development is illustrated in Figure 7. First, regression models predicting the minimum and maximum stresses based on the pavement structure and design of aircraft were developed using 3D FEA results. The cumulative fatigue damage to each sample section in the seven target runways of the five target airports was calculated using stress and air traffic. The PCI model was developed as a function of the cumulative fatigue damage and pavement age.

3.1. Finite Element Model for Predicting Minimum and Maximum Tensile Stress

The minimum and maximum tensile stresses must be predicted to calculate cumulative fatigue damage using a fatigue model. Hence, a 3D FEA was conducted to calculate the minimum tensile stress σmin that develops under environmental loads and the maximum tensile stress σmax that develops under combined environmental and traffic loads. The tensile stress that develops under traffic loads can only be calculated using Equation (2) based on Westergaard’s edge loading theory [3]:
σ e = 3 ( 1 + μ ) ( 3 + μ ) π h 2 ln E c h 3 100 k a 4 + 1.84 4 μ 3 + 1 μ 2 + 1.18 ( 1 + 2 μ ) a l ,
where σ e is Westergaard’s edge-loading stress (MPa), μ is Poisson’s ratio of the concrete slab, E c is the elastic modulus of the concrete slab (MPa), a is the radius of the contact area (mm), and l is the radius of the relative stiffness (mm).
Westergaard’s edge-loading theory cannot be used when traffic loading is induced by environmental loading, which causes curling and warping of the concrete slab [11,12]. Therefore, the minimum tensile stress generated by only environmental loads and the maximum tensile stress generated by simultaneous environmental and traffic loads were calculated using FEA.
A finite element (FE) model of the airport concrete pavement was established to conduct the FEA [13,14]. The FE model comprised nine (3 × 3) or 25 (5 × 5) slabs, an asphalt base, a lean concrete subbase, and a subgrade, as shown in Figure 8. The number of slabs was determined based on the joint spacing. An eight-node incompatible element that exhibited a relatively high accuracy in flexural behavior analyses with a relatively short analysis time was selected to model the slabs [13,15,16]. Furthermore, an eight-node reduced-integration element (C3D8R), relatively less affected by the flexural behavior, was used to model the layers underneath the slabs. The dowel bars connecting the adjacent slabs were simulated by spring connectors using element-type CONN3D2. The stiffness of the spring connector was adjusted such that the load transfer efficiency between adjacent slabs was 85% [15]. The stiffness of the spring connector was predicted based on its relationship with the load transfer efficiency, obtained by simulating the Falling Weight Deflectometer test using the FEA [17]. C3D8I was applied to concrete slab layers. The concrete slab is directly influenced by the loading conditions that generate tensile stress; therefore, the element type efficiently analyzes the flexural behavior of the concrete slab. In addition, C3D8R, the most common element type, was applied to the other layers because it is hardly affected by the flexural behavior that generates the tensile stress.
Table 4 lists the material properties of the pavement layers used in the FEA. The elastic modulus of the concrete slab and the material properties of the lean concrete subbase were determined according to FAA AC 150/5320-6F [5]. The unit weight of the pavement layers and other material properties of the concrete slab, such as Poisson’s ratio and the coefficient of thermal expansion, were determined based on Park et al. [18]. The elastic modulus and Poisson’s ratio of the asphalt base and the material properties of the subgrade were determined based on the Pavement Evaluation Report of Incheon International Airport [19]. The frictional coefficient between the concrete slab and asphalt base was determined based on Park et al. [20], in which the layers beneath the slabs were considered to have completely adhered together and behaved as a single body.
Figure 7. Procedure of PCI model development [20].
Buildings 13 02512 g007
Figure 8. FE model of airport concrete pavement.
Buildings 13 02512 g008
The FEA was conducted to develop a multilinear regression model for the minimum and maximum tensile stresses in the slab. The equivalent linear temperature difference (ELTD) between the top and bottom of the slab and the load on the aircraft gear were used as variables for the FEA to simulate environmental and traffic loads. The slab thickness, joint spacing, and composite modulus of the subgrade reaction beneath the slab were also used as variables in the FEA.
For the environmental loads, an ELTD ranging between −30 and 0 °C was used to consider shrinkage and creep, in addition to the temperature of the concrete pavement [21]. ELTD is the temperature difference between the top and bottom of a slab for which the actual nonlinear vertical temperature distribution can be converted into a mechanistically equivalent linear distribution [22]. The nonlinear vertical shrinkage and creep distributions can be added after converting them into mechanistically equivalent linear temperature distributions. The ELTD of the target airports was calculated using the multilinear regression model expressed by Equation (3) [21]:
T e q = 2.636 h 0.772 × T C m a x 0.105 × R H m i n 0.672 ,
where T e q is the ELTD between the top and bottom of the slab (°C), h is the slab thickness (mm), T C m a x is the maximum monthly average daily temperature variation, and R H m i n is the minimum monthly average relative humidity of the region where the target airport is located.
The tire pressure ranged between 0.91 and 1.64 MPa based on the gear type and the manual provided by each aircraft manufacturer [23,24,25,26,27,28,29,30,31,32,33,34,35,36,37,38,39,40,41,42,43]. The slab thickness ranged from 250 to 500 mm, and the joint spacing was 3.6–7.6 m, according to the airport concrete-pavement structures of Korea and the US [44].
The composite modulus of the subgrade reaction can be calculated based on the thickness and modulus of the sublayers of each airport pavement using the prediction model proposed by the KPRP [1]. Therefore, the composite modulus of the subgrade reaction was limited to between 59.33 and 1220.15 MPa/m, as recommended by KPRP, by varying the sublayers of the FE model (Figure 8).
Figure 9 shows an example of the FEA results under environmental loads only and those under environmental and aircraft loads with DDT or DT gear loads. The minimum tensile stress developed only under the environmental loads, as shown in Figure 9a. The maximum tensile stress was developed by applying an additional aircraft load to the environmental load on the edge of the slab, as shown in Figure 9b,c.
The multilinear regression model of the maximum tensile stress that develops in a slab when environmental and traffic loads are simultaneously applied is expressed by Equation (4), based on the FEA results [13,14]. This model can predict the minimum tensile stress that develops when only environmental loads are applied. Thus, the minimum and maximum tensile stresses required to be input into the fatigue model can be predicted using Equation (4):
σ min o r   m a x = 0.8 × a + b · L + c · H + d · T e q + e · P + f · ( k c ) ,
where L is the joint spacing (m), H is the slab thickness (mm), T e q is the ELTD (°C), P is the tire pressure (MPa), k c is the composite modulus of the subgrade reaction (MPa/m), and a, b, c, d, and e are the regression coefficients. The regression coefficients of the minimum and maximum tensile stress models according to the loading type are listed in Table 5.
The minimum tensile stresses, maximum tensile stresses, and stress ratios of the target airports are listed in Table 6. Incheon, Gimpo, and Cheongju International Airports used a B747 with a DDT gear as their design aircraft. Incheon International Airport, with thicker slabs, underwent lower minimum and maximum tensile stresses than the Gimpo and Cheongju International Airports. Gimpo and Cheongju International Airports, with the same slab thickness of 400 mm, underwent different stresses owing to the differences in joint spacing and sublayer conditions. However, the difference in the stress ratios between the airports was minimal (0.01). Gimhae and Gwangju International Airports used A330 and A300, respectively, with a DT gear as the design aircraft. Gimhae International Airport, with thinner slabs, exhibited higher minimum and maximum tensile stresses than Gwangju International Airport. Gwangju International Airport, which has the same slab thickness as the Gimpo and Cheongju International Airports, underwent lower tensile stress because it was designed for smaller aircraft.

3.2. Fatigue Model

Generally, the tensile stress that develops in a pavement slab when an aircraft moves on it is significantly lower than the tensile strength of the slab. However, concrete subjected to long-term repetitive traffic and environmental loads is damaged by significantly lower tensile stress than its tensile strength because of the gradual development of microcracks [20]. The relationship between the ratio of stress and strength (S) and the number of repetitive loads applied until the concrete is damaged (Nf) is represented by the Wohler curve (also called the S–N curve). This relationship is expressed by Equation (5) [45,46,47]:
S = σ f = a + b log N f ,
where S is the stress–strength ratio of the concrete under repetitive loads, f is the strength, σ is the stress, N f is the fatigue lifespan, and a and b are coefficients determined experimentally.
Many fatigue models have been developed, assuming that the maximum tensile stress ( σ m a x ) of a concrete slab is generated only due to traffic loads, without considering any other type of loading (Figure 10a). However, stress always exists in a slab because the expansion and contraction caused by variations in temperature and humidity are restrained by the self-weight of the slab, dowel bar, tie bar, and friction between the slab and subbase. Therefore, the minimum tensile stress ( σ m i n ) generated owing to the environmental loads was considered in the fatigue test, as shown in Figure 10b.
The effect of minimum tensile stress on the fatigue lifespan of concrete was first demonstrated by Murdock and Kesler [48]. Various fatigue models that consider the minimum stress–maximum stress ratio have been proposed since the 1970s [49,50,51]. In this study, the fatigue models expressed by Equation (6) were used [20,52]:
log N f = a + b × S + c × R ,
where Nf is the allowable number of loading repetitions, S is the stress–strength ratio, R is the minimum stress–maximum stress ratio, and a, b, and c are regression constants with values of 13.291, −12.431, and 2.677, respectively.
The allowable numbers of loading repetitions for the target airports, calculated using Equation (6), are shown in Figure 11. Incheon and Gwangju International Airports, with relatively low stress–strength ratios, exhibited a higher allowable number of loading repetitions than the three other airports.
The cumulative damage was predicted based on age, as shown in Figure 12, using the average annual departures converted for the designed aircraft, as listed in Table 3. The allowable number of loading repetitions for each target airport is shown in Figure 11. The cumulative damage to Gimhae International Airport, which has a relatively thinner pavement than the other target airports, exceeded 1.0 from 12 years of age.

3.3. PCI Model

Cumulative fatigue damage was determined using the ratio of the calculated allowable load repetition to the actual cumulative converted traffic volume. Generally, a pavement with a cumulative fatigue damage value higher than 1.0 is considered to exceed its lifespan. However, the cumulative damage predicted in this study differs from the actual cumulative damage. The predicted cumulative damage should have been calibrated; however, because the pavements were repaired in most cases before they were completely damaged, this was impossible. Therefore, predicted cumulative damage was used as an independent variable in the PCI model without calibration.
The PCI model was established using the exponential function expressed by Equation (7) to predict the decrease in PCI with the variables influencing the PCI.
P C I = 100 e 1 i a i × V i ,
where a i is the regression coefficient, and V i denotes the variables.
The exponential form of Equation (7) is transformed into Equation (8) by obtaining the natural logarithms of both sides, as follows:
ln ( 100 P C I ) = a × D + b × A g e + c ,
where D is the cumulative fatigue damage, “Age” is the pavement age, and a , b , and c are the regression coefficients.
Using IBM SPSS, a regression analysis was conducted for the data of all sample sections of the target airports based on the correlation between the PCI, pavement age, and cumulative fatigue damage of the airport concrete pavement. An extremely low value of 10−5 was subtracted from the PCI during the regression analysis because Equation (8) cannot be used to analyze an initial PCI of 100. The scale of each variable changed significantly when the natural logarithm was applied to both sides of Equation (7). Thus, the results of the multilinear regression analyses were corrected, improving the accuracy. The regression coefficients that minimized the variance between the predicted and actual PCIs were determined via repetitive multilinear regression analyses while varying the regression coefficients. The final PCI model is expressed by Equation (9), derived by eliminating the natural logarithm on both sides of Equation (8).
P C I = 100 e a × D + b × A g e + c .
In Equation (9), the values of regression coefficients a, b, and c were 0.21308, 0.04692, and 1.93665, respectively.
The PCIs of the concrete pavements for the five target airports predicted using the PCI model (Equation (9)) were compared with the actual PCIs. The coefficient of determination (R2) between the predicted and measured PCIs was relatively high (R2 = 0.621) (Figure 13).
Figure 14 shows a comparison between the actual PCIs of the target runways measured according to the pavement age and those predicted using the proposed PCI model. The average PCI values of the first and second runways at Incheon International Airport were compared with the predicted PCI values. The predicted PCI values exceeded the measured PCI values by one for pavement aged 14 and 17 years. The actual PCI at a pavement age of 13 years for Gimpo International Airport, which was subjected to significant early distress, was lower than the predicted PCI by 12, which ignored early distress. The runway of Gwangju International Airport, which had the lowest pavement age of five years, maintained a PCI of 100, indicating an excellent condition, whereas the predicted PCI decreased to 91. However, the remaining eight measured PCI values were equal to or close to the predicted PCI values.
The PCI values for the seven target runways from the five target airports were predicted according to pavement age using the PCI model, as shown in Figure 15. Overall, the PCI model satisfactorily predicted the PCI, except for Gimpo International Airport (pavement age of 13 years), for which the measured PCI was lower because of early distress. In Korea, airports with a PCI below 70 are considered to have poor pavement properties and, thus, require large-scale repairs [53]. Therefore, a PCI of 70 was used as the lower limit for the large-scale repair work in this study. The PCI values for the four target airports, except for the Gimhae International Airport, which has a relatively thin slab of 350 mm thickness, are expected to decrease below 70 after a pavement age of 30–35 years. However, their design lifespan is 20 years. In 2013, the measured PCI of the old runway of the Cheongju International Airport was 69 at a pavement age of 34 years, which is close to the predicted PCI value, as shown in Figure 15c. The runway was repaved in 2017, as repaving was planned immediately after the 2013 pavement condition survey.

4. Conclusions

This study proposes a PCI model that enables the correlation of mechanistically calculated pavement damage with actual field pavement conditions for application in the mechanical–empirical design of airport concrete pavements as a transfer function.
(1)
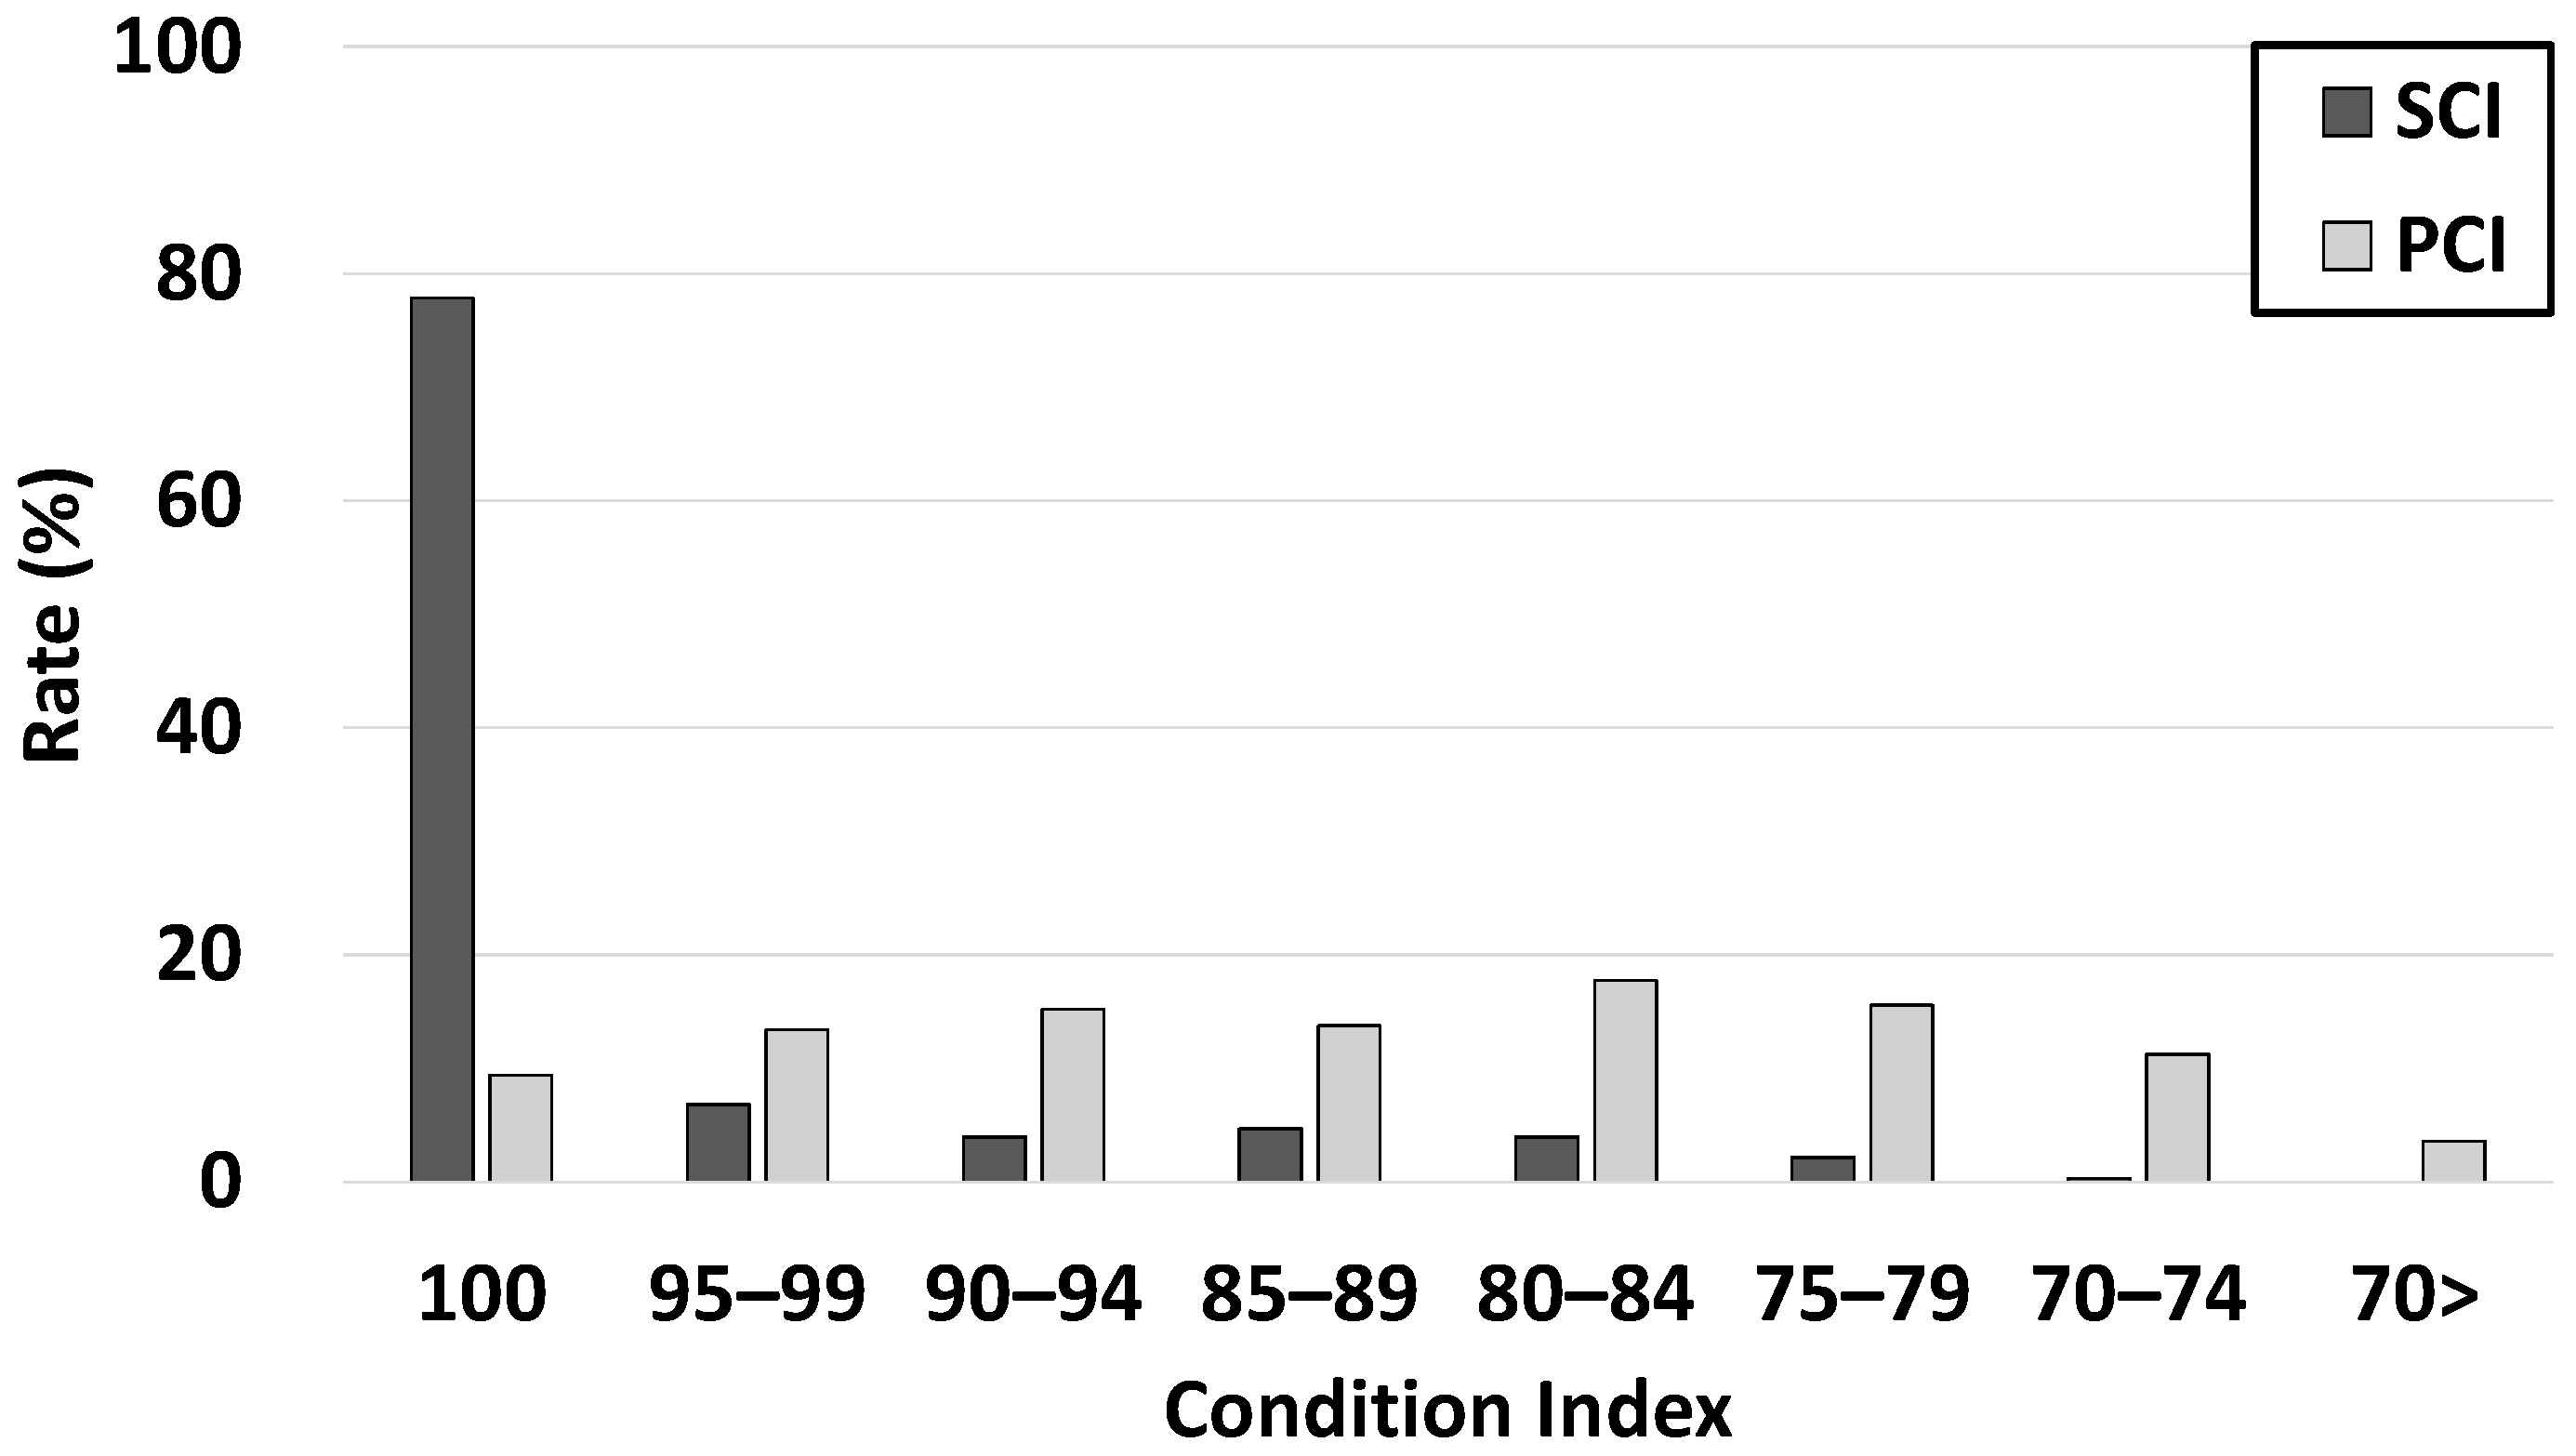
Survey results for the pavement conditions of seven target runways were collected from five target airports, for which information regarding pavement design was accessible. Most sample sections yielded an SCI of 100 regardless of the pavement age. Therefore, the PCI, which exhibited uniformly varying distributions according to the pavement age, was used as an indicator of the pavement conditions to establish the PCI model.
(2)
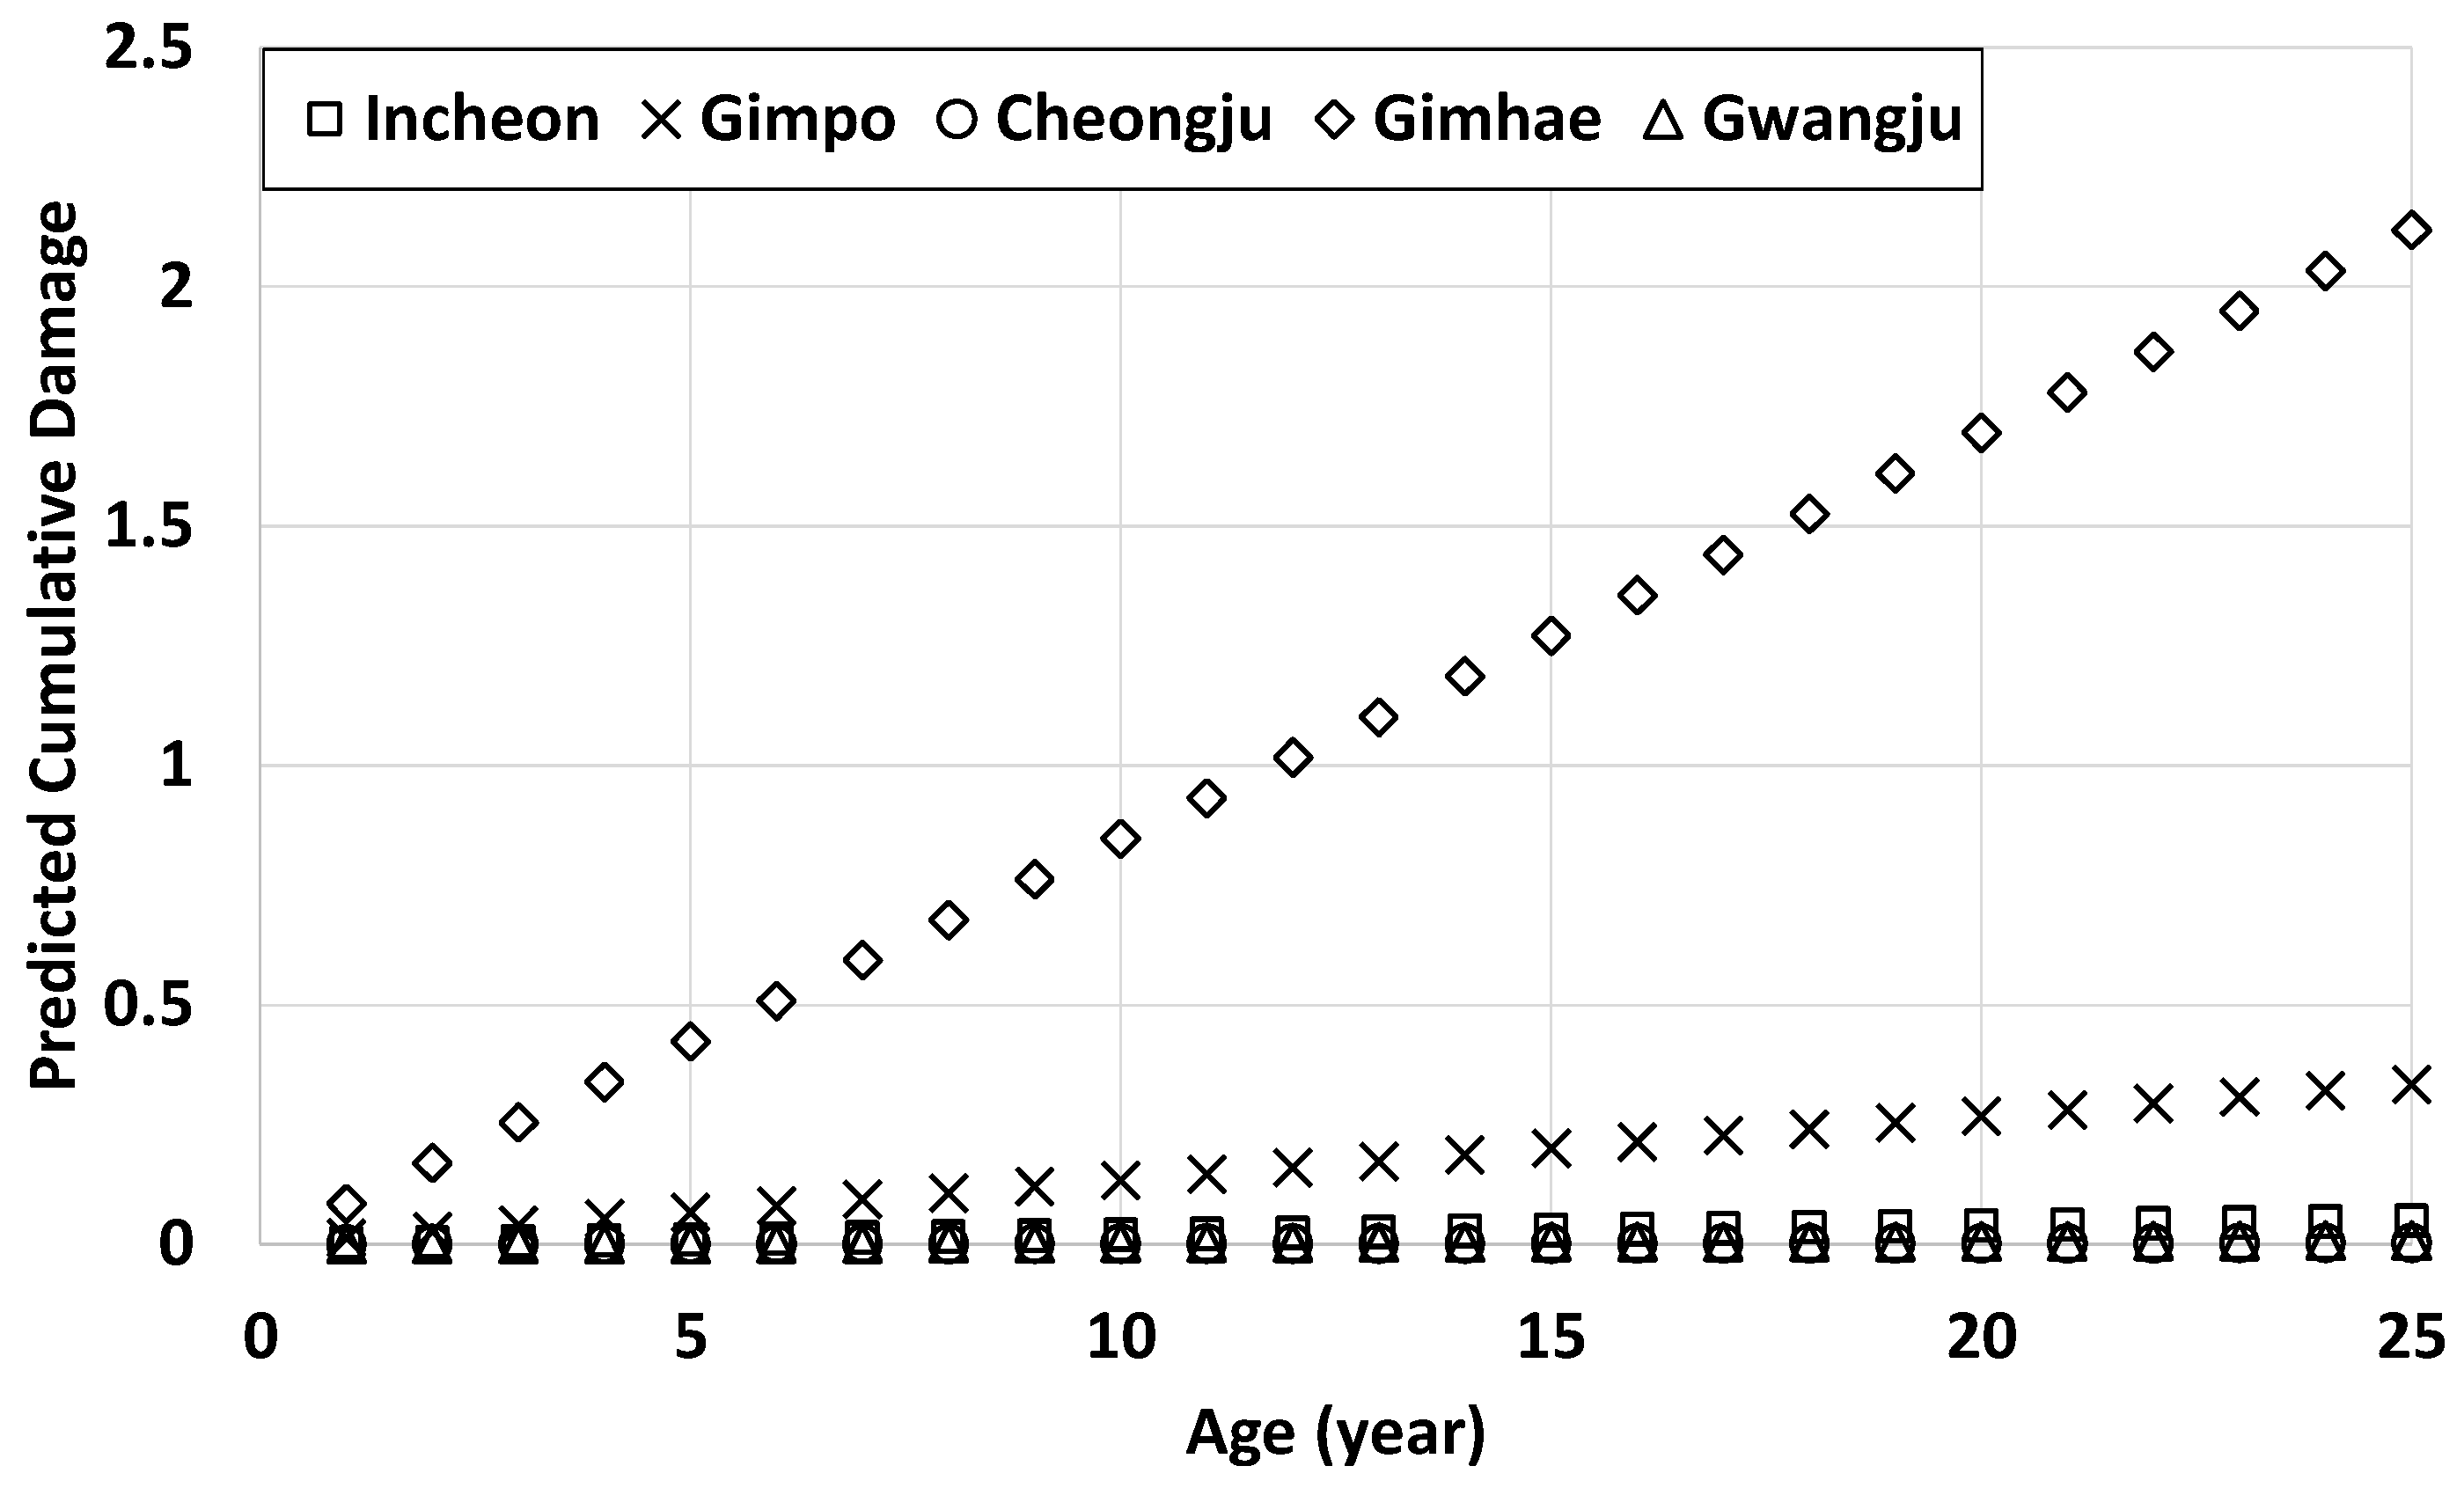
A fatigue model reflecting the minimum tensile stress generated by only the environmental loads and the maximum tensile stress from combined environmental and traffic loads was used to predict the fatigue damage.
(3)
Moreover, a 3D FEA was conducted to calculate the minimum and maximum tensile stresses induced by the environmental and traffic loads. Additionally, a multilinear regression model based on the FEA results was developed to determine the minimum and maximum tensile stresses to be used as input variables for the fatigue model.
(4)
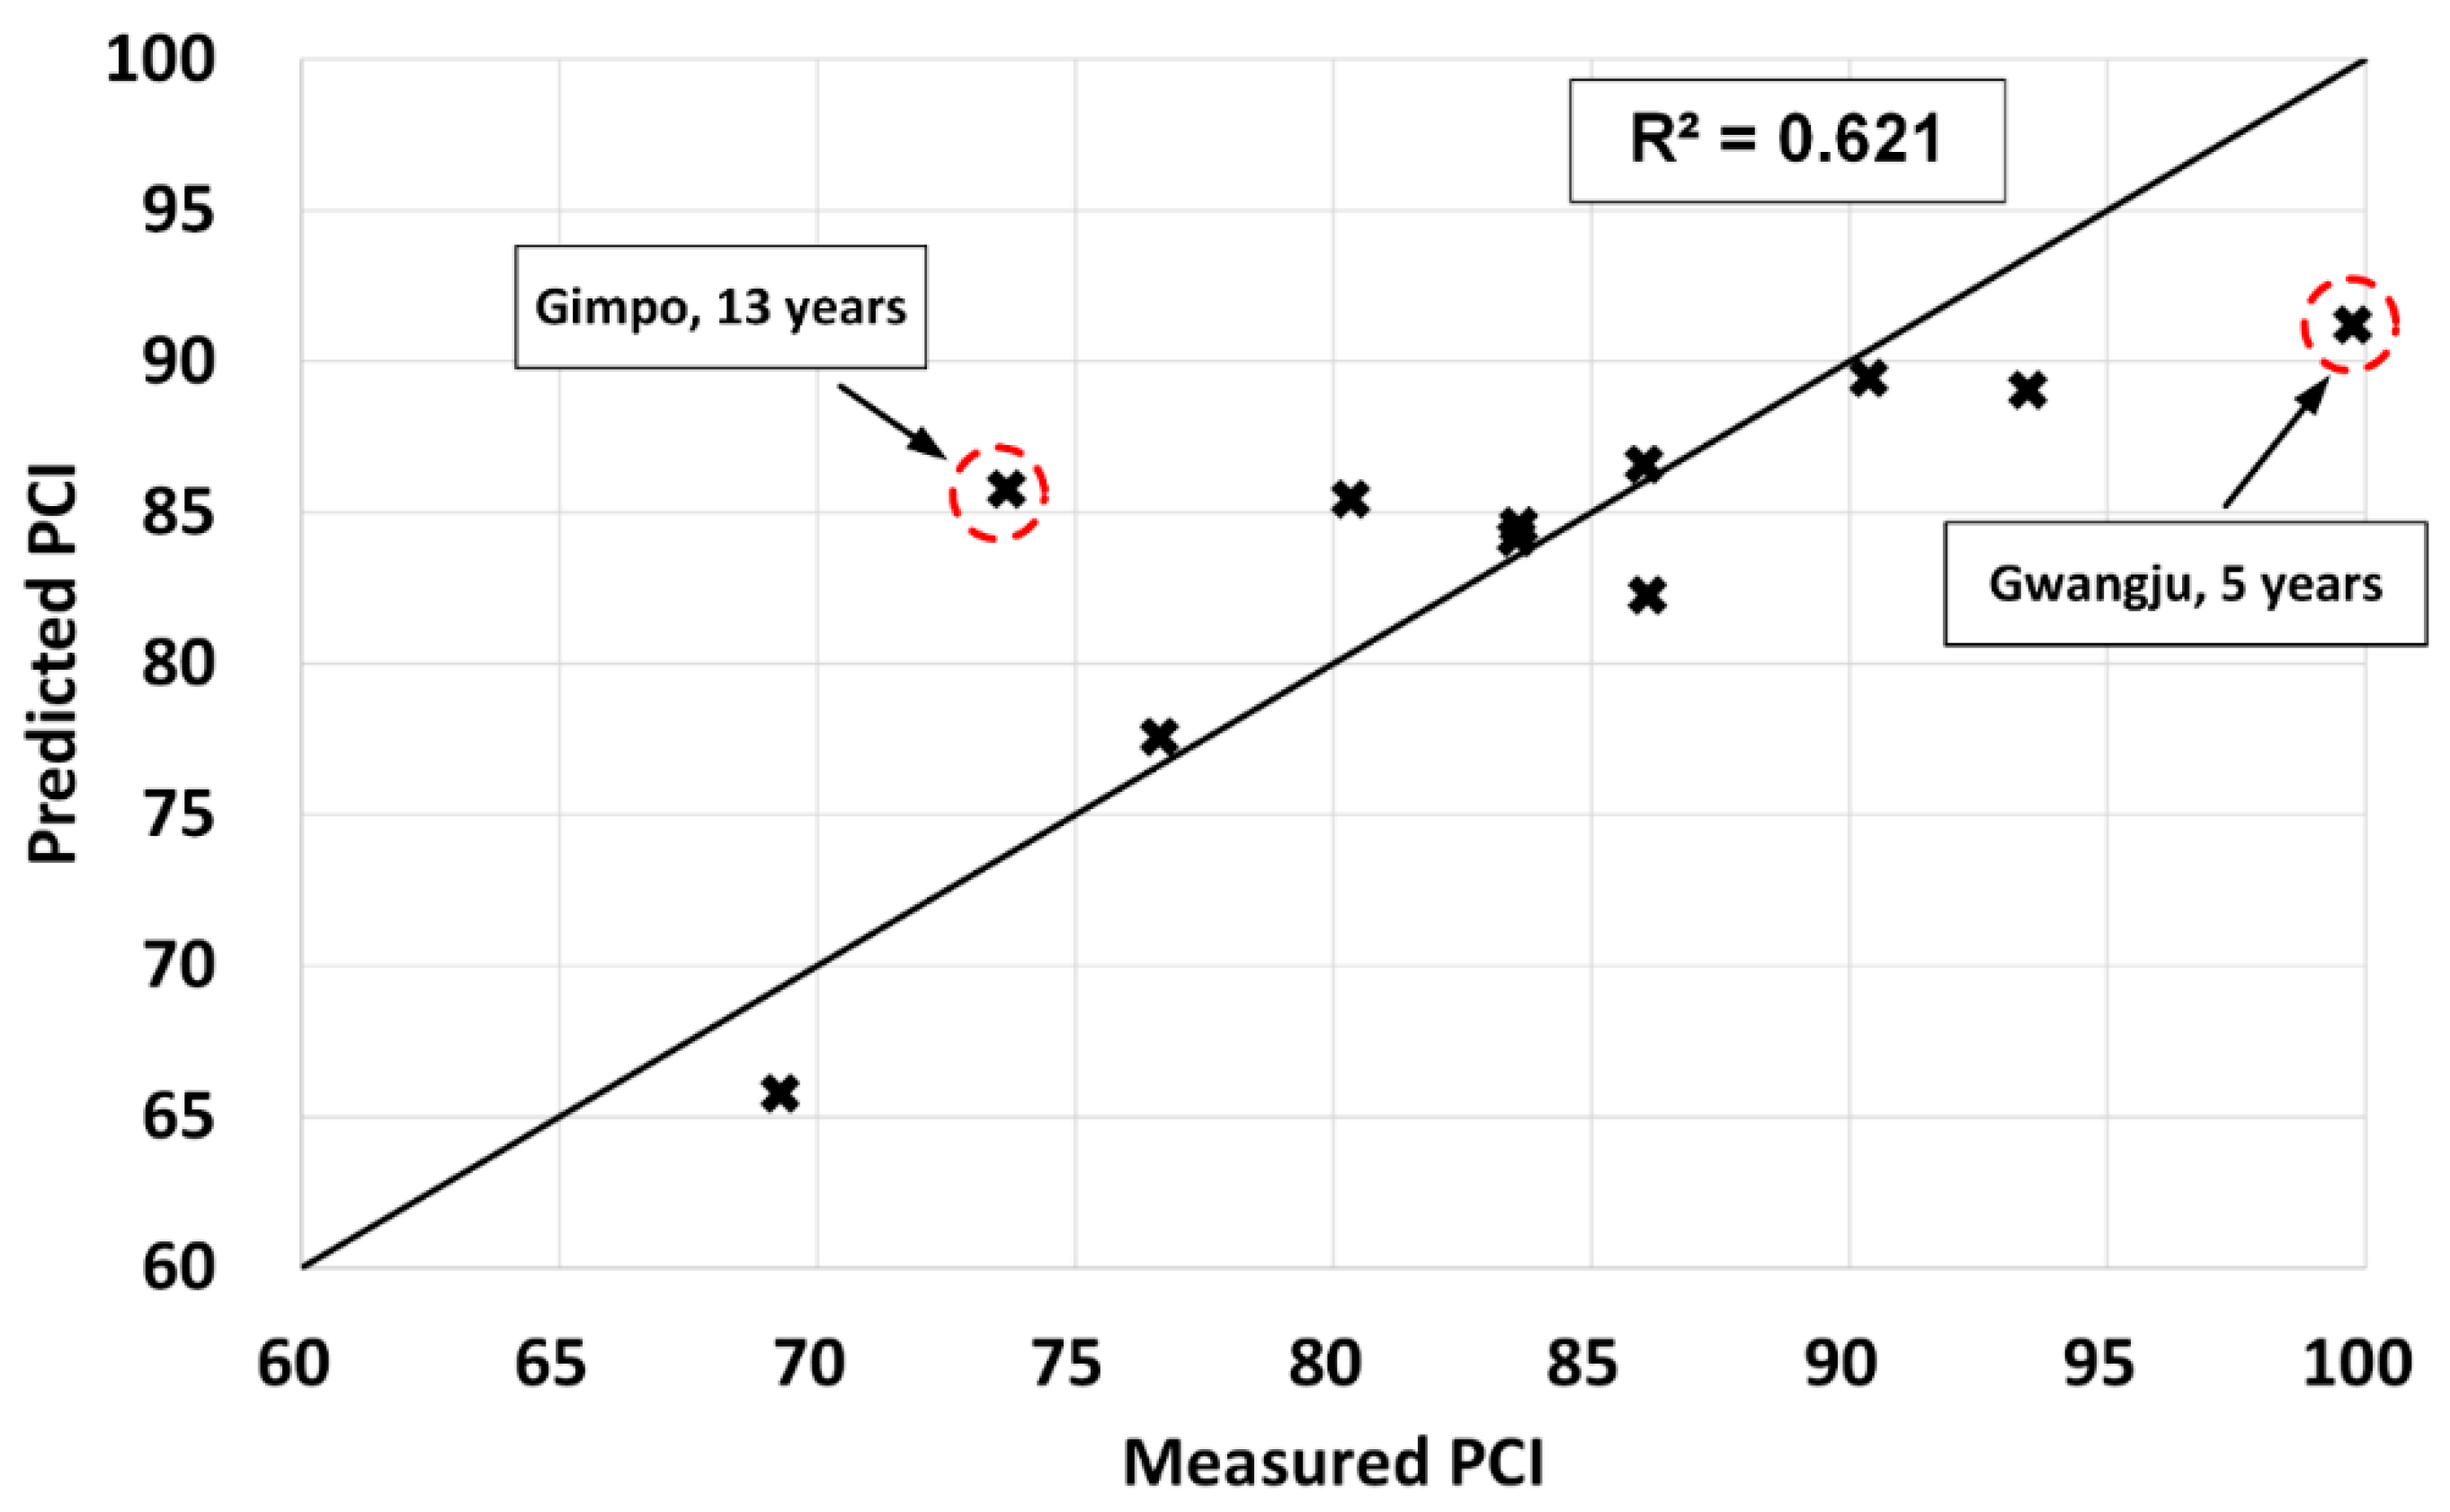
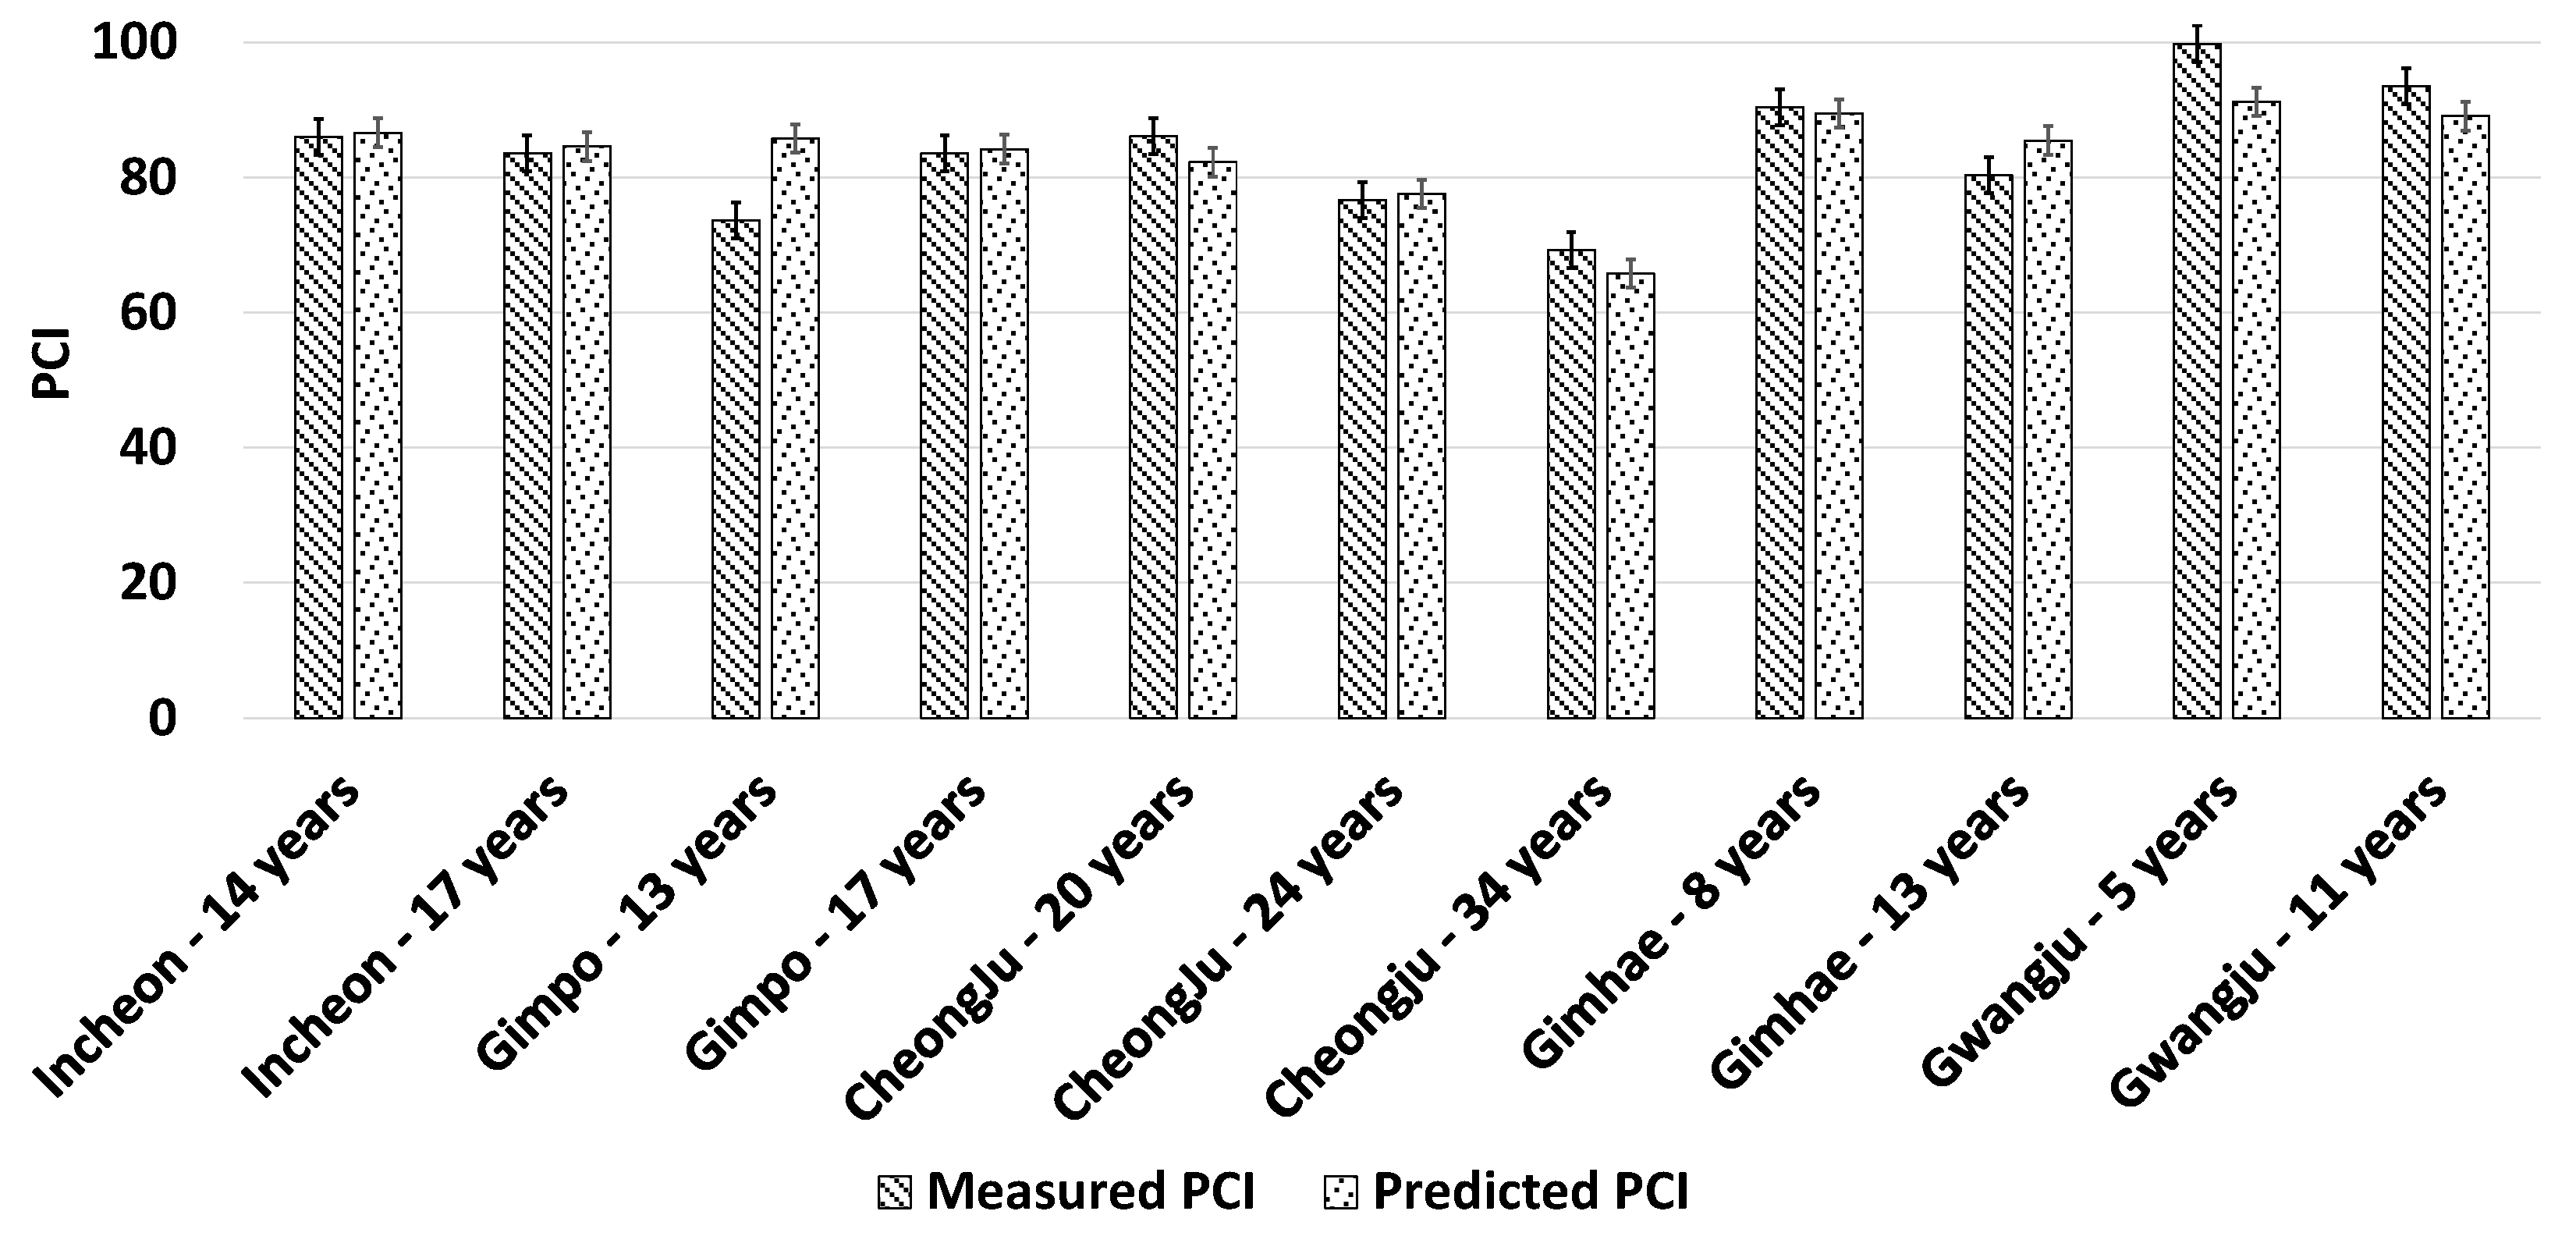
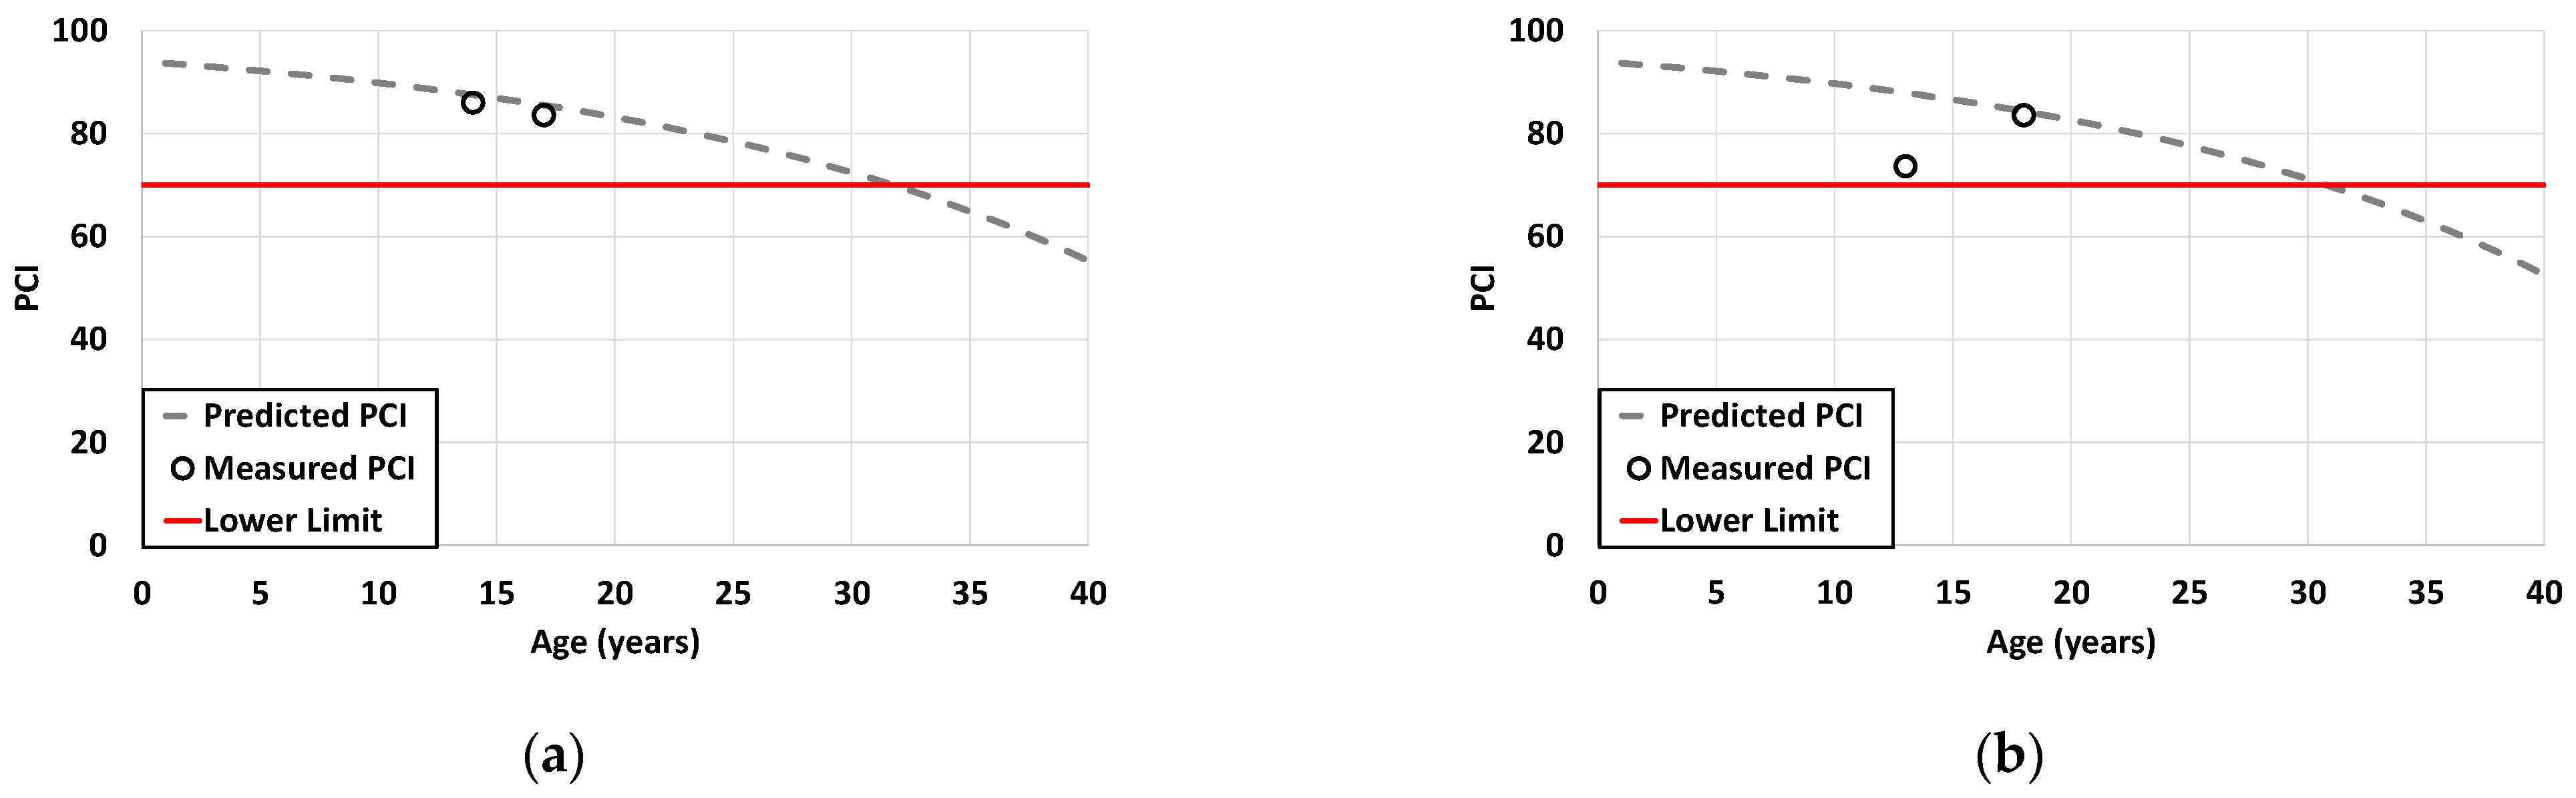
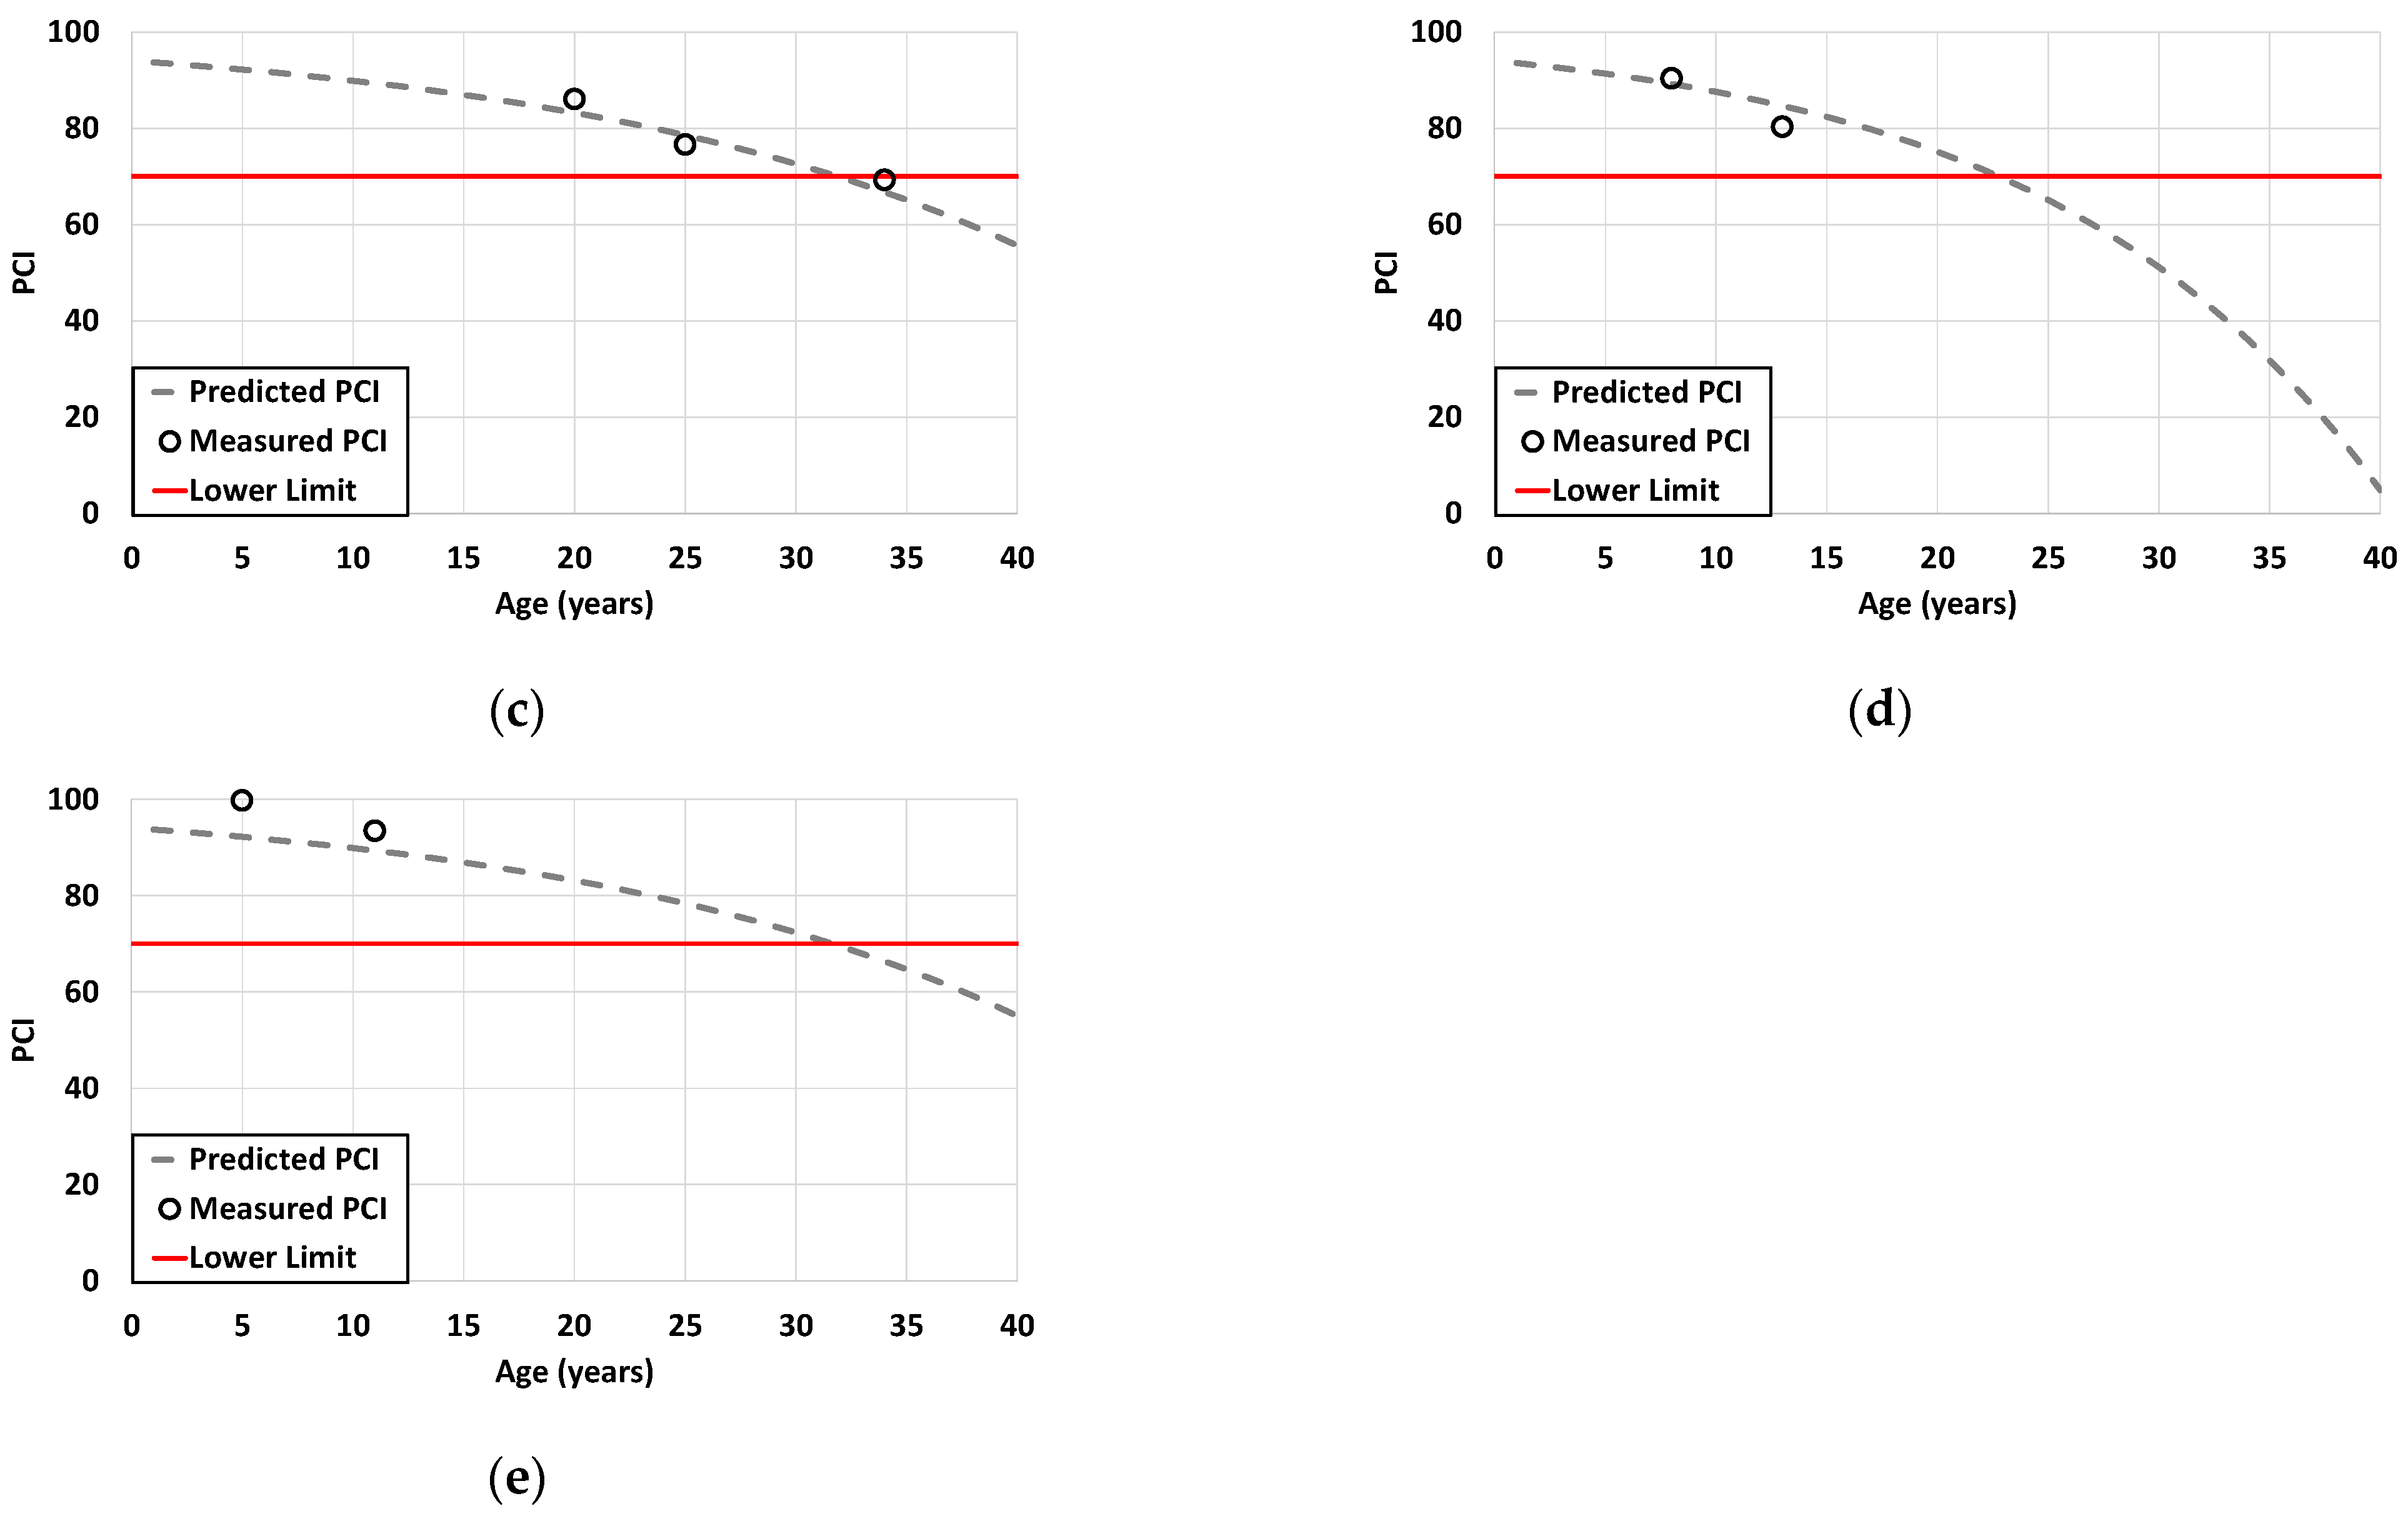
Consequently, the proposed PCI model was developed using an exponential function to predict the decrease in PCI with respect to cumulative fatigue damage and pavement age. The actual PCIs of the target runways were compared with the predicted PCIs to verify the validity of the proposed PCI model. The proposed model successfully predicted the actual PCI with a relatively high coefficient of determination (0.621) between the actual and predicted PCIs.
(5)
The PCIs obtained in this study can be used to design airport programs. In future research, by collecting data from more airports and employing various prediction methods to develop and compare PCI models, we anticipate that the robustness of the PCI will be enhanced.

Author Contributions

H.-W.P., J.M.K. and J.-H.J. conceived and designed the study. H.-W.P. wrote the manuscript. H.-W.P., J.H.L. and D.S.L. contributed to the manuscript revision. All authors have read and agreed to the published version of the manuscript.

Funding

This study was supported by a research grant (No. BEX00625) from Incheon International Airport Corporation (IIAC). This work was also supported by Inha University.

Institutional Review Board Statement

Not applicable.

Informed Consent Statement

Not applicable.

Data Availability Statement

Not applicable.

Acknowledgments

This paper is based on the research project, “Development of Airport Pavement Design Method by Analyzing the Characteristics of Long-Term Behavior of Airport Pavement (Rigid) (I)”, of Incheon International Airport Corporation and the research project of Inha University.

Conflicts of Interest

The authors declare no conflict of interest.

References

  1. MOLTMA. Road Pavement Structure Design Guidelines; Ministry of Land, Transport and Maritime Affairs: Sejong, Republic of Korea, 2011. [Google Scholar]
  2. ARA Inc. Guide for Mechanistic-Empirical Design of New and Rehabilitated Pavement Structures; NCHRP 1-37A; National Coop-erative Highway Research Program: Washington, DC, USA, 2004. [Google Scholar]
  3. Westergaard, H.H. New Formulas for Stresses in Concrete Pavements of Airfields. Trans. Am. Soc. Civ. Eng. 1948, 113, 425–444. [Google Scholar] [CrossRef]
  4. FAA AC 150/5320-6E; Standard for Airport Pavement Design and Evaluation. Office of Airport Safety and Standards, Federal Aviation Administration: Washington, DC, USA, 2009.
  5. FAA AC 150/5320-6F; Standard for Airport Pavement Design and Evaluation. Office of Airport Safety and Standards, Federal Aviation Administration: Washington, DC, USA, 2016.
  6. Park, H.W.; Kim, D.H.; Shim, C.S.; Jeong, J.H. Behavior of Airport Concrete Pavement Slabs Exposed to Environmental Loadings. Appl. Sci. 2020, 10, 2618. [Google Scholar] [CrossRef]
  7. Wang, Q.A.; Dai, Y.; Ma, Z.G.; Lin, J.F.; Ni, Y.Q.; Ren, W.X.; Jiang, J.; Yang, X.; Yan, J.R. Towards high-precision data modeling of SHM measurements using an improved sparse Bayesian learning scheme with strong generalization ability. Struct. Health Monit. 2023, 14759217231170316. [Google Scholar] [CrossRef]
  8. Wang, Q.-A.; Zhang, C.; Ma, Z.-G.; Ni, Y.-Q. Modelling and forecasting of SHM strain measurement for a large-scale sus-pension bridge during typhoon events using variational heteroscedastic Gaussian process. Eng. Struct. 2022, 251, 113554. [Google Scholar] [CrossRef]
  9. Rollings, R.S. Design of Overlays for Rigid Airport Pavements; Report No.: DOT/FAA/PM-87/19, AD-A194 331, Federal Aviation Administration: Washington, DC, USA, 1988. [Google Scholar]
  10. ASTM D6433-07; Standard Practice for Roads and Parking Lots Pavement Condition Index Survey. American Society for Testing and Materials: West Conshohocken, PA, USA, 2007.
  11. Jeong, J.H.; Zollinger, D.G. Early-Age Curling and Warping Behavior: Insights from a Fully Instrumented Test-Slab System. Transp. Res. Rec. 2004, 1896, 66–74. [Google Scholar] [CrossRef]
  12. Jeong, J.H.; Zollinger, D.G. Environmental Effects on the Behavior of Jointed Plain Concrete Pavements. J. Traffic Eng. 2005, 131, 140–148. [Google Scholar] [CrossRef]
  13. Kim, D.H.; Ma, K.H.; Park, H.W.; Jeong, J.H. Development of Maximum Tensile Stress Prediction Model for Airport Concrete Pavements Using Environmental and B777 Aircraft Gear Loadings. Int. J. Highw. Eng. 2018, 20, 93–102. [Google Scholar] [CrossRef]
  14. Ma, K.H.; Park, H.W.; Seo, J.S.; Mo, S.H.; Jeong, J.H. Analysis of Maximum Tensile stress on the airport concrete pavement by Aircraft types. In Proceedings of the Spring Korean Society of Road Engineers, Seoul, Republic of Korea, 3 August 2019. [Google Scholar]
  15. Park, H.W.; Shim, C.S.; Lim, J.S.; Joe, N.H.; Jeong, J.H. Development of Three-Dimensional Finite Element Model for Structure Analysis of Airport Concrete Pavements. Int. J. Highw. Eng. 2017, 19, 67–74. [Google Scholar] [CrossRef]
  16. Jiang, X.; Zhang, M.; Xiao, R.; Polaczyk, P.; Bai, Y.; Huang, B. An investigation of structural responses of inverted pavements by numerical approaches considering nonlinear stress-dependent properties of unbound aggregate layer. Constr. Build. Mater. 2021, 303, 124505. [Google Scholar] [CrossRef]
  17. Jiang, X.; Gabrielson, J.; Huang, B.; Bai, Y.; Polaczyk, P.; Zhang, M.; Hu, W.; Xiao, R. Evaluation of inverted pavement by structural condition indicators from falling weight deflectometer. Constr. Build. Mater. 2022, 319, 125991. [Google Scholar] [CrossRef]
  18. Park, H.W.; Kim, D.H.; Lim, J.S.; Shim, C.S.; Jeong, J.H. Prediction of differential drying shrinkage of airport concrete pavement slabs. Int. J. Pavement Eng. 2021, 22, 752–762. [Google Scholar] [CrossRef]
  19. IIAC. Pavement Evaluation Report of Incheon International Airport; Incheon International Airport Corporation: Incheon, Republic of Korea, 2015. [Google Scholar]
  20. Park, J.Y.; Lim, J.S.; Kim, S.H.; Jeong, J.H. Improvement of Fatigue Model of Concrete Pavement Slabs Using Environmental Loading. Int. J. Highw. Eng. 2011, 13, 103–115. [Google Scholar] [CrossRef]
  21. Park, J.Y.; Yeom, W.S.; Kim, S.H.; Jeong, J.H. Environmental load for design of airport concrete pavements. Proc. Inst. Civ. Eng. Transp. 2015, 168, 139–149. [Google Scholar] [CrossRef]
  22. Mohamed, A.R.; Hansen, W. Effect of nonlinear temperature gradient on curling stress in concrete pavements. Trans-Portation Res. Rec. 1997, 1568, 65–71. [Google Scholar] [CrossRef]
  23. Airbus, S.A.S. AC A300—Airplane Characteristics for Airport Planning; Airbus S.A.S.: Leiden, The Netherlands, 2009. [Google Scholar]
  24. Airbus, S.A.S. AC A310—Airplane Characteristics for Airport Planning; Airbus S.A.S.: Leiden, The Netherlands, 2009. [Google Scholar]
  25. Airbus, S.A.S. AC A318—Airplane Characteristics Airport and Maintenance Planning; Airbus S.A.S.: Leiden, The Netherlands, 2019. [Google Scholar]
  26. Airbus, S.A.S. AC A319/A319neo—Airplane Characteristics Airport and Maintenance Planning; Airbus S.A.S.: Leiden, The Netherlands, 2019. [Google Scholar]
  27. Airbus, S.A.S. AC A320/A320neo—Airplane Characteristics Airport and Maintenance Planning; Airbus S.A.S.: Leiden, The Netherlands, 2019. [Google Scholar]
  28. Airbus, S.A.S. AC A321/A321neo—Airplane Characteristics Airport and Maintenance Planning; Airbus S.A.S.: Leiden, The Netherlands, 2019. [Google Scholar]
  29. Airbus, S.A.S. AC A330—Airplane Characteristics Airport and Maintenance Planning; Airbus S.A.S.: Leiden, The Netherlands, 2019. [Google Scholar]
  30. Airbus, S.A.S. AC A340-200/-300—Airplane Characteristics Airport and Maintenance Planning; Airbus S.A.S.: Leiden, The Netherlands, 2019. [Google Scholar]
  31. Airbus, S.A.S. AC A350-900/-1000—Airplane Characteristics Airport and Maintenance Planning; Airbus S.A.S.: Leiden, The Netherlands, 2019. [Google Scholar]
  32. Airbus, S.A.S. AC A380—Airplane Characteristics Airport and Maintenance Planning; Airbus S.A.S.: Leiden, The Netherlands, 2019. [Google Scholar]
  33. Boeing Commercial Airplanes. 707—Airplane Characteristics Airport Planning; D6-58332; Boeing Commercial Airplanes: Seal Beach, CA, USA, 2011. [Google Scholar]
  34. Boeing Commercial Airplanes. 720—Airplane Characteristics Airport Planning; D6-58323; Boeing Commercial Airplanes: Seal Beach, CA, USA, 2011. [Google Scholar]
  35. Boeing Commercial Airplanes. 727—Airplane Characteristics Airport Planning; D6-58324; Boeing Commercial Airplanes: Seal Beach, CA, USA, 2011. [Google Scholar]
  36. Boeing Commercial Airplanes. 747-400—Airplane Characteristics for Airport Planning; D6-58326-1; Boeing Commercial Airplanes: Seal Beach, CA, USA, 2011. [Google Scholar]
  37. Boeing Commercial Airplanes. 757-200/300—Airplane Characteristics for Airport Planning; D6-58327; Boeing Commercial Airplanes: Seal Beach, CA, USA, 2011. [Google Scholar]
  38. Boeing Commercial Airplanes. 767—Airplane Characteristics for Airport Planning; D6-58328; Boeing Commercial Airplanes: Seal Beach, CA, USA, 2011. [Google Scholar]
  39. Boeing Commercial Airplanes. 777-200/300—Airplane Characteristics for Airport Planning; D6-58329; Boeing Commercial Airplanes: Seal Beach, CA, USA, 2011. [Google Scholar]
  40. Boeing Commercial Airplanes. 737—Airplane Characteristics for Airport Planning; D6-58325-6; Boeing Commercial Airplanes: Seal Beach, CA, USA, 2013. [Google Scholar]
  41. Boeing Commercial Airplanes. 717-200—Airplane Characteristics Airport Planning; D6-58330; Boeing Commercial Airplanes: Seal Beach, CA, USA, 2014. [Google Scholar]
  42. Boeing Commercial Airplanes. 777-200LR/-300ER/-Freighter—Airplane Characteristics for Airport Planning; D6-58329-2; Boeing Commercial Air-planes: Seal Beach, CA, USA, 2015. [Google Scholar]
  43. Boeing Commercial Airplanes. 787—Airplane Characteristics for Airport Planning; D6-58333; Boeing Commercial Airplanes: Seal Beach, CA, USA, 2018. [Google Scholar]
  44. Lee, J.H.; Kim, Y.T.; Tonn, S.; Cho, N.H.; Jeong, J.H. Airport Concrete Pavement Design by Environmental and Double Dual Tandem Gear Loadings. Proc. Inst. Civ. Eng. 2019, 172, 210–220. [Google Scholar] [CrossRef]
  45. Darter, M.I. Design of Zero-Maintenance Plain Jointed Concrete Pavement, Volume 1: Development of Design Procedures; Report No.: FHWA-RD-77-III, Federal Highway Administration: Washington, DC, USA, 1977. [Google Scholar]
  46. Roesler, J.R. Fatigue of Concrete Beams and Slabs. Ph.D. Thesis, University of Illinois, Urbana, IL, USA, 1998. [Google Scholar]
  47. Asgari, A. Evaluation of Concrete Pavement Service Life Using Three-dimensional Nonlinear Finite Element Analysis and Nonlinear Fatigue Damage Model. Ph.D. Thesis, Purdue University, West Lafayette, IN, USA, 2004. [Google Scholar]
  48. Murdock, J.W.; Kesler, C.E. Effect of Range of Stress on Fatigue Strength of Plain Concrete Beam. J. Am. Concr. Inst. 1958, 30, 221–231. [Google Scholar]
  49. Aas-Jakobsen, L. Fatigue of Concrete Beams and Columns. In Division of Concrete Structures; Bulletin No.70-1; NTH: Trondheim, Norway, 1970. [Google Scholar]
  50. Tepfers, R.; Kutti, T. Fatigue Strength of Plain, Ordinary, and Lightweight Concrete. J. Am. Concr. Inst. 1979, 76, 635–652. [Google Scholar]
  51. Shi, X.P.; Fwa, T.F.; Tan, S.A. Flexural fatigue strength of plain concrete. Mater. J. 1993, 90, 435–440. [Google Scholar]
  52. MOLTMA. Road Pavement Structure Design Handbook; Ministry of Land, Transport and Maritime Affairs: Sejong, Republic of Korea, 2011. [Google Scholar]
  53. KAC. Cheongju Airport Pavement Condition Evaluation Report; Korea Airport Corporation: Seoul, Republic of Korea, 2017. [Google Scholar]
Figure 1. Overview of FAARFIELD program [5].
Buildings 13 02512 g001
Figure 2. Locations of target airports.
Buildings 13 02512 g002
Figure 3. Relationship between coverage and SCI (or PCI) [9].
Buildings 13 02512 g003
Figure 4. Distribution of PCI and SCI of target airports.
Buildings 13 02512 g004
Figure 5. Footprint of main gears of design aircraft.
Buildings 13 02512 g005
Figure 6. PCIs of target airports according to converted traffic volume.
Buildings 13 02512 g006
Figure 9. Stress distributions for different loading cases; (a) Environmental loads only; (b) Environmental and traffic loads (double dual-tandem gear); (c) Environmental and traffic loads (dual-tandem gear).
Buildings 13 02512 g009
Figure 10. Loading conditions applied in fatigue testing.
Buildings 13 02512 g010
Figure 11. Allowable numbers of loading repetitions for target airports.
Buildings 13 02512 g011
Figure 12. Predicted cumulative damage to target airports.
Buildings 13 02512 g012
Figure 13. Correlation between actual (measured) and predicted PCIs.
Buildings 13 02512 g013
Figure 14. Comparison between actual (measured) and predicted PCIs of target airports.
Buildings 13 02512 g014
Figure 15. Comparison between actual (measured) and predicted PCIs of target airports according to pavement age; (a) First and second runways of Incheon International Airport; (b) Gimpo International Airport; (c) Cheongju International Airport; (d) Gimhae International Airport; (e) Gwangju International Airport.
Buildings 13 02512 g015aBuildings 13 02512 g015b
Table 1. Information from pavement condition survey of target airports.
Target AirportTarget RunwaySurvey Area (m2)Year of SurveyPavement Age at Survey
Incheon1st and 2nd runways450,0002013/201713/17
GimpoNew runway192,0002009/201412/17
CheongjuOld and
new runways
288,0152012 (NR and OR)
/2017 (NR)
20/25
/34 (2012)
GimhaeNew runway192,0002008/20138/13
GwangjuEast-side runway127,5752007/20135/11
Table 2. Distress types used in calculating SCI and PCI.
Distress TypePCISCI
1.Blow-up
2.Corner break
3.Cracks: longitudinal, transverse, and diagonal
4.Durability (“D”) cracking
5.Joint seal damage
6.Patching, small
7.Patching, large and utility cuts
8.Pop-outs
9.Pumping
10.Scaling
11.Settlement or faulting
12.Shattered slab/intersecting cracks
13.Shrinkage cracking
14.Spalling (longitudinal and transverse joint)
15.Spalling (corner)
16.Alkali–silica reaction (ASR)
Table 3. Pavement structures and average annual departures converted to design aircraft of target airports.
AirportSlab
Thickness (mm)
AC
(mm)
CTB
(mm)
Subbase
(mm)
Joint
Spacing
(m)
Design AircraftConverted
Average Annual Departure
Incheon500501501506.00B74782,000
Gimpo400200-3007.50B7473900
Cheongju400--3507.62B74710
Gimhae350-1502007.50A3308900
Gwangju400-1503007.62A3002400
Table 4. Material properties of pavement layers used in FE model.
CategoryConcrete SlabLean Concrete SubbaseSubbaseSubgrade
Elastic modulus(psi)4,000,000500,00075,00015,000
(MPa)28,0003447517103
Poisson’s ratio0.180.20.350.4
Unit weight (kN/m3)23.022.021.019.0
Coefficient of
thermal expansion (/°C)
9.927 × 10⁻⁶---
Coefficient of friction4.8-
Table 5. Regression coefficients according to loading type.
Gear Typeabcdef
Environmental Load only−0.1540.409−0.0050.04400.000232
Environmental Load + Dual Gear2.4260.151−0.009440.0911.285−0.0000818
Environmental Load + Dual-Tandem Gear0.3350.473−0.0008730.0941.082−0.0000524
Environmental Load + Double Dual-Tandem Gear (B747)3.4040.164−0.001190.0941.841−0.0000472
Environmental Load + Triple Dual-Tandem Gear (B777)1.1700.408−0.008700.0391.372−0.000746
Environmental Load + Triple Dual-Tandem Gear (A380)2.4030.146−0.008930.1052.061−0.00042
Table 6. Minimum and maximum tensile stresses and stress ratios of target airports.
Target AirportMaximum Tensile Stress (MPa)Minimum Tensile Stress (MPa)Stress Ratio
Incheon0.662.560.26
Gimpo1.503.600.42
Cheongju1.643.810.43
Gimhae1.673.800.44
Gwangju1.162.990.38
Disclaimer/Publisher’s Note: The statements, opinions and data contained in all publications are solely those of the individual author(s) and contributor(s) and not of MDPI and/or the editor(s). MDPI and/or the editor(s) disclaim responsibility for any injury to people or property resulting from any ideas, methods, instructions or products referred to in the content.

