Article

Potential Benefits of Thermal Insulation in Public Buildings: Case of a University Building

Department of Civil Engineering, Sakarya University of Applied Sciences, 54050 Sakarya, Turkey
*
Author to whom correspondence should be addressed.
Buildings 2023, 13(10), 2586; https://doi.org/10.3390/buildings13102586
Submission received: 16 September 2023 / Revised: 11 October 2023 / Accepted: 12 October 2023 / Published: 13 October 2023

Abstract

:
Global energy demand continues to rise due to advances in both developed and developing countries. Energy-efficient technologies and eco-friendly policies have been insufficient to counterbalance the increasing demand and, thus, the national strategies of many countries have been shaped by energy conservation considerations. Buildings are responsible for more than one third of the global final energy consumption and the energy use in buildings is expected to grow more than 40% in the next 20 years. Even though the energy-efficient retrofits and thermal insulation of the building envelope have been widely studied in academia, the case of existing public buildings has been largely neglected. To fill the gap, this study investigates the thermal insulation of existing public buildings and unveils its potential benefits. An administrative building of a public university has been the subject of financial analysis to observe the feasibility of insulation applications and to identify the most feasible insulation application. The results reveal that (i) the most feasible application depends considerably on the financial scenarios and (ii) the feasibility of insulation applications is greatly influenced by the building geometry. This study contributes to the literature by demonstrating the feasibility of energy retrofits in an administrative public building and proposing an alternative way to achieve national energy efficiency objectives.

1. Introduction

Rapid industrialization in recent decades has greatly accelerated the use of fossil fuels. Deriving the majority of energy consumption from nonrenewable energy sources leads to an undesired condition for the environment, emphasizing the need to reduce nonrenewable energy consumption on the global scale [1]. Even though the technological advancements and encouraging policies have gradually enhanced the efficiency of energy end-use services, the increasing demand for energy services has not been counterbalanced [2].
Achieving carbon neutrality by 2050 necessitates efficiency and a reduction in energy demand to ensure flexible selection of the available decarbonization options that avoid social and environmental side-effects [3]. Aside from benefitting the mitigation of climate change and national security of energy supply, energy savings owing to the conservation of energy can provide improvements in local pollution, productivity, competitiveness of companies, household energy expenditure, and health of building occupants [2].
Energy use in buildings and building construction sectors corresponds to more than one third of global final energy consumption and is responsible for nearly 40% of total (both direct and indirect) CO2 emissions [4]. Furthermore, the energy demand of buildings is expected to grow by more than 40% in the next 20 years [5] due to urbanization and climate change, such as global warming and extreme weather events [6]. Therefore, providing energy-efficient buildings would be critical for the prevention of the increase in the energy demand.
The measures to achieve energy efficiency in buildings can be divided into two categories, namely soft and hard measures. The former implies education and behavior changes, while the latter contains investment in energy efficiency including equipment upgrades [7]. In spite of their high initial costs, the hard measures are especially effective for limiting energy consumption in buildings by means of well-proven solutions such as thermal insulation, the use of efficient glazing, the elimination of thermal bridges, and the installation of efficient heating/cooling generation and distribution systems [8].
The achievement of energy efficiency in new buildings has received a great deal of attention using a multidisciplinary approach throughout the life cycle including the pre-building, building, and post-building phases [9]. Equally important is the case of existing buildings where poor thermal properties lead to high energy demand [10]. In this direction, the trend toward re-engineering or retrofitting existing buildings has accelerated in recent years. Energy-efficient retrofits cover the improvement in the building envelope through building-integrated renewable energy technologies, climate control strategies, and insulation [11].
The renovations in buildings with structural vulnerability need to consider both the seismic and energy retrofitting concurrently. Especially in regions with seismic hazard, the interventions should address seismic and energy performance for buildings not designed to modern standards. The types of integrated retrofitting solutions proposed in the literature include (i) exoskeleton interventions, (ii) enhancements in envelope elements to achieve better energy/seismic performance, and (iii) replacements of envelope elements by higher-performance elements [12].
This study examines the potential benefits of energy-efficient retrofits, more specifically, the thermal insulation of existing public buildings. An administrative building in Sakarya University of Applied Sciences was subjected to investigation. The financial analysis of thermal insulation considered the cost of insulation application and potential savings owing to the reduction in annual energy requirements. Financial parameters were calculated to observe the feasibility of insulation applications on existing public buildings and to identify the optimum insulation application. Scenario analysis was conducted to pay regard to the probable deviations in inflation and interest rates.
This paper is organized as follows: Section 1 presents the motivation of this study and summarizes previously conducted studies on energy efficiency in buildings; Section 2 illustrates the flowchart of methodology and explains the steps in detail; Section 3 introduces and discusses the results; and Section 4 emphasizes main observations, clarifies the contribution to the literature, and proposes future studies.

1.1. Role of Energy Efficiency in the National Strategies

The oil crisis in the early 1970s brought about the emergence of conservation of energy and energy efficiency as the key pillars of national energy policies [13]. Countries from all over the world started to shape their national energy policies in compliance with these energy conservation considerations [14]. These policies have been especially effective in Europe, where the European Union has been the tower of strength. The Member States have been motivated to join the energy efficiency movement.
A critical part of the European Union climate and energy strategies is to decrease the energy requirement of buildings through the implementation of energy efficiency policies. The concept of energy efficiency first appeared in the European Union energy policy agenda in the 1970s and gradually gained importance with the increasing concern for global energy and climate priorities [15]. The Paris Agreement in December 2015 accelerated the attempts to mitigate the effects of global warming and climate change [16].
Energy efficiency has been proposed as a way to promote sustainability and competitiveness of the European economy. It is recognized as a cost-effective solution to concurrently enhance the security of supply and contribute to the energy and climate objectives. The European Union has set the target to achieve an energy efficiency of 32.5% by 2030. The National Energy Efficiency Action Plans of the Member States involve radical energy efficiency measures to accomplish the national energy efficiency objectives [7].
The main piece of European Union legislation that imposes binding measures for the Member States to reach the objectives is the Energy Efficiency Directive (2012/27/EU) [17]. The Directive covers a number of binding measures including energy efficiency policies, the provisions on the setting of energy efficiency targets, and legal obligations to establish energy conservation schemes in Member States. It instructs the Member States to draft national energy efficiency action plans proposing a structural framework and an implementation methodology on energy efficiency [7].
The instructions of the directive have encouraged the Member States to develop energy efficiency policies. To illustrate, Italy promoted financial incentives to renovations and gave tax credits up to 110% of the intervention value [18]. Even though the binding measures are not applicable to the United Kingdom after leaving the European Union on the Brexit deal, it still follows through the international commitments. The United Kingdom aims to cut carbon emissions to combat climate change with the recent strategy “the Clean Growth Strategy: Leading the way to a low carbon future” [7].
To harmonize with the Energy Efficiency Directive, Turkish officials also implemented a policy, namely the National Energy Efficiency Action Plan (NEEAP). Within this context, the goals of the NEEAP were also included in the National Energy and Mining Policy issued by the Ministry of Energy and Natural Resources (MENR). The action plan, which was implemented in the period of 2017–2023, contained 55 actions defined under six categories, namely transport, industry and technology, buildings and services, energy, agriculture, and cross-cutting areas [19].
The primary energy consumption of Türkiye was 147.2 Mtoe in 2020 and is expected to reach up to 205.3 Mtoe by 2035. The shares of fossil resources and renewable energy sources in primary energy consumption in 2020 were 83.3% and 16.7%, respectively. The final energy consumption, which was 105.5 Mtoe in 2020, is expected to move up to 148.5 Mtoe by 2035. As of 2020, residential buildings were responsible for 24.5% of the total final energy consumption [20].
With the help of measures taken in the 2000–2020 period, Türkiye could reduce the energy intensity by 25%, which was still less than the 28%–36% reduction achieved by developed countries, namely France and Germany. The objective was indicated as the reduction in the energy intensity by 35.3% in the 2020–2035 period. It was also stated that meeting the objective would require a major transformation in all sectors and a systematic approach unlike that which had been previously followed [20].

1.2. Previous Studies on Energy Efficiency in Buildings

Energy efficiency has been an attractive topic in academia for decades. Researchers have conducted numerous studies to promote energy efficiency, especially in buildings, where energy use accounts for a considerable part of the global primary energy consumption. The topic has been mainly investigated through the following aspects: evaluation of the accuracy and optimality of national standards, prediction of building energy consumption, review and classification of energy efficiency measures, and analysis of the impact of energy efficiency measures.
A number of studies have questioned the accuracy and optimality of national standards. Caglayan et al. [21] examined the optimality of the limits stated in the Turkish national standard for thermal insulation requirements. Hussein et al. [22] assessed the benefits of an updated building energy code. They focused on the heat transfer coefficient of the building envelope to reduce the future energy demand. He et al. [23] analyzed the impact of upgrading the ASHRAE 90.1–2016 to 2019 in sixteen climate zones in the United States. Wang et al. [24] calculated the difference between the actual energy use and regulated energy consumption by design standards for residential buildings in China.
Multiple studies have attempted to predict the energy consumption of buildings. Runge and Zmeureanu [25] reviewed studies that had utilized artificial neural networks to forecast building energy use and demand. Le et al. [26] forecasted the heating load of buildings’ energy efficiency by developing four artificial intelligence techniques including the combination of the artificial neural network with artificial bee colony optimization, particle swarm optimization, the imperialist competitive algorithm, and the genetic algorithm. Pham et al. [27] utilized machine learning algorithms to predict the short-term energy consumption in an hourly resolution in several buildings.
Certain studies have reviewed and classified the energy efficiency measures utilized in the literature. Belussi et al. [28] summarized the state of the art of zero-energy building performances and related technical solutions. Lidelöw et al. [29] performed a literature review of the energy efficiency measures for heritage buildings. Farzaneh et al. [30] reviewed the application of artificial intelligence technologies in smart buildings to decrease energy consumption through better control, improved reliability, and automation. Nair et al. [31] reviewed the energy efficiency retrofit measures and revealed the technical challenges and possibilities.
Several studies have focused on the impact of energy efficiency measures on building energy efficiency. Serale et al. [32] highlighted the application of model predictive control in improving energy efficiency in buildings. Bughio et al. [33] investigated the influence of passive energy efficiency measures on the cooling energy demand. Chippagiri et al. [34] tested the effects of sustainable prefabricated wall technology on energy consumption. The peak cooling load was reduced by six times. Meena et al. [35] assessed the potential of utilizing solar energy for water heating. Albatayneh et al. [36] investigated the shading effect of solar photovoltaic rooftop panels on the roof surface.
Researchers have paid great attention to the thermal insulation of the building envelope, but relatively few studies have specifically addressed the case of existing public buildings. On the government side, officials have frequently encouraged private home owners to pursue energy efficiency. The issue seems to have been neglected for public buildings that account for a significant portion of the total building stock. Based on the fact that meeting the national energy objectives requires a systematic approach unlike that previously followed, this study considers promoting the energy efficiency of public buildings as an alternative path to decrease the total energy consumption and to realize the national strategy in energy efficiency.

2. Research Methodology

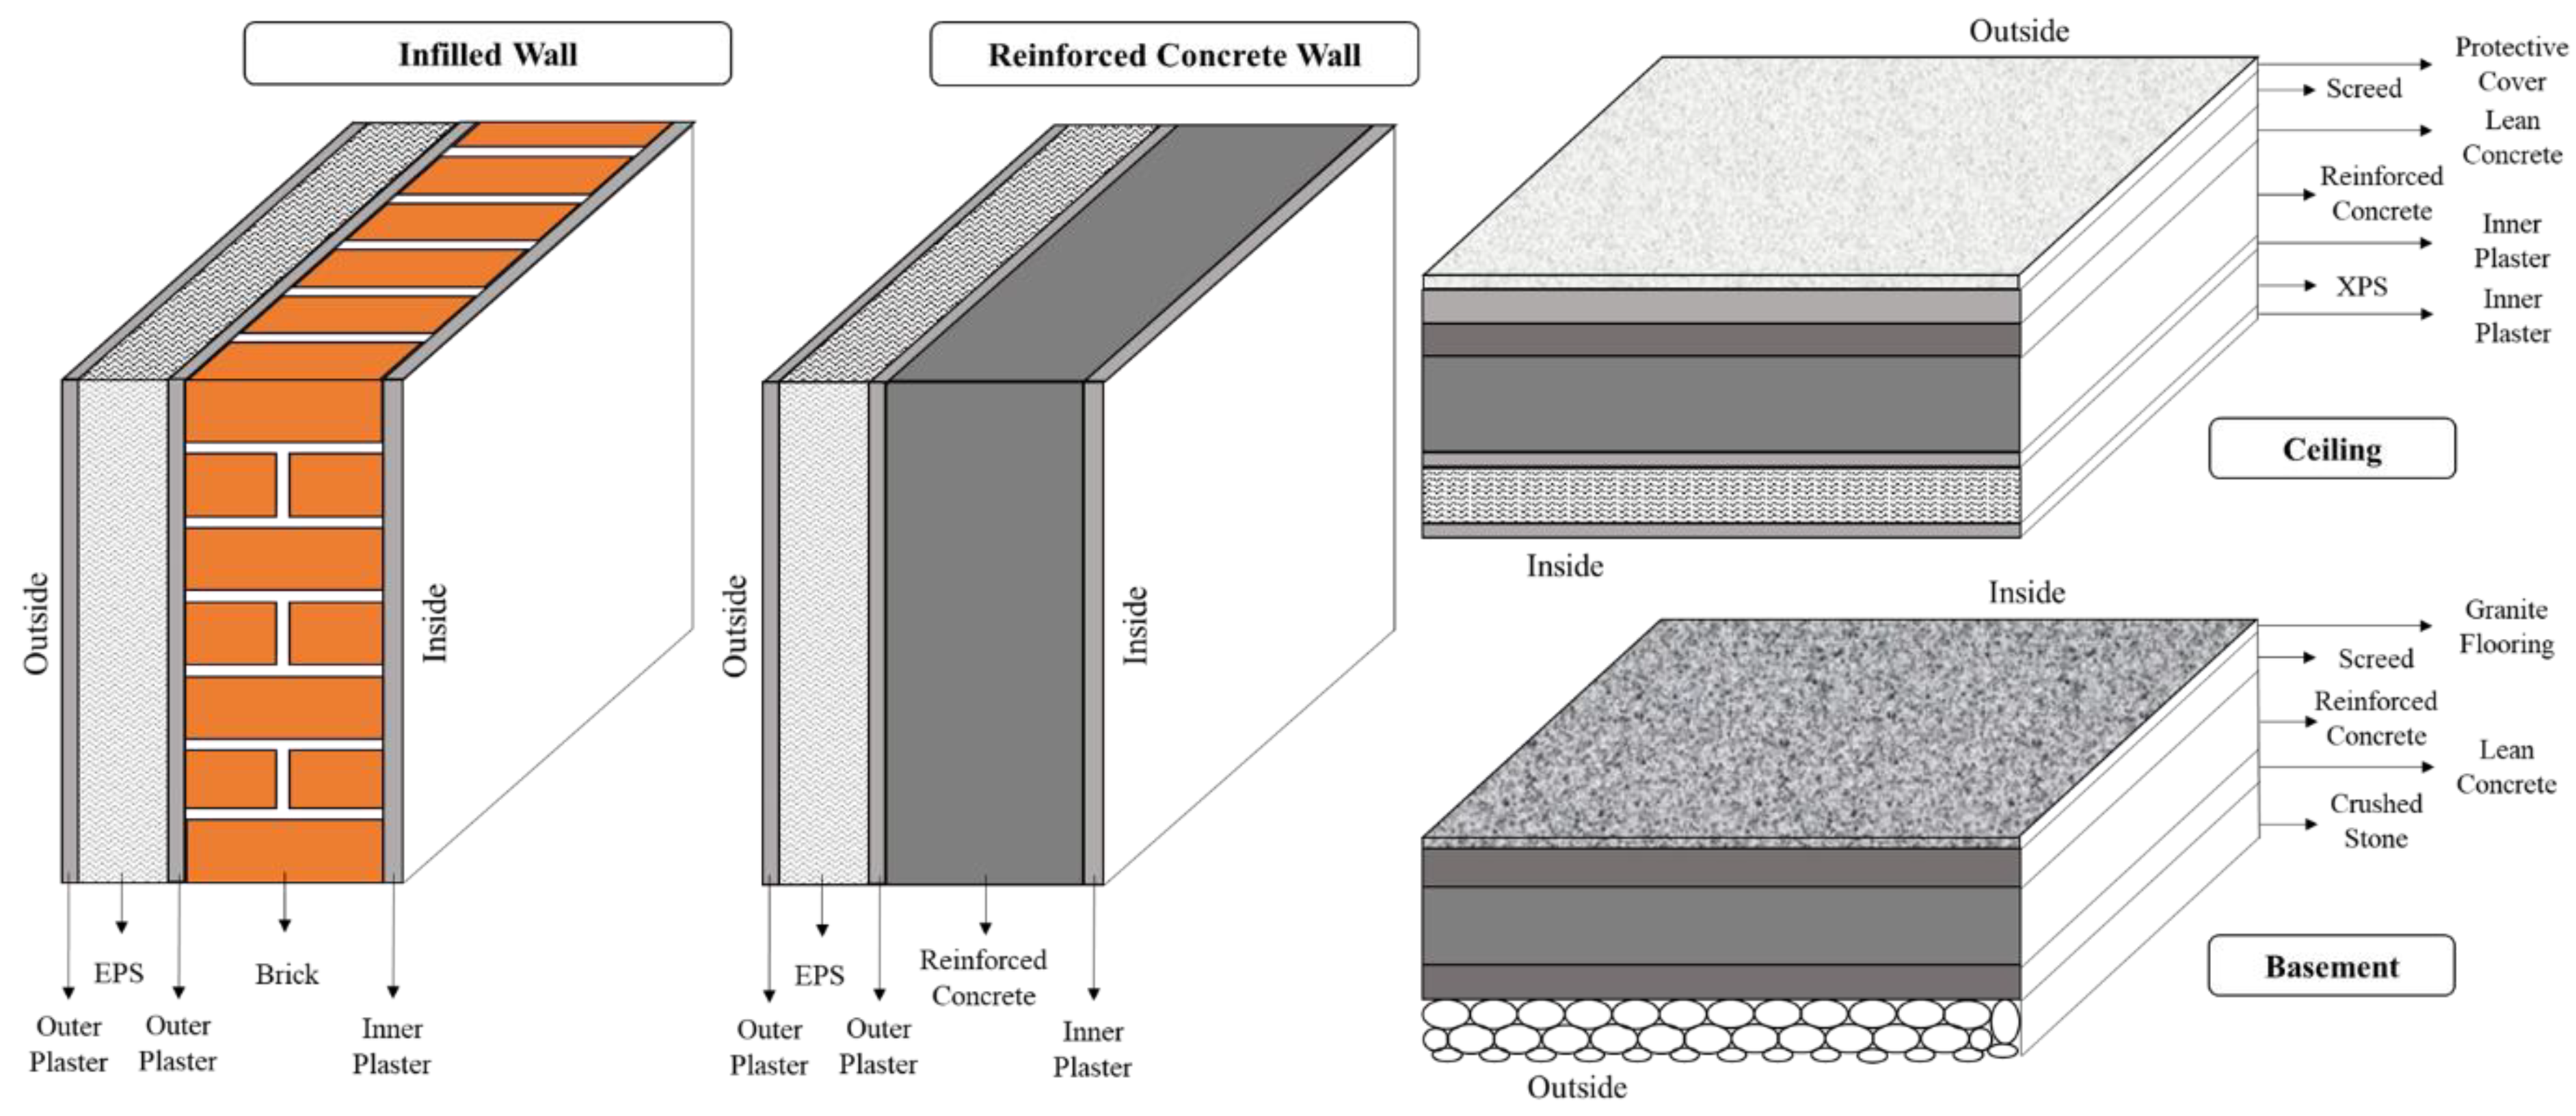
2.1. The Building Profile

The profile of the aforementioned building and its floor plan are shown in Figure 1. It is a four-story university building located next to the Sapanca lake in the city of Sakarya, Türkiye. The building currently belongs to Sakarya University of Applied Sciences and is labeled as the T2 building. The building comprises various units including the office of the rectorate, dean’s office, registrar’s office, directorate of information technologies, department of civil engineering, and conference hall. The building has a total area of 4486 m2 and a gross volume of 16,140 m3. The areas of the windows are 167 m2, 134 m2, 7.2 m2, and 10 m2 in the south, north, east, and west directions, respectively.
The construction of the building was completed on 1 March 2011. The reinforced concrete building was designed and constructed in accordance with the Turkish Earthquake Code (TEC) 2007 [37]. The history of code revisions shows that the earthquakes in Turkey and the code revisions occur at similar times. The code came into force after the Great Marmara Earthquake on 17 August 1999. The earthquake caused a financial cost of USD 1.1–4.5 billion and a loss of approximately 25,000 lives [38]. Sakarya was categorized in the first seismic zone in TEC 2007. The building was designed according to an effective ground acceleration coefficient of 0.40 and building importance factor of 1.4. The building has had no structural damage. Therefore, this study focuses solely on the energy retrofitting.

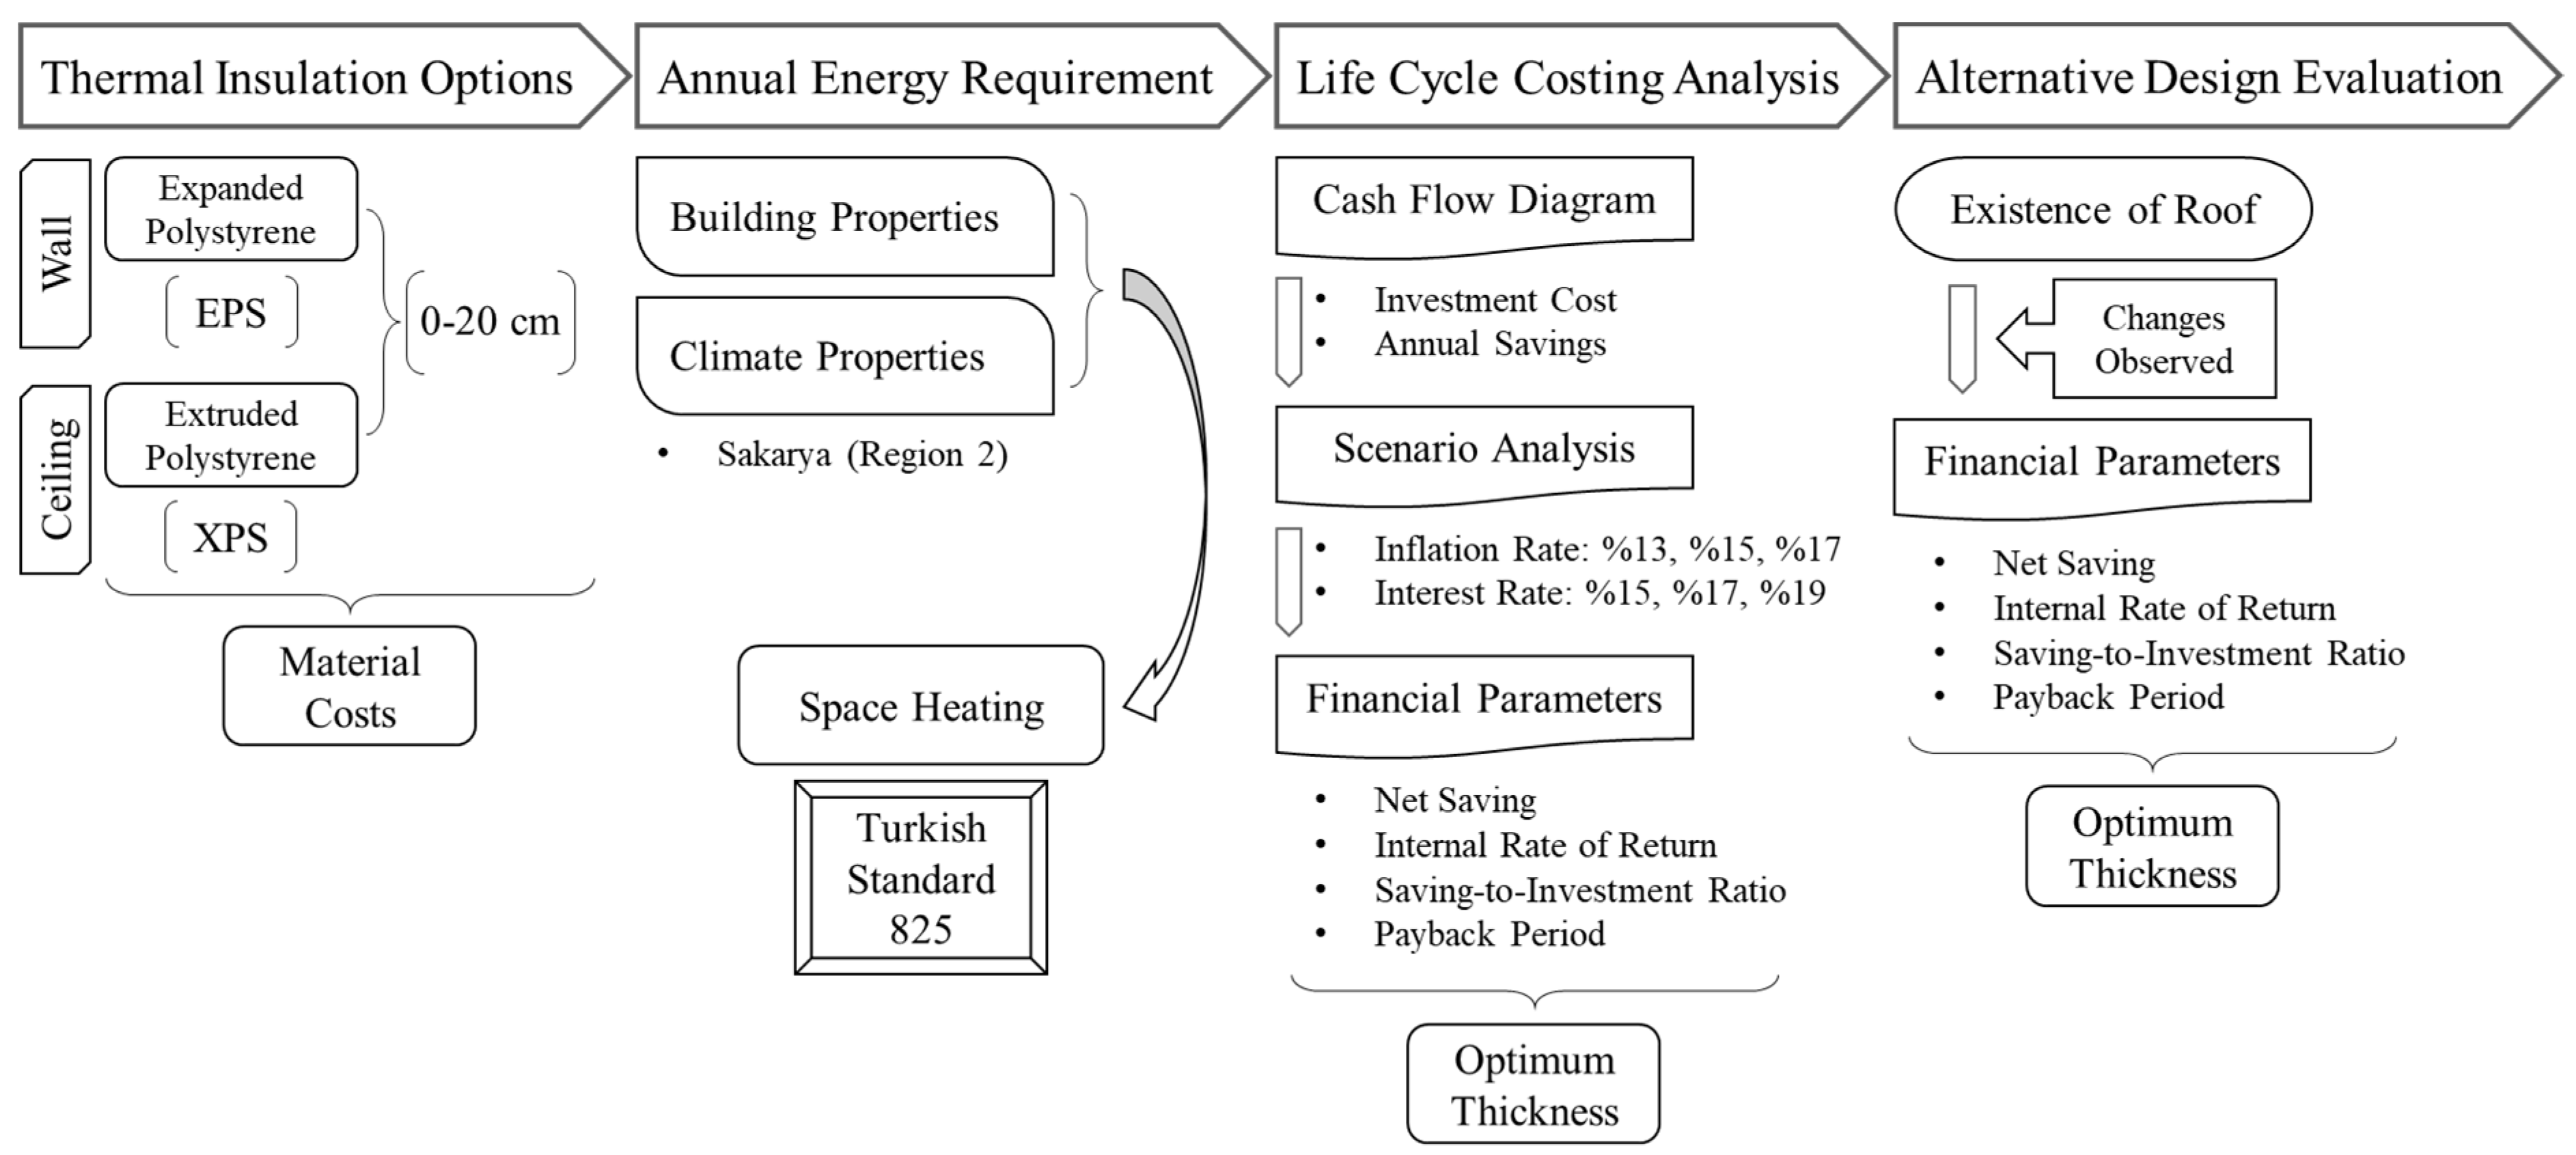
2.2. The Flowchart of Research Methodology

The flowchart of the research methodology is illustrated in Figure 2. It is composed of a total of four phases, including the (i) thermal insulation options, (ii) annual energy requirement, (iii) life cycle costing analysis, and (iv) alternative design evaluation. In the first phase, thermal insulation options were determined. Insulation application included insulation of the exterior walls and insulation of the ceiling. It was assumed that the exterior walls would be insulated with expanded polystyrene (EPS). The lack of an inclined roof (a non-heated attic with sloping roof pitches) made extruded polystyrene (XPS) the only applicable insulation material to be applied on the ceiling. The costs of the insulation applications were determined by taking offers from companies for each insulation thickness (from 0 to 20 cm). The annual energy requirement of the building was calculated in the second phase. Space heating was calculated for the uninsulated and insulated cases to observe the potential saving. The calculations were based on the national standard, Turkish Standard (TS) 825 [39], which mainly considered the building geometry and climate.
The third phase involved the life cycle costing analysis and detection of the optimum insulation thickness. A cash flow diagram was generated for each insulation alternative. The cash flow diagram covered the cost of investment and annual savings obtained in the following years. Financial parameters were determined for different scenarios of inflation and interest rates. The insulation alternative resulting in the greatest net saving was regarded as the optimum alternative. In the fourth phase, focus was placed on discovering the changes in results if the building had an inclined roof. The presence of a non-heated attic with sloping roof pitches would enable the application of alternative insulation materials such as stone wool on the ceiling. This could consequently lead to the achievement of greater financial parameters and different optimum thicknesses.

2.3. Determination of Thermal Insulation Options

The most common way of applying thermal insulation on existing buildings is to insulate the exterior walls and ceiling [21]. EPS is the most preferred insulation material for the exterior walls. Nevertheless, the situation is quite different for the ceiling. The preferred insulation material largely depends on the presence of the inclined roof. In case of the inclined roof, it would be possible to apply a variety of materials and the insulation material would be simply spread over the ceiling. The lower cost of stone wool makes it the most appropriate material for inclined roofs. The lack of the inclined roof restricts the types of applicable materials because the insulation material is applied on the interior side of the ceiling. XPS is the most commonly used material in this case. A cross-section of the insulated building envelope is presented in Figure 3. The area of both the ceiling and basement is 1040 m2. The areas of the infilled and reinforced concrete walls are 1190 m2 and 876 m2, respectively.

2.4. Calculation of Annual Energy Requirement

The annual energy requirement was calculated by using the national standard TS 825 “thermal insulation requirements for buildings” published by the Turkish Standards Institute [39]. The standard mainly considers the building geometry and climate properties. Cities in Türkiye are categorized into four climate regions including region 1, region 2, region 3, and region 4. Sakarya belongs to region 2 in this category, where region 1 represents the warmest and region 4 covers the coldest cities. The yearly heating degree-days of Sakarya was calculated as 2154 for a base temperature of 19.5 °C [40].
The annual heating energy consumption (Qyear) is equal to the sum of monthly heating energy consumptions (Qm).
Q y e a r = Q m
Q m = H θ i n θ o u t η φ i n + φ s t
The specific heat loss (H) of the building equals to the sum of the heat losses caused by conduction and convection (Htr) and ventilation (Hven).
H = H t r + H v e n
Htr is obtained as follows:
H t r = A U = U e w A e w + U g l A g l + U e d A e d + U c e A c e + 0.5 U f l A f l
A and U represent the area and heat transfer coefficient, respectively. In the case of an inclined roof, UceAce is multiplied by 0.8.
According to the national standard, the heat loss due to thermal bridges is calculated separately. In this study, it was assumed that necessary precautions had been taken to prevent the occurrence of thermal bridges.
Hven is calculated as follows:
H v e n = 0.264 n a V g r o s s
Vgross is the gross building volume and na is the air changing volume. na was taken as 0.8 for natural ventilation.
The monthly average heat gain (φin) is equal to
φ i n 5 A n
An is the building usage area.
A n = 0.32 V g r o s s
The monthly average solar energy gain (φs) is equal to
φ s , j = k r j G j I j , k A g l , k
r is the monthly average shading factor of the transparent surfaces, Agl,k is the total glazing area in direction k, and G is the solar energy permeation factor of the transparent elements. r was considered as 0.8 for detached buildings. The monthly average solar radiation intensities (Ij,k) are given in Table 1 [39].
Solar energy permeation factor (G) is equal to
G j = F w g
Fw is the correction factor for windows and g is the solar energy permeation factor measured under laboratory conditions for the rays striking the surface vertically. Fw was assumed as 0.8 and g was considered as 0.75 for colorless glass.
The monthly average usage factor of heat gain (η) is equal to
η = 1 e ( 1 / G L R )
GLR is the gain/loss ratio and is equal to
G L R = φ i n + φ s H θ i n θ o u t
The GLR formula in Equation (11) is inserted in Equation (10) and η becomes
η = 1 e H θ o u t θ i n φ i n + φ s
The monthly average indoor temperature (θin) is assumed as 20 °C in the national standard. The monthly average outdoor temperatures (θout) are presented in Table 2. Having a GLR value equal to or greater than 2.5 implies that no heat loss occurs in the corresponding month.

2.5. Limitations of the National Standard

The national standard requires that when the whole or independent parts of existing buildings are subjected to substantial repair or amendment, the resulting heat transfer coefficients of the exterior wall (Uew), ceiling (Uce), basement (Ubs), and glazing (Ugl) should be equal to or smaller than the limiting values indicated in the standard (Table 3). As the insulation is implemented to the exterior wall and ceiling, the resulting heat transfer coefficients (Uew and Uce) need to be less than 0.60 and 0.40 W/m2K, respectively.
The heat transfer coefficients of the insulated building are summarized in Table 4. The coefficients that satisfy the standard limits are colored in gray. The EPS insulation applied to the exterior walls needs to satisfy the requirements of the standard for both the infilled and reinforced concrete (RC) walls. Thus, the minimum applicable insulation thickness of EPS on exterior walls is 5 cm. A minimum XPS thickness of 8 cm can satisfy the requirements for the ceiling. This results in 17 insulation alternatives for the exterior walls (none or 5–15 cm) and 14 insulation alternatives for the ceiling (none or 8–20 cm), the combination of which leads to a total of 238 different insulation applications.

2.6. Life Cycle Costing Analysis

The financial benefits of 238 different insulation applications were determined based on the life cycle costing analysis. From the financial perspective, insulation application implies an initial cost and annual savings in the following years. The initial cost is the cost of implementing insulation, which can be subdivided into the material cost, auxiliary item cost, and application cost. The initial cost was determined by taking offers from construction companies. Annual savings occur due to the decrease in the annual energy requirement. The annual saving is equal to the difference between the annual energy requirement of the uninsulated and insulated building.
A cash flow diagram was created for each insulation application. The diagram considered a period of 20 years in line with the assumptions made in the literature [21]. Financial parameters such as the net savings (NS), internal rate of return (IRR), savings-to-investment ratio (SIR), and payback period (PBP) were calculated for each insulation application to discover the potential benefits of insulation applications and determine the optimum alternative. Scenario analysis was conducted to observe the effect of changes in inflation and interest rates on the financial parameters and optimum insulation alternative.
NS measures the cost effectiveness of the benefits to be achieved from the investments. It is obtained by subtracting the present value of investment costs from the present value of the savings.
N S = t = 0 N S t 1 + i t I n v t 1 + i t
where S is the saving, Inv is the investment, i is the interest rate, t is the time, and N is the period of the study, which was assumed as 20 years.
IRR represents the annual rate of return to be earned on a project. It is equal to the discount rate that makes the net present value of a project zero.
0 = t = 0 N S t 1 + I R R t I n v t 1 + I R R t
SIR is the ratio of the net present value of the savings to the net present value of the investment. It should be greater than 1.0 to be considered as an alternative and regarded as cost-effective.
S I R = t = 0 N S t 1 + i t t = 0 N I n v t 1 + i t
PBP shows the minimum time satisfying the condition that cash inflows offset the investment costs.

2.7. Evaluation of Alternative Design

The university building under investigation had no inclined roof and, thus, the insulation implementation on the ceiling was restricted to XPS insulation on the interior side. In an attempt to observe the effect of the building geometry (presence of the inclined roof) on the results, the process was repeated with the assumption that the building had an inclined roof. The presence of the non-heated attic with sloping roof pitches could enable the application of alternative insulation materials such as stone wool on the exterior side, which would lead to a significant decrease in the initial cost. The probable changes in the financial parameters and optimum insulation alternative were noted.

3. Research Results and Discussion

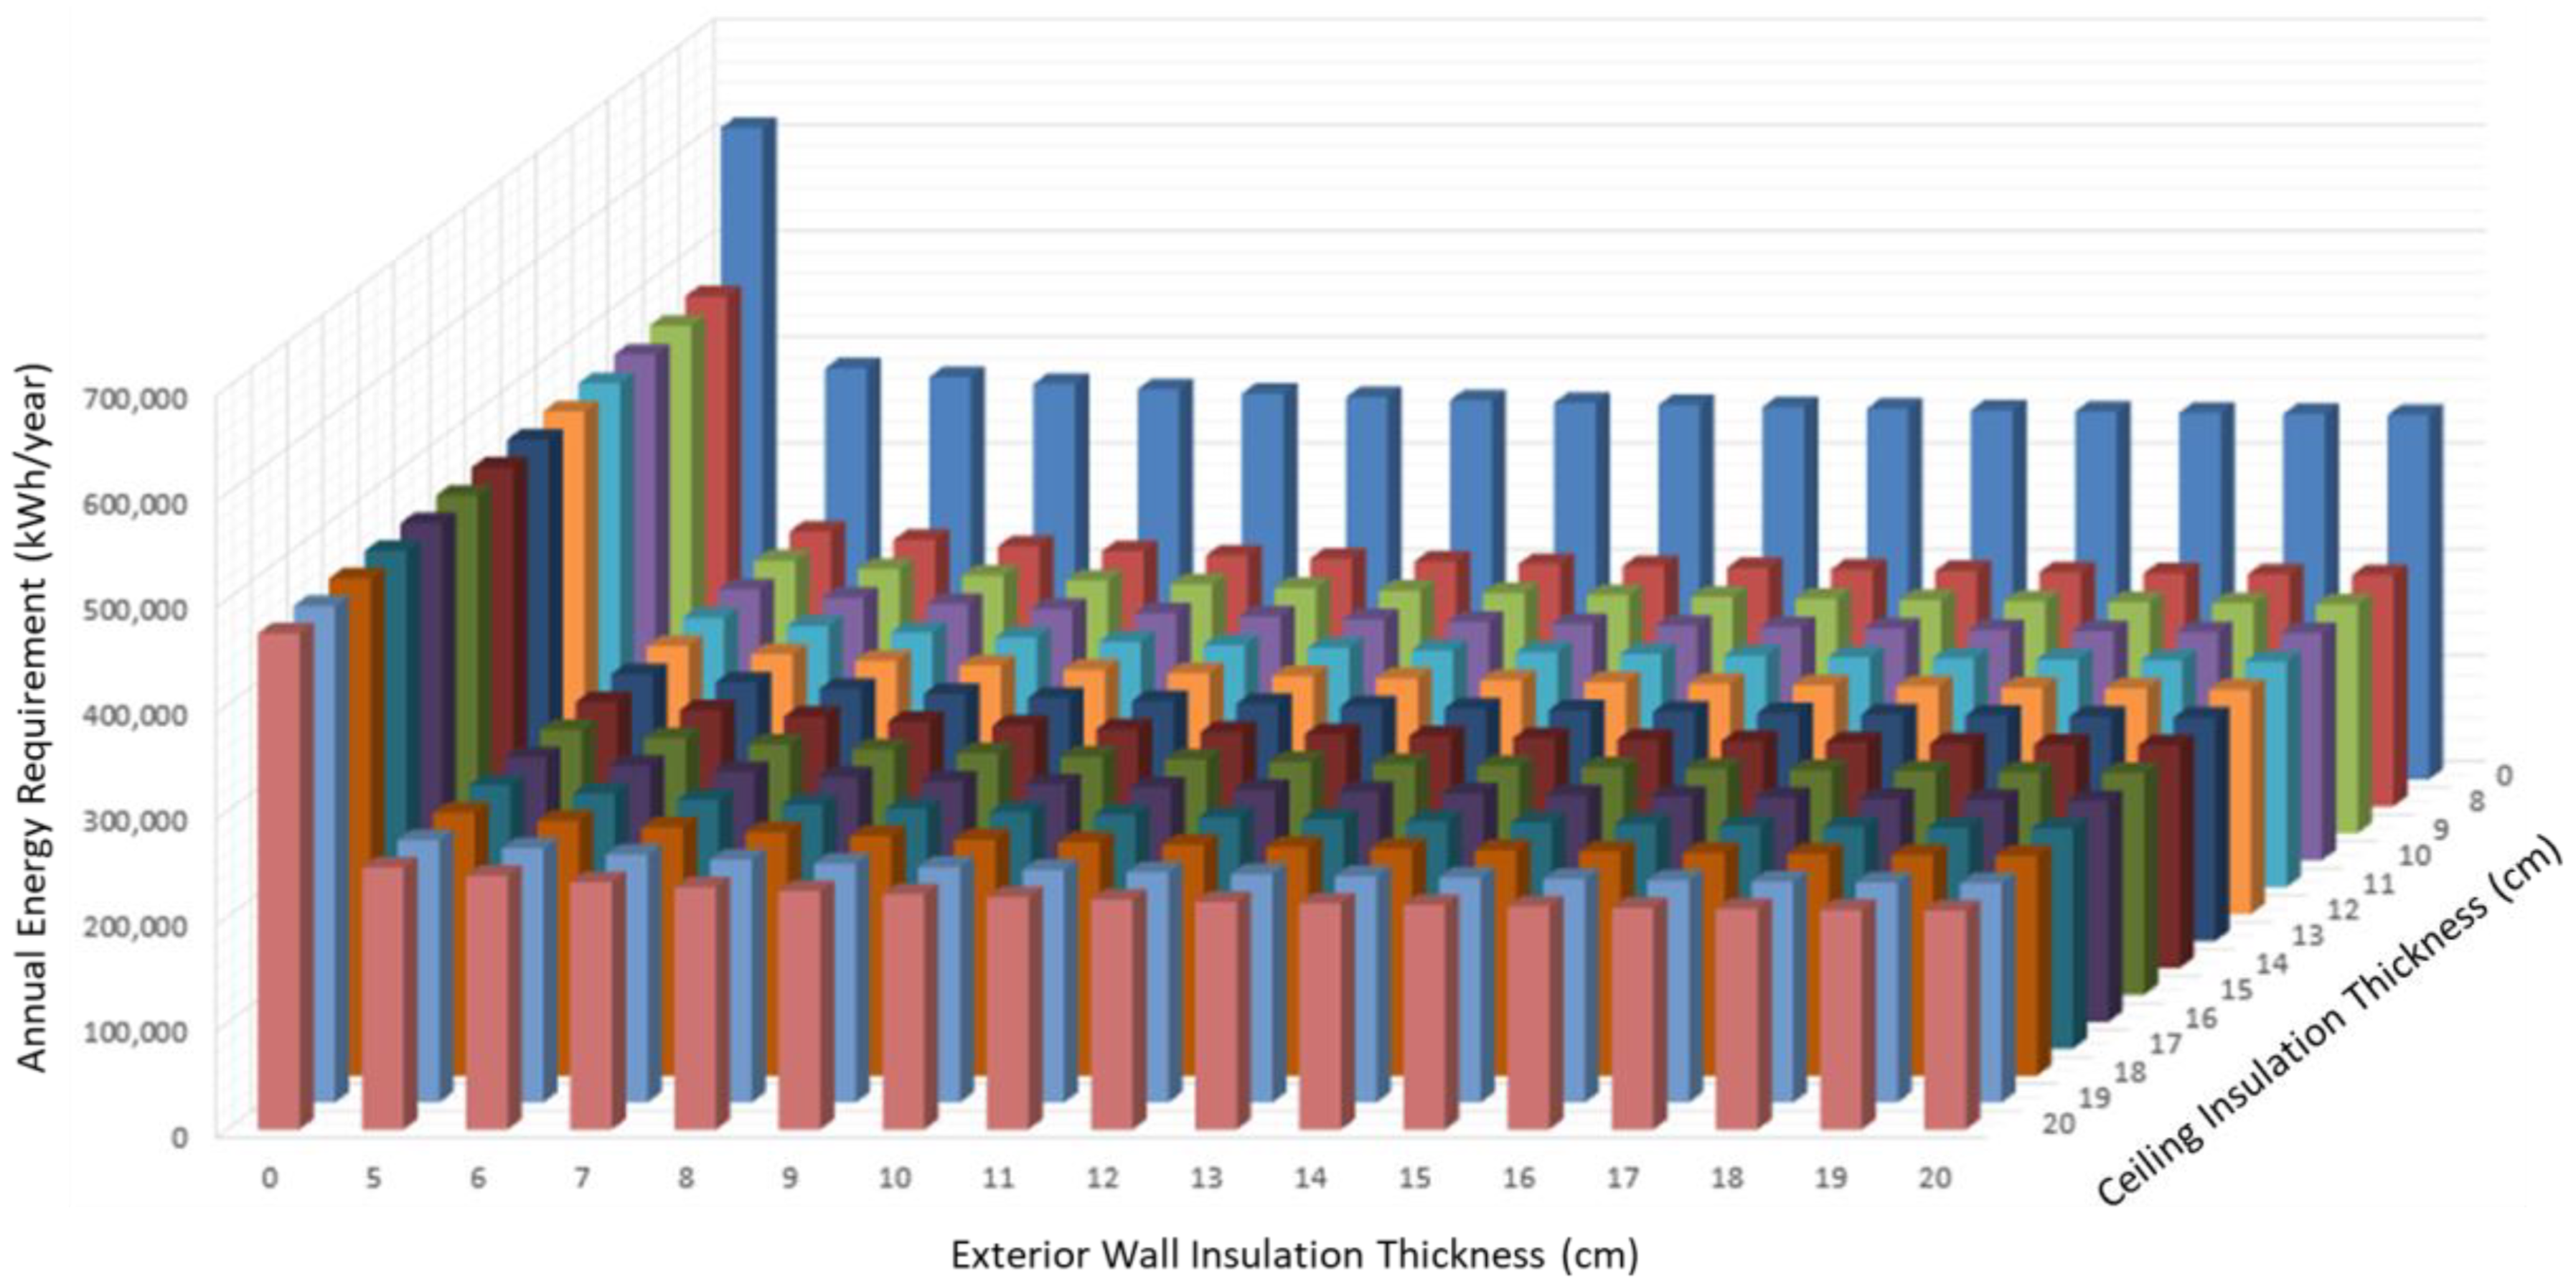
3.1. Annual Energy Requirement and Saving

The annual energy requirement and saving are summarized in Table 5 and the annual energy requirement is graphically presented in Figure 4. Each cell in the table is composed of the values where the upper represents the annual energy requirement and the lower stands for the annual energy saving. The annual energy requirement of the uninsulated building (the current form) is 615,056 kWh/year. Insulating the building according to the minimum thicknesses that satisfy the standard limitations decreases the annual energy requirement to 259,360 kWh/year, providing a saving of 57.8%. Increasing the insulation thicknesses can increase the saving amount up to 66.4%. Nevertheless, it should be noted that the increasing insulation thickness also results in a greater initial cost and, thus, does not guarantee better financial results.

3.2. Cost of Insulation

The insulation cost was determined by receiving offers from construction firms (Table 6). The cost of an insulation application includes the cost of material, auxiliary items, and application. It was initially assumed that EPS insulation would be applied on the exterior walls and XPS insulation would be applied on the interior side of the ceiling. In order to evaluate the changes in case of the inclined roof, the cost of stone wool application on the exterior side of the ceiling was also obtained. As the stone wool is simply spread over the ceiling, the cost only includes the cost of the material. It does not necessarily require auxiliary items and the application cost becomes negligible. It was observed that the presence or lack of the inclined roof caused a considerable difference in the cost of insulation application on the ceiling and consequently in the initial cost.

3.3. Cash Flow Diagrams

A cash flow diagram was generated for each insulation application and Table 7 illustrates the diagrams of certain applications for an inflation and interest rate of 15% and 17%, respectively. The annual savings were calculated based on the assumption that the cost of natural gas was 0.026 USD/kWh in the base year and would increase in harmony with the inflation rate. Financial parameters indicated the financial feasibility of insulation applications in existing public buildings. The cases showed that NS values were clearly positive, IRR values were mostly greater than 30%, SIR values were greater than 2, and PBP values were less than 7 years.
NS values of all insulation applications are summarized in Table 8 and Figure 5 for an inflation and interest rate of 15% and 17%, respectively. The insulation alternative with the greatest NS value is regarded as the optimum alternative. It is observed that insulating the building with minimum insulation thicknesses satisfying the standard limits could provide a saving of USD 112,838. However, greater savings could be attained by increasing the thicknesses of insulation materials. The optimum insulation application is identified as the application of 9 cm EPS on the exterior walls and 8 cm XPS on the ceiling, which results in a saving of USD 116,344.

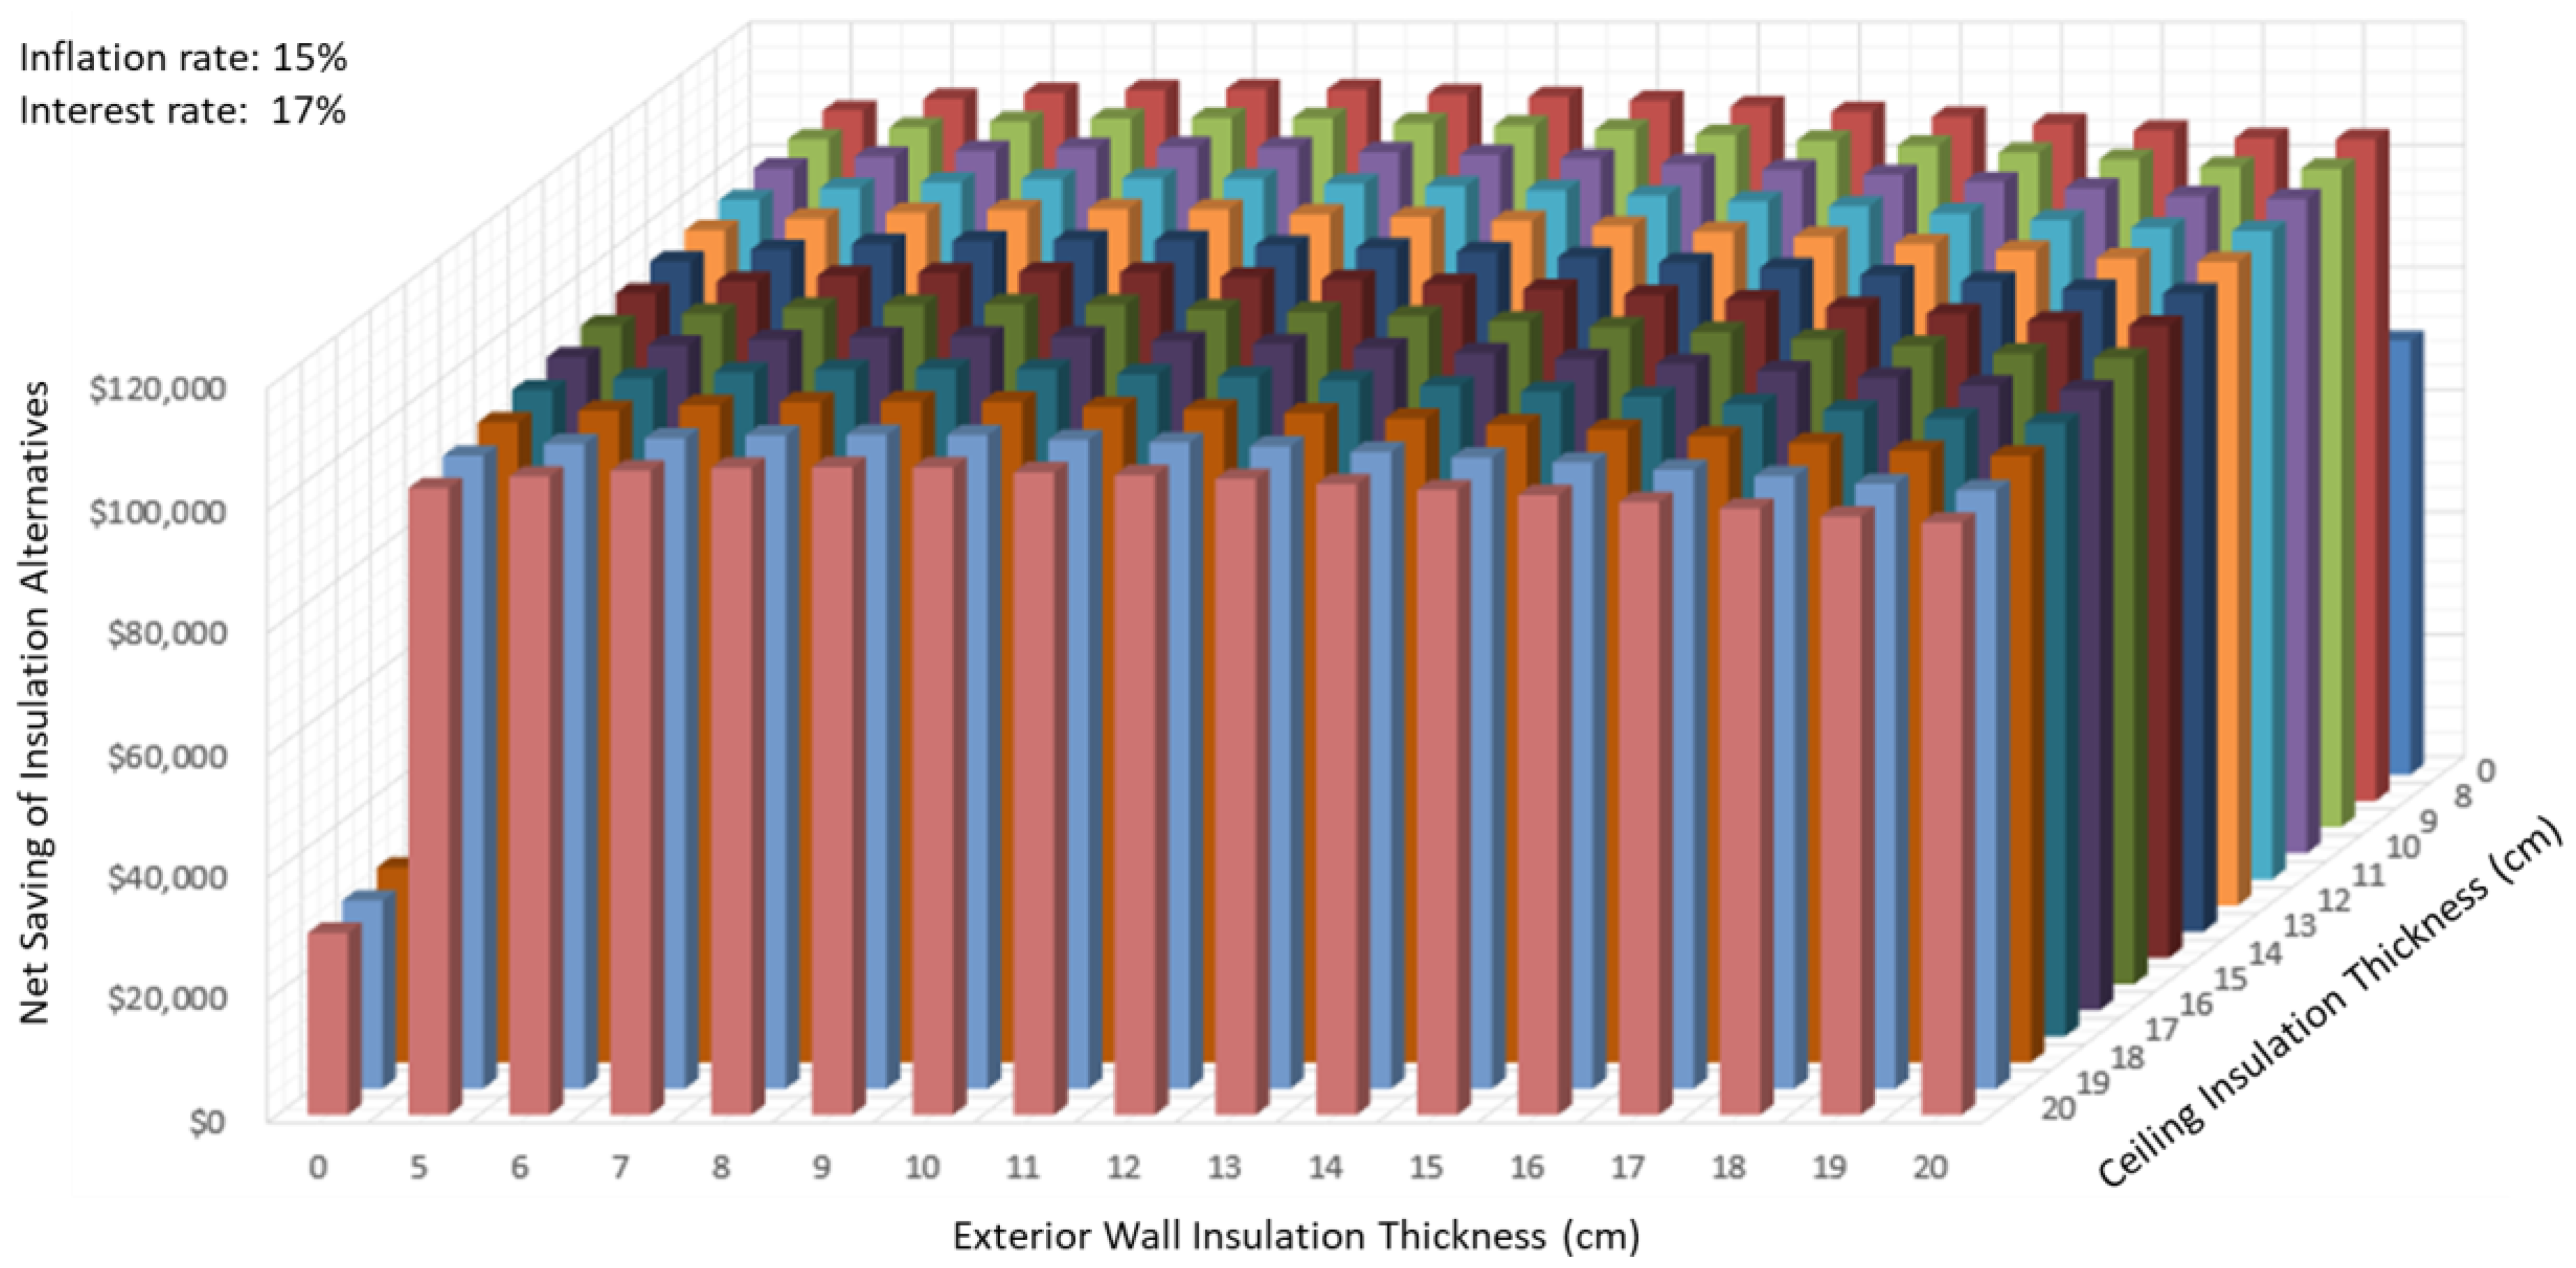
3.4. Scenario Analysis and Optimum Insulation Thickness

Generation of the cash flow diagrams for each insulation application was repeated for varying interest and inflation rates. The analysis included a total of nine different scenarios, where the interest and inflation rates varied between 15–19% and 13–17%, respectively. The optimum insulation application was noted for each scenario and the financial results of these optimum thicknesses are presented in Table 9. The optimum EPS thickness on the exterior walls changed between 7 and 10 cm, while the optimum XPS thickness on the ceiling in all scenarios was 8 cm, which corresponded to the minimum insulation thickness satisfying the standard limits. Financial parameters of optimum insulation applications demonstrated the profitability of these public investments. The NS values ranged between USD 74,707 and 182,503, IRR values were more than two times the interest rates, SIR values were mostly greater than 3 and went up to 5, and the PBP values were only 4–5 years.

3.5. Case of the Inclined Roof

Investigation of the financial feasibility and the optimization process were repeated for the case of the inclined roof, and changes in the financial parameters and optimum insulation thicknesses were observed (Table 10). The optimum thickness of EPS insulation remained the same as expected. However, the notably lower cost of stone wool application increased the optimum insulation thickness applied on the ceiling to 10–14 cm. Financial parameters were also influenced by the reflections of this situation on the cash flow diagram. NS values had an increase of approximately 20%, IRR values became greater than 50%, SIR values had an increase of more than 50%, and PBP became less than 4 years.

4. Conclusions

This study discovered the potential benefits of insulation application in existing public buildings. Insulation applications satisfying the standard limits were considered as the alternatives and the optimum alternative was determined through the life cycle costing analysis with different scenarios of inflation and interest rates. Changes in the optimization process were observed for the case of an alternative building geometry. The findings show that
  • The optimum insulation application depends considerably on the scenario of the inflation and interest rates;
  • Benefits of the insulation application are greatly influenced by the building geometry, more specifically, the presence of the inclined roof.
Cash flow diagrams generated under different economic scenarios demonstrated the profitability of thermal insulation in public buildings. The diagrams of optimum applications produced NS values greater than zero, IRR values greater than the interest rates, SIR values greater than one, and payback period less than five years. The financial results (and thus the optimum insulation alternatives) varied with the scenario of the inflation and interest rates. It was observed that the presence of the inclined roof could provide even better financial results as it enabled the use of alternative cost-effective insulation materials on the ceiling.
Governments encourage their citizens to invest in energy conservation instruments in an attempt to actualize the national energy strategies focusing on decreasing the energy requirement and greenhouse gas emissions. These attempts are not perfectly effective, as convincing home owners for such investments requires raising awareness of the life cycle costing concept where the benefits are obtained in the course of time. This study demonstrates the profitability of thermal insulation in existing public buildings, which can be achieved with the governments’ own initiatives. Investing in the thermal insulation of public buildings should be considered as an alternative path for governments to achieve the objectives of their national energy strategies.
This study examined the financial feasibility of thermal insulation for an administrative university building. The results cannot be generalized for residential buildings or other types of public buildings such as hospitals. This is mainly because the calculation of the annual energy requirement changes according to the building functionality. To illustrate, the monthly average indoor temperature (θin) is taken as 19 °C, 20 °C, and 22 °C for residential buildings, education buildings, and hospitals, respectively. The changing energy calculation method in the national standard necessitates repetition of the analysis for the other building types. Yet, the analysis provided with this demonstrates the potential benefits of energy efficiency measures in public buildings.
The illustrated optimization process can be repeated for existing public buildings in other cities or countries to observe the changes in potential benefits. The results may change with respect to the building geometry, building functionality, standard limitations in the corresponding country, availability and cost of insulation materials, and climate properties. The identified optimum insulation alternative and financial benefits can be compared to investigate potential differences across cities/countries and the reasons behind these differences can be discussed. Country-specific suggestions can be provided to promote energy efficiency and enhance the return on investment in corresponding countries.

Author Contributions

Conceptualization, S.C.; Methodology, R.K.; Validation, R.K.; Formal analysis, R.K.; Writing—review & editing, S.C.; Supervision, S.C. All authors have read and agreed to the published version of the manuscript.

Funding

This research received no external funding.

Data Availability Statement

Data should be made available on request.

Conflicts of Interest

The authors declare no conflict of interest.

Nomenclature

Aarea (m2)
Anbuilding usage area (m2)
Fwcorrection factor for windows
Gsolar energy permeation factor of the transparent elements
gsolar energy permeation factor measured under laboratory conditions
Hspecific heat loss of the building (W/K)
Imonthly average solar radiation intensity (W/m2)
iinterest rate (%)
Invinvestment (USD)
IRRinternal rate of return (%)
naair changing ratio
Nperiod of the study (year)
NSnet savings (USD)
PBPpayback period (year)
Qmmonthly heating energy consumption (kWh/month)
Qyearannual heating energy consumption (kWh/year)
rmonthly average shading factor of the transparent surfaces
Ssaving
SIRsavings-to-investment ratio
ttime
Uheat transfer coefficient ((W/m2)/K)
Vvolume (m3)
ηaverage usage factor of heat gain
θtemperature (°C)
φaverage heat gain (W)
Subscripts
ceceiling
edexterior door
ewexterior wall
flfloor
glglazing
ininside
jmonth
kdirection
outoutside
ssolar
trtransfer
venventilation

References

  1. Zune, M.; Pantua, C.A.J.; Rodrigues, L.; Gillott, M. A review of traditional multistage roofs design and performance in vernacular buildings in Myanmar. Sustain. Cities Soc. 2020, 60, 102240. [Google Scholar] [CrossRef]
  2. Bertoldi, P. Policies for energy conservation and sufficiency: Review of existing policies and recommendations for new and effective policies in OECD countries. Energy Build. 2022, 264, 112075. [Google Scholar] [CrossRef]
  3. Buonomano, A.; Barone, G.; Forzano, C. Advanced energy technologies, methods, and policies to support the sustainable development of energy, water and environment systems. Energy Rep. 2022, 8, 4844–4853. [Google Scholar] [CrossRef]
  4. International Energy Agency. Tracking Buildings 2020; International Energy Agency: Paris, France, 2020. [Google Scholar]
  5. Mariano-Hernández, D.; Hernández-Callejo, L.; Zorita-Lamadrid, A.; Duque-Pérez, O.; García, F.S. A review of strategies for building energy management system: Model predictive control, demand side management, optimization, and fault detect & diagnosis. J. Build. Eng. 2021, 33, 101692. [Google Scholar]
  6. Lu, C.; Li, S.; Lu, Z. Building energy prediction using artificial neural networks: A literature survey. Energy Build. 2022, 262, 111718. [Google Scholar] [CrossRef]
  7. Malinauskaite, J.; Jouhara, H.; Ahmad, L.; Milani, M.; Montorsi, L.; Venturelli, M. Energy efficiency in industry: EU and national policies in Italy and the UK. Energy 2019, 172, 255–269. [Google Scholar] [CrossRef]
  8. Aslani, A.; Bakhtiar, A.; Akbarzadeh, M.H. Energy-efficiency technologies in the building envelope: Life cycle and adaptation assessment. J. Build. Eng. 2019, 21, 55–63. [Google Scholar] [CrossRef]
  9. Najjar, M.; Figueiredo, K.; Hammad, A.W.; Haddad, A. Integrated optimization with building information modeling and life cycle assessment for generating energy efficient buildings. Appl. Energy 2019, 250, 1366–1382. [Google Scholar] [CrossRef]
  10. Kalmár, F. Summer operative temperatures in free running existing buildings with high glazed ratio of the facades. J. Build. Eng. 2016, 6, 236–242. [Google Scholar] [CrossRef]
  11. Sharma, S.K.; Mohapatra, S.; Sharma, R.C.; Alturjman, S.; Altrjman, C.; Mostarda, L.; Stephan, T. Retrofitting existing buildings to improve energy performance. Sustainability 2022, 14, 666. [Google Scholar] [CrossRef]
  12. Pohoryles, D.; Bournas, D.; Da Porto, F.; Caprino, A.; Santarsiero, G.; Triantafillou, T. Integrated seismic and energy retrofitting of existing buildings: A state-of-the-art review. J. Build. Eng. 2022, 61, 105274. [Google Scholar] [CrossRef]
  13. Grossman, P.Z. Energy shocks, crises and the policy process: A review of theory and application. Energy Policy 2015, 77, 56–69. [Google Scholar] [CrossRef]
  14. Caglayan, S.; Ozorhon, B.; Kurnaz, L. Nationwide mapping of optimum wall insulation thicknesses: A stochastic approach. J. Therm. Sci. Technol. 2022, 42, 169–202. [Google Scholar] [CrossRef]
  15. Economidou, M.; Todeschi, V.; Bertoldi, P.; D’Agostino, D.; Zangheri, P.; Castellazzi, L. Review of 50 years of EU energy efficiency policies for buildings. Energy Build. 2020, 225, 110322. [Google Scholar] [CrossRef]
  16. Kinley, R. Climate change after Paris: From turning point to transformation. Clim. Policy 2017, 17, 9–15. [Google Scholar] [CrossRef]
  17. European Parliament and Council. Directive 2012/27/EU of the European Parliament and of the Council of 25 October 2012 on energy efficiency, amending Directives 2009/125/EC and 2010/30/EU and repealing Directives 2004/8/EC and 2006/32/EC. Off. J. Eur. Union 2012, 14112012, 1–56. [Google Scholar]
  18. Presidente Della Repubblica Italiana. ‘Decree 34/2020. Misure Urgenti in Materia di Salute, Sostegno al Lavoro e All’economia, Nonché di Politiche Sociali Connesse All’emergenza Epidemiologica da COVID-19 Gazzetta Ufficiale Della Repubblica Italiana n. 21 del 19.05.2020′; Gazzetta Ufficiale Della Repubblica Italiana: Rome, Italy, 2020. [Google Scholar]
  19. MENR. The National Energy Efficiency Action Plan; Republic of Türkiye Ministry of Energy and Natural Resources: Ankara, Turkey, 2018. [Google Scholar]
  20. MENR. Türkiye National Energy Plan; Republic of Türkiye Ministry of Energy and Natural Resources: Ankara, Turkey, 2022. [Google Scholar]
  21. Caglayan, S.; Ozorhon, B.; Ozcan, G.; Yigit, S. A life cycle costing approach to determine the optimum insulation thickness of existing buildings. J. Therm. Sci. Technol. 2020, 40, 1–14. [Google Scholar]
  22. Hussein, M.H.; Monna, S.; Abdallah, R.; Juaidi, A.; Albatayneh, A. Improving the thermal performance of building envelopes: An approach to enhancing the building energy efficiency code. Sustainability 2022, 14, 16264. [Google Scholar] [CrossRef]
  23. He, Y.; Chen, Y.; Chen, Z.; Deng, Z.; Yuan, Y. Impacts of occupant behavior on building energy consumption and energy savings analysis of upgrading ASHRAE 90.1 energy efficiency standards. Buildings 2022, 12, 1108. [Google Scholar] [CrossRef]
  24. Wang, X.; Yuan, J.; You, K.; Ma, X.; Li, Z. Using real building energy use data to explain the energy performance gap of energy-efficient residential buildings: A case study from the hot summer and cold winter zone in China. Sustainability 2023, 15, 1575. [Google Scholar] [CrossRef]
  25. Runge, J.; Zmeureanu, R. Forecasting energy use in buildings using artificial neural networks: A review. Energies 2019, 12, 3254. [Google Scholar] [CrossRef]
  26. Le, L.T.; Nguyen, H.; Dou, J.; Zhou, J. A comparative study of PSO-ANN, GA-ANN, ICA-ANN, and ABC-ANN in estimating the heating load of buildings’ energy efficiency for smart city planning. Appl. Sci. 2019, 9, 2630. [Google Scholar] [CrossRef]
  27. Pham, A.-D.; Ngo, N.-T.; Truong, T.T.H.; Huynh, N.-T.; Truong, N.-S. Predicting energy consumption in multiple buildings using machine learning for improving energy efficiency and sustainability. J. Clean. Prod. 2020, 260, 121082. [Google Scholar] [CrossRef]
  28. Belussi, L.; Barozzi, B.; Bellazzi, A.; Danza, L.; Devitofrancesco, A.; Fanciulli, C.; Ghellere, M.; Guazzi, G.; Meroni, I.; Salamone, F.; et al. A review of performance of zero energy buildings and energy efficiency solutions. J. Build. Eng. 2019, 25, 100772. [Google Scholar] [CrossRef]
  29. Lidelöw, S.; Örn, T.; Luciani, A.; Rizzo, A. Energy-efficiency measures for heritage buildings: A literature review. Sustain. Cities Soc. 2019, 45, 231–242. [Google Scholar] [CrossRef]
  30. Farzaneh, H.; Malehmirchegini, L.; Bejan, A.; Afolabi, T.; Mulumba, A.; Daka, P.P. Artificial intelligence evolution in smart buildings for energy efficiency. Appl. Sci. 2021, 11, 763. [Google Scholar] [CrossRef]
  31. Nair, G.; Verde, L.; Olofsson, T. A review on technical challenges and possibilities on energy efficient retrofit measures in heritage buildings. Energies 2022, 15, 7472. [Google Scholar] [CrossRef]
  32. Serale, G.; Fiorentini, M.; Capozzoli, A.; Bernardini, D.; Bemporad, A. Model predictive control (MPC) for enhancing building and HVAC system energy efficiency: Problem formulation, applications and opportunities. Energies 2018, 11, 631. [Google Scholar] [CrossRef]
  33. Bughio, M.; Khan, M.S.; Mahar, W.A.; Schuetze, T. Impact of passive energy efficiency measures on cooling energy demand in an architectural campus building in Karachi, Pakistan. Sustainability 2021, 13, 7251. [Google Scholar] [CrossRef]
  34. Chippagiri, R.; Gavali, H.R.; Ralegaonkar, R.V.; Riley, M.; Shaw, A.; Bras, A. Application of sustainable prefabricated wall technology for energy efficient social housing. Sustainability 2021, 13, 1195. [Google Scholar] [CrossRef]
  35. Meena, C.S.; Prajapati, A.N.; Kumar, A.; Kumar, M. Utilization of solar energy for water heating application to improve building energy efficiency: An experimental study. Buildings 2022, 12, 2166. [Google Scholar] [CrossRef]
  36. Albatayneh, A.; Albadaineh, R.; Juaidi, A.; Abdallah, R.; Zabalo, A.; Manzano-Agugliaro, F. Enhancing the energy efficiency of buildings by shading with PV panels in semi-arid climate zone. Sustainability 2022, 14, 17040. [Google Scholar] [CrossRef]
  37. TEC. Turkish Earthquake Code: Regulations on Structures Constructed in Disaster Regions; Ministry of Public Works and Settlement: Ankara, Turkiye, 2007. [Google Scholar]
  38. Arslan, M.H. An evaluation of effective design parameters on earthquake performance of RC buildings using neural networks. Eng. Struct. 2010, 32, 1888–1898. [Google Scholar] [CrossRef]
  39. TS 825; Thermal İnsulation Requirements for Buildings. Turkish Standard Institution: Ankara, Turkiye, 2008.
  40. Dombaycı, A. Degree-days maps of Turkey for various base temperatures. Energy 2009, 34, 1807–1812. [Google Scholar] [CrossRef]
Figure 1. The profile and floor plan of T2 building.
Buildings 13 02586 g001
Figure 2. Flowchart of research methodology.
Buildings 13 02586 g002
Figure 3. Cross-section of the building envelope.
Buildings 13 02586 g003
Figure 4. Graphical presentation of annual energy requirement.
Buildings 13 02586 g004
Figure 5. Graphical presentation of net saving.
Buildings 13 02586 g005
Table 1. Monthly average solar radiation intensities (W/m2).
Solar RadiationMonths
JanuaryFebruaryMarchAprilMayJuneJulyAugustSeptemberOctoberNovemberDecember
Isouth728487909295939389826764
Inorth263752667983817357402722
Ieast/west4357779011412211810681594137
Table 2. Monthly average outdoor temperatures (°C).
MonthRegion 1Region 2Region 3Region 4
January8.42.9−0.3−5.4
February9.04.40.1−4.7
March11.67.34.10.3
April15.812.810.17.9
May21.218.014.412.8
June26.322.518.517.3
July28.724.921.721.4
August27.624.321.221.1
September23.519.917.216.5
October18.514.111.610.3
November13.08.55.63.1
December9.33.81.3−2.8
Table 3. Limiting heat transfer coefficients for existing buildings (W/m2K) [39].
RegionUewUceUbsUgl
Region 10.700.450.702.40
Region 20.600.400.602.40
Region 30.500.300.452.40
Region 40.400.250.402.40
Table 4. Heat transfer coefficients of insulation applications.
Uew Coefficient (W/m2K)Uce Coefficient (W/m2K)
ThicknessInfilled WallRC WallThicknessCeiling
Thickness of EPS insulation on the exterior wall (cm)01.6703.239Thickness of XPS insulation on the ceiling (cm)02.479
11.1021.62011.451
20.8381.10721.026
30.6760.84130.793
40.5760.67840.647
50.4880.56850.546
60.4280.48960.472
70.3810.42970.416
80.3440.38280.372
90.3130.34490.336
100.2870.314100.307
110.2660.288110.282
120.2470.266120.261
130.2310.247130.243
140.2160.231140.227
150.2040.217150.213
160.1930.204160.201
170.1830.193170.190
180.1730.183180.180
190.1650.174190.171
200.1580.165200.163
Table 5. Annual energy requirement/saving (kWh/year).
Exterior Wall Insulation Thickness (cm)
0567891011121314151617181920
Ceiling Insulation Thickness (cm)0615,056
0
387,987
227,069
379,657
235,399
373,268
241,788
368,210
246,846
364,107
250,950
360,710
254,346
357,852
257,205
355,413
259,643
353,308
261,748
351,473
263,583
349,858
265,198
348,427
266,630
347,149
267,907
346,001
269,055
344,965
270,092
344,024
271,032
8481,319
133,737
259,360
355,696
251,509
363,547
245,501
369,555
240,754
374,303
236,908
378,149
233,728
381,328
231,056
384,000
228,778
386,278
226,814
388,243
225,102
389,954
223,597
391,459
222,264
392,793
221,074
393,982
220,006
395,050
219,042
396,014
218,168
398,909
9479,072
135,984
257,282
357,775
249,441
365,615
243,440
371,616
238,700
376,357
234,859
380,197
231,684
383,372
229,016
386,041
226,742
388,315
224,780
390,276
223,071
391,985
221,568
393,488
220,237
394,819
219,049
396,007
217,983
397,073
217,021
398,036
216,148
400,572
10477,220
137,836
255,569
359,487
247,737
367,319
241,743
373,313
237,008
378,049
233,172
381,885
230,001
385,056
227,335
387,721
225,064
389,992
223,105
391,951
221,398
393,658
219,898
395,159
218,568
396,488
217,382
397,674
216,317
398,739
215,356
399,700
214,484
401,966
11475,667
139,389
254,135
360,922
246,309
368,747
240,321
374,736
235,590
379,466
231,758
383,299
228,590
386,466
225,928
389,129
223,659
391,398
221,702
393,355
219,997
395,060
218,498
396,559
217,170
397,887
215,985
399,071
214,921
400,135
213,961
401,095
213,090
403,151
12474,346
140,710
252,915
362,142
245,095
369,961
239,112
375,945
234,385
380,672
230,556
384,501
227,391
387,666
224,731
390,326
222,464
392,593
220,509
394,548
218,805
396,251
217,308
397,749
215,981
399,075
214,797
400,259
213,735
401,321
212,776
402,281
211,906
404,170
13473,208
141,848
251,865
363,192
244,050
371,006
238,071
376,985
233,347
381,709
229,521
385,535
226,359
388,698
223,701
391,355
221,436
393,621
219,482
395,574
217,780
397,276
216,284
398,772
214,958
400,098
213,776
401,281
212,714
402,342
211,756
403,301
210,886
405,056
14472,218
142,838
250,952
364,105
243,142
371,915
237,166
377,890
232,445
382,611
228,622
386,435
225,461
389,595
222,805
392,251
220,542
394,515
218,590
396,467
216,889
398,167
215,394
399,663
214,069
400,987
212,887
402,169
211,826
403,230
210,869
404,187
210,000
405,834
15471,349
143,707
250,150
364,906
242,344
372,712
236,372
378,684
231,654
383,402
227,832
387,224
224,674
390,382
222,019
393,037
219,757
395,299
217,806
397,250
216,107
398,950
214,612
400,444
213,289
401,768
212,108
402,949
211,048
404,009
210,091
404,966
209,223
406,522
16470,580
144,476
249,441
365,615
241,639
373,417
235,669
379,387
230,954
384,103
227,134
387,922
223,977
391,079
221,324
393,732
219,063
395,993
217,114
397,943
215,415
399,642
213,921
401,135
212,598
402,458
211,418
403,638
210,358
404,698
209,402
405,654
208,535
407,135
17469,895
145,162
248,809
366,247
241,010
374,046
235,043
380,013
230,330
384,727
226,512
388,544
223,357
391,700
220,705
394,351
218,445
396,611
216,496
398,560
214,798
400,258
213,306
401,751
211,983
403,073
210,804
404,253
209,745
405,312
208,789
406,268
207,922
407,684
18469,280
145,777
248,243
366,813
240,447
374,610
234,482
380,574
229,770
385,286
225,954
389,102
222,800
392,256
220,150
394,907
217,891
397,166
215,943
399,114
214,246
400,811
212,754
402,303
211,432
403,624
210,253
404,804
209,194
405,862
208,239
406,817
207,372
408,179
19468,725
146,331
247,732
367,324
239,939
375,118
233,976
381,080
229,266
385,790
225,451
389,605
222,298
392,758
219,649
395,407
217,391
397,665
215,444
399,613
213,747
401,309
212,256
402,800
210,935
404,122
209,756
405,300
208,698
406,358
207,743
407,313
206,877
408,179
20468,222
146,834
247,269
367,787
239,478
375,578
233,517
381,539
228,809
386,247
224,995
390,061
221,844
393,213
219,195
395,861
216,938
398,118
214,992
400,065
213,296
401,761
211,805
403,251
210,484
404,572
209,306
405,750
208,249
406,808
207,294
407,762
206,428
408,628
Table 6. Cost of insulation applications (USD/m2).
Thickness
(cm)
Expanded Polystyrene (EPS)Extruded Polystyrene (XPS)Stone Wool
Mat.Aux.App.TotalMat.Aux.App.Total
10.682.573.907.151.172.573.907.640.43
21.352.573.907.822.342.573.908.810.86
32.022.573.908.493.512.573.909.981.29
42.702.573.909.174.692.573.9011.161.72
53.382.633.909.915.852.633.9012.382.15
64.052.633.9010.587.022.633.9013.552.58
74.722.673.9511.348.202.673.9514.823.01
85.402.674.0012.079.362.674.0016.033.44
96.072.724.0012.7910.542.724.0017.263.87
106.742.724.0013.4611.702.724.0018.424.30
117.432.924.0514.4012.872.924.0519.844.73
128.102.924.0515.0714.052.924.0521.025.16
138.772.954.0515.7715.212.954.0522.215.59
149.442.954.1516.5416.392.954.1523.496.02
1510.123.034.1517.3017.563.034.1524.746.45
1610.793.034.1517.9718.733.034.1525.916.88
1711.463.064.2518.7719.903.064.2527.217.31
1812.133.124.2519.5021.073.124.2528.447.74
1912.823.154.3520.3222.243.154.3529.748.17
2013.493.154.3520.9923.413.154.3530.918.60
Table 7. Cash flow diagram of certain insulation applications (USD).
InsulationYearNS
(USD)
IRR
(%)
SIR
(-)
PBP
(Years)
0125131720
Wall: none
Ceiling: 8 cm
−16,67238674447676320,68836,18455,03139,71837.553.385–6
Wall: 5 cm
Ceiling: 8 cm
−37,14010,28411,82717,98755,02496,237146,364112,83842.304.044–5
Wall: 5 cm
Ceiling: 20 cm
−52,61210,63412,22918,59956,89499,508151,339102,46434.302.956–7
Wall: 6 cm
Ceiling: none
−21,8546806782711,90436,41463,68996,86377,40145.884.543–4
Wall: 8 cm
Ceiling: 15 cm
−50,66411,08512,74819,38859,310103,733157,764110,99636.133.195–6
Wall: 9 cm
Ceiling: 8 cm
−43,10110,93312,57319,12358,497102,311155,603116,34439.863.704–5
Wall: 9 cm
Ceiling: 20 cm
−58,57311,27812,97019,72560,340105,534160,504105,89533.242.816–7
Wall: 12 cm
Ceiling: 15 cm
−56,85211,42913,14419,99061,150106,951162,660109,82434.192.936–7
Wall: 18 cm
Ceiling: 20 cm
−72,43811,76213,52620,57262,930110,065167,39599,09129.792.377–8
Wall: 19 cm
Ceiling: 14 cm
−66,40011,68613,43920,43962,525109,356166,317104,02331.372.576–7
Table 8. Net saving of insulation alternatives (USD).
Exterior Wall Insulation Thickness (cm)
0567891011121314151617181920
Ceiling Insulation Thickness (cm)0 75,275 77,401 78,523 79,143 79,384 79,429 78,709 78,351 77,790 76,971 76,078 75,295 74,179 73,153 71,912 70,922
839,718 112,838 114,762 115,723 116,212 116,344 116,299 115,500 115,074 114,454 113,583 112,643 111,819 110,666 109,606 108,335 108,169
939,389 112,438 114,358 115,316 115,802 115,932 115,884 115,084 114,657 114,035 113,163 112,222 111,397 110,243 109,183 107,911 107,594
1038,957 111,947 113,863 114,819 115,303 115,431 115,382 114,580 114,151 113,529 112,656 111,714 110,889 109,734 108,672 107,400 106,969
1138,139 111,080 112,993 113,946 114,428 114,554 114,504 113,701 113,271 112,648 111,774 110,832 110,005 108,850 107,788 106,516 105,996
1237,472 110,370 112,281 113,231 113,712 113,837 113,785 112,981 112,551 111,927 111,052 110,109 109,283 108,127 107,065 105,791 105,202
1336,708 109,569 111,477 112,426 112,906 113,029 112,977 112,172 111,741 111,116 110,241 109,297 108,470 107,314 106,251 104,978 104,332
1435,797 108,626 110,532 111,480 111,958 112,081 112,027 111,221 110,789 110,164 109,288 108,345 107,517 106,360 105,297 104,023 103,331
1534,868 107,668 109,573 110,519 110,996 111,118 111,063 110,257 109,824 109,199 108,322 107,378 106,550 105,393 104,330 103,056 102,326
1633,968 106,743 108,646 109,591 110,067 110,188 110,133 109,326 108,893 108,267 107,390 106,445 105,617 104,460 103,396 102,122 101,360
1732,909 105,661 107,563 108,507 108,982 109,102 109,047 108,239 107,806 107,179 106,302 105,357 104,529 103,371 102,307 101,033 100,244
1831,894 104,625 106,526 107,469 107,943 108,063 108,006 107,198 106,764 106,137 105,260 104,315 103,486 102,328 101,264 99,990 99,178
1930,768 103,481 105,381 106,323 106,796 106,915 106,858 106,050 105,616 104,989 104,111 103,166 102,336 101,178 100,114 98,839 97,818
2029,768 102,464 104,362 105,304 105,777 105,895 105,838 105,029 104,594 103,967 103,089 102,143 101,314 100,156 99,091 97,816 96,795
Table 9. Scenario analysis of financial parameters.
NoInterest RateInflation RateOptimum ThicknessFinancial Parameters
WallCeilingNS (USD)IRRSIRPBP
1%15%139 cm8 cm118,68037.89%3.754–5 years
2%15%1510 cm8 cm147,25939.24%4.314–5 years
3%15%1710 cm8 cm182,50341.21%5.104–5 years
4%17%138 cm8 cm94,01538.57%3.264–5 years
5%17%159 cm8 cm116,34439.86%3.704–5 years
6%17%1710 cm8 cm143,98241.21%4.244–5 years
7%19%137 cm8 cm74,70739.24%2.864–5 years
8%19%158 cm8 cm92,40140.54%3.224–5 years
9%19%179 cm8 cm114,07441.83%3.654–5 years
Table 10. Optimum insulation thickness in case of the inclined roof.
NoInterest RateInflation RateOptimum ThicknessFinancial Parameters
WallCeilingNS (USD)IRRSIRPBP
1%15%139 cm11 cm142,007 50.25%5.533–4 years
2%15%1510 cm12 cm172,673 50.51%6.203–4 years
3%15%1710 cm14 cm210,586 51.68%7.183–4 years
4%17%138 cm10 cm115,587 52.24%4.933–4 years
5%17%159 cm11 cm139,504 52.24%5.453–4 years
6%17%1710 cm12 cm169,154 52.49%6.103–4 years
7%19%137 cm10 cm94,948 53.90%4.403–4 years
8%19%158 cm10 cm113,861 54.23%4.873–4 years
9%19%179 cm11 cm137,072 54.22%5.373–4 years
Disclaimer/Publisher’s Note: The statements, opinions and data contained in all publications are solely those of the individual author(s) and contributor(s) and not of MDPI and/or the editor(s). MDPI and/or the editor(s) disclaim responsibility for any injury to people or property resulting from any ideas, methods, instructions or products referred to in the content.

