
Effects of Concrete Strength and CFRP Cloth Ratio on the Shear Performance of CFRP Cloth Strengthened RC Beams


Abstract
:1. Introduction
2. Modeling Approach
2.1. Analytical Model
2.2. Component Properties
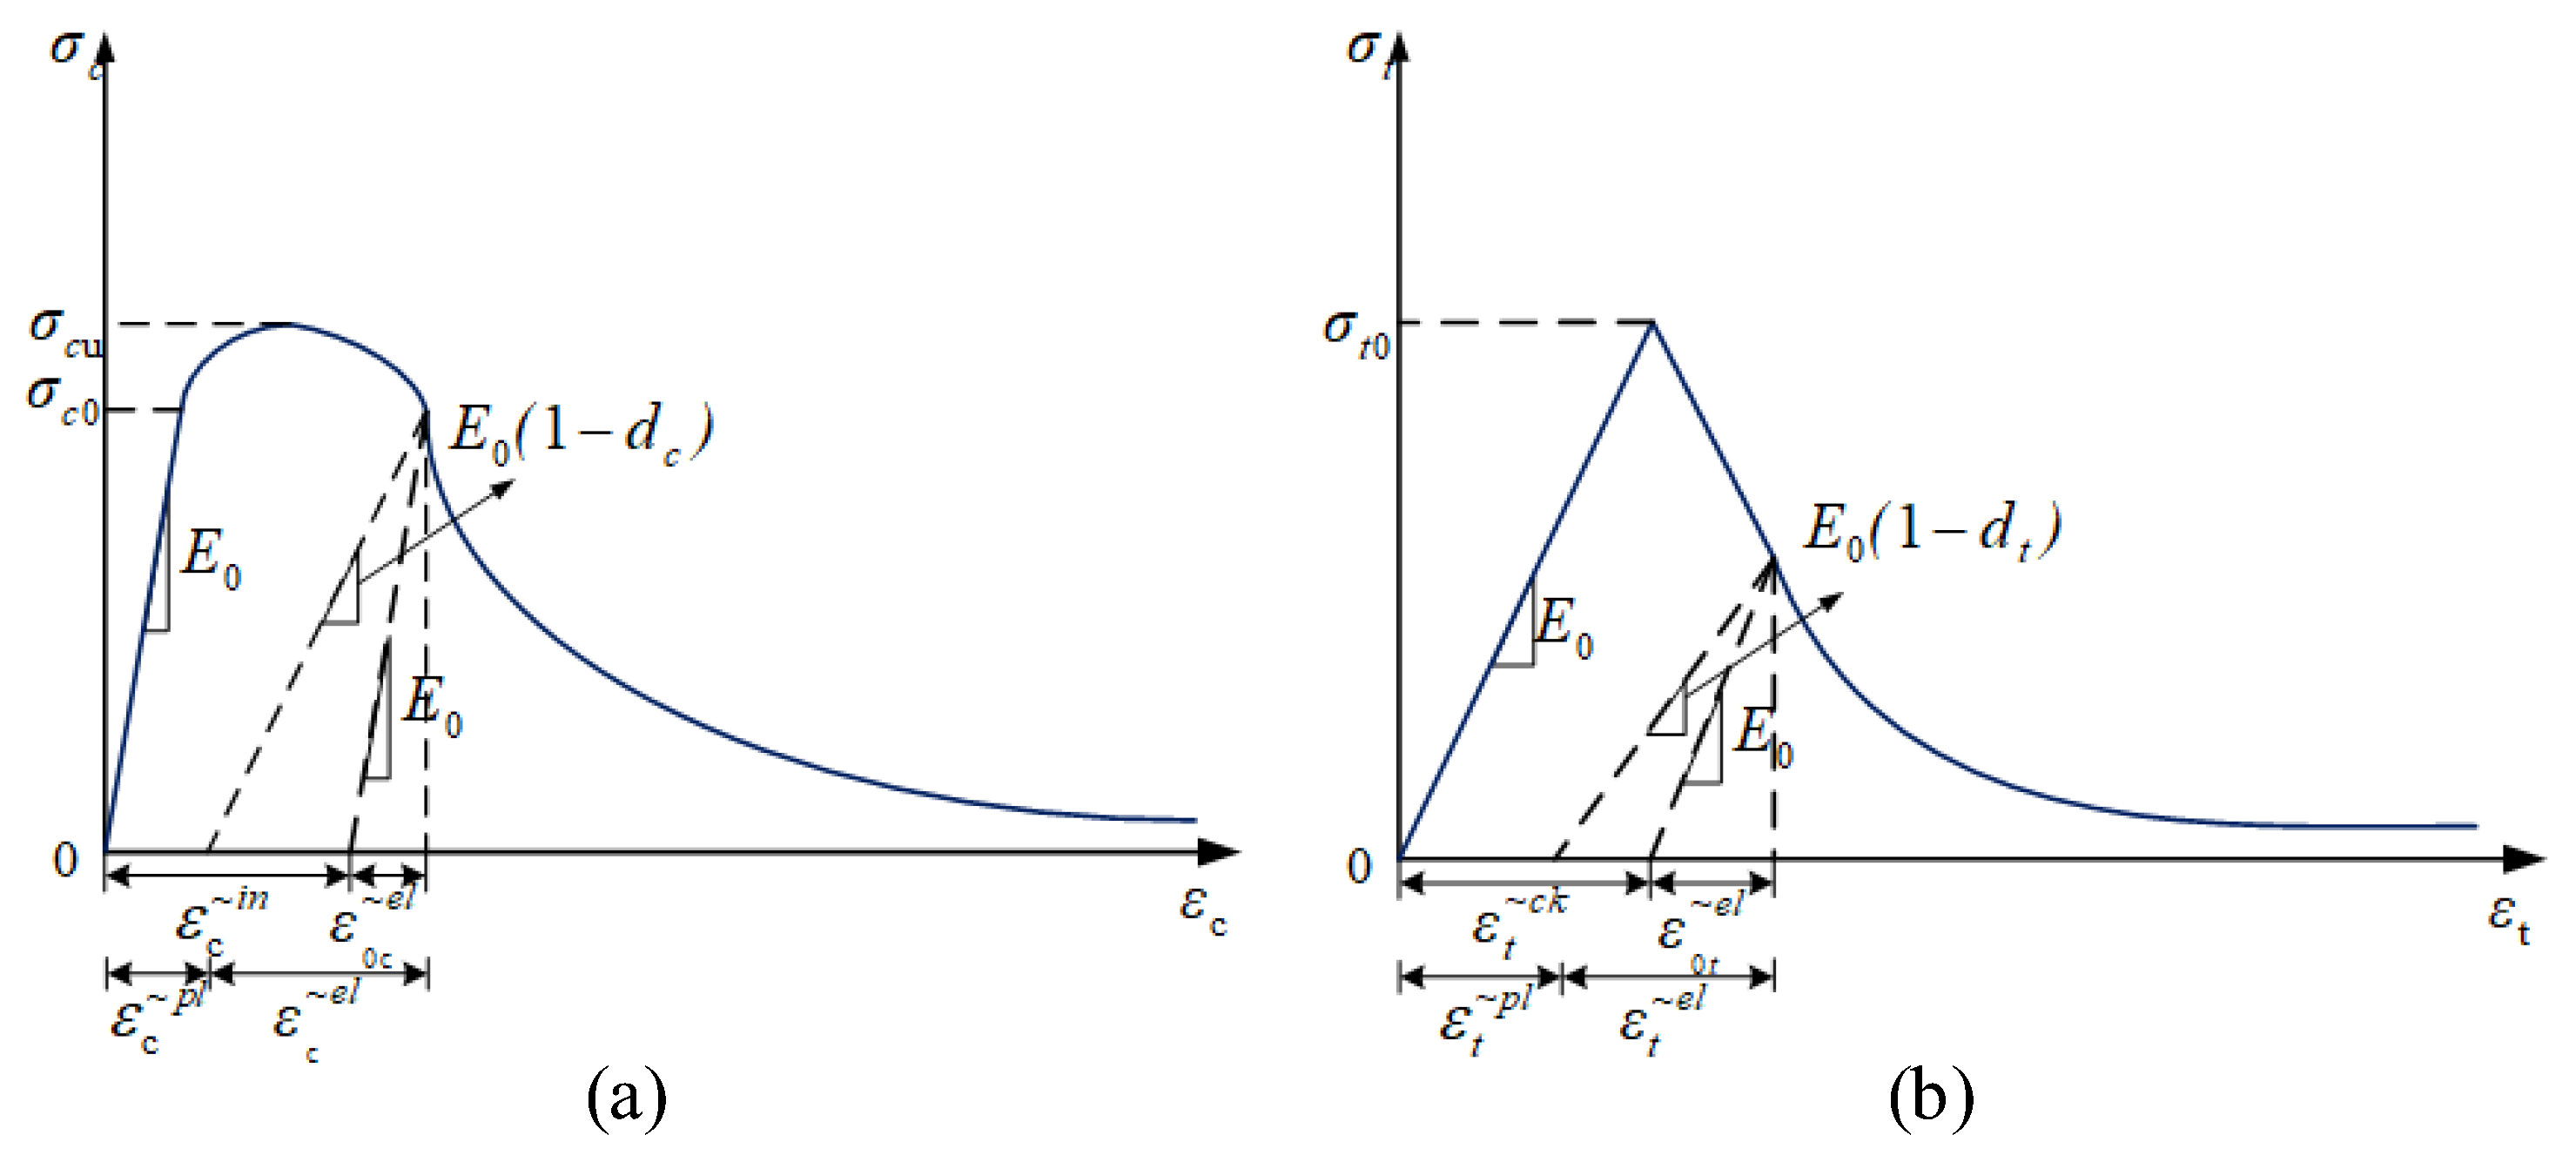
2.2.1. Meso-Scale Compositions of Concrete
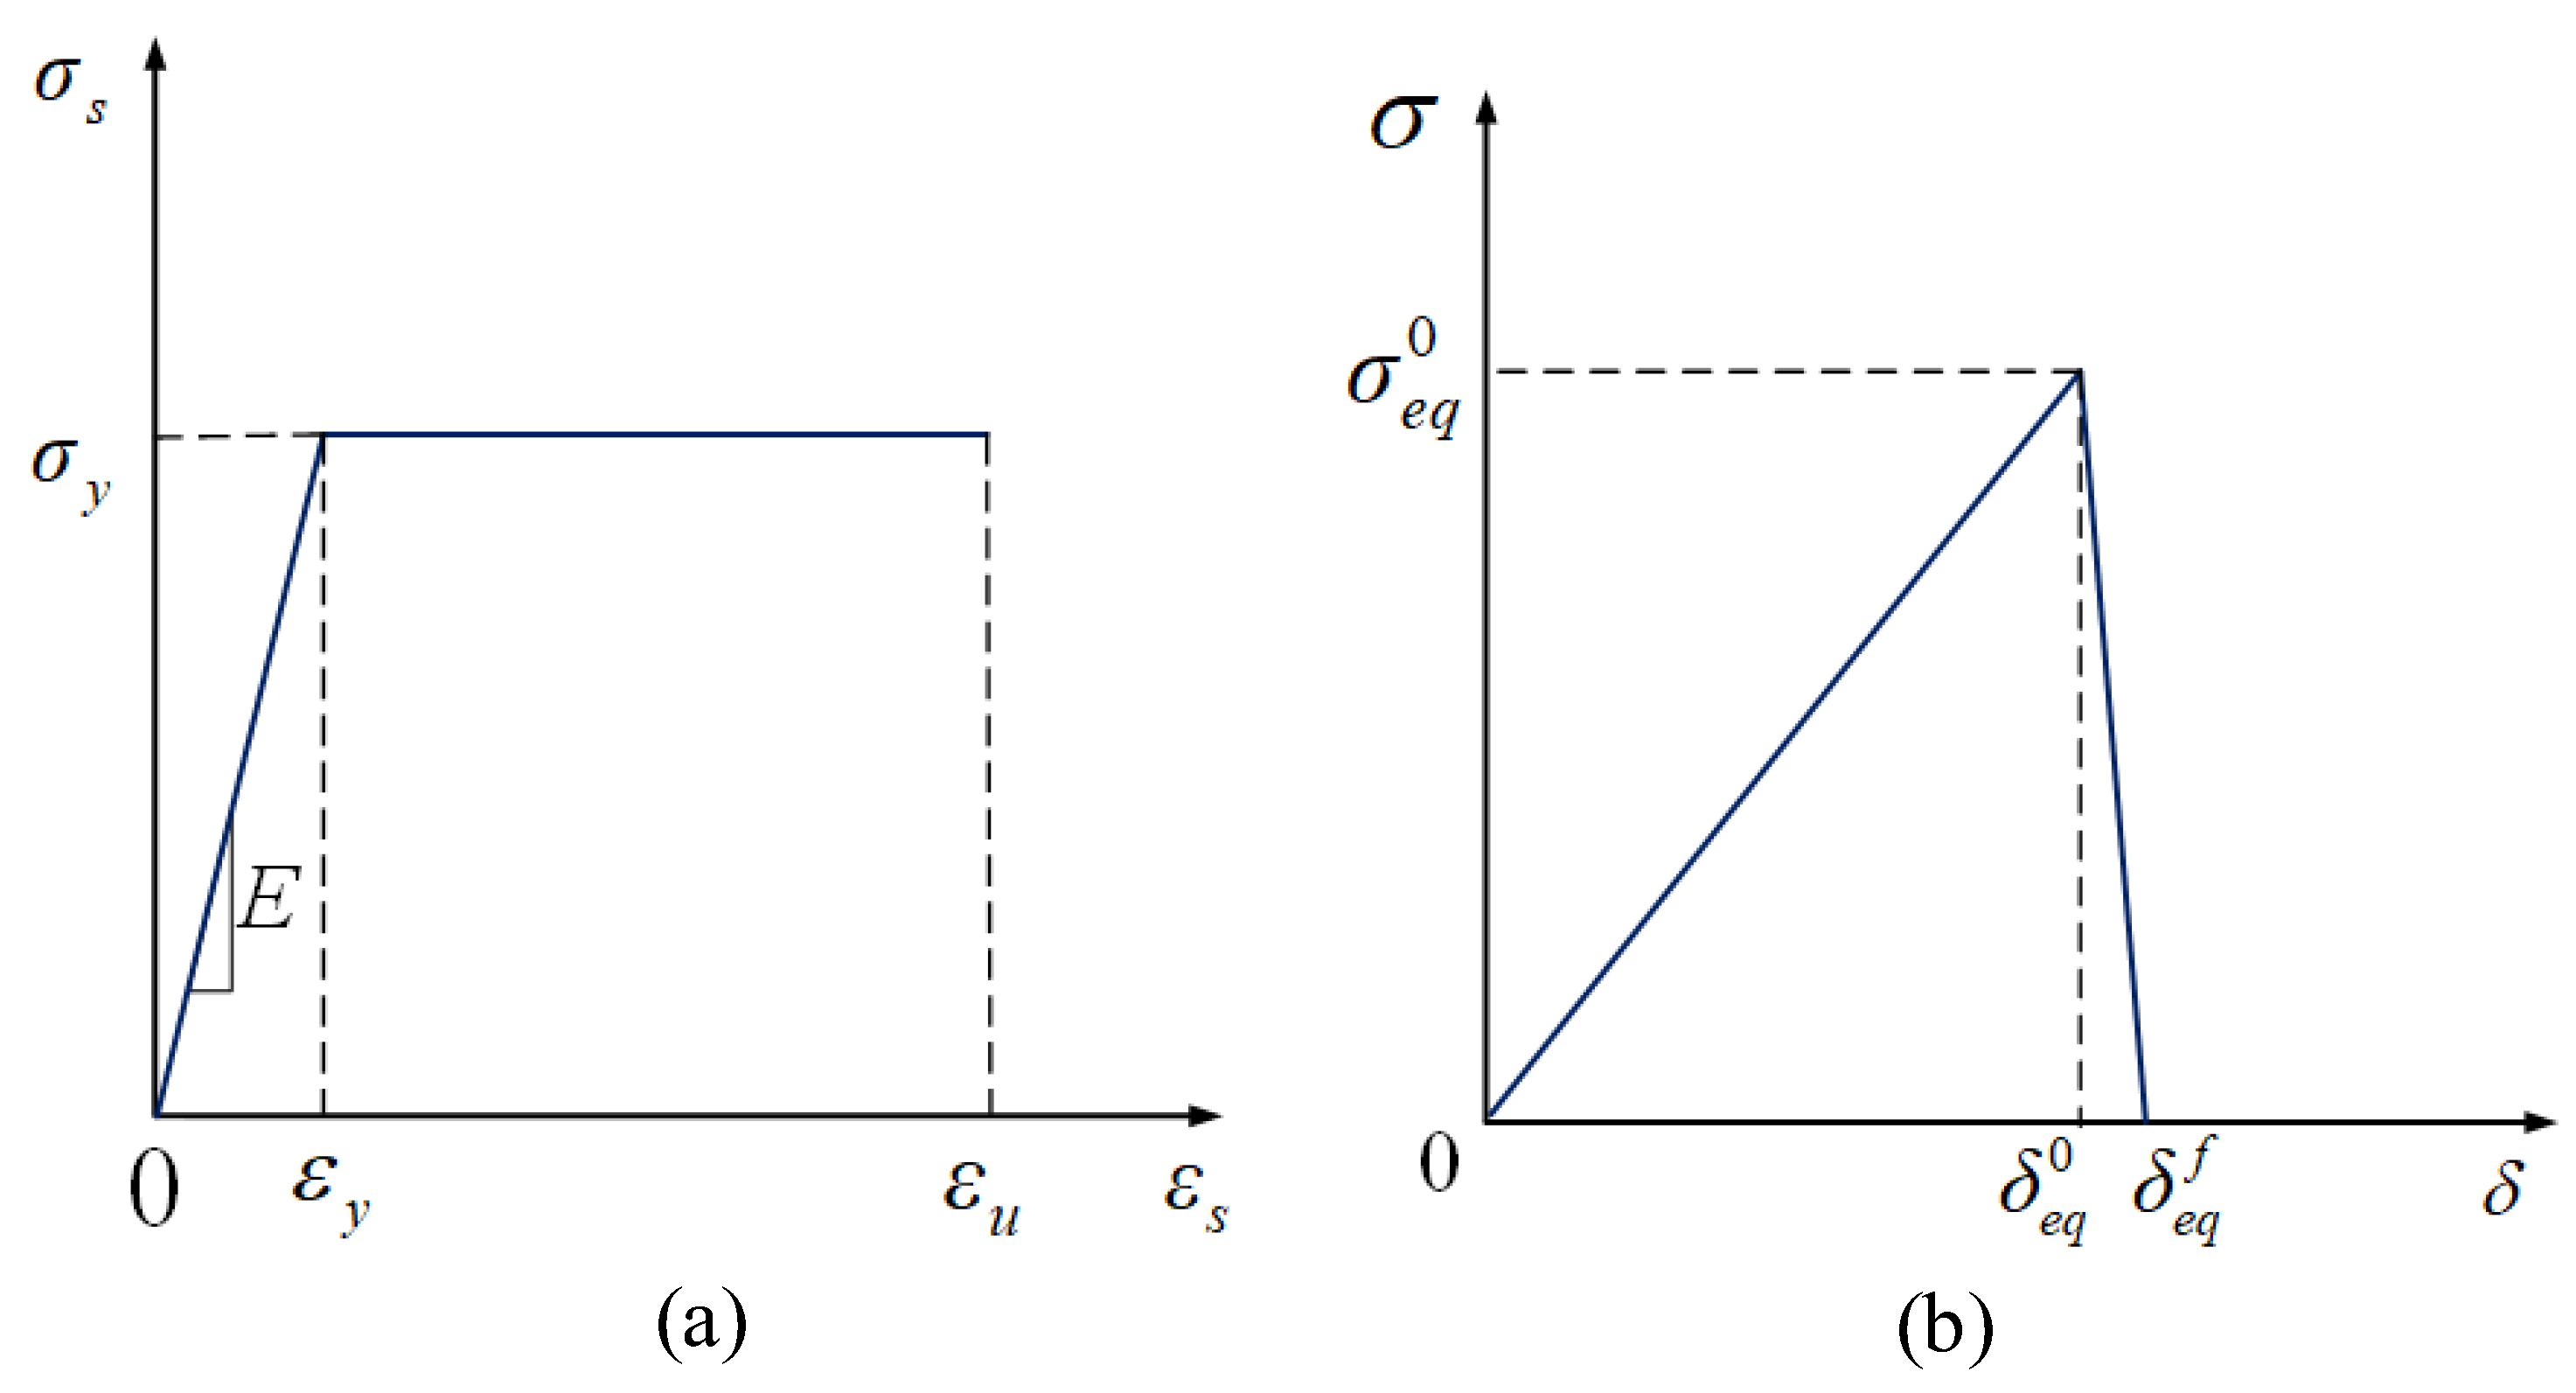
2.2.2. Steel Bar
2.2.3. CFRP Cloth
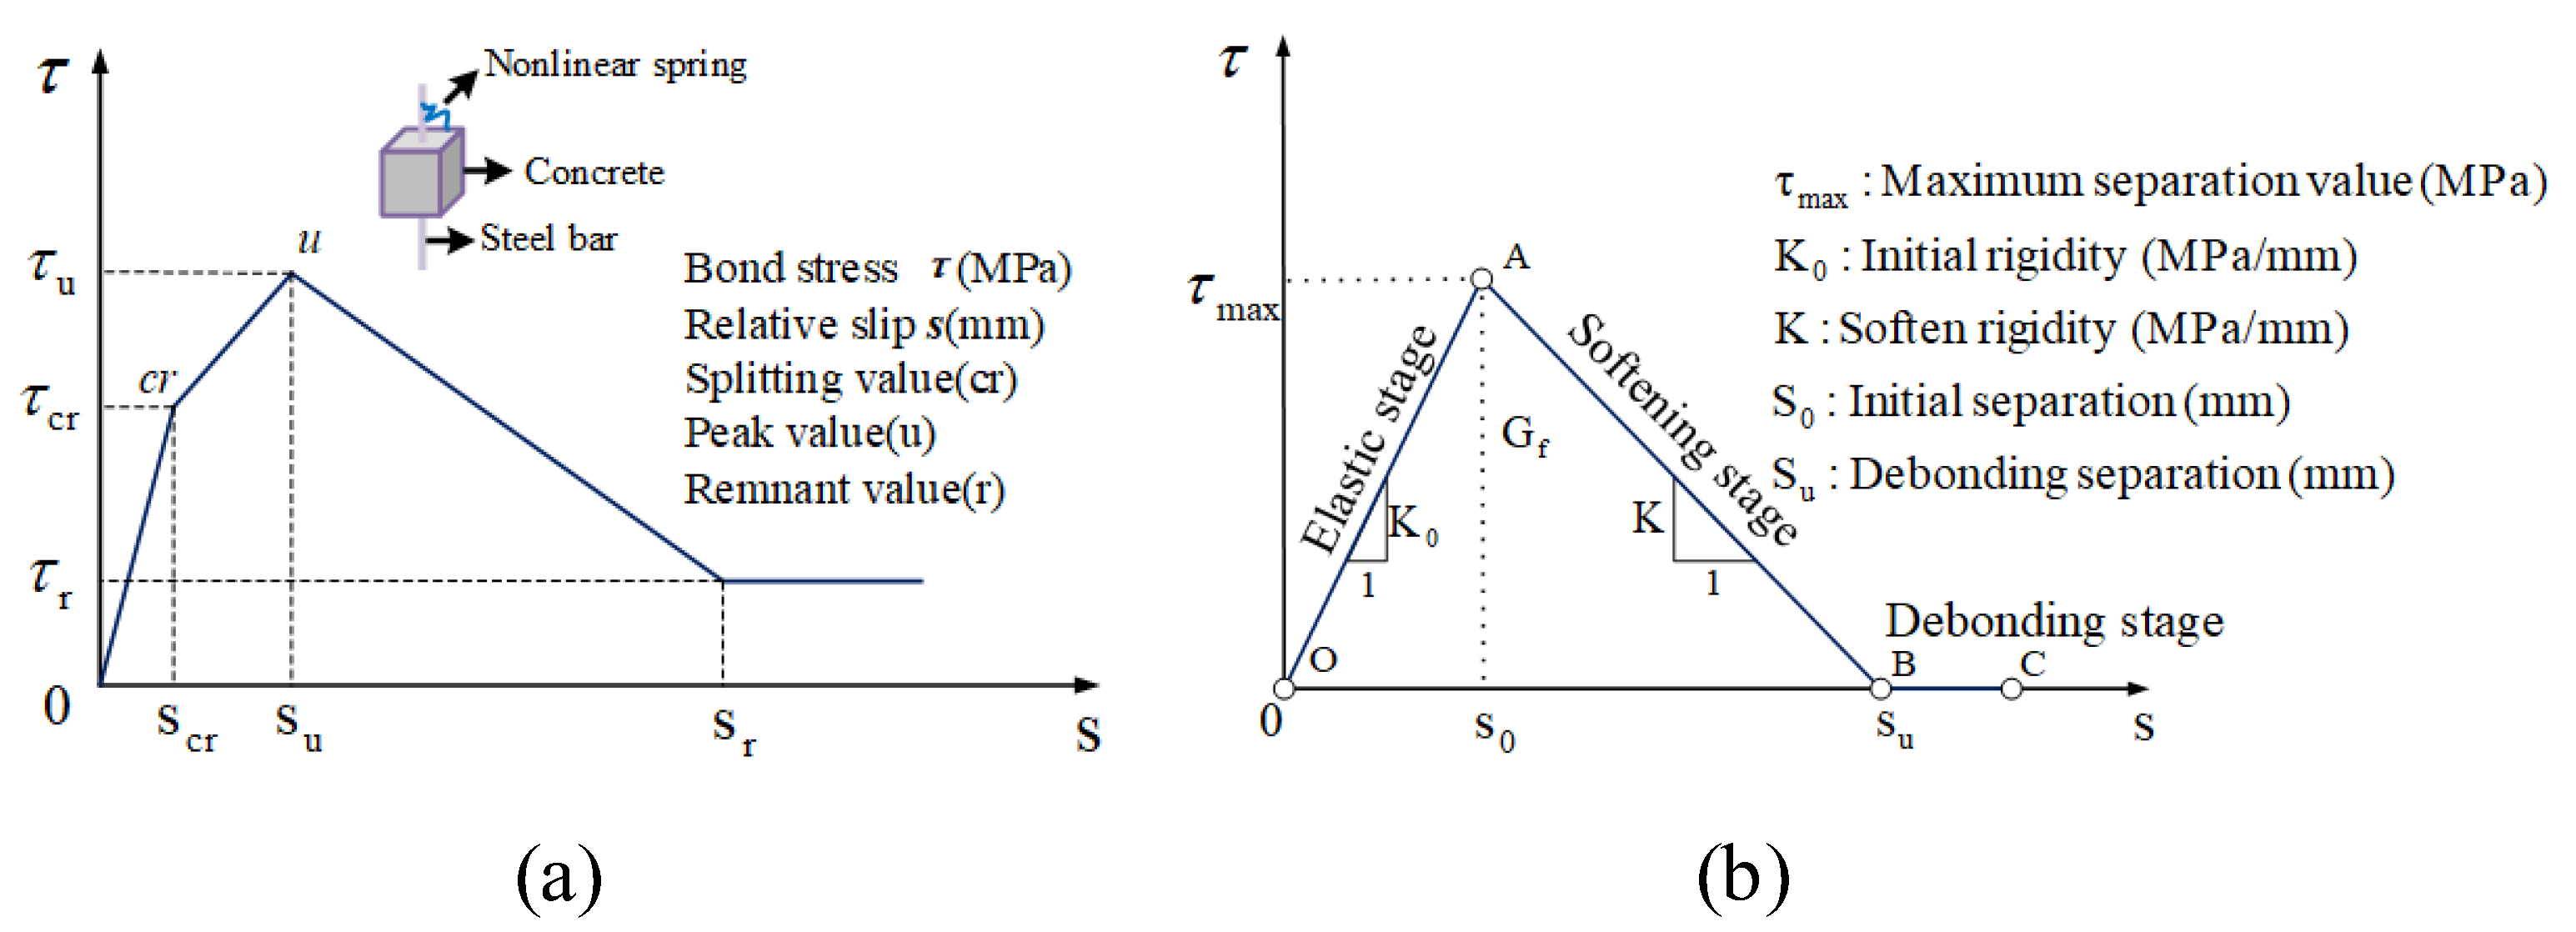
2.2.4. Interactions
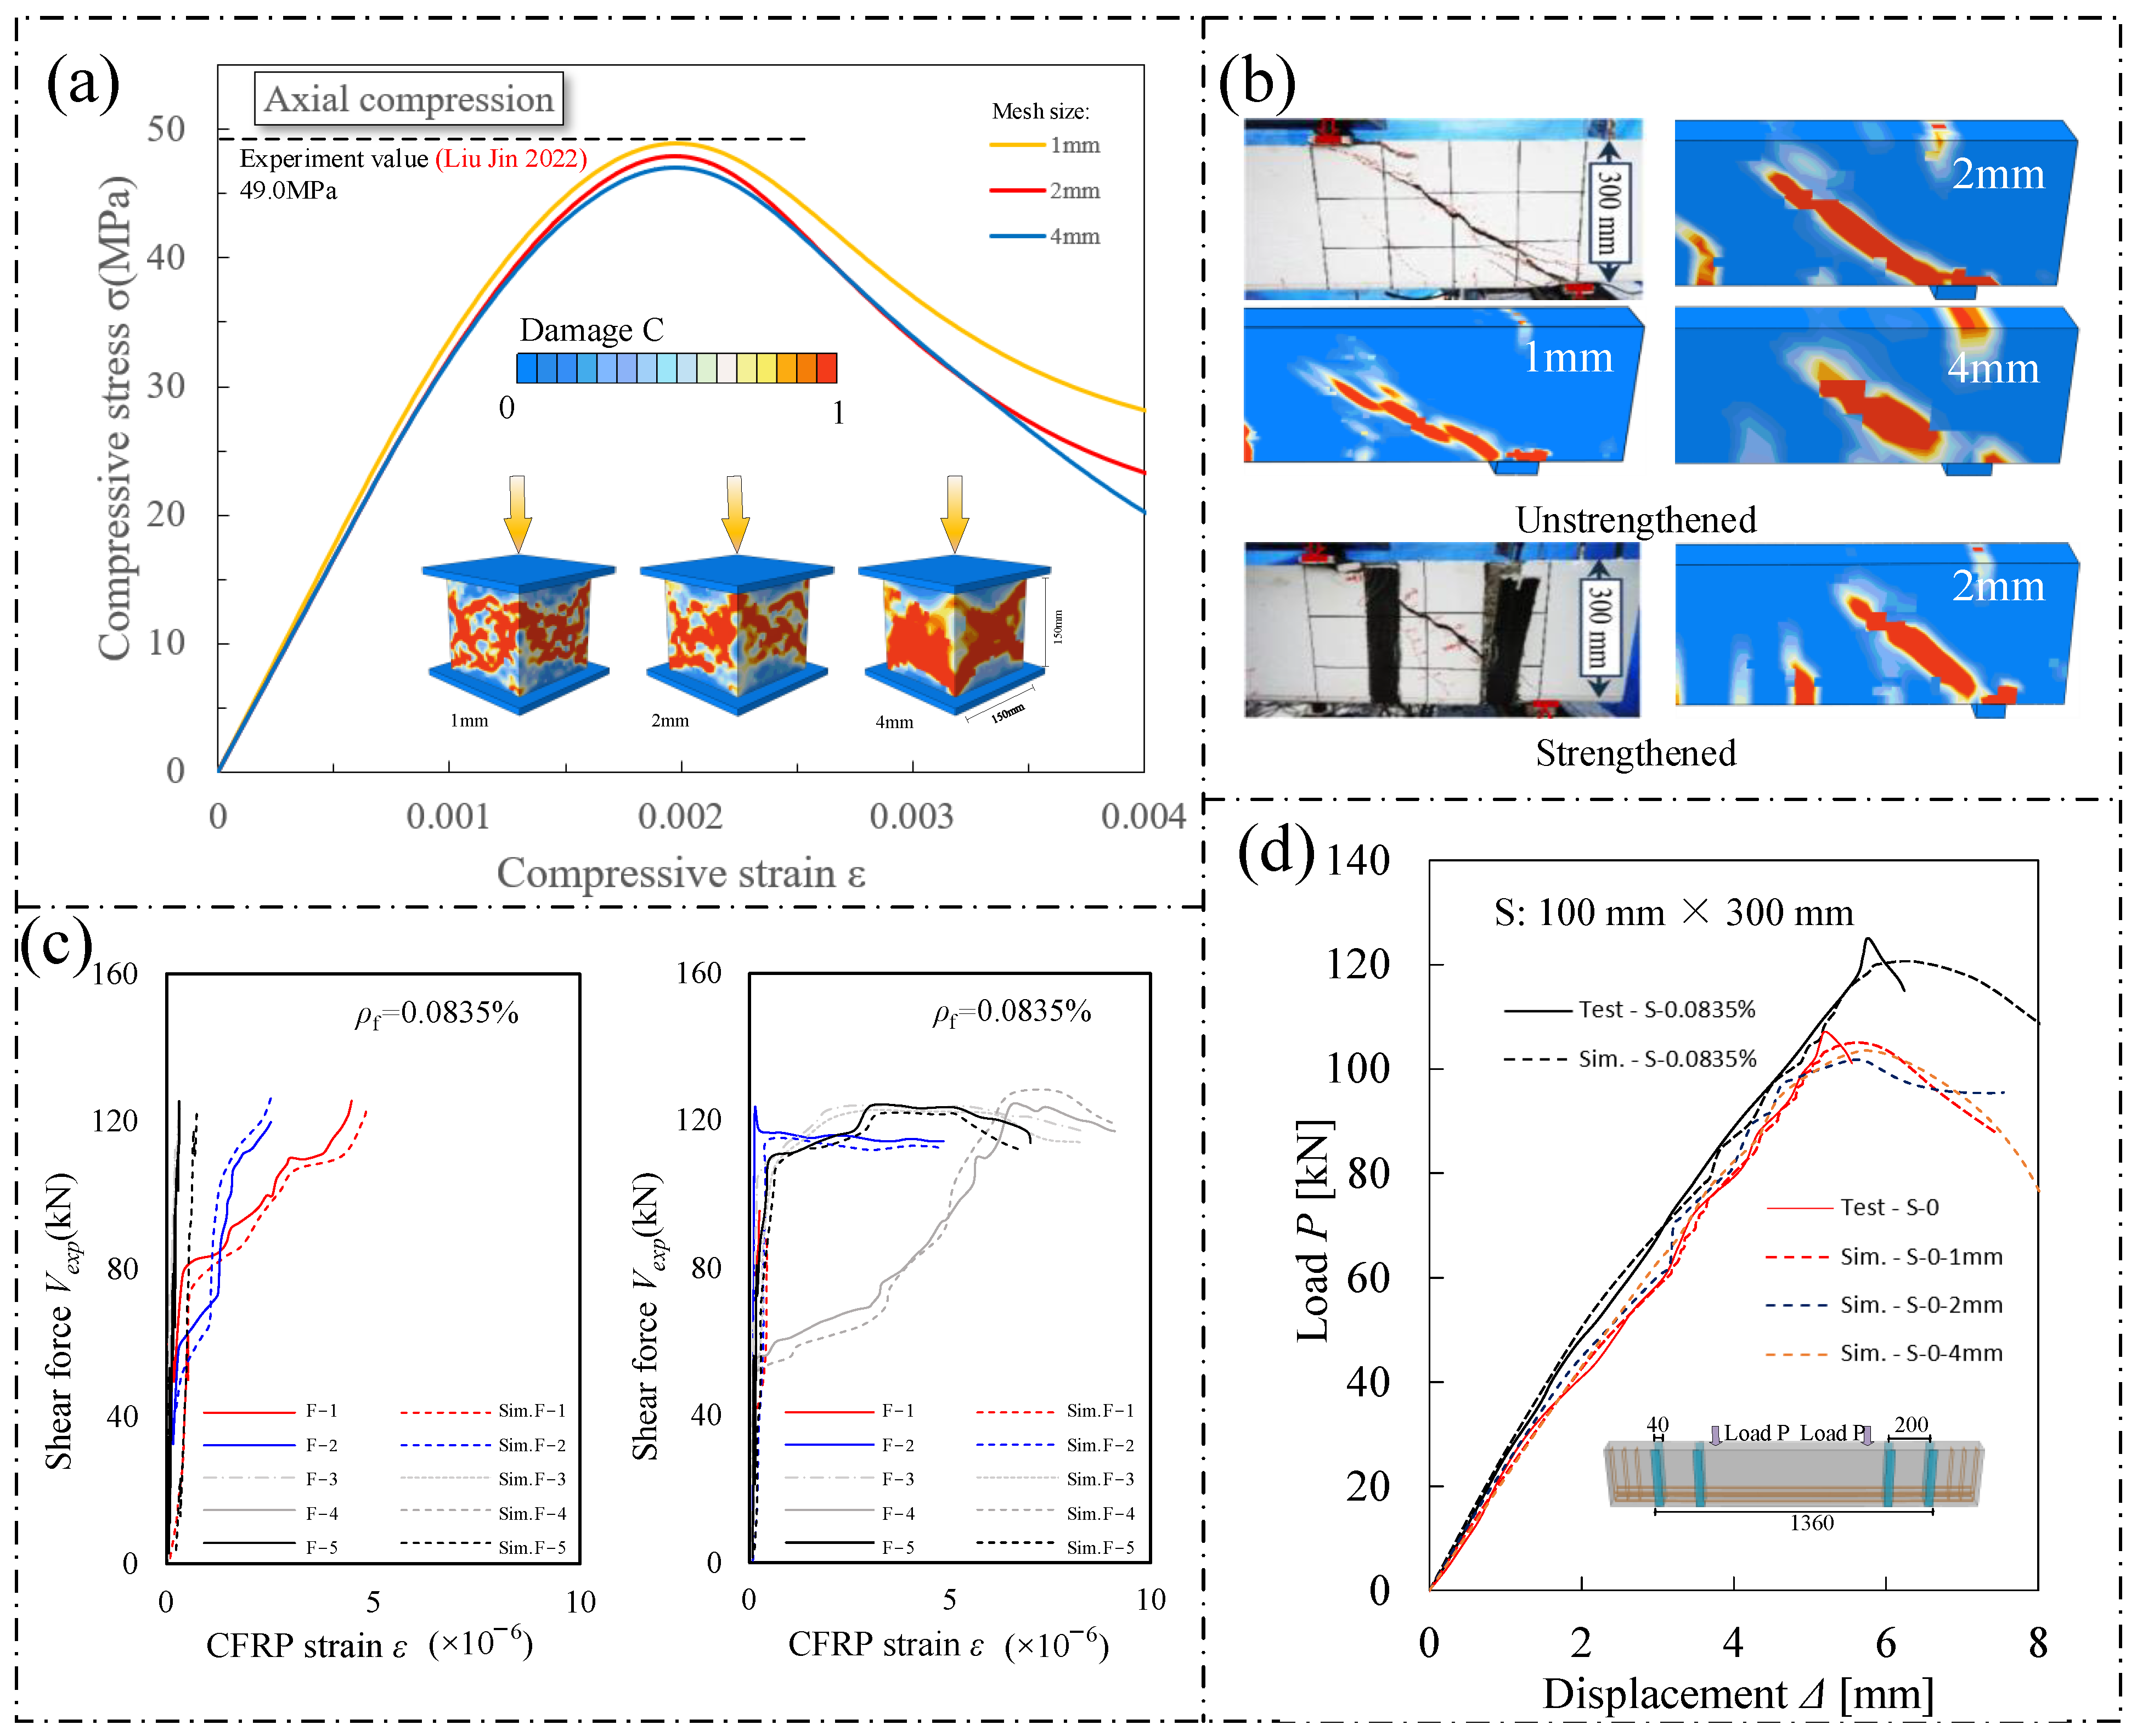
2.3. Verifications

| Mechanical Property | Mortar Matrix | ITZ | Aggregate |
|---|---|---|---|
| Elastic modulus E/GPa | * 33.1 | #26.5 | ^ 70.0 |
| Poisson’s ratio ν | * 0.2 | #0.2 | * 0.2 |
| Dilatancy angle ψ (°) | 18 | 15 | 18 |
| Fracture energy Gc/J/m2 | 50 | 30 | |
| Compressive strength σc/MPa | * 49.0 | #39.2 | * 80 |
| Tensile strength σt/MPa | * 2.77 | #2.22 | * 6 |
3. Results and Discussion
3.1. Test Design
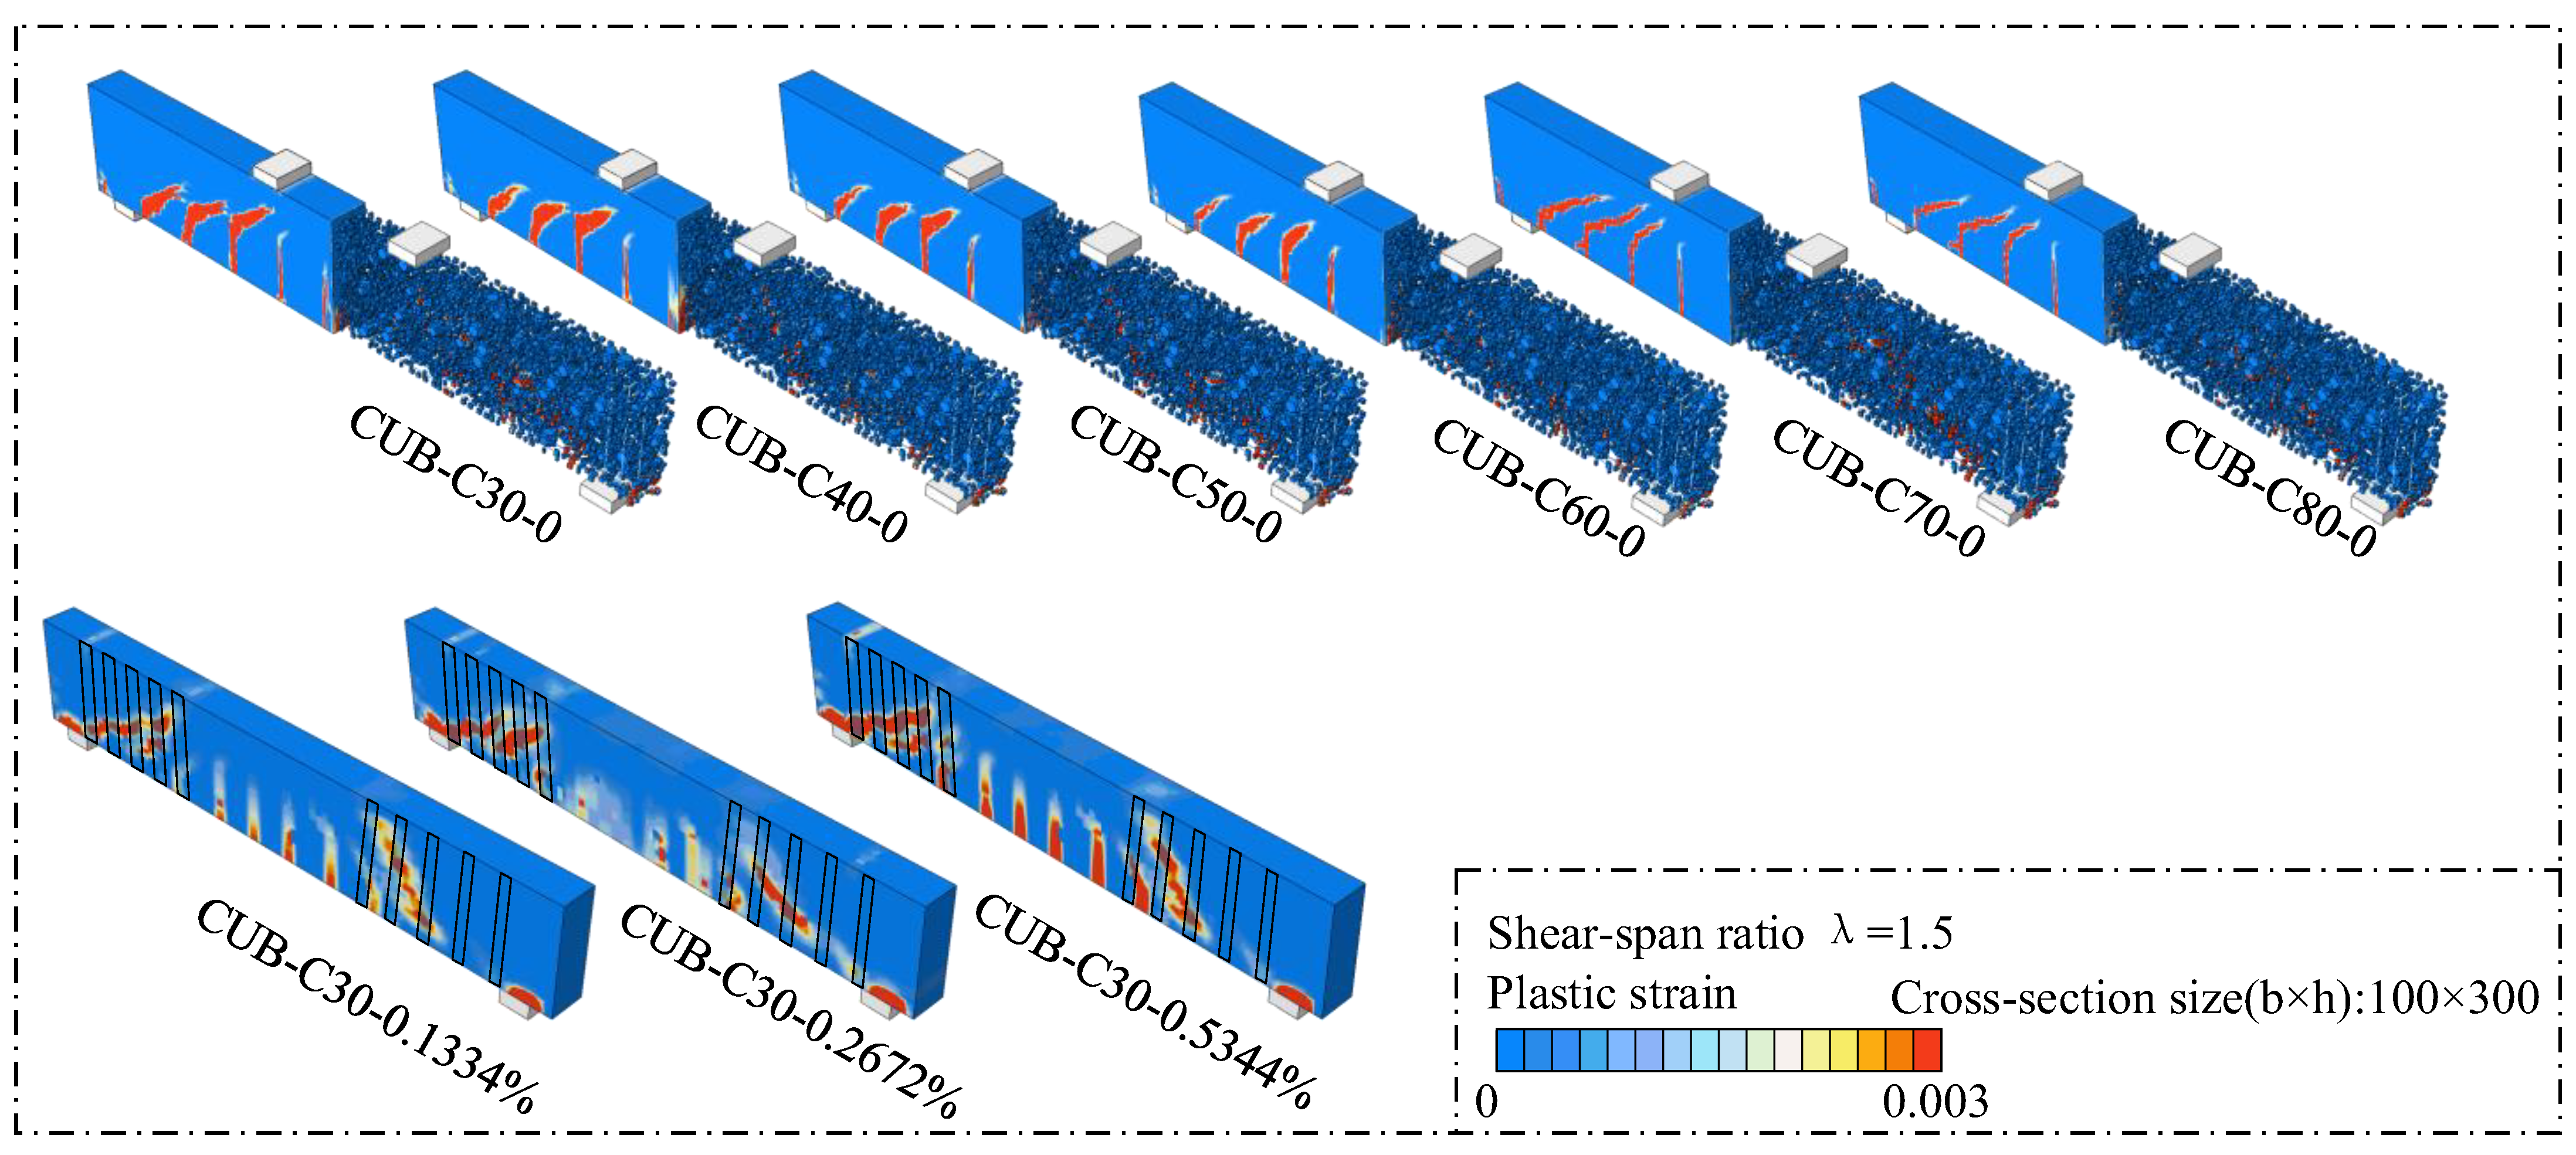
3.2. Shear Failure Patterns
3.3. Analysis of Shear Capacity of CFRP Cloth
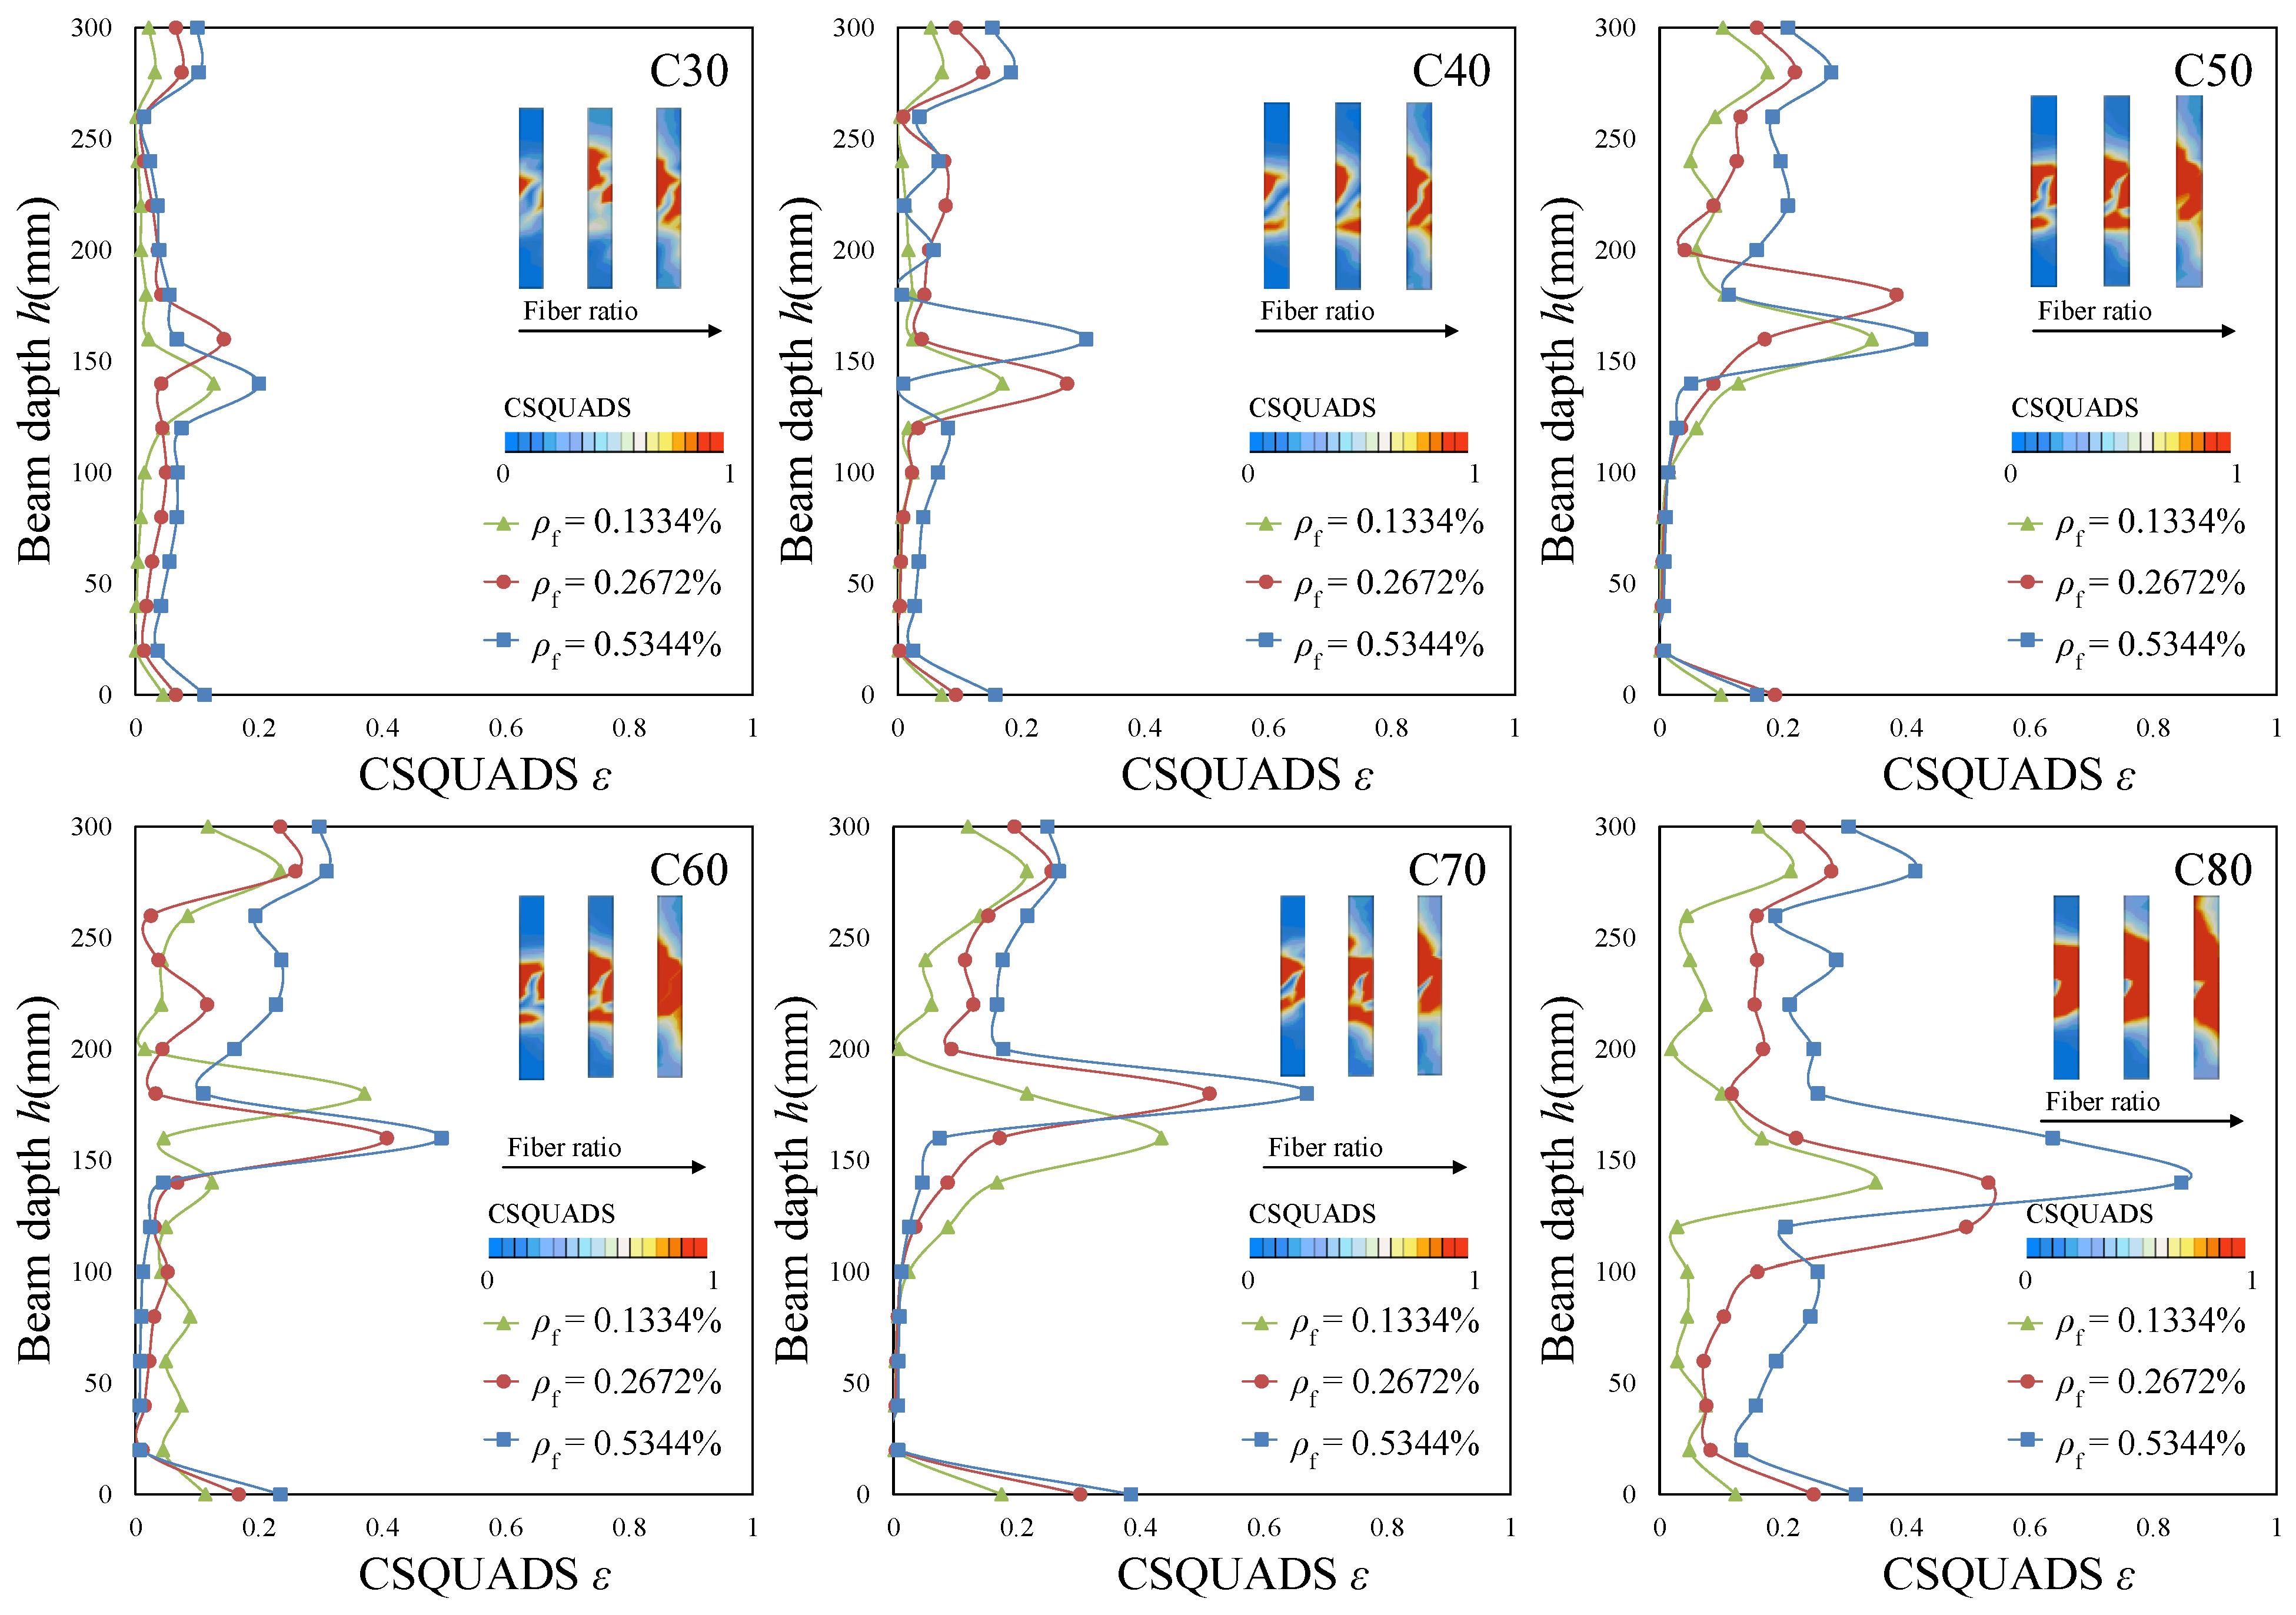
3.3.1. Damage Analysis of the CFRP Cloth–Concrete Interface
3.3.2. Strain Analysis of CFRP Cloth
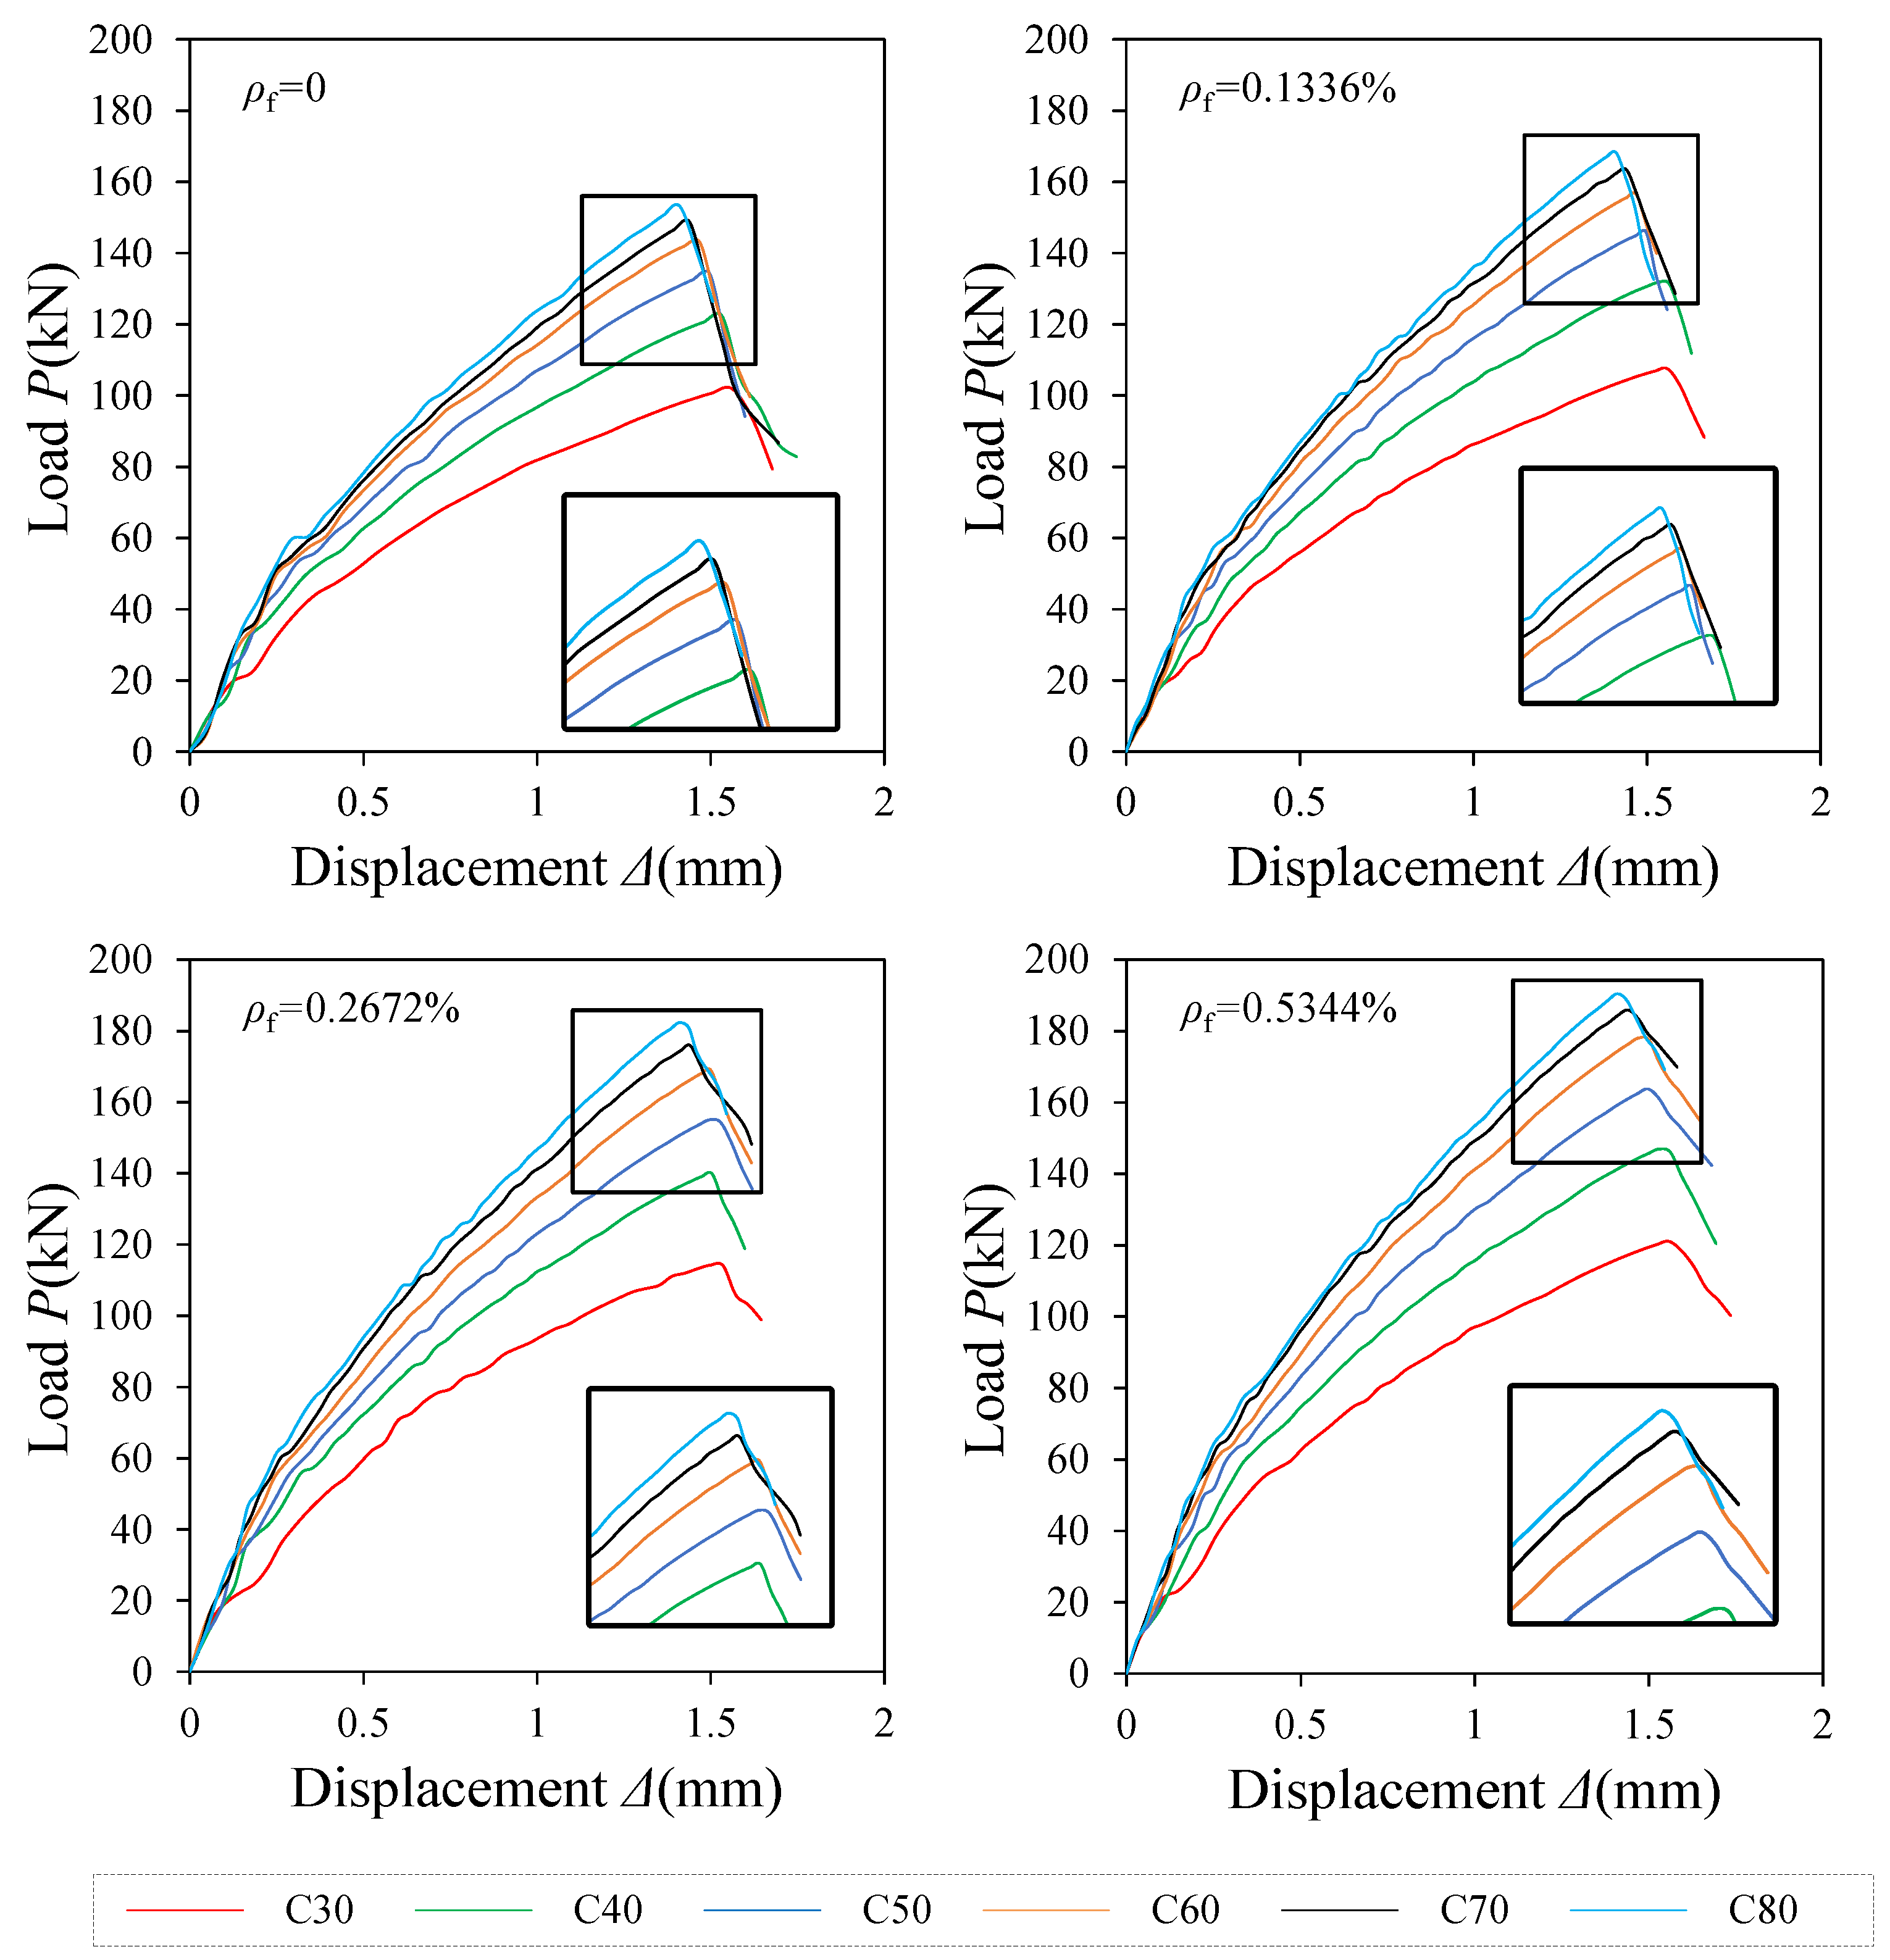
3.4. Load-Displacement (P-Δ) Curve
4. A Shear Law Considering Both Concrete Strength Grade and CFRP Ratio
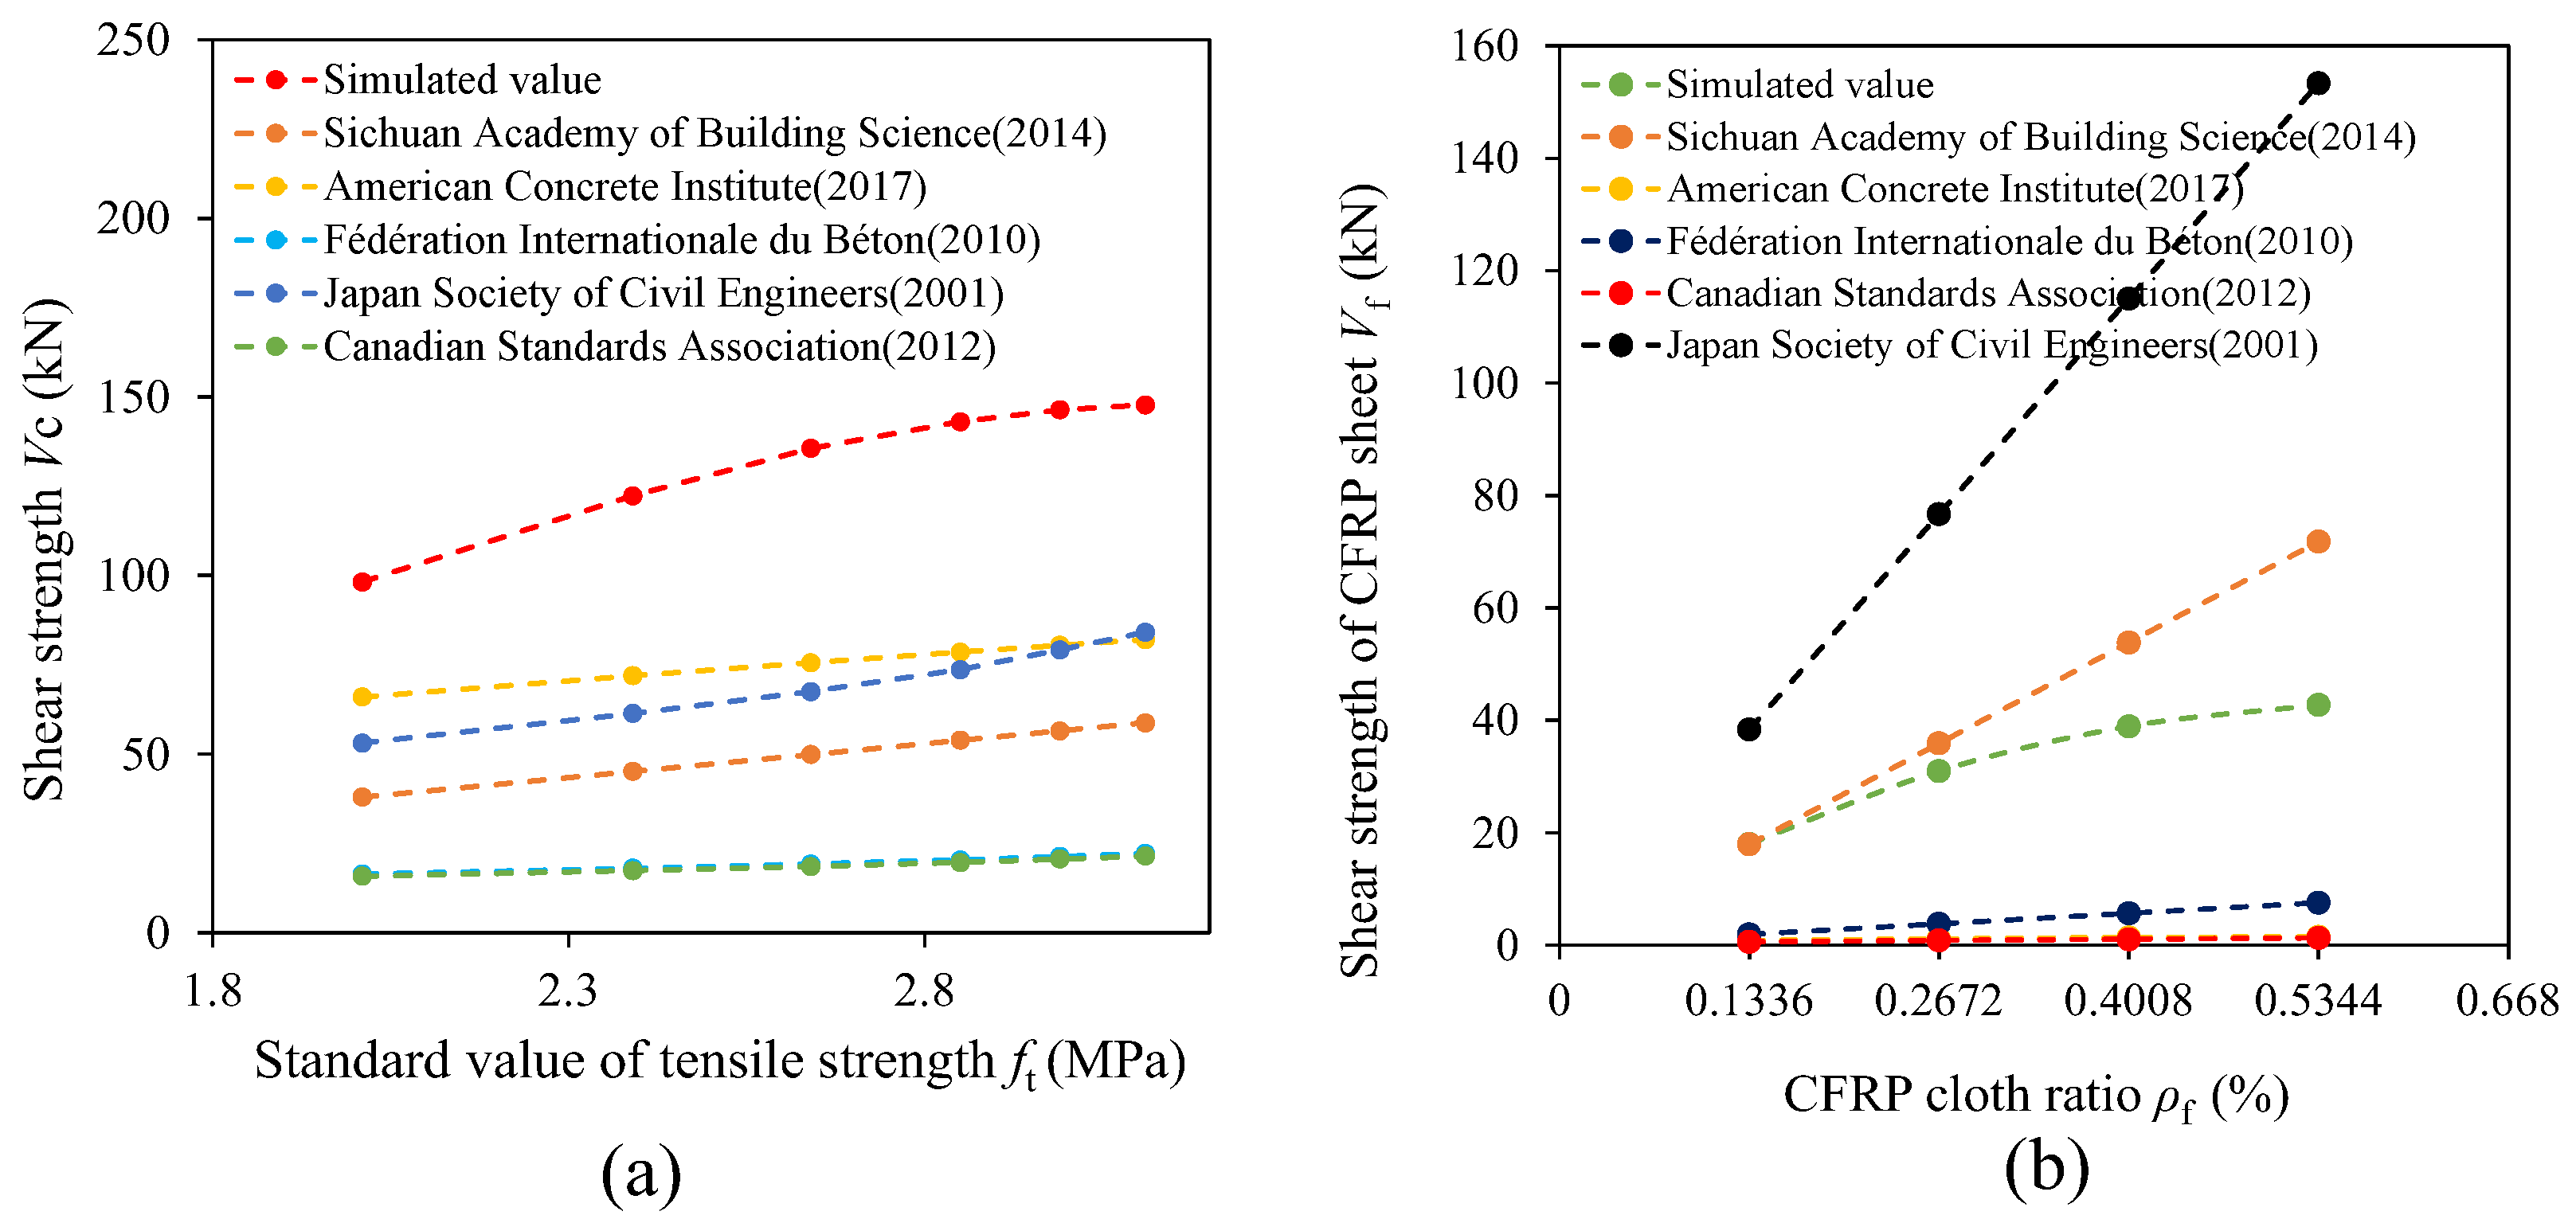
4.1. Shear Contribution Analysis
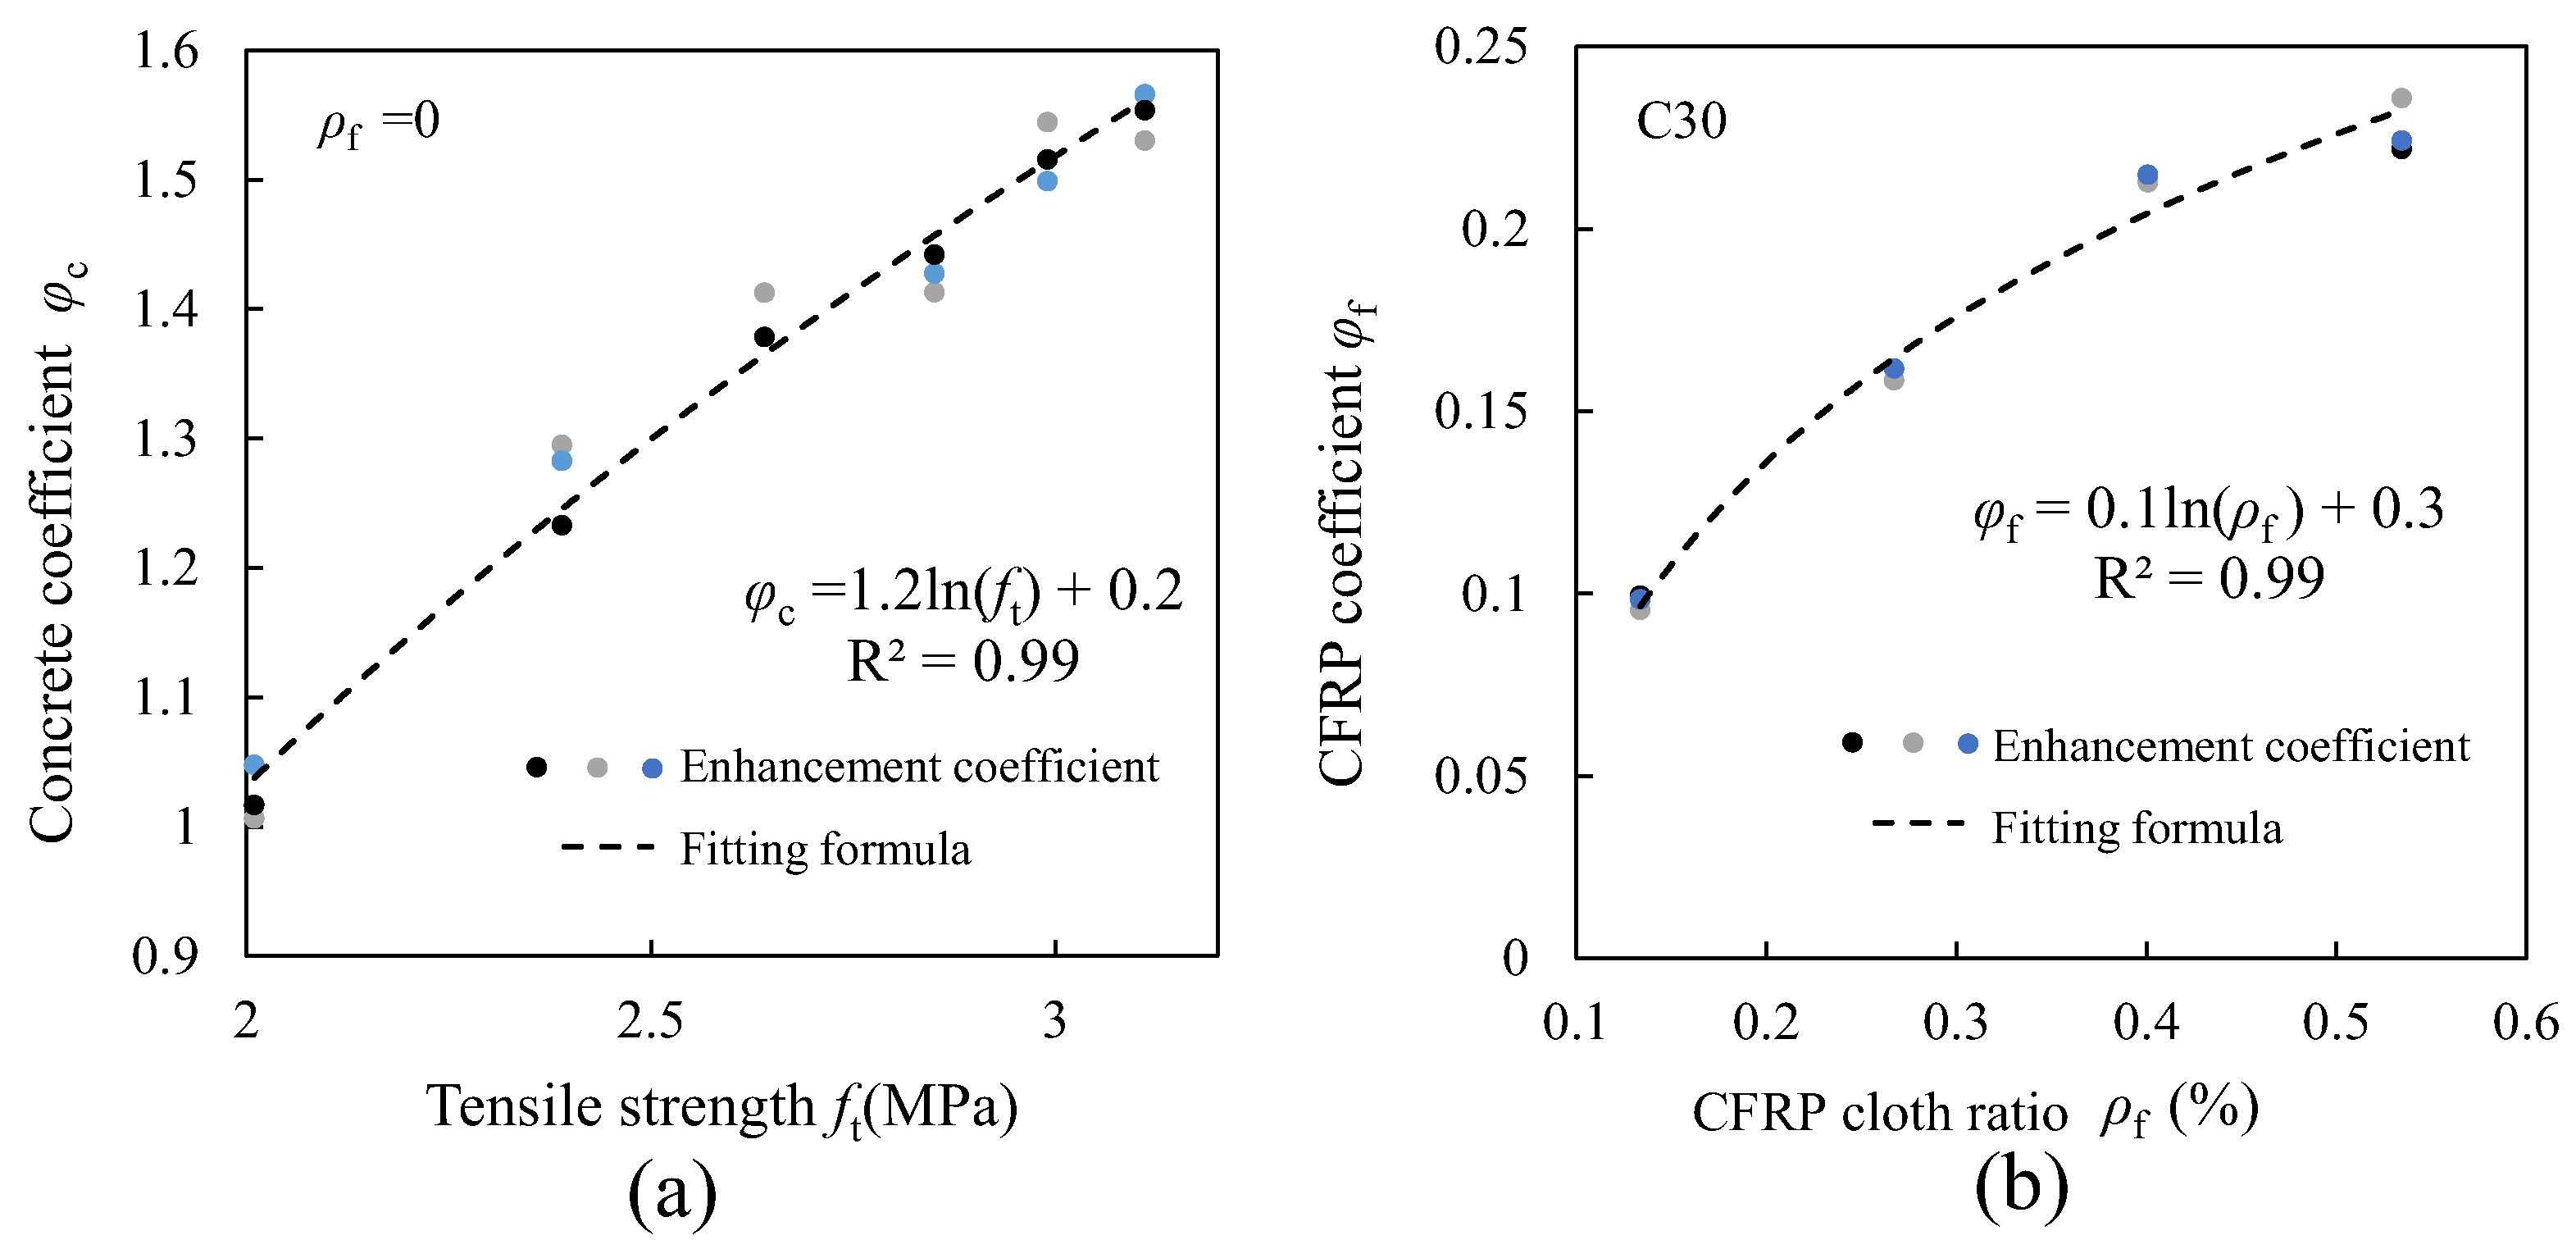
4.2. Determination of Correlation Coefficient
4.2.1. Determination of φc
4.2.2. Determination of φf
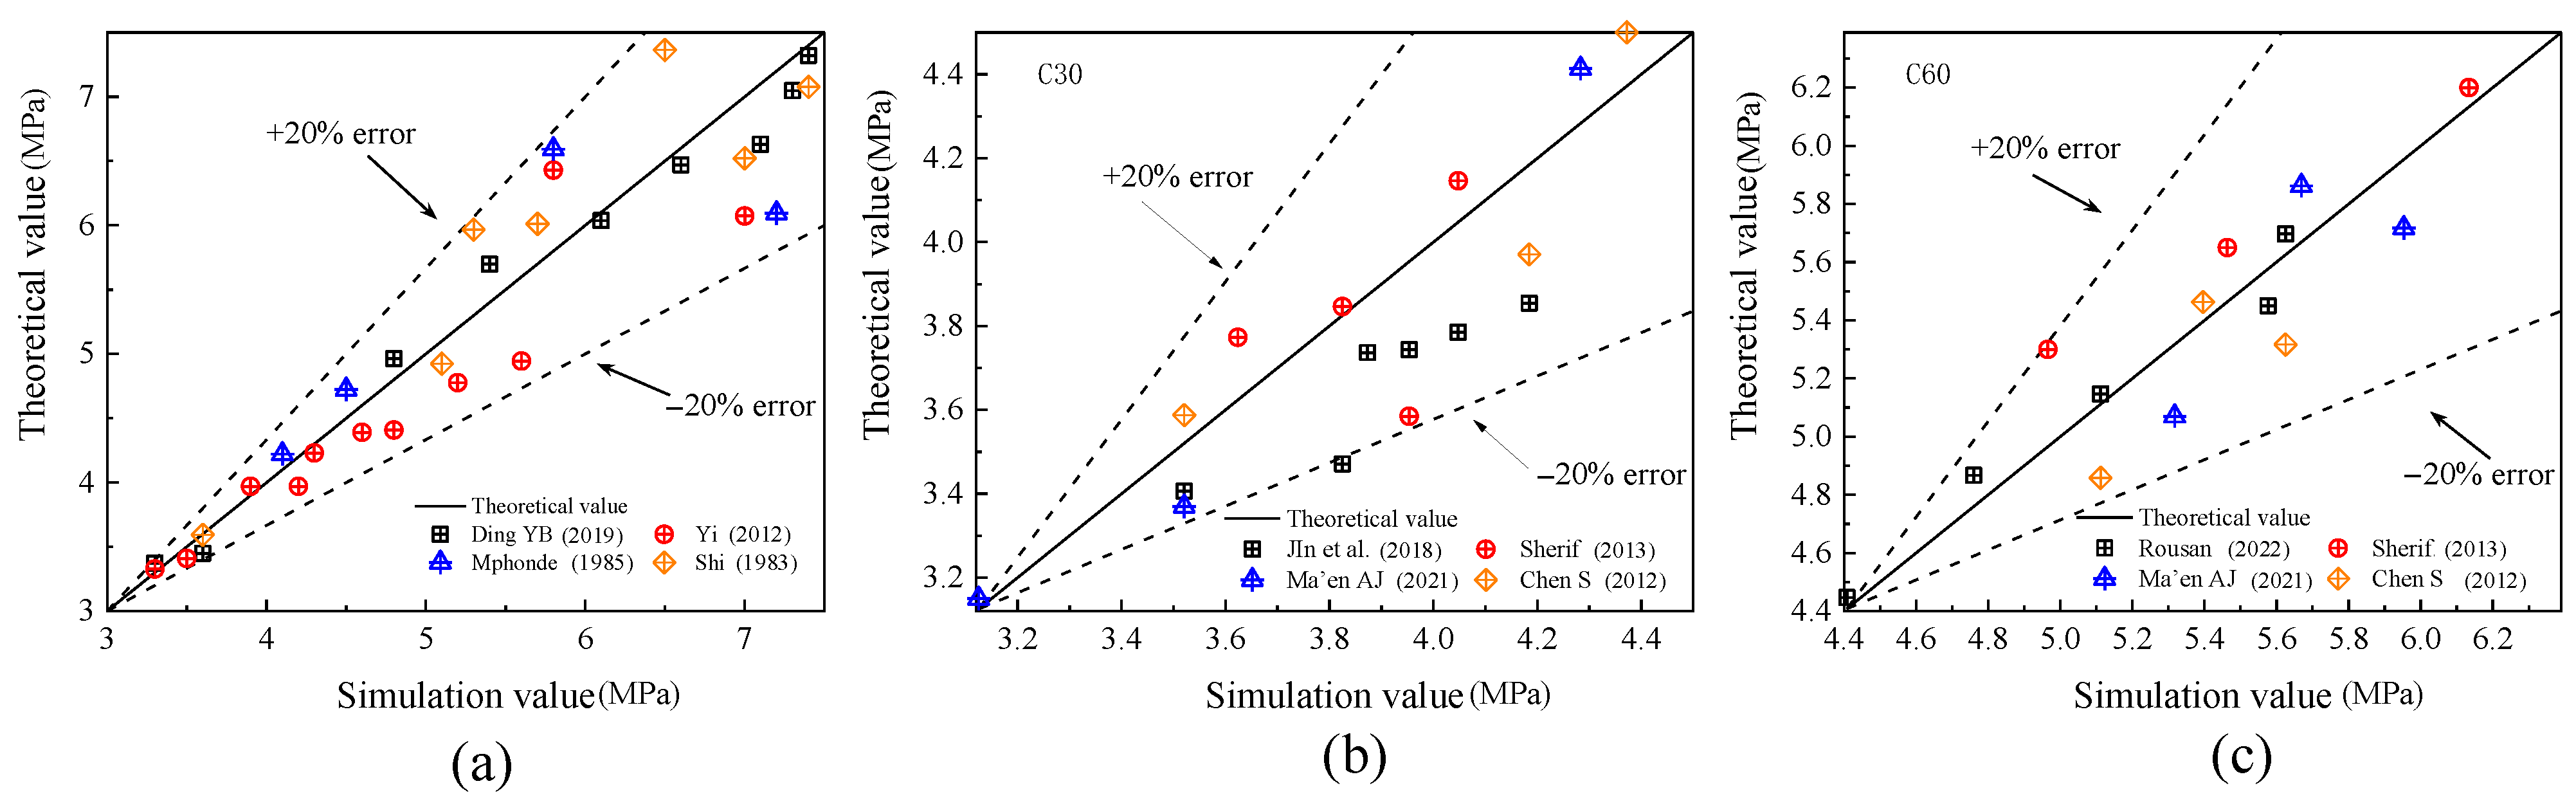
4.3. Verification of Theoretical Formulas
5. Conclusions
- (1)
- RC beams with higher strength grades can usually withstand greater loads before failure. High-strength concrete tends to have lower shrinkage and creep, which helps control cracks. Under the same load conditions, fewer and narrower cracks may form in high-strength concrete than in low-strength concrete. The shear capacity of RC beams is substantially influenced by the concrete strength grade, and the shear capacity can be significantly increased by increasing the concrete strength grade. In the scope of this study, up to 50% improvement can be achieved, but the improvement of each concrete strength grade is reduced from 25% to 1%;
- (2)
- The effect of concrete strength grade against shear capacity is not linear. When the strength is below C60, the shear strength is close to linear; when the strength is above C60, the growth is slowed down and increases logarithmically;
- (3)
- CFRP cloth can improve the ductility of concrete beams, even in high-strength concrete. The external bonding of CFRP can greatly increase the shear resistance of the beam from 10% to 24%. In addition, with the increase of the proportion of CFRP fiber, the strengthening range of the anti-shear strength of CFRP gradually decreased from 10% to 2%;
- (4)
- The effects of concrete strength grade and CFRP cloth ratio on the shear strength of U-shaped bonded CFRP-strengthened RC beams could be quantitatively described using the suggested shear capacity formula. The error between the theoretical value and the simulated value obtained by this formula is within 10%, and the error between the experimental data and the researchers is within 20%. Therefore, current experimental data and simulation results show that the method is reasonable.
Author Contributions
Funding
Data Availability Statement
Conflicts of Interest
References
- Yu, W.J. Shear Test of High Strength Concrete Beams without Abdominal Reinforcement; Hefei University of Technology: Hefei, China, 2012. [Google Scholar]
- Liu, J.Y.; Yan, Y.X.; Luan, L.W. Research Progress on Shear Performance of Concrete Beam. Sichuan Build. Mater. 2016, 42, 28–29. [Google Scholar]
- Pan, B.R. Experimental Study on Shear Performance of High Strength Concrete Beams; Hunan University: Changsha, China, 2009. [Google Scholar]
- Davood, M.; Mohammad, R.E.; Amir, S. Experimental and numerical study of the RC beams shear-strengthened with NSM technique. J. Compos. Mater. 2019, 53, 2377–2389. [Google Scholar]
- Smith, K.N.; Vantsiotis, A.S. Shear Strength of Deep Beams. J. Proc. 1982, 79, 201–213. [Google Scholar]
- Oh, J.-K.; Shin, S.-W. Shear Strength of Reinforced High-Strength Concrete Deep Beams. Struct. J. 2001, 98, 164–173. [Google Scholar]
- Chen, S.; Tao, Y.; Zhao, S.H. Reliability Analysis of Different Concrete Strength RC Beams Reinforced by CFRP. Appl. Mech. Mater. 2012, 1799, 1971–1975. [Google Scholar] [CrossRef]
- Mphonde, A.G.; Frantz, G.C. Shear tests of high and low-strength concrete beams with stirrups. ACI Spec. Publ. 1985, 87, 179–196. [Google Scholar]
- Ye, X.G.; Yu, W.J.; Jiang, Q. Experimental study on the shear strength of 500 MPa reinforced high-strength concrete beams without abdominal reinforcement. Ind. Archit. 2012, 42, 11–15. [Google Scholar]
- Ding, Y.B.; Qi, L.P. Study on shear behavior of lightweight aggregate concrete deep beams. Shanxi Archit. 2019, 45, 44–46. [Google Scholar] [CrossRef]
- Wu, J.; Zhu, Y.; Li, C. Experimental Investigation of Fatigue Capacity of Bending-Anchored CFRP Cables. Polymers 2023, 15, 2483. [Google Scholar] [CrossRef]
- Daneshvar, K.; Moradi, M.J.; Ahmadi, K.; Hajiloo, H. Strengthening of corroded reinforced concrete slabs under multi-impact loading: Experimental results and numerical analysis. Constr. Build. Mater. 2021, 284, 122650. [Google Scholar] [CrossRef]
- Aghayari, R.; Moradi, M. Improving the Punching Shear Strength of RC Slabs by FRP and Steel Sheets. J. Rehabil. Civ. Eng. 2016, 4, 1–17. [Google Scholar]
- Carolin, A.; Taljsten, B. Experimental study of strengthening for increased shear bearing capacity. J. Compos. Constr. 2005, 9, 488–496. [Google Scholar] [CrossRef]
- El-Maaddawy, T.; Yousef, C. Retrofitting of severely shear-damaged concrete T-beams using externally bonded composites and mechanical end anchorage. J. Compos. Constr. 2012, 16, 693–704. [Google Scholar] [CrossRef]
- Ma’en, A.J.; Mu’tasim, A.J.; Hasan, K.; Nasim, S.; Rola, E. Influence of Compressive Strength of Concrete on Shear Strengthening of Reinforced Concrete Beams with Near Surface Mounted Carbon Fiber-Reinforced Polymer. Buildings 2021, 11, 563. [Google Scholar]
- Jin, L.; Xia, H.; Jiang, X.; Du, X.L. Size effect on shear failure of CFRP-strengthened concrete beams without web reinforcement: Meso-scale simulation and formulation. Compos. Struct. 2020, 236, 111895. [Google Scholar] [CrossRef]
- Wang, S.Y. Experimental study on flexural behavior of high-strength reinforced concrete beams strengthened by carbon fiber cloth. Build. Sci. 2006, 5, 34–38+70. [Google Scholar]
- Yang, M. Study on Flexural Behavior of High-Strength Reinforced Concrete Beams Strengthened by Carbon Fiber Cloth; Dalian University of Technology: Qingdao, China, 2005. [Google Scholar]
- Shi, L.Q.; Xu, Y.L. Shear strength control area of reinforced concrete flexural member and its lower envelope. J. Build. Struct. 1983, 4, 23–34. [Google Scholar]
- Mofidi, A.; Chaallal, O. Tests and Design Provisions for Reinforced-Concrete Beams Strengthened in Shear Using FRP Sheets and Strips. Int. J. Concr. Struct. Mater. 2014, 8, 117–128. [Google Scholar] [CrossRef]
- Benzeguir, Z.E.A.; El-Saikaly, G.; Chaallal, O. Size Effect of RC T-Beams Strengthened in Shear with Externally Bonded CFRP L-Shaped Laminates. J. Compos. Constr. 2020, 24, 04020031. [Google Scholar] [CrossRef]
- Cladera, A.; Mari, A.R. Experimental study on high-strength concrete beams failing in shear. Eng. Struct. 2005, 27, 1519–1527. [Google Scholar] [CrossRef]
- Abdelhak, B.; Omar, C. Behavior of Reinforced Concrete T-Beams Strengthened in Shear with Carbon Fiber-Reinforced Polymer-An Experimental Study. ACI Struct. J. 2006, 103, 339–347. [Google Scholar]
- GB50367-2013; Code for Design of Strengthening Concrete Structure. China Building Industry Press: Beijing, China, 2014.
- ACI440.2R; Guide for the Design and Construction of Externally Bonded FRP Systems for Strengthening Concrete Structures. American Concrete Institute: Farmington Hills, MI, USA, 2017.
- Fib-TG 9.3; European Standard® Concrete Structures. Fédération Internationale du Béton: Brussels, Belgium, 2010.
- JSCE:2001; Japan Civil Engineering Society. Japan Society of Civil Engineers: Tokyo, Japan, 2001.
- CSA S806-12; Design and Construction of Building Structures with Fiber-Reinforced Polymers. Canadian Standards Association: Toronto, ON, Canada, 2012.
- Roberto, D.R.; Jorge, D.R. Size effects in the analysis of reinforced concrete structures. Eng. Struct. 2004, 26, 1115–1125. [Google Scholar]
- Liu, J.; Wenxuan, Y.; Xiuli, D.U.; Zhang, S.; Dong, L.I. Meso-scale modelling of the size effect on dynamic compressive failure of concrete under different strain rates. Int. J. Impact Eng. 2018, 125, 1–12. [Google Scholar]
- Du, X.; Jin, L.; Ma, G. A meso-scale analysis method for the simulation of nonlinear damage and failure behavior of reinforced concrete members. Int. J. Impact Eng. 2013, 22, 878–904. [Google Scholar] [CrossRef]
- Donza, H.; Cabrera, O.; Irassar, E.F. High-strength concrete with different fine aggregate. Cem. Concr. Res. 2002, 32, 1755–1761. [Google Scholar] [CrossRef]
- Meddah, M.S.; Salim, Z.; Saïd, B. Effect of content and particle size distribution of coarse aggregate on the compressive strength of concrete. Constr. Build. Mater. 2010, 24, 505–512. [Google Scholar] [CrossRef]
- Wriggers, P.; Moftah, S.O. Mesoscale models for concrete: Homogenization and damage behavior. Finite Elem. Anal. Des. 2006, 42, 623–636. [Google Scholar] [CrossRef]
- Jin, L.; Zhu, H.J.; Du, X.L. Meso-scale modelling of size effect on pure torsional-shear of RC columns. Arch. Civ. Mech. Eng. 2022, 22, 36. [Google Scholar] [CrossRef]
- Zhou, X.Q.; Hao, H. Modelling of compressive behaviour of concrete-like materials at high strain rate. Int. J. Solids Struct. 2008, 45, 4648–4661. [Google Scholar] [CrossRef]
- Zhou, X.Q.; Hao, H. Mesoscale modelling of concrete tensile failure mechanism at high strain rates. Comput. Struct. 2008, 86, 2013–2026. [Google Scholar] [CrossRef]
- Du, X.L.; Jin, L.; Ma, G.W. Numerical simulation of dynamic tensile-failure of concrete at meso-scale. Int. J. Impact Eng. 2014, 66, 5–17. [Google Scholar] [CrossRef]
- Song, Z.; Lu, Y. Mesoscopic analysis of concrete under excessively high strain rate compression and implications on interpretation of test data. Int. J. Impact Eng. 2012, 46, 41–55. [Google Scholar] [CrossRef]
- Svetlana, V. Bending of beams externally reinforced with TRC and CFRP monitored by DIC and AE. Compos. Struct. 2014, 112, 113–121. [Google Scholar]
- Thilakarathna, P.S.M.; Baduge, K.K.; Mendis, P.; Vimonsatit, V.; Lee, H. Mesoscale modelling of concrete—A review of geometry generation, placing algorithms, constitutive relations and applications. Eng. Fract. Mech. 2020, 231, 106974. [Google Scholar] [CrossRef]
- Guo, C.; Lu, Z. A 3D FEM Mesoscale Numerical Analysis of Concrete Tensile Strength Behaviour. Adv. Mater. Sci. Eng. 2021, 2021, 1–14. [Google Scholar] [CrossRef]
- Lubliner, J.; Oliver, J.; Oller, S. A plastic-damage model for concrete. Int. J. Solids Struct. 1989, 25, 299–326. [Google Scholar] [CrossRef]
- Lee, J.; Fenves, G.L. Plastic-damage model for cyclic loading of concrete structures. Eng. Mech. 1998, 124, 892–900. [Google Scholar] [CrossRef]
- Jin, L.; Zhu, H.J.; Du, X.L. Size effect numerical analysis on pure torsional failure of RC columns. Eng. Mech. 2022, 39, 227–236. [Google Scholar]
- Godat, A.; Qu, Z.; Lu, X.Z. Size effects for reinforced concrete beams strengthened in shear with CFRP strips. Compos. Constr. 2010, 14, 260–271. [Google Scholar] [CrossRef]
- Obaidat, Y.T.; Heyden, S.; Dahlblom, O. The effect of CFFP and CFRP/concrete interface models when modelling retrofitted RC beams with FEM. Compos. Struct. 2010, 92, 1391–1398. [Google Scholar] [CrossRef]
- Hashin, Z. Failure criteria for unidirectional fiber composites. J. Appl. Mech. 1980, 47, 329–334. [Google Scholar] [CrossRef]
- Kim, S.-M.; Rashid, K.; Abu, A.-R. Meso-scale computational modeling of the plastic-damage response of cementitious composites. Cem. Concr. Res. 2011, 41, 339–358. [Google Scholar] [CrossRef]
- GB50010-2010; Code for Design of Concrete Structures. China Architecture & Building Press: Beijing, China, 2010.
- Jiang, X.; Jin, L.; Du, X.L. Experimental Study on the Effect of Fiber Ratio on Shear Behavior of Large Size Concrete Beams Wrapped with CFRP Cloths. J. Build. Struct. 2022, 27, 1–12. [Google Scholar]
- Lu, X.Z.; Ye, L.P.; Teng, J.G. Bond-slip model for FRP-to-concrete interface. J. Build. Struct. 2005, 26, 9. [Google Scholar]
- Yuan, H. Interfacial Fracture Theories of FRP-Strengthened Structures; Faclty of Constryction: Guangzhou, China, 2002. [Google Scholar]
- Jin, L.; Jiang, X.; Lu, K. Tests on shear failure and size effect of CFRP-wrapped RC beams without stirrups: Influence of CFRP ratio. Compos. Struct. 2022, 291, 115613. [Google Scholar] [CrossRef]
- Unger, J.F.; Eckardt, S. Multiscale modeling of concrete-from mesoscale to marco-scale. Arch. Comput. Method Eng. 2011, 18, 341–393. [Google Scholar] [CrossRef]
- Jin, L.; Jiang, X.; Du, X.L. Shear failure and size effect of lightweight aggregate concrete beams without web reinforcement: Meso simulation. Eng. Mech. 2020, 37, 57–67. [Google Scholar]
- Ngo, D.; Scordelis, A.C. Finite element analysis of reinforced concrete beams. Proc 1967, 64, 152–163. [Google Scholar]
- Jin, L.; Yu, W.; Du, X.L. Mesoscopic numerical simulation of dynamic size effect on the splitting-tensile strength of concrete. Eng. Fract. Mech. 2019, 209, 317–332. [Google Scholar] [CrossRef]
- Raza, A.; Ali, B.; Nawaz, M.A. Structural Performance of FRP-RC Compression Members Wrapped with FRP Composites. Structures 2020, 27, 1693–1709. [Google Scholar] [CrossRef]
- Leung, C.K.; Chen, Z.; Lee, S.; Ng, M.; Xu, M.; Tang, J. Effect of size on the failure of geometrically similar concrete beams strengthened in shear with FRP strips. Compos. Constr. 2007, 11, 487–496. [Google Scholar] [CrossRef]
- Matta, F.; Nanni, A.; Galati, N. Size effect on shear strength of concrete beams reinforced with FRP bars. In Proceedings of the 6th International Conference on Fracture Mechanics of Concrete and Concrete Structures, Catania, Italy, 17–22 June 2007; Volume 2, pp. 1077–1084. [Google Scholar]
- Godat, A.; Labossiere, P.; Neale, K.W. Numerical investigation of the parameters influencing the behaviour of FRP shear-strengthened beams. Constr. Build Mater. 2012, 32, 90–98. [Google Scholar] [CrossRef]
- Liu, M.Y.; Yin, H.Q. Shear behavior test of reinforced concrete beams with high strength and light aggregate. J. Harbin Inst. Technol. 2008, 40, 5. [Google Scholar] [CrossRef]
- DG/TJ08-12-2017; Technical Specification for Reinforced Concrete Structures by Fiber Reinforced Composites. Tongji University Press: Shanghai, China, 2017.
- Zhang, J.Q. Experimental study on shear behavior of high strength concrete beams. Build. Sci. 2016, 32, 5. [Google Scholar] [CrossRef]
- Yi, W.; Pan, B.R.; Lv, Y.-M. Experimental study on shear behavior of HRB500 reinforced concrete beam with hoop. J. Civ. Eng. 2012, 45, 56–62. [Google Scholar]
- Sherif, H.A. Effect of fiber parameters and concrete strength on shear behavior of strengthened RC beams. Constr. Build. Mater. 2013, 44, 15–24. [Google Scholar]
- Al-Rousan, R. The shear behavior of Anchored CFRP Strengthened RC beams. Mag. Civ. Eng. 2022, 109, 1090. [Google Scholar]
- Al-Rousan, R. The shear behavior of CFRP strengthened RC beam. Mag. Civ. Eng. 2020, 98, 981. [Google Scholar]


| Specification Name | Calculation Formula | Characteristics and Comments |
|---|---|---|
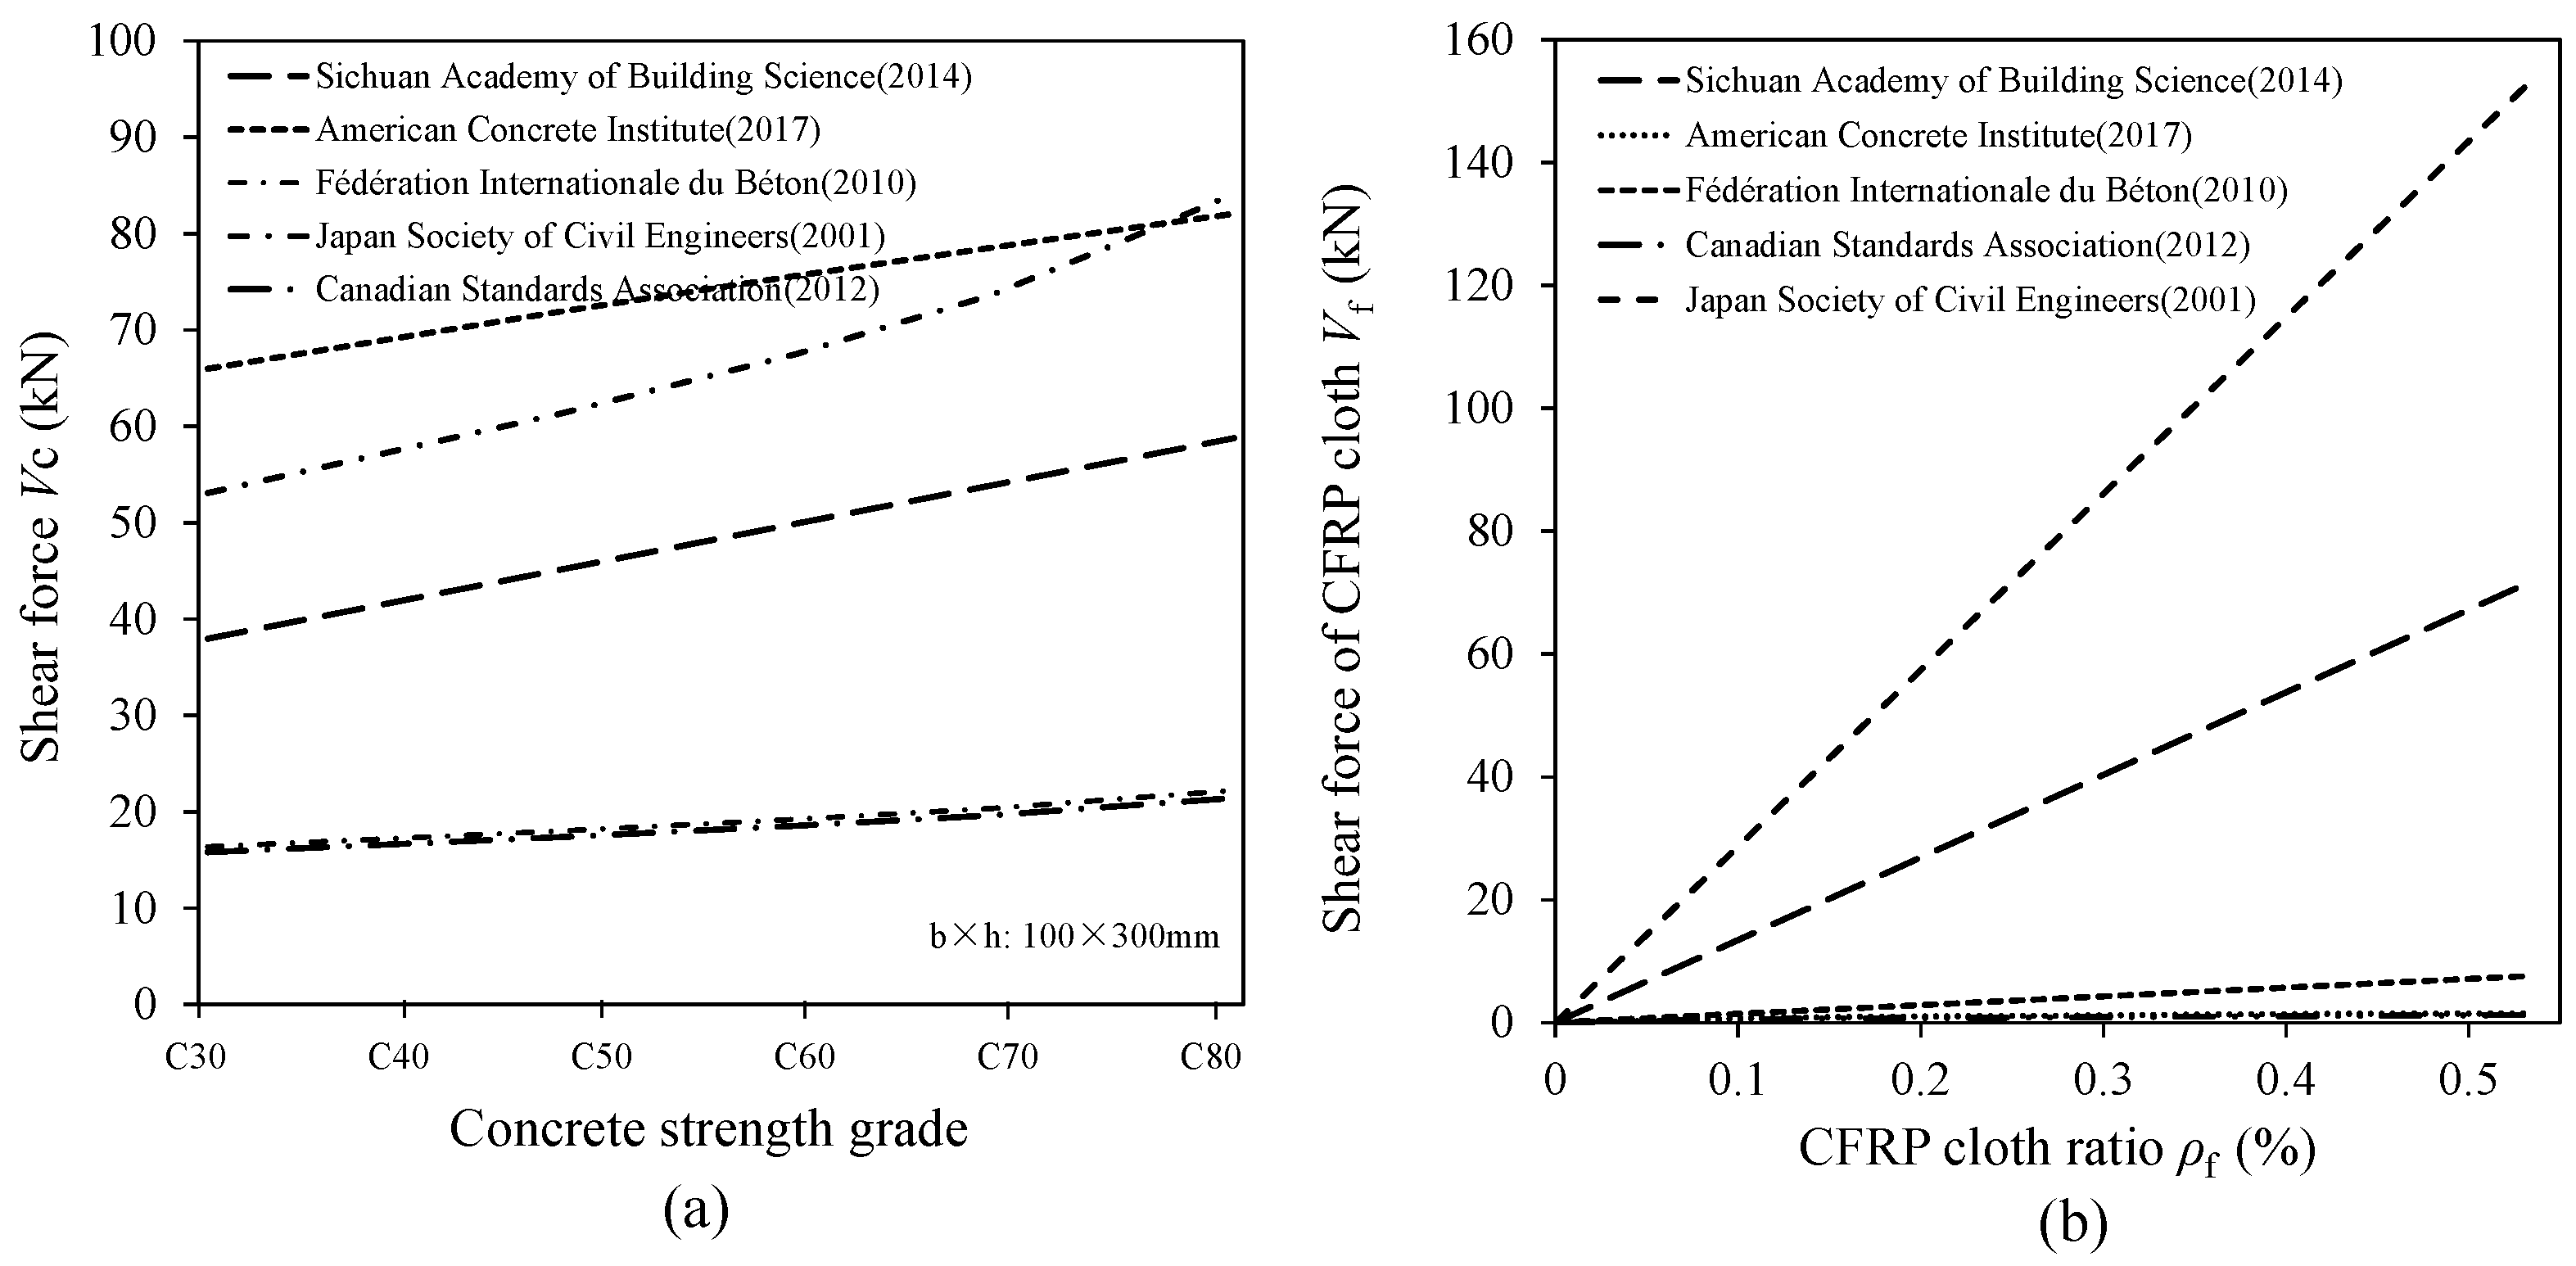
| Chinese codesꞏGB50367-2013 [25] | , influence coefficient of section height: when h0 is less than 800 mm, 800 mm is taken; When h0 is greater than 2000 mm, use 2000 mm; ft is the design value of concrete tensile strength; b and h0 are the width and effective height of the calculated section respectively. | The effect of section size on shear strength is considered; the effect of concrete strength increases linearly with ft |
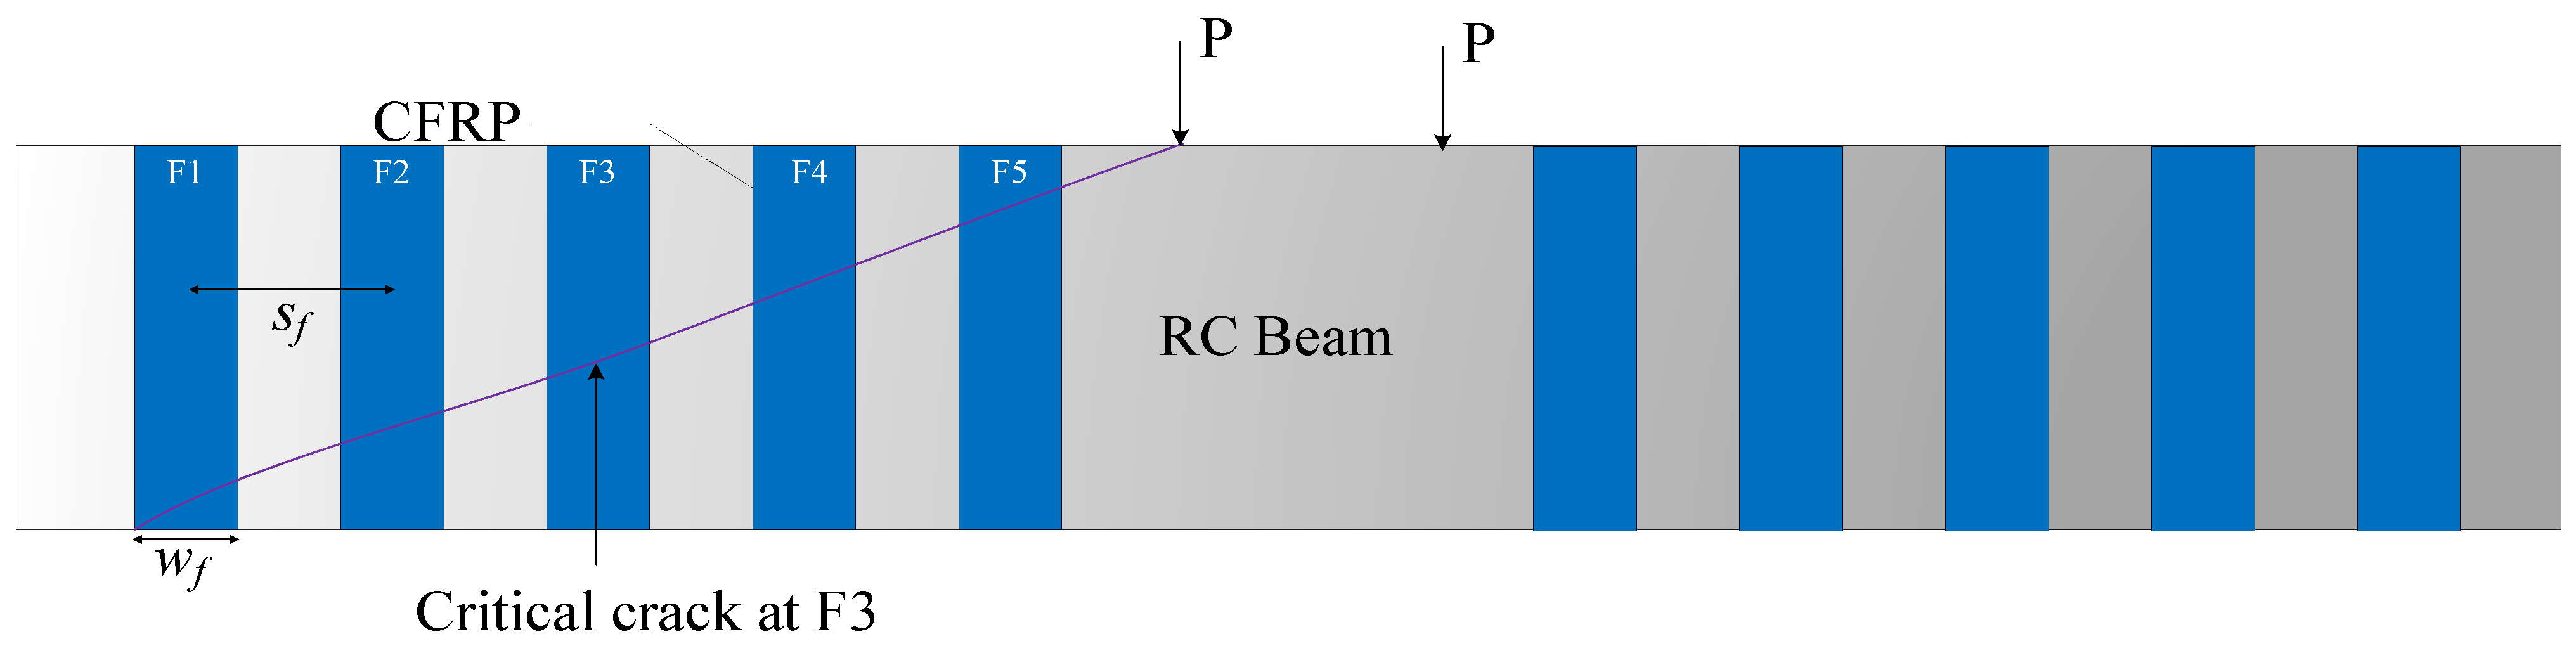
φ is the reduction coefficient of shear strength related to the anchoring method and stress condition of the strip; is the design value of tensile strength of fiber composite material for shear reinforcement; Af is the cross-sectional area of CFRP plate, that is, Af = 2nfwf tf, nf is the number of layers, wf is the width of CFRP plate, and tf is the thickness of CFRP plate. sf represents the distance between CFRP plates, here is the distance between two adjacent CFRP plates. hf is the bonding height of CFRP cloth. | Vf increases linearly with the increase of the fiber ratio; is multiplied by the adjustment coefficient of 0.56, multiply by the reduction coefficient φ according to the anchoring mode | |
| American codesꞏACI440.2R [26] | Λ is the density correction factor of concrete and 1.0 is taken for ordinary concrete; ρw is the ratio of longitudinal tensile reinforcement, which is 1% in this study; λs is the size effect correction factor, which is 1 in this study; is the compressive strength of concrete cylinder; bw and d are the width and effective height of the calculated section, respectively. | V is calculated using the arithmetic square of the compressive strength of a concrete cylinder |
Ψf is the additional reduction factor determined by the reinforcement scheme, 0.85 for the side reinforced and U-shaped wrapped beams, 0.95 for the fully wrapped beams; Af is the cross-sectional area of the CFRP plate, that is, Af = 2nfwf tf, nf is the number of layers, wf is the width of CFRP plate, and tf is the thickness of CFRP plate. sf represents the distance between CFRP plates; εfe is the effective strain of carbon fiber cloth; Ef is the elastic modulus of the CFRP cloth; α is the angle between the direction of the fiber force and the longitudinal axis of the beam; df is the width of CFRP plate; sf represents the distance between CFRP plates. | Compared with GB50367-2013, the tensile strength of CFRP is not reduced, but the effective strain of CFRP sheet is taken in account | |
| European codesꞏFib-TG 9.3 [27] | CRd,c = 0.18/γc, the concrete material component coefficient γc = 1.5 under the action of lasting and temporary loads; k = 2.0; ρl is the ratio of longitudinal tensile steel reinforcement; fck is the compressive strength of the concrete axis, unit MPa; bw and d are the width and effective height of the calculated section respectively. | The reduction coefficient CRd,c is very small, so that the calculated value of Vc is small when the reinforcement ratio is small, which is conservative |
is the effective strain design value of carbon fiber; Ef is the elastic modulus of carbon fiber cloth; α is the angle formed between the force direction of the fiber and the longitudinal axis of the beam; ρf is the fiber ratio; bw and d are the width and effective height of the calculated section, respectively; θ is the inclination angle of the concrete pressure rod and 21.8° ≤ θ ≤ 45°, the corresponding 1.0 ≤ cotθ ≤ 2.5. | The effective strain is taken in account and multiplied by a reduction factor of 0.9 | |
| Japanese codesꞏ JSCE: 2001 [28] | is the designed compressive strength of concrete; ; ; γb is the coefficient, take 1.3; bw and d are the width and effective height of the calculated section, respectively. | The design compressive strength of concrete is greatly reduced; divided by the coefficient 1.3, it makes the calculation very small |
K is the effective coefficient of shear reinforcement, and 0.4 is adopted in this paper; Af is the cross-sectional area of the CFRP plate, that is, Af = 2nfwf tf, nf is the number of layers, wf is the width of CFRP plate, and tf is the thickness of CFRP plate. Sf represents the distance between CFRP plates; ftf is the design tensile strength of the fiber material; α is the angle between the direction of the fiber force and the longitudinal axis of the beam; z is d/1.15; sf represents the distance between CFRP plates; γb is the coefficient, take 1.25. | The formula directly brings the tensile strength of CFRP cloth into the calculation, and although multiplied by the reduction factor K, Vf is greatly estimated | |
| Canadian codesꞏCSA S806-12 2017) [29] | Φc is the strength coefficient of concrete, which is 0.65; is the compressive strength of concrete, which is less than 64 Mpa; λ is the density correction factor of concrete, ordinary concrete takes 1.0; β is the influence coefficient of section height; bw and dv are the width and effective height of the calculated section, respectively. | Considering the concrete strength coefficient φc, Vc increases nonlinearly with |
is the reduction coefficient of FRP cloth, which is 0.65; Af is the cross-sectional area of CFRP plate, that is, Af = 2nfwf tf, nf is the number of layers, wf is the width of CFRP plate, and tf is the thickness of CFRP plate. sf represents the distance between CFRP plates; εf is the effective strain of carbon fiber cloth; Ef is the elastic modulus of carbon fiber cloth; θ is the inclination angle of the concrete pressure rod; αf is the angle between the direction of the fiber force and the longitudinal axis of the beam; sf represents the distance between CFRP plates. | Similar to the specification ACI440.2R; a smaller reduction factor is used |
| Key Point | Splitting Value (cr) | Peak Value (u) | Remnant Value (r) |
|---|---|---|---|
| Bonding stress τ (MPa) | τcr = 2.5ft | τu = 3ft | τr = ft |
| Relative slip s (mm) | scr,l = 0.025d | su,l = 0.04d | sr,l = 0.55d |
| Mechanical Property | C30 | C40 | C50 | C60 | C70 | C80 |
|---|---|---|---|---|---|---|
| The initial stiffness K0 (MPa/mm) | 70 | 70 | 70 | 70 | 70 | 70 |
| The initial slip S0 (mm) | 0.050 | 0.050 | 0.050 | 0.050 | 0.050 | 0.050 |
| Softening stiffness K (Mpa/mm) | 23.330 | 23.330 | 23.330 | 23.330 | 23.330 | 23.330 |
| The maximum bond slip Su (mm) | 0.200 | 0.200 | 0.200 | 0.200 | 0.200 | 0.200 |
| Tensile strength of concrete ft/Mpa | 2.01 | 2.39 | 2.64 | 2.85 | 2.99 | 3.11 |
| Fracture energy Gf/N/mm | 0.4367 | 0.4762 | 0.5004 | 0.5200 | 0.5326 | 0.5432 |
| Interfacial bearing capacity Pu/kN | 7357.86 | 7683.38 | 7876.87 | 8029.04 | 8125.88 | 8206.21 |
| Maximum stress τmax (Mpa) | 0.04367 | 0.04762 | 0.05004 | 0.052 | 0.05326 | 0.05432 |
| Density ρ (g/m3) | Thickness tf (mm) | Tensile Strength σt (MPa) | Elastic Modulus E (GPa) | Poisson’s Ratio ν |
|---|---|---|---|---|
| 1.8 | 0.167 | 3820 | 232 | 0.2 |
| Mechanical Parameters | Numerical Value |
|---|---|
| Longitudinal tensile strength (MPa) | #1188 |
| Longitudinal compressive strength (MPa) | #3.96 |
| Transverse tensile strength (MPa) | #3.96 |
| Transverse compressive strength (MPa) | #3.96 |
| Longitudinal shear strength (MPa) | #3.96 |
| Transverse shear strength (MPa) | #3.96 |
| Specimen Name | Effective Cross-Section Height h0 (mm) | CFRP Layers n | The Width of the CFRP wf (mm) | The Spacing of the CFRP sf (mm) | Fiber Ratio ρf |
|---|---|---|---|---|---|
| CUB-C30-0 | 270 | 0 | 0 | 100 | 0.0% |
| CUB-C30-0.1336 | 270 | 1 | 40 | 100 | 0.1336% |
| CUB-C30-0.2672 | 270 | 2 | 40 | 100 | 0.2672% |
| CUB-C30-0.4008 | 270 | 3 | 40 | 100 | 0.4008% |
| CUB-C30-0.5344 | 270 | 4 | 40 | 100 | 0.5344% |
| CUB-C40-0 | 270 | 0 | 0 | 100 | 0.0% |
| CUB-C40-0.1336 | 270 | 1 | 40 | 100 | 0.1336% |
| CUB-C40-0.2672 | 270 | 2 | 40 | 100 | 0.2672% |
| CUB-C40-0.4008 | 270 | 3 | 40 | 100 | 0.4008% |
| CUB-C40-0.5344 | 270 | 4 | 40 | 100 | 0.5344% |
| CUB-C50-0 | 270 | 0 | 0 | 100 | 0.0% |
| CUB-C50-0.1336 | 270 | 1 | 40 | 100 | 0.1336% |
| CUB-C50-0.2672 | 270 | 2 | 40 | 100 | 0.2672% |
| CUB-C50-0.4008 | 270 | 3 | 40 | 100 | 0.4008% |
| CUB-C50-0.5344 | 270 | 4 | 40 | 100 | 0.5344% |
| CUB-C60-0 | 270 | 0 | 0 | 100 | 0.0% |
| CUB-C60-0.1336 | 270 | 1 | 40 | 100 | 0.1336% |
| CUB-C60-0.2672 | 270 | 2 | 40 | 100 | 0.2672% |
| CUB-C60-0.4008 | 270 | 3 | 40 | 100 | 0.4008% |
| CUB-C60-0.5344 | 270 | 4 | 40 | 100 | 0.5344% |
| CUB-C70-0 | 270 | 0 | 0 | 100 | 0.0% |
| CUB-C70-0.1336 | 270 | 1 | 40 | 100 | 0.1336% |
| CUB-C70-0.2672 | 270 | 2 | 40 | 100 | 0.2672% |
| CUB-C70-0.4008 | 270 | 3 | 40 | 100 | 0.4008% |
| CUB-C70-0.5344 | 270 | 4 | 40 | 100 | 0.5344% |
| CUB-C80-0 | 270 | 0 | 0 | 100 | 0.0% |
| CUB-C80-0.1336 | 270 | 1 | 40 | 100 | 0.1336% |
| CUB-C80-0.2672 | 270 | 2 | 40 | 100 | 0.2672% |
| CUB-C80-0.4008 | 270 | 3 | 40 | 100 | 0.4008% |
| CUB-C80-0.5344 | 270 | 4 | 40 | 100 | 0.5344% |
Disclaimer/Publisher’s Note: The statements, opinions and data contained in all publications are solely those of the individual author(s) and contributor(s) and not of MDPI and/or the editor(s). MDPI and/or the editor(s) disclaim responsibility for any injury to people or property resulting from any ideas, methods, instructions or products referred to in the content. |
© 2023 by the authors. Licensee MDPI, Basel, Switzerland. This article is an open access article distributed under the terms and conditions of the Creative Commons Attribution (CC BY) license (https://creativecommons.org/licenses/by/4.0/).
Share and Cite
Li, D.; Yang, B.; Zhang, J.; Jin, L.; Du, X. Effects of Concrete Strength and CFRP Cloth Ratio on the Shear Performance of CFRP Cloth Strengthened RC Beams. Buildings 2023, 13, 2604. https://doi.org/10.3390/buildings13102604
Li D, Yang B, Zhang J, Jin L, Du X. Effects of Concrete Strength and CFRP Cloth Ratio on the Shear Performance of CFRP Cloth Strengthened RC Beams. Buildings. 2023; 13(10):2604. https://doi.org/10.3390/buildings13102604
Chicago/Turabian StyleLi, Dong, Bo Yang, Jiangxing Zhang, Liu Jin, and Xiuli Du. 2023. "Effects of Concrete Strength and CFRP Cloth Ratio on the Shear Performance of CFRP Cloth Strengthened RC Beams" Buildings 13, no. 10: 2604. https://doi.org/10.3390/buildings13102604