Abstract
Sediments are dredged from waterways to maintain maritime activities and prevent floods. Exorbitant amounts of money are budgeted for the removal of dredged material (DM) and its disposal in landfills. We investigated the potential for reuse of DM as a road construction material using so-called bio-enzyme products as stabilizing agents. To improve the mechanical properties of DM, such as compressive strength, compressibility, Atterberg limits and the California bearing ratio (CBR), mixtures of DM were tested with two different amounts of a commercially available bio-enzyme product, which yielded enzymatically stabilized dredged material (ESDM). Unconfined compressive strength (UCS), compaction and Atterberg limits were measured in accordance with ASTM specifications on all samples. Data show that the addition of bio-enzymes resulted in increases in UCS but did not affect the optimum moisture content (OMC), maximum dry unit weight or Atterberg limits of the DM. A comparative field study was carried out to evaluate the CBR of the CH subgrade before and after treatments with the bio-enzyme product and with lime as a traditional stabilizing agent. The results of the field study supported the laboratory findings. Based on these data and results from the literature, models predicting the effect of bio-enzyme treatments on the value of CBR and of UCS were developed statistically. These models also underlined the importance of the clay fraction and PI values for the improvement of the engineering properties of soil using bio-enzyme additives.
1. Introduction
Navigation waterways must be periodically dredged of naturally accumulating sediments to maintain efficient commercial or recreational navigation [1,2]. An enormous amount of dredged material (DM), 3 × 10⁸ m3 in the US alone, has been excavated from waterways [3,4]. However, DM may contain a variety of contaminants such as heavy metals and organic compounds [5,6] originating from different sources over time, making it difficult to predict the characteristics of DM and the environmental impact when considering reusing it [1]. Guidelines have been developed worldwide to guarantee sustainable use of ocean and marine ecosystems. The Marine Strategy Framework Directive, the European Water Framework Directive (2008), the OSPAR Convention (1992), the Barcelona Convention (1995) as well as the London LC72 (1972) and Helsinki (1992) Conventions are concerned with protecting the marine environment and have ensured the prohibition of DM disposal in open waters since 1992 [7]. Management alternatives have been developed, including the use of confined disposal facilities. Accordingly, in the US, since the enforcement of the existing ocean dumping permit plan in 1973, DM has been disposed of in placement areas designated by the United States Environmental Protection Agency (USEPA) [8]. Other management alternatives include disposal in landfills and the beneficial reuse of DM [9,10,11]. This later solution generates the most interest and has been the object of a recent extensive review [12]. However, DM generally makes for poor planting soils, may contain toxic compounds, and has limited structural properties, for example, shear strengths below 50 kPa (7.25 psi) and higher water contents than its liquid limits [13]. For a soil to be used for structural fill and/or cover soil in roadway construction, there are accepted requirements such as the material having a liquid limit (LL) of less than 45, a plastic index (PI) of less than 20, an unconfined compressive strength (UCS) greater than 35 psi and a California bearing ratio (CBR) of greater than 8 [14]. Since CBR and UCS test results are adversely affected if samples have a moisture content (MC) much above their corresponding optimum moisture content (OMC), untreated DM does not have the engineering properties required for structural applications [14]. The cementitious stabilization of DM has been attempted using Portland cement (PC), lime or pozzolanic stabilizers such as fly ash (FA) type C and F, cement kiln dust, etc. [15,16,17,18,19]. In recent studies, dredged material was treated with a blend of FA, PC, hydrated lime (HL) and fibers to produce compressed stabilized earth bricks (CSEBs) [20], while a report on the mixture of DM and recycled concrete concluded that mixtures containing 20% DM met the minimum road subgrade properties [21]. The stabilization mechanism and strengthening processes of these traditional stabilizers have been well-characterized in several studies [22,23,24,25], and the relationship between strength and water distribution was investigated using nuclear magnetic resonance spectroscopy [26]. Non-traditional stabilizers including ionic stabilizers, sulphonated limonene and enzyme emulsion are available in concentrated liquid forms, which are diluted with water prior to application and marketed as potential alternatives to traditional calcium-based stabilizers such as lime and cement [27,28]. Few independent investigations have been carried out regarding the use of non-traditional stabilizing agents [19]. One category of these agents comprises the so-called bio-enzyme products. Enzyme-based soil stabilizers have been successfully used in ground applications for the last 30 years [29]. These have sometimes been used to enhance the strength of soils because of their cost effectiveness and wide potential applicability; however, the potential of these additives as soil stabilizers remains unclear [30]. While numerous studies have been carried out on the stabilization of different fine-grained soils and sludges using more traditional reagents such as lime, cement, marble powder and other natural and artificial pozzolanic materials [15,16,18,19,31,32,33,34,35,36], studies on the stabilizer effect of the relatively new bio-enzyme products on soils are much fewer. Research has been conducted on the effectiveness of a fabricated enzymatic delivery system suitable for bio-cementation of soil [37] and efforts have been made to introduce bio-enzyme-based soil stabilization techniques [31]. Nevertheless, to the best of the authors’ knowledge, no independent studies have reported on the improvement of the strength characteristics, consistency limits, compaction and CBR of dredged material treated with bio-enzyme products. However, several studies have assessed the potential of these compounds on different soils, and some attempts to elucidate the physical and/or chemical reason for any functionality of bio-enzymes are relevant to this study.
Some reports demonstrate significant improvements in soil properties upon using bio-enzymes, while others report only marginal improvements. For example, Fox et al. [27] added a bio-enzyme product to a silty clay and demonstrated increases in the UCS of the stabilized material as compared to control samples as well as a shear strength increase of 15%, while the Atterberg values did not change significantly [27]. Bergmann similarly suggested that the best results of soil stabilization using a bio-enzyme product are achieved when the clay fraction is above 10% [38]. Going one step further, Kestler, by adding different types of bio-enzyme emulsions to various non-DM soils, concluded that bio-enzyme products work best on soils containing 12–24% clay, with a plasticity index between 8 and 35, and with a moisture content of about 2% to 3% below the optimum moisture content [4]. Shukla et al. also reported that bio-enzymatic stabilization of soils led to moderate to high improvements in the UCS—between 65% and 253%—and in CBR, depending on the clay content of the soil [39]. Isaac et al. carried out a comprehensive study on the enzyme effectiveness on lateritic soil and clay-type soil [40]. They found that in all soil types investigated, the CBR was increased by 136% to 1800% depending on the soil type. Agarwal and Kaur also observed 200% increases in UCS using high concentrations of a bio-enzyme on low-strength expansive soil [41], a report that was confirmed by Nadini et al. and by Sen and Singh, although LL and PI values did not change significantly [42,43].
Considering these results, it is perhaps unsurprising that too much clay will result in only small improvements, as reported by Marasteanu et al. and Milburn and Parsons [17,30]. Several other research groups report either that the addition of bio-enzymes causes modest improvement of soil properties [44,45,46] or has an effect on some properties but only a negligible impact on others [47,48,49]. Generally, the successful application of a given enzyme-based additive is case-specific and depends on the soil type, soil condition and operational loads [29].
The value of a stabilizing agent can ultimately only be evaluated based on its performance in the field. Brazetti and Murphy reported a field experiment conducted in Brazil on the use of a bio-enzyme product to increase the performance and cost of road construction, in which they concluded that the use of a bio-enzyme product was effective for both performance and cost [50]. A field study was also conducted by Hitam et al. on plantation roads, which were having serious problems during the rainy season [51]. Two monsoon seasons following the application of stabilizing agent the road was found to be in very good condition despite having been exposed to heavy rainfall.
A recent review of the literature confirms the difficulty in assessing the effect of bio-enzymes on multiple types of soils due in part to the mechanism of action being unclear and likewise because the fabrication of bio-enzymes has not been made public [31]. On the other hand, numerous reports suggest the potential of using this type of stabilizing agent to generate a significant positive impact in certain road and soil conditions. Nonetheless, more information is required before our understanding of bio-enzymes can support general predictions of the outcome of soil stabilization [17,31]. Observations such as those of Katz et al. [52], who studied the effect of liquid stabilizers as well as one bio-enzyme product when applied to five soil samples including Texas clays, finding no noticeable improvements, have led to a hypothesis on the mechanism of stabilization of bio-enzymes. Kat et al. explained that when a stabilizer solution was added to soil, the extent of the effect depended on the valence and size of the cation present. Bio-enzymes are often believed to initiate some type of interaction with clay particles. Tingle et al. have suggested that the bio-enzymes stabilize soils by binding large, organic positively charged particles attracted to the net negative surface charge of the clay minerals [19]. The clay environment would then be closer to a net-zero charge, reducing the affinity of water molecules for the clay particles. Along similar lines of thought, other hypotheses also include that the mechanism of action may involve the encapsulation of clay minerals, the accelerated exchange of interlayer cations, the breakdown of clay mineral with expulsion of water from the double layer, or the interlayer expansion with subsequent moisture entrapment [28,31,53,54].
While no reports are available on using bio-enzyme products for the stabilization of DM, this type of soil is classified as CH-fat clay. The stabilizing mechanism of high-plasticity CH-fat clay soil found in Texas, which is considered a highly expansive clay, has been demonstrated to occur through cations’ exchange and the increase in cations’ concentration in the soil pore water, which leads to accelerated cation exchange with negatively charged clay particles [55]. Therefore, it is worthwhile investigating the potential of bio-enzymes to stabilize DM, particularly in view of the availability and need to reuse DM. Herein, we present experimental results on the potential of bio-enzymes to stabilize DM classified as high-plasticity clay (CH) dredged from the mouth of the Neches River in Texas, USA. Included in our report is a field test of the bio-enzyme on Texas CH soil. Our results are compared with those reported by various researchers for non-DM soils. Drawing on these comparisons, ANOVAs were performed, and preliminary models are presented to help predict improvements in UCS and CBR as a function of native soil properties, enzyme dosage and curing time.
2. Results and Discussion
2.1. Chemical Toxicity Tests
Dredged material may often contain various heavy metals and high organic compounds including microplastics, though depending on the location where it was dredged [56]. High concentrations of heavy metals and organics make soil hazardous and unsuitable for construction purposes. Therefore, in this study on how to reuse DM, the first step was to ensure that the soil was environmentally safe. A chemical analysis was conducted on the untreated DM sample to determine the presence of contaminants and also to evaluate the presence of any chemicals that could affect the stabilization process. A waste material is considered toxic if it can leach toxic compounds such as heavy metals, organic compounds, or pesticides into the soil or groundwater over time. The toxicity characteristic leaching procedure (TCLP) test was used to determine if the DM could leach these chemicals into the soil or groundwater. The TCLP test is a complex leaching procedure that simulates conditions of wastes if they were to be disposed of in an ordinary sanitary landfill [57]. Table 1 summarizes the results of the TCLP chemical analysis of the untreated DM as compared with thresholds specified by the U.S. Environmental Protection Agency (USEPA) when tested in accordance with the EPA 6010C method. The results showed that no heavy metals were present in excess and that this material could be reused. We note that the barium concentration was about three times over the reporting limit and, therefore, was reported as requested by the EPA.

Table 1.
Heavy metal detection levels using TCLP method.
2.2. Untreated Dredged Material
DM samples were collected from three different locations in Placement Area 5C. Table 2 summarizes the engineering properties of the untreated DM. Dredged material may exhibit some variations when tested for moisture content and other physical properties depending on sampling location and the amount of time since the DM has been excavated and placed in the landfill. Since the plastic characteristics and the fraction of soil passing through sieve No. 200 (F200) were similar for the three sampling locations, samples from all three locations were combined. The properties of this combined soil represented an average of the DM located in Placement Area 5C. We note that the moisture content of the combined sample was lower than expected because the DM samples were stored at ambient temperature for about three months before testing. Due to the moisture evaporation over time, the moisture content in Table 2 is 57%.
Table 2.
Engineering properties of the untreated DM.
From the data in Table 2, untreated DM can be classified as a CH soil according to USCS recommendations. Table 2 also shows that the organic content of the untreated DM is below 3% and thus the DM can be considered an inorganic silty clay. According to the literature, an organic content below a minimum threshold of 3–4% is too low to interfere with the stabilization process [58,59,60].
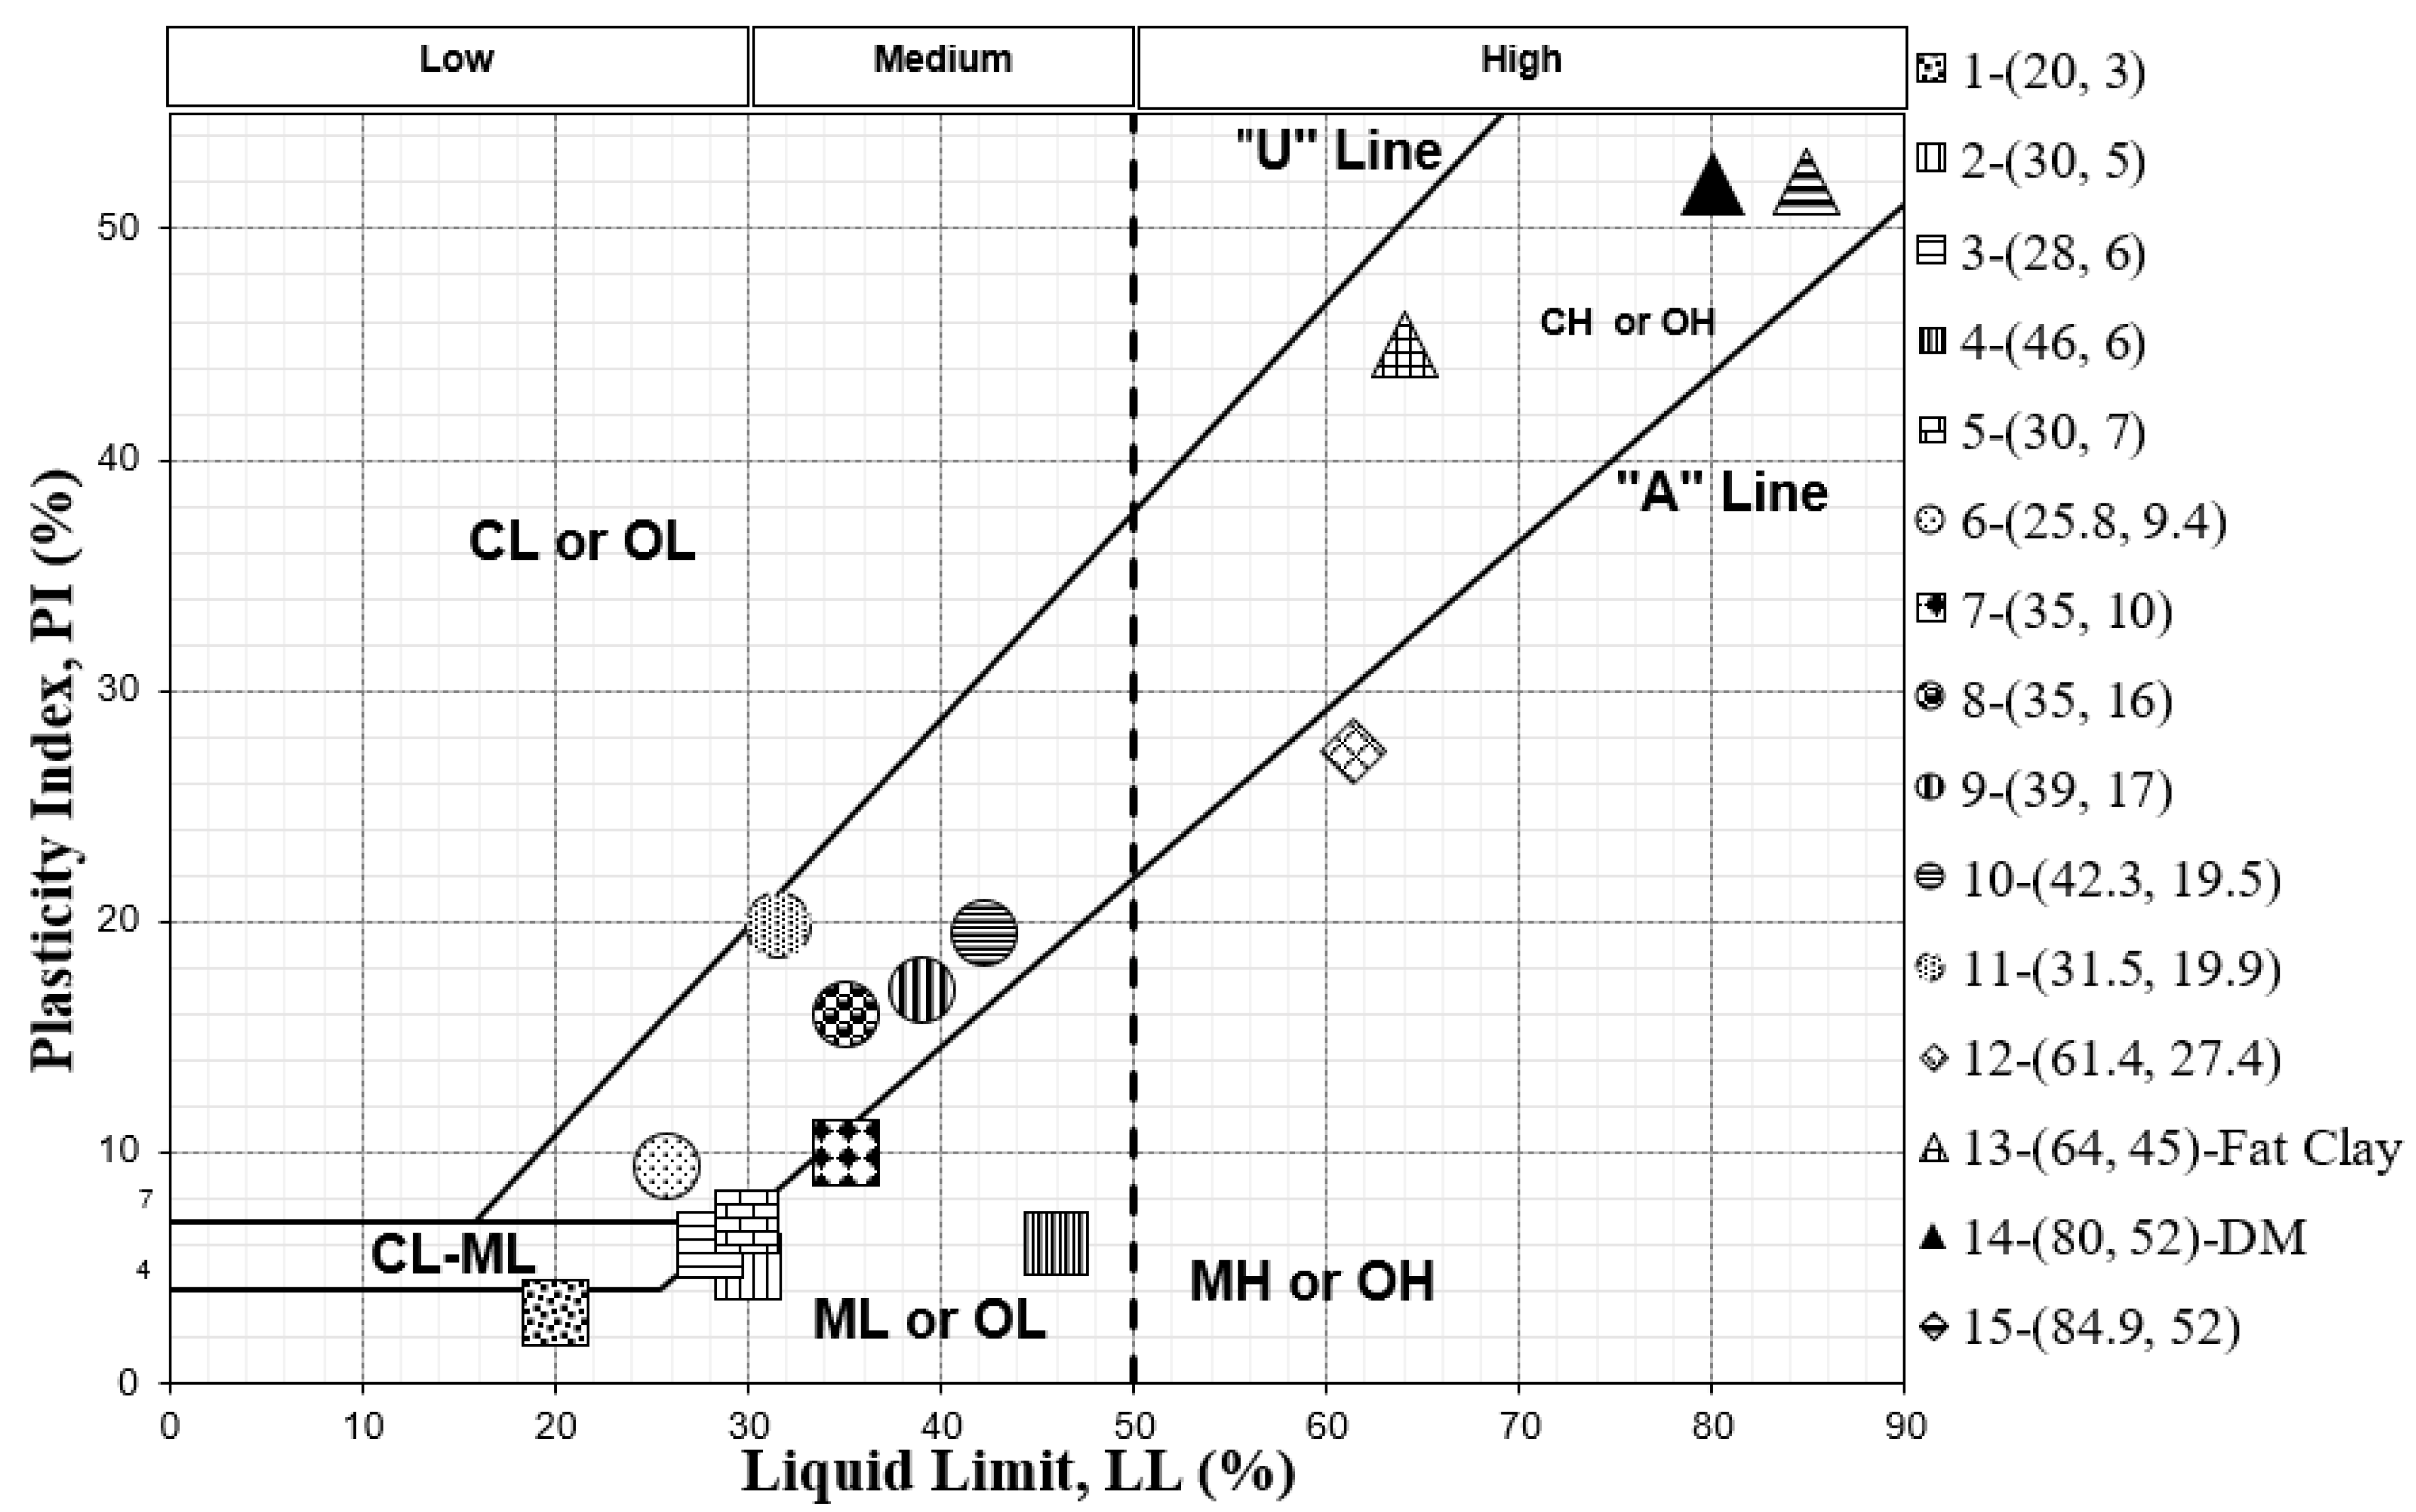
Although no work has been reported specifically on the bio-enzyme stabilization of dredged material, some studies have presented results on the improvement of the mechanical and engineering properties of different types of soils, particularly poor-strength local soil. Studies on the stabilizing effect of bio-enzyme products on soils, specifically ones that presented basic soil properties (e.g., particle size distribution, strength and consistency limits), are tabulated in Table 3. Soil samples are organized and numbered in ascending order for their PI values. Therefore, No. 1 denotes the untreated soil with the lowest PI, while No. 15 indicates the largest PI, which is the untreated DM used in this study.
Table 3.
Initial properties of untreated soil materials compared in this study.
The soil types related to these comparative studies are presented on a USCS chart in Figure 1 based on their particle size distribution and plasticity characteristics. Figure 1 shows how different soil samples fall in different plasticity regions and have varied LL and PI. The soil samples that are in roughly the same region are shown with the same marker shape for easier identification. All soil samples are listed in the legend according to their ID number (see Table 3) followed by their LL and PI.

Figure 1.
Classification, based on moisture indices, of soil types used in our comparative study.
In the following sections, the results of the UCS, standard Proctor, Atterberg limit and CBR tests on DM before and after bio-enzyme treatment at two dosages are presented and discussed. The results are then compared with those of other soil types, shown in Figure 1, reported in the literature.
2.3. Effect of Stabilization on Physical Properties
2.3.1. Unconfined Compressive Strength (UCS)
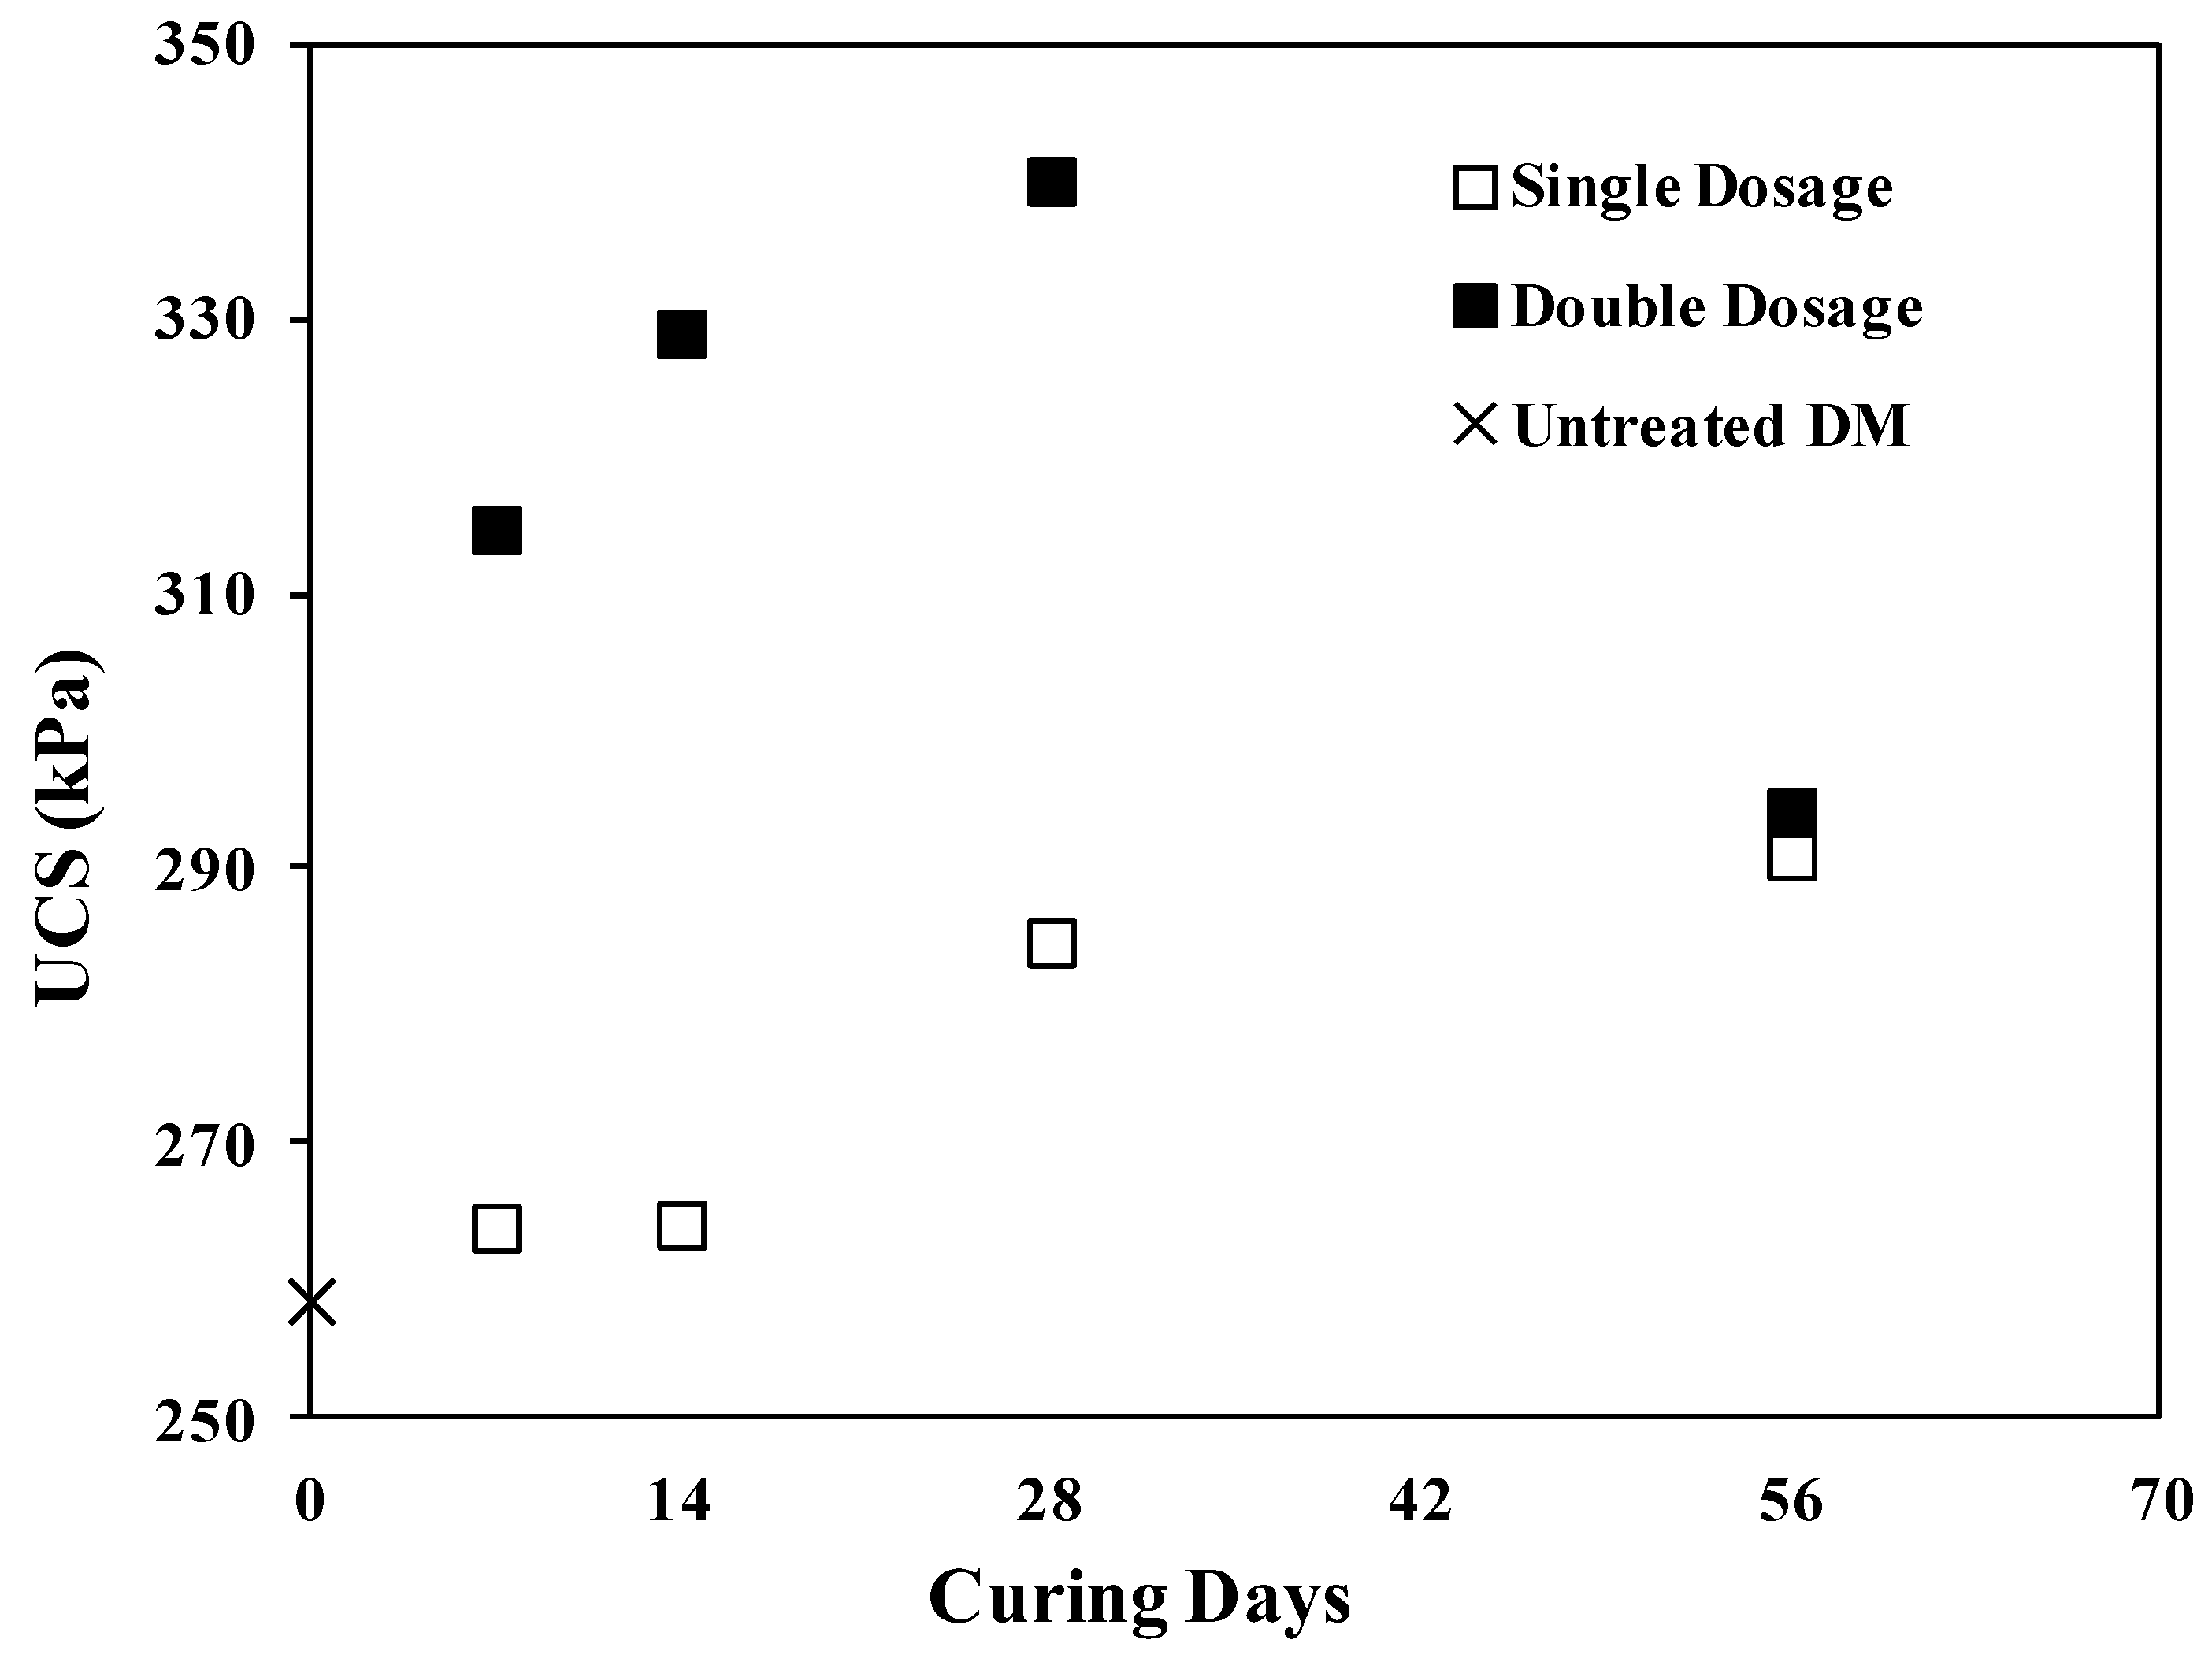
Dredged material was treated with two different dosages of enzyme and cured for 1, 2, 4 and 8 weeks. Unconfined compressive strength tests were carried out on untreated DM and ESDM. Figure 2 presents the UCS of all samples as a function of treatment time. Applying a single dosage of bio-enzyme to the DM did not improve the UCS of DM at short curing times (7 and 14 days) but caused increases of roughly 10% and 13% for UCS values measured following 28 and 56 days of curing, respectively, up to a maximum value of 290.9 kPa (42.2 psi) after 56 days. Using a double dose of enzyme resulted in a rapid increase in UCS, with a maximum achieved after 28 days of curing (340 kPa (49.3 psi)), representing a 31% increase. However, at a longer curing time of 56 days, the UCS decreased to 295 kPa (42.7 psi). The improvement may be attributed, as previously suggested by several authors, to the additive acting as a barrier preventing the absorption of water molecules and generating a more densely packed structure of soil particles [28,30,54].
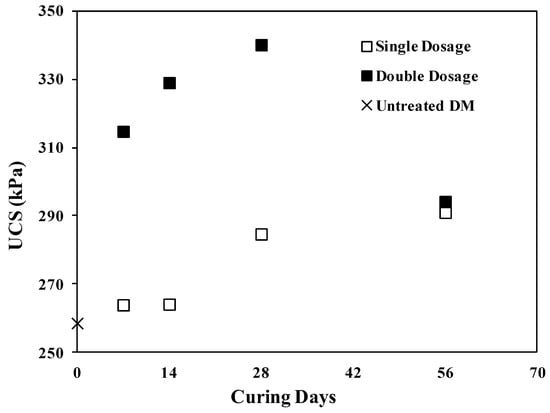
Figure 2.
UCS variation versus curing time for single and double dosage.
Marasteanu et al. pointed out that bio-enzyme products require more than 56 days to permanently change the soil, and they argued that more than 4 months are needed for favorable bio-enzyme reactions to complete and work effectively [30]. Other research groups have not reported consistent results in terms of the effects of bio-enzyme content and curing age on UCS gains. Some studies demonstrated that, when a bio-enzyme was found to be effective for soil stabilization, i.e., an increase in UCS of 100% or more, the maximum UCS gain occurred at the dosage recommended by the manufacturer, and that increasing the bio-enzyme amount did not result in a significant improvement [43,61]. Previous results have shown that increasing the bio-enzyme content to as high as 16-fold caused the soil sample’s UCS to increase by only 69% [41]. Cases have even been reported where increasing the dosage had a negative effect and a lower UCS was obtained as the dosage was increased [42,61]. Hence, the increase and later decrease in UCS at higher bio-enzyme dosages and longer curing times may be the results of multiple effects that are related to the type of soil investigated. To help shed some light on the influence of soil type, Figure 3 compares our results of DM soil treated with a bio-enzyme product with other soils treated using similar additives. Panel 3A presents the UCS of all the untreated soils considered in this study, and panel 3B shows the percentage increase resulting from the bio-enzyme treatment and 28 days of curing. We should note that the normalized increase in UCS was defined as [(UCStreated − UCSinitial)/UCSinitial] × 100. The soil samples are listed in the figure’s legend according to the numbers assigned in Table 3. The numbers in parentheses represent the soil sample’s LL and PI, respectively (LL, PI).
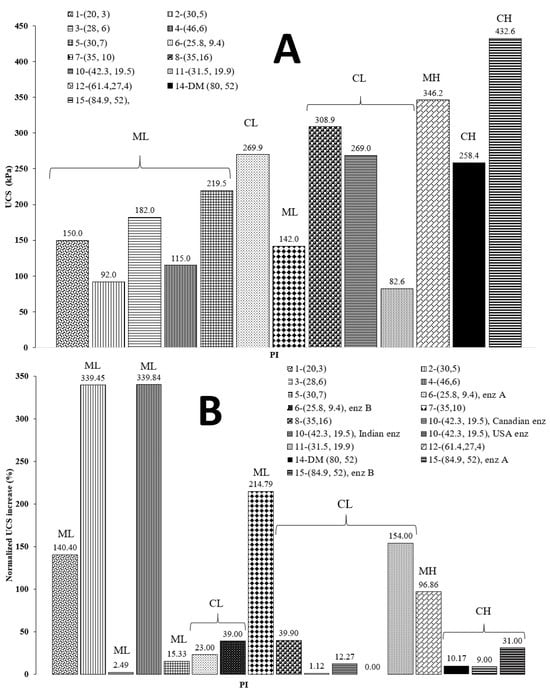
Figure 3.
Comparison of the UCS for the soils considered. (Panel (A)) initial UCS values. (Panel (B)) normalized USC increase (%) after 28 days of curing for different soil types treated with bio-enzyme products.
Figure 3A shows that ML soil has a lower initial strength compared to other types of soil, perhaps because ML soil has lower plasticity values, fewer clay minerals and, therefore, less cohesion. Figure 3B reveals that ML soils show better improvement, on average, after a treatment using bio-enzymes, while CL and CH soils show only moderate to little improvement. Improvement for ML soils may be due to the surfactant-like effect of the additive on soil particles [28,30,45,52]. This suggests that bio-enzyme products are more efficient at increasing the UCS of soils containing more silt than clay. The ML soil studied by Parsons and Milburn, sample 5, only showed modest improvement in UCS after bio-enzyme treatment [32]. This could be due to the presence of too much fine content (88%) in the soil (see Table 3). Figure 3B indicates that the three highest increases in UCS occurred for soils with clay fractions between 2% and 20%.
The data suggest that samples containing a 2–20% clay fraction are more likely to show a UCS increase after enzyme treatment. From the original properties of untreated soils provided in Table 3 and the normalized UCS values displayed in Figure 3B, we note that among the five samples (i.e., samples #4, #2, #7, #11 and #1) with the highest normalized UCS percentage increase, four have a PI value between 3 and 10. These results are partly in agreement with results reported by Kestler recommending that a soil suitable for enzymatic stabilization should have a PI between 8 and 35 and a clay content of 12–24% [4]. These results also confirm those of Bergmann, who suggested that 2% clay is necessary for reactions leading to UCS improvement and added that a clay fraction between 10% and 15% tends to exhibit the most significant strength improvement [38]. These effects suggest that the initial soil properties, such as UCS, clay and sand fraction, and moisture indices (LL and PI) also affect the physical properties of the treated soil and need to be investigated further.
2.3.2. Consistency Limits
The application of bio-enzyme products did not have a significant effect on the moisture limits of the DM. The LL and PI of the untreated DM were 80 and 52, respectively, and remained mostly unchanged (LL = 79, PI = 50) after treatment with either of the bio-enzyme dosages. These results agree with those of other studies [28,30,44,46], which observed only minor changes when a bio-enzyme product was added to soil.
2.3.3. Compaction Characteristics
Standard Proctor compaction tests were conducted as per ASTM D698 on untreated DM and ESDM at the two different bio-enzyme dosages. Figure 4 presents the compaction curves. The optimum moisture content and the maximum dry density (MDD) remained almost unchanged after the stabilization with either dosage.
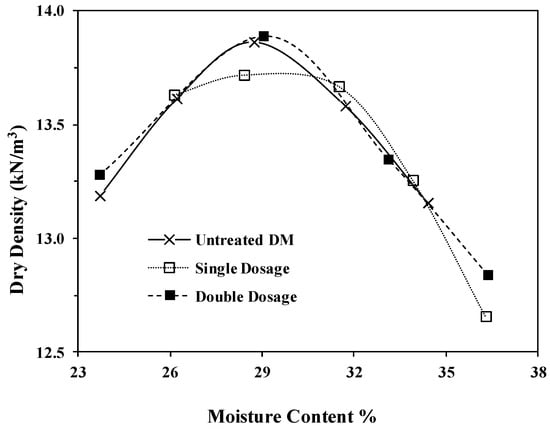
Figure 4.
Moisture–density relation of the untreated and stabilized DM.
Our results support the finding of others. In fact, the ineffectiveness of the bio-enzyme addition in altering the MDD and OMC of clayey soil has been reported by several groups [17,28,44,46]. Results reported on CL-lean clay treated with PermaZyme by Milburn and Parsons showed slightly higher density [17]. Compaction tests on three mixtures and natural Texas CH high-plasticity clays as well as on two other soil samples (kaolinite (MH) and illite (CL)), previously reported by Rauch et al., showed no significant effect of any bio-enzyme treatment on the compacted soil unit weight or void ratio, which agrees with the results reported here [28]. Researchers have argued that structural properties of the bio-enzyme-treated soils remain unchanged after additive application and that no change in the mineralogy and chemical composition takes place in these treated soils [28,46,52]. The results show that laboratory tests may or may not demonstrate improvements in soil physical properties upon bio-enzyme treatment. For the reuse of DM and other soils for various applications such as road construction material, field studies are expected to provide more reliable information.
2.4. Field Study
2.4.1. Road Test Lanes
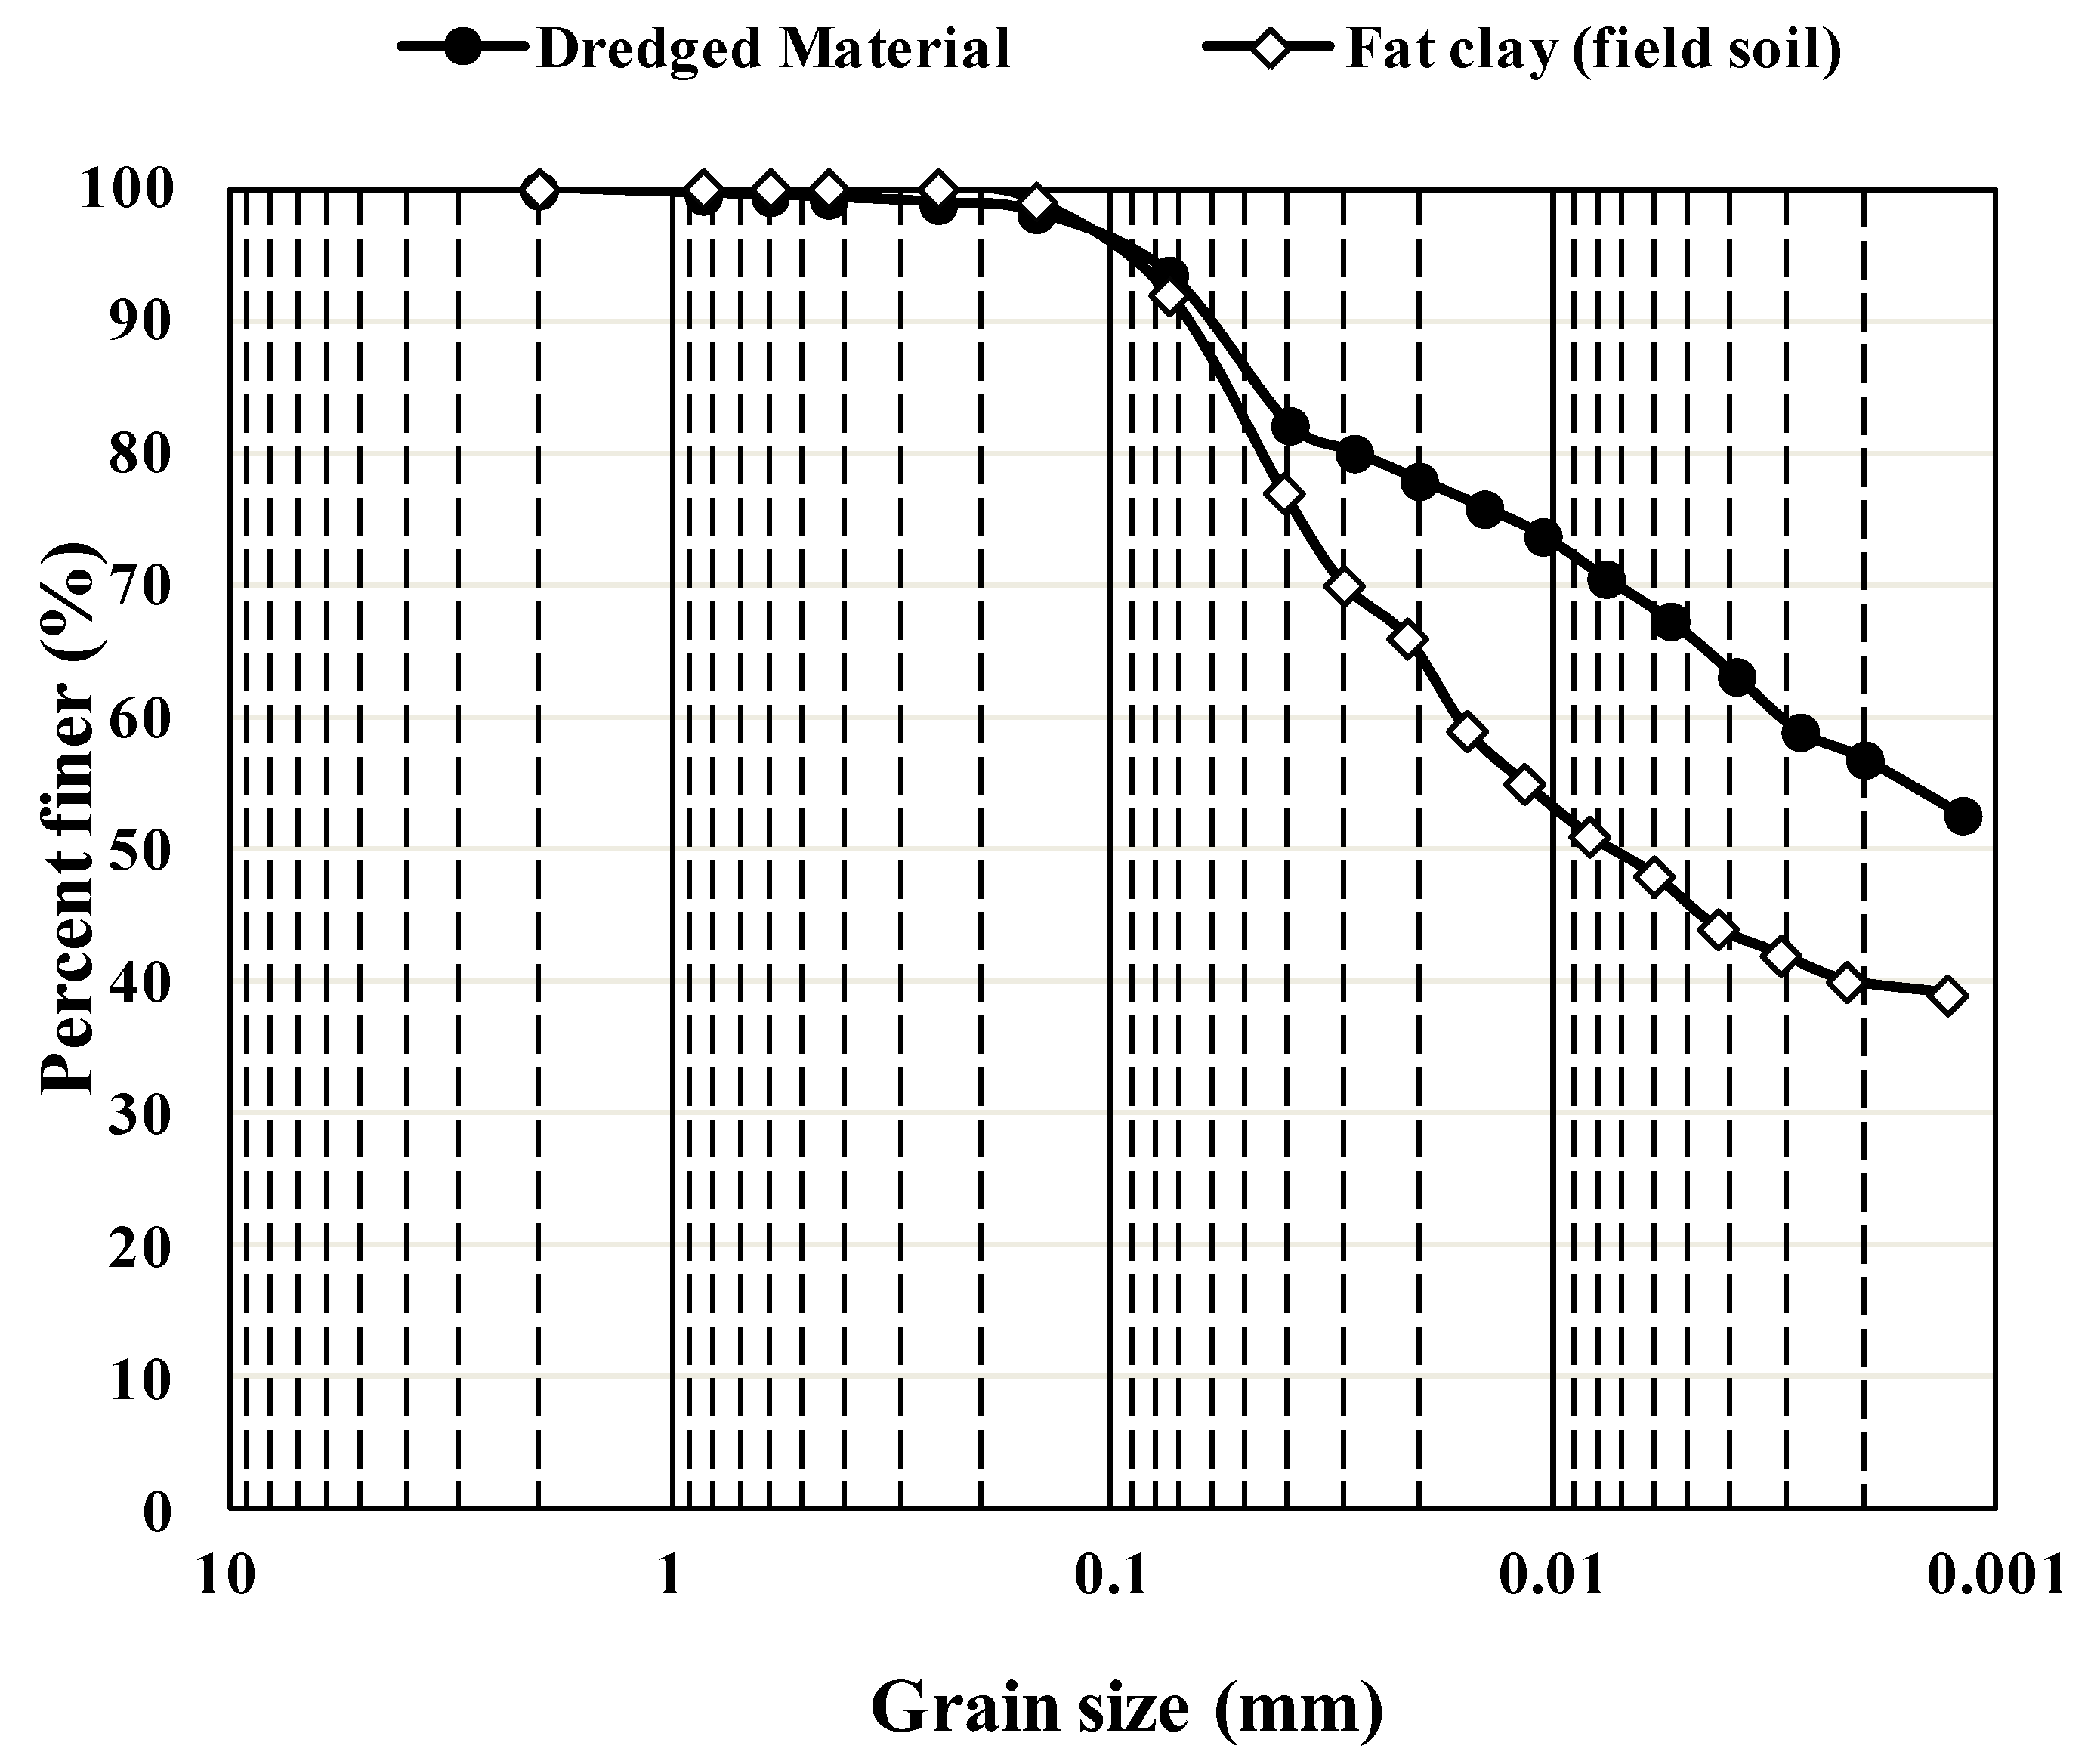
Unlike traditional stabilization methods using lime, cement, etc., no reliable laboratory tests can predict the field performance of soils stabilized using bio-enzyme reagents [45]. Researchers have argued that all stabilizers perform less effectively when used in the field, where rigorous control of laboratory conditions can no longer be achieved [46]. To determine the field performance of the bio-enzyme-stabilized CH-fat clay subgrade, a separate study was performed. An experimental site was provided by Mason Construction (Texas) in their laydown yard, approximately 20 miles from the DM sampling location. CH-fat clay field soil was used as a control. Figure 5 compares the gradation curves for the DM and the CH-fat clay field soil and reveals that both soils are silty clay with minimum sand content. The DM contains smaller particles, which could be attributed to the accumulation of finer particle washed down along the waterway to the mouth of the river. DM is composed of 6% fine sand, 37% silt and about 57% clay, while the CH-fat clay field soil contains 8% fine sand, 52% silt and 40% clay. The field soil has a PI value of 45 and thus is classified as a non-organic CH-fat clay according to the USCS soil classification system (ASTM D2487). Both DM and the field CH soil can also be classified as A-7-6 per AASHTO (M 145). The similarities between the soil samples enabled their comparison under laboratory and field conditions.
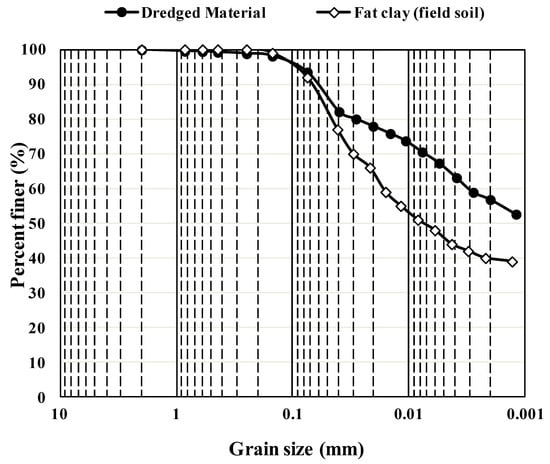
Figure 5.
Particle size distribution of DM and the CH-fat clay field soil.
Three test road lanes, 5 m × 15 m (16 ft × 50 ft), were made using untreated soil and soil treated with the two different dosages of bio-enzyme. For comparison, a 2.5 m × 15 m (8 ft × 50 ft) lane was prepared from a local CH soil treated with 7% hydrated lime, the prevailing regional stabilization method.
2.4.2. Moisture–Density Relation and Cracking Behavior
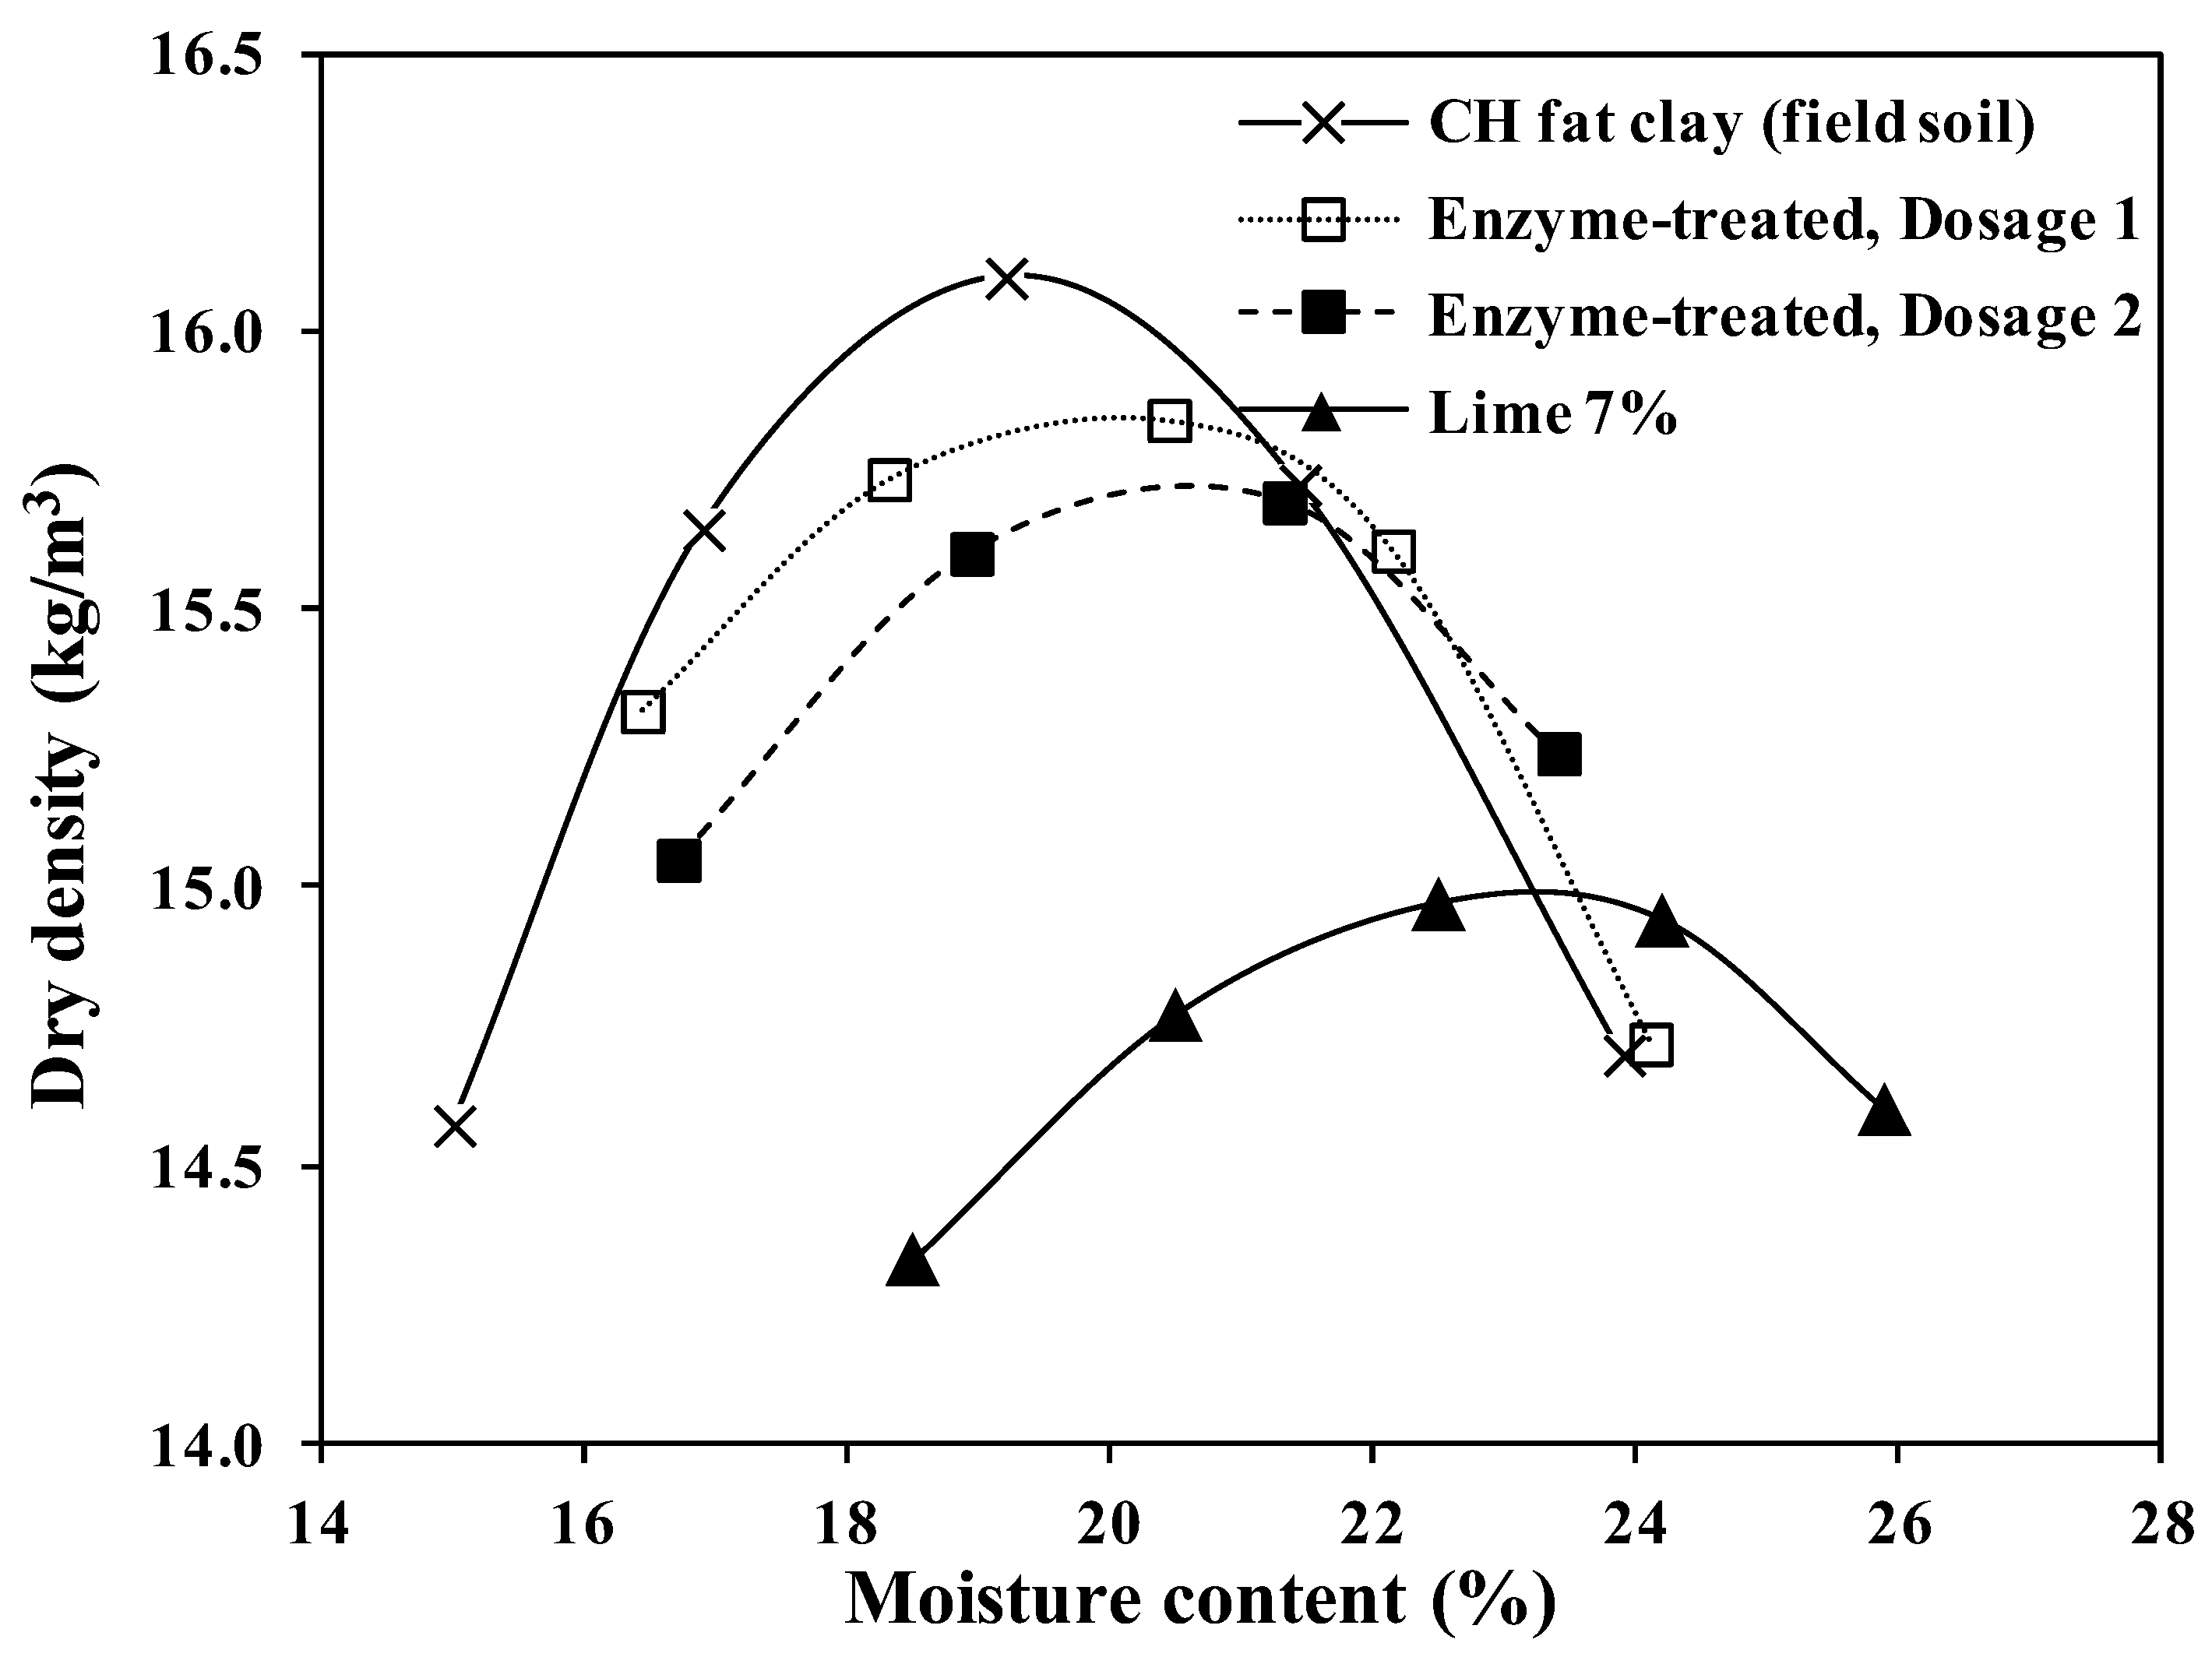
The results of standard compaction tests carried out on all four samples are shown in Figure 6. Similar to the laboratory results, the bio-enzyme additive only caused a slight change in the OMC of the original soil. Lime treatment caused a considerable change in the maximum dry density (ϒdmax) and increased the OMC from around 19% to 23.5%. The decrease in the maximum dry density in conjunction with slight increases in OMC was also previously reported for lime treatment [17,62].

Figure 6.
Moisture–density curves for untreated and treated CH field soil.
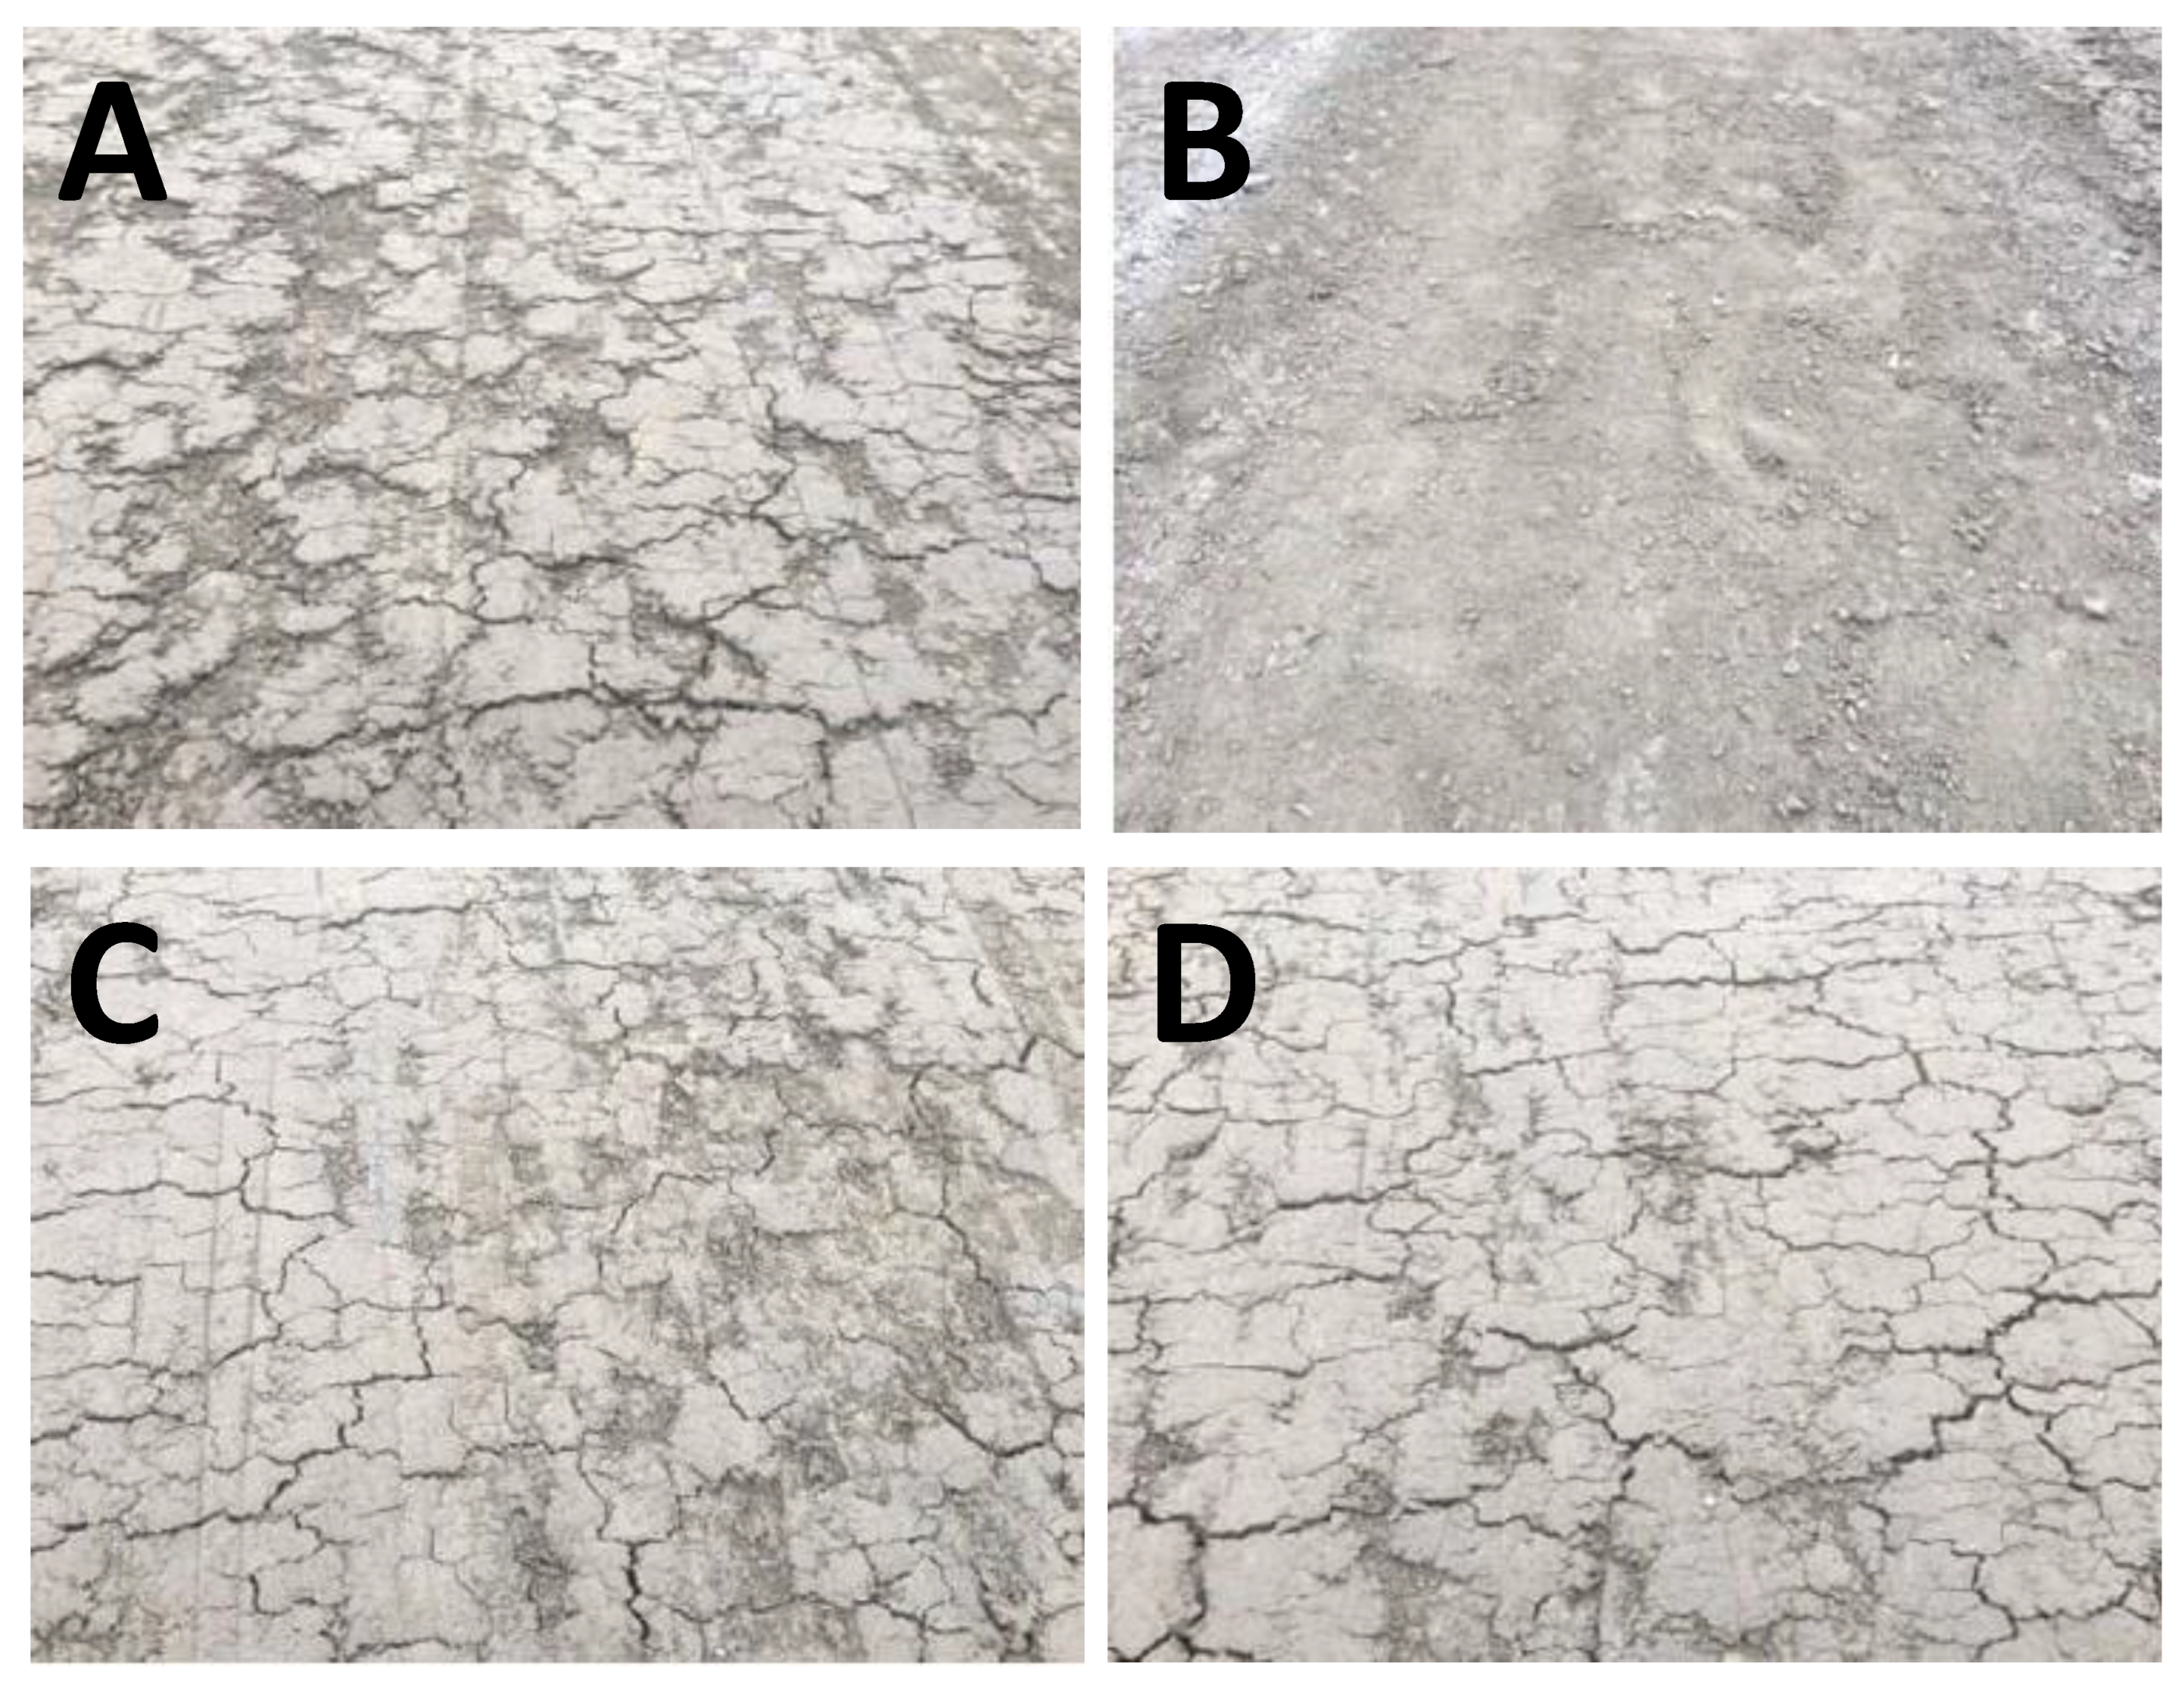
Figure 7 presents images of the soil samples following one week of curing. Panel A, representing the untreated CH-fat clay soil sample, reveals multiple large cracks in the tracks. However, panel B, showing the lime-stabilized track, proves that the treatment was successful as the image shows little to no cracks. The bio-enzyme additive barely seemed to improve the shrink/swell potential of the soil, regardless of using a single (panel C) or double (panel D) dosage. Hence, the field test suggests that the bio-enzyme mode of stabilization of CH-fat clay is not similar to that of lime.
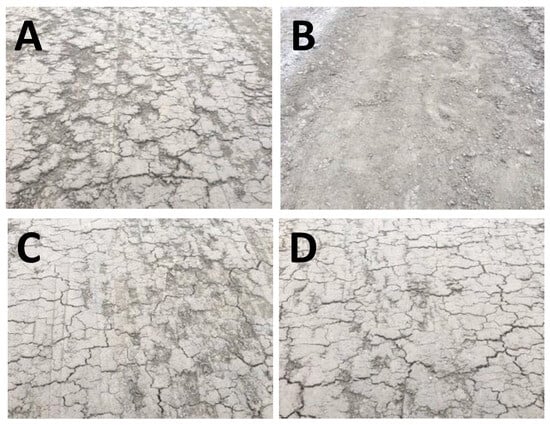
Figure 7.
Images of untreated and treated field soil tracks one week after treatment: (A) untreated field soil, (B) treated with 7% lime, (C) treated with bio-enzyme (single dosage), (D) treated with bio-enzyme (double dosage).
2.4.3. California Bearing Ratio (CBR)
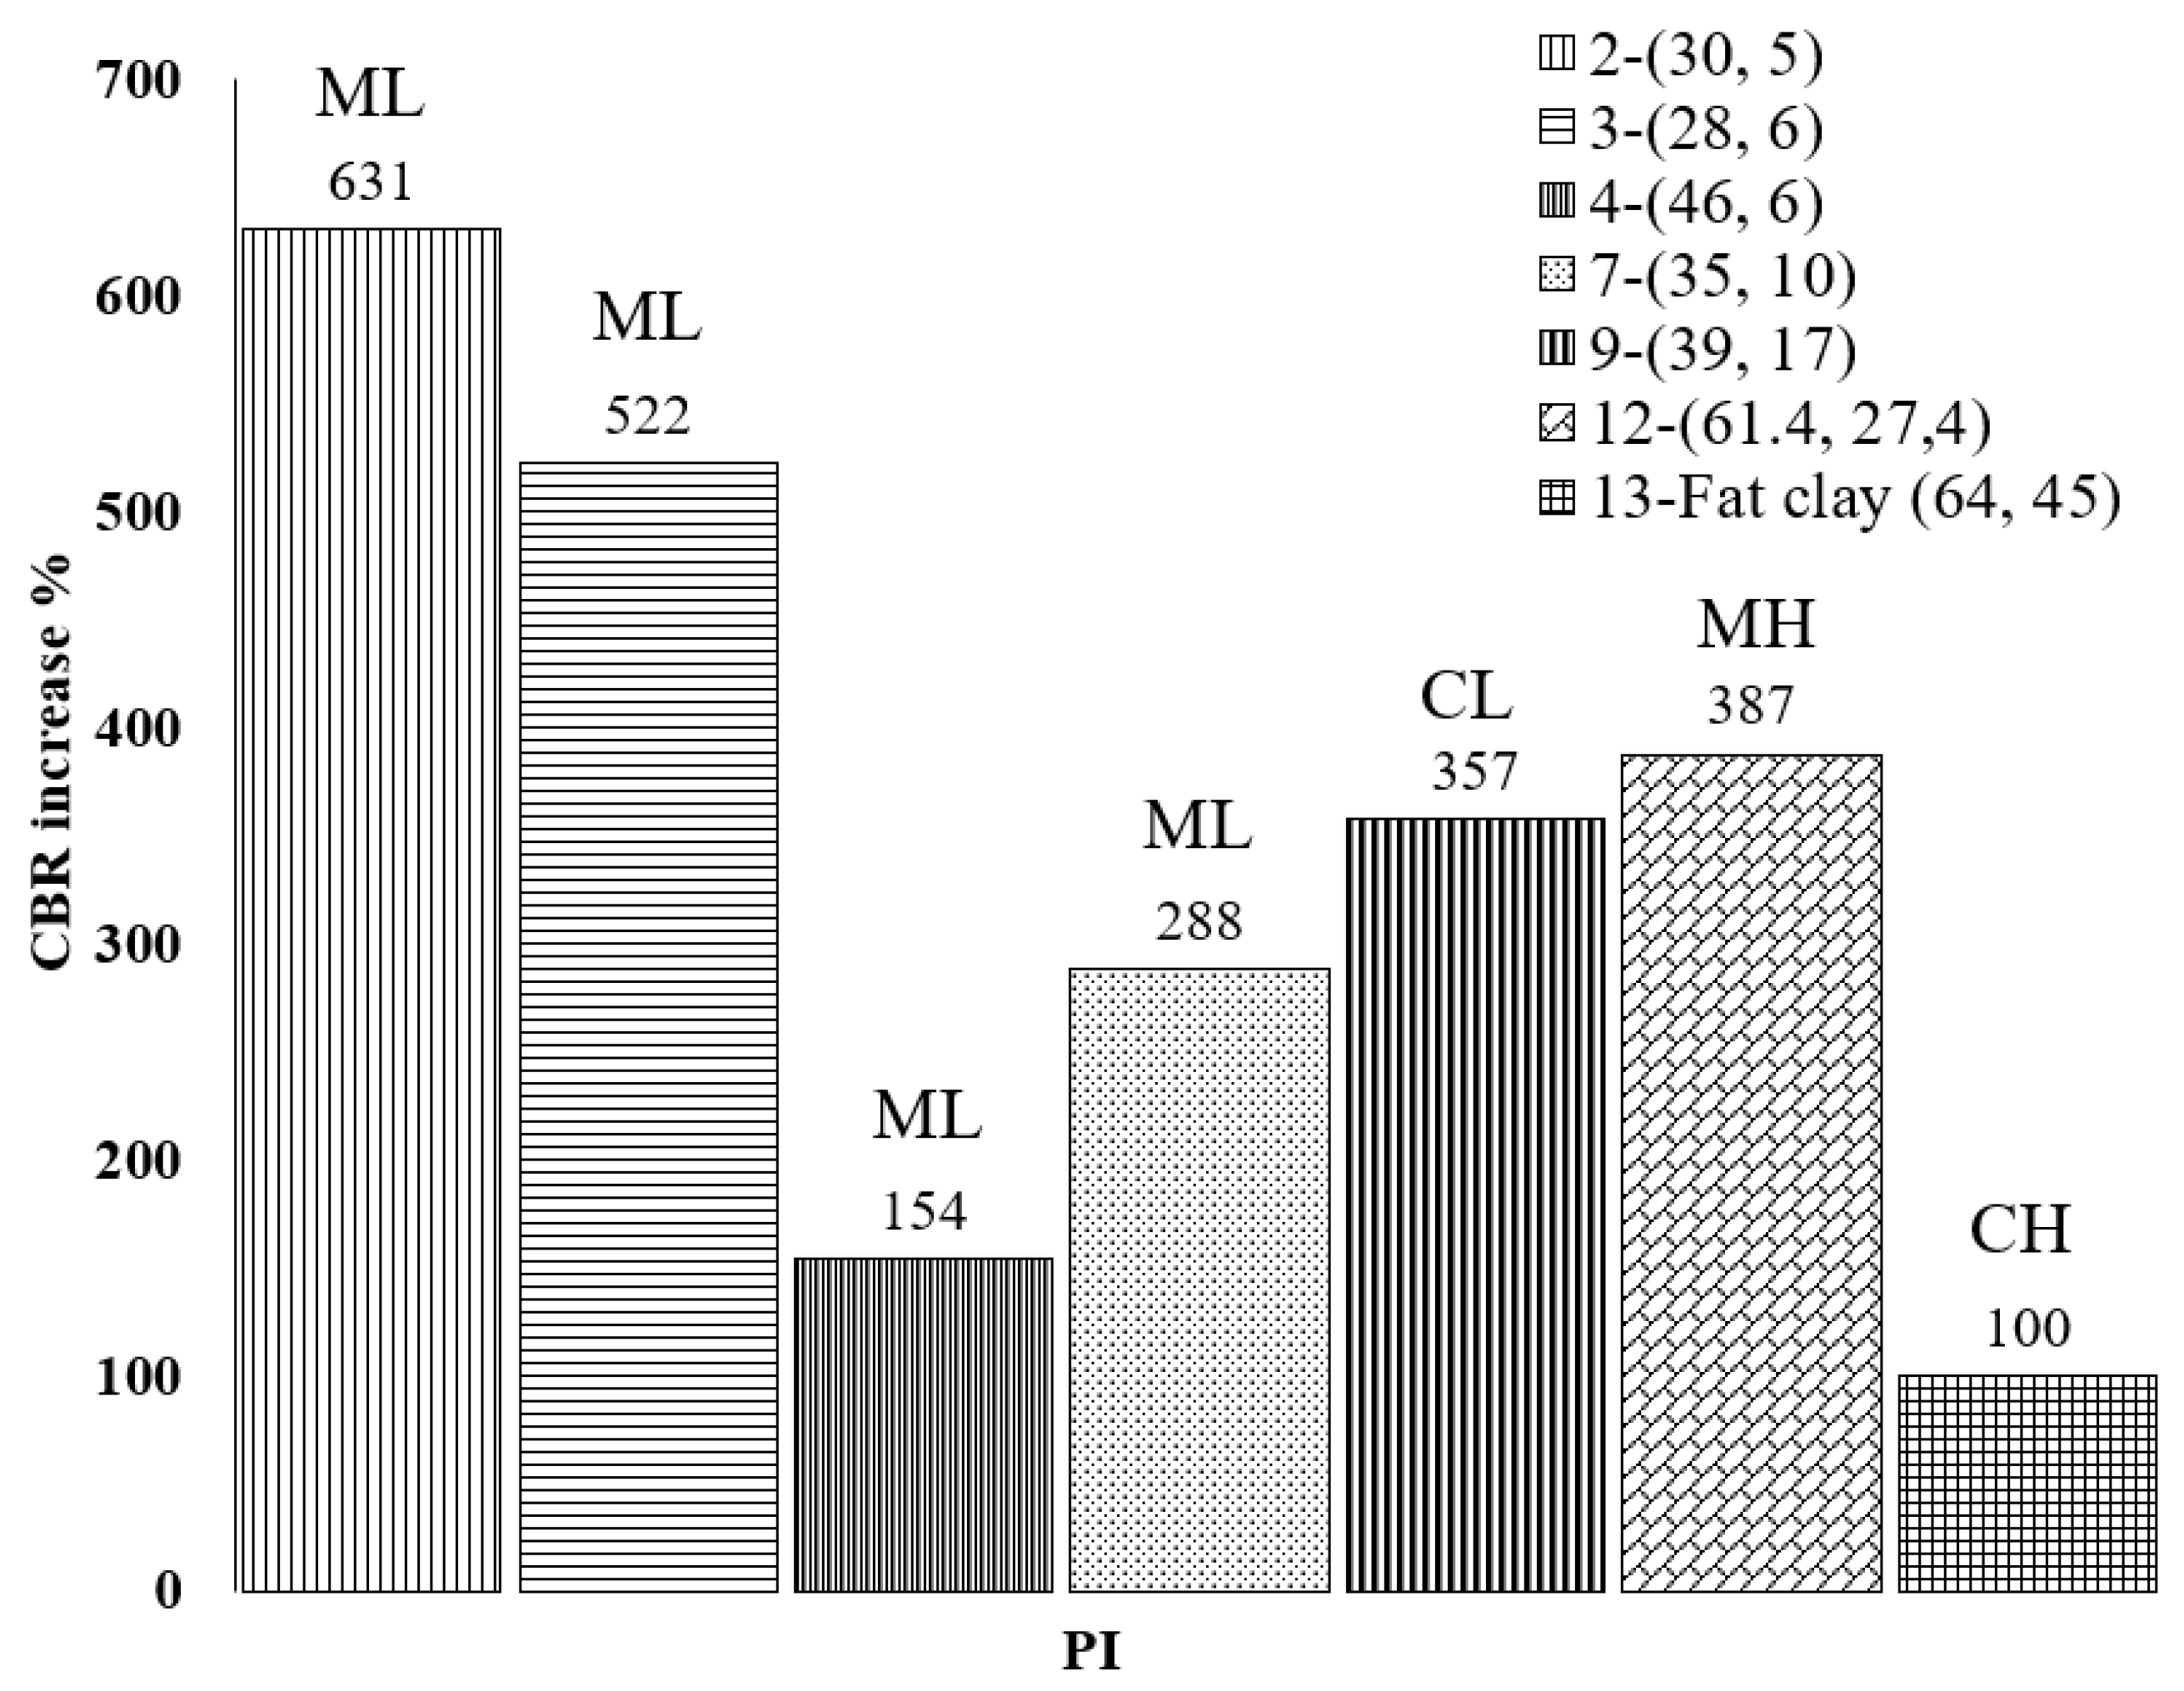
The California bearing ratio (CBR) test is an evaluation of the penetration resistance of the surface of the subgrade to determine the relative strength for pavement design purposes. Two CBR tests were carried out after 28 days, each on one end of the field test tracks, to evaluate subgrade support characteristics. The two CBR values were averaged for each stabilized track. In the field CBR test results, the untreated subgrade material had an average CBR value of about 2.0. The recommended dosage of the bio-enzyme did not significantly improve this value (CBRTreated = 2.4), while the soil treated with a double dose of bio-enzyme product yielded CBR values of about 4.0. Normalized improvements in CBR (NCBR) were calculated using Equation (1) and are presented in Figure 8 comparing the NCBRs observed in this and other studies using bio-enzyme products for the stabilization of soils. The soils are presented in ascending order of PI of untreated soil. The legend of Figure 8, as mentioned before, shows the soil number, as listed in Table 3, followed by the LL and PI in parentheses.
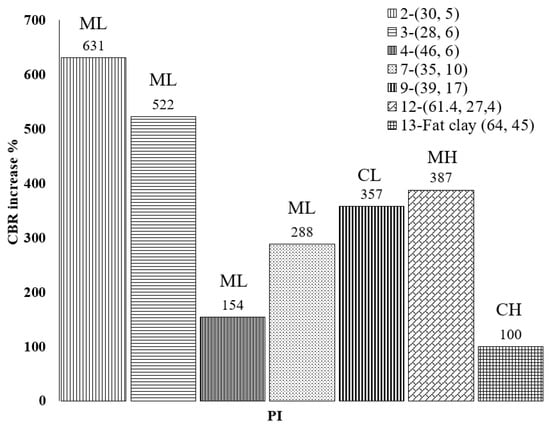
Figure 8.
Normalized CBR improvement of the field soil 28 days after bio-enzyme treatment from this study and compared to others.
Comparison of the normalized CBR increases reveals that the addition of bio-enzyme to the field CH-fat clay caused only a modest CBR increase after 28 days of curing and that the range of the CBR increase was between 100% and 631%. For all soils considered, PI does not seem to play a recognizable role in the increase in CBR values; however, we note that the lowest CBR improvement was obtained for the CH-fat clay, which had the highest LL and PI values among all soil samples. These results reveal the complexity of the relations between soil properties and stabilization product performance. Statistical analyses were performed to shed some light on these relations.
2.5. Statistical Study
2.5.1. ANOVA of the California Bearing Ratio (CBR)
A statistical analysis of variance (ANOVA) was conducted on data compiled from our study and four others to total seven different types of soils. The selected output was the normalized improvement in CBR (NCBR), defined by Equation (1). The ANOVA model of the NCBR was developed considering the direct influence of different variables and their interactions. A total of nine variables were considered to establish the model: initial values of CBR, UCS, LL, PI, void ratio, specific gravity, curing age, particle size distribution and ratio of dosage used compared to that recommended by the manufacturer. After evaluating the significance of each variable and the interaction terms, the results of the ANOVA model included two main inputs and one crossover interaction, which considered the effects of curing time, enzyme dosage and clay fraction of fine particles, as shown in Table 4. We note that that the clay fraction represents the content of clay in the fines that passed through sieve #200 (i.e., (%clay)/(%clay + %silt)). The term Dused/Drec is the ratio of enzyme dosage to the manufacturer’s recommended dosage for each enzyme type. The resulting model is shown as Equation (2).
Table 4.
ANOVA analysis—output: NCBR increase.
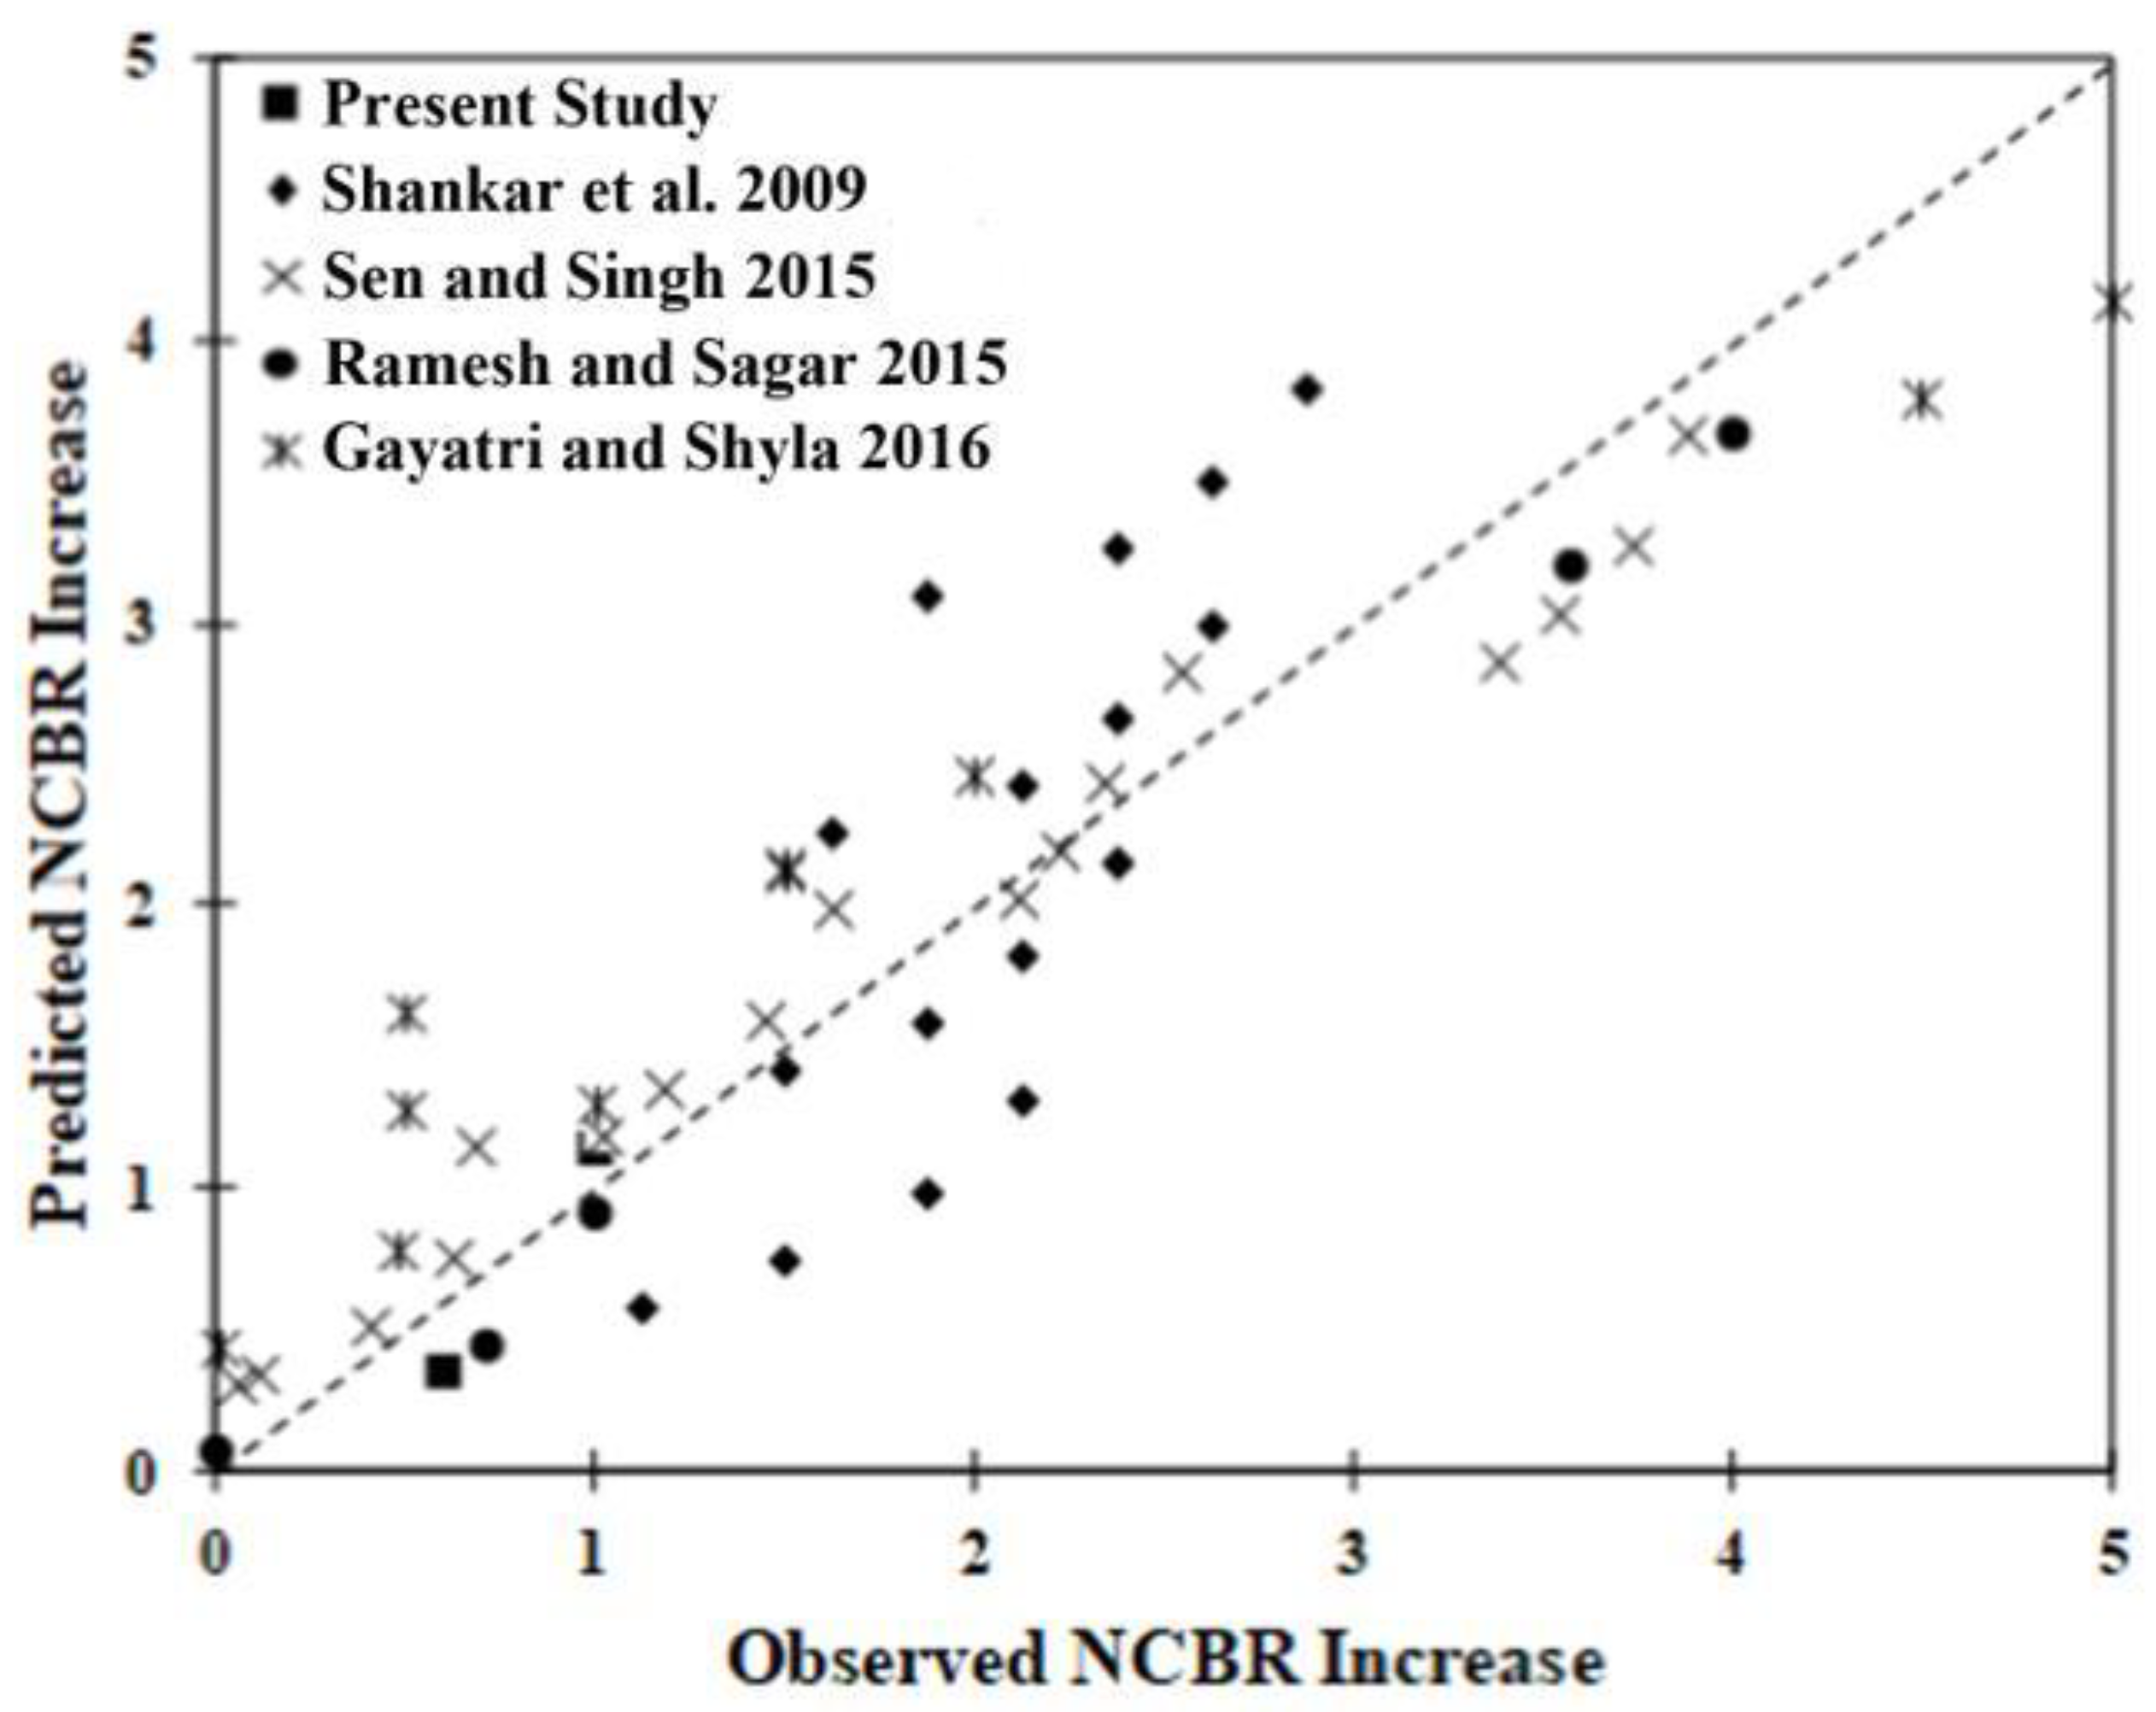
As expected, the curing age and the dosage term (Dused/Drec) had positive effects on the NCBR gain. However, the crossover term representing the interaction between bio-enzyme dosage and clay fraction was negative. This suggests that for a fixed bio-enzyme dosage, a larger fraction of small particles decreases the potential improvement in NCBR. Therefore, increasing the time and the amount of bio-enzyme used will lead to an increase in NCBR if the clay fraction is limited. The model predicts increases in NCBR after enzyme treatment with an accuracy of R2 = 0.85. Figure 9 presents the correlation plot of the prediction associated with the model versus observation. The different markers represent the data from the various studies used for the analysis. With the possible exception of the data from Gayatri and Shyla, the model predicts the NCBR increases for different types of soils reasonably well [63].
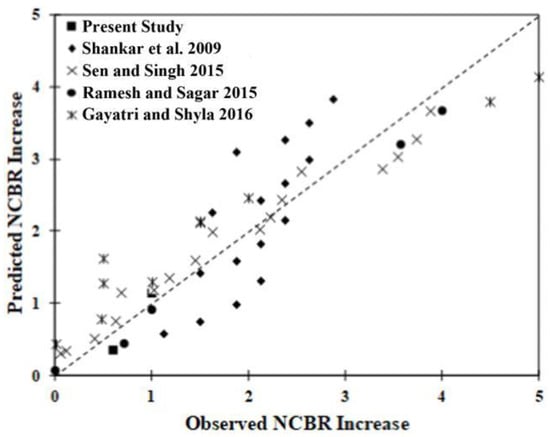
Figure 9.
Correlation between the predicted and observed NCBR increase [44,49,50,64].
2.5.2. ANOVA of the Unconfined Compressive Strength (UCS)
A statistical analysis of variance was also carried out to predict UCS increases based on our data as well as those of five other research reports, totaling 66 data points. The model output was the normalized UCS (NUCS) increase, as defined by Equation (3). Using a similar approach as for the statistical modeling of the NCBR increase, the model used to describe the increase in NUCS included six main parameters and two crossover interaction terms. The clay fraction, as defined previously, is the content of clay as a ratio of fine particles passing through sieve #200; the term fine fraction, which is between 0 and 1, represents the total content of clay, silt and fine sand in the soil sample (i.e., %clay + %silt + %fine sand). The results of the analysis are summarized in Table 5, while the resulting mathematical model is shown as Equation (4).
Table 5.
ANOVA analysis—output: NUCS increase.
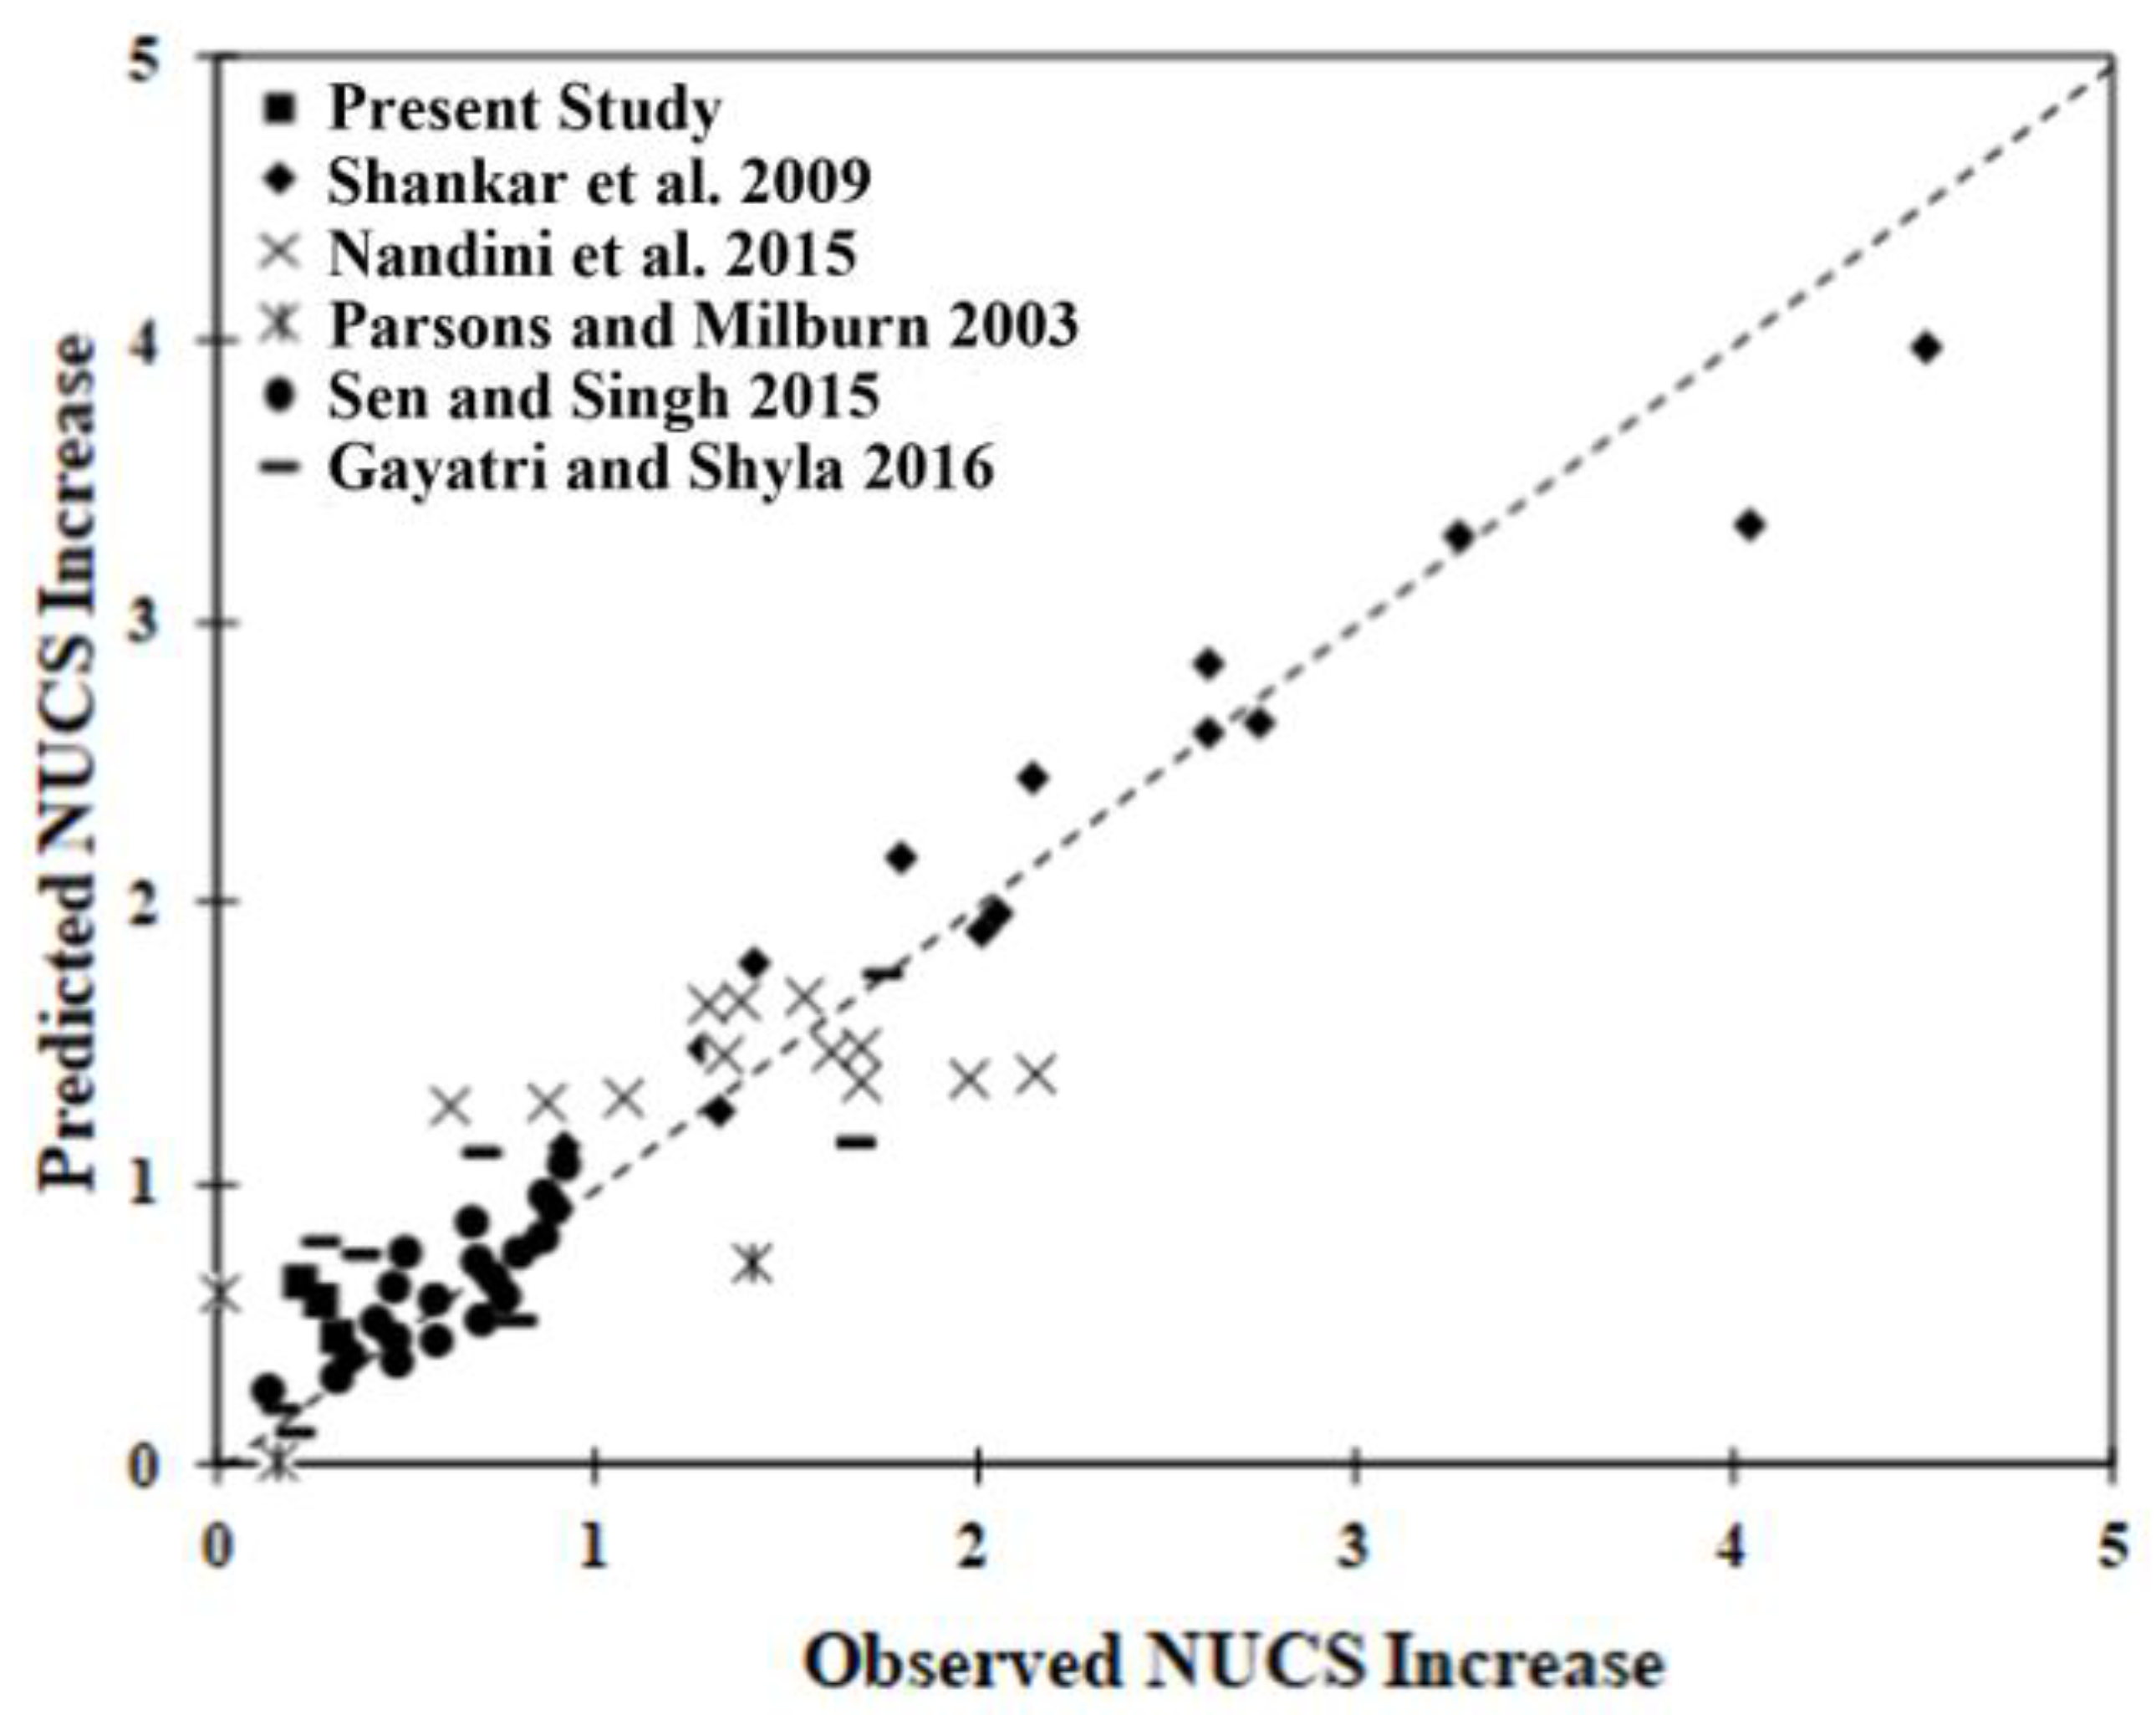
Figure 10 presents the correlation plot of the prediction associated with the model versus observation. A good correlation exists for most samples, with the possible exception of those of Nandini et al. [42], for which the predicted increase calculation remains relatively constant, suggesting another parameter may be involved. The linear regression model developed can predict the strength improvement with an R2 of 0.90. Four parameters, the fine fraction, clay fraction, Dused/Drec and curing time, were determined to affect the strength gain in a positive manner. The LL, however, showed a negative effect. Three of the interaction parameters, the (fine fraction) (curing time), (clay fraction) (Dused/Drec) and (LL) (curing time), also showed a negative correlation with strength gain, suggesting that the particle size and size distribution in soil are important parameters to consider when trying to predict strength gains.
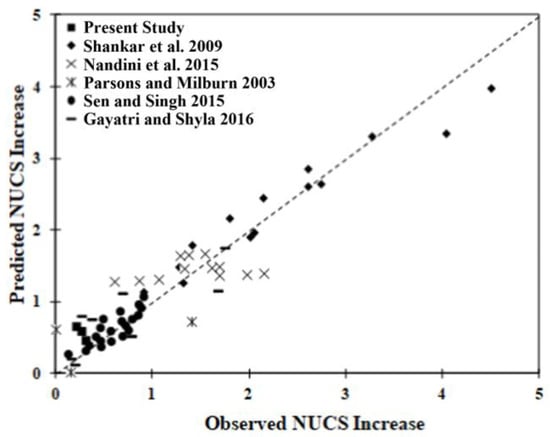
Figure 10.
Correlation between the predicted and observed normalized UCS increase [33,43,44,50,64].
Combined, the ANOVA of the California bearing ratio and of the unconfined compressive strength represent a first step in developing predictive models of soil stabilization used bio-enzyme products. However, to further develop stability models, longer-term characterization of the effects of stabilizing agents is needed.
2.5.3. Scanning Electron Microscopy (SEM)
The surface topography and effectiveness of chemical and physical bonding were observed using SEM, following about two years post stabilization and demolding. This relatively long time frame enabled us to study the effect of a bio-enzyme treatment on the long-term properties of the stabilized DM. Figure 11, Figure 12 and Figure 13 present the SEM images of untreated DM, DM following treatment with a single dosage and DM following treatment with a double dosage of the enzyme, respectively.
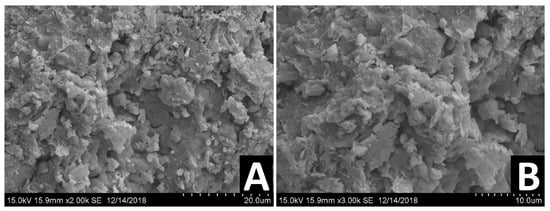
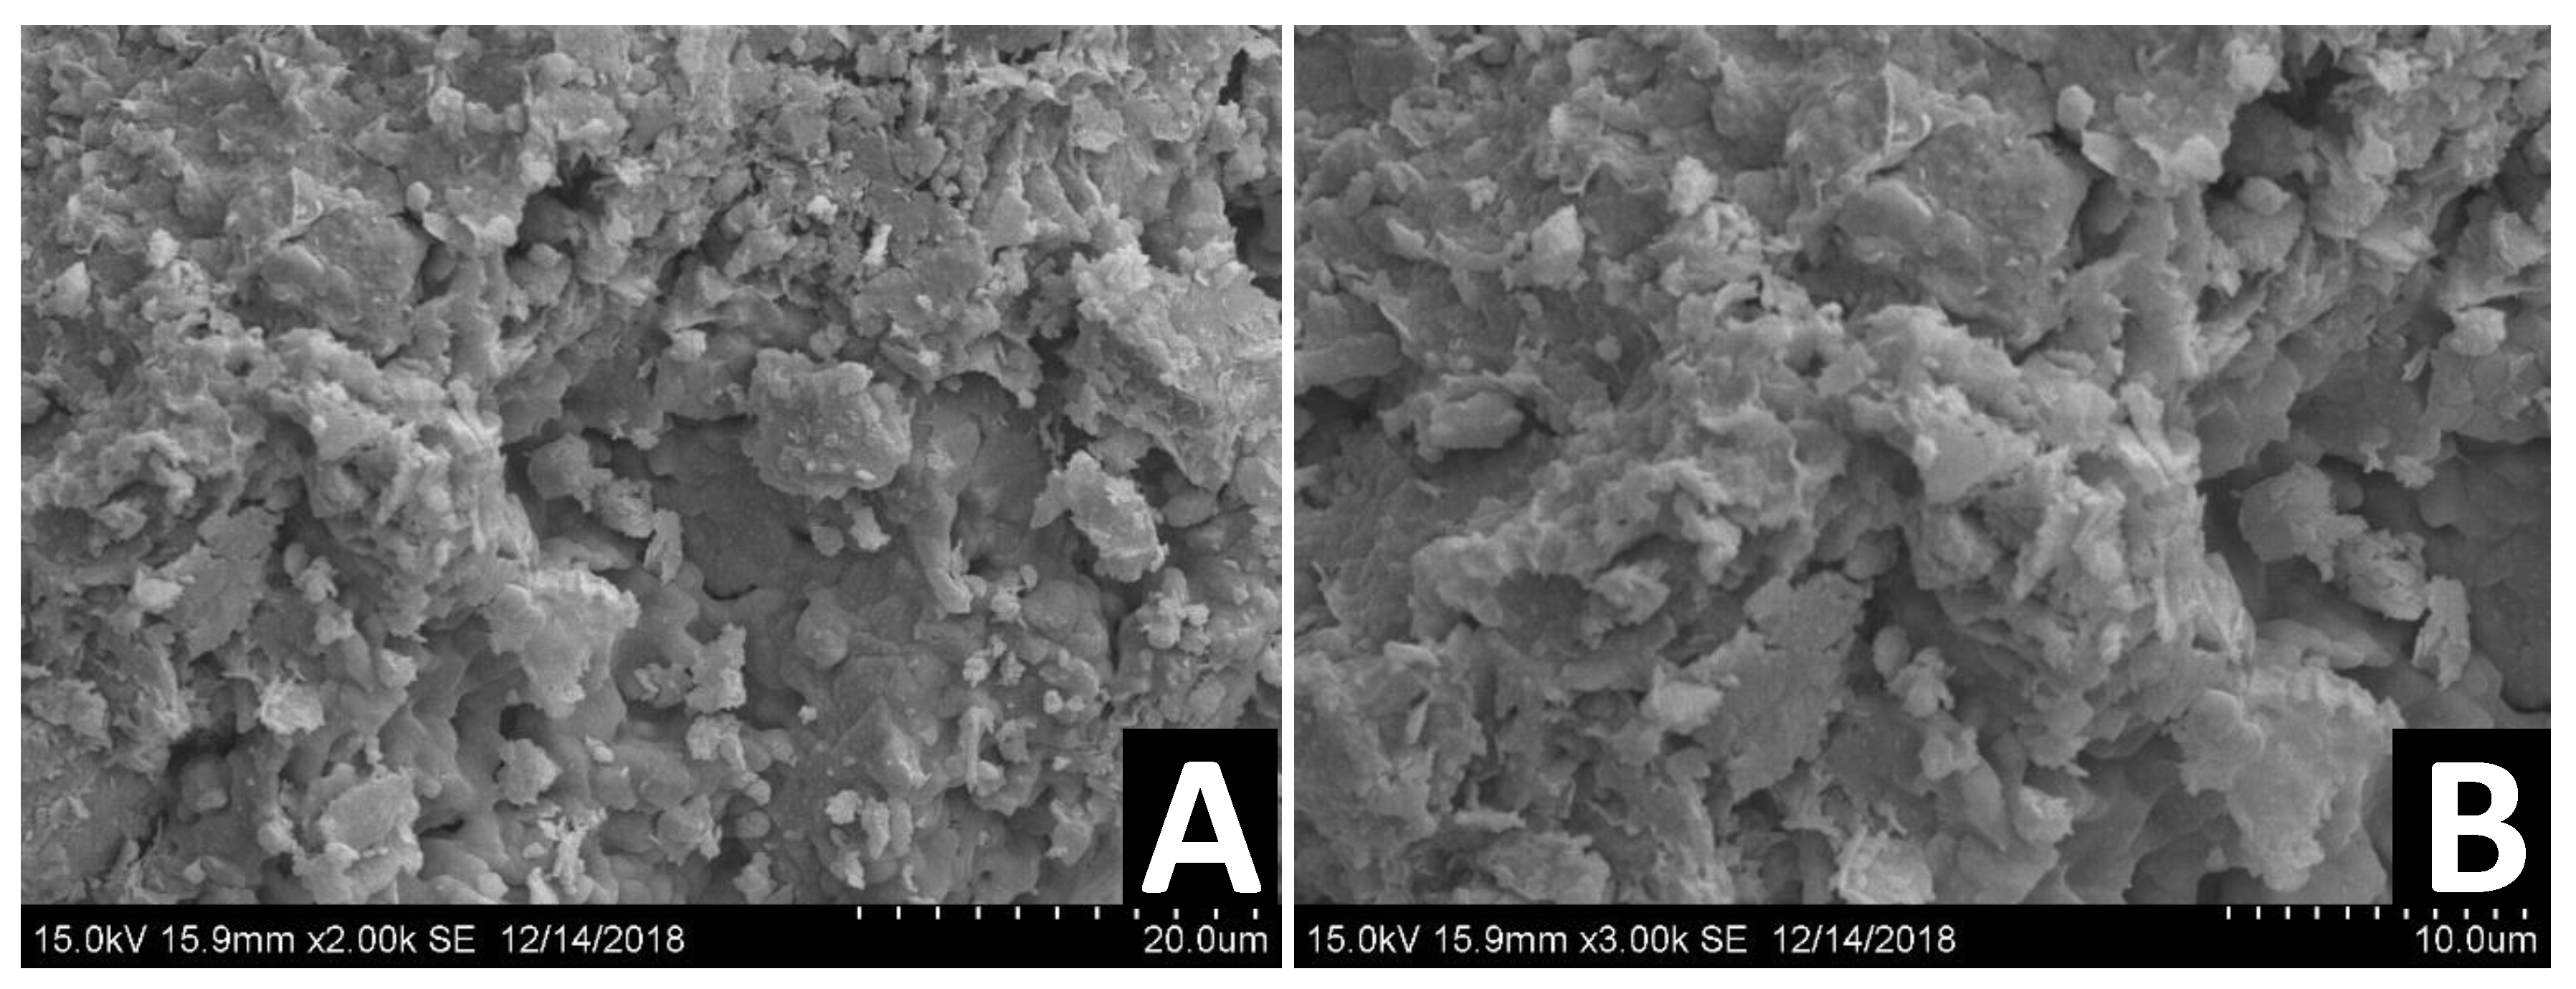
Figure 11.
SEM images of different untreated DM samples at two different magnifications: 2000× (A), 3000× (B).
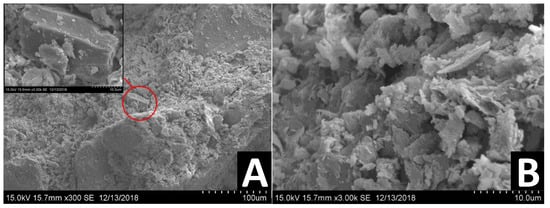
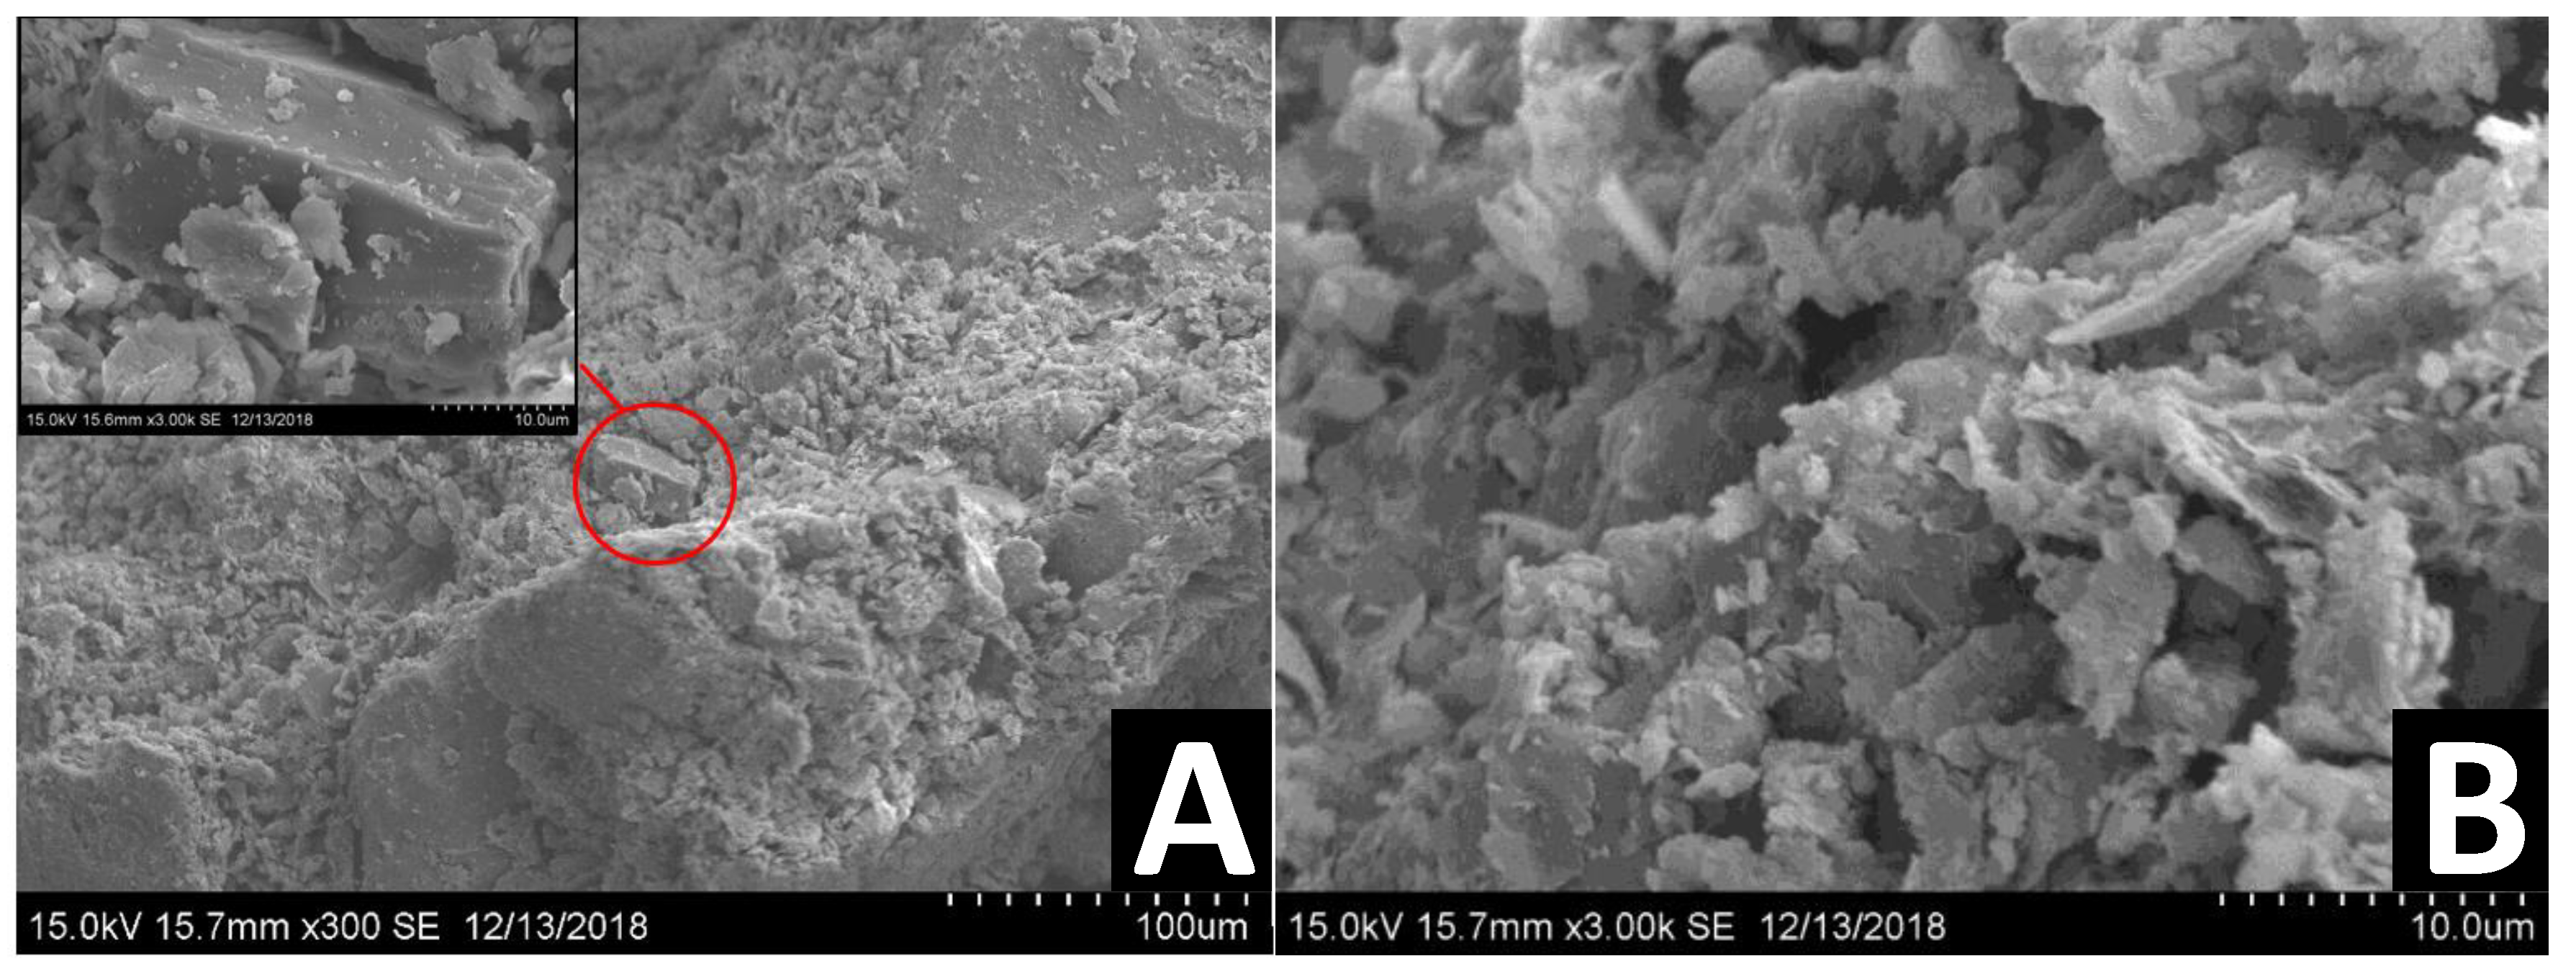
Figure 12.
SEM images of different DM samples treated with a single dosage of bio-enzyme (1:100) at two different magnifications: 300× (A), 3000× (B).
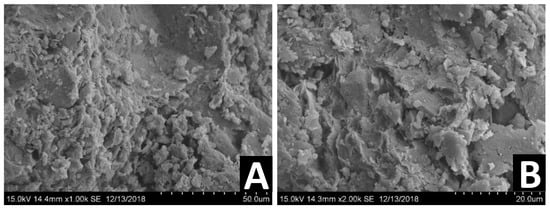
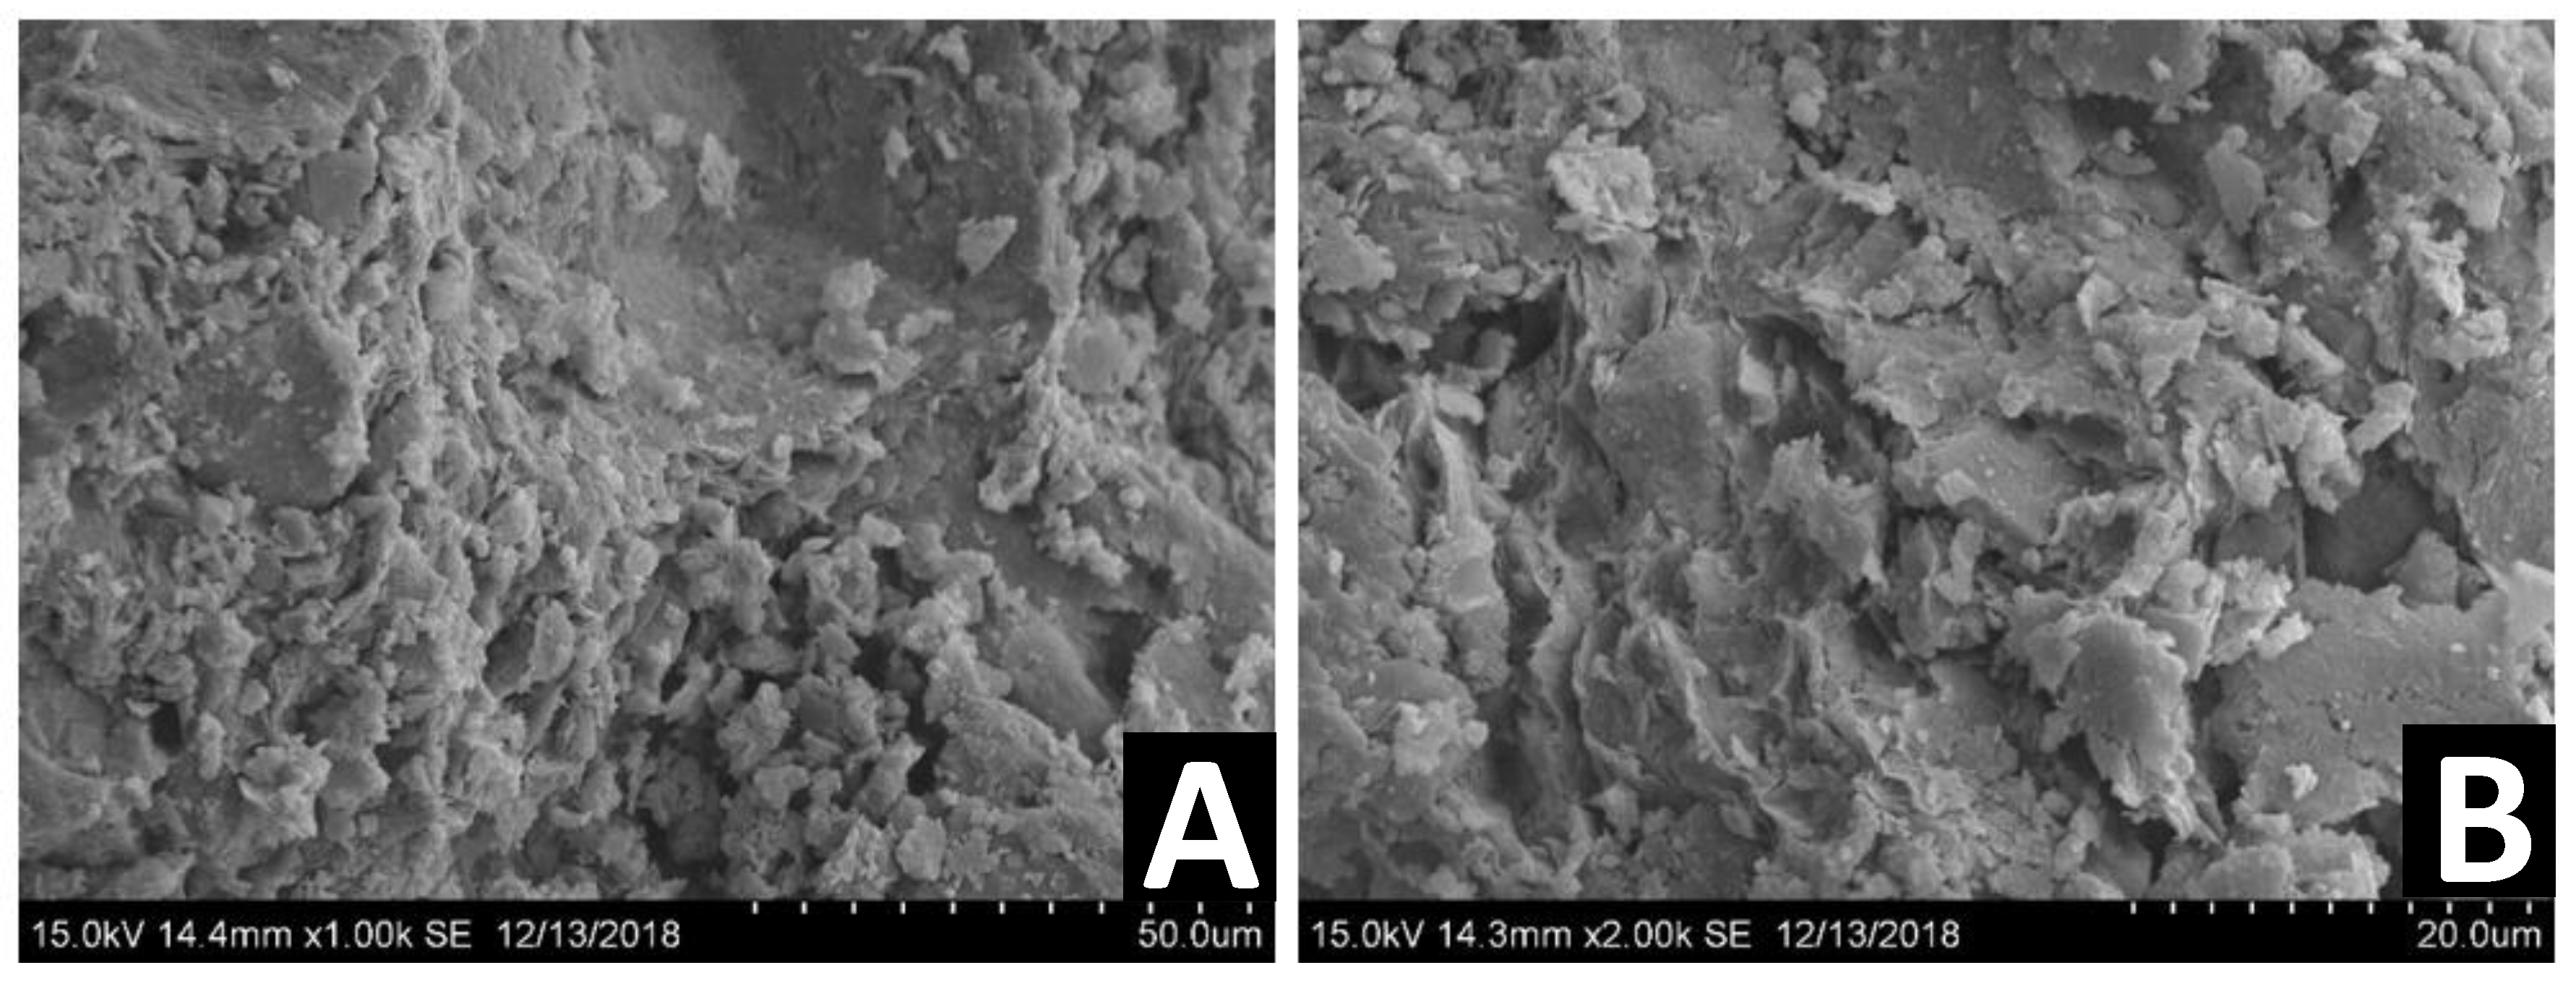
Figure 13.
SEM images of different DM samples treated with a double dosage of bio-enzyme (1:50) at two different magnifications: 1000× (A), 2000× (B).
Figure 11 presents the SEM images of different untreated DM samples at two different magnifications: 2000× (A), 3000× (B). Clay particles are observed as foliated textures smaller than 2 µm. The images indicate the porous structure of the soil matrix and that the constituents are loosely packed.
Figure 12 presents SEM images of different DM samples two years after stabilization with a single dosage of bio-enzyme (1:100) at two different magnifications: 300× (A), 3000× (B). The particles in the samples seem more uniform compared to untreated DM (Figure 11). However, the view of the marked zone shown in panel A shows that this may be the result of a denser mechanical packing of the particles. Hence, the use of a bio-enzyme product may promote better packing of particles, which lasts for a period of at least two years.
Figure 13 presents SEM images of different DM samples two years after stabilization with a double dosage of bio-enzyme (1:50) at different magnifications: 1000× (A), 2000× (B). The images reveal a more compact structure of the treated DM. The larger magnification shows that, similarly to untreated DM and DM following a treatment using a single dosage of bio-enzyme, boundaries between soil particles are observable. This again suggests the presence of denser mechanical packing of the soil particles.
For comparison purposes, more traditional stabilizing agents were used as controls. DM was treated with hydrated lime (HL), fly ash (FA), a combination of HL and FA and a combination of Portland cement (PC), HL and FA. Figure 14 presents SEM images of DM following such treatments. All images are shown at a magnification of 2000×. Panel A is a typical image from a DM sample treated with HL, panel B is from a sample treated with FA, panel C is following a treatment combining HL and FA and panel D shows the SEM image of a DM sample treated with a combination of PC, HL and FA.

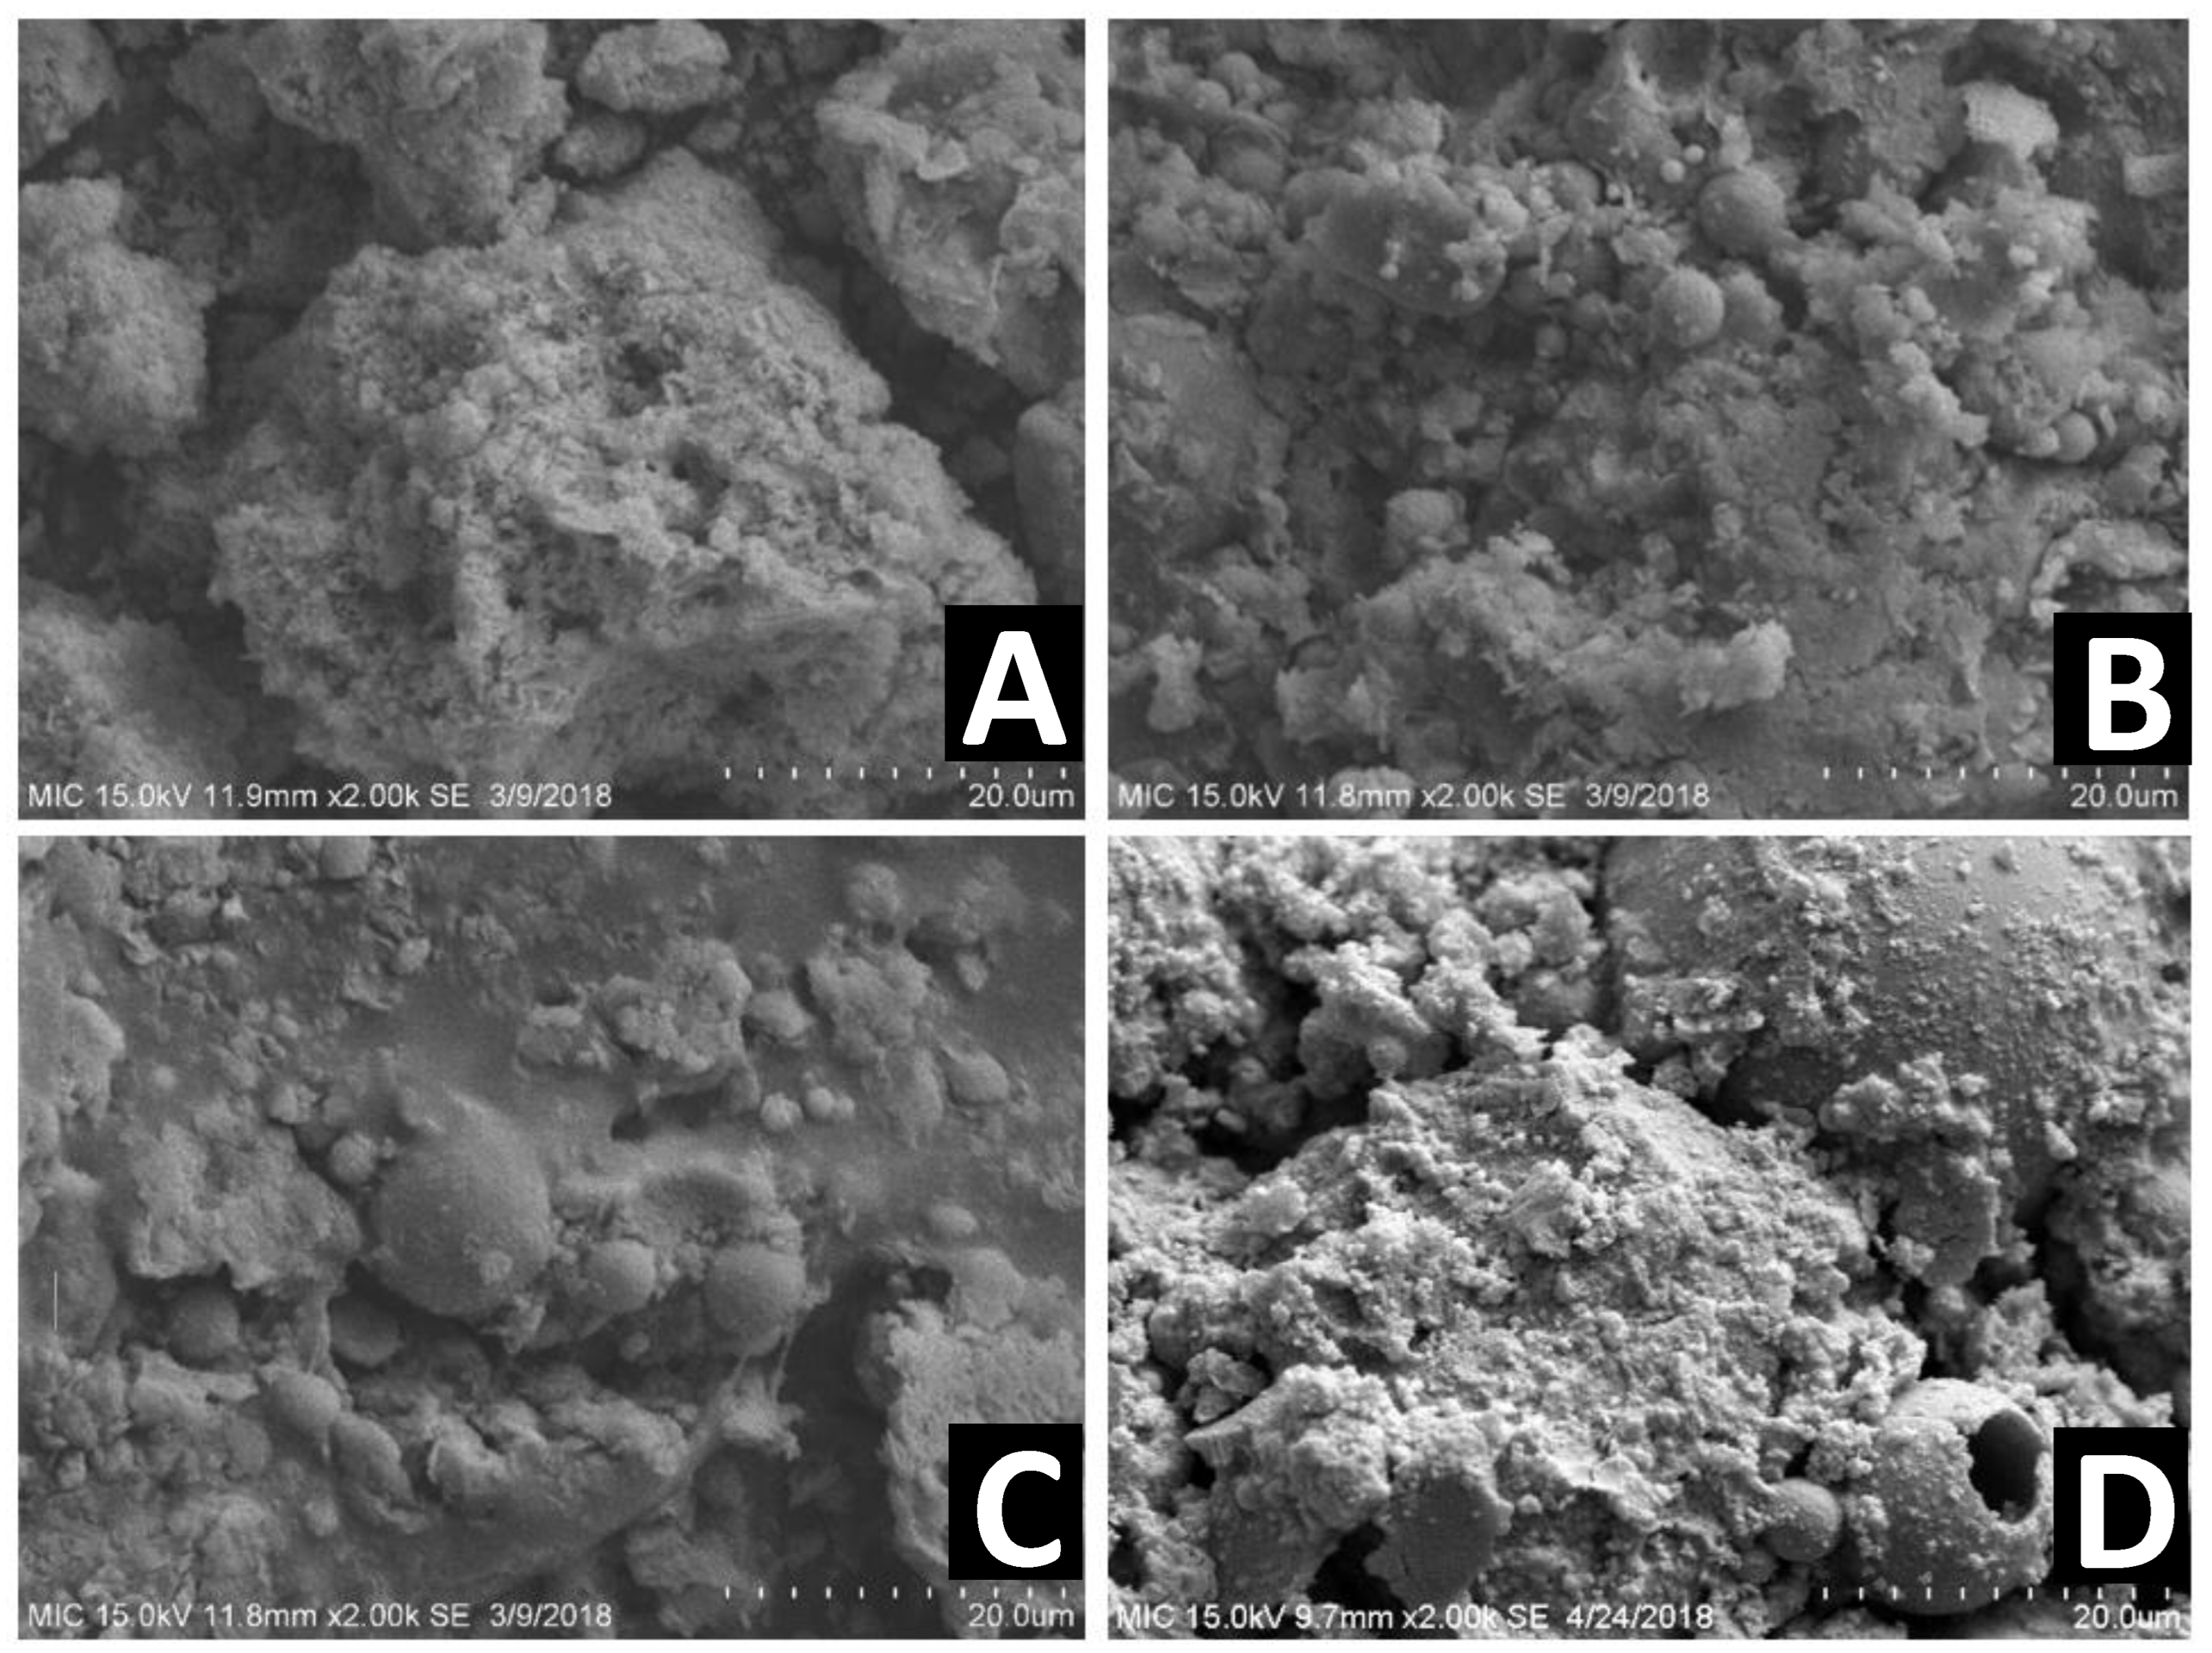
Figure 14.
SEM images of DM treated with (A) HL, (B) FA, (C) combination of HL and FA and (D) combination of PC, HL and FA. All images were recorded using a 2000X× magnification.
In Figure 14A, fine sand, clay and silt particles are not visible because they are covered by a layer of bound particles, formed because of the chemical reaction initiated by the presence of HL [64]. Larger agglomerations seen in Figure 14A represent bonded particles of DM and HL forming relatively denser layers with smaller and less frequent pores, The presence of these agglomerations provides an explanation for the minimized amount of cracking that can be observed in Figure 8 illustrating the field soil track stabilized using lime. DM soil treated with FA similarly resulted in a layer of bonded particles, although seemingly with less consistency (Figure 14B). Treating DM with a mixture of both HL and FA resulted in a more homogeneous layer of bonded particles, as shown in Figure 14C. The presence of this layer provides an explanation for the improvements in strength associated with this sample. When DM was treated with a mixture of PC, HL and FA, the SEM image shows the presence of some bonded larger particles that are covered with a large variety of smaller particles (Figure 14D), suggesting that the strength improvements observed in this sample are the result of the formation of larger particles, which can then bind to smaller fragments.
The comparison of the SEM images of the DM stabilized using bio-enzyme products and DM stabilized cementitiously suggests that any observed stabilization of DM using the bio-enzyme product may be the result of displaced water leading to a better initial packing of soil particles. This could explain why aging time does not significantly affect the performance of DM stabilized with bio-enzyme as opposed to stabilization using more traditional compounds. A thorough investigation of any chemical reactions involved with the use of bio-enzyme products would need to be performed to clarify this notion.
3. Materials and Methods
The Sabine–Neches Navigation District (SNND) and the United States Army Corps of Engineers Port Arthur facility (USACEPA) face increasing problems with the placement of new DM along the Sabine–Neches Waterway in Orange and Jefferson Counties, Texas, as the existing placement areas are close to full capacity. Samples were acquired from placement area 5C, as depicted in Figure 15. Placement area 5C is in Johnson’s Bayou in Louisiana, just south of the existing Cheniere liquefied natural gas facility. It has a total of three placement areas, with an approximate area of 300 acres and a depth varying from 4 to 10 ft.
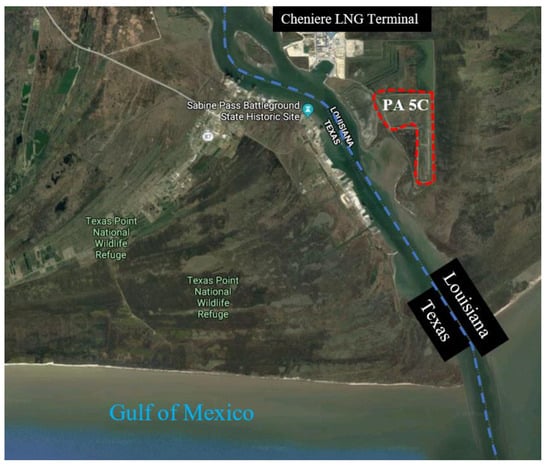
Figure 15.
Aerial image of the location where DM samples were collected (latitude: 29.73361, longitude: −93.84888, imagery ©2019 Google, map data ©2019 Google, INEGI).
3.1. Sample Preparation and Testing
Following sample collection, two properties were defined as the bio-enzyme product was used, as suggested by Rauch et al. [28]: the dilution mass ratio (DMR), used to describe the dilution proportion as the enzyme is mixed with water, and the application mass ratio (AMR), which is the mass ratio of a diluted chemical product to oven-dried material in the stabilized DM. To prepare the bio-enzyme stabilizer, the bio-enzyme was first diluted to DMR values of 100:1 (i.e., single dosage) and 50:1 (i.e., double dosage) and then added to the soil at the AMR of 1 mL diluted enzyme to 60 g dredged material.
As the bio-enzyme product may work as a surfactant, i.e., increasing the wetting effect of water, tests were carried out at a moisture content slightly lower than the OMC, following a common methodology [19,30,46]. A preliminary compaction test was performed to find the optimum moisture content (OMC). Accordingly, AMR was calculated such that the enzyme-stabilized dredge material (ESDM) mixtures had a moisture content (MC) 2–3% lower than the OMC. Specimens were mellowed for a period of 48 to 72 h before testing, following a common practice [4,14,16,17,28]. Compaction, UCS and consistency limit tests were carried out at curing ages of 7, 14, 28 and 56 days.
Physical properties of untreated DM and ESDM were evaluated, including the compressive strength, compactability and moisture indices (liquid limit (LL) and plastic limit (PL)). Untreated DM samples were used as controls. Table 6 presents which tests were carried out on each sample, as well as the corresponding ASTM method designation.
Table 6.
Laboratory tests carried out on DM and SDM mixtures.
3.2. Field Test
In a first step, laboratory tests were performed on both untreated DM and ESDM mixtures, stabilized with a commercially available bio-enzyme product at two dilution factors: D1 = 100:1 and D2 = 50:1. In a second step, a separate field study was performed to evaluate the stabilizing effect of the enzyme in situ on CH-classified soil, as well as making visual observations of the swelling and cracking behavior of the treated soil tracks prepared for the field test.
4. Conclusions
The potential effectiveness of bio-enzyme products as additives for the stabilization of dredged material (DM), characterized as high-plasticity CH-fat clay, was investigated. Along with standard laboratory tests (UCS, Atterberg limits, compaction), a field study was carried out on local CH soil that matched the moisture limits and classification of the dredged material. The results obtained were compared with those reported by other researchers. Based on results from this study combined with data available from the literature, an initial attempt at developing semi-empirical equations for predicting the UCS and CBR values of soils treated with bio-enzymes showed promise and included several parameters such as the clay/fine fraction, curing time and LL and PI values.
The UCS of the DM was not significantly improved when a single dosage of enzyme was applied. Using the single-dosage treatment of the bio-enzyme caused marginal changes at early ages of curing (7 and 14 days) and only a maximum improvement of 12.6% after 56 days. Other type of soils, the ML type, in particular, showed better improvement in UCS. Soils with PI between 3 and 10 and clay contents between 2% and 20% were more likely to show strength improvements upon bio-enzyme addition. Field tests were undertaken, on field CH-fat clay, which simulated the behavior of DM. The CBR tests showed no improvements when using a single-dosage treatment of the bio-enzyme, while the double-dosage application increased the CBR from a value of 2 to 4.
Author Contributions
Conceptualization, T.T.M.N., P.B. and M.J.; methodology, S.R., Q.Q., N.A.B. and M.J.; validation, S.R., K.K., H.E.C., S.O., R.L.W., J.S.F. and B.G.B.; formal analysis, S.R.; investigation, S.R., K.K., H.E.C., S.O., R.L.W., J.S.F. and B.G.B.; resources, T.T.M.N., P.B. and M.J.; writing—original draft preparation, S.R.; writing—review and editing, T.T.M.N., P.B. and M.J.; supervision, T.T.M.N., Q.Q., P.B. and M.J.; project administration, T.T.M.N., P.B. and M.J.; funding acquisition, T.T.M.N., Q.Q., P.B. and M.J. All authors have read and agreed to the published version of the manuscript.
Funding
Research was partially supported by grants from the Center for Advances in Port Management (2021), and the Welch Foundation (V-0004).
Data Availability Statement
Due to the nature of this research, participants of this study did not agree for their data to be shared publicly, so supporting data are only available upon request.
Acknowledgments
The authors gratefully acknowledge the assistance of Clayton Henderson and Larry Fountain of Sabine Neches Navigation District, who granted access to the dredged material locations and historical data of the designated DM disposal sites to the research team. Tyler Henneke, P.E. and Tolunay-Wong Engineers, Inc. are thanked for facility support in sample testing. Jerry Lin provided the funding for the chemical–environmental tests as well as useful comments on the manuscript. The detection of heavy metals using the TCLP method was completed by Earth Analytical Services. Le Short at Mason Construction, Ltd. in Beaumont, TX, USA, assisted with the geotechnical testing program and donated the funds necessary for the stabilizing additive mixing experiments.
Conflicts of Interest
The authors declare no conflict of interest.
References
- Millrath, K.; Kozlova, S.; Shimanovich, S.; Meyer, C. Beneficial Use of Dredged Material 2; Progress report prepared for Echo Environmental, Inc.; Columbia University: New York, NY, USA, 2001. [Google Scholar]
- Rahimikelarijani, B.; Abedi, A.; Hamidi, M.; Cho, J. Simulation Modeling of Houston Ship Channel Vessel Traffic for Optimal Closure Scheduling. Simul. Model. Pract. Theory 2018, 80, 89–103. [Google Scholar] [CrossRef]
- Kennedy, C.C. History of Dredged Material Management and Usage in the United States. In Proceedings of the 18th World Congress of Soil Science, Philadelphia, PA, USA, 9–15 July 2006. [Google Scholar]
- Kestler, M.A. Stabilization Selection Guide for Aggregate-and Native-Surfaced Low-Volume Roads; US Department of Agriculture, Forest Service, National Technology & Development Program; BiblioGov: Columbus, OH, USA, 2009. [Google Scholar]
- Mitchell, J.K. Practical Problems from Surprising Soil Behaviour. J. Geotech. Engrg. 1986, 112, 259–289. [Google Scholar]
- Conner, J.R. ChemicalFixation and Solidificationof Hazardous Wastes; Van Nostrand Reinhold: New York, NY, USA, 1990; Volume 692, p. 335. [Google Scholar]
- Manzenrieder, H.A.; De Vries, J.M. Dredging and Disposal within the Limits of a National Park. In Coastal Engineering; ASCE: Reston, VA, USA, 1997; pp. 4274–4288. [Google Scholar]
- Crowe, S.E.; Gayes, P.T.; Viso, R.F.; Bergquist, D.C.; Jutte, P.C.; Van Dolah, R.F. Impact of the Charleston Ocean Dredged Material Disposal Site on Nearby Hard Bottom Reef Habitats. Mar. Pollut. Bull. 2010, 60, 679–691. [Google Scholar] [CrossRef]
- Francingues, N.R.; Thompson, D.W. Innovative Dredged Sediment Decontamination and Treatment Technologies; US Army Engineer Research and Development Center: Vicksburg, MS, USA, 2000. [Google Scholar]
- Lee, C.R. Case Studies: Characterization Tests to Determine Dredged Material Suitability for Beneficial Uses; US Army Engineer Research and Development Center [Environmental Laboratory]: Vicksburg, MS, USA, 1999. [Google Scholar]
- Board, M. Contaminated Sediments in Ports and Waterways: Cleanup Strategies and Technologies; National Academies Press: Washington, DC, USA, 1997; ISBN 0309054931. [Google Scholar]
- Solanki, P.; Jain, B.; Hu, X.; Sancheti, G. A Review of Beneficial Use and Management of Dredged Material. Waste 2023, 1, 815–840. [Google Scholar] [CrossRef]
- Chiu, C.F.; Zhu, W.; Zhang, C.L. Yielding and Shear Behaviour of Cement-Treated Dredged Materials. Eng. Geol. 2009, 103, 1–12. [Google Scholar] [CrossRef]
- Beeghly, J.; Schrock, M. Dredge Material Stabilization Using the Pozzolanic or Sulfo-Pozzolanic Reaction of Lime by-Products to Make an Engineered Structural Fill. Int. J. Soil Sediment Water 2010, 3, 6. [Google Scholar]
- Federico, A.; Vitone, C.; Murianni, A. On the Mechanical Behaviour of Dredged Submarine Clayey Sediments Stabilized with Lime or Cement. Can. Geotech. J. 2015, 52, 2030–2040. [Google Scholar] [CrossRef]
- Grubb, D.G.; Chrysochoou, M.; Smith, C.J.; Malasavage, N.E. Stabilized Dredged Material. I: Parametric Study. J. Geotech. Geoenviron. Eng. 2010, 136, 1011–1024. [Google Scholar] [CrossRef]
- Milburm, J.P.; Parsons, R.L. Performance of Soil Stabilization Agents; Kansas Department of Transportation: Topeka, KS, USA, 2004. [Google Scholar]
- Nguyen, T.T.M.; Rabbanifar, S.; Brake, N.A.; Qian, Q.; Kibodeaux, K.; Crochet, H.E.; Oruji, S.; Whitt, R.; Farrow, J.; Belaire, B. Stabilization of Silty Clayey Dredged Material. J. Mater. Civ. Eng. 2018, 30, 4018199. [Google Scholar] [CrossRef]
- Tingle, J.S.; Larson, S.L.; Weiss, C.A.; Newman, J.K.; Peters, J.F. Constitutive Analyses of Nontraditional Stabilization Additives; Engineer Research and Development Center: Vicksburg, MS, USA, 2004. [Google Scholar]
- Nguyen, T.T.M.; Rabbanifar, S.; Luo, Z.; Huddleston, C.; O’Connor, T.; Richard, A.; Michel, M.; Moon, R.; Yao, C.W.; Jao, M.; et al. Development of Fiber Reinforced Sustainable Dredge Bricks. Appl. Sci. 2023, 13, 789. [Google Scholar] [CrossRef]
- Abriak, Y.; Maherzi, W.; Benzerzour, M.; Senouci, A.; Rivard, P. Valorization of Dredged Sediments and Recycled Concrete Aggregates in Road Subgrade Construction. Buildings 2023, 13, 646. [Google Scholar] [CrossRef]
- Shi, J.; Wang, S.; Cao, W.; Su, J.; Zhang, X. Mechanical Properties and Strengthening Mechanism of Dredged Silty Clay Stabilized by Cement and Steel Slag. Materials 2022, 15, 3823. [Google Scholar] [CrossRef] [PubMed]
- Develioglu, I.; Pulat, H.F. Compressibility Behaviour of Natural and Stabilized Dredged Soils in Different Organic Matter Contents. Constr. Build. Mater. 2019, 228, 116787. [Google Scholar] [CrossRef]
- Cheng, X.; Chen, Y.; Chen, G.; Li, B. Characterization and Prediction for the Strength Development of Cement Stabilized Dredged Sediment. Mar. Georesour. Geotechnol. 2021, 39, 1015–1024. [Google Scholar] [CrossRef]
- Zhu, X.; Niu, F.; Ren, L.; Jiao, C.; Jiang, H.; Yao, X. Effect of Calcium Carbide Residue on Strength Development along with Mechanisms of Cement-Stabilized Dredged Sludge. Materials 2022, 15, 4453. [Google Scholar] [CrossRef]
- Wang, S.; He, X.; Cai, G.; Lang, L.; Ma, H.; Gong, S.; Niu, Z. Investigation on Water Transformation and Pore Structure of Cement-Stabilized Dredged Sediment Based on NMR Technology. Materials 2022, 15, 3178. [Google Scholar] [CrossRef] [PubMed]
- Wright-Fox, R.; Macfarlane, J.G.; Bibbens, R.F. Alternate Chemical Soil Stabilisers; Minor Research Report; CalTrans: Sacramento, CA, USA, 1993. [Google Scholar]
- Rauch, A.; Harmon, J.; Katz, L.; Liljestrand, H. Measured Effects of Liquid Soil Stabilizers on Engineering Properties of Clay. Transp. Res. Rec. J. Transp. Res. Board 2002, 1787, 33–41. [Google Scholar] [CrossRef]
- Renjith, R.; Robert, D.J.; Gunasekara, C.; Setunge, S.; O’Donnell, B. Optimization of Enzyme-Based Soil Stabilization. J. Mater. Civ. Eng. 2020, 32, 4020091. [Google Scholar] [CrossRef]
- Marasteanu, M.O.; Hozalski, R.M.; Clyne, T.R.; Velasquez, R. Preliminary Laboratory Investigation of Enzyme Solutions as a Soil Stabilizer; University of Minnesota Digital Conservancy: Minneapolis, MN, USA, 2005; pp. 1–102. [Google Scholar]
- Mekonnen, E.; Kebede, A.; Tafesse, T.; Tafesse, M. Application of Microbial Bioenzymes in Soil Stabilization. Int. J. Microbiol. 2020, 2020, 1725482. [Google Scholar] [CrossRef]
- Parsons, R.; Milburn, J. Engineering Behavior of Stabilized Soils. Transp. Res. Rec. J. Transp. Res. Board 2003, 1837, 20–29. [Google Scholar] [CrossRef]
- Tremblay, H.; Leroueil, S.; Locat, J. Mechanical Improvement and Vertical Yield Stress Prediction of Clayey Soils from Eastern Canada Treated with Lime or Cement. Can. Geotech. J. 2001, 38, 567–579. [Google Scholar] [CrossRef]
- Rabbanifar, S.; Nguyen, T.T.M.; Yao, C.-W.; Qian, Q.; Bernazzani, P.; Jao, M. Adding Value to Dredged Material Using Lime and Ash Products. In Proceedings of the Recent Trends in Geotechnical Geo-Environmental Engineering and Education RTG2EE International Conference, Online, 15–17 July 2020; pp. 94–98, ISBN 13-978-0-6489449-0-4. [Google Scholar]
- Umar, I.H.; Lin, H.; Ibrahim, A.S. Laboratory Testing and Analysis of Clay Soil Stabilization Using Waste Marble Powder. Appl. Sci. 2023, 13, 9274. [Google Scholar] [CrossRef]
- James, J.; Vijayasimhan, S.; Eyo, E. Stress-Strain Characteristics and Mineralogy of an Expansive Soil Stabilized Using Lime and Phosphogypsum. Appl. Sci. 2023, 13, 123. [Google Scholar] [CrossRef]
- Mwandira, W.; Purchase, D.; Mavroulidou, M.; Gunn, M.J. Synthesis and Utilisation of Hybrid Metal-Carbonic Anhydrase Enzyme Carrier System for Soil Biocementation. Appl. Sci. 2023, 13, 9494. [Google Scholar] [CrossRef]
- Bergmann, R. Soil Stabilizer for Use on Universally Accessible Trails; USDA Forest Service, San Dimas Technology and Development Center: San Dimas, CA, USA, 1995. [Google Scholar]
- Shukla, M.; Bose, S.; Sikdar, P.K. Bio-Enzyme for Stabilization of Soil in Road Construction a Cost Effective Approach; Integrated development of rural and arterial road networks for socio-economic development; IRC Seminar: New Delhi, India, 2003. [Google Scholar]
- Isaac, K.P.; Biju, P.B.; Veeraragavan, A. Soil Stabilization Using Bio-Enzyme for Rural Roads. In Proceedings of the Conference by the Indian Road Congress, New Delhi, India, 5–6 December 2003. [Google Scholar]
- Agarwal, P.; Kaur, S. Effect of Bio-Enzyme Stabilization on Unconfined Compressive Strength of Expansive Soil. Int. J. Res. Eng. Technol. 2014, 3, 30–33. [Google Scholar]
- Nandini, D.; Amate, V.; Kumar, M.P. Compaction and Strength Characteristics of Terra-Zyme Stabilized Red Soil. Int. J. Res. Publ. Eng. Technol. Manag. 2015, 1, 1–3. [Google Scholar]
- Sen, J.; Singh, J.P. Stabilization of Black Cotton Soil Using Bio Enzyme for a Highway Material. Int. J. Innov. Res. Sci. Eng. Technol. 2015, 4, 553. [Google Scholar]
- Brandon, F.; Ding, C.; Gary, H.; Charles, R. Permazyme Testing Volume I: Final Testing Summary Report; California Pavement Preservation Center: Chico, CA, USA, 2010. [Google Scholar]
- Guthrie, W.S.; Simmons, D.O.; Eggett, D.L. Enzyme Stabilization of Low-Volume Gravel Roads. Transp. Res. Rec. J. Transp. Res. Board 2015, 2511, 112–120. [Google Scholar] [CrossRef]
- Khan, T.A.; Taha, M.R. Effect of Three Bioenzymes on Compaction, Consistency Limits, and Strength Characteristics of a Sedimentary Residual Soil. Adv. Mater. Sci. Eng. 2015, 2015, 798965. [Google Scholar] [CrossRef]
- Peng, H.T.; Su, H.T.; Zhang, X.P.; Wang, J. An Experimental Comparison of Compressive Strengths of Soils Stabilized with Enzyme and Ground Quicklime. Adv. Mater. Res. 2011, 280, 9–12. [Google Scholar] [CrossRef]
- Ramesh, H.N.; Sagar, S.R. Effect of Drying on the Strength Properties of Terrazyme Treated Expansive and Non-Expansive Soils. In Proceedings of the 50th Indian Geotechnical Conference, Maharashtra, India, 17–19 December 2015. [Google Scholar]
- Shankar, A.U.; Rai, H.K.; Mithanthaya, R. Bio-Enzyme Stabilized Lateritic Soil as a Highway Material. Indian Roads Congr. J. 2009, 70. [Google Scholar]
- Brazetti, R.; Murphy, S.R. General Usage of Bio-Enzyme Stabilizers in Road Construction in Brazil. In Proceedings of the 32nd Annual Meeting on Paving, Brasília, Brazil, 15–19 October 2000; pp. 2–12. [Google Scholar]
- Abedin, M.Z.; Tang Lon Mood, J.; Jurutesa, J.S. An attempt to improve Plantation Road Soils Using an Organic Stabilizer. Soc. Malays. Bull. 2003, 46, 59–62. [Google Scholar] [CrossRef]
- Katz, L.; Rauch, A.; Liljestrand, H.; Harmon, J.; Shaw, K.; Albers, H. Mechanisms of Soil Stabilization with Liquid Ionic Stabilizer. Transp. Res. Rec. J. Transp. Res. Board 2001, 1757, 50–57. [Google Scholar] [CrossRef]
- Petry, T.; Das, B. Evaluation of Chemical Modifiers and Stabilizers for Chemically Active Soils—Clays. Transp. Res. Rec. J. Transp. Res. Board 2001, 1757, 43–49. [Google Scholar] [CrossRef]
- Scholen, D.E. Non-Standard Stabilizers; United States. Federal Highway Administration. Office of Direct Federal Programs: Washington, DC, USA, 1992. [Google Scholar]
- Zhao, H.; Ge, L.; Petry, T.M.; Sun, Y.-Z. Effects of Chemical Stabilizers on an Expansive Clay. KSCE J. Civ. Eng. 2014, 18, 1009–1017. [Google Scholar] [CrossRef]
- Ji, X.; Ma, Y.; Zeng, G.; Xu, X.; Mei, K.; Wang, Z.; Chen, Z.; Dahlgren, R.; Zhang, M.; Shang, X. Transport and Fate of Microplastics from Riverine Sediment Dredge Piles: Implications for Disposal. J. Hazard. Mater. 2021, 404, 124132. [Google Scholar] [CrossRef]
- Thurnau, R.C. Low-Temperature Desorption Treatment of Co-Contaminated Soils: TCLP as an Evaluation Technique. J. Hazard. Mater. 1996, 48, 149–169. [Google Scholar] [CrossRef]
- Booth, J.S.; Dahl, A.G. A Note on the Relationships between Organic Matter and Some Geotechnical Properties of a Marine Sediment. In Marine Geotechnology; Taylor & Francis: Abingdon-on-Thames, UK, 1986. [Google Scholar]
- Huang, P.-T.; Bobet, A.; Santagata, M. Identification of Low-Organic-Content Soils: An Engineering Approach. Geotech. Test. J. 2012, 35, 596–606. [Google Scholar] [CrossRef]
- Keller, G.H. Organic Matter and the Geotechnical Properties of Submarine Sediments. Geo-Marine Lett. 1982, 2, 191–198. [Google Scholar] [CrossRef]
- Venkatasubramanian, C.; Dhinakaran, G. Effect of Bio-Enzymatic Soil Stabilisation on Unconfined Compressive Strength and California Bearing Ratio. J. Eng. Appl. Sci. 2011, 6, 295–298. [Google Scholar]
- Maher, A.; Douglas, W.S.; Jafari, F.; Pecchioli, J. The Processing and Beneficial Use of Fine-Grained Dredged Material. In A Manual for Engineers; Citeseer: Princeton, NJ, USA, 2013. [Google Scholar]
- Gayatri, N.; Shyla, J. Effect of Bioenzyme and Geotextile on Strength Characteristics of Subgrade Soil. Int. Res. J. Eng. Technol. 2016, 3, 1891–1897. [Google Scholar]
- Mymrin, V.; Stella, J.C.; Scremim, C.B.; Pan, R.C.Y.; Sanches, F.G.; Alekseev, K.; Pedroso, D.E.; Molinetti, A.; Fortini, O.M. Utilization of Sediments Dredged from Marine Ports as a Principal Component of Composite Material. J. Clean. Prod. 2017, 142, 4041–4049. [Google Scholar] [CrossRef]


Disclaimer/Publisher’s Note: The statements, opinions and data contained in all publications are solely those of the individual author(s) and contributor(s) and not of MDPI and/or the editor(s). MDPI and/or the editor(s) disclaim responsibility for any injury to people or property resulting from any ideas, methods, instructions or products referred to in the content. |
© 2023 by the authors. Licensee MDPI, Basel, Switzerland. This article is an open access article distributed under the terms and conditions of the Creative Commons Attribution (CC BY) license (https://creativecommons.org/licenses/by/4.0/).