

Influencing Factors on Air Conditioning Energy Consumption of Naturally Ventilated Research Buildings Based on Actual HVAC Behaviours
Abstract
:1. Introduction
2. Materials and Methods
2.1. Method for Collecting Data in the Case Building
2.2. A Quantitative Approach to Describing the Actual HVAC Behaviour
2.2.1. Division of the Characteristic Stages of Air Conditioning Usage
2.2.2. Generation of the HVAC Behaviour Decision Branch-Based Clustering Analysis
- Classifications are significantly different from each other;
- If the number of clusters is k + 1, there are 2 classifications with similar features.
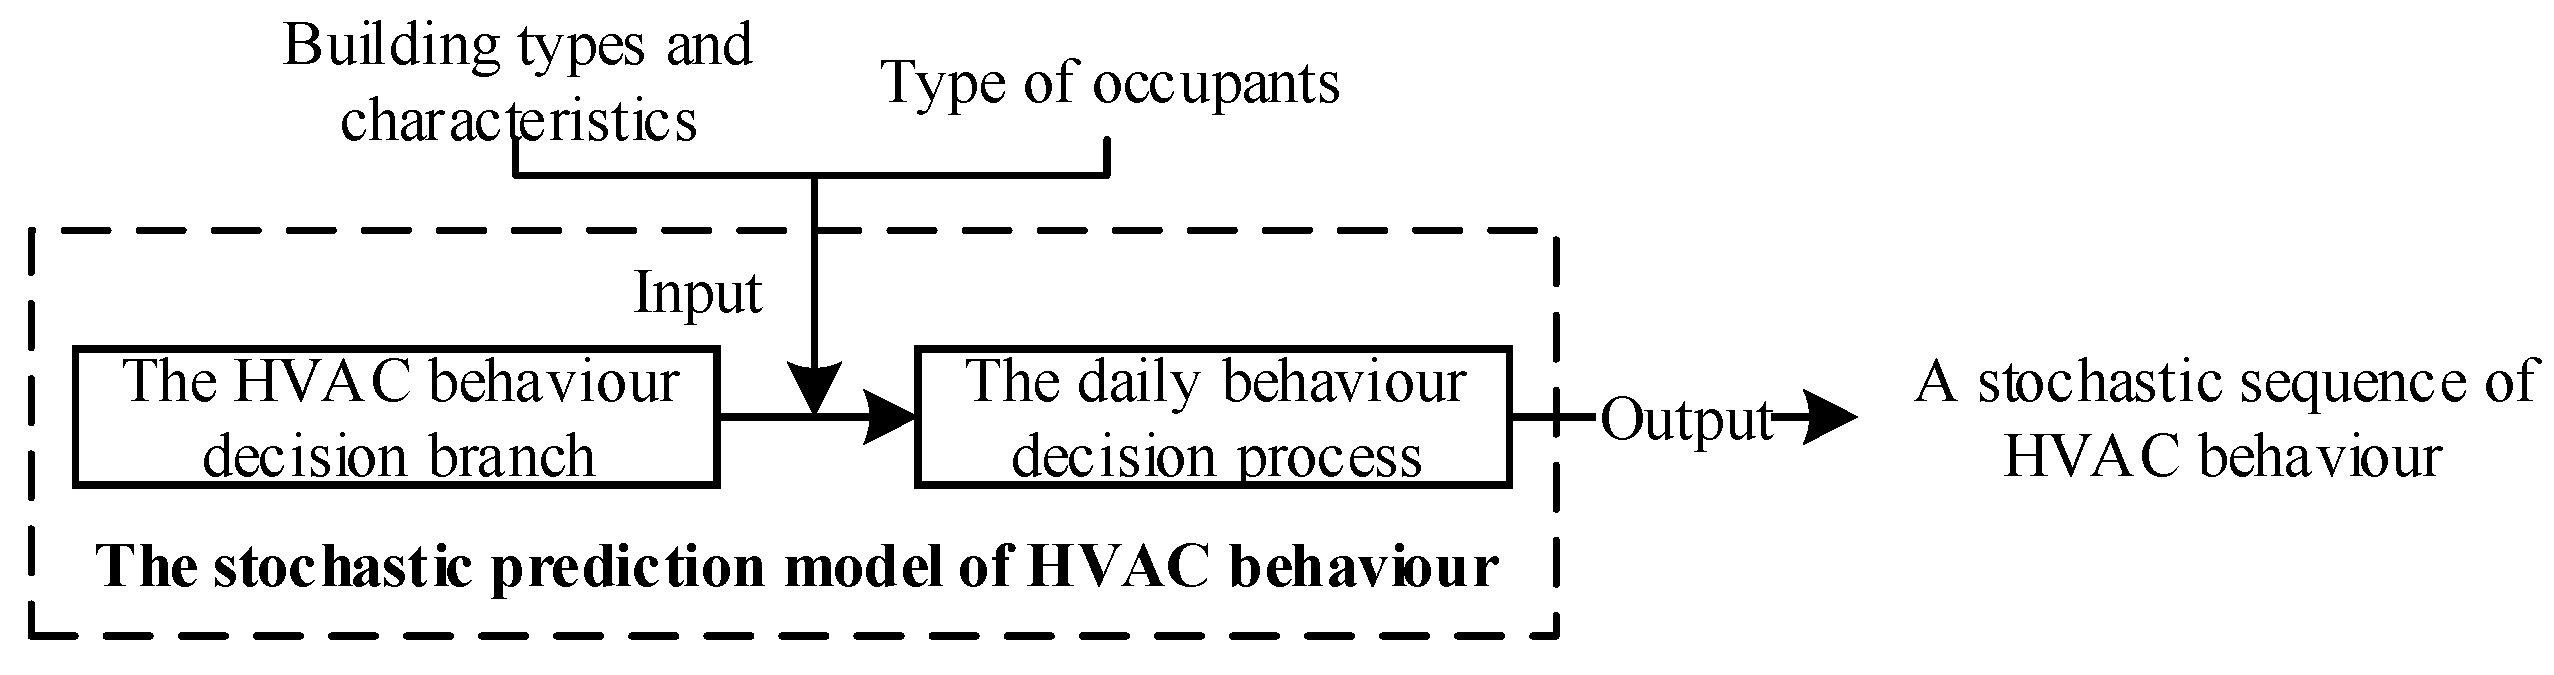
2.2.3. Stochastic HVAC Sequence Generation Based on the Monte Carlo Method
- 1.
- The setting parameter D indicates the D-th day of the year, with an initial value of “1” for January 1 and so forth, corresponding to the date December 31 when D = 365;
- 2.
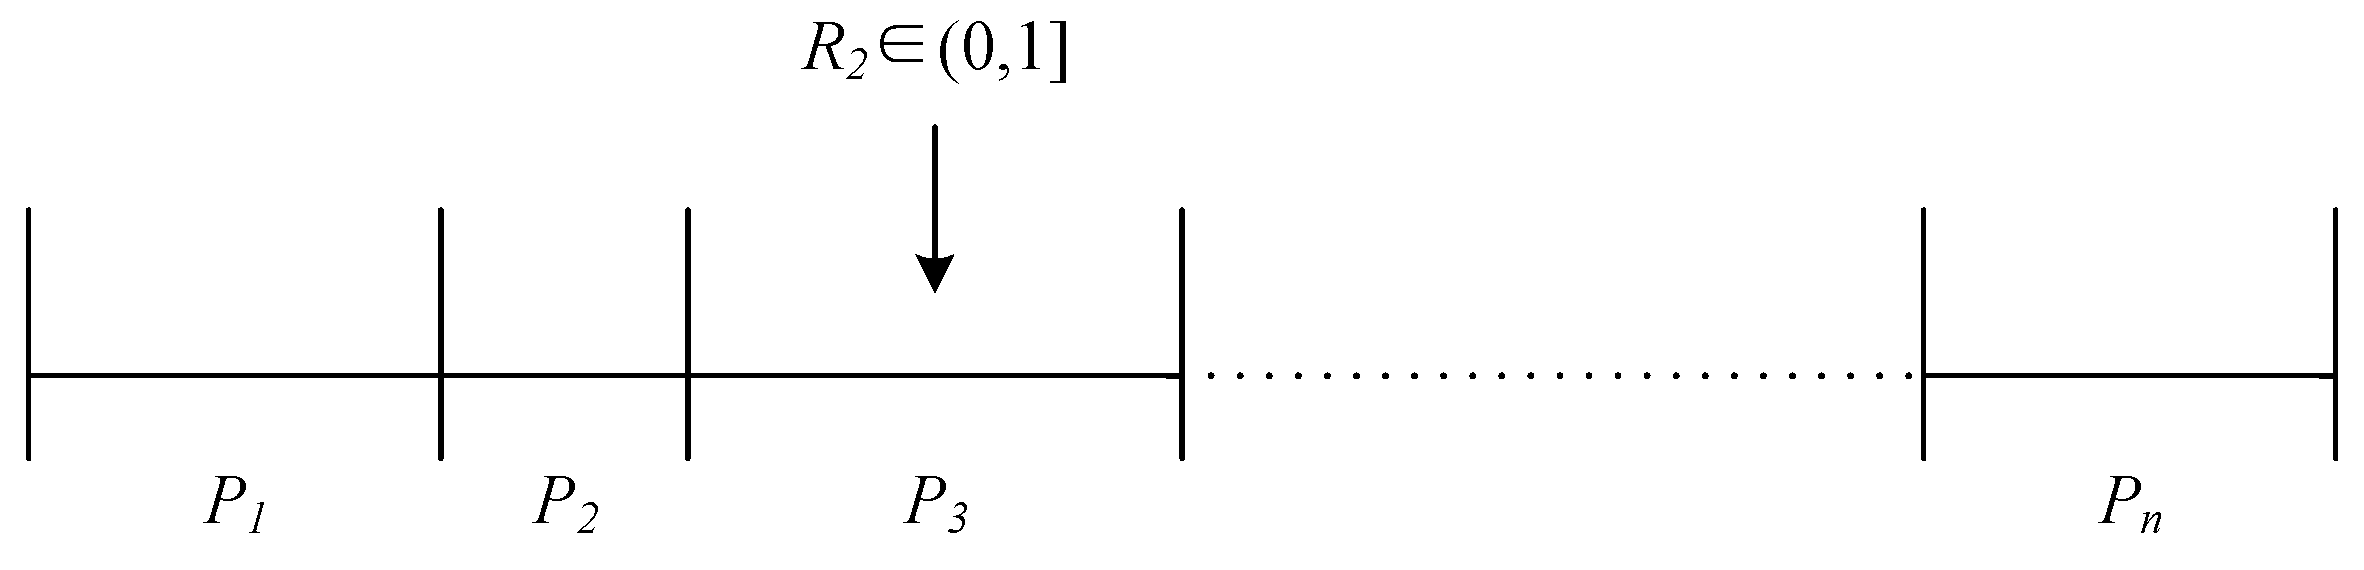
- Determine the characteristic stage of AC usage on Day D, and load n typical daily AC operation schedules for all patterns in this stage. The probability of occurrence corresponding to each typical schedule is , and . Generate random numbers according to the procedure shown in Figure 3, and decide and output the AC operation schedule for Day D according to the distribution interval where the fall point lies. Enter the decision process for the next day, i.e., D = D + 1, and perform step 3;
- 3.
- Check if D meets D > 365; if so, sequence generation is complete; otherwise, go back to step 2.
2.3. Method for Predicting AC Energy Consumption under Multiple Building Scenarios
2.3.1. Parametrised Translation of the Stochastic Sequences by Python Programming
2.3.2. Simulation of AC Energy Consumption Based on Different Behavioural Patterns by Applying jEPlus
2.4. Method for Analysing the Importance of the Factors Influencing AC Energy Consumption
2.4.1. Calculation of Importance Scores Based on Random Forest Regression
- 1.
- Build a regression tree model for each bootstrap sample set to predict the corresponding OOB, using Equation (1) to calculate the mean square of the OOB residuals, denoted MSE1, MSE2, ……, MSEk;
- is the actual value of the dependent variable (DV) in the OOB dataset,
- is the predicted value of the dependent variable (IV) in the OOB dataset taken from the regression model.
- 2.
- Randomly permute the independent variable among the k OOB samples to form a new OOB sample for testing. Predict the new OOB using a random forest regression tree and compute a mean square of residuals to obtain the matrix ;
- 3.
- Calculate the importance score of the independent variable using Equation (2).
2.4.2. Study of Main Procedures for AC Energy Conservation Based on Important Influencing Factors
- is the annual AC power consumption per unit area of the building;
- is the total area of the building;
- and are the annual heating load and cooling load of the building, respectively; and
- and are the energy conservation ratio in heating and cooling condition, respectively.where
- is the total value of uncomfortable hours for the entire building;
- is the combined duration of AC operation for the entire building;
- n is the number of air-conditioned rooms in the building;
- is the area of the i-th air-conditioned zone;
- and are the total area of collective and individual offices, respectively;
- and are the average measured duration of AC operation in collective and individual offices, respectively;
- is the value of uncomfortable hours in the i-th air-conditioned room from the simulation; and
- is the value of uncomfortable hours as a percentage of the duration of AC operation.
3. The Stochastic Prediction Model of HVAC Behaviour Based on the Actual Operating Characteristics of Research Buildings
3.1. Quantitative Description of Actual HVAC Behavioural Characteristics
3.1.1. Typical HVAC Behavioural Patterns and Their Distribution Characteristics
3.1.2. Quantitative Description of the HVAC Behaviour Decision Branch
3.2. Simulation and Verification of the Stochastic Sequence of HVAC Behaviour
4. Construction of the Database of Multiple Scenarios Based on Simulation
4.1. Verification of the Simulated Energy Consumption of the Case Building
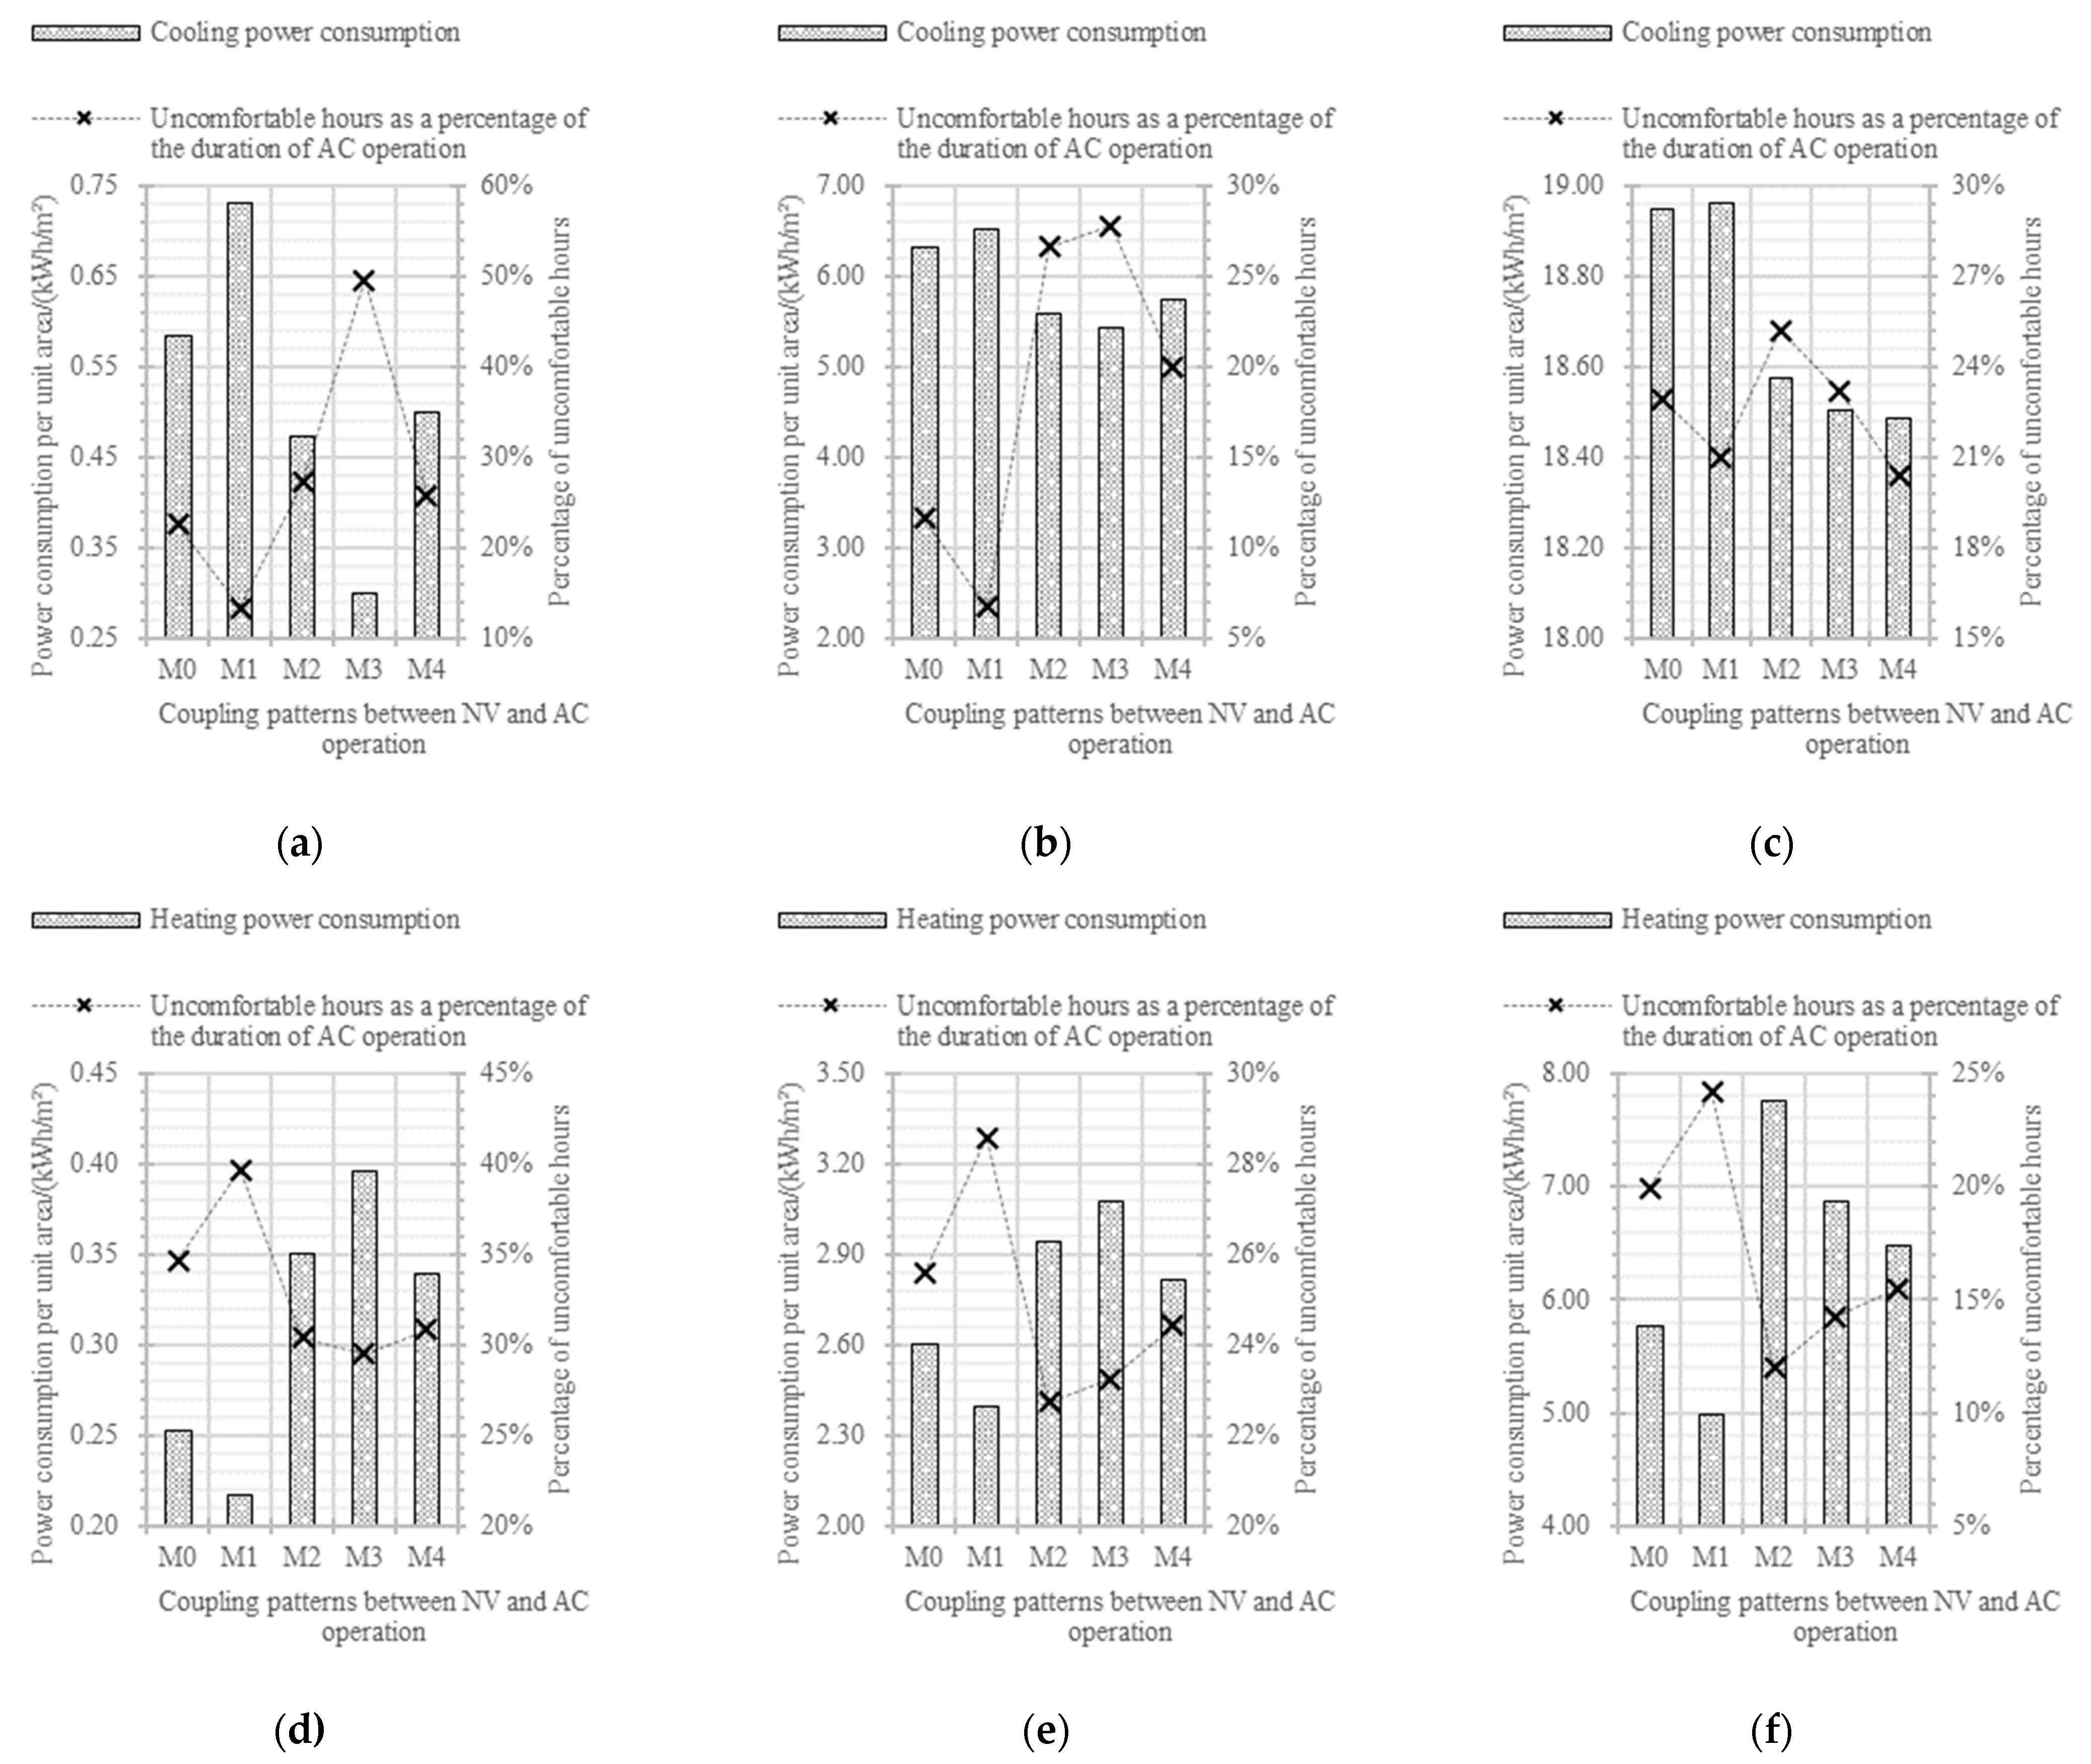
4.2. Description of the Coupling Patterns between NV and AC Operation
4.3. Determination of Initial Factors Influencing the AC Energy Consumption
5. Importance Analysis of Factors Influencing AC Energy Consumption
5.1. Importance Score Calculation Based on the Actual Operational Characteristics of HVAC Behaviour
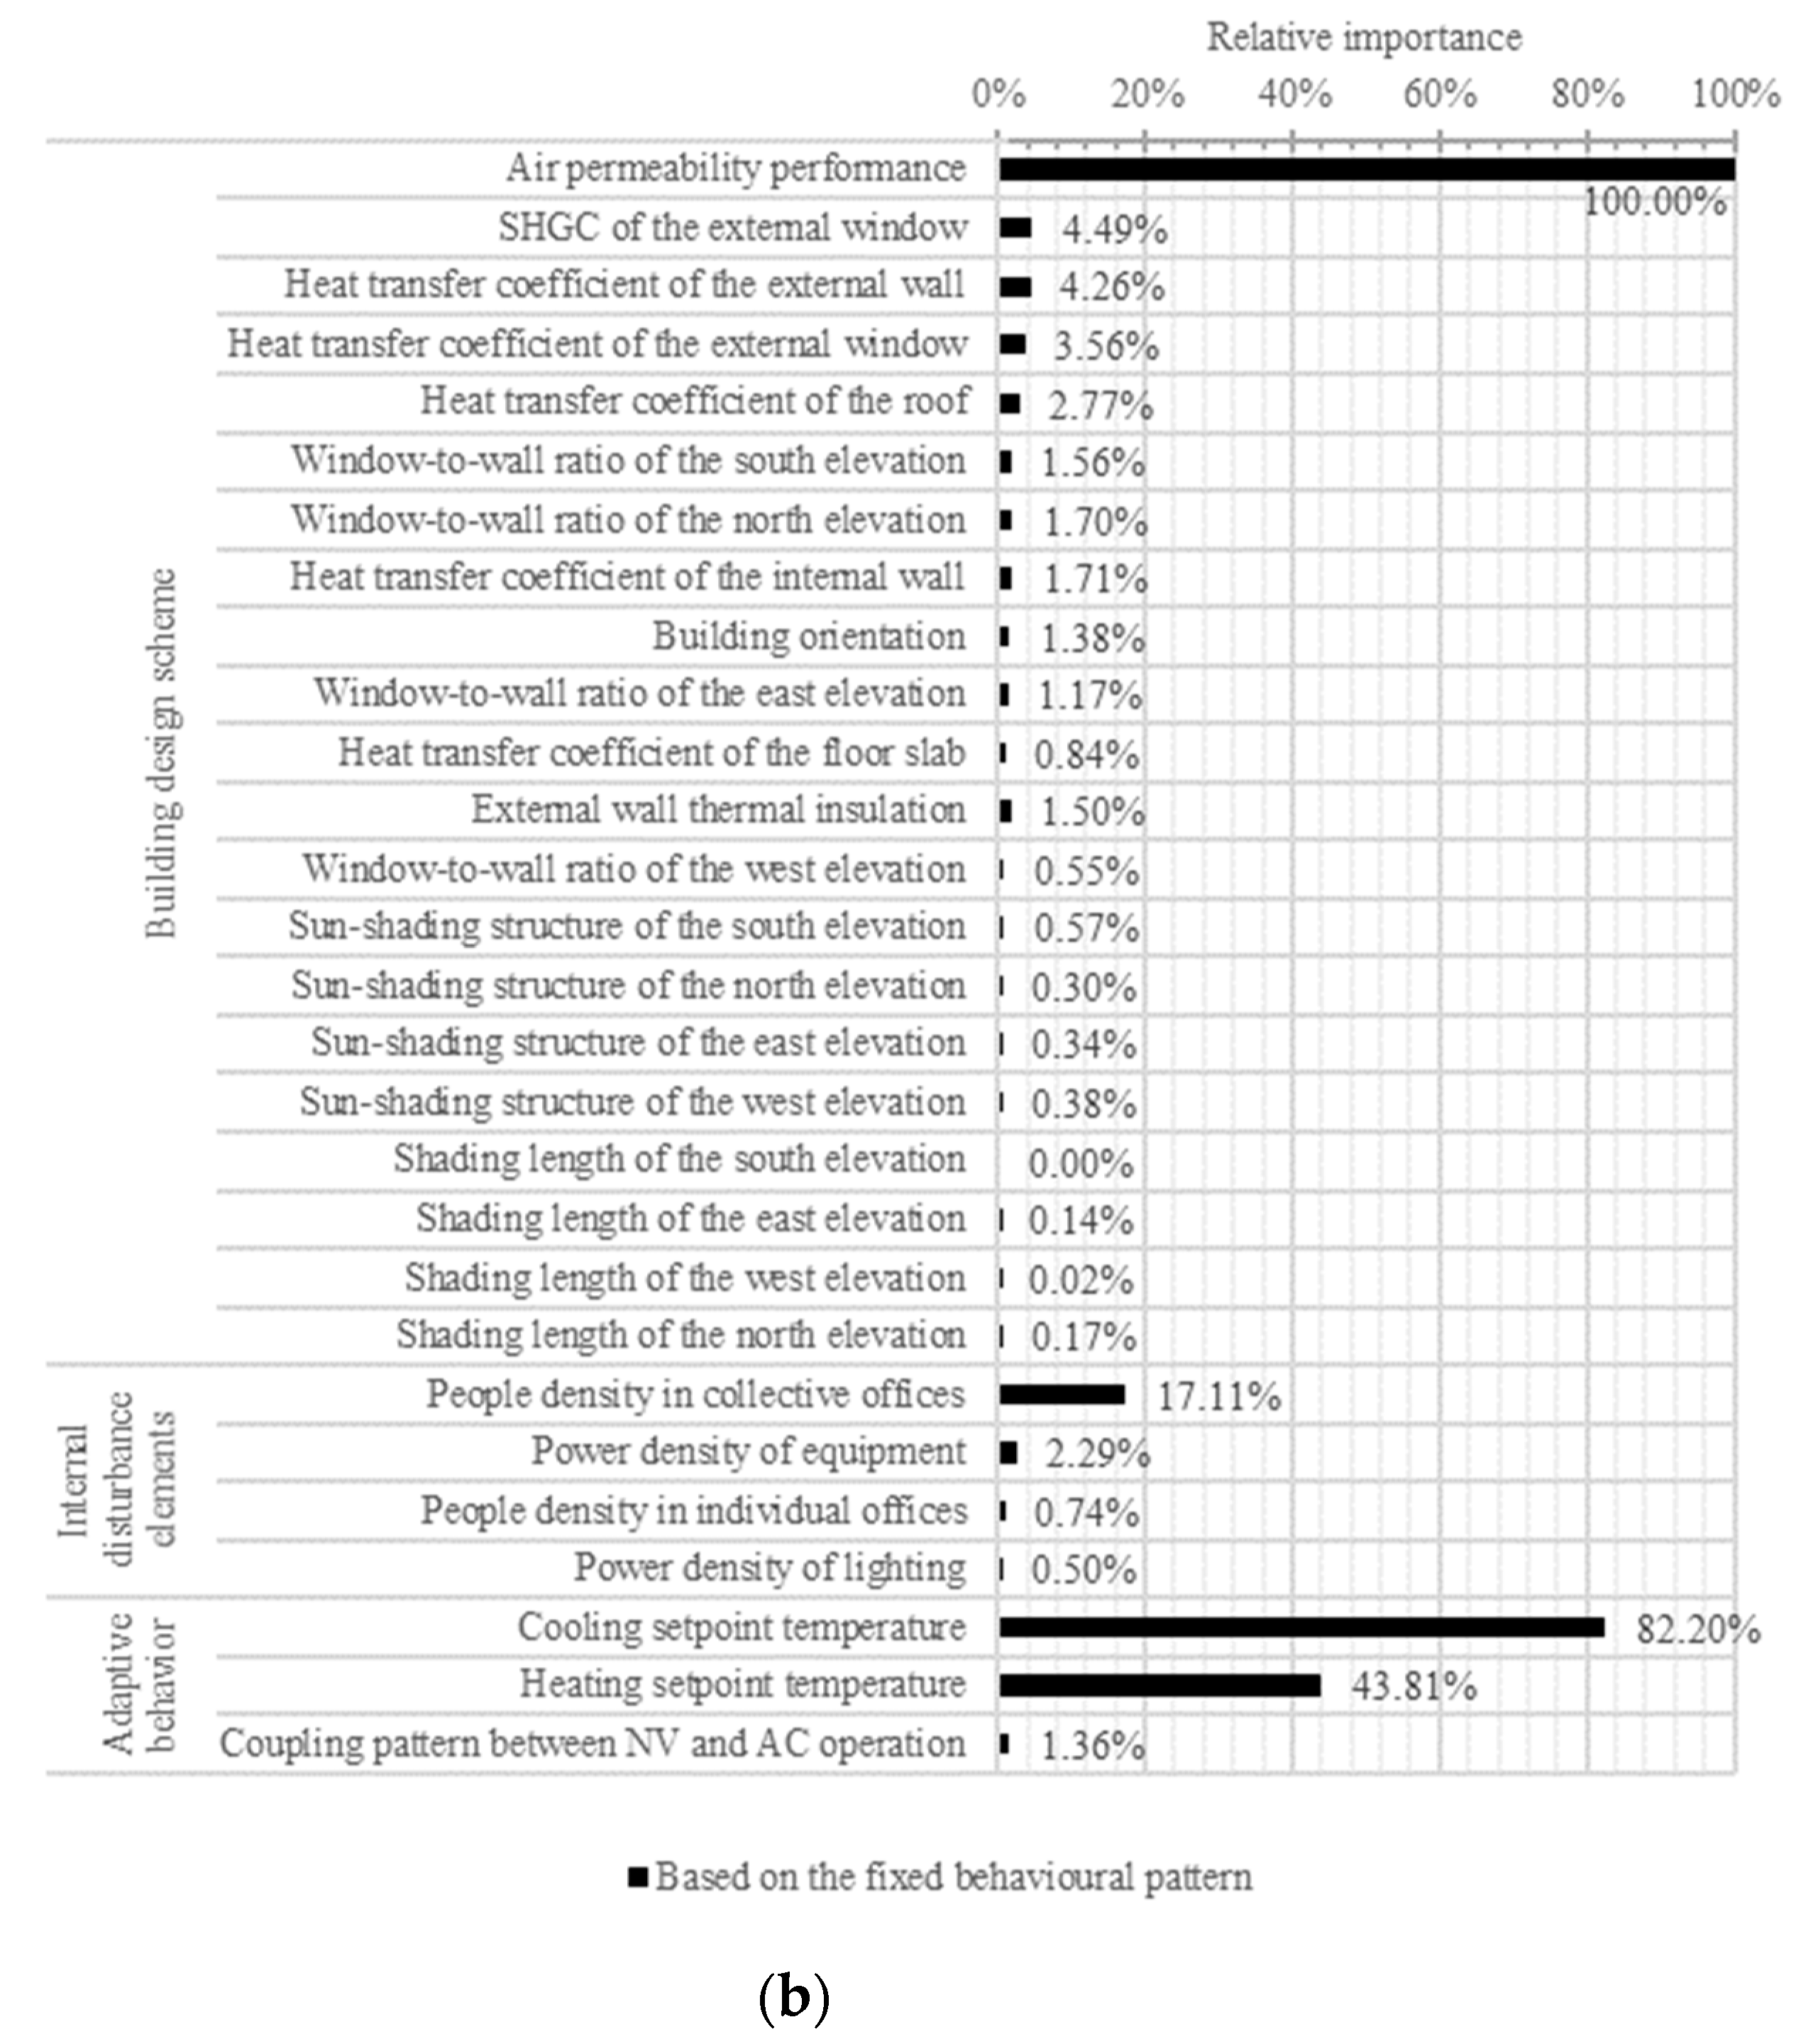
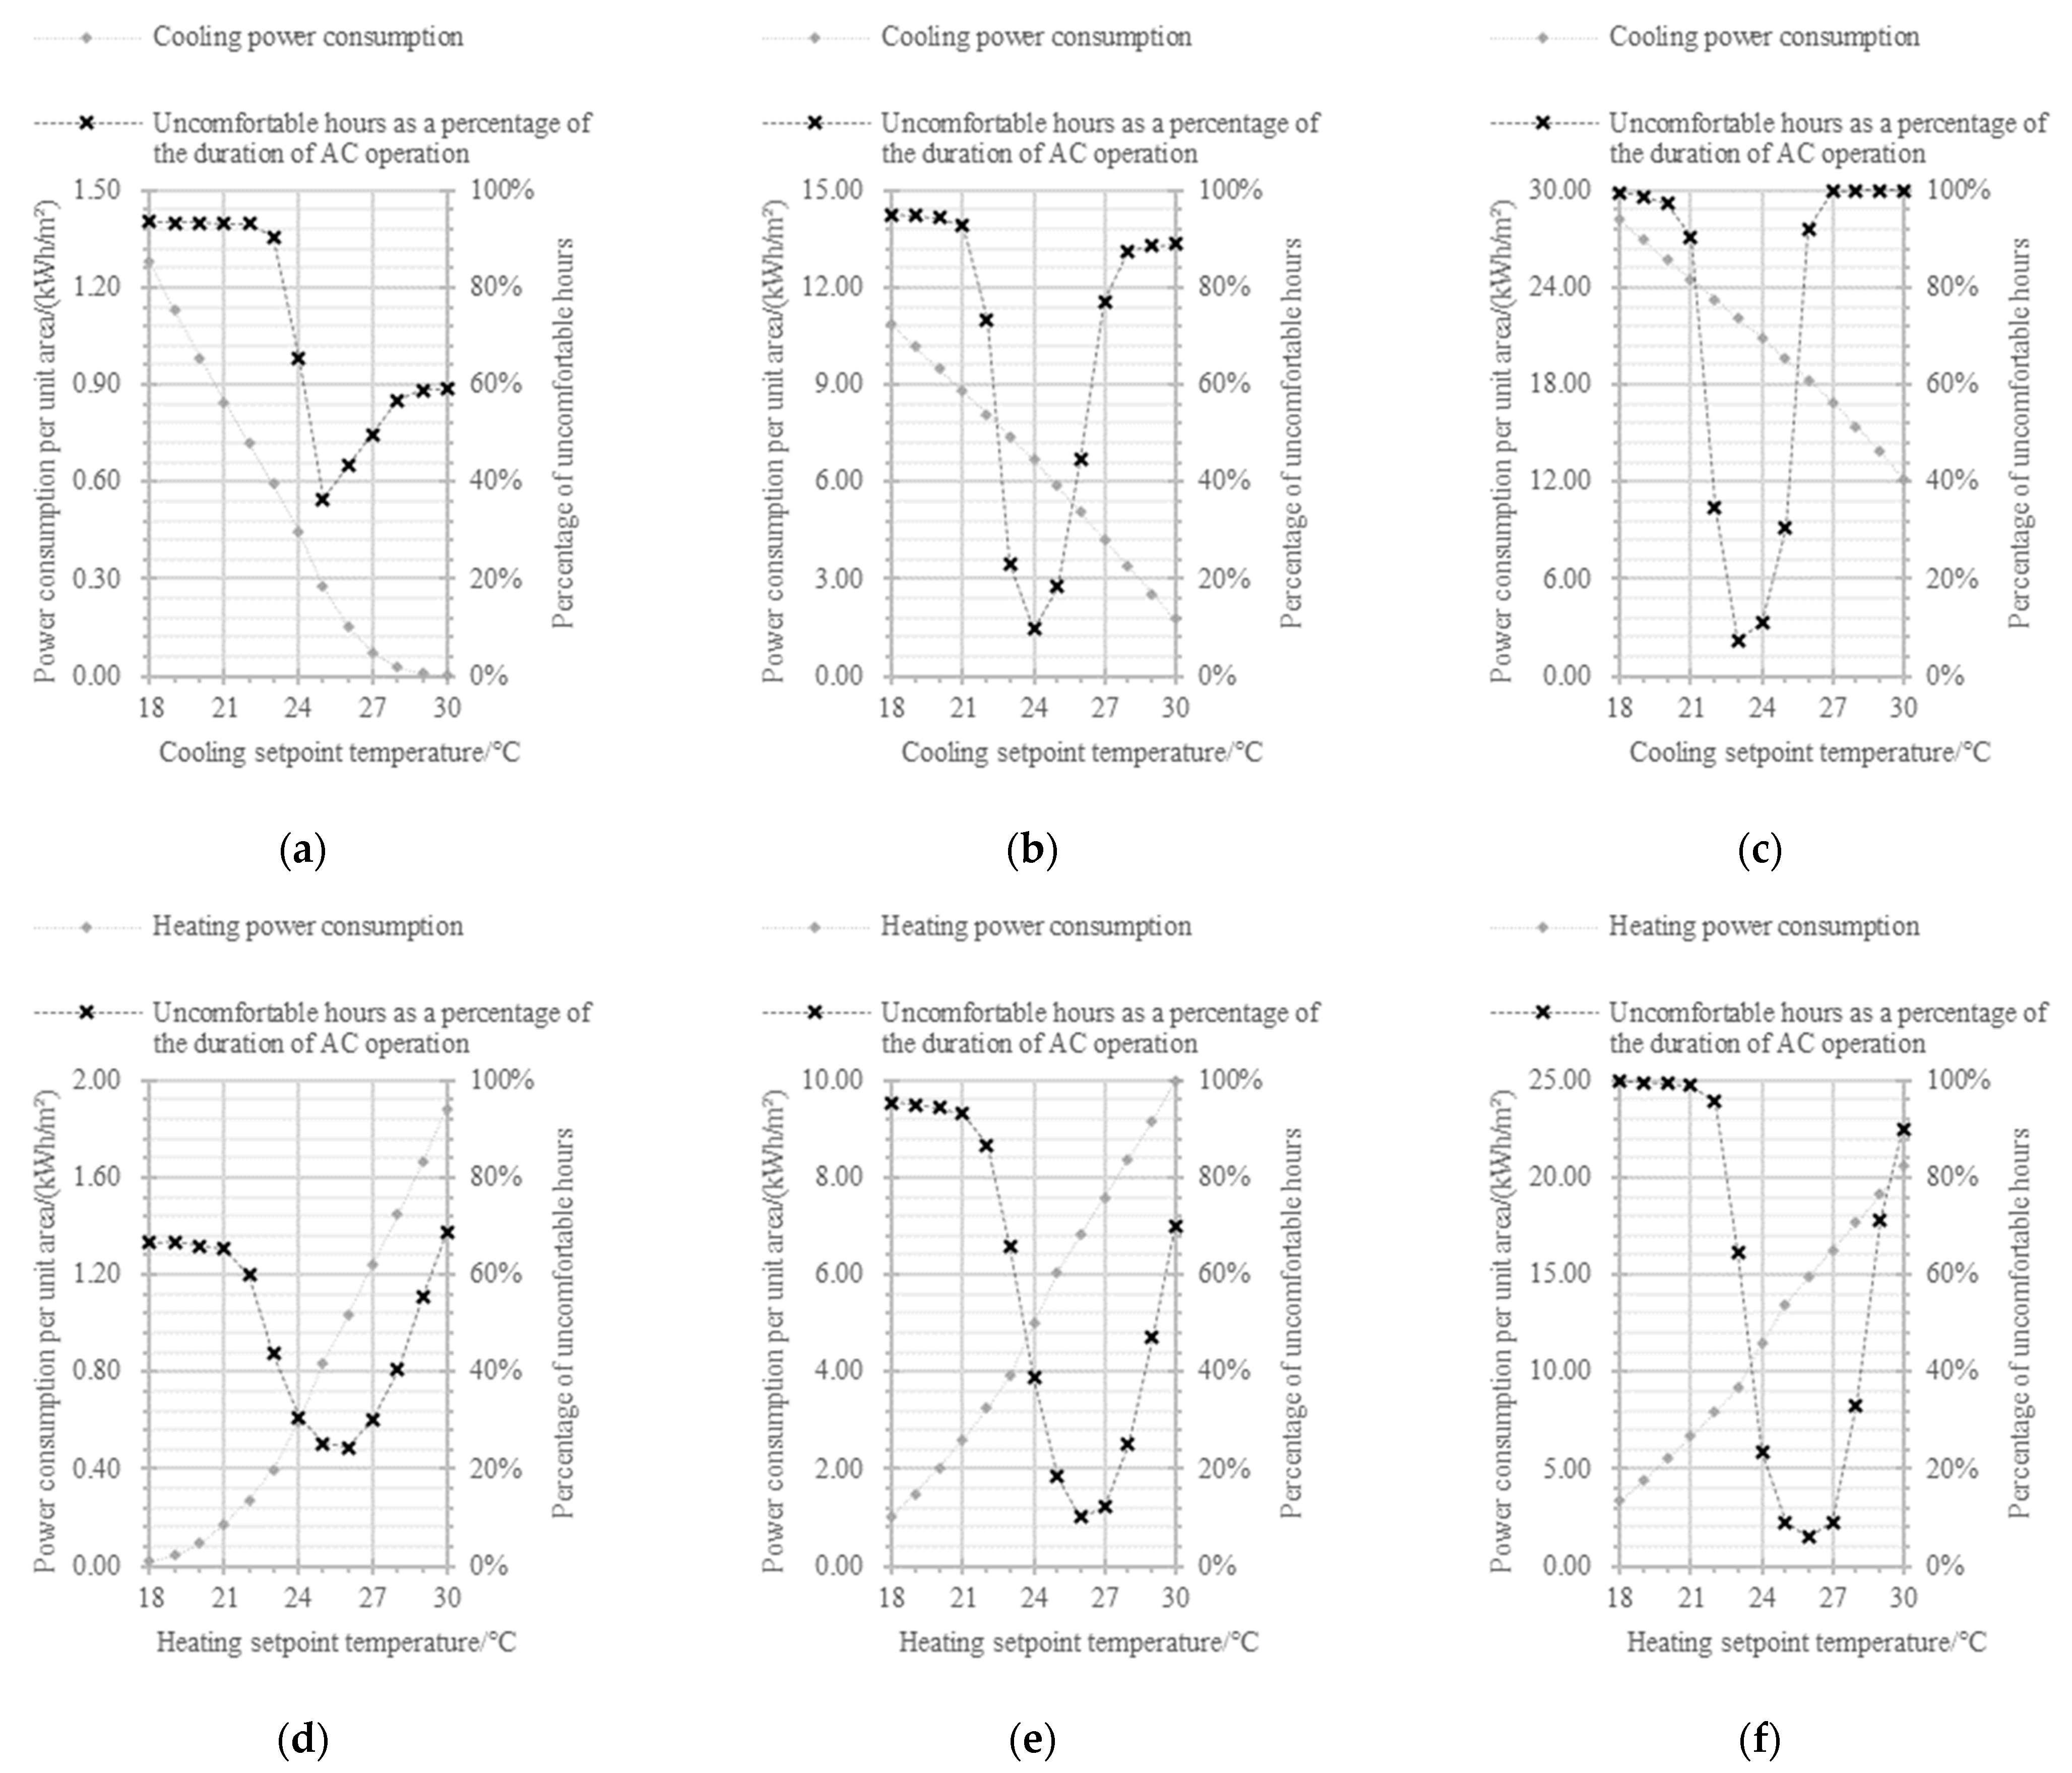
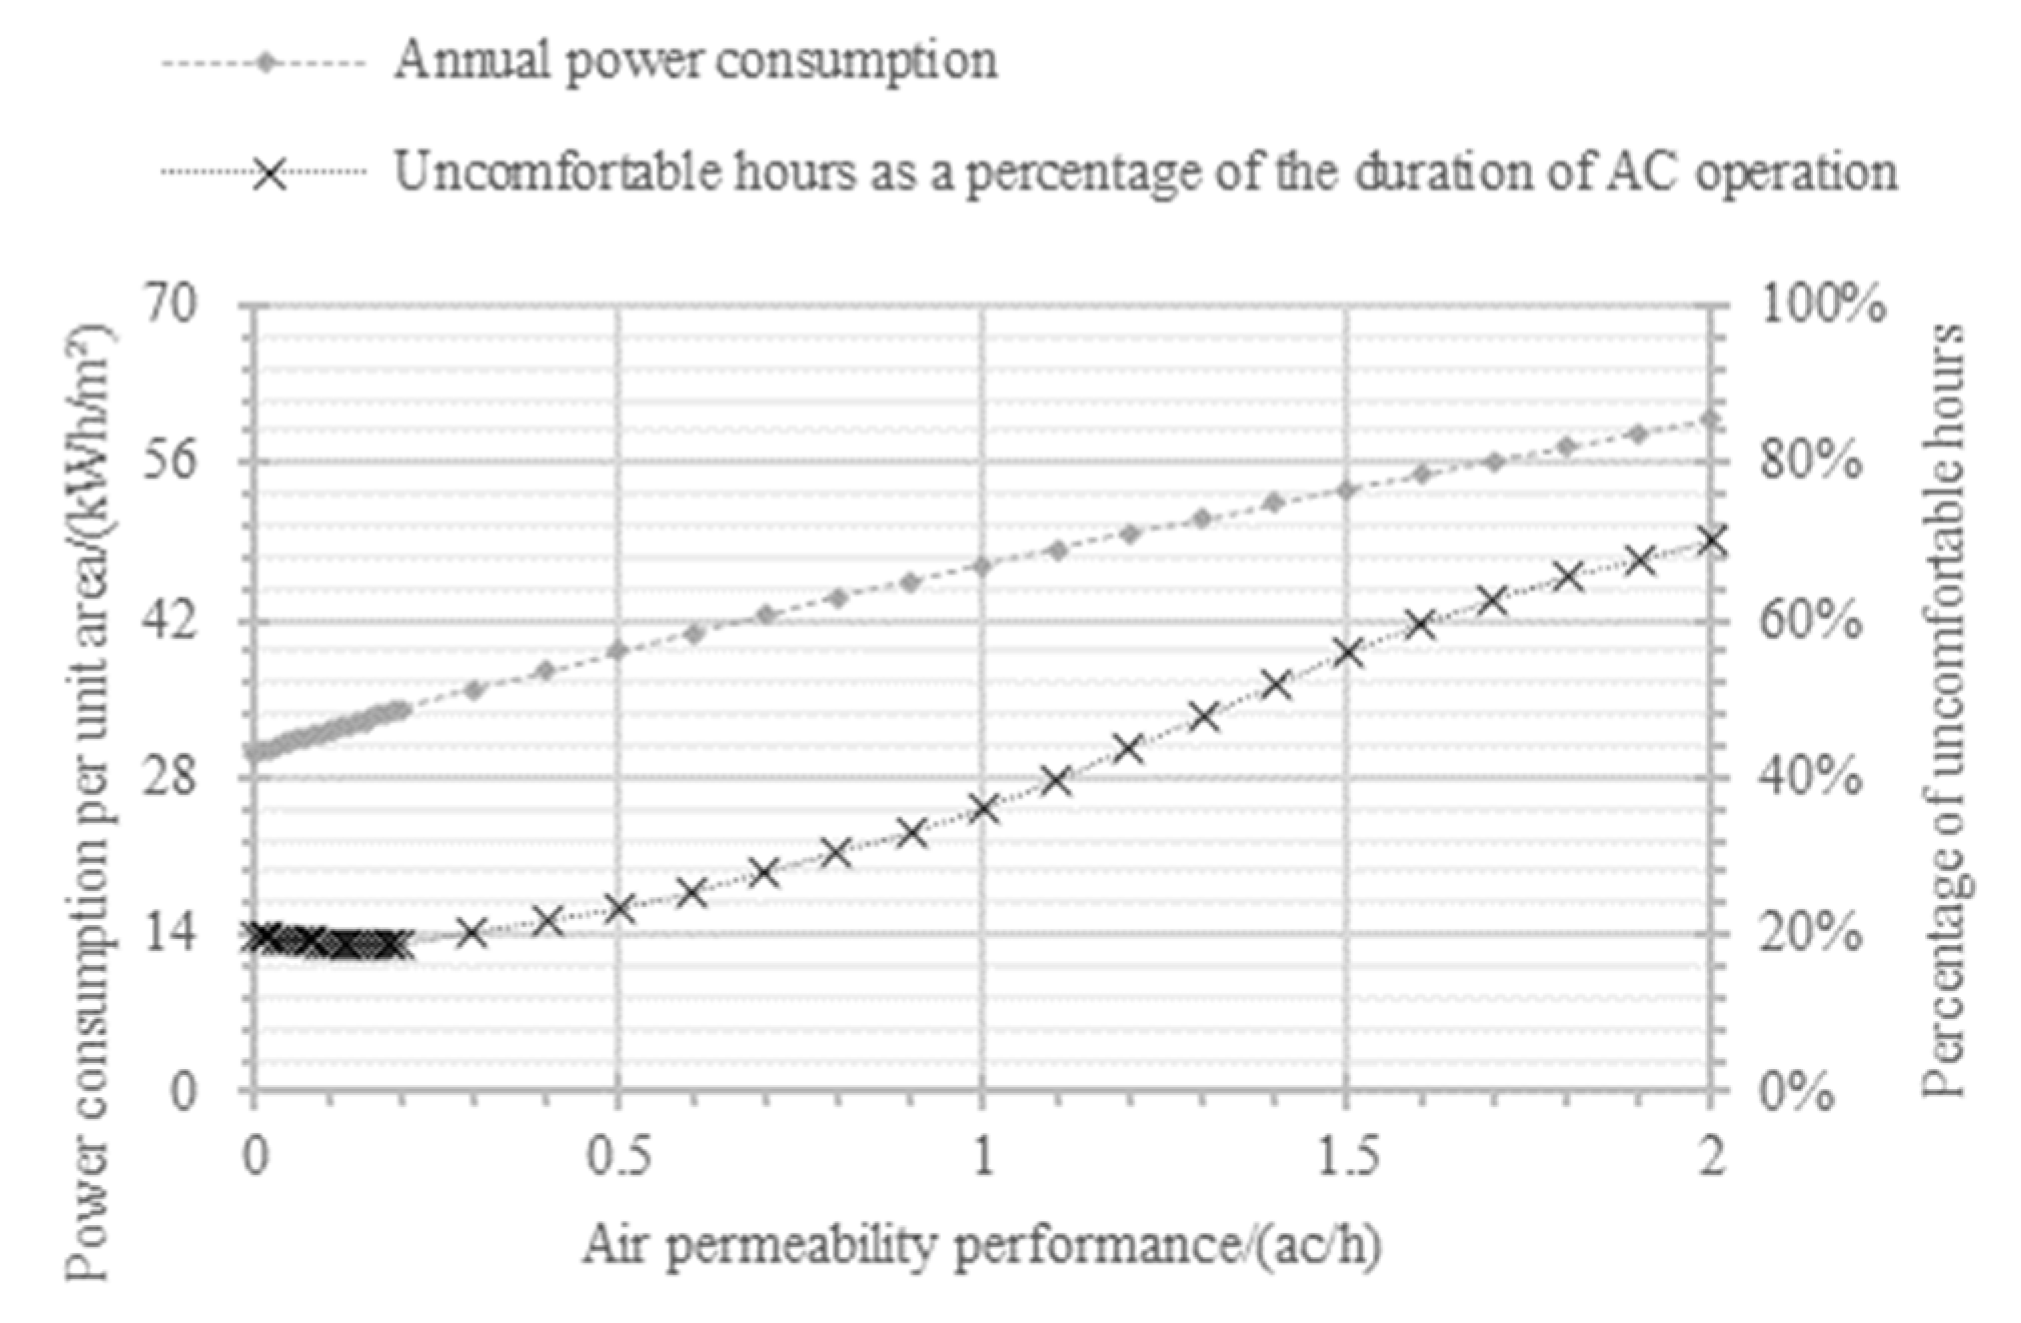
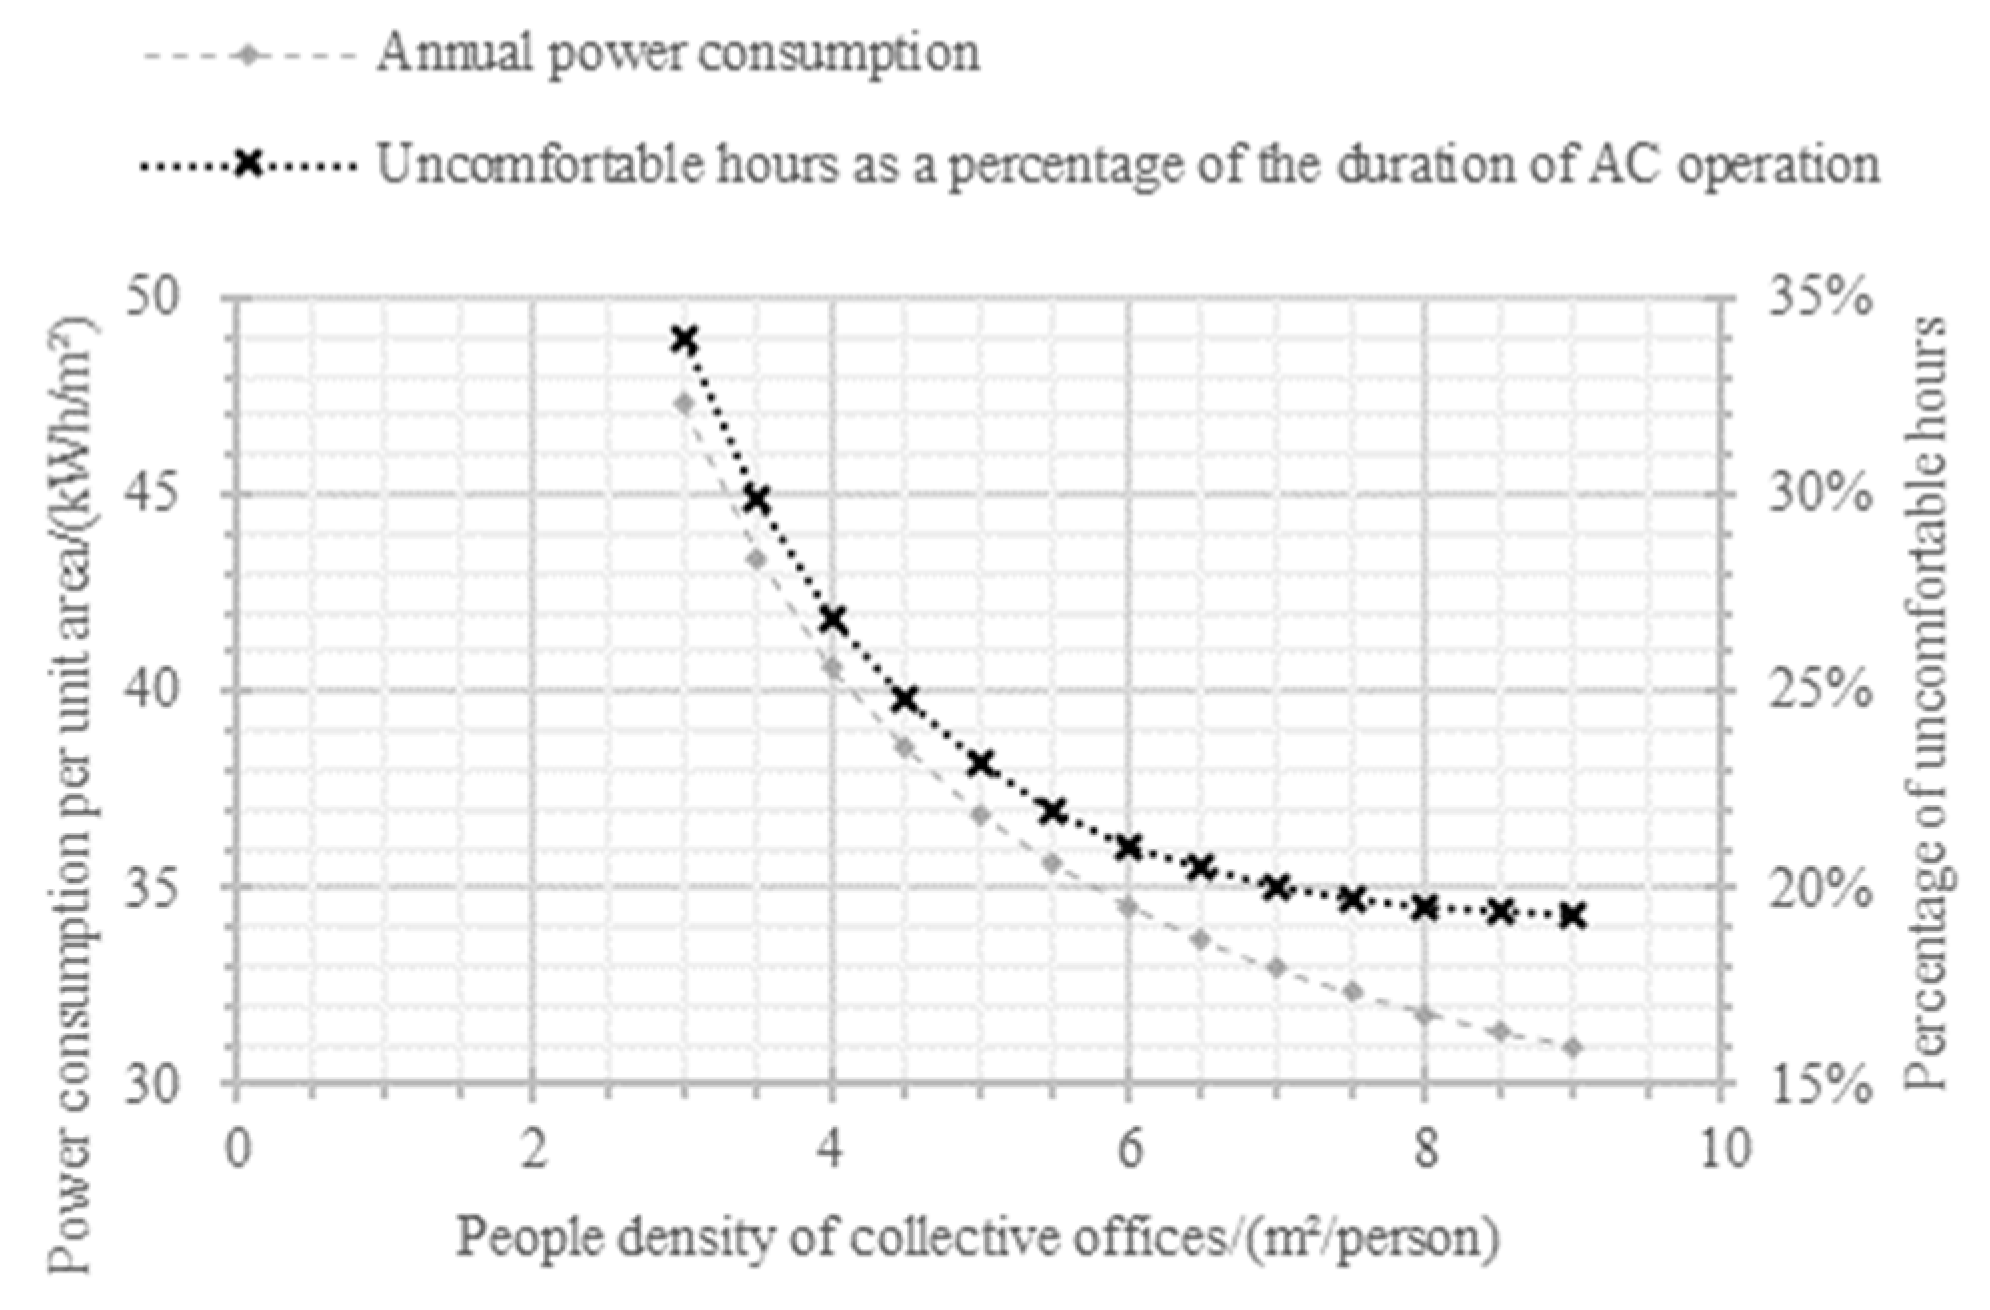
5.2. Importance Analysis for Factors Influencing AC Energy Consumption
- 1.
- For factors extracted from the building design scheme
- 2.
- For factors extracted from the internal disturbance elements
- 3.
- For factors extracted from the adaptive behaviours
6. Discussion: Key Strategies for AC Energy Conservation Based on Important Influencing Factors
7. Conclusions
- The cooling/heating setpoint temperature, the air permeability, and the people density of collective offices are critical influencing factors with a relative importance greater than 10% based on both behavioural patterns. Therefore, energy conservation strategies based on these factors are a high priority.
- The relative importance and number of significant and limited factors are remarkably different depending on the behavioural patterns. The key strategies for energy conservation in similar naturally ventilated research buildings should be based on the cooling/heating setpoint temperature, the air permeability, the people density of collective offices, the coupling pattern between NV and AC operation, and the SHGC of the external window.
- The effect of implementing key strategies in the case buildings was simulated. Accordingly, the power consumption can be reduced from 52.37 kWh/(m2·a) to 34.03 kWh/(m2·a), while the uncomfortable hours as a percentage of the duration of AC operation decreased from 51.49% to 26.78%, thus achieving 35.02% AC energy savings while promoting thermal comfort.
Author Contributions
Funding
Data Availability Statement
Conflicts of Interest
References
- Korsavi, S.S.; Montazami, A.; Brusey, J. Developing a Design Framework to Facilitate Adaptive Behaviours. Energy Build. 2018, 179, 360–373. [Google Scholar] [CrossRef]
- Papadopoulos, S.; Kontokosta, C.E.; Vlachokostas, A.; Azar, E. Rethinking HVAC Temperature Setpoints in Commercial Buildings: The Potential for Zero-Cost Energy Savings and Comfort Improvement in Different Climates. Build. Environ. 2019, 155, 350–359. [Google Scholar] [CrossRef]
- Ge, F.; Guo, X.; Liu, H.; Wang, J.; Lu, C. Energy Performance of Air Cooling Systems Considering Indoor Temperature and Relative Humidity in Different Climate Zones in China. Energy Build. 2013, 64, 145–153. [Google Scholar] [CrossRef]
- Kempton, W.; Feuermann, D.; McGarity, A.E. “I Always Turn It on Super”: User Decisions about When and How to Operate Room Air Conditioners. Energy Build. 1992, 18, 177–191. [Google Scholar] [CrossRef]
- Liu, N.; Mo, D.; Wang, M. A Study on Occupants’ Behavior and Thermal Environmental Energy Efficiency of Dwellings. Archit. J. 2016, 2, 33–37. [Google Scholar]
- Wang, Z.; Zhang, L.; Zhao, J.; He, Y. Thermal Comfort for Naturally Ventilated Residential Buildings in Harbin. Energy Build. 2010, 42, 2406–2415. [Google Scholar] [CrossRef]
- Zhao, L.; Liu, J.; Ren, J. Impact of Various Ventilation Modes on IAQ and Energy Consumption in Chinese Dwellings: First Long-Term Monitoring Study in Tianjin, China. Build. Environ. 2018, 143, 99–106. [Google Scholar] [CrossRef]
- Santamouris, M.; Sfakianaki, A.; Pavlou, K. On the Efficiency of Night Ventilation Techniques Applied to Residential Buildings. Energy Build. 2010, 42, 1309–1313. [Google Scholar] [CrossRef]
- Liu, Y.; Gao, Y.; Zhuang, C.; Shi, D.; Xu, Y.; Guan, J.; Di, Y. Optimization of Top-Floor Rooms Coupling Cool Roofs, Natural Ventilation and Solar Shading for Residential Buildings in Hot-Summer and Warm-Winter Zones. J. Build. Eng. 2023, 66, 105933. [Google Scholar] [CrossRef]
- Kubota, T.; Chyee, D.T.H.; Ahmad, S. The Effects of Night Ventilation Technique on Indoor Thermal Environment for Residential Buildings in Hot-Humid Climate of Malaysia. Energy Build. 2009, 41, 829–839. [Google Scholar] [CrossRef]
- Kubota, T.; Chyee, D.T.H. Potential of Passive Cooling Techniques for Modern Houses in the Tropical Climate of Malaysia—Analysis of the Indoor Thermal Environment for Various Ventilation Strategies. Int. J. Vent. 2010, 9, 11–23. [Google Scholar] [CrossRef]
- Crawley, D.; Lawrie, L.; Winkelmann, F.; Buhl, W.F.; Huang, Y.J.; Pedersen, C.; Strand, R.; Liesen, R.; Fisher, D.; Witte, M.; et al. EnergyPlus: Creating a New-Generation Building Energy Simulation Program. Energy Build. 2001, 33, 319–331. [Google Scholar] [CrossRef]
- Po-Jen Cheng, C.-H.C.; Lin, Y.-C. Design of an Intelligent Controller for an Air-Conditioning System Using DSP. J. Inf. Optim. Sci. 2008, 29, 907–922. [Google Scholar] [CrossRef]
- Indraganti, M. Behavioural Adaptation and the Use of Environmental Controls in Summer for Thermal Comfort in Apartments in India. Energy Build. 2010, 42, 1019–1025. [Google Scholar] [CrossRef]
- Schweiker, M.; Shukuya, M. Comparison of Theoretical and Statistical Models of Air-Conditioning-Unit Usage Behaviour in a Residential Setting under Japanese Climatic Conditions. Build. Environ. 2009, 44, 2137–2149. [Google Scholar] [CrossRef]
- Nicol, F.; Humphreys, M.; Olesen, B. A Stochastic Approach to Thermal Comfort—Occupant Behavior and Energy Use in Buildings. ASHRAE Trans. 2004, 110, 554–568. [Google Scholar]
- Tanimoto, J.; Hagishima, A. State Transition Probability for the Markov Model Dealing with on/off Cooling Schedule in Dwellings. Energy Build. 2005, 37, 181–187. [Google Scholar] [CrossRef]
- Haldi, F.; Robinson, D. Interactions with Window Openings by Office Occupants. Build. Environ. 2009, 44, 2378–2395. [Google Scholar] [CrossRef]
- Ren, X. Research on Occupant Behavior Action Model in Buildings. Master’s Thesis, Tsinghua University, Beijing, China, 2015. [Google Scholar]
- Park, H. A Stochastic Planning Model for Battery Energy Storage Systems Coupled with Utility-Scale Solar Photovoltaics. Energies 2021, 14, 1244. [Google Scholar] [CrossRef]
- Gilani, S.; Ouf, M. Advancing Occupant Modeling for Building Design & Code Compliance: Part 1. ASHRAE J. 2019, 61, 22–29. [Google Scholar]
- Ouf, M.; Gilani, S. Advancing Occupant Modeling for Building Design & Code Compliance: Part 2. ASHRAE J. 2019, 61, 28–36. [Google Scholar]
- Yu, W.; Li, B.; Jia, H.; Zhang, M.; Wang, D. Application of Multi-Objective Genetic Algorithm to Optimize Energy Efficiency and Thermal Comfort in Building Design. Energy Build. 2015, 88, 135–143. [Google Scholar] [CrossRef]
- Delgarm, N.; Sajadi, B.; Delgarm, S.; Kowsary, F. A Novel Approach for the Simulation-Based Optimization of the Buildings Energy Consumption Using NSGA-II: Case Study in Iran. Energy Build. 2016, 127, 552–560. [Google Scholar] [CrossRef]
- Magnier, L.; Haghighat, F. Multiobjective Optimization of Building Design Using TRNSYS Simulations, Genetic Algorithm, and Artificial Neural Network. Build. Environ. 2010, 45, 739–746. [Google Scholar] [CrossRef]
- Abuimara, T.; Gunay, B.; Carrizo, S. Assessing the Impact of Changes in Occupants on Design Decision Making. In Proceedings of the eSim 2018—Building Simulation to Support Building Sustainability, Montréal, QC, Canada, 9–10 May 2018. [Google Scholar]
- Satyavada, H.; Baldi, S. An Integrated Control-Oriented Modelling for HVAC Performance Benchmarking. J. Build. Eng. 2016, 6, 262–273. [Google Scholar] [CrossRef]
- Gao, H.; Wang, X.; Wu, K.; Zheng, Y.; Wang, Q.; Shi, W.; He, M. A Review of Building Carbon Emission Accounting and Prediction Models. Buildings 2023, 13, 1617. [Google Scholar] [CrossRef]
- Chen, S.; Wu, J.; Ge, J.; Liu, S. Simulation Method and Case Study of Stochastic Usage Behavior of Air Conditioners in Office Buildings. J. Hunan Univ. Sci. 2021, 48, 157–164. [Google Scholar] [CrossRef]
- Crawley, D.; Lawrie, L.; Winkelmann, F.; Pedersen, C. EnergyPlus: A New-Generation Building Energy Simulation Program. In Proceedings of the Renewable and Advanced Energy Systems for the 21st Century, Lahaina, HI, USA, 11–15 April 1999. [Google Scholar]
- Zhang, Y. Jeplus.Org. Available online: http://www.jeplus.org/wiki/doku.php?id=start (accessed on 23 October 2023).
- Zhang, Y.; Korolija, I. Performing Complex Parametric Simulations with jEPlus. In Proceedings of the SET 2010: 9th International Conference on Sustainable Energy Technologies, Shanghai, China, 24–27 August 2010. [Google Scholar]
- Rainville, F.-M.D.; Gagné, C.; Teytaud, O.; Laurendeau, D. Evolutionary Optimization of Low-Discrepancy Sequences. ACM Trans. Model. Comput. Simul. 2012, 22, 1–25. [Google Scholar] [CrossRef]
- Breiman, L. Random Forests. Mach. Learn. 2001, 45, 5–32. [Google Scholar] [CrossRef]
- Li, Z.; Zhang, T.; Wu, X.; Li, K. Methodology of Regression by Random Forest and Its Applica Tion on Metabolomics. Chin. J. Health Stat. 2012, 29, 158–160+163. [Google Scholar]
- GB50189-2015; Design Standard for Energy Efficiency of Public Buildings. China Architecture Publishing & Media Co., Ltd.: Beijing, China, 2015; pp. 46–52.
- GB/T 51350-2019; Technical Standard for Nearly Zero Energy Buildings. China Architecture Publishing & Media Co., Ltd.: Beijing, China, 2019; pp. 10–14.


| Characteristic Stages of AC Usage | Duration Date | Average Daily Outdoor Temperature/°C | Daily Probability of AC Operation | Average Daily Duration of AC Operation/h | |||
|---|---|---|---|---|---|---|---|
| Collective Offices | Individual Offices | Collective Offices | Individual Offices | ||||
| Cooling season | Mid-summer | Jun. 21~Sep. 10 | 29.33 | 92% | 73% | 11.52 | 5.83 |
| Early and late summer | May 11~Jun. 20 Sep. 11~Sep. 30 | 24.09 | 80% | 60% | 7.94 | 3.60 | |
| Late spring and early autumn | Apr. 21~May. 10 Oct. 1~Oct. 20 | 20.59 | 30% | 16% | 2.09 | 0.55 | |
| Transitional period | Apr. 11~Apr. 20 Oct. 21~Oct. 31 | 17.67 | 16% | 6% | 0.76 | 0.17 | |
| Heating season | Late autumn and early spring | Mar. 21~Apr. 10 Nov. 1~Nov. 20 | 15.49 | 27% | 4% | 1.65 | 0.27 |
| Early and late winter | Feb. 11~Mar. 20 Nov. 21~Dec. 10 | 9.94 | 53% | 30% | 4.84 | 1.73 | |
| Mid-winter | Dec. 11~Feb. 10 | 6.29 | 94% | 56% | 10.86 | 3.30 | |
| Room Type | Operating Conditions | The Characteristic Stage | Average Daily Duration of AC Operation/h | Average Daily Duration of Opening External Windows/h | ||
|---|---|---|---|---|---|---|
| Measured | Simulated | Measured | Simulated | |||
| Collective offices | Cumulative annual duration/h | 2538.35 | 2525.06 | 2808.74 | 2809.84 | |
| Cooling condition | Mid-summer | 11.52 | 11.63 | 7.01 | 6.95 | |
| Early and late summer | 7.92 | 7.72 | 10.19 | 10.36 | ||
| Late spring and early autumn | 2.09 | 2.14 | 12.72 | 12.61 | ||
| Heating condition | Mid-winter | 10.86 | 10.85 | 5.04 | 5.15 | |
| Early and late Winter | 4.84 | 4.75 | 6.73 | 6.51 | ||
| Late autumn and early spring | 1.65 | 1.63 | 9.78 | 9.93 | ||
| Individual Offices | Cumulative annual duration/h | 1035.82 | 999.20 | 4112.61 | 4089.38 | |
| Cooling condition | Mid-summer | 5.83 | 5.62 | 8.39 | 8.45 | |
| Early and late summer | 3.60 | 3.42 | 13.84 | 13.91 | ||
| Late spring and early autumn | 0.55 | 0.50 | 15.21 | 15.42 | ||
| Heating condition | Mid-winter | 3.30 | 3.11 | 10.34 | 10.53 | |
| Early and late Winter | 1.73 | 1.62 | 12.55 | 11.96 | ||
| Late autumn and early spring | 0.27 | 0.20 | 14.70 | 14.27 | ||
| Operating Conditions | Measured Power Consumption/kWh | Stochastic Behavioural Pattern | Fixed Behavioural Pattern | ||
|---|---|---|---|---|---|
| Simulated Power Consumption/kWh | Error Rate | Simulated Power Consumption/kWh | Error Rate | ||
| Heating condition | 79,429.27 | 75,265.37 | −5.24% | 97,376.41 | 22.60% |
| Cooling condition | 85,005.37 | 87,179.47 | 2.56% | 79,187.40 | −6.84% |
| Coupling Pattern | Parametric Description | Description for NV Sequences | |
|---|---|---|---|
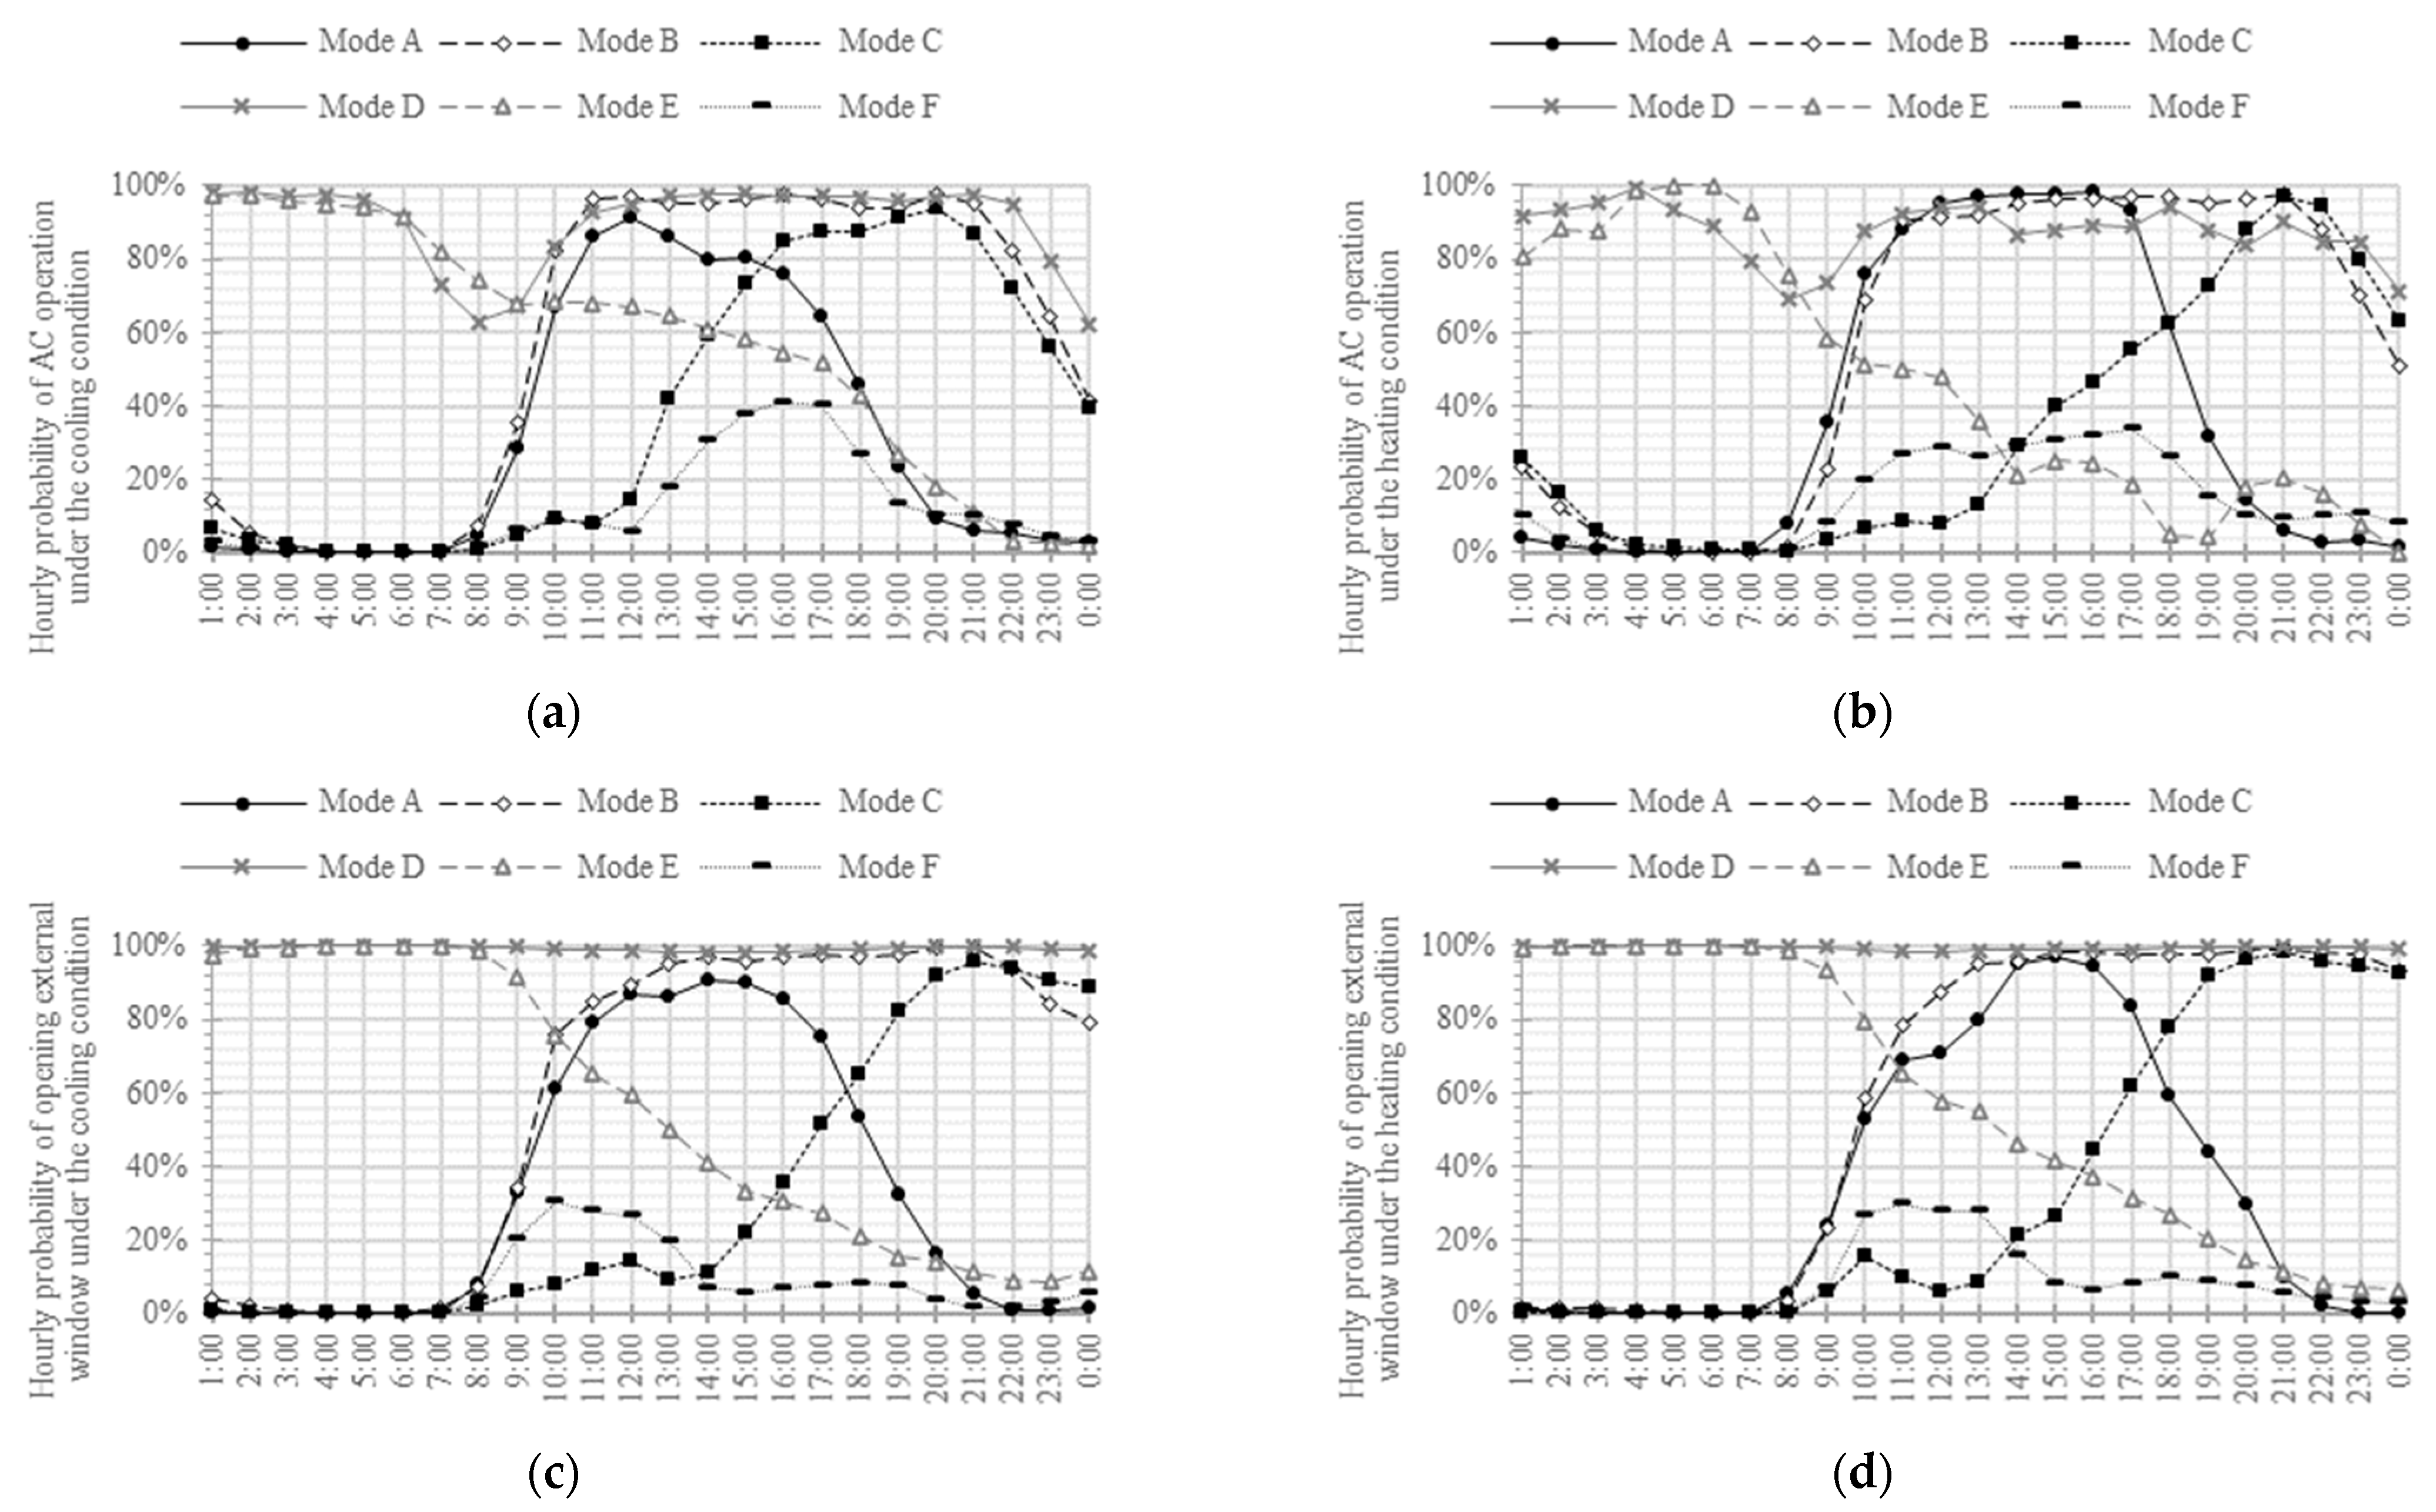
| M0 | Stochastic behavioural pattern | A default pattern, reflecting the actual operational characteristics of NV according to measurements. | The sample NV sequence should be referred to Figure 8b,d. |
| Fixed behavioural pattern | For , and . For , and . | On day D, the daily NV sequence is (0,0,0,0,0,0,0,1,1,1,1,1,1,1,1,1,1,1,0,0,0,0,0,0). | |
| M1 | For , . For , . | On day D, the daily NV sequence is (0,0,0,0,0,0,0,0,1,0,0,0,0,0,0,0,0,0,0,0,0,0,0,0). | |
| M2 | For , . For , . | On day D, the daily NV sequence is (1,1,1,1,1,1,1,1,0,0,0,0,0,0,0,0,0,1,1,1,1,1,1,1). | |
| M3 | For , when , ; when , . | On day D, if the daily AC sequence is (0,0,0,0,0,0,0,0,1,1,1,1,0,0,1,1,1,1,0,0,0,0,0,0), then the daily NV sequence is (1,1,1,1,1,1,1,1,0,0,0,0,1,1,0,0,0,0,1,1,1,1,1,1). | |
| M4 | For , . For , when , ; when , . | On day D, if the daily AC sequence is (0,0,0,0,0,0,0,0,1,1,1,1,0,0,1,1,1,1,1,1,0,0,0,0), then the daily NV sequence is (1,1,1,1,1,1,1,1,0,0,0,0,0,0,0,0,0,0,0,0,1,1,1,1). | |
| Code | Initial Influencing Factor | Unit | Range of Values | |
|---|---|---|---|---|
| 1 | Building orientation (northwards deflection) | [−90, 90] | ||
| 2 | External wall thermal insulation | - | {S,E,I,C} [Note 1] | |
| 3 | Heat transfer coefficient of | the external wall | W/(m2·K) | [0.15, 2.50] |
| 4 | the roof | W/(m2·K) | [0.15, 3.00] | |
| 5 | the internal wall | W/(m2·K) | [0.60, 5.00] | |
| 6 | the floor slab | W/(m2·K) | [0.60, 4.50] | |
| 7 | the external window | W/(m2·K) | [2.20, 6.40] | |
| 8 | Solar heat gain coefficient of the external window | - | [0.10, 0.85] | |
| 9–12 | Window-to-wall ratio of the east/south/west/north elevation | - | [0, 1] | |
| 13–16 | Sun-shading structure of the east/south/west/north elevation | - | {H,HS,HSL,L} [Note 2] | |
| 17–20 | Shading length of the east/south/west/north elevation | m | [0, 1.8] | |
| 21 | Air permeability performance | ac/h | [0, 2] | |
| 22 | People density in individual offices | m2/person | [12, 24] | |
| 23 | People density in collective offices | m2/person | [3, 9] | |
| 24 | Power density of lighting | W/m2 | [6, 18] | |
| 25 | Power density of equipment | W/person | [0, 300] | |
| 26 | Cooling setpoint temperature | °C | [18, 30] | |
| 27 | Heating setpoint temperature | °C | [18, 30] | |
| 28 | Coupling pattern between NV and AC operation | - | {M0, M1, M2, M3, M4} [Note 3] | |
| Code | Important Influencing Factor | Relative Importance | Importance Evaluation |
|---|---|---|---|
| 1 | Cooling setpoint temperature | 100.0% | Type A—Critical factors |
| 2 | Air permeability performance | 67.0% | |
| 3 | Heating setpoint temperature | 46.6% | |
| 4 | People density of collective offices | 17.3% | |
| 5 | Coupling pattern between NV and AC operation | 7.8% | Type B—Significant factors |
| 6 | SHGC of the external window | 4.5% |
| Code | Important Influencing Factor | Relative Importance | Importance Evaluation |
|---|---|---|---|
| 1 | Air permeability performance | 100.0% | Type A—Critical factors |
| 2 | Cooling setpoint temperature | 82.2% | |
| 3 | Heating setpoint temperature | 43.8% | |
| 4 | People density of collective offices | 17.1% | |
| 5 | SHGC of the external window | 4.5% | Type B—Significant factors |
| 6 | Heat transfer coefficient of the external wall | 4.3% | |
| 7 | Heat transfer coefficient of the external window | 3.6% |
| The Case Building | Original Values | Optimal Values | ||
| Important influencing factors | Cooling setpoint temperature | Mid-summer | 25 °C | 25 °C |
| Early and late summer | 25 °C | 25 °C | ||
| Early autumn and late spring | 25 °C | 25 °C | ||
| Heating setpoint temperature | Mid-winter | 26 °C | 24 °C | |
| Early and late winter | 26 °C | 25 °C | ||
| Early spring and late autumn | 26 °C | 24 °C | ||
| Air permeability performance | 0.7 ac/h | 0.2 ac/h | ||
| People density of collective offices | 6 m2/person | 6 m2/person | ||
| Coupling pattern between NV and AC operation | Mid-summer | M0 | M4 | |
| Early and late summer | M0 | M3 | ||
| Early autumn and late spring | M0 | M3 | ||
| Mid-winter | M0 | M1 | ||
| Early and late winter | M0 | M1 | ||
| Early spring and late autumn | M0 | M1 | ||
| SHGC of the external window | 0.819 | 0.3 | ||
| Simulated AC energy consumption | AC energy consumption for cooling | 28.10 kWh/(m2·a) | 23.75 kWh/(m2·a) | |
| AC energy consumption for heating | 24.26 kWh/(m2·a) | 10.28 kWh/(m2·a) | ||
| Total AC energy consumption | 52.37 kWh/(m2·a) | 34.03 kWh/(m2·a) | ||
| Simulated thermal comfort | Uncomfortable hours as a percentage of the duration of AC operation | 51.49% | 26.78% | |
Disclaimer/Publisher’s Note: The statements, opinions and data contained in all publications are solely those of the individual author(s) and contributor(s) and not of MDPI and/or the editor(s). MDPI and/or the editor(s) disclaim responsibility for any injury to people or property resulting from any ideas, methods, instructions or products referred to in the content. |
© 2023 by the authors. Licensee MDPI, Basel, Switzerland. This article is an open access article distributed under the terms and conditions of the Creative Commons Attribution (CC BY) license (https://creativecommons.org/licenses/by/4.0/).
Share and Cite
Wu, J.; Chen, S.; Ying, X.; Shu, J. Influencing Factors on Air Conditioning Energy Consumption of Naturally Ventilated Research Buildings Based on Actual HVAC Behaviours. Buildings 2023, 13, 2710. https://doi.org/10.3390/buildings13112710
Wu J, Chen S, Ying X, Shu J. Influencing Factors on Air Conditioning Energy Consumption of Naturally Ventilated Research Buildings Based on Actual HVAC Behaviours. Buildings. 2023; 13(11):2710. https://doi.org/10.3390/buildings13112710
Chicago/Turabian StyleWu, Jiajing, Shuqin Chen, Xiaoyu Ying, and Jinbiao Shu. 2023. "Influencing Factors on Air Conditioning Energy Consumption of Naturally Ventilated Research Buildings Based on Actual HVAC Behaviours" Buildings 13, no. 11: 2710. https://doi.org/10.3390/buildings13112710