

Analysis and Optimized Location Selection of Comprehensive Green Space Supply in the Central Urban Area of Hefei Based on GIS

Abstract
:1. Introduction
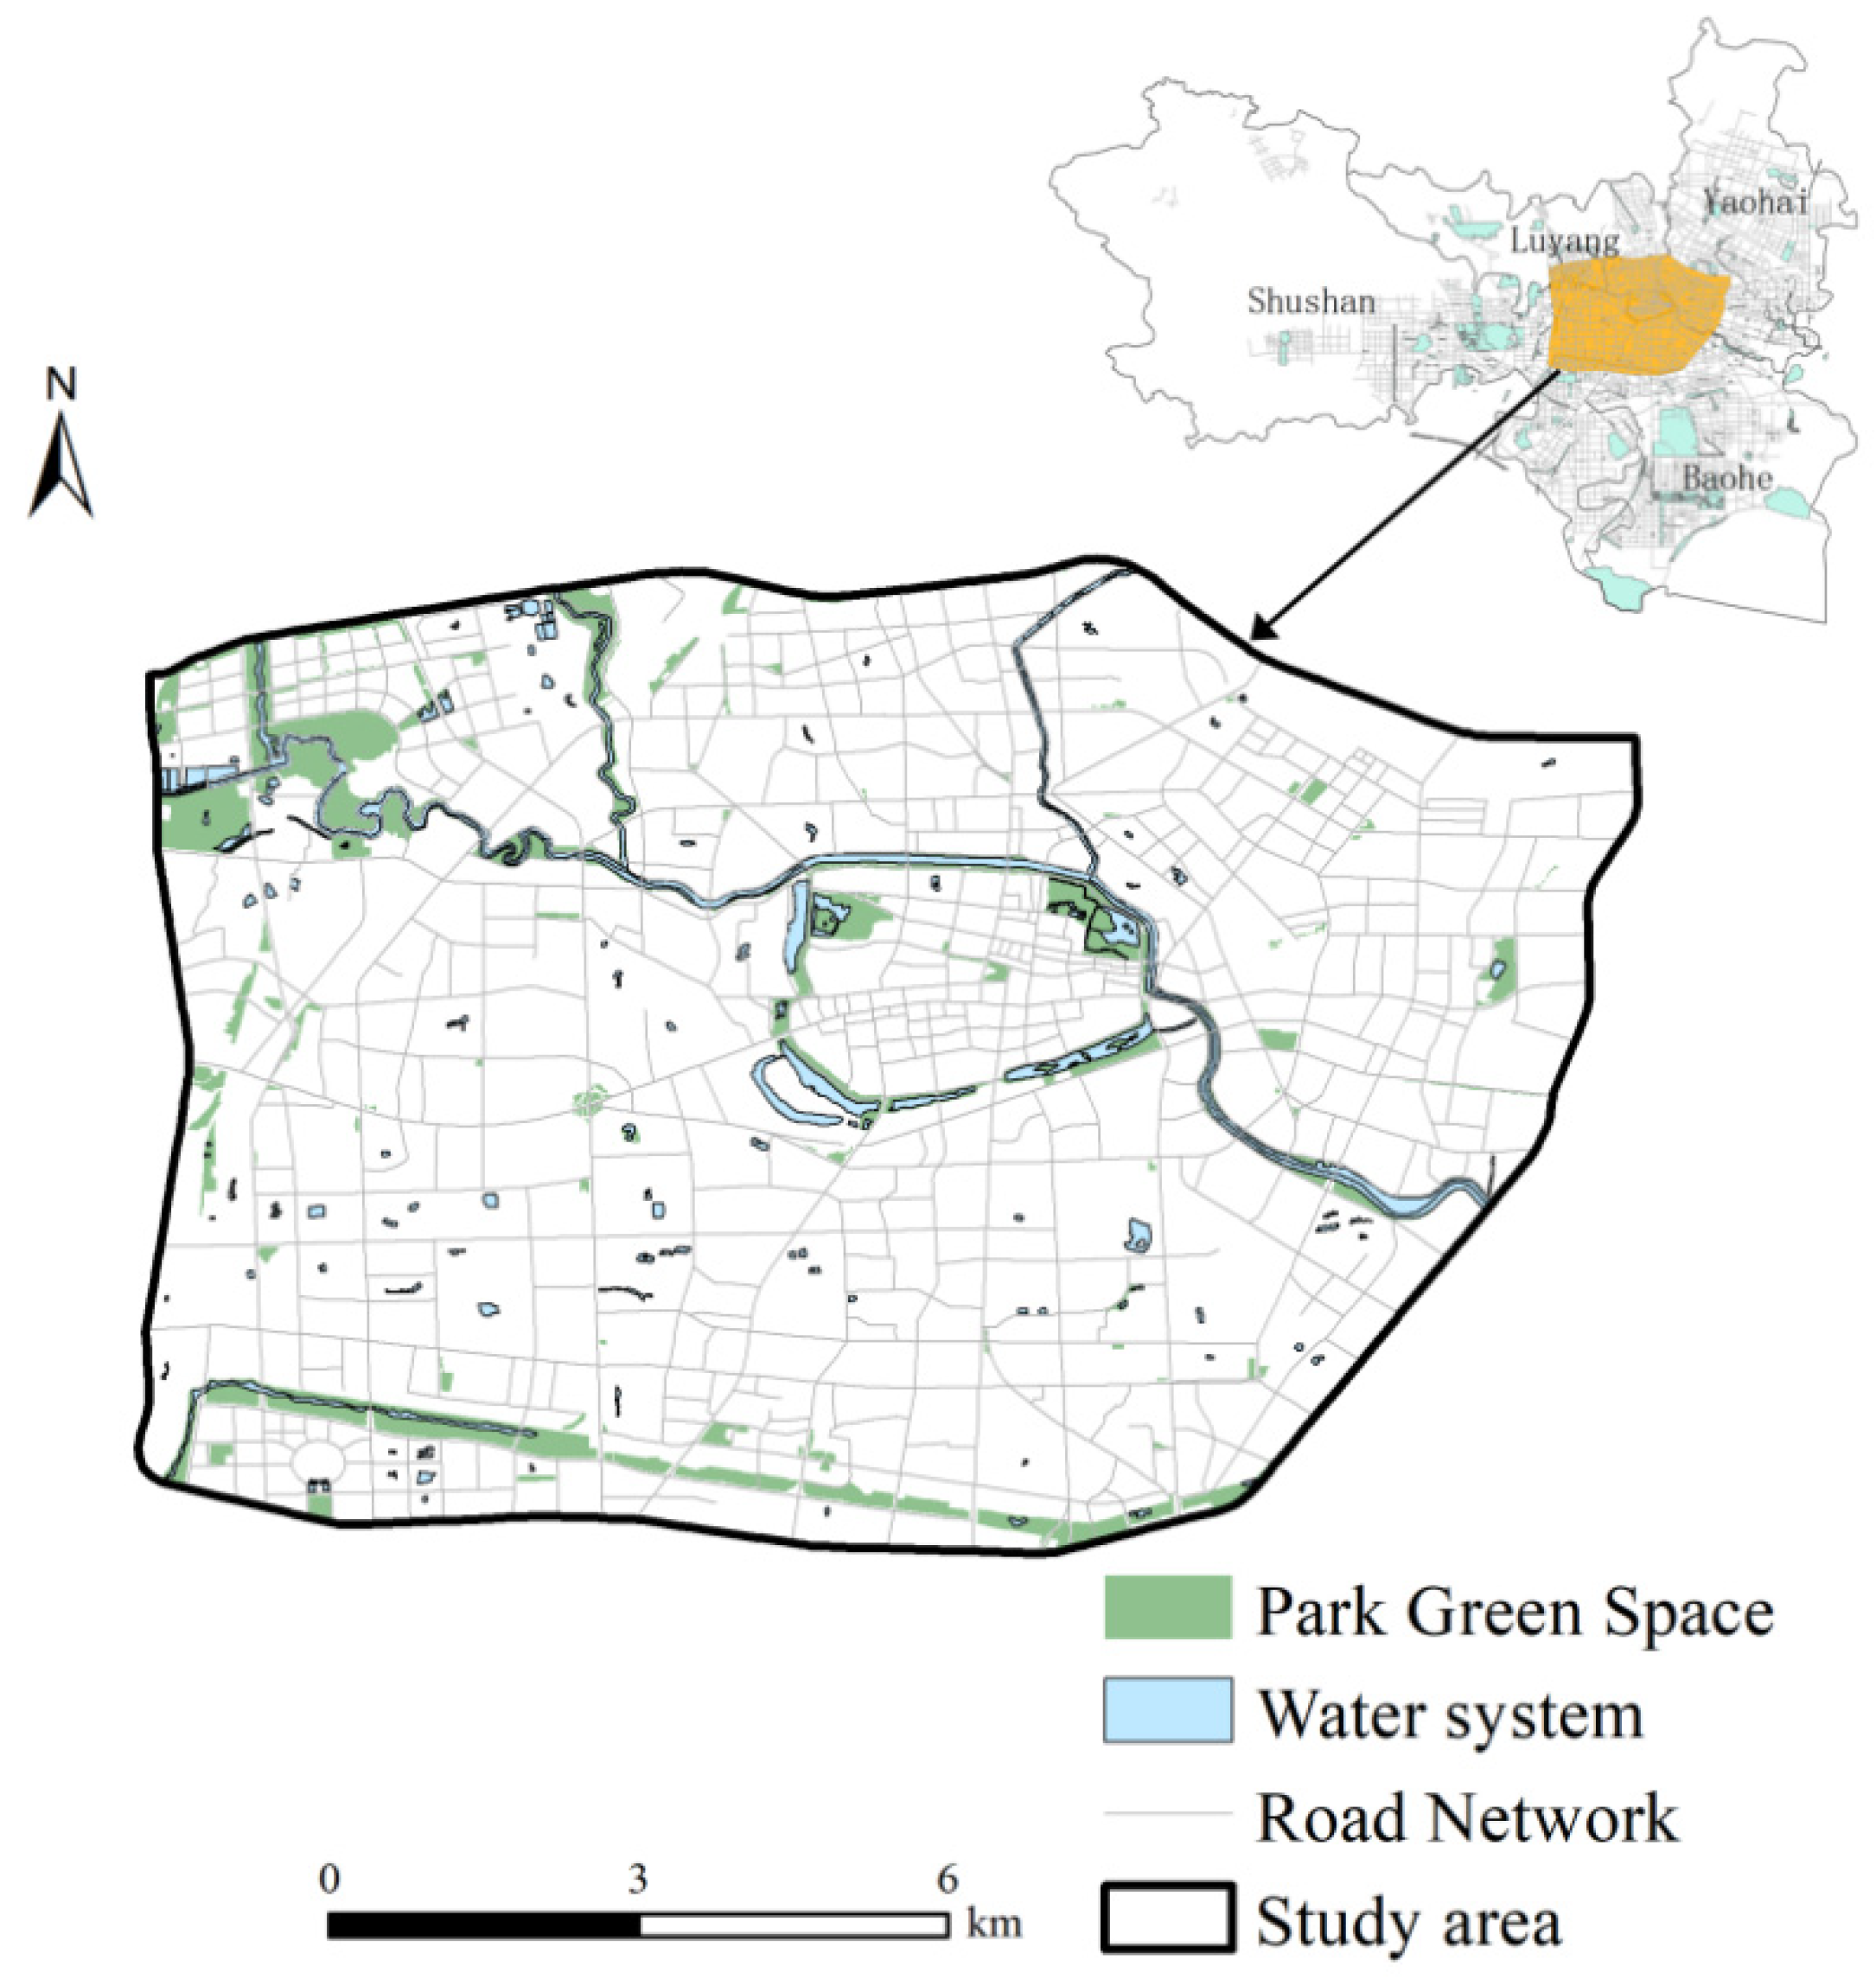
2. Overview of the Research Area
3. Research Methodology
3.1. The Fundamental Data and Its Processing
3.1.1. The Quantity and Spatial Distribution of Park Green Spaces
3.1.2. Road Network Data
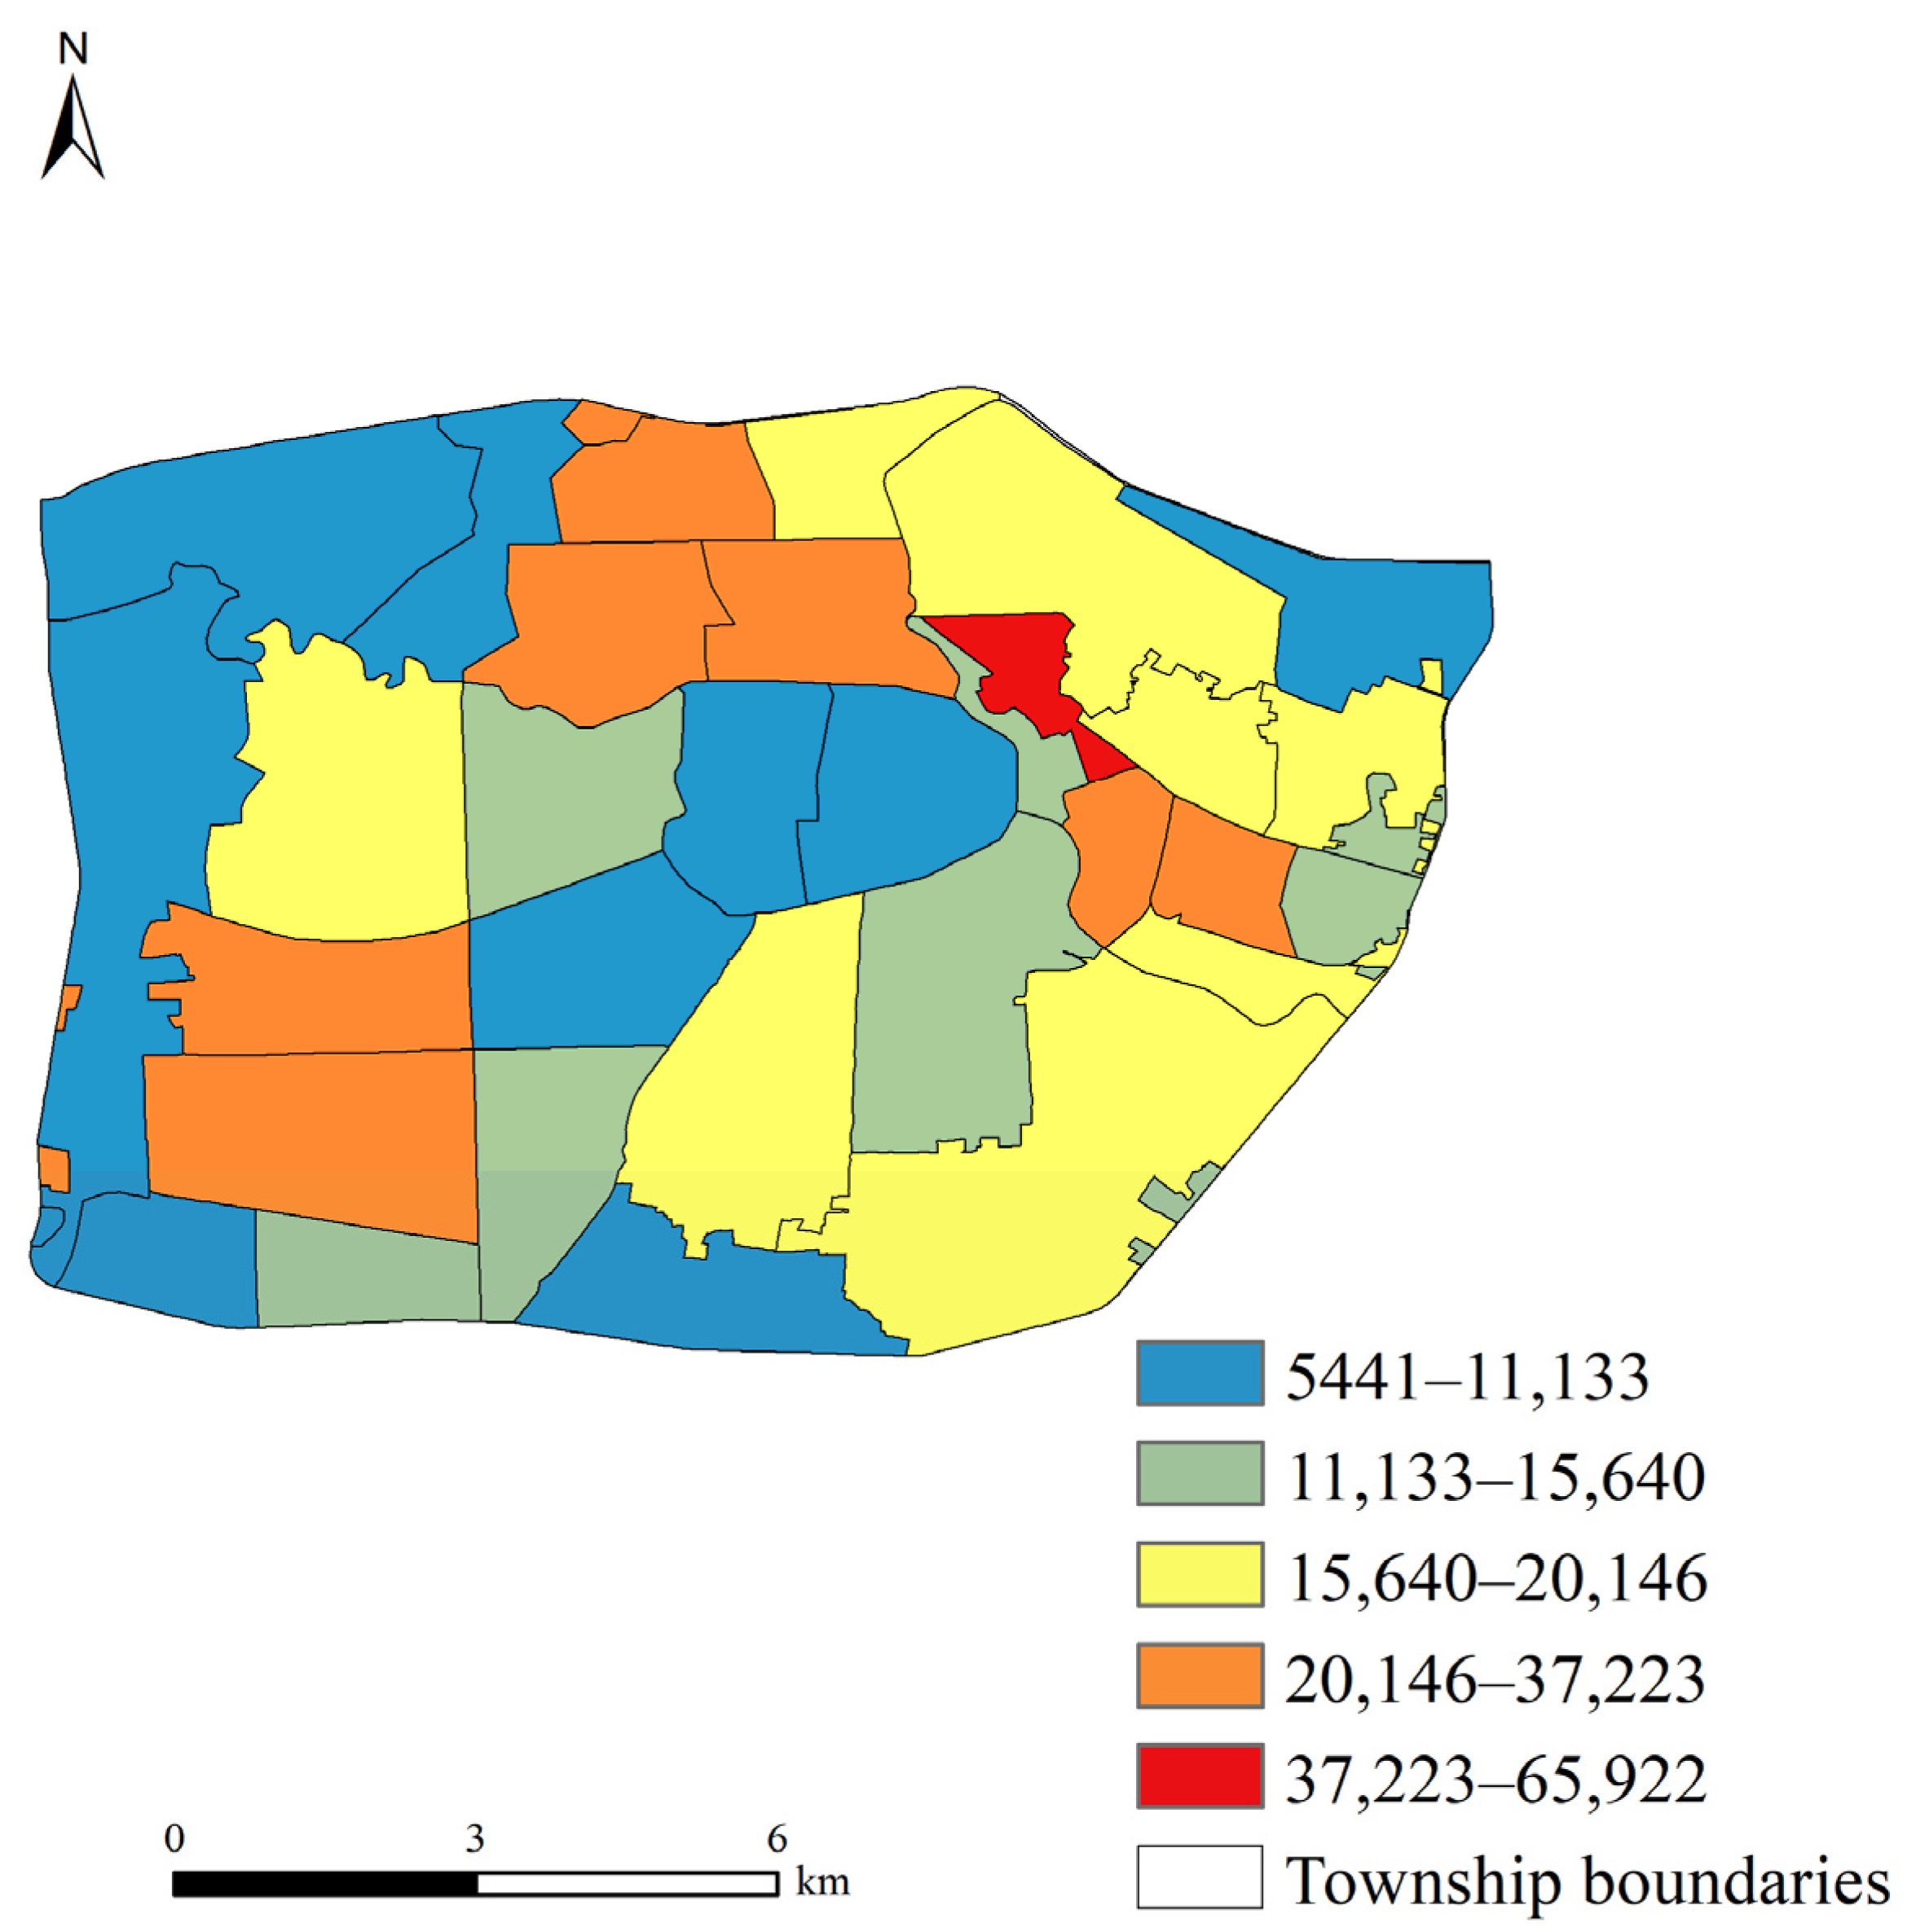
3.1.3. Population Data
3.2. Research Methods
3.2.1. Entropy Weight Method
- (1)
- Standardized raw data matrix.
- (2)
- Calculating entropy value.
- (3)
- Determining weights
3.2.2. Principal Component Analysis Method
3.2.3. Gaussian Two-Step Moving Search Method
3.2.4. Coupling Coordination Analysis
3.2.5. Particle Swarm Optimization
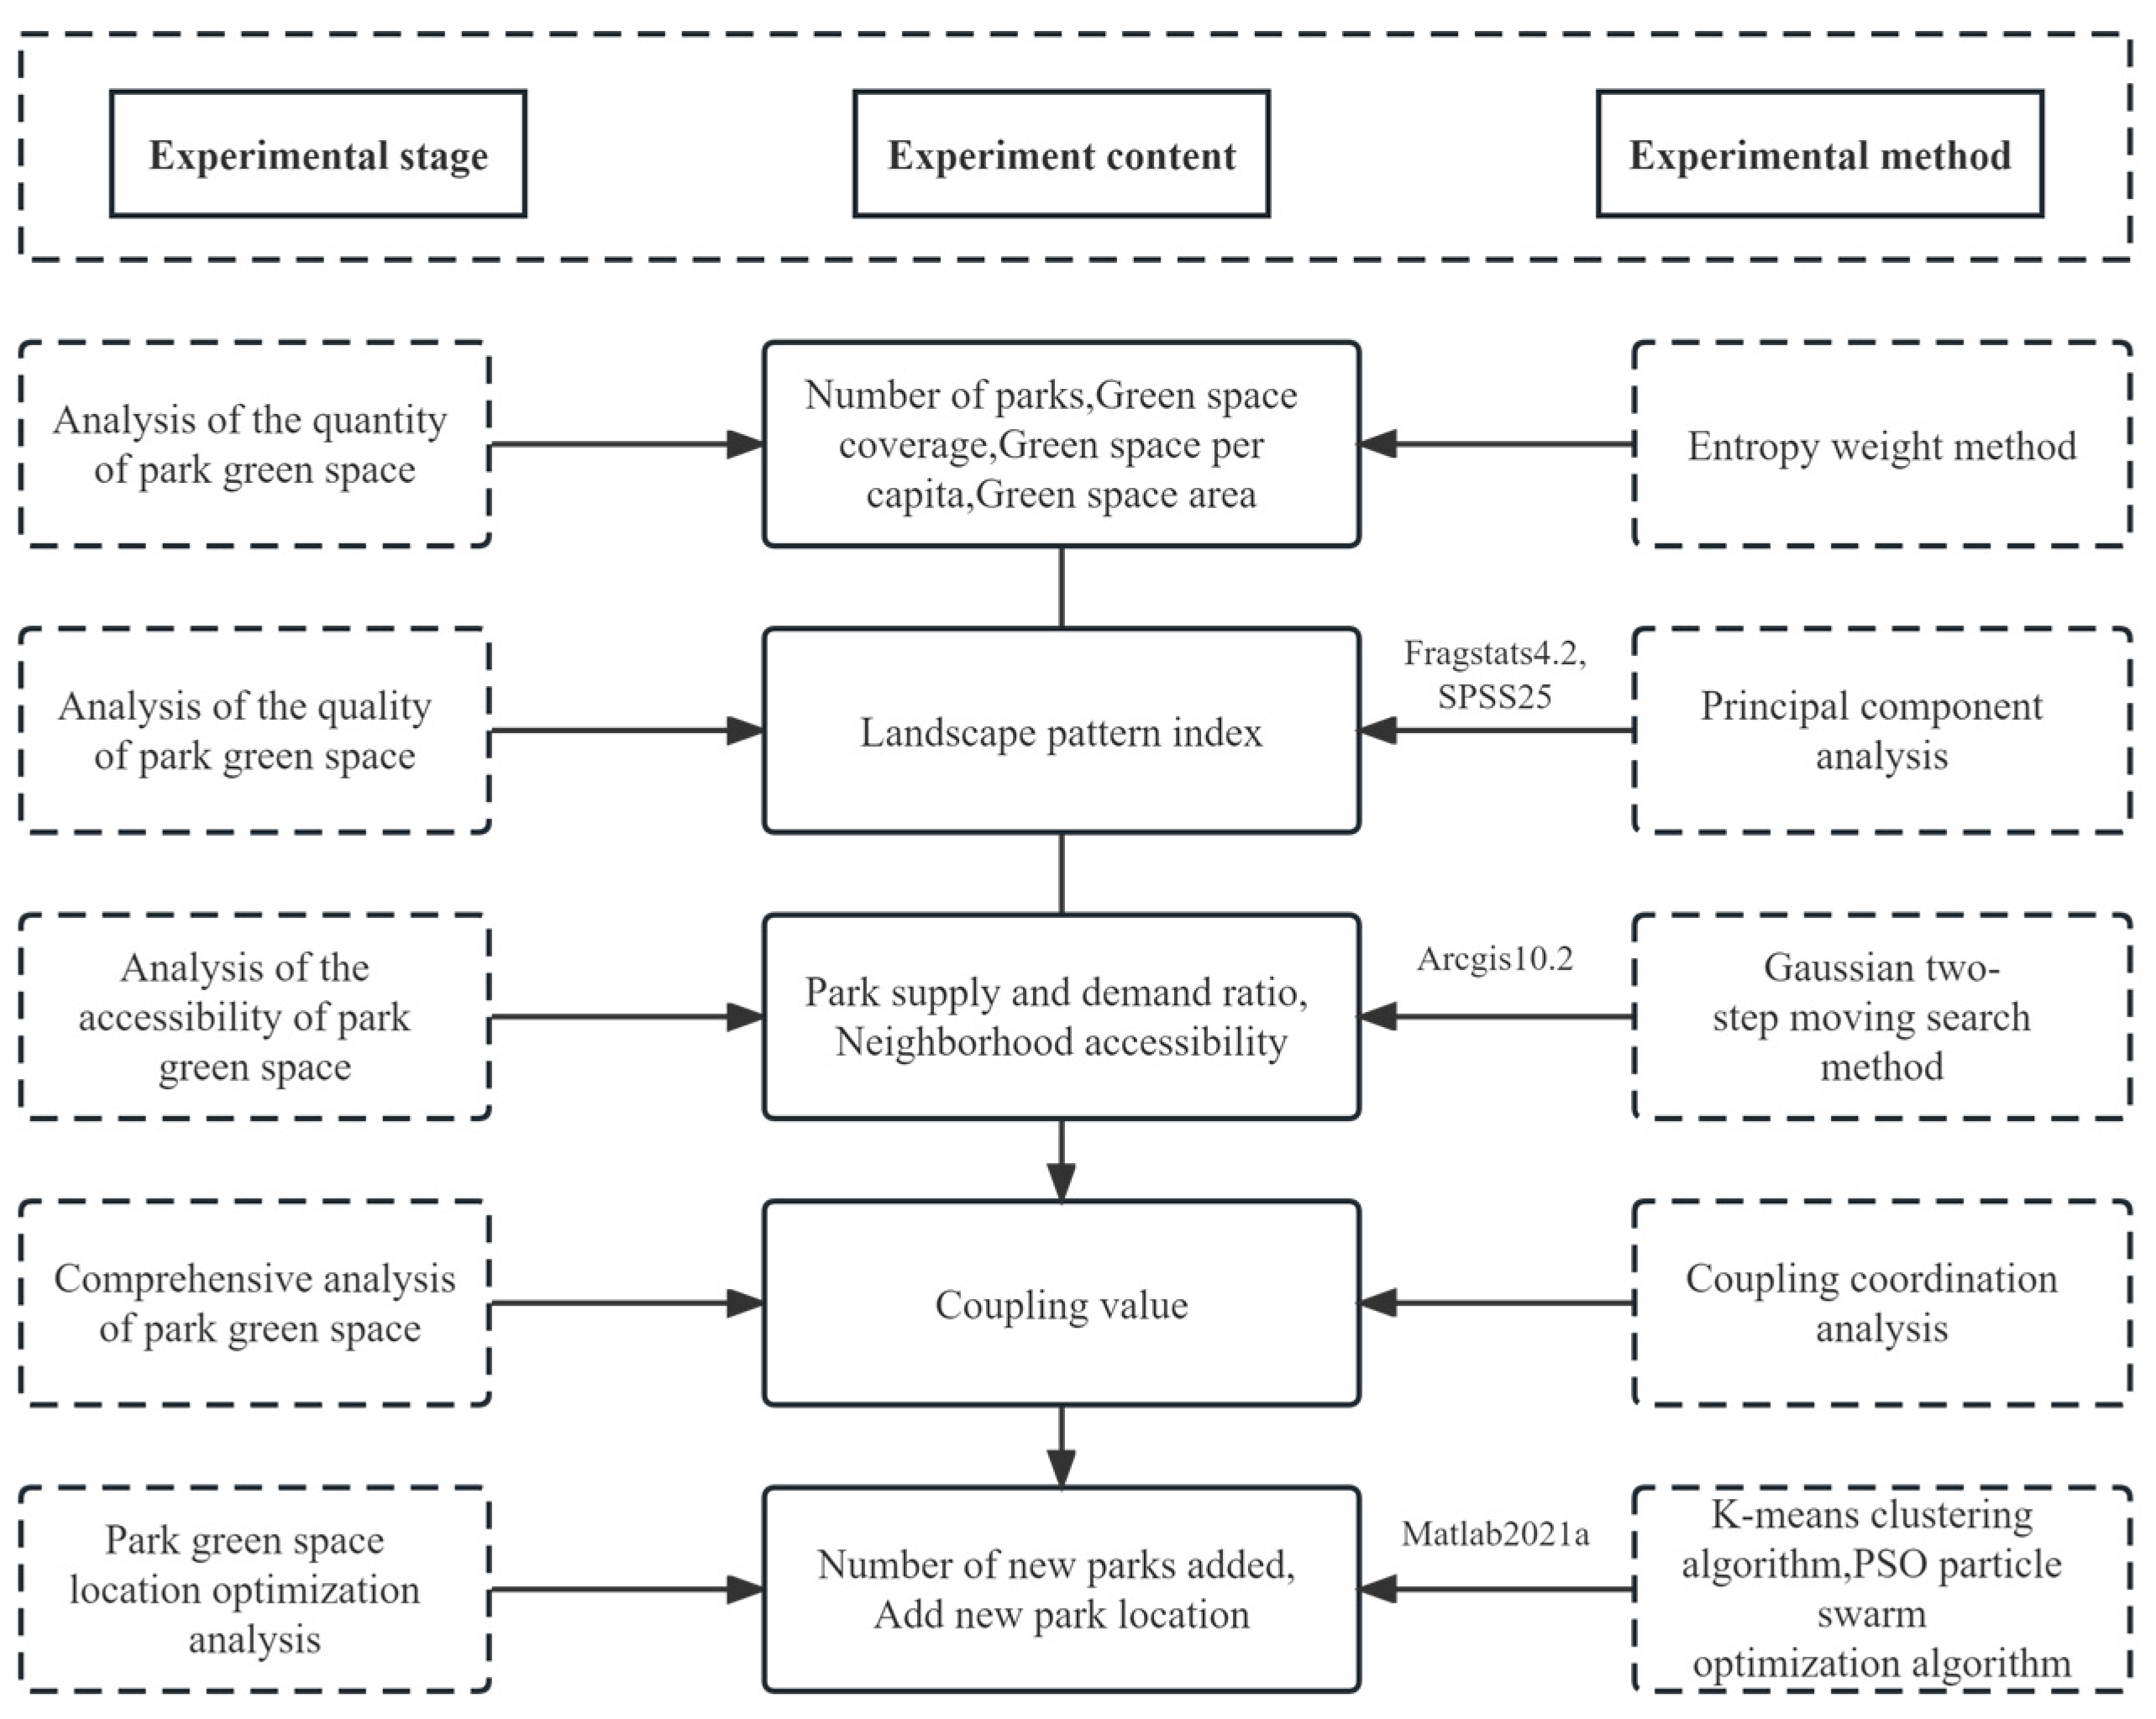
3.3. Technical Flow Chart
4. Results and Analysis
4.1. Analysis of the Quantity of Park Green Spaces Supplied
4.2. Analysis of the Supply Quality of Park Green Space
4.3. Accessibility Analysis of Park Green Space
4.3.1. Overall Analysis
4.3.2. Street Analysis
4.4. Analysis of Comprehensive Supply of Park Green Space
- -
- Yaohai District = 0.301;
- -
- Luyang District = 0.564;
- -
- Shushan District = 0.269;
- -
- Baohe District = 0.314.
4.5. Optimization Analysis of the Site Selection for Park Green Spaces
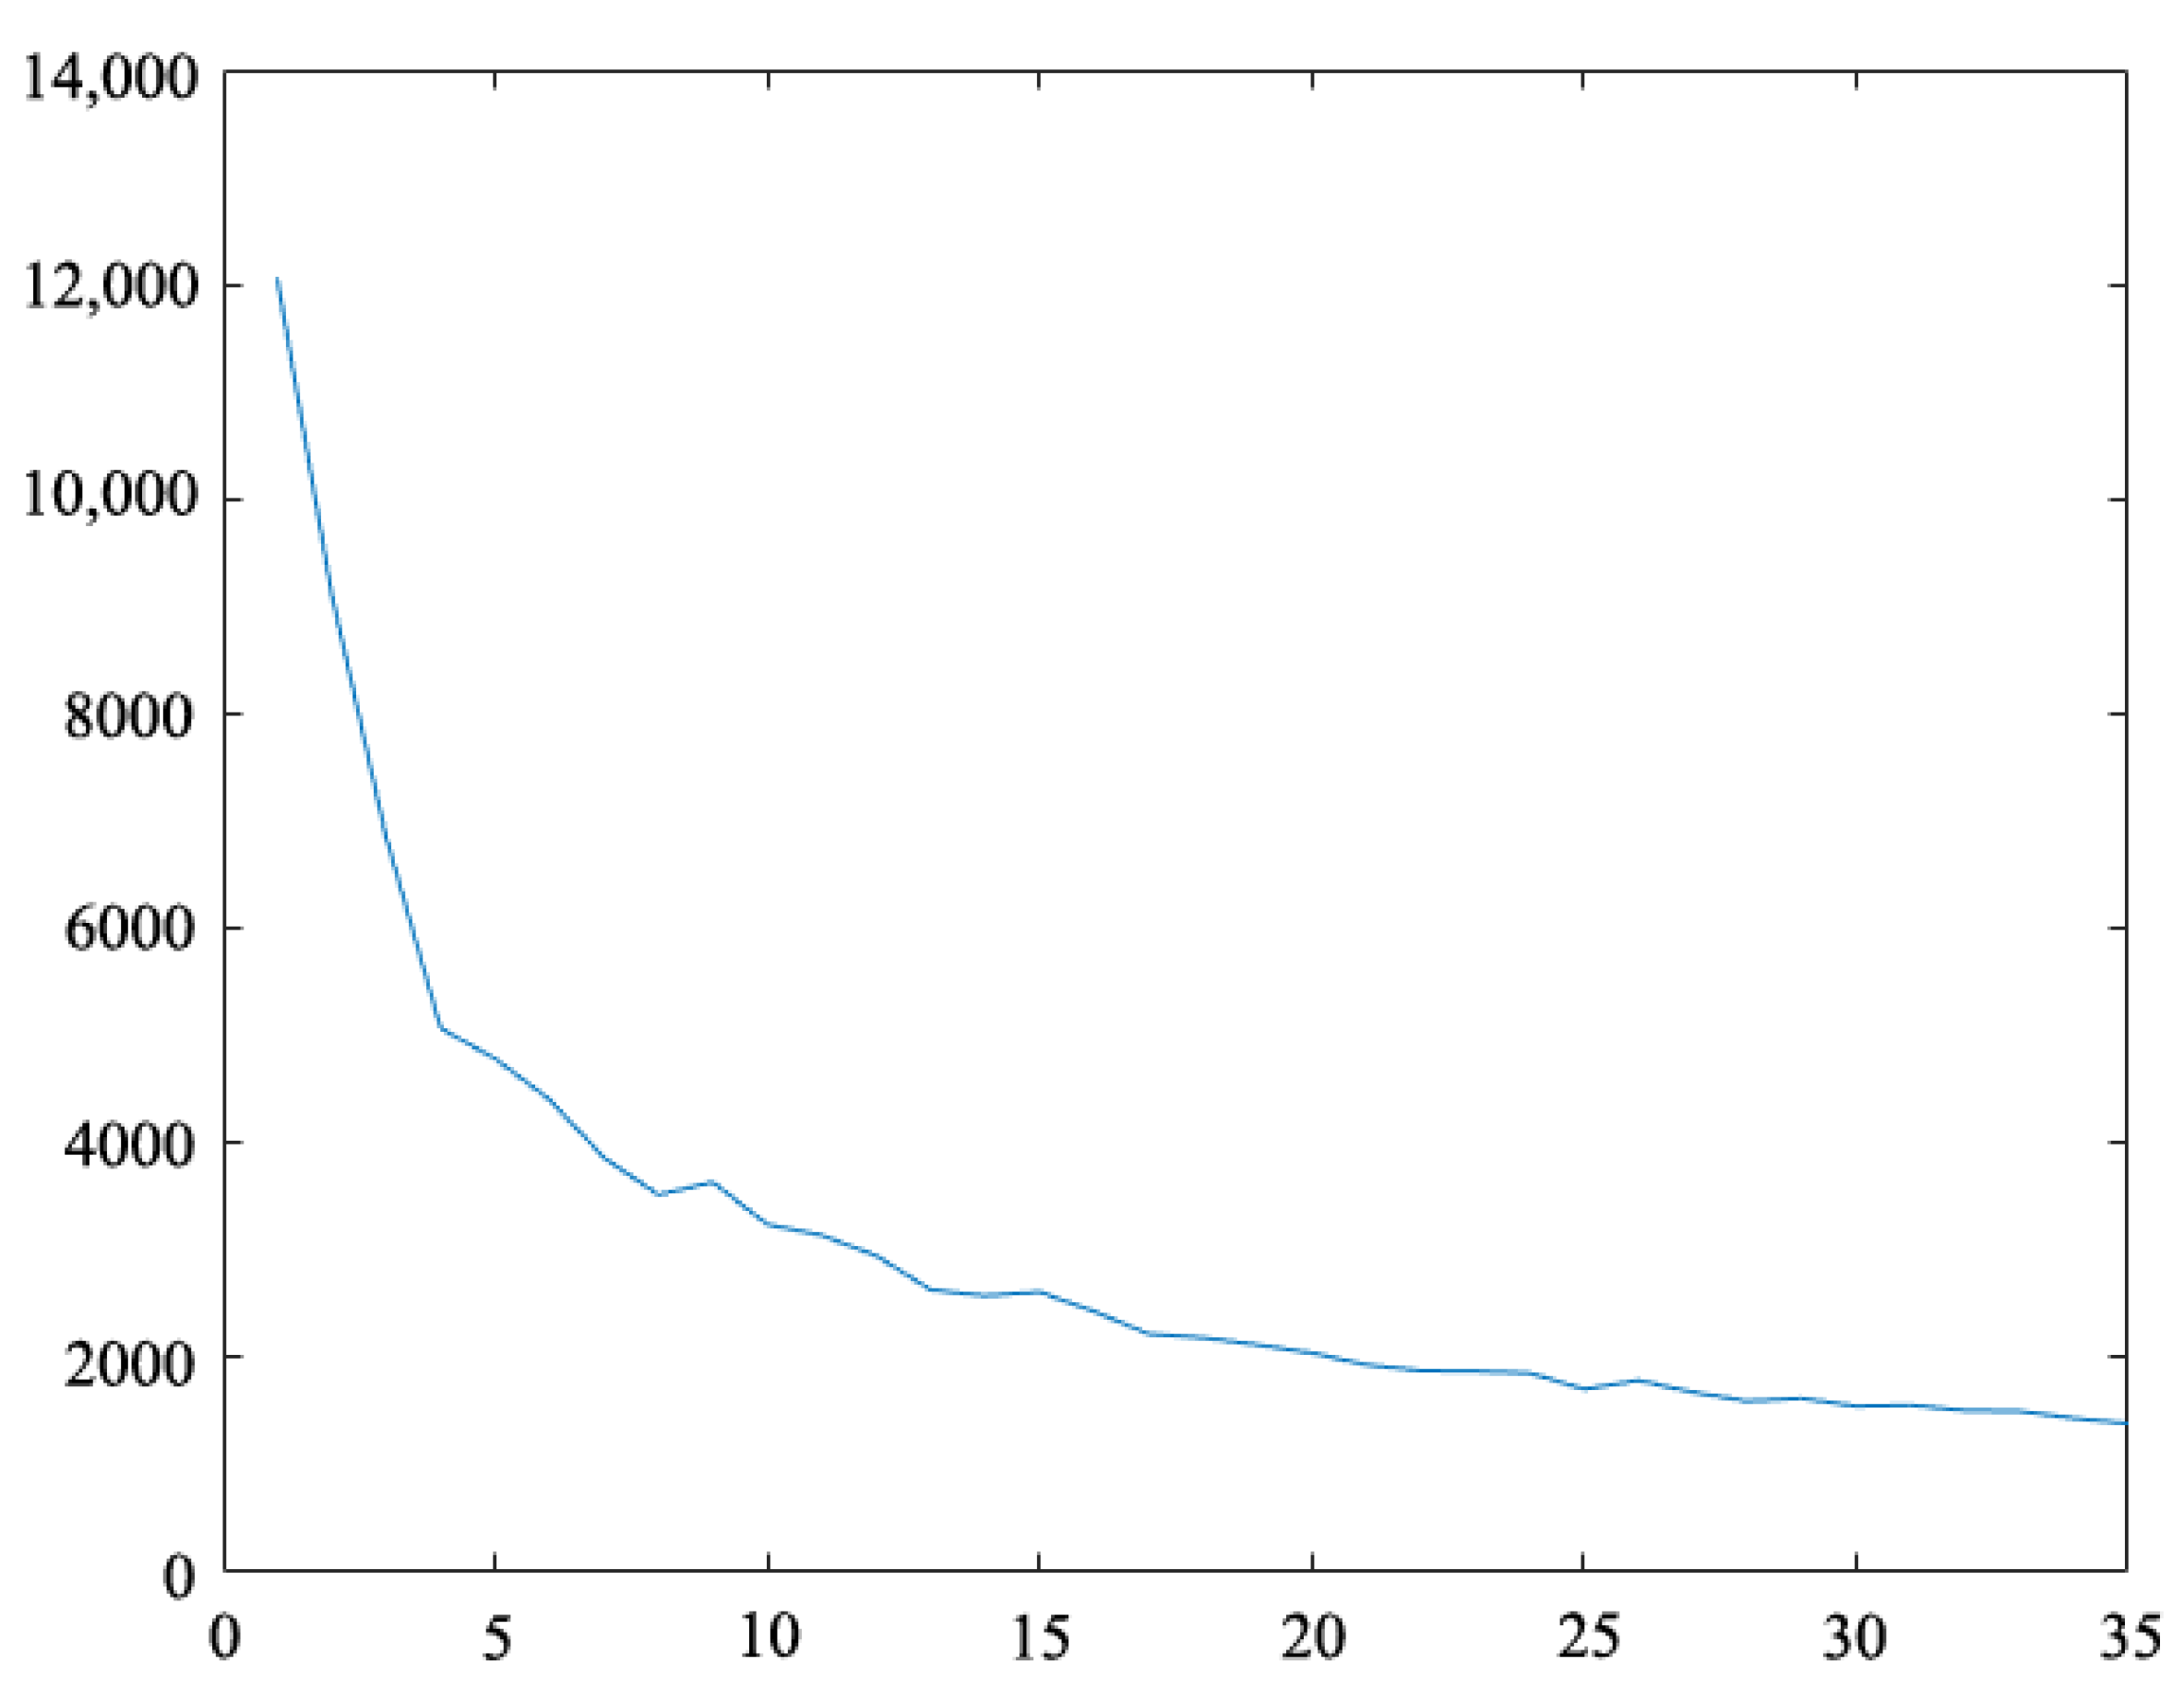
4.5.1. Determine the Number of New Parks Based on k-Means Clustering Algorithm
4.5.2. Solving the Problem of Park Green Space Location Selection Based on Particle Swarm Optimization Algorithm
5. Conclusions and Discussion
- (1)
- In the central urban area of Hefei city, the accessibility of parks and green spaces displays a spatial pattern characterized by higher levels in the south and west and lower levels in the north and east. Notably, only the Luyang district exhibits a period of antagonistic coupling in its comprehensive supply level of parks and green spaces, achieved through a benign resonance coupling of park and green space quantity, quality, and accessibility. The remaining three areas of the park have a relatively lagging or irrelevant state in terms of quantity, quality, and accessibility of green spaces. When optimizing the urban green space structure in the future, it is not only about increasing the number of parks, but also about optimizing the quality and accessibility of park green spaces.
- (2)
- The distribution of green spaces, the density of greenery, and the population density play a crucial role in determining the accessibility of green spaces in a particular region. Urban areas that are densely populated and have limited green resources tend to have lower accessibility to green space. This is due to the imbalance between the park green space layout and population distribution, which leads to spatial differences in accessibility. As a result, a significant portion of the population residing in the city center is unable to fulfill their green space needs. To improve the overall number of green spaces in the area, it is essential to focus on the spatial configuration of park green spaces.
- (3)
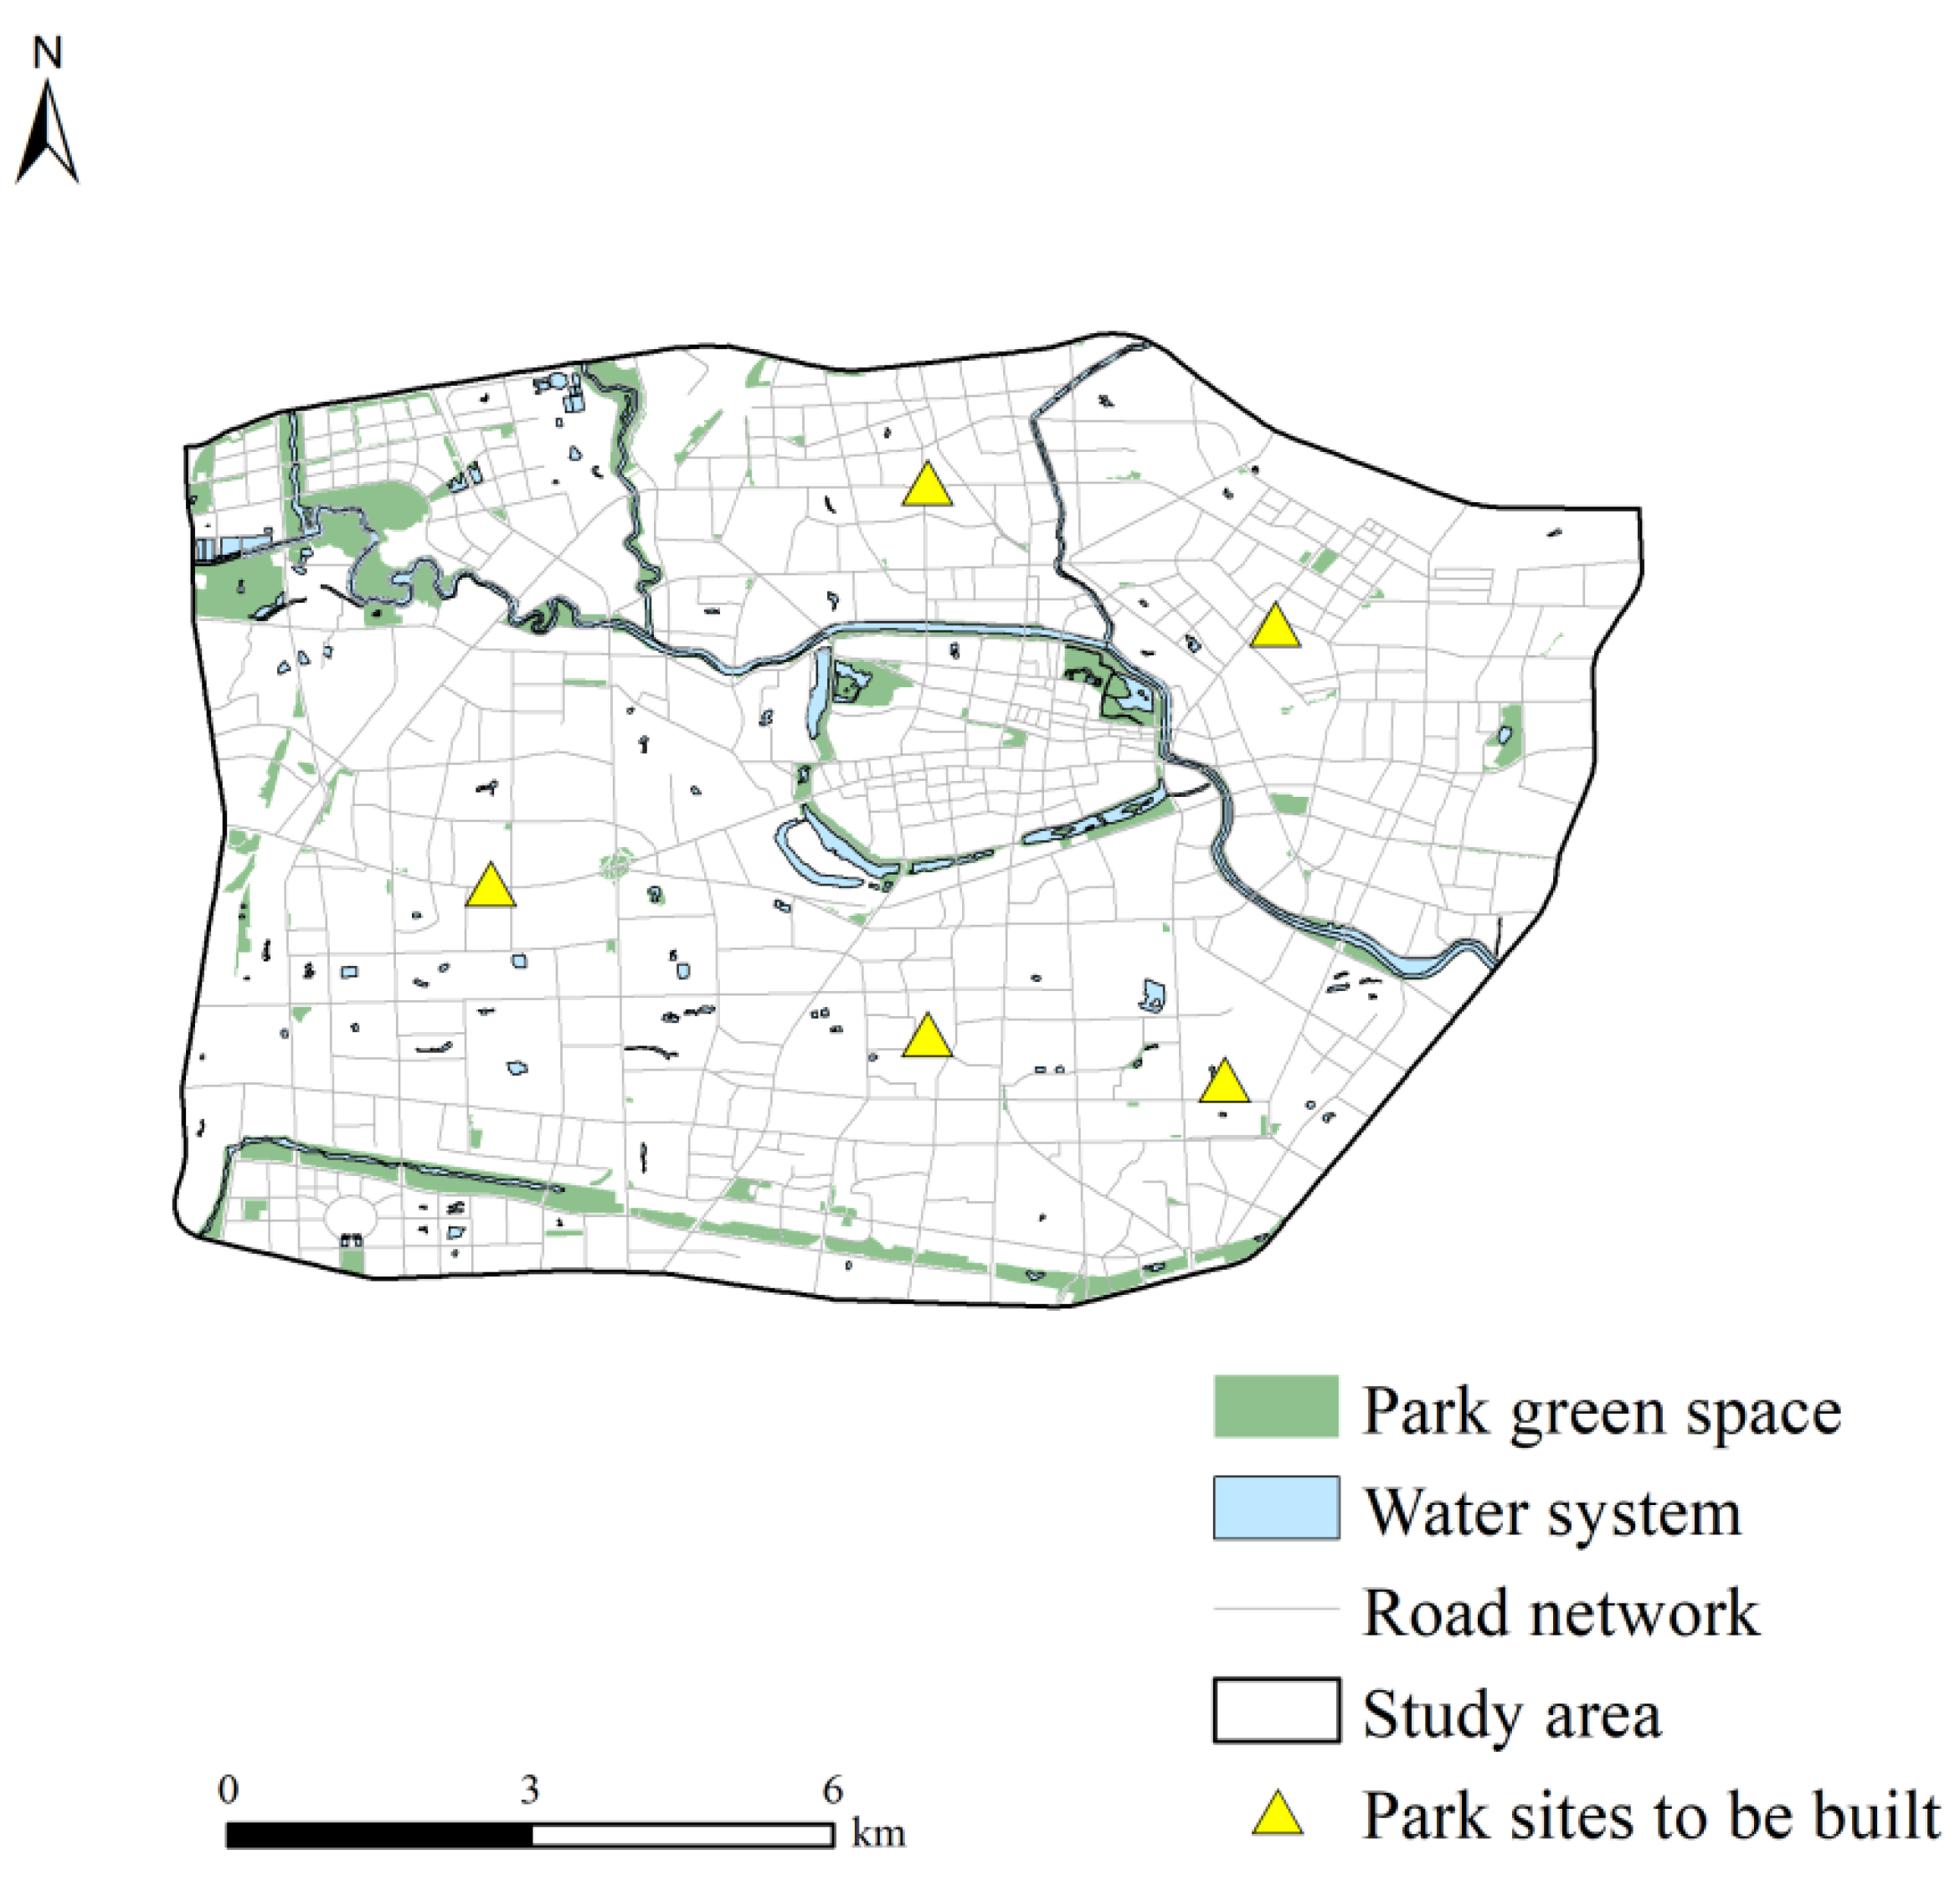
- According to the outcomes of the feasibility analysis, the optimized park locations demonstrate a substantial level of dependability. Of the chosen sites, three are situated in regions characterized by high-density structures and a scarcity of land resources. As such, the proposal for these sites is to enhance the urban green belts surrounding them and to establish compact parks on unused land. The remaining two sites, on the other hand, are endowed with more plentiful land resources and are enclosed by residential areas. Consequently, it is advised that these sites be integrated with the present urban green landscape to create novel parks and green spaces.
Author Contributions
Funding
Data Availability Statement
Conflicts of Interest
References
- Coombes, E.; Jones, A.P.; Hillsdon, M. The relationship of physical activity and overweight to objectively measured green space accessibility and use. Soc. Sci. Med. 2010, 70, 816–822. [Google Scholar] [CrossRef] [PubMed]
- Kong, F.; Yin, H.; Nakagoshi, N. Using GIS and landscape metrics in the hedonic price modeling of the amenity value of urban green space: A case study in Jinan City, China. Landsc. Urban Plan. 2007, 79, 240–252. [Google Scholar] [CrossRef]
- Chen, X.; Su, Y.; Li, D.; Huang, G.; Chen, W.; Chen, S. Study on the cooling effects of urban parks on surrounding environments using Landsat TM data: A case study in Guangzhou, southern China. Int. J. Remote Sens. 2012, 33, 5889–5914. [Google Scholar] [CrossRef]
- Bekele, S.E. Parkland agroforestry of Ethiopia; key to production, productivity, biodiversity conservation and climate change mitigation: A review. Open J. For. 2018, 8, 472. [Google Scholar] [CrossRef]
- Zhang, R.; Peng, S.; Sun, F.; Deng, L.; Che, Y. Assessing the social equity of urban parks: An improved index integrating multiple quality dimensions and service accessibility. Cities 2022, 129, 103839. [Google Scholar] [CrossRef]
- Wu, L.; Kim, S.K. Exploring the equality of accessing urban green spaces: A comparative study of 341 Chinese cities. Ecol. Indic. 2021, 121, 107080. [Google Scholar] [CrossRef]
- Chen, Q.; Hou, Y.; Wu, S. Assessment of Accessibility to Urban Parks in Shaoxing City from the Perspective of Opportunity Equity. Sci. Geogr. Sin. 2016, 36, 375–383. [Google Scholar]
- Jian, I.Y.; Luo, J.; Chan, E.H.W. Spatial justice in public open space planning: Accessibility and inclusivity. Habitat Int. 2020, 97, 102122. [Google Scholar] [CrossRef]
- Wang, D.; Brown, G.; Liu, Y. The physical and non-physical factors that influence perceived access to urban parks. Landsc. Urban Plan. 2015, 133, 53–66. [Google Scholar] [CrossRef]
- Bai, H.; Wilhelm Stanis, S.A.; Kaczynski, A.T.; Besenyi, G.M. Perceptions of neighborhood park quality: Associations with physical activity and body mass index. Ann. Behav. Med. 2013, 45 (Suppl. S1), S39–S48. [Google Scholar] [CrossRef]
- Cojanu, V.; Dobre, R.; Pătru-Stupariu, I. The Accessibility Buffer—A Basic GIS Tool in Determining the Competitive Potential Index. Procedia Environ. Sci. 2012, 14, 237–246. [Google Scholar] [CrossRef]
- Yang, R.; Liu, Y.; Liu, Y.; Liu, H.; Gan, W. Comprehensive public transport service accessibility index—A new approach based on degree centrality and gravity model. Sustainability 2019, 11, 5634. [Google Scholar] [CrossRef]
- Östh, J.; Reggiani, A.; Galiazzo, G. Novel methods for the estimation of cost-distance decay in potential accessibility models. In Accessibility and spatial interaction; Edward Elgar: Cheltenham, UK, 2014; Volume 2, p. 15. [Google Scholar]
- Comber, A.; Brunsdon, C.; Green, E. Using a GIS-based network analysis to determine urban greenspace accessibility for different ethnic and religious groups. Landsc. Urban Plan. 2008, 86, 103–114. [Google Scholar] [CrossRef]
- McGrail, M.R.; Humphreys, J.S. Measuring spatial accessibility to primary care in rural areas: Improving the effectiveness of the two-step floating catchment area method. Appl. Geogr. 2009, 29, 533–541. [Google Scholar] [CrossRef]
- Kun, W.; Hao, S.; Xu, Y.; Xian, M.; Zhang, Q. Accessibility analysis of urban parks based on GIS. In Proceedings of the 2012 Fifth International Conference on Information and Computing Science, Liverpool, UK, 24–25 July 2012; pp. 56–59. [Google Scholar]
- Lu, N.; Li, J.; Yan, H.; Shi, T.; Li, Y. Analysis on accessibility of urban park green space: The case study of Shenyang Tiexi District. Yingyong Shengtai Xuebao 2014, 25, 2951–2958. [Google Scholar] [PubMed]
- Hu, M.X. Applications of GIS-based accessibility and spatial autocorrelation analysis in the green space system planning—A case study of Jiangyin. Chin. Landsc. Archit. 2010, 9, 20–24. [Google Scholar]
- Wu, H.; Liu, L.; Yu, Y.; Peng, Z. Evaluation and planning of urban green space distribution based on mobile phone data and two-step floating catchment area method. Sustainability 2018, 10, 214. [Google Scholar] [CrossRef]
- Chen, X.; Jia, P. A comparative analysis of accessibility measures by the two-step floating catchment area (2SFCA) method. Int. J. Geogr. Inf. Sci. 2019, 33, 1739–1758. [Google Scholar] [CrossRef]
- Hu, S.; Song, W.; Li, C.; Lu, J. A multi-mode Gaussian-based two-step floating catchment area method for measuring accessibility of urban parks. Cities 2020, 105, 102815. [Google Scholar] [CrossRef]
- Li, Y.; Xie, Y.; Sun, S.; Hu, L. Evaluation of Park Accessibility Based on Improved Gaussian Two-Step Floating Catchment Area Method: A Case Study of Xi’an City. Buildings 2022, 12, 871. [Google Scholar] [CrossRef]
- Li, X.; Huang, Y.; Ma, X. Evaluation of the accessible urban public green space at the community-scale with the consideration of temporal accessibility and quality. Ecol. Indic. 2021, 131, 108231. [Google Scholar] [CrossRef]
- Wolch, J.R.; Byrne, J.; Newell, J.P. Urban green space, public health, and environmental justice: The challenge of making cities ‘just green enough’. Landsc. Urban Plan. 2014, 125, 234–244. [Google Scholar] [CrossRef]
- Liu, B.; Tian, Y.; Guo, M.; Tran, D.; Alwah, A.A.Q.; Xu, D. Evaluating the disparity between supply and demand of park green space using a multi-dimensional spatial equity evaluation framework. Cities 2022, 121, 103484. [Google Scholar] [CrossRef]
- Alessandro, R. A complex landscape of inequity in access to urban parks: A literature review. Landsc. Urban Plan. 2016, 153, 160–169. [Google Scholar]
- Rigolon, A. Parks and young people: An environmental justice study of park proximity, acreage, and quality in Denver, Colorado. Landsc. Urban Plan. 2017, 165, 73–83. [Google Scholar] [CrossRef]
- Li, Y.Y.; Ren, B.T.; Chen, Y.S.; Huang, L.C.; Sun, C.G. Multiscale spatiotemporal dynamics analysis of urban green space: Implications for green space planning in the rapid urbanizing Hefei City, China. Front. Ecol. Evol. 2022, 10, 998111. [Google Scholar] [CrossRef]
- CJJT 85-2017S; Standard for Classification of Urban Green Space. China Architecture & Building Press: Beijing, China, 2017.
- GBT51346-2019; Standard for Planning of Urban Green Space. China Architecture & Building Press: Beijing, China, 2019.
- Wang, Z.; Li, Z.; Cheng, H. The equity of urban park green space accessibility in large Chinese cities: A case study of Wuhan City. Prog. Geogr. 2022, 41, 621–635. [Google Scholar] [CrossRef]
- Zhu, Y.; Tian, D.; Yan, F. Effectiveness of entropy weight method in decision-making. Math. Probl. Eng. 2020, 2020, 3564835. [Google Scholar] [CrossRef]
- Delgado, A.; Romero, I. Environmental conflict analysis using an integrated grey clustering and entropy-weight method: A case study of a mining project in Peru. Environ. Model. Softw. 2016, 77, 108–121. [Google Scholar] [CrossRef]
- Sahoo, M.M.; Patra, K.C.; Swain, J.B.; Khatua, K.K. Evaluation of water quality with application of Bayes’ rule and entropy weight method. Eur. J. Environ. Civ. Eng. 2017, 21, 730–752. [Google Scholar] [CrossRef]
- Paul, L.C.; Al Sumam, A. Face recognition using principal component analysis method. Int. J. Adv. Res. Comput. Eng. Technol. (IJARCET) 2012, 1, 135–139. [Google Scholar]
- Bro, R.; Smilde, A.K. Principal component analysis. Anal. Methods 2014, 6, 2812–2831. [Google Scholar] [CrossRef]
- Yang, Y.; Bao, W.; Liu, Y. Coupling coordination analysis of rural production-living-ecological space in the Beijing-Tianjin-Hebei region. Ecol. Indic. 2020, 117, 106512. [Google Scholar] [CrossRef]
- Li, W.; Wang, Y.; Xie, S.; Cheng, X. Coupling coordination analysis and spatiotemporal heterogeneity between urbanization and ecosystem health in Chongqing municipality, China. Sci. Total Environ. 2021, 791, 148311. [Google Scholar] [CrossRef] [PubMed]
- An, S.; Zhang, S.; Hou, H.; Zhang, Y.; Xu, H.; Liang, J. Coupling coordination analysis of the ecology and economy in the Yellow River Basin under the background of high-quality development. Land 2022, 11, 1235. [Google Scholar] [CrossRef]
- Wang, D.; Tan, D.; Liu, L. Particle swarm optimization algorithm: An overview. Soft Comput. 2018, 22, 387–408. [Google Scholar] [CrossRef]
- Venter, G.; Sobieszczanski-Sobieski, J. Particle swarm optimization. AIAA J. 2003, 41, 1583–1589. [Google Scholar] [CrossRef]
- Chen, Z.; Xu, B.; Devereux, B. Urban landscape pattern analysis based on 3D landscape models. Appl. Geogr. 2014, 55, 82–91. [Google Scholar] [CrossRef]
- Dadashpoor, H.; Azizi, P.; Moghadasi, M. Land use change, urbanization, and change in landscape pattern in a metropolitan area. Sci. Total Environ. 2019, 655, 707–719. [Google Scholar] [CrossRef]
- Peng, J.; Xie, P.; Liu, Y.; Ma, J. Urban thermal environment dynamics and associated landscape pattern factors: A case study in the Beijing metropolitan region. Remote Sens. Environ. 2016, 173, 145–155. [Google Scholar] [CrossRef]
- McGarigal, K. Fragstats Help; University of Massachusetts: Amherst, MA, USA, 2015; p. 182. [Google Scholar]
- Fan, Y.; Fang, C.; Zhang, Q. Coupling coordinated development between social economy and ecological environment in Chinese provincial capital cities-assessment and policy implications. J. Clean. Prod. 2019, 229, 289–298. [Google Scholar] [CrossRef]


| Type | Service Radius (m) | Appropriate Scale (hm2) | |
|---|---|---|---|
| Comprehensive park | 3000 | ≥50 | |
| 2000 | 20–50 | ||
| 1200 | 10–20 | ||
| Spatial park | 2000 | 20–50 | |
| 1200 | 10–20 | ||
| 800 | 5.0–10.0 | ||
| Residential park | Community park | 800 | 5.0–10.0 |
| 500 | 1.0–5.0 | ||
| Garden tour | 300 | 0.2–1.0 | |
| Number of Parks | Park Green Area (hm2) | Per Capita Green Space (Square Meters/Person) | Proportion of Green Space | |
|---|---|---|---|---|
| Yaohai | 22 | 56.1 | 1.06 | 2.94% |
| Luyang | 36 | 291.21 | 6.13 | 12.52% |
| Shushan | 36 | 288.31 | 4.19 | 8.44% |
| Baohe | 24 | 143.95 | 3.33 | 6.54% |
| Number of Parks | Park Green Area | Per Capita Green Space | Proportion of Green Space | |
|---|---|---|---|---|
| Yaohai | 0 | 0 | 0 | 0 |
| Luyang | 1 | 1 | 1 | 1 |
| Shushan | 1 | 0.988 | 0.617 | 0.574 |
| Baohe | 0.143 | 0.374 | 0.448 | 0.376 |
| PD | LPI | LSI | AREA_AM | SHAPE_MN | DIVISION | MESH | SPLIT | AI | |
|---|---|---|---|---|---|---|---|---|---|
| Yaohai | 2.1362 | 93.2959 | 3.046 | 1916.0511 | 1.3945 | 0.1291 | 1916.0511 | 1.1483 | 97.0055 |
| Luyang | 3.0938 | 87.8551 | 4.7256 | 1800.0566 | 1.3912 | 0.2265 | 1800.0566 | 1.2929 | 94.8228 |
| Shushan | 1.8135 | 91.3079 | 3.5738 | 2853.1279 | 1.4127 | 0.1654 | 2853.1279 | 1.1982 | 96.938 |
| Baohe | 1.8875 | 97.0524 | 2.296 | 1796.6712 | 1.3234 | 0.058 | 1796.6712 | 1.0616 | 98.0636 |
| PD | LPI | LSI | AREA_AM | SHAPE_MN | DIVISION | MESH | SPLIT | AI | |
|---|---|---|---|---|---|---|---|---|---|
| Yaohai | 0.748 | 0.592 | 0.691 | 0.887 | 0.204 | 0.578 | 0.113 | 0.625 | 0.674 |
| Luyang | 0 | 0 | 0 | 0.997 | 0.241 | 0 | 0.003 | 0 | 0 |
| Shushan | 1 | 0.375 | 0.474 | 0 | 0 | 0.363 | 1 | 0.409 | 0.653 |
| Baohe | 0.942 | 1 | 1 | 1 | 1 | 1 | 0 | 1 | 1 |
| Accessibility Level | Number of Streets | Contains Street |
|---|---|---|
| Very good | 9 | Bijiashan Street, Dayang Town, High-Tech Industrial Development Zone, Silihe Street, Jinggang Town, Shengli Road Street, Chengdong Street, Heyedi Street, Heping Road Street |
| Good | 4 | Fangmiao Street, Sanxiaokou Street, Changqing Street, Nanqi Street |
| General | 5 | Bozhou Road Street, Xiaoyaojin Street, Amber Street, Wulitun Street, Daoxiangcun Street |
| Poor | 9 | Changhuai Street, Mingguang Road Street, Tongan Street, Qili Station Street, Baogong Street, Wanghu Street, Sanlian Street, Tongling Road Street, Shuanggang Street |
| Very poor | 8 | Wuhu Road Street, Datong Road Street, Xiyuan Street, Chezhan Street, Haitang Street, Sanlijie Street, Xinglin Street, Feihe Street |
Disclaimer/Publisher’s Note: The statements, opinions and data contained in all publications are solely those of the individual author(s) and contributor(s) and not of MDPI and/or the editor(s). MDPI and/or the editor(s) disclaim responsibility for any injury to people or property resulting from any ideas, methods, instructions or products referred to in the content. |
© 2023 by the authors. Licensee MDPI, Basel, Switzerland. This article is an open access article distributed under the terms and conditions of the Creative Commons Attribution (CC BY) license (https://creativecommons.org/licenses/by/4.0/).
Share and Cite
Huang, Y.; Yu, P.; Xie, P. Analysis and Optimized Location Selection of Comprehensive Green Space Supply in the Central Urban Area of Hefei Based on GIS. Buildings 2023, 13, 2731. https://doi.org/10.3390/buildings13112731
Huang Y, Yu P, Xie P. Analysis and Optimized Location Selection of Comprehensive Green Space Supply in the Central Urban Area of Hefei Based on GIS. Buildings. 2023; 13(11):2731. https://doi.org/10.3390/buildings13112731
Chicago/Turabian StyleHuang, Yunfeng, Pengcheng Yu, and Peng Xie. 2023. "Analysis and Optimized Location Selection of Comprehensive Green Space Supply in the Central Urban Area of Hefei Based on GIS" Buildings 13, no. 11: 2731. https://doi.org/10.3390/buildings13112731
APA StyleHuang, Y., Yu, P., & Xie, P. (2023). Analysis and Optimized Location Selection of Comprehensive Green Space Supply in the Central Urban Area of Hefei Based on GIS. Buildings, 13(11), 2731. https://doi.org/10.3390/buildings13112731