Article

Analysis and Optimized Location Selection of Comprehensive Green Space Supply in the Central Urban Area of Hefei Based on GIS

School of Civil Engineering and Architecture, Anhui University of Science and Technology, Huainan 232001, China
*
Author to whom correspondence should be addressed.
Buildings 2023, 13(11), 2731; https://doi.org/10.3390/buildings13112731
Submission received: 20 September 2023 / Revised: 12 October 2023 / Accepted: 24 October 2023 / Published: 29 October 2023

Abstract

:
Urban parks and green spaces are essential for improving the urban environment and enhancing ecological conditions. In this study, we utilize Geographic Information Systems (GIS) as a foundation to comprehensively evaluate the overall condition of park green spaces in Hefei city, taking into account factors, such as quantity (including area), quality, and accessibility. Additionally, we propose corresponding optimization site selection schemes. The results indicate that (1) the parks and green spaces in the central urban area of Hefei city are more accessible in the southern and western parts, while they are less accessible in the northern and eastern parts; (2) the green spaces in the Shushan area are not closely connected, and the parks are not developed in a related manner. In the Yaohai and Baohe areas, green spaces are in conflict, and the parks are developing at a slower pace. However, in the Luyang area, park green spaces are integrated and positively developed; (3) it is suggested that five new parks are added to the research area, and the locations of the newly added parks should be consistent with the results of the accessibility analysis, so that the selected locations are more reasonable.

1. Introduction

Urban parks and green spaces are an essential component of the urban ecosystem, playing a crucial role in improving the ecological environment, regulating microclimates, mitigating the urban heat island effect, and maintaining biodiversity [1,2,3,4]. Simultaneously, they serve as important indicators of citizens’ quality of life and a significant measure of modern urban development. As living standards rise, the demand for urban parks and green spaces continues to increase. Not only are people concerned with the quantity (including area) and quality of these areas, but they are also interested in whether the natural services provided by these parks can be accessed conveniently, equitably, and fairly [5,6].
Currently, the measurement of park green space service goes beyond physical attributes like park area and quantity [7,8]. It also includes non-physical attributes such as park accessibility and quality [9,10]. Researchers have extensively studied the use of accessibility as an evaluation parameter for fair park allocation [11,12,13,14,15]. Accessibility refers to how easily residents can reach park green spaces and helps guide the strategic placement of parks. Currently, there are various assessment methods available for determining accessibility, making quantitative research on the layout and accessibility of parks and green spaces necessary.
The concept of accessibility, or reachability, pertains to the level of difficulty that individuals encounter when trying to reach their intended destination from any given location in a green space. It quantitatively measures people’s willingness and capability to overcome obstacles, such as distance, time, and expenses, in order to access service facilities or participate in activities. Currently, there are several methods for studying accessibility, including buffer analysis [11], a gravity model [12], cost-weighted distance [13], network analysis [14], and a two-step floating catchment area method [15]. Each method reflects the spatial accessibility of service facilities from different perspectives, but they all have their own strengths and weaknesses. The buffer method and minimum nearest distance method do not take into account any resistance that may be encountered when trying to reach a destination. As a result, they may give an overly optimistic estimate of the accessibility of service facilities [16]. Similarly, the gravity model and cost-weighted distance method do not consider the actual path that needs to be taken to reach the destination. Typically, different land use types are assigned relative resistance values, but the process of dividing land use types and assigning these values is highly subjective. The cost-weighted distance method requires the research area to be divided into a large number of networks, and the size of the grid directly affects the calculation accuracy [17,18]. The two-step floating catchment area method makes up for the shortcomings of the above methods and has received extensive attention in the field of urban park accessibility research [19,20].
The Gaussian two-step floating catchment area method builds upon the conventional two-step floating catchment area method by incorporating a Gaussian function to simulate the distance decay effect of resident travel within the search threshold. One of the most widely applied algorithms for assessing the accessibility of park green spaces is the method that takes into account both the interaction between demand points and facility points and the attenuation relationship between the attraction of facility points and distance [21,22]. This approach is deemed successful as it fully considers these aspects.
Although numerous studies have been conducted on accessibility, there is limited research on incorporating indicators such as the quantity, size, quality, and accessibility of park green spaces into a comprehensive analysis of supply [23,24,25]. Alessandro [26] evaluated existing research in Western countries and concluded that most studies on park equity primarily focus on comparing differences in accessibility, quantity, and quality. Rigolon [27] examined the environmental justice concerns related to park green spaces in Denver, USA, using these three indicators as a starting point. They established a fundamental framework for conducting a comprehensive assessment of park green space environmental justice, which serves as a basis for future evaluations of fairness in the allocation of park green spaces.
In the past few years, Hefei city has experienced significant growth and progress. By evaluating the parks and green spaces in Hefei city, we can gain a better understanding of the overall development of these areas in other major cities in eastern China. This study focuses on the central urban area of Hefei city and assesses the accessibility of parks and green spaces using a Gaussian two-step mobile search method. We performed a comprehensive analysis of the quality of parks and green spaces in Hefei city by calculating various quality indicators. Then, we combined the quantity and area indicators of these parks and green spaces to conduct a comprehensive analysis. Additionally, we proposed suggestions for optimizing the layout of parks and green spaces in the research area. The aim of this research is to provide references for the optimization and construction of urban parks and green spaces in Hefei city, and to assist in the future planning and development of urban parks and green spaces in China and worldwide.

2. Overview of the Research Area

The city of Hefei has a preliminarily established urban ecological spatial layout characterized by “one lake and one hill, one core and four districts, and multiple corridors interconnected,” which has significantly increased the area of urban parks and green spaces [28]. This study focuses on the region within the Second Ring Road of the central urban area of Hefei (as shown in Figure 1), which has a high population density and a complete transportation system; therefore, it can accurately represent the situation of urban parks and green spaces in the entire city.
In this study, we identified a total of 118 park green spaces, covering a combined area of 897.6 hectares. On average, each person has access to 3.67 square meters of green space, which accounts for 7.61% of the total area. Furthermore, we also considered park green spaces within a 2 km buffer zone outside the central urban area, as people living on the outskirts may have the opportunity to access these areas. Within this buffer zone, there are 60 park green spaces, covering a total area of 742 hectares (Figure 2).

3. Research Methodology

3.1. The Fundamental Data and Its Processing

3.1.1. The Quantity and Spatial Distribution of Park Green Spaces

In this study, our research focuses on the parks and green spaces that are located within the Second Ring Road of Hefei. We excluded parks and green spaces with an area below 0.2 hectares, as we were primarily interested in their recreational and leisure functions. We classified the parks and green spaces within our research area into four categories: comprehensive parks, community parks, specialized parks, and amusement parks, according to the classification requirements of urban green spaces in 2017 (CJJT/85―2017) [29]. In order to determine the entrances and exits of each park and green space, we conducted on-site surveys of all the access points for each park and compared them with high-definition images to ensure more accurate accessibility calculations. The service radius of parks and green spaces follows the standards outlined in China’s official “GBT51346—2019 Urban Green Space Planning” (Table 1) [30].

3.1.2. Road Network Data

The road network data utilized in this study were procured from the 2022 urban inspection results of Hefei city, as illustrated in Figure 1. It is important to note that the dataset does not account for Hefei city rail transit information, incorporating broken connections at road intersections in addition to undergoing topological checks.

3.1.3. Population Data

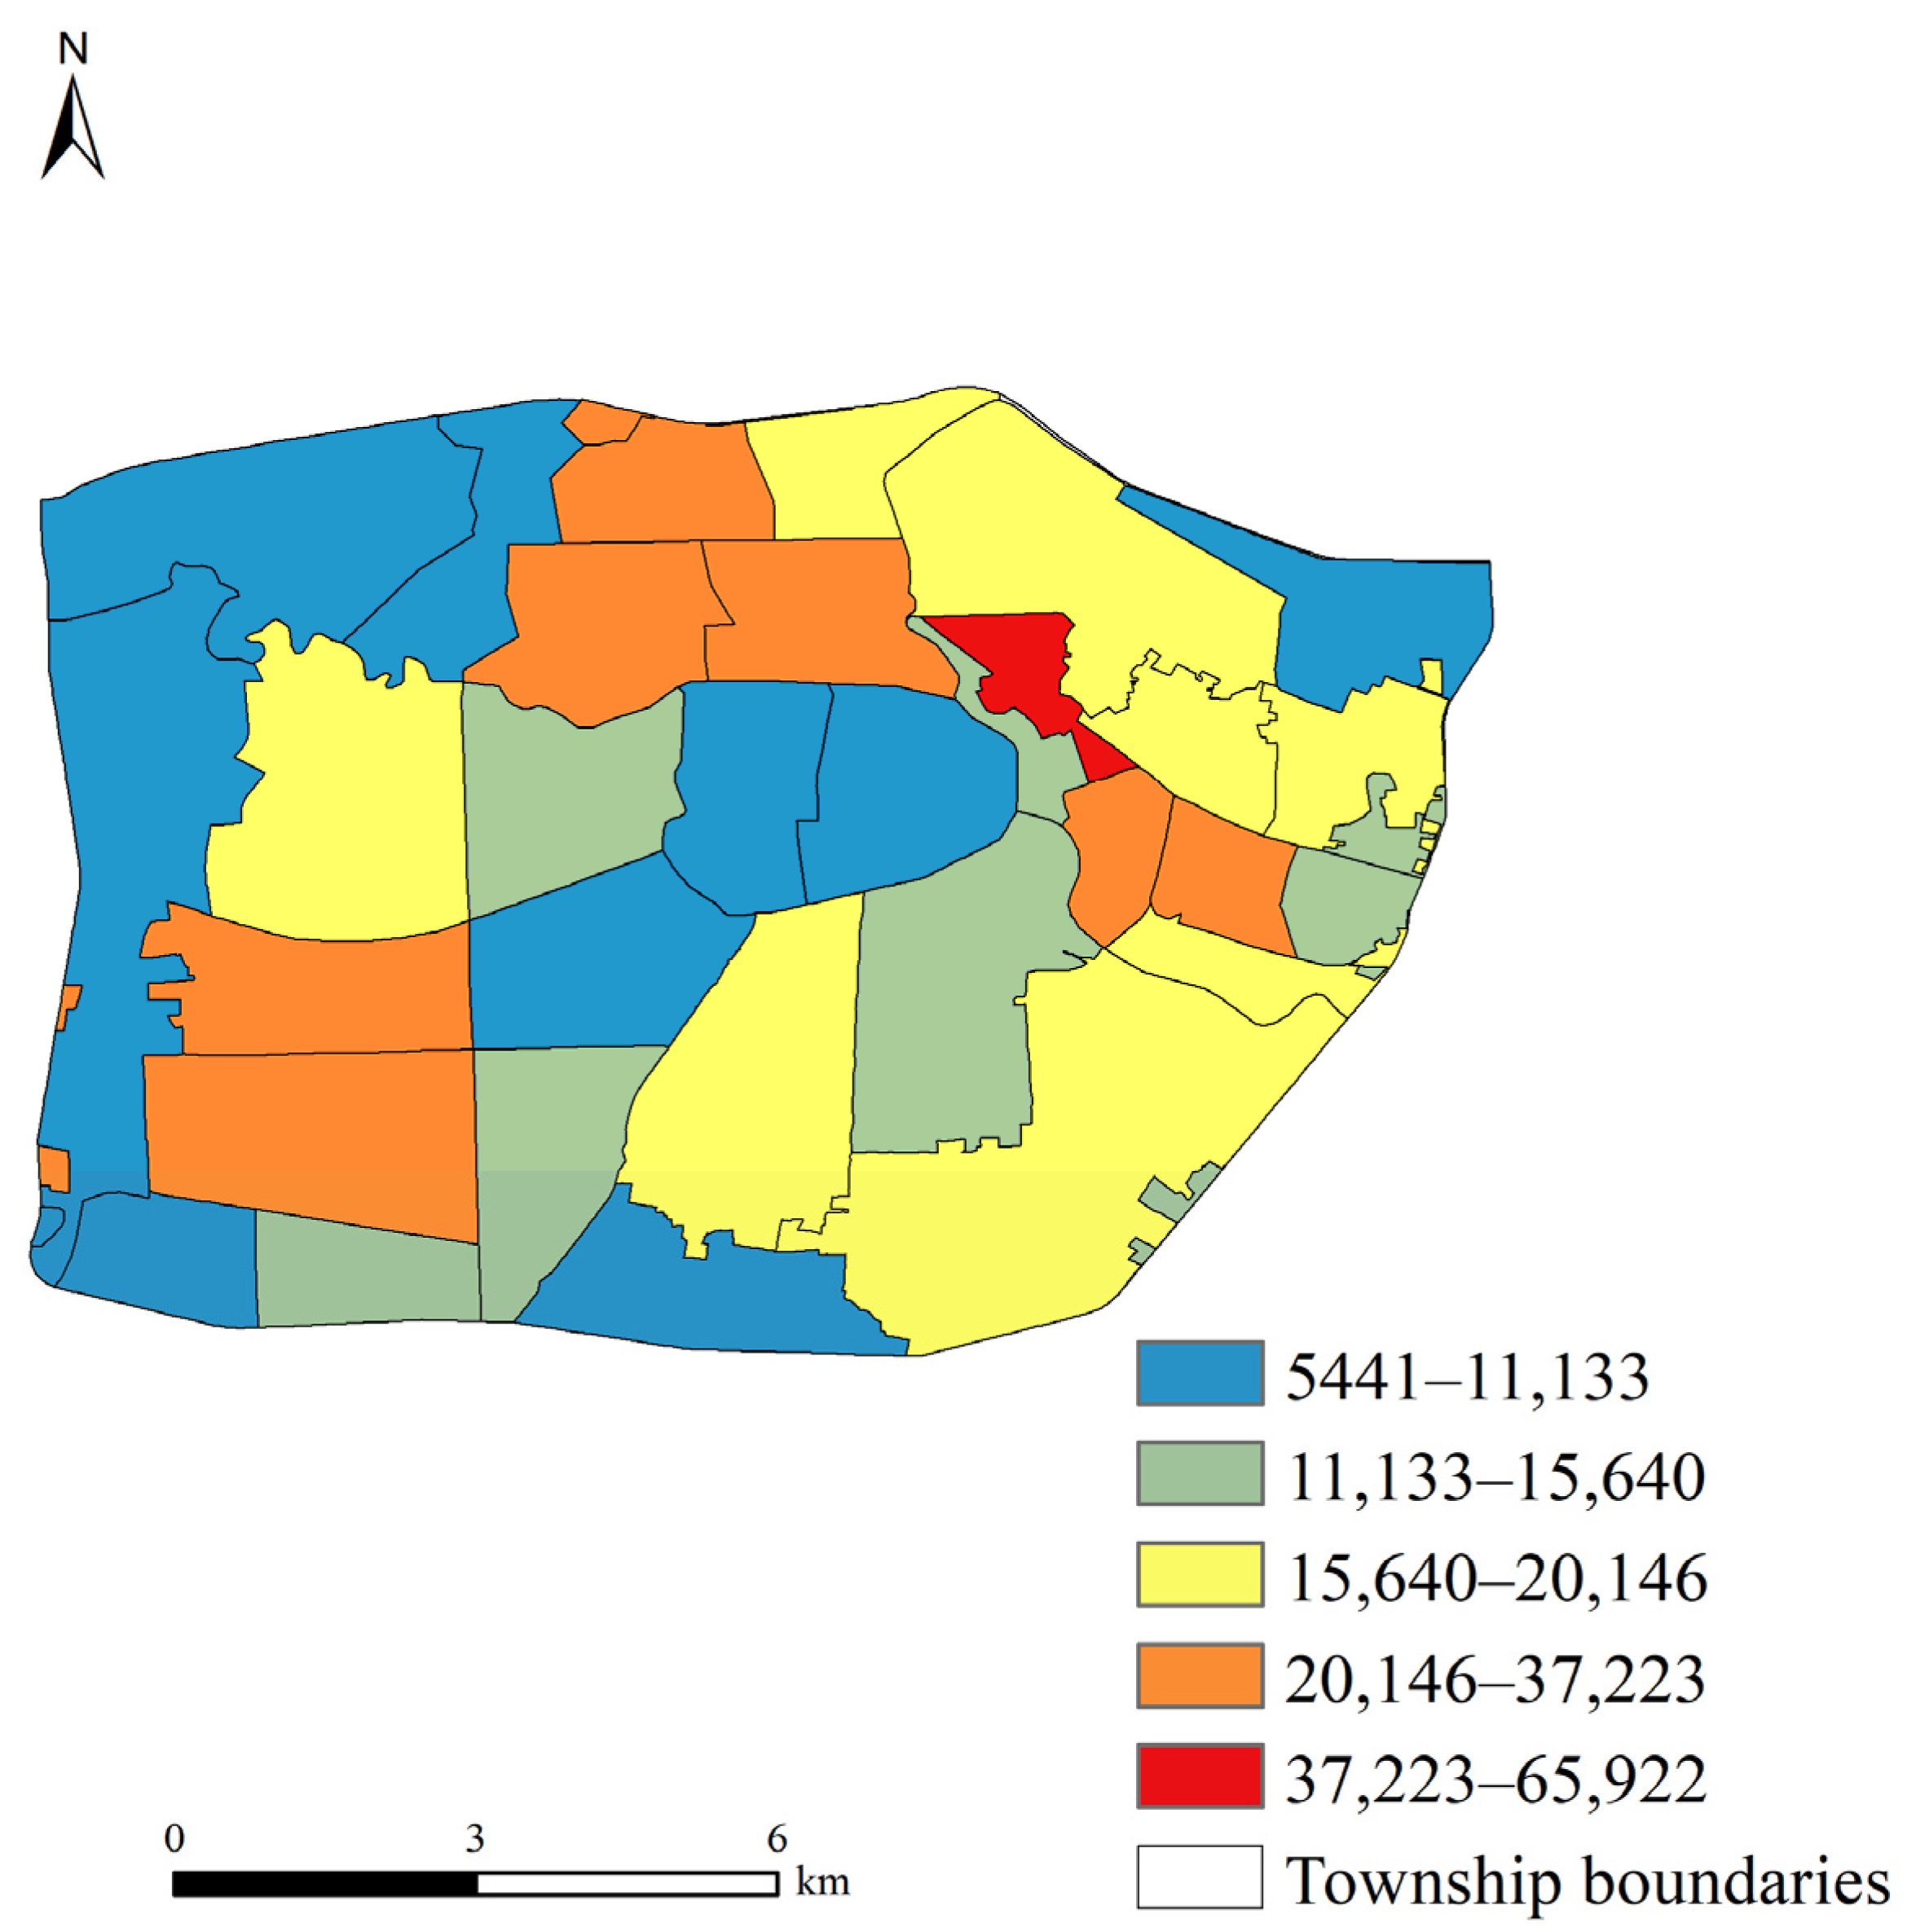
By merging the information obtained from the 7th National Census and utilizing Python web scraping techniques to extract the aggregate number of houses listed on Anjuke and Lianjia websites, multiplied by the mean population per household, we can calculate the overall populace of every community [31]. Additionally, we can leverage spatial connection tools to determine the comprehensive populace of each street, as depicted in Figure 3.

3.2. Research Methods

3.2.1. Entropy Weight Method

The entropy weighting method is a widely employed approach for multi-criteria decision-making that allocates weights to various indicators or factors. This method, which is founded on the notion of information entropy, gauges the significance of each indicator by computing the entropy value and weight. It is known for its remarkable features, including strong objectivity, high precision, and wide applicability [32,33,34].
(1)
Standardized raw data matrix.
The data set comprises ‘m’ entities and ‘n’ indicators, creating a matrix X = { x i j , i = 1, 2, …, m; j = 1, 2, …, n}. Upon standardizing the data, we achieved the standardized matrix Y = { y i j , i = 1, 2, …, m; j = 1, 2, …, n}. The formula used to calculate   y i j is as follows:
y i j = { x i j min ( x i ) max ( x i ) min ( x i ) ,   Positive   indicators max ( x i ) x i j max ( x i ) min ( x i ) ,   Negative   indicators
(2)
Calculating entropy value.
e j = k j = 1 n p i j ln ( p i j ) i = 1 , 2 , , m
In the formula p i j = y i j j = 1 n y i j ; k is a constant, k = 1/ ln n
(3)
Determining weights
w i = 1 e j j = 1 m 1 e j

3.2.2. Principal Component Analysis Method

Principal component analysis (PCA) is a commonly used multivariate data reduction and feature extraction method. It projects the original data onto a new coordinate system through linear transformation so that the projected data have the maximum variance, thereby identifying the most important features in the data [35,36].
This study employed SPSS 25 software to perform a principal component analysis of the data of evaluation indicators and threshold values. The primary steps include (1) standardizing the evaluation indicators, (2) calculating the correlation coefficient matrix, (3) calculating the eigenvalues and eigenvectors, (4) selecting the principal components, and (5) calculating the composite scores of the principal components.

3.2.3. Gaussian Two-Step Moving Search Method

In order to determine the supply–demand ratio for a given area, a methodical approach can be taken. The first step is to identify the center of gravity for each supply point, denoted as point j. From here, a spatial domain can be established by selecting a distance threshold d 0 . Within this domain, the number of demanders for each demand point, denoted by point k, can be calculated. To determine the potential number of demanders for a specific supply point, denoted by point j, weights can be assigned using the Gaussian equation and then accumulated. By dividing the area of the supply land, denoted by j, by the total number of potential demanders, the supply–demand ratio, denoted by R j , can be calculated. This systematic approach provides a rigorous means of determining the supply–demand ratio and can be applied to a variety of situations.
R j = S j k { d k j , d 0 } G ( d k j , d 0 ) P k
The used formula considers various parameters. d k j represents the distance between the supply point and the demand point K, while d 0 refers to the service radius of different park services, and d k j < d 0 .   P k represents the total number of demanders within the search domain, whereas S j represents the total supply available at point j. The distance decay function of point source elements for spatial features is represented by G( d j k , d 0 ), which is calculated using the Gaussian equation, as shown in Formula (5).
G ( d k j , d 0 ) = { e ( 1 2 ) × ( d k j d 0 ) 2 e ( 1 2 ) 1 e ( 1 2 ) ,   if   d k j d 0 0 , if   d k j > d 0
Upon the determination of the service radius d 0 for each demand location i, a new spatial domain is established. The parks and green spaces supply ratio ( R j ) that falls within said domain is then assessed by applying the Gaussian equation, and corresponding weights are assigned. The sum of these weighted supply ratios yields the park and green space accessibility ( A i ) for each individual point i in the small area.
A i = i { d i l d 0 } G ( d i j , d 0 ) R j
The symbol R j in the equation represents the supply ratio of park green space j within the spatial scope of the community point.

3.2.4. Coupling Coordination Analysis

Coupled coordination analysis is a method used to evaluate and analyze the degree of coupling and coordination between various internal parts of a system. It is mainly applied in complex systems, organizations, or networks with the aim of studying the interactions and interdependencies between the various components of the system [37,38].
The concept of coupling pertains to the extent to which distinct elements in a system are interconnected or reliant on one another. Conversely, coordination concerns the extent of harmony and cooperative interaction among the distinct elements of a system. The analysis of coupling and coordination endeavors to measure and assess these variables to enhance comprehension of the system’s functionality and optimize its overall performance [39].
A thorough assessment of the overarching abundance of parks and green spaces in four distinct areas was undertaken by evaluating their quantity, quality, and accessibility in a coherent and harmonious manner. This was achieved by coupling and coordinating analysis of these three aspects. The calculation formula for this evaluation is as follows:
C = { U 1 × U 2 × U 3 ( U 1 + U 2 ) × ( U 2 + U 3 ) × ( U 1 + U 3 ) } 1 3
In the aforementioned equation, the variables U1, U2, and U3 denote the normalized values assigned to the measurements of the volume, caliber, and convenience of public parks and green spaces within a given region. The variable C, on the other hand, relates to the comprehensive magnitude of the supply of public parks and green spaces within that same region.

3.2.5. Particle Swarm Optimization

The Particle Swarm Optimization (PSO) algorithm is an optimization technique that is based on swarm intelligence. It derives inspiration from the behavior of biological populations like bird flocks or fish schools. The PSO algorithm is designed to search for the optimal solution by simulating the movement of particles within the search space and facilitating the exchange of information [40,41]. In the context of this study, we employed the PSO algorithm to address the optimization challenge of identifying appropriate locations for urban parks within the research area. In this article, the study area is conceptualized as a two-dimensional plane with a search space dimension of D = 2. The park that is scheduled to be built is represented as a particle, with each particle being distinguished by an equiangular cone projection coordinate of X i = (x, y). The velocity vector of the particle in the plane is defined as V t   = ( v x , v y ). The target function for site selection is the sum of the product of the population of residential areas with poor accessibility and the distance from the residential area to the nearest particle. The fitness function of the particle is represented by F = 1/minZ.
The initial step in the algorithm involves setting the size of the particle swarm N and the initial value of the optimal position p b e s t that is being searched by the i-th particle. The optimal position of the entire particle swarm is set to g b e s t . Additionally, the maximum number of iterations iter is determined, and the fitness of each particle is computed.
The second stage of the process includes repetitive computation. Formulas (8) and (9) are used to iterate the i-th particle k + 1 times, and the resulting particle position is verified to ensure that it falls within the exploration region. In these equations, V i j denotes the velocity of the i-th particle in the j dimension in the next iteration, W indicates the inertial weight, (0, 1) denotes a random number ranging between 0 and 1, and C1 and C2 represent the learning factors.
v i j k + 1 = w × v i j k + C 1 × r a n d ( 0 , 1 ) × ( p b e s t X i j k ) + C 2 × r a n d ( 0 , 1 ) × ( g b e s t   X g j k )
X i j k + 1 = X i j k + v i j k + 1
The third step of the process requires ensuring that the stopping conditions are met. If the algorithm has either reached the maximum number of iterations or the optimization objective function value has decreased by less than 1 × 10⁻⁸ every 1000 iterations, it indicates that the accessibility blind spots of the park green space are approaching the lowest path cost to the proposed park. This is the point where the algorithm iteration is terminated. However, if these conditions are not met, the algorithm proceeds to step 2 to continue iterating. The algorithm determines the most suitable location for the proposed park and records its coordinates.

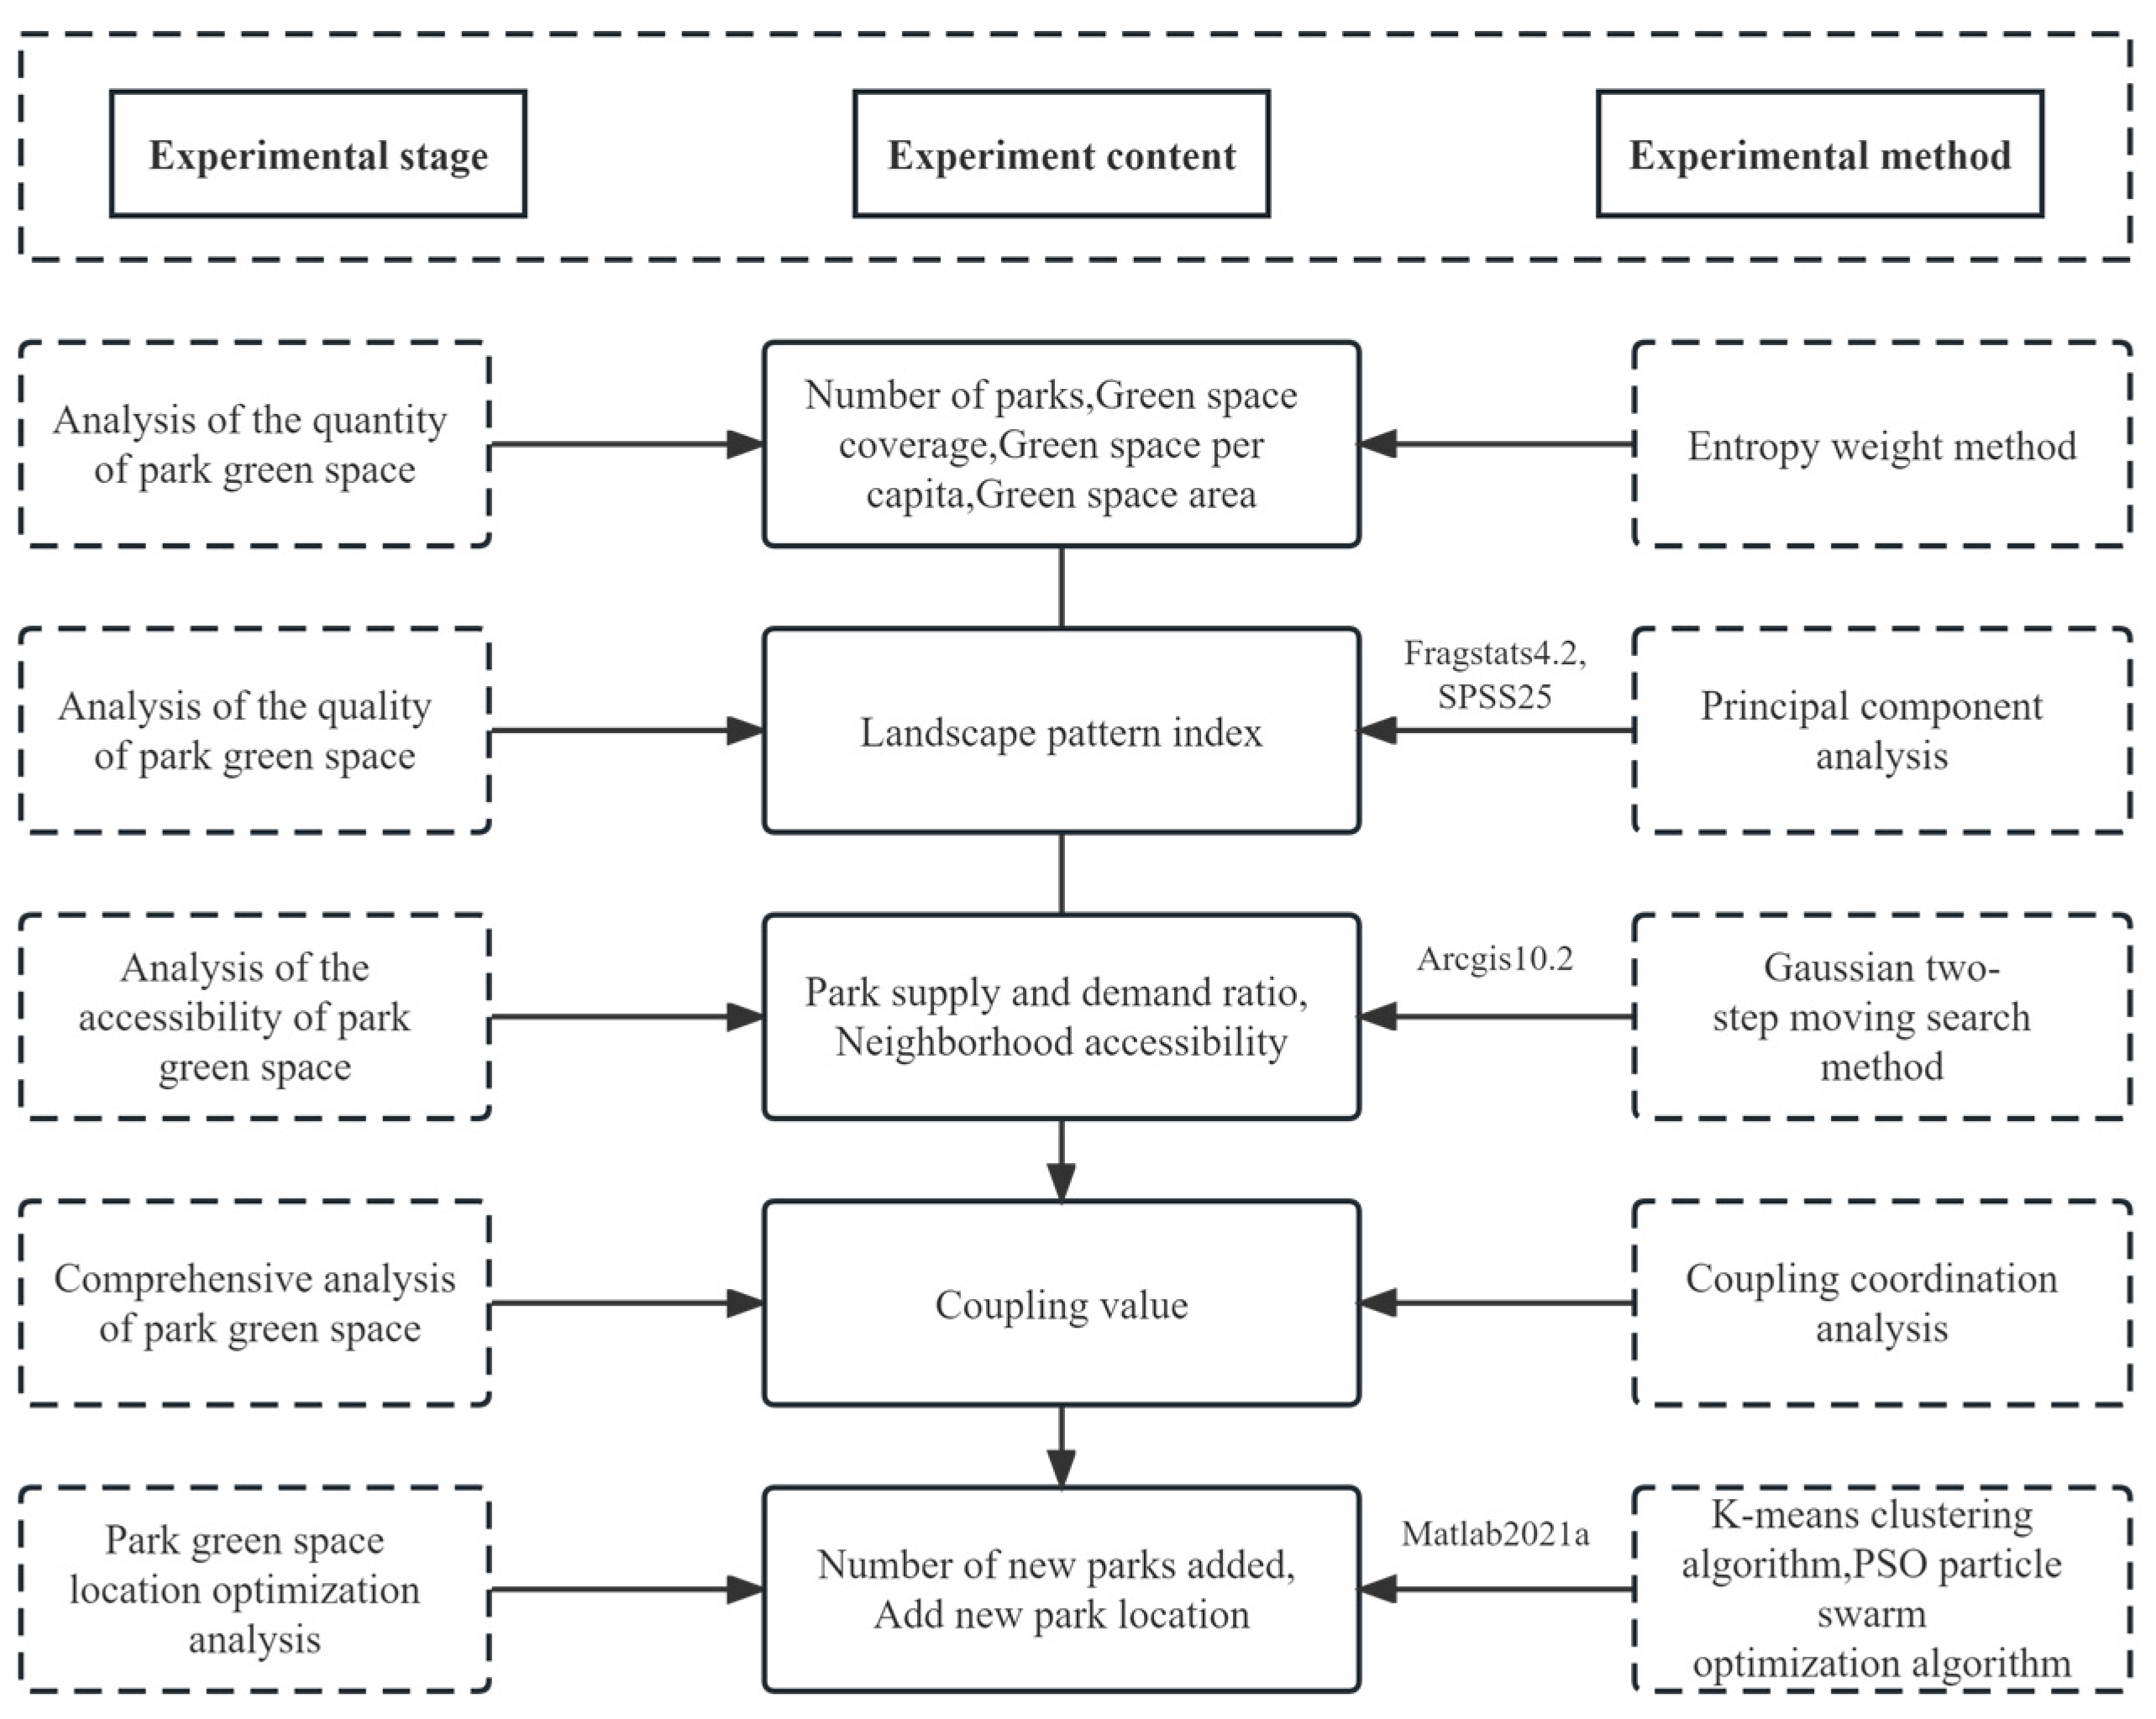
3.3. Technical Flow Chart

The processes of the abovementioned methods can be seen in Figure 4.

4. Results and Analysis

4.1. Analysis of the Quantity of Park Green Spaces Supplied

The application of ArcGIS 10.2 facilitated the summation of data pertaining to district area, park green space area, population, and park count. The per capita green space area was computed through by dividing the total green space area by the corresponding district’s population. Likewise, the green space ratio was determined by dividing the green space area by the district’s total area. These derived values were employed to generate indicators that reflect the quantity of park green spaces present in each district. Table 2 presents the distribution of parks across various regions in the study area. Notably, the Luyang and Shushan areas exhibit the most substantial number of parks (36). Baohe District follows with 24 parks, whereas Yaohai District has the fewest parks with only 22. Notably, the Luyang region has the highest amount of green space per person, with an average of 6.13 square meters, and the highest proportion of green space (12.52%). On the other hand, the Yaohai District has the lowest amount of green space per person, with an average of 1.06 square meters, and the lowest proportion of green space (2.94%).
Using the entropy weighting method, a comprehensive evaluation index of the total number of green spaces in each area’s public parks was obtained, and the supply level of parks was evaluated based on quantity. The data shown in Table 2 were substituted into Formula (1) for range standardization, the results of which are shown in Table 3.
By replacing the standardized index of green space quantity in Formulas (2) and (3) and carrying out the necessary calculations, we obtained the comprehensive evaluation indicators of green space quantity for each district. The results are as follows: Yaohai District = 0.315, Luyang District = 0.233, Shushan District = 0.218, and Baohe District = 0.233.

4.2. Analysis of the Supply Quality of Park Green Space

The quality of green spaces is determined by various factors, such as the size, shape, and ecological functions that they provide. Indicators of landscape patterns can provide insights into the overall health of the natural environment and ecosystem. These indicators assess the structure, functionality, resilience, and vitality of the environment and ecosystem [42,43,44,45].
In this study, we evaluated the level of urban park construction by analyzing the composition of green space in urban parks. We converted vector data of park green space in each administrative district into raster data, and then calculated the landscape pattern index using Fragstats4.2. We selected nine indicators to analyze the landscape pattern of park green space in the main urban area of Hefei city. The positive indicators included AI (aggregation index), LPI (largest patch index), and MESH (effective mesh size). On the other hand, the negative indicators included PD (patch density), LSI (landscape shape), AREA_AM (patch area-weighted mean size), SHAPE_MN (mean shape index), SPLIT (splitting index), and DIVISION (dividing index). The results of the calculations are presented in Table 4.
Table 5 is derived through the standardization of data by substituting it into Formula (1).
The landscape pattern index for park green space was standardized and imported into SPSS25 software. Through principal component analysis, the integrated indicators were calculated to obtain the comprehensive evaluation index of park green space quality for each area. The evaluation index values for Yaohai, Luyang, Shushan, and Baohe are 0.933, −0.055, 1.083, and 1.487, respectively.

4.3. Accessibility Analysis of Park Green Space

4.3.1. Overall Analysis

By plugging in the values for the park service radius and the population of the community into Equation (4), we can determine the supply–demand ratio R j . We can then use the calculated results of Equations (5) and (6) to find the accessibility value A i from the community to the park green space. Using the Kriging interpolation method, the computed results of park green space accessibility can be analyzed using interpolation. The accessibility can be reclassified into five levels—very good, good, general, poor, and very poor—using the natural break classification method, as depicted in Figure 5. The central urban region of Hefei city showed a distinct spatial pattern of park green space accessibility, with lower values observed towards the north and higher values towards the south and west. The northwest region exhibited higher accessibility values, attributed to the presence of large parks, such as Luzhou Park, the intersection of the West Second Ring Road and North Second Ring Road Park, and the Nanfei River Scenic Area Park, which have large park areas and fewer residents. The southern region of the city primarily comprises strip parks, including Kuanghe Park, Le Street Park, and High Voltage Corridor Phase III Park. These parks are evenly distributed and benefit from a well-developed transportation network. Conversely, areas with low accessibility values are predominant in the northeast region and within the first ring road to the west and south. In these areas, small-scale amusement parks are the primary green spaces, with limited service radius and coverage of residential areas. Large parks and green spaces, such as Xiaoyaojin Park, Xinghua Park, and Huancheng Park, are mainly located within the first ring road of the city. Despite the relatively small number of parks within the aforementioned areas, they are distributed unevenly.

4.3.2. Street Analysis

The level of access that neighborhoods have to parks at street level is determined by calculating the average accessibility of all neighborhoods within each street. To calculate the accessibility values for park green spaces on each street, we used the spatial join tool in ArcGIS 10.2 (Figure 6). After calculating the accessibility values, the streets were classified into five categories using the natural break classification method, as shown in Table 6. From a street-level perspective, the streets that offer the highest level of ease of access are primarily concentrated in the western region of the research area. This area features expansive parks such as Luzhou Park, Swan Lake Park, Huancheng Park, Hefei Botanical Garden, Sili River Waterfront Ecological Park, and Kuanghe Park, as well as several densely clustered smaller parks. The population density in these areas is comparatively low. Conversely, the streets with the lowest level of accessibility are mainly situated in the northeastern part of the research area and the southwestern part of the central region. The nearby parks in these areas are predominantly smaller amusement parks and their quantity is relatively limited. The population density in these areas is relatively high.

4.4. Analysis of Comprehensive Supply of Park Green Space

According to the data presented in Figure 5 regarding the accessibility of community parks and green spaces, an overall evaluation index of the accessibility of parks and green spaces in each district was calculated by averaging the accessibility of all communities within the district. The results indicate that Yaohai District has an index of 29.17, Luyang District has an index of 31.25, Shushan District has an index of 39.49, and Baohe District has an index of 18.73.
After inputting the standardized scores for the quantity, quality, and accessibility of park green spaces into Formula (7), the coupling level index for park green space supply in the four districts is as follows:
-
Yaohai District = 0.301;
-
Luyang District = 0.564;
-
Shushan District = 0.269;
-
Baohe District = 0.314.
According to the classification of coordination degree [46], the park green space in Shushan District exhibits a low-level coupling, with the area, quantity, quality, and accessibility of the park green space developing in a relatively unrelated manner.
The comprehensive supply level of park green space in Yaohai District and Baohe District shows an antagonistic coupling phase, with the development of the quantity, quality, and accessibility of park green spaces lagging behind.
Luyang District is in the adjustment phase, with the development of the quantity, quality, and accessibility of park green spaces reaching a state of positive resonance coupling.

4.5. Optimization Analysis of the Site Selection for Park Green Spaces

4.5.1. Determine the Number of New Parks Based on k-Means Clustering Algorithm

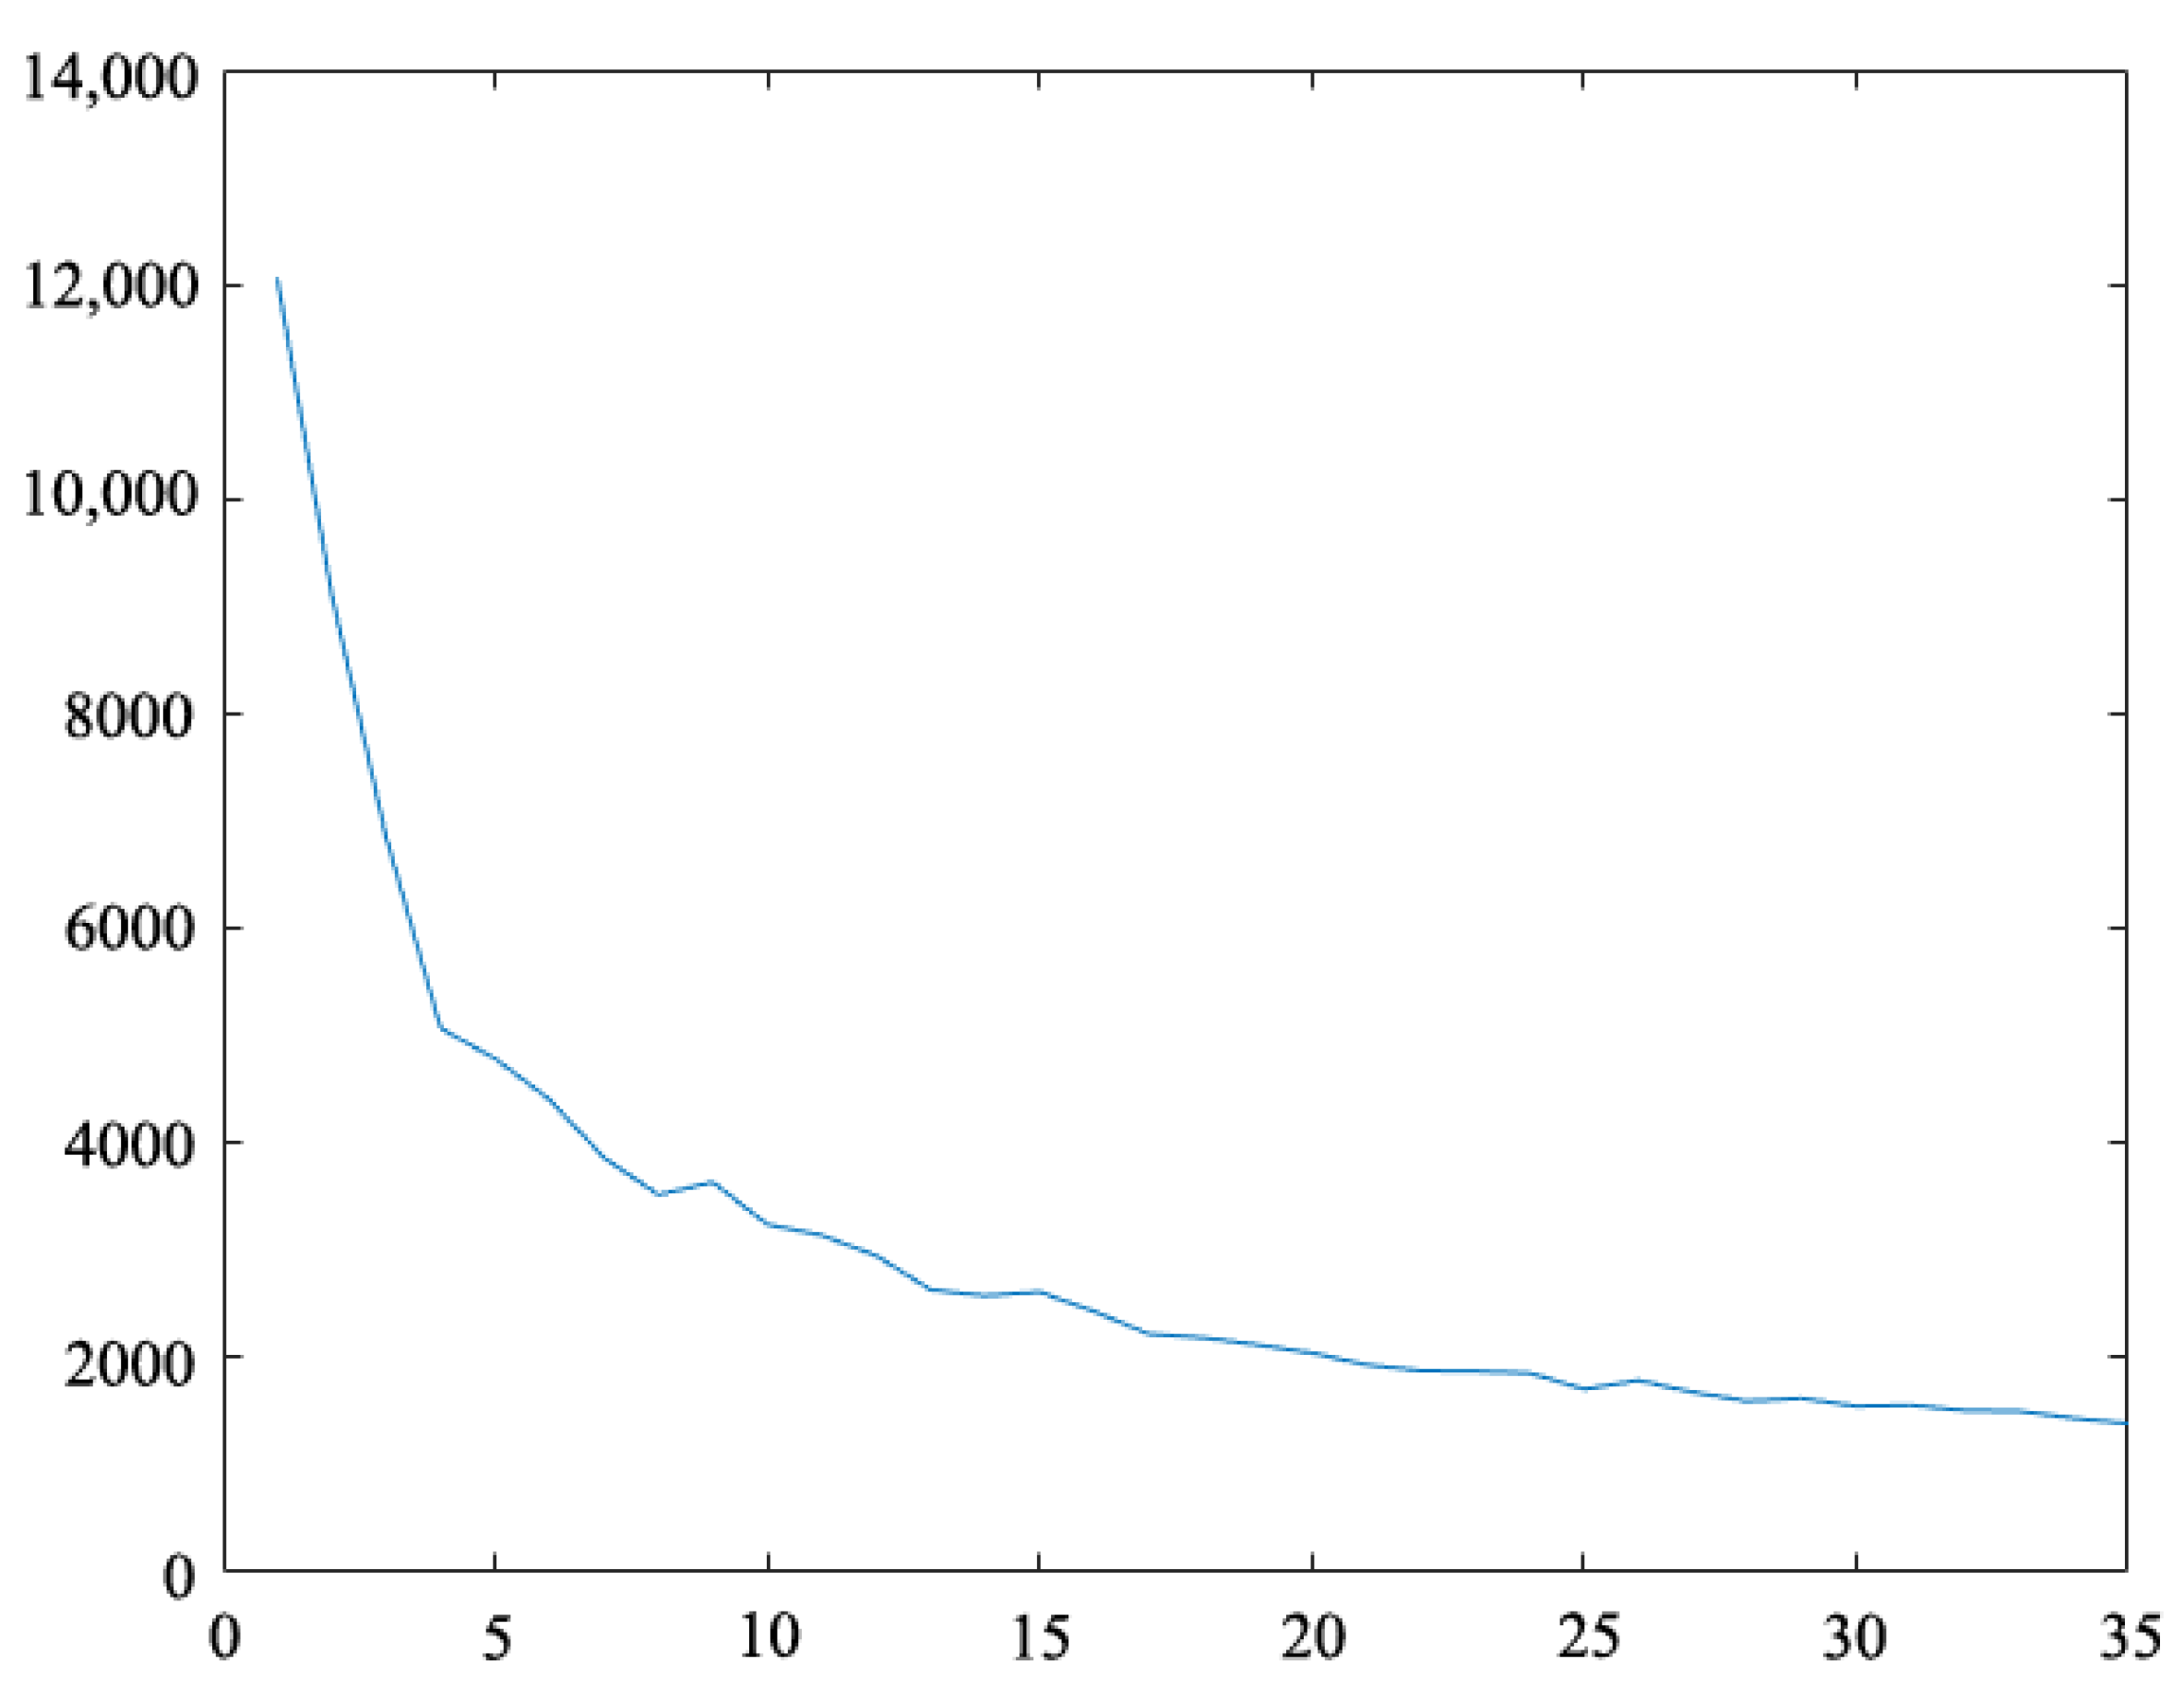
Based on the findings for the accessibility of green spaces in community parks from previous research, we identified the neighborhoods that had accessibility values below 22.66. Afterwards, we utilized the k-means clustering algorithm to calculate the maximum distance between the residential neighborhood points and the cluster centers for each cluster number ranging from k = 1 to 35. This calculation helped us to determine the number of new parks required. The clustering curve, displayed in Figure 7, illustrates the relationship between the number of cluster centers (on the horizontal axis) and the maximum distance value between sample points and cluster centers (on the vertical axis). The steepness of the curve indicates the degree of improvement in clustering effect with the addition of cluster centers, while a gentler curve implies a less significant enhancement.

4.5.2. Solving the Problem of Park Green Space Location Selection Based on Particle Swarm Optimization Algorithm

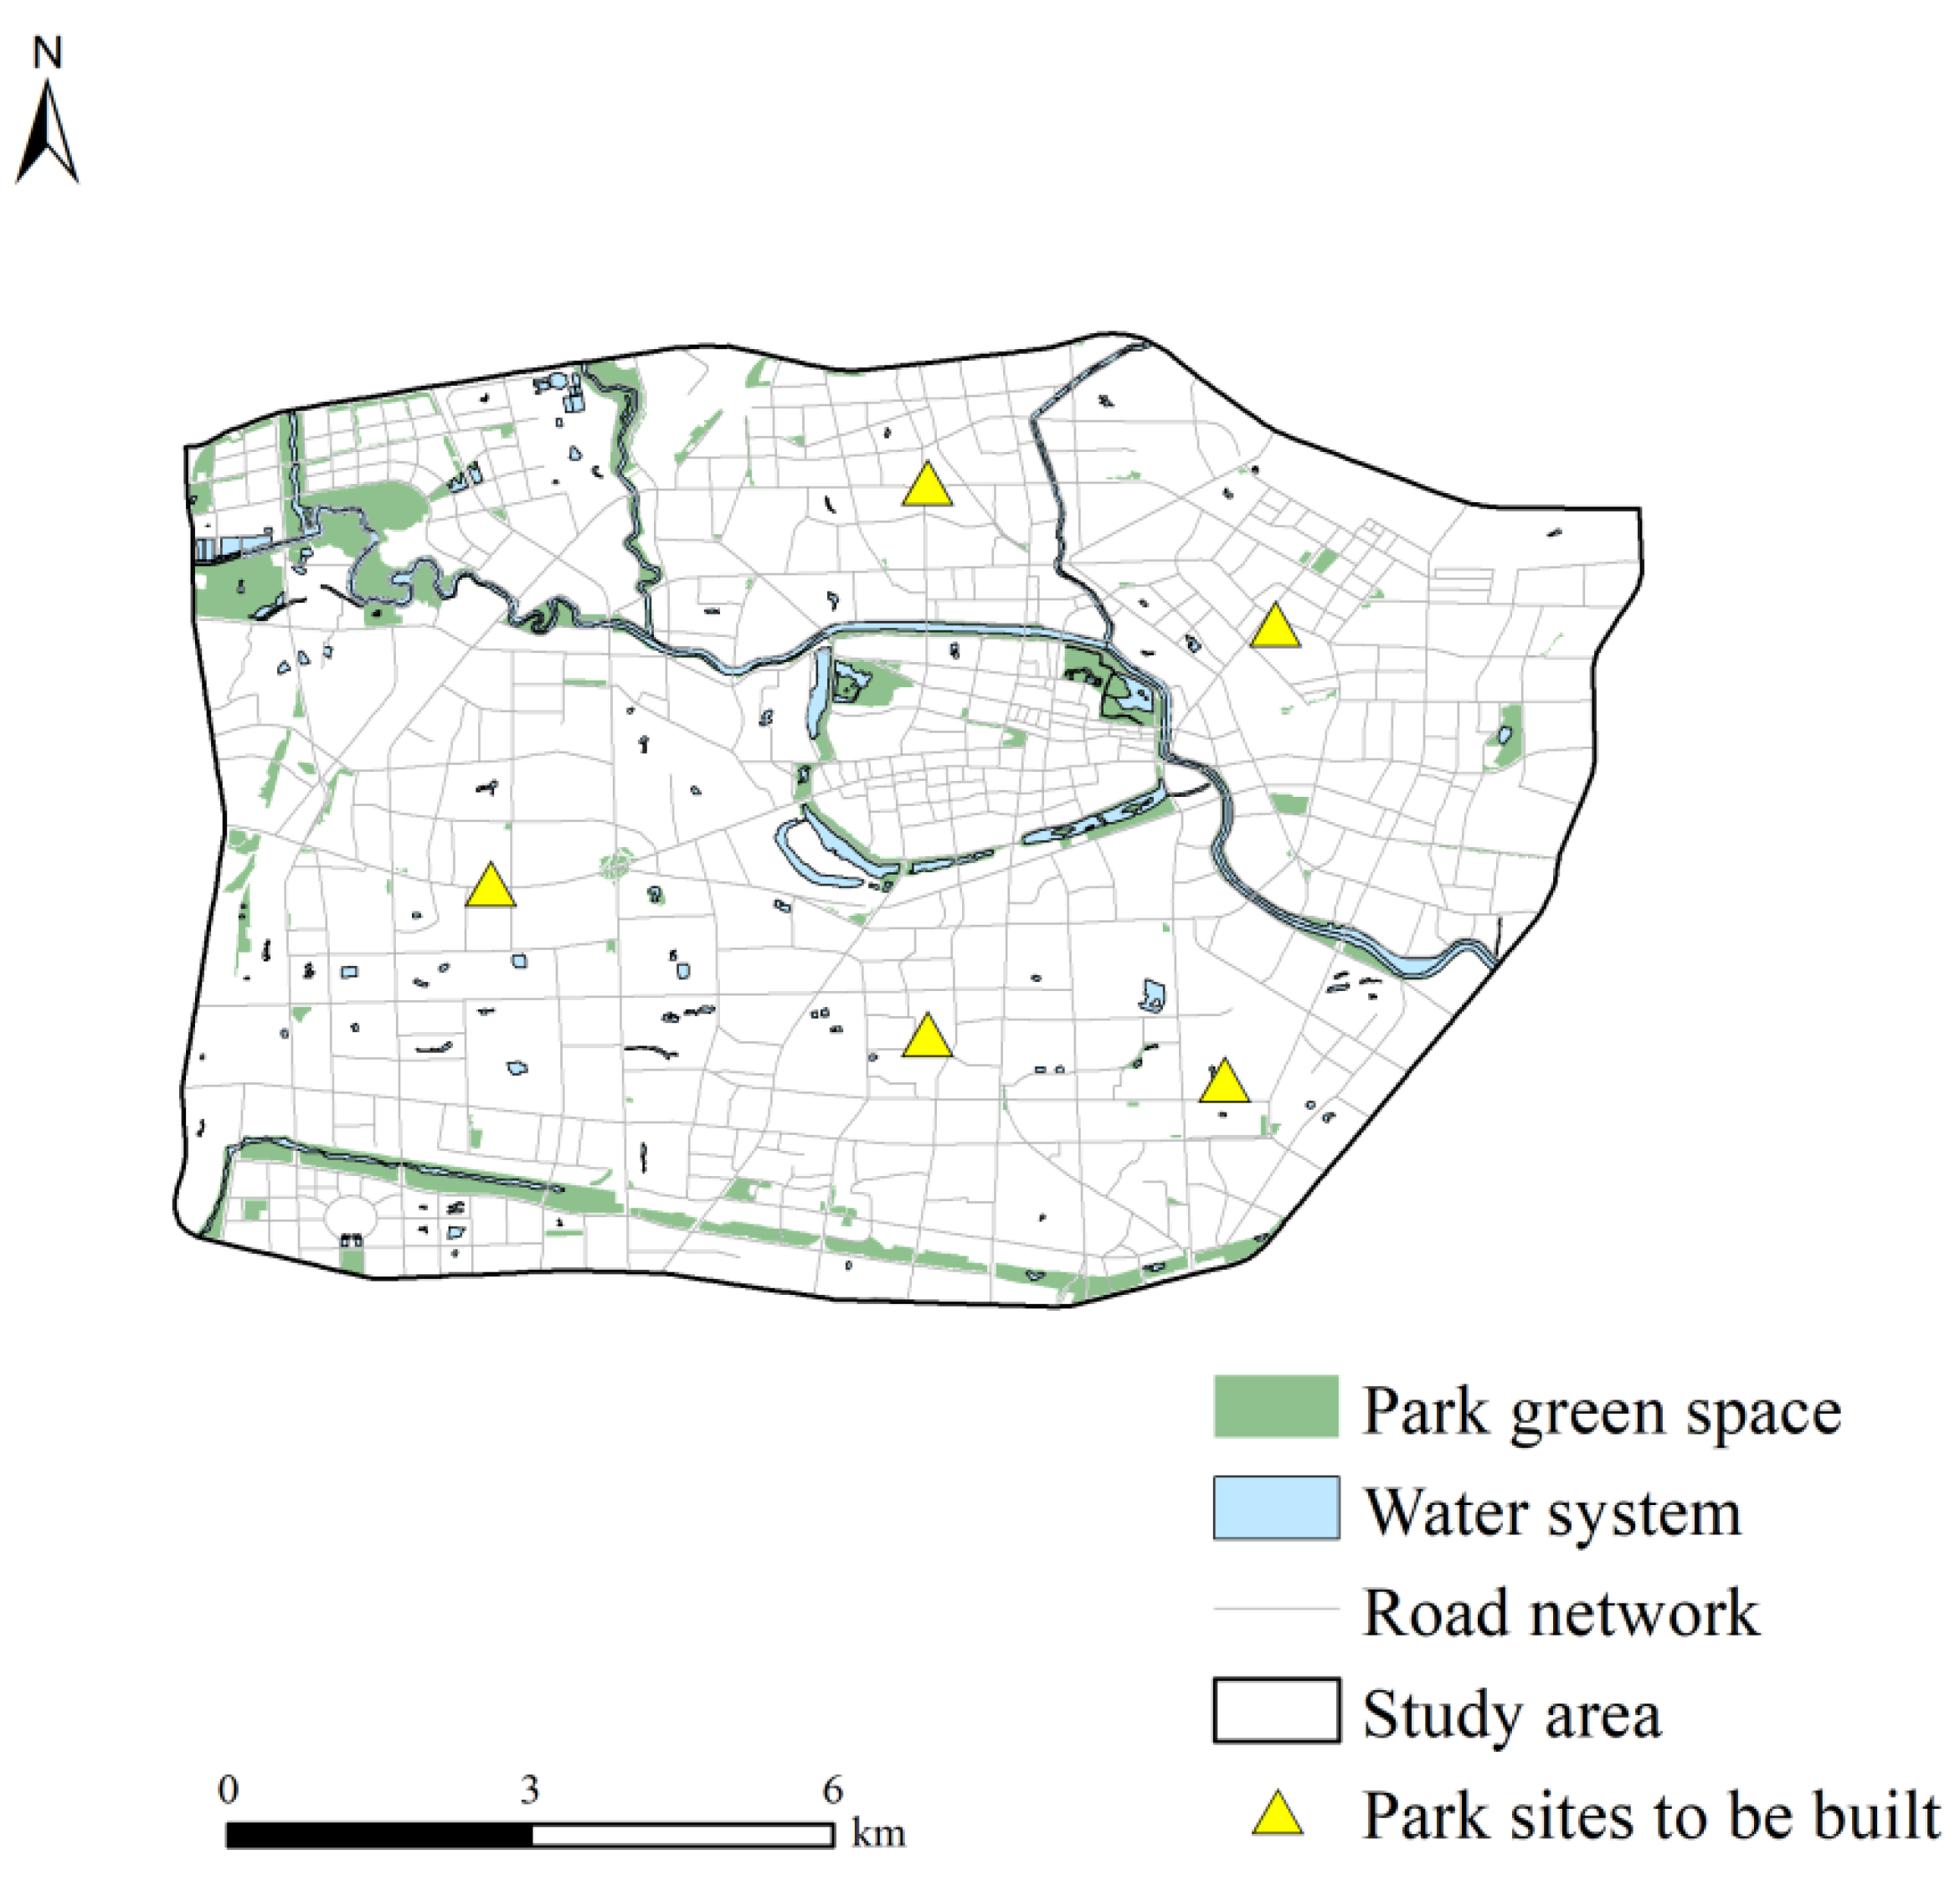
In the present investigation, the PSO toolbox integrated in MATLAB R2021a software was employed to conduct a simulation in which five new planned parks were introduced as particles. The objective of this undertaking was to identify the optimal arrangement of green spaces for each park, while ensuring that spatial constraints were adhered to. The outcomes of this analysis, which demonstrate the coordinates for the proposed new parks, are displayed in Figure 8. The comparison of the computed coordinates with the image data revealed that the majority of the selected locations were located in regions with limited access to green spaces and inadequate resources. To determine the location for each park, both the K-means algorithm and PSO algorithm were utilized, resulting in relatively dependable outcomes.

5. Conclusions and Discussion

In order to promote the healthy and sustainable development of cities, it is important to establish a scientific evaluation system for urban park green spaces. In this study, we focused on analyzing the supply level of park green spaces in the central urban area of Hefei from three different perspectives: quantity (including area) level, quality level, and accessibility level. To calculate the quantity indicators of park green spaces, we used the entropy weight method as our research method. For the quality indicators, we applied the principal component analysis method. Additionally, we used the Gaussian two-step moving search method to establish an accessibility model for park green spaces. This allowed us to quantitatively identify areas with a lower supply of park green spaces in the study area and obtain accessibility indicators.
To gain a comprehensive understanding of the development of park green spaces, we conducted a coupled and coordinated analysis of these three indicators in four specific areas within the study area. Based on the accessibility indicators, we then used the k-means algorithm and PSO algorithm to calculate the suggested number and locations for new park constructions. The conclusion is as follows:
(1)
In the central urban area of Hefei city, the accessibility of parks and green spaces displays a spatial pattern characterized by higher levels in the south and west and lower levels in the north and east. Notably, only the Luyang district exhibits a period of antagonistic coupling in its comprehensive supply level of parks and green spaces, achieved through a benign resonance coupling of park and green space quantity, quality, and accessibility. The remaining three areas of the park have a relatively lagging or irrelevant state in terms of quantity, quality, and accessibility of green spaces. When optimizing the urban green space structure in the future, it is not only about increasing the number of parks, but also about optimizing the quality and accessibility of park green spaces.
(2)
The distribution of green spaces, the density of greenery, and the population density play a crucial role in determining the accessibility of green spaces in a particular region. Urban areas that are densely populated and have limited green resources tend to have lower accessibility to green space. This is due to the imbalance between the park green space layout and population distribution, which leads to spatial differences in accessibility. As a result, a significant portion of the population residing in the city center is unable to fulfill their green space needs. To improve the overall number of green spaces in the area, it is essential to focus on the spatial configuration of park green spaces.
(3)
According to the outcomes of the feasibility analysis, the optimized park locations demonstrate a substantial level of dependability. Of the chosen sites, three are situated in regions characterized by high-density structures and a scarcity of land resources. As such, the proposal for these sites is to enhance the urban green belts surrounding them and to establish compact parks on unused land. The remaining two sites, on the other hand, are endowed with more plentiful land resources and are enclosed by residential areas. Consequently, it is advised that these sites be integrated with the present urban green landscape to create novel parks and green spaces.
There are certain aspects mentioned in this article that are worthy of discussion. When conducting a comprehensive assessment of park green spaces, in addition to the primary evaluation indicators, such as accessibility, size, quantity, and quality, factors such as the duration of time spent in the urban park, the primary demographic of park visitors and the historical and cultural significance of the park are also likely to impact outcomes. Therefore, it is important to consider these factors in future comprehensive evaluations of park green spaces.
With regard to research methods, it is important to consider the various factors when deciding on the integration method for park quantity indicators, choosing landscape indices for evaluating the quality of park green spaces, and assessing the impact of different methods on accessibility calculations. By conducting a thorough analysis of park green spaces in the main urban area of Hefei city, we can propose corresponding recommendations to address the current issues in the layout of urban parks. These recommendations can serve as a scientific basis for future planning and decision making regarding urban green space systems. Additionally, this study can provide valuable insights for future research on integrating urban parks and studying the accessibility of other urban service facilities.

Author Contributions

Methodology, Y.H.; Validation, P.X.; Formal analysis, P.X.; Writing – original draft, P.Y.; Writing – review & editing, P.Y. All authors have read and agreed to the published version of the manuscript.

Funding

This research received no external funding.

Data Availability Statement

Not applicable.

Conflicts of Interest

The authors declare no conflict of interest.

References

  1. Coombes, E.; Jones, A.P.; Hillsdon, M. The relationship of physical activity and overweight to objectively measured green space accessibility and use. Soc. Sci. Med. 2010, 70, 816–822. [Google Scholar] [CrossRef] [PubMed]
  2. Kong, F.; Yin, H.; Nakagoshi, N. Using GIS and landscape metrics in the hedonic price modeling of the amenity value of urban green space: A case study in Jinan City, China. Landsc. Urban Plan. 2007, 79, 240–252. [Google Scholar] [CrossRef]
  3. Chen, X.; Su, Y.; Li, D.; Huang, G.; Chen, W.; Chen, S. Study on the cooling effects of urban parks on surrounding environments using Landsat TM data: A case study in Guangzhou, southern China. Int. J. Remote Sens. 2012, 33, 5889–5914. [Google Scholar] [CrossRef]
  4. Bekele, S.E. Parkland agroforestry of Ethiopia; key to production, productivity, biodiversity conservation and climate change mitigation: A review. Open J. For. 2018, 8, 472. [Google Scholar] [CrossRef]
  5. Zhang, R.; Peng, S.; Sun, F.; Deng, L.; Che, Y. Assessing the social equity of urban parks: An improved index integrating multiple quality dimensions and service accessibility. Cities 2022, 129, 103839. [Google Scholar] [CrossRef]
  6. Wu, L.; Kim, S.K. Exploring the equality of accessing urban green spaces: A comparative study of 341 Chinese cities. Ecol. Indic. 2021, 121, 107080. [Google Scholar] [CrossRef]
  7. Chen, Q.; Hou, Y.; Wu, S. Assessment of Accessibility to Urban Parks in Shaoxing City from the Perspective of Opportunity Equity. Sci. Geogr. Sin. 2016, 36, 375–383. [Google Scholar]
  8. Jian, I.Y.; Luo, J.; Chan, E.H.W. Spatial justice in public open space planning: Accessibility and inclusivity. Habitat Int. 2020, 97, 102122. [Google Scholar] [CrossRef]
  9. Wang, D.; Brown, G.; Liu, Y. The physical and non-physical factors that influence perceived access to urban parks. Landsc. Urban Plan. 2015, 133, 53–66. [Google Scholar] [CrossRef]
  10. Bai, H.; Wilhelm Stanis, S.A.; Kaczynski, A.T.; Besenyi, G.M. Perceptions of neighborhood park quality: Associations with physical activity and body mass index. Ann. Behav. Med. 2013, 45 (Suppl. S1), S39–S48. [Google Scholar] [CrossRef]
  11. Cojanu, V.; Dobre, R.; Pătru-Stupariu, I. The Accessibility Buffer—A Basic GIS Tool in Determining the Competitive Potential Index. Procedia Environ. Sci. 2012, 14, 237–246. [Google Scholar] [CrossRef]
  12. Yang, R.; Liu, Y.; Liu, Y.; Liu, H.; Gan, W. Comprehensive public transport service accessibility index—A new approach based on degree centrality and gravity model. Sustainability 2019, 11, 5634. [Google Scholar] [CrossRef]
  13. Östh, J.; Reggiani, A.; Galiazzo, G. Novel methods for the estimation of cost-distance decay in potential accessibility models. In Accessibility and spatial interaction; Edward Elgar: Cheltenham, UK, 2014; Volume 2, p. 15. [Google Scholar]
  14. Comber, A.; Brunsdon, C.; Green, E. Using a GIS-based network analysis to determine urban greenspace accessibility for different ethnic and religious groups. Landsc. Urban Plan. 2008, 86, 103–114. [Google Scholar] [CrossRef]
  15. McGrail, M.R.; Humphreys, J.S. Measuring spatial accessibility to primary care in rural areas: Improving the effectiveness of the two-step floating catchment area method. Appl. Geogr. 2009, 29, 533–541. [Google Scholar] [CrossRef]
  16. Kun, W.; Hao, S.; Xu, Y.; Xian, M.; Zhang, Q. Accessibility analysis of urban parks based on GIS. In Proceedings of the 2012 Fifth International Conference on Information and Computing Science, Liverpool, UK, 24–25 July 2012; pp. 56–59. [Google Scholar]
  17. Lu, N.; Li, J.; Yan, H.; Shi, T.; Li, Y. Analysis on accessibility of urban park green space: The case study of Shenyang Tiexi District. Yingyong Shengtai Xuebao 2014, 25, 2951–2958. [Google Scholar] [PubMed]
  18. Hu, M.X. Applications of GIS-based accessibility and spatial autocorrelation analysis in the green space system planning—A case study of Jiangyin. Chin. Landsc. Archit. 2010, 9, 20–24. [Google Scholar]
  19. Wu, H.; Liu, L.; Yu, Y.; Peng, Z. Evaluation and planning of urban green space distribution based on mobile phone data and two-step floating catchment area method. Sustainability 2018, 10, 214. [Google Scholar] [CrossRef]
  20. Chen, X.; Jia, P. A comparative analysis of accessibility measures by the two-step floating catchment area (2SFCA) method. Int. J. Geogr. Inf. Sci. 2019, 33, 1739–1758. [Google Scholar] [CrossRef]
  21. Hu, S.; Song, W.; Li, C.; Lu, J. A multi-mode Gaussian-based two-step floating catchment area method for measuring accessibility of urban parks. Cities 2020, 105, 102815. [Google Scholar] [CrossRef]
  22. Li, Y.; Xie, Y.; Sun, S.; Hu, L. Evaluation of Park Accessibility Based on Improved Gaussian Two-Step Floating Catchment Area Method: A Case Study of Xi’an City. Buildings 2022, 12, 871. [Google Scholar] [CrossRef]
  23. Li, X.; Huang, Y.; Ma, X. Evaluation of the accessible urban public green space at the community-scale with the consideration of temporal accessibility and quality. Ecol. Indic. 2021, 131, 108231. [Google Scholar] [CrossRef]
  24. Wolch, J.R.; Byrne, J.; Newell, J.P. Urban green space, public health, and environmental justice: The challenge of making cities ‘just green enough’. Landsc. Urban Plan. 2014, 125, 234–244. [Google Scholar] [CrossRef]
  25. Liu, B.; Tian, Y.; Guo, M.; Tran, D.; Alwah, A.A.Q.; Xu, D. Evaluating the disparity between supply and demand of park green space using a multi-dimensional spatial equity evaluation framework. Cities 2022, 121, 103484. [Google Scholar] [CrossRef]
  26. Alessandro, R. A complex landscape of inequity in access to urban parks: A literature review. Landsc. Urban Plan. 2016, 153, 160–169. [Google Scholar]
  27. Rigolon, A. Parks and young people: An environmental justice study of park proximity, acreage, and quality in Denver, Colorado. Landsc. Urban Plan. 2017, 165, 73–83. [Google Scholar] [CrossRef]
  28. Li, Y.Y.; Ren, B.T.; Chen, Y.S.; Huang, L.C.; Sun, C.G. Multiscale spatiotemporal dynamics analysis of urban green space: Implications for green space planning in the rapid urbanizing Hefei City, China. Front. Ecol. Evol. 2022, 10, 998111. [Google Scholar] [CrossRef]
  29. CJJT 85-2017S; Standard for Classification of Urban Green Space. China Architecture & Building Press: Beijing, China, 2017.
  30. GBT51346-2019; Standard for Planning of Urban Green Space. China Architecture & Building Press: Beijing, China, 2019.
  31. Wang, Z.; Li, Z.; Cheng, H. The equity of urban park green space accessibility in large Chinese cities: A case study of Wuhan City. Prog. Geogr. 2022, 41, 621–635. [Google Scholar] [CrossRef]
  32. Zhu, Y.; Tian, D.; Yan, F. Effectiveness of entropy weight method in decision-making. Math. Probl. Eng. 2020, 2020, 3564835. [Google Scholar] [CrossRef]
  33. Delgado, A.; Romero, I. Environmental conflict analysis using an integrated grey clustering and entropy-weight method: A case study of a mining project in Peru. Environ. Model. Softw. 2016, 77, 108–121. [Google Scholar] [CrossRef]
  34. Sahoo, M.M.; Patra, K.C.; Swain, J.B.; Khatua, K.K. Evaluation of water quality with application of Bayes’ rule and entropy weight method. Eur. J. Environ. Civ. Eng. 2017, 21, 730–752. [Google Scholar] [CrossRef]
  35. Paul, L.C.; Al Sumam, A. Face recognition using principal component analysis method. Int. J. Adv. Res. Comput. Eng. Technol. (IJARCET) 2012, 1, 135–139. [Google Scholar]
  36. Bro, R.; Smilde, A.K. Principal component analysis. Anal. Methods 2014, 6, 2812–2831. [Google Scholar] [CrossRef]
  37. Yang, Y.; Bao, W.; Liu, Y. Coupling coordination analysis of rural production-living-ecological space in the Beijing-Tianjin-Hebei region. Ecol. Indic. 2020, 117, 106512. [Google Scholar] [CrossRef]
  38. Li, W.; Wang, Y.; Xie, S.; Cheng, X. Coupling coordination analysis and spatiotemporal heterogeneity between urbanization and ecosystem health in Chongqing municipality, China. Sci. Total Environ. 2021, 791, 148311. [Google Scholar] [CrossRef] [PubMed]
  39. An, S.; Zhang, S.; Hou, H.; Zhang, Y.; Xu, H.; Liang, J. Coupling coordination analysis of the ecology and economy in the Yellow River Basin under the background of high-quality development. Land 2022, 11, 1235. [Google Scholar] [CrossRef]
  40. Wang, D.; Tan, D.; Liu, L. Particle swarm optimization algorithm: An overview. Soft Comput. 2018, 22, 387–408. [Google Scholar] [CrossRef]
  41. Venter, G.; Sobieszczanski-Sobieski, J. Particle swarm optimization. AIAA J. 2003, 41, 1583–1589. [Google Scholar] [CrossRef]
  42. Chen, Z.; Xu, B.; Devereux, B. Urban landscape pattern analysis based on 3D landscape models. Appl. Geogr. 2014, 55, 82–91. [Google Scholar] [CrossRef]
  43. Dadashpoor, H.; Azizi, P.; Moghadasi, M. Land use change, urbanization, and change in landscape pattern in a metropolitan area. Sci. Total Environ. 2019, 655, 707–719. [Google Scholar] [CrossRef]
  44. Peng, J.; Xie, P.; Liu, Y.; Ma, J. Urban thermal environment dynamics and associated landscape pattern factors: A case study in the Beijing metropolitan region. Remote Sens. Environ. 2016, 173, 145–155. [Google Scholar] [CrossRef]
  45. McGarigal, K. Fragstats Help; University of Massachusetts: Amherst, MA, USA, 2015; p. 182. [Google Scholar]
  46. Fan, Y.; Fang, C.; Zhang, Q. Coupling coordinated development between social economy and ecological environment in Chinese provincial capital cities-assessment and policy implications. J. Clean. Prod. 2019, 229, 289–298. [Google Scholar] [CrossRef]
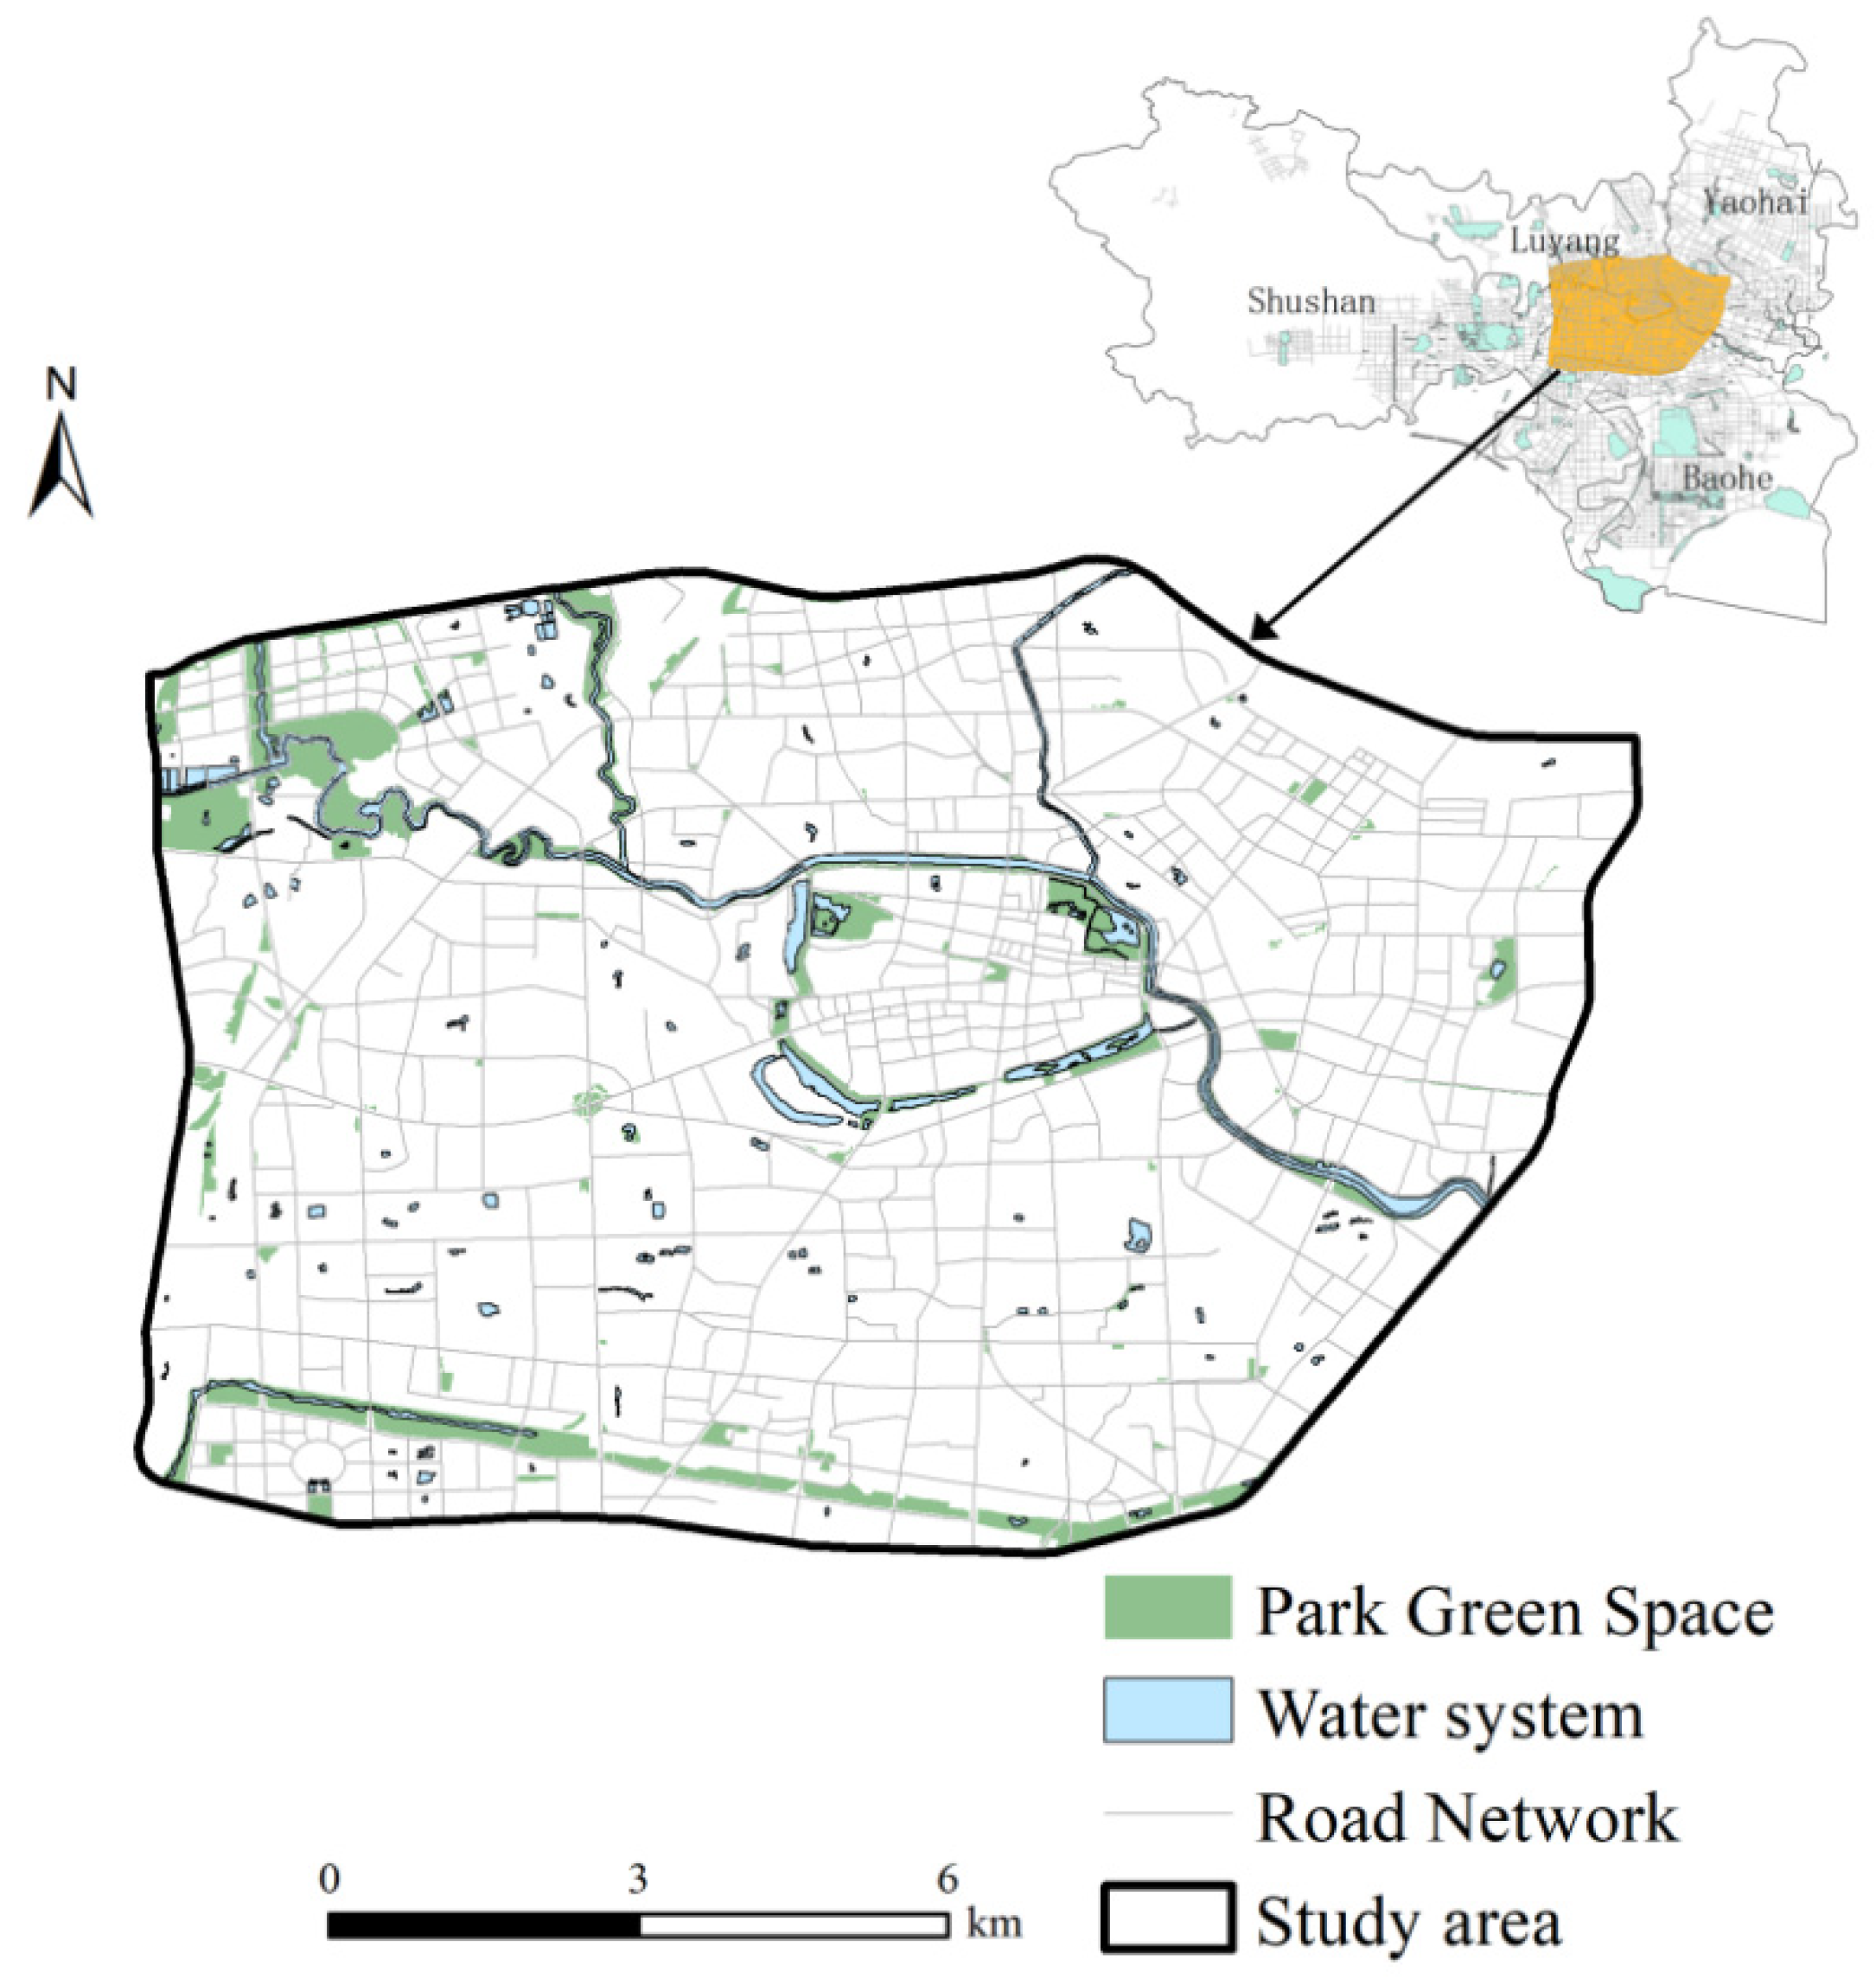
Figure 1. Park green space distribution map of the study area.
Buildings 13 02731 g001
Figure 2. Park green space distribution map and buffer zone in the study area.
Buildings 13 02731 g002
Figure 3. Population distribution map of the study area.
Buildings 13 02731 g003
Figure 4. Technical flow chart.
Buildings 13 02731 g004
Figure 5. Calculation of green space accessibility in the central city of Hefei.
Buildings 13 02731 g005
Figure 6. Street-scale accessibility of green spaces in the city center of Hefei.
Buildings 13 02731 g006
Figure 7. Clustering curves.
Buildings 13 02731 g007
Figure 8. Results for the optimal locations of park green spaces.
Buildings 13 02731 g008
Table 1. Service radii of different types of parks.
TypeService Radius (m)Appropriate Scale (hm2)
Comprehensive park3000≥50
200020–50
120010–20
Spatial park200020–50
120010–20
8005.0–10.0
Residential parkCommunity park8005.0–10.0
5001.0–5.0
Garden tour3000.2–1.0
Table 2. Index of the number of parks and green spaces in each district.
Number of ParksPark Green Area (hm2)Per Capita Green Space (Square Meters/Person)Proportion of Green Space
Yaohai2256.11.062.94%
Luyang36291.216.1312.52%
Shushan36288.314.198.44%
Baohe24143.953.336.54%
Table 3. Index of the number of parks and green spaces in each district (standardization).
Number of ParksPark Green AreaPer Capita Green SpaceProportion of Green Space
Yaohai0 000
Luyang1 1 1 1
Shushan1 0.988 0.617 0.574
Baohe0.143 0.374 0.448 0.376
Table 4. Landscape pattern index of park green space.
PDLPILSIAREA_AMSHAPE_MNDIVISIONMESHSPLITAI
Yaohai2.136293.29593.0461916.05111.39450.12911916.05111.148397.0055
Luyang3.093887.85514.72561800.05661.39120.22651800.05661.292994.8228
Shushan1.813591.30793.57382853.12791.41270.16542853.12791.198296.938
Baohe1.887597.05242.2961796.67121.32340.0581796.67121.061698.0636
Table 5. Landscape pattern index of park green space (standardization).
PD LPI LSI AREA_AMSHAPE_MN DIVISION MESH SPLIT AI
Yaohai0.748 0.592 0.691 0.887 0.204 0.578 0.113 0.625 0.674
Luyang0 0 0 0.997 0.241 0 0.003 0 0
Shushan1 0.375 0.474 0 0 0.363 1 0.409 0.653
Baohe0.942 1 1 1 1 1 0 1 1
Table 6. Accessibility classification of green spaces in each street in the downtown area of Hefei.
Accessibility LevelNumber of StreetsContains Street
Very good9Bijiashan Street, Dayang Town, High-Tech Industrial Development Zone, Silihe Street, Jinggang Town, Shengli Road Street, Chengdong Street, Heyedi Street, Heping Road Street
Good4Fangmiao Street, Sanxiaokou Street, Changqing Street, Nanqi Street
General5Bozhou Road Street, Xiaoyaojin Street, Amber Street, Wulitun Street, Daoxiangcun Street
Poor9Changhuai Street, Mingguang Road Street, Tongan Street, Qili Station Street, Baogong Street, Wanghu Street, Sanlian Street, Tongling Road Street, Shuanggang Street
Very poor8Wuhu Road Street, Datong Road Street, Xiyuan Street, Chezhan Street, Haitang Street, Sanlijie Street, Xinglin Street, Feihe Street
Disclaimer/Publisher’s Note: The statements, opinions and data contained in all publications are solely those of the individual author(s) and contributor(s) and not of MDPI and/or the editor(s). MDPI and/or the editor(s) disclaim responsibility for any injury to people or property resulting from any ideas, methods, instructions or products referred to in the content.