Review

Comprehensive Review of Direct and Indirect Pozzolanic Reactivity Testing Methods

by
Farzaneh Elyasigorji
1,
Farhad Farajiani
1,
Milad Hajipour Manjili
2,
Qian Lin
3,
Sina Elyasigorji
1,
Visar Farhangi
4 and
Habib Tabatabai
1,*
1
Department of Civil & Environmental Engineering, University of Wisconsin-Milwaukee, Milwaukee, WI 53211, USA
2
Department of Materials Science and Engineering, University of Wisconsin-Milwaukee, Milwaukee, WI 53211, USA
3
Collage of Civil Engineering and Architecture, Guangxi University, Nanning 530004, China
4
Department of Civil Engineering, Construction Management, and Environmental Engineering, Northern Arizona University, Flagstaff, AZ 86011, USA
*
Author to whom correspondence should be addressed.
Buildings 2023, 13(11), 2789; https://doi.org/10.3390/buildings13112789
Submission received: 13 October 2023 / Revised: 29 October 2023 / Accepted: 1 November 2023 / Published: 6 November 2023

Abstract

:
The production of portland cement is among the major contributors to greenhouse gas emissions that adversely affect the environment. Identifying sustainable materials to partially replace portland cement in concrete, such as pozzolanic materials, is crucial in addressing this issue. These materials mainly consist of silica and alumina that react with the available calcium hydroxide to form strength-bearing phases such as calcium silicate hydrates. Understanding the degree of pozzolanic reactivity of materials using efficient reactivity test methods is an important consideration. The paper thoroughly reviews the available literature related to direct and indirect pozzolanic reactivity test methods that have been utilized over the years. Direct methods quantify the amount of consumed calcium hydroxide, whereas indirect methods assess changes in the physical properties of the specimen due to pozzolanic reactions. The aim of this paper is to identify affordable, time-saving, and effective direct and indirect methods. Based on this study, the Frattini, electrical conductivity, and pH tests are considered the most time-efficient methods to assess pozzolanic materials. Electrical conductivity and pH tests are also easy to perform. In contrast, other methods are more time-consuming.

1. Introduction

Approximately 7% of the anthropogenic emissions worldwide (i.e., CO2) are related to the production of ordinary portland cement [1] To reduce the economic and environmental costs of portland cement production and to improve the durability of concrete, supplementary cementitious materials (SCMs) are commonly used to partially replace cement in concrete. According to Suraneni et al. [2] SCMs are classified into three types: inert, hydraulic, pozzolanic, and highly pozzolanic materials.
Pozzolans are primarily siliceous in nature and contribute to the densification of the microstructure of concrete by reacting with water and hydrated cement paste to form additional strength-bearing phases [3]. According to ASTM C618 [4], the sum of SiO2, Al2O3, and Fe2O3 shall be 70% for the for a raw pozzolan, and 50% for Class F and C fly ashes, to be considered as pozzolan. Pozzolans stabilize portlandite (Ca(OH)2), which is produced during cement hydration reactions, to form calcium silicate hydrates (C–S–H), calcium aluminate hydrates (C–A–H), or calcium aluminosilicate hydrates (C–A–S–H). Pozzolanic reactivity can be directly measured based on Ca(OH)2 reduction and the formation of hydrated phases [5]. Figure 1 demonstrates the schematic mechanism of the strength development caused by pozzolanic reaction products [6].
Three stages express the progression of a pozzolanic reaction. The first stage is the dissolution of lime in water (Equation (1)), which provides a strongly basic medium (pH > 12). Typically, Ca(OH)2 forms during the hydration of the main cement phases (alite and belite). The second stage is the dissolution of amorphous silica from the pozzolan (Equation (2)), and the third stage is the reaction of H2SiO42− with calcium ions to form C–S–H (CaO.SiO2.H2O) (Equation (3)) [7].
Ca(OH)2 ⇄ Ca2+ + 2OH
SiO2 + 2OH ⇄ H2SiO42−
H2SiO42− + Ca2+ ⇄ CaO.SiO2. H2O
The cement hydration process predominates over the pozzolanic reaction in the early stages of concrete production. However, at later stages the pozzolanic reaction outweighs the cement hydration with a gradual reduction in the portlandite content within the paste and the formation of additional C–S–H [7].
It is important to note that different methods are utilized to evaluate the reactivity of SCMs, and using only one method may lead to misleading results [8]. The pozzolanic reactivity tests consist of direct and indirect methods. In general, direct methods (e.g., Frattini and thermogravimetric analysis) employ analytical means to assess the ability of pozzolans to consume free lime and form hydration compounds [9]. Direct methods provide direct insight into the amount of portlandite consumed for the formation of the hydrates [10]. The Frattini test employs chemical titration to determine calcium and hydroxyl ion concentrations and evaluate the reduction in portlandite caused by pozzolanic reactions [11,12]. Thermal gravimetric and differential thermal analyses (TG/DTA) compare the weight loss of the sample containing pozzolan with that of a control sample at certain temperatures to evaluate pozzolanic reactivity [10]. X-ray diffraction (XRD) provides another direct method that can not only detect and characterize the main phases in hydrated samples, but can also quantify the Ca(OH)2 consumption [13,14].
In contrast to direct methods, indirect methods demonstrate the extent of pozzolanic reactivity by measuring the physical property of a test specimen [10,11,13]. For instance, the strength activity index (SAI) is an indirect indication of the effect of pozzolanic reactivity on compressive strength. Calorimetry is another indirect method for assessing pozzolanic reactivity by measuring the heat of hydration in samples containing pozzolanic materials [15,16,17,18]. In addition, scanning electron microscopy- energy-dispersive X-ray spectroscopy (SEM/EDS) can be used as an indirect method to estimate the Ca/Si ratio of the C–S–H gel and identify a reactive pozzolan. The Ca/Si ratio of the C–S–H gel for the pozzolanic reaction is lower than the Ca/Si ratio of C–S–H from the hydration of cement [19,20,21]. Electrical conductivity and pH are also other indirect methods for assessing pozzolanic reactivity. The pozzolanic reactivity can be assessed through measurement of changes in electrical conductivity and pH of a lime-pozzolan suspension in a certain time [9,11,13,22,23,24]. Ultrasonic pulse velocity (UPV) is another method that can be used to indirectly examine the interaction between portlandite and pozzolanic materials in concrete composites [25] As a result of the pozzolanic reaction and the formation of C–S–H gel, the pores are filled and refined leading to an increase in UPV [26,27,28]. Therefore, in a similar manner to SAI, the ultrasonic pulse velocity index (UPVI) can be used indirectly to assess pozzolanic reactivity [29].
In 2016, an indirect test method called Rapid, Relevant, and Reliable (R3) was introduced to assess the pozzolanic reactivity of calcined clays and to identify other pozzolanic materials [30,31]. The R3 test offers two methods for the analysis of a paste of pozzolanic material and lime (2:1 mixture of pozzolan and lime and a water-to-solid ratio of 1.2). The first R3 method involves measuring the heat released during exothermal hydration reactions through isothermal calorimetry. The second R3 method is centered on determining the bound water content, achieved using the thermogravimetric approach within the temperature range of 110 to 400 degrees [30]. The ASTM C1897 standard offers a choice of the two R3 options (Method A or B) [32].
This paper reviews several common direct and indirect test methods that have been used for evaluating the reactivity of pozzolanic materials in concrete, including Frattini, TG/DTA, calorimetry, SAI, R3, electrical conductivity, and pH. This paper also reviews the XRD, SEM/EDS, and UPVI techniques for the first time. The pozzolanic reactivity methods are reviewed in this paper to identify efficient, affordable, and rapid methods. Various methods are comparatively assessed with respect to cost of the major equipment needed to perform the tests and the time it takes to perform them.

2. Research Significance

Pozzolanic materials can contribute to reducing the adverse effects of carbon and greenhouse emissions on the environment as a replacement for hazardous materials such as ordinary Portland cement. In this context, thorough evaluations of the direct and indirect pozzolanic reactivity methods to discover suitable pozzolanic materials are imperative. The key objective of this study is to offer a profound review of direct and indirect pozzolanic reactivity test methods and identify efficient methods that can be used to evaluate these materials in a reliable, affordable, and time-saving manner. The results of this study will also enable engineers, researchers, members of the construction industry, and the academic community to further recognize and effectively utilize pozzolanic materials in concrete formulations. As a result, such an approach will contribute to reducing the carbon footprint of construction projects, which is very significant for the environment.

3. Direct Methods

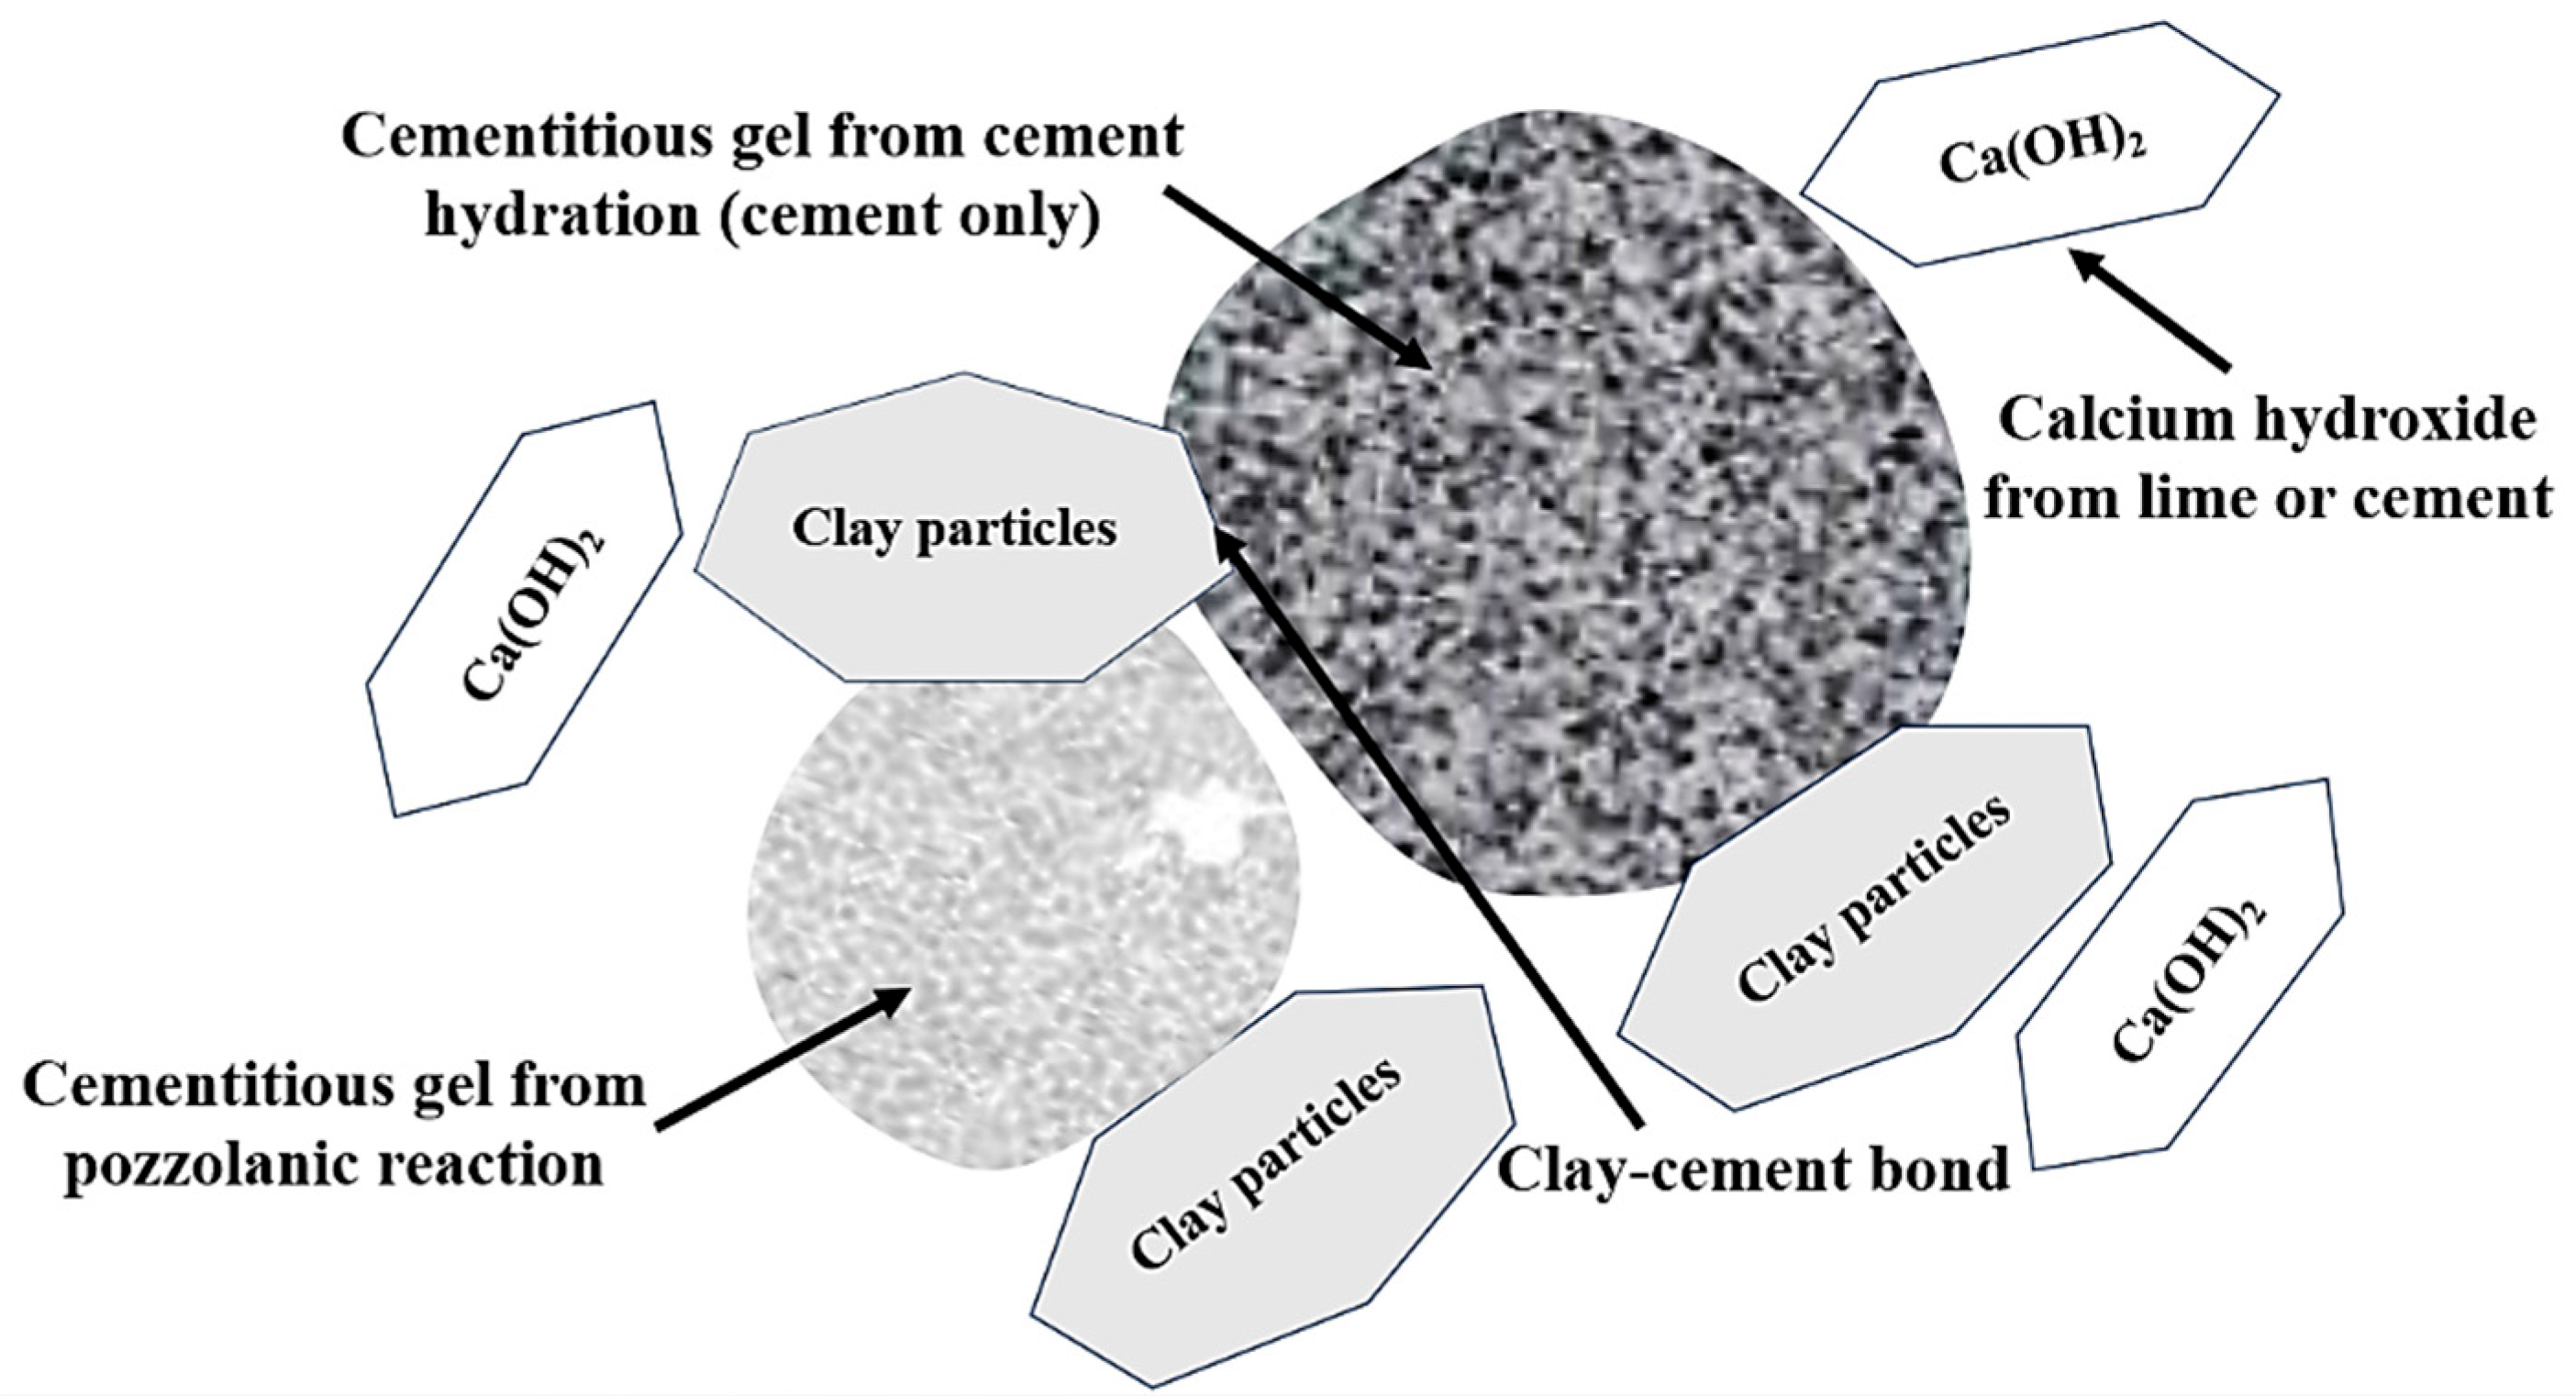
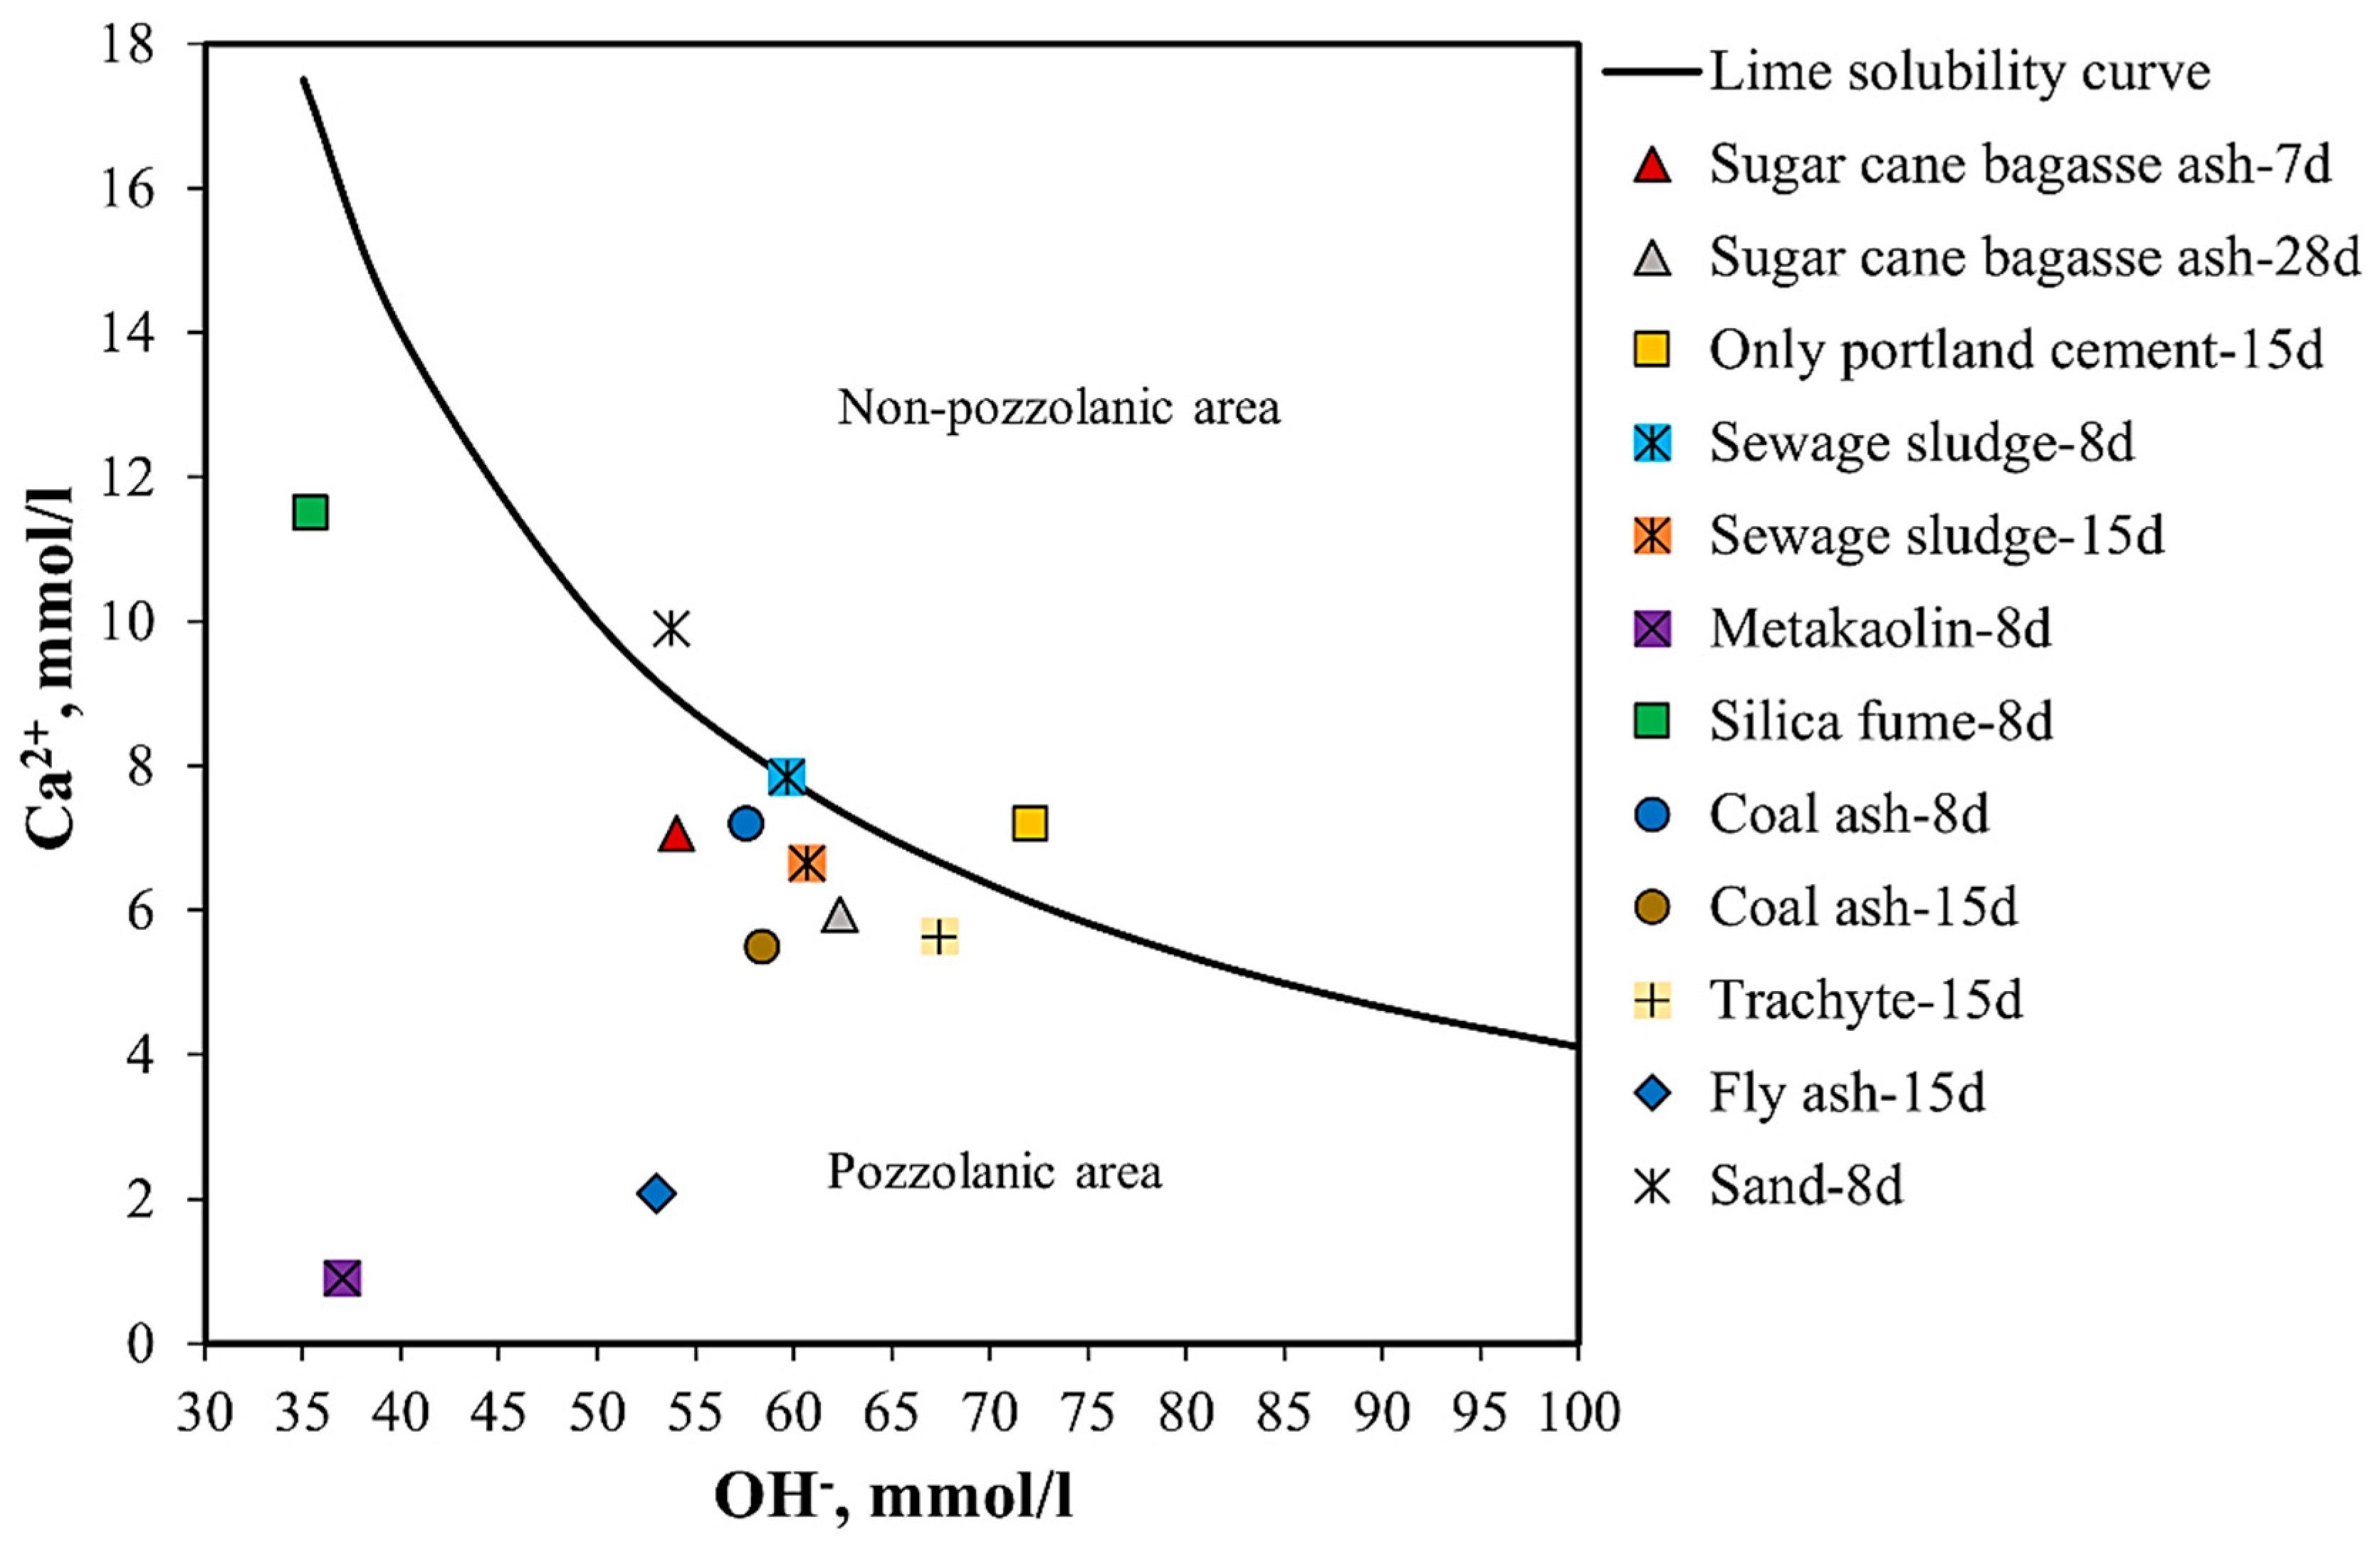
3.1. The Frattini Chemical Titration Method

This test was first developed by N. Frattini and was later adopted by the EN 196-5 standard [33]. Using this standard procedure, it is possible to quantify the lime consumed during the pozzolanic reaction in an aqueous solution containing a sample at a temperature of 40 °C [34]. The pozzolanic reactivity can be measured by quantifying the number of calcium ions (Ca2+) in the aqueous solution in contact with the hydrated cement with time (e.g., 8 or 15 days) [35]. Figure 2 shows a diagram for assessing the pozzolanic activity provided in EN 169-5. Results that fall below the lime solubility curve show pozzolanic reactivity, as indicated by the removal of Ca2+ from the solution [36]. Decreasing the hydroxyl content results in increasing C–S–H and C–A–S–H nuclei [37]. The lime solubility curve represents the maximum Ca2+ concentration as a function of OH at 40 °C using Equation (4) [11], where Ca2+, equivalent to CaO in mmol/l, is linked to OH in mmol/l [35].
Max   C a O = 350 O H 15
According to the BS EN 196-5 standard [35], the Frattini test sample weighs 20 g and is prepared by mixing 80% cement and 20% finely ground pozzolan in 100 mL of deionized water. After preparation, the sample is placed in an oven at 40 °C for a period of between 8 and 15 days. After the specified test period, the sample is vacuum filtered using a dry double filter paper with a pore size of 2 µm and allowed to cool down at room temperature. The filtered solution is then analyzed for the OH and Ca 2 + concentrations using titration. The OH concentration can be found using titration against a 0.1 mol/l diluted hydrochloric acid solution using a methyl orange indicator. After adjusting the pH of the titrated solution to 12.5 ± 0.2 with the addition of sodium hydroxide, the Ca 2 + concentration can be analyzed through titration against a 0.03 mol/l EDTA solution using one of the suggested indicators (murexide, calcon, or Patton and Reeder’s).
Studies have shown that there is a good correlation between the Frattini test results and some other pozzolanic reactivity test methods. For instance, Donatello et al. [11] compared three different pozzolanic activity test methods, including the Frattini, SAI, and the saturated lime test. Using these methods, they evaluated the reactivity of metakaolin, silica fume, coal fly ash, incinerated sewage sludge ash (ISSA), and sand (as an inert material). The authors concluded that the Frattini test and the SAI were significantly correlated and were closely controlled methods. In contrast, the saturated lime test results did not correlate with the other results. Also, the saturated lime test showed positive pozzolanic reactivity for sand and ISSA. In the Frattini test, however, these materials did not exhibit pozzolanic reactivity. Likewise, a study by Kramar and Ducman [10] indicated that the Frattini and SAI results indicated similar trends for the various ash samples tested. Several other pozzolan assessment studies have been performed using the Frattini test. Figure 3 represents the Frattini test results for different materials (with 80% portland cement and 20% pozzolan) collected from various studies [10,11,33,38,39,40]. The Frattini test can distinguish pozzolans from non-pozzolanic materials such as portland cement and sand.
There is an indication that some pozzolans show reactivity at a later stage. For example, in a study by Alayish and Çelik [33], sewage sludge did not show reactivity at 8 days, but it showed reactivity at 15 days. In addition, for some pozzolans (like coal ash), the rate of reactivity was higher at a later stage [10]. This is because Frattini is a time-sensitive test for detecting pozzolanic reactivity. Trusilewicz et al. [34] observed that higher metakaolin showed higher pozzolanic reactivity at later stages as more Ca2+ and OH ions were consumed. Similarly, Rahhal et al. [41] observed that the pozzolanic reactivity of waste brick powder as partial cement replacement improved with age and a higher cement replacement level [42,43].
In another study using the Frattini test [36], the pozzolanic reactivity of volcanic tuffs and fly ash was investigated at the age of 15 days with different cement replacement ratios. All tested materials demonstrated pozzolanic reactivity [39]. The authors reported that lime consumption increased with increasing pozzolan replacement ratios, which is consistent with the findings of other studies [34,41]. In an earlier study on the pozzolanic reactivity of rice husk ash, the amorphous silica content and particle fineness were noted as the main factors affecting reactivity in an alkaline environment [44]. Kramar and Ducman [10] also observed that ashes with a higher proportion of amorphous phase showed more reactivity by means of higher free lime removal.
In general, the Frattini test can help assess the ability of a pozzolan (that is, partially replacing cement) with respect to reducing portlandite content in a solution. However, it does not provide any information on the potential presence of portlandite in hardened pastes [45].

3.2. X-ray Diffraction Spectroscopy

X-ray diffraction spectroscopy, or XRD, is a powerful technique for the quantification of crystalline and amorphous phases [46]. This technique can not only detect and characterize the main phases such as quartz, muscovite, albite, chlorite, and calcite in pozzolan powders [13], but is also a direct method of quantifying consumption of Ca(OH)2 in hydrated samples [14]. Figure 4 demonstrates XRD peaks of the hydrated products, CH and C–A–S–H, for a hydrated cement sample partially replaced with brick powder.
Belie et al. [47] noted that the coexistence of an amorphous SCM and the C–S–H phase in hydrated blended cement presents an issue, since the C–S–H contribution may overlap with the SCM signal either partially (e.g., metakaolin) or completely (e.g., blast furnace slag). Thus, for correct quantification, the proper selection and calibration of a fingerprint model of C–S–H are required [47]. Du and Tan [48] used XRD patterns for cement paste with 30% and 60% glass powder replacement at curing stages of 7, 28, and 91 days. Their results showed that the principal peaks associated with Ca(OH)2 were weakened in samples with higher glass powder and later curing stage. For example, the Ca(OH)2 peak was relatively small for the paste with 60% glass powder at 91 days, indicating that most Ca(OH)2 had been consumed to form an additional C–S–H phase. At later stages, lime was not sufficiently available to fully react with the dissolved silicates of the glass powder [48]. In a study by Snellings et al. [17], it was observed that the XRD peaks associated with the main clinker phases (e.g., alite, belite, and celite) decreased for the blended cement pastes with partial fly ash replacement. On the other hand, the number of peaks associated with the hydration products increased [17]. The reduction in the number of the main clinker phases is related to an increase in the formation of hydration products such as ettringite (AFt), portlandite, and C–S–H during the hydration process [7]. In a study by Tognonvi et al. [7], hydrated lime samples containing 70% glass powder showed high carbonation (calcite peaks) at ages up to 28 days. However, samples that were cured for 91 days showed an absence of calcite and the appearance of C–S–H peaks because of the pozzolanic reaction of the glass powder with lime over time [7]. In another study [49], the effect of quartz powder and silica fume was investigated using XRD. Results showed that after 28 days, portlandite was only found in the portland cement reference sample and the sample with 20% cement replacement with quartz powder. In contrast, in the blended silica fume–cement sample, no portlandite was detected due to the consumption of portlandite and enhancement of C–S–H nuclei. That is an indication of the high pozzolanic reactivity of silica fume and the low pozzolanic reactivity of quartz powder [49].
Martins Torres et al. [14] measured the amount of portlandite in the calcined and non-calcined sugarcane bagasse ash (SBA) pastes with lime (CH–pozzolan) through the assessment of the relative decrease in peak intensities (RDPIs), relative intensity ratio (RIR) and Rietveld refinement. Relative estimation is performed by comparing the CH peaks of the control (only CH) and CH–pozzolan samples. The CH consumption from the pozzolanic reaction for the CH–pozzolan paste was quantified by studying the main CH peak intensities using the RDPI method (Equation (5)).
  Relative   consumed   CH   = CH   peak   intensity   of   CH pozzolan   paste CH   peak   intensity   of   control
XRD analyses demonstrated that the portlandite peak intensity decreased due to the pozzolanic reactivity of fine SBA. Moreover, SBA with a finer particle size and the calcined SBA demonstrated an additional reduction in the peak intensity of portlandite [14].

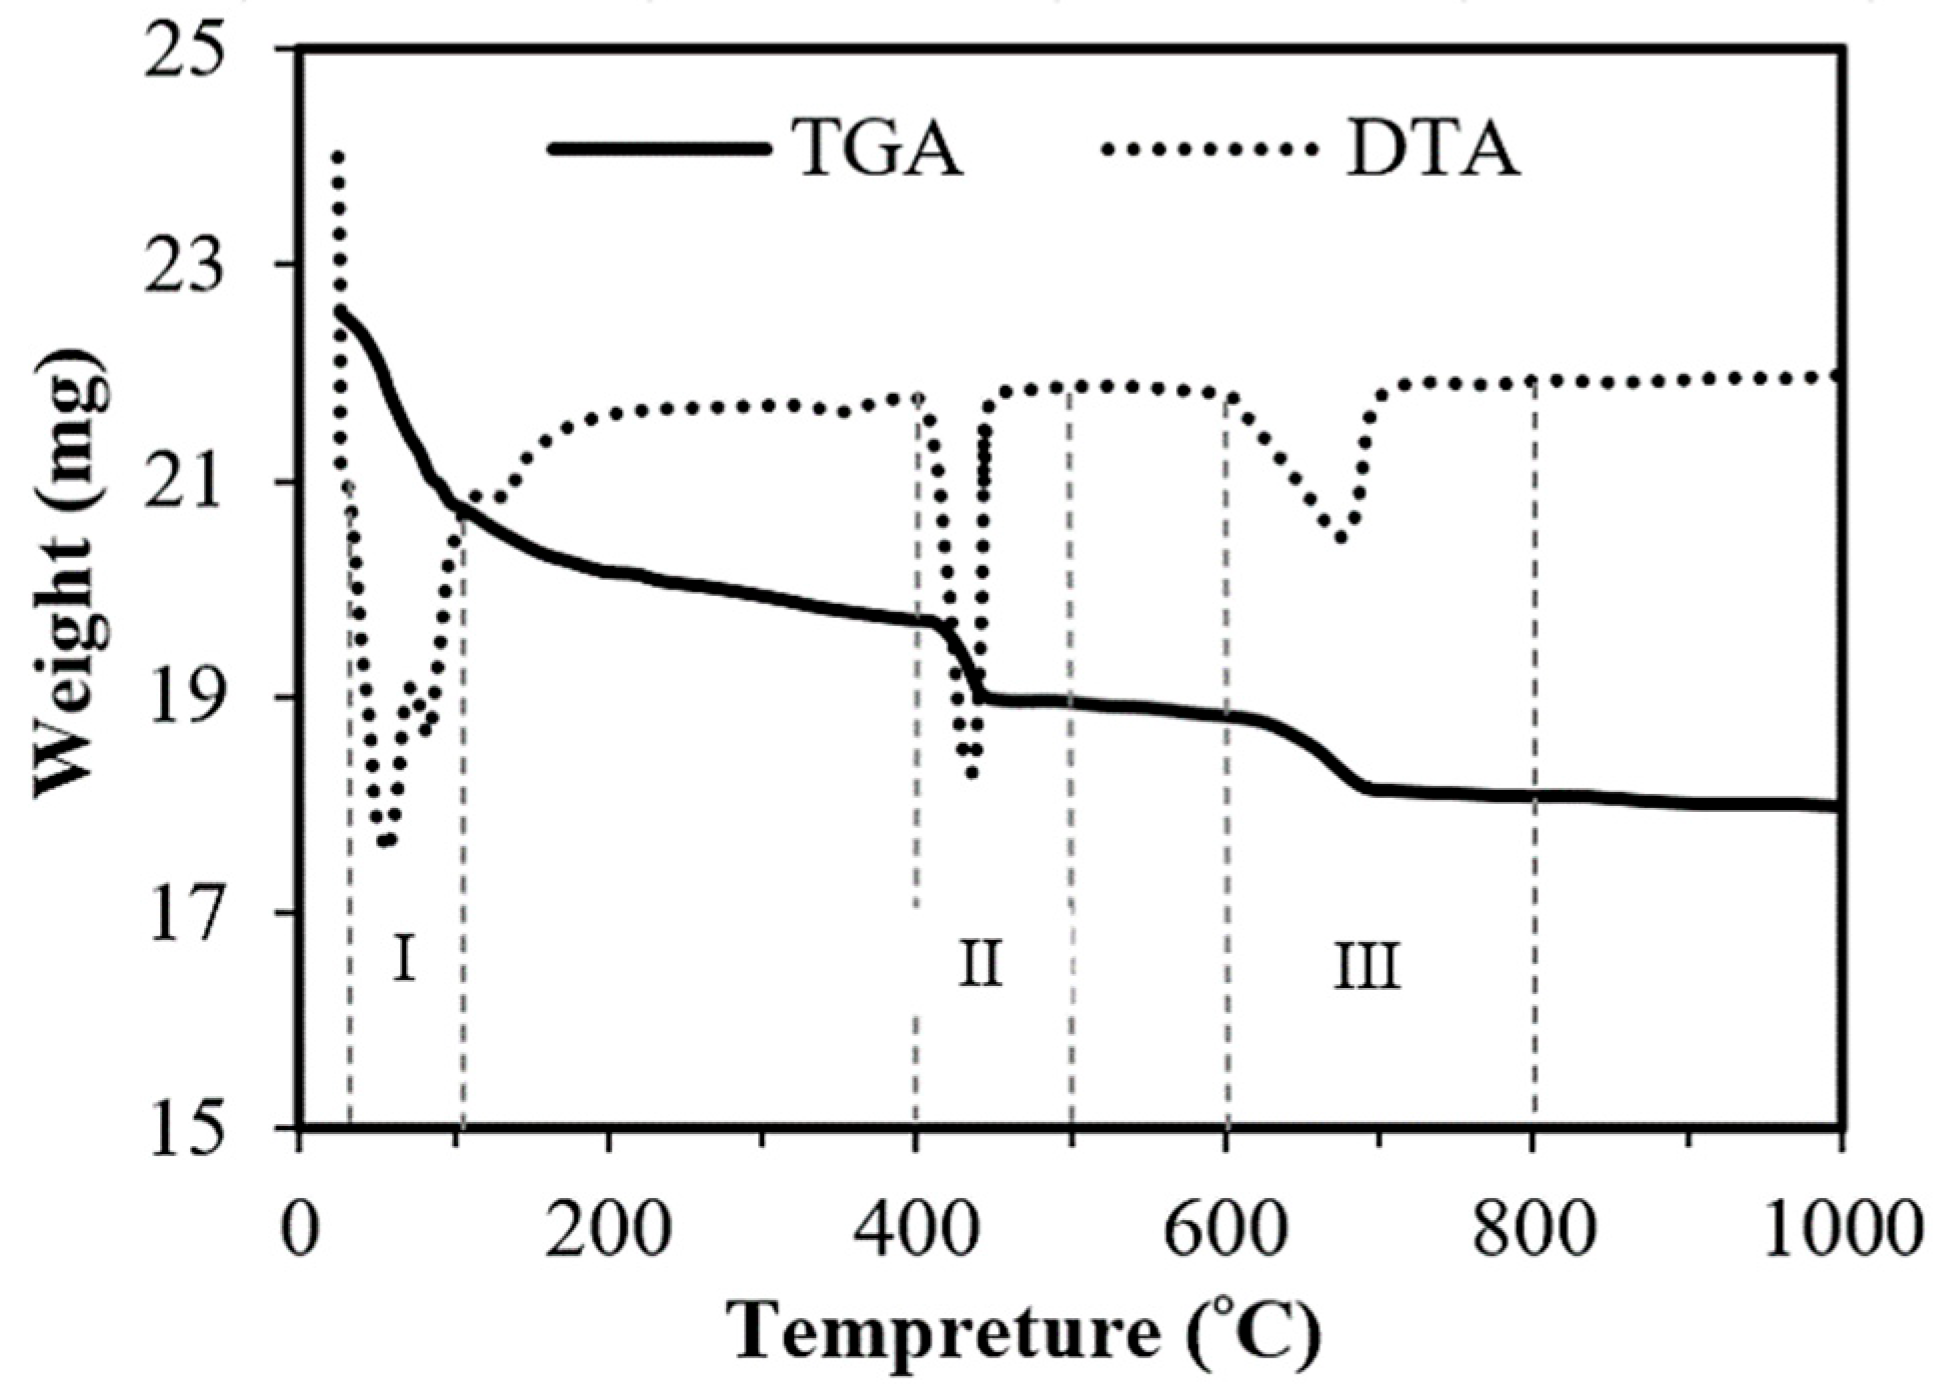
3.3. Thermogravimetric and Differential Thermal Analyses

Thermogravimetric (TG) and differential thermal analyses (DTA) have been widely used for the characterization of pozzolanic reactivity [10]. TG/DTA is one of the direct methods used to measure the amount of portlandite consumption [13,39,50]. TG analysis (TGA) is an analytical method that records the relationship between mass and temperature (TGA curve) on a thermal balance [51]. A TGA test measures the change in mass of a sample as a function of temperature or heating time [39]. The tangent method is used to calculate the percent weight change or mass loss of calcium hydroxide in the samples [51]. An indicator of pozzolanic reactivity is the amount of consumed portlandite in the lime–pozzolan (or cement–pozzolan) pastes measured with TG/DTA [52]. Typically, the portlandite content increases with age in samples that consist of plain portland cement due to the formation of additional hydration products with time. In contrast, the amount of portlandite in pastes containing SCMs is less than in plain cement samples because of a combination of the dilution effect and pozzolanic reaction [53]. Therefore, by determining the consumption of portlandite, the extent of reactivity of SCMs in the cement pastes can be evaluated [2]. The four main weight loss ranges typically identified by the TGA curve are as follows (Figure 5):
I.
Evaporable water decomposition is related to the loss of free water between 25 °C and 105 °C.
II.
Dehydroxylation of portlandite between 400 °C and 500 °C.
III.
Decarbonation corresponds to calcite (CaCO3) decomposition between 600 °C and 800 °C [54].
Proper sample preparation and interpretation of the TG/DTA are required for accurate determination of Ca(OH)2 [55]. The Ca(OH)2 content can be overestimated due to the carbonation effect when using traditional methods that only measure weight changes resulting from Ca(OH)2 decomposition at a fixed range of temperature. The temperature range for the decomposition of Ca(OH)2 depends on several factors, including particle fineness and the amount of sample, the degree of crystallinity of the material, and gas pressure in the thermogravimetry analysis instrument [55].
The remaining Ca(OH)2 can be calculated by considering the effect of carbonation using Equation (6) [13].
C H r = 4.11 m C H + 1.68   m C C
where CHr is the mass of remaining Ca(OH)2 in the sample, 4.11 is the molar mass ratio of Ca(OH)2/H2O, and 1.68 is the molar mass ratio of Ca(OH)2/CO2. m C H is the mass loss due to the decomposition of Ca(OH)2 (dehydroxylation), and m C C is the mass loss due to the decomposition of CaCO3 (decarbonation) [13].
The percentage of the consumed or fixed lime of the blended samples with respect to the control sample can also be calculated using Equation (7) [23].
Fixed   lime   % = C H r , c × C C H r , b ( C H r , c × C ) × 100
where C H r , c and C H r , b are the mass of remaining Ca(OH)2 in the control and blended cement samples, respectively. C is the proportion of cement in the blended samples (e.g., for a blended cement sample with 80% cement and 20% pozzolan, C is 0.8).
Various methods have been developed for preparing TGA mixtures. For example, Uzal et al. [50] prepared different mixtures of lime–pozzolan pastes to monitor lime depletion using TGA. They used Ca(OH)2 with a 1:1 lime:pozzolan ratio and a water-to-solid ratio of 0.55. Fresh pastes were kept in plastic syringes to avoid moisture loss and carbonation, and the samples were held at 50 ± 1 °C to accelerate the pozzolanic reaction. Then, the amount of consumed lime in the hardened pastes for each lime–pozzolan paste was calculated by performing the TGA test at 3, 7, and 28 days. Results were reported as a percentage of the total weight of the components. The authors studied the pozzolanic activity of a natural zeolite (clinoptilolite) in comparison with silica fume, fly ash, and a non-zeolitic natural pozzolan. From the TGA results, the portlandite depletion of silica fume was higher than all other tested pozzolans for all tested ages [50].
In other studies by Pacewska et al. [56] and Kramar and Ducman [10], samples were prepared by mixing 30% ash (fly ash and pulverized combusted brown coal) and 70% Ca(OH)2. Pastes were enclosed in hermetic plastic bags and stored at room temperature for the given time periods. Samples were pulverized, and powders were tested through TG/DTA after 7, 28, and 90 days. [10,56].
Kramar and Ducman [10] reported that samples containing ash with a higher surface area showed considerable portlandite consumption. On the other hand, Lima et al. [13] tested slate cutting waste (SCW) as a partial (25%) replacement of portland cement with water-to-binder ratio of 0.55. Pastes were cast in plastic molds to prevent carbonation, and were kept in sealed plastic bags in a wet chamber at 40 °C. After 28 and 56 days, dried pastes were ground and sieved using a No. 200 sieve and tested using TG/DTA. SCW showed no pozzolanic reactivity since it did not significantly reduce Ca(OH)2. Its filler effect and specific surface area reportedly played a significant role in enhancing the degree of hydration and compressive strength [13,57].
In some cases, TGA may not be able to detect pozzolanic reactivity at shorter reaction times, since the reaction typically does not produce a measurable weight change related to the total remained portlandite in the sample. For instance, Kramar and Ducman [10] tested a paper mill ash and reported that this pozzolan showed a slow rate of reactivity at seven days of hydration, as there was no significant weight change related to the total remaining portlandite in the sample, while significant mass loss was observed after 90 days [10]. Table 1 is a summary of studies using the TGA method to assess the pozzolanic reactivity of common pozzolans.

4. Indirect Methods

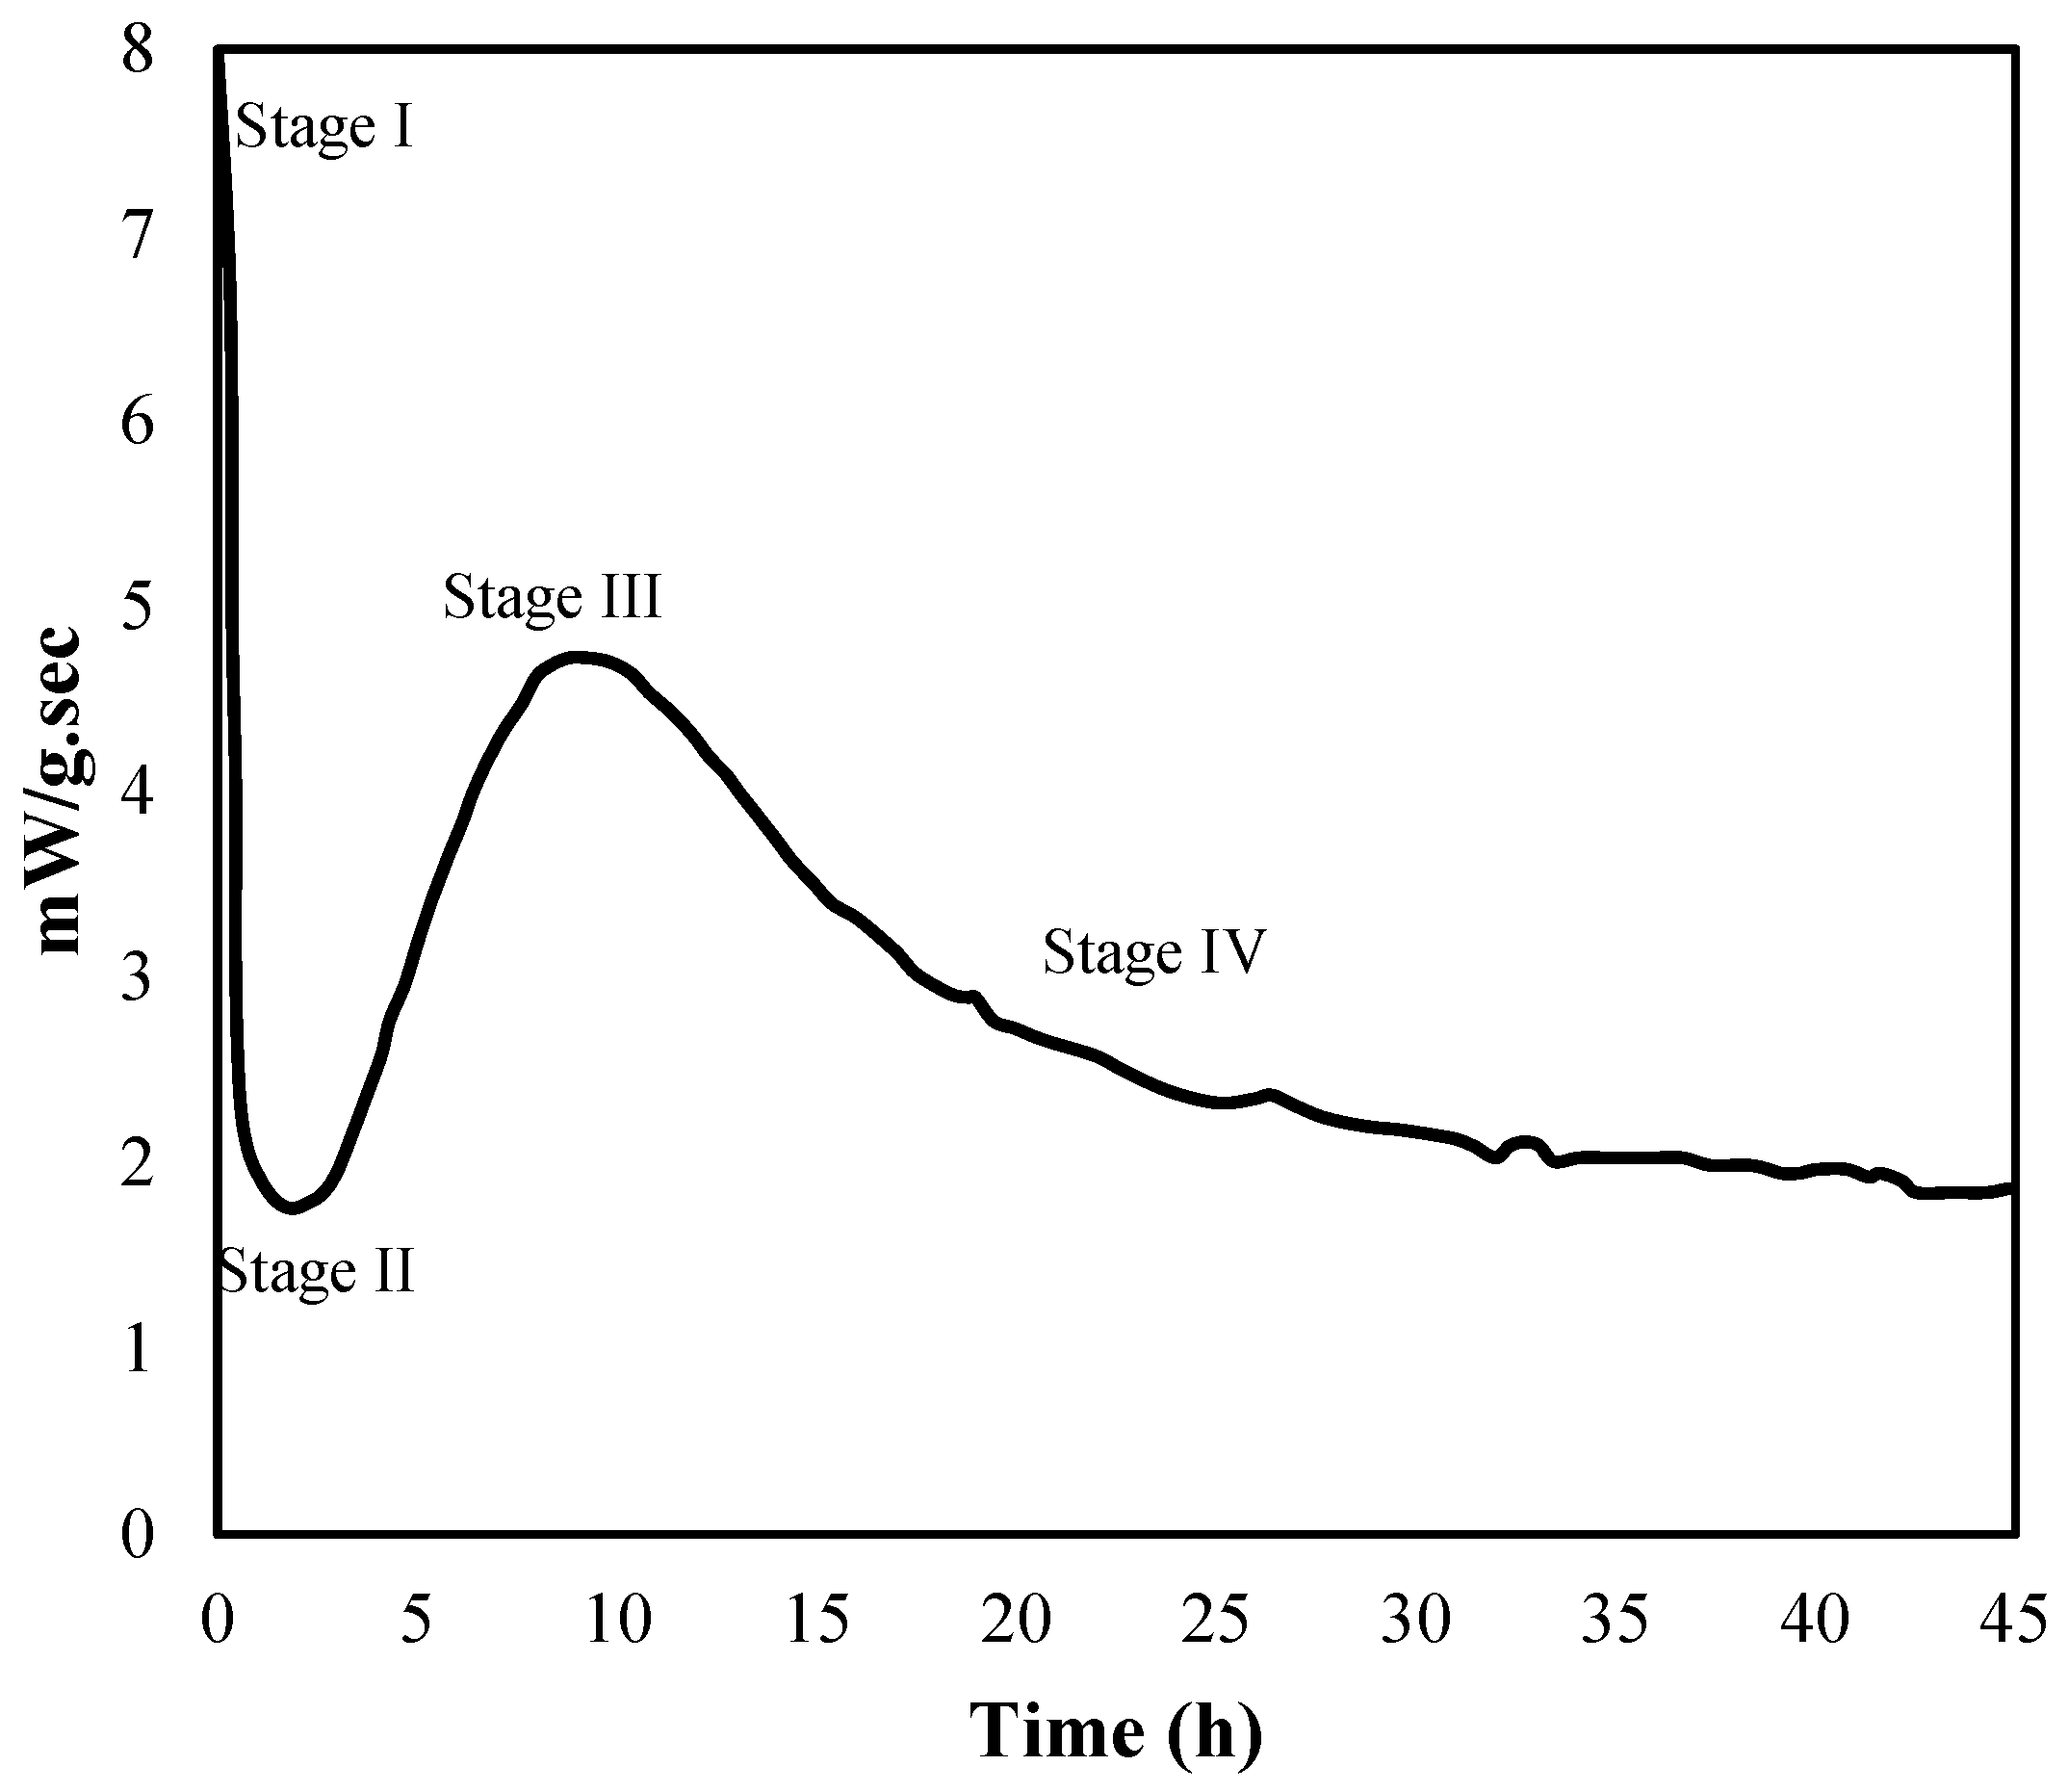
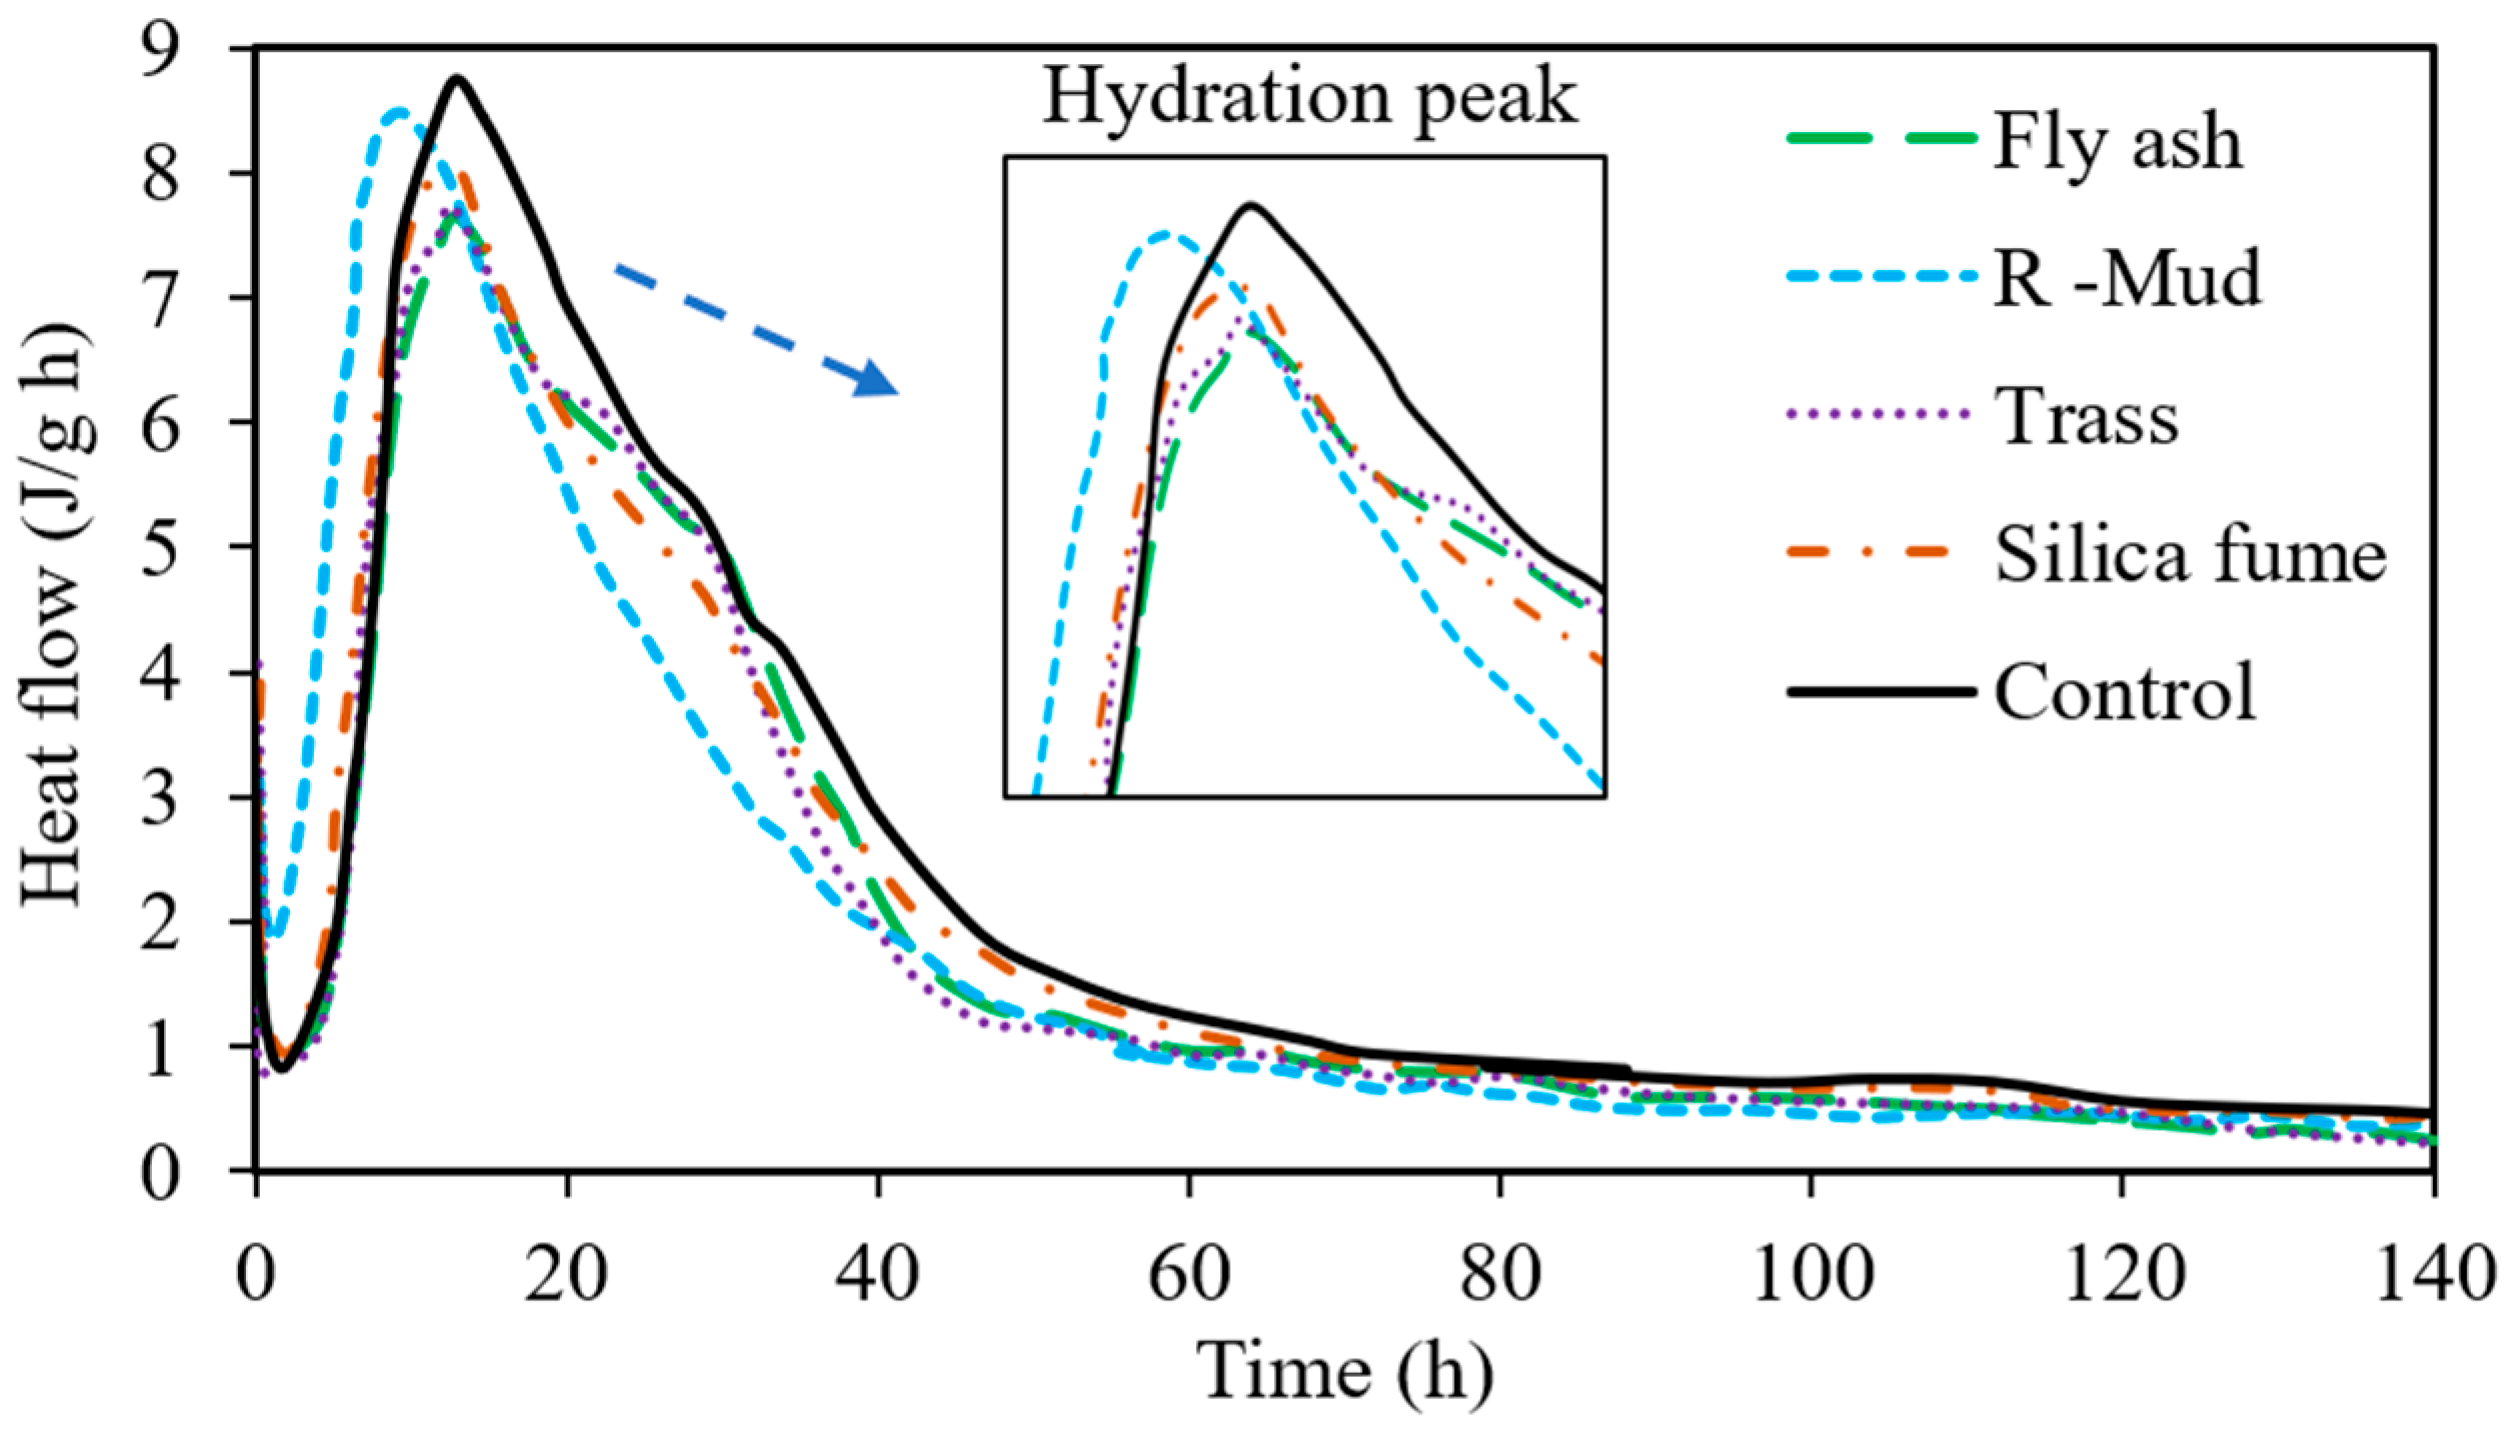
4.1. Isothermal Calorimetry

Due to cement’s exothermic hydration reaction, the hydration kinetics of the clinker could be evaluated by measuring its heat of hydration. It is possible to characterize the effect of different additives and admixtures on the mixture’s hydration kinetics through measurement of the heat of hydration versus time [59]. The most widely used equipment for studying cement hydration is isothermal and semi-adiabatic calorimeters. Isothermal calorimeters directly measure the heat of hydration (heat evolution) of small samples of cement paste or mortars. A semi-adiabatic calorimeter measures the temperature change in the mortar or concrete samples that are insulated [60].
In general, heat generation at an early stage of hydration is related to highly reactive cement phases such as alite, ferrite, and brownmillerite. Belite is less reactive, but contributes to the hydration products and strength gain at later stages, approximately after ten days [61].
Typically, an isothermal calorimetry curve consists of four peaks and stages [61] (Figure 6).
  • Stage I involves rapid dissolution and the early reaction period. Rapid and overall exothermic dissolution of free lime, alkalis, gypsum, ferrite, and brownmillerite with some alites occurs in this stage, which lasts only a few minutes. Ions such as Ca2+, SO42−, Al(OH)4, SiO44−, K+, Na+, and OH are released into the solution.
  • Stage II is an induction period that happens after the initial highly exothermic reactions. This stage is a period of deceleration of cement hydration, in which heat evolution is relatively low.
  • Stage III is an acceleration period that is due to nucleation and growth of the C–S–H.
  • Stage IV is a deceleration period with a slow and continued reaction. This is a result of diffusion control and space-filling. Diffusion control is a mechanism in which a thick layer of C–S–H slows the diffusion of water ions, resulting in a slower reaction. Also, space-filling occurs when there is a reduction in the available surface area and pore volume to produce C–S–H [61].
Several studies have assessed pozzolanic reactivity using calorimetry [15,16,17,18]. Bobrowicz and Chyliński [63] compared the pozzolanic activity of R-Mud waste with other pozzolans, such as silica fume, fly ash, and trass, using an isothermal calorimeter. The calorimetry tests were conducted using 8 g of cement–pozzolan mixtures and 4 g of water inserted in syringes at 20 °C and monitored for a minimum of 140 h in customized measurement equipment. Each tested pozzolan replaced 15% of Type I portland cement. The R-Mud waste generated the highest heat after the control sample, demonstrating that R-Mud was a highly reactive pozzolan after 24 h of hydration. The higher specific surface area and very fine grains of colloidal silica present in R-Mud were mentioned as the main reasons for its high pozzolanic reactivity. In contrast, samples containing fly ash and trass showed the lowest heat of hydration compared to R-Mud and silica fume (Figure 7).
In an earlier study by Siler et al. [64], the effect of silica fume, granulated blast furnace slag, and fly ash on cement hydration (with 10% and 50% replacement levels) was assessed at seven days. The authors found that the maximum heat for the fly ash sample was lower than the heat from the plain cement paste. A dilution effect due to the replacement of reactive cement with a less reactive additive (fly ash) and a slower reaction rate (pozzolanic reaction) were noted as the reasons for the observed reduction in the heat of hydration.
Suraneni and Weiss [2] proposed a slightly modified method for determining the pozzolanic reactivity through isothermal calorimetry. They examined the heat evolution of fly ash, slag, calcined clay, silica fume, quartz, and limestone mixed with calcium hydroxide (3-to-1 mass ratio of calcium hydroxide to SCM mixed with a solution of 0.5 molar potassium hydroxide with a liquid-to-solid ratio of 0.9). The initial temperature of the calorimeter was set at 50 °C to shorten the time of the test from 12 to 10 days and to improve calorimetric stability. After ten days, the heat release was in the following order, from highest to lowest: calcined clay > silica fume > slag > fly ash > quartz > limestone.

4.2. Strength Activity Index

SAI is the most widely used indirect approach for evaluating pozzolanic reactivity. This method assesses how pozzolanic reaction affects the cementitious matrix densification and packing effect, which results in the enhancement of compressive strength [65,66]. In other words, the SAI test establishes the actual contribution of microstructure densification brought on by the pozzolanic reaction [67]. The SAI approach demonstrates the impact of the pozzolanic activity on the mixture’s mechanical properties [68]. To determine SAI, two sets of test specimens are made using a standard mix design, one with 100% portland cement (control sample) and the other with a portland cement–pozzolan blend, seen in Table 2. Both sets of specimens are examined for compressive strength after a specific number of curing days [69]. The applicable US standard is ASTM C311, which compares the compressive strength of mortar with pozzolan, replacing 20% of the portland cement binder with the control mixture [70].
The SAI is a measure of the pozzolanic material’s impact, which is calculated using Equation (8) [69]:
S A I = S 1 / S 2
S1 and S2 denote the compressive strengths of the sample with pozzolan replacement and the control sample, respectively [69]. According to ASTM C618, fly ash and natural pozzolans must have an SAI greater than 0.75 at 7 and 28 days (at a 20% cement substitution) to be considered a pozzolan [4]. Figure 8 shows the 28-day SAI results for different pozzolans (with 20% cement replacement) obtained from several studies [11,71,72,73,74,75]. Each single bar represents an average value of SAI related to each tested pozzolan in different studies. The dashed line demonstrates the requirement of ASTM C618 for the evaluation of a pozzolanic material by SAI test. All pozzolans except bagasse ash showed SAI above 0.75 according to the ASTM C618 requirement.
Pozzolanic materials can fill the micropore structure of cement mortar and concrete. In cement-based materials, highly reactive pozzolans such as metakaolin can contribute to early hydration and also promote secondary hydration processes, which improves mechanical properties such as compressive strength [76]. By replacing cement with pozzolanic materials, extra C–S–H is generated, which increases the strength at later stages. Due to the slower activity rate of some pozzolanic materials and the absence of significant amounts of portlandite at the early stages of cement hydration, the strength gain in pozzolanic mixes is usually slower than in the control samples [68].
Another factor that influences compressive strength is the condition of the interfacial transition zone (ITZ). Partially replacing cement with reactive pozzolans such as metakaolin, silica fume, and slag improves the ITZ, pore structure, and pore size distribution of concrete, which can increase SAI [77]. Other factors that affect the SAI are the fineness and active silica content of the pozzolan. Typically, the silica fume particles have a high surface area and contain high amounts of active silica [78]. Consequently, the finer silica fume is highly reactive and produces strong concrete and mortar. It should be noted that Ca(OH)2 regulates the pozzolanic process, so additional silica fume beyond the optimum level only serves as an inert filler in the mixture [78].
A major disadvantage of the SAI test is that it may not be able to differentiate between an active pozzolan and an inert filler in some cases [4,9,79]. First, according to ASTM C618, a target mortar flow requirement must be met for the mix rather than a fixed water-to-binder requirement. Consequently, fluctuation in the water-to-binder ratio to meet the flow requirement may result in a false impression of pozzolanic reactivity [80]. Second, when the pozzolan content is low, the filler effect would likely dominate the reactivity effect [3,81]. Third, in most cases, class F fly ash may exhibit a minor degree of reactivity at seven days, and frequently, pozzolanic materials could not be distinguished from inert fillers at this stage [82,83].
There is also a criticism of the SAI in that the threshold value of 75% may be too low. If the additive did not contribute at all, the strength could be approximately 80% of the control (with a 20% replacement of cement) at the same water-to-binder ratio [84,85]. In other words, if the tested pozzolans were fully inert, the dilution effect may cause a 20% decrease in strength development. The cement content, however, is not the only factor that affects strength. There are other factors that influence strength development, including permeability, porosity, and hydration reaction kinetics [11]. Therefore, results from an indirect pozzolanic activity test are commonly confirmed through direct methods to ensure that pozzolanic reactions are truly happening [86,87].

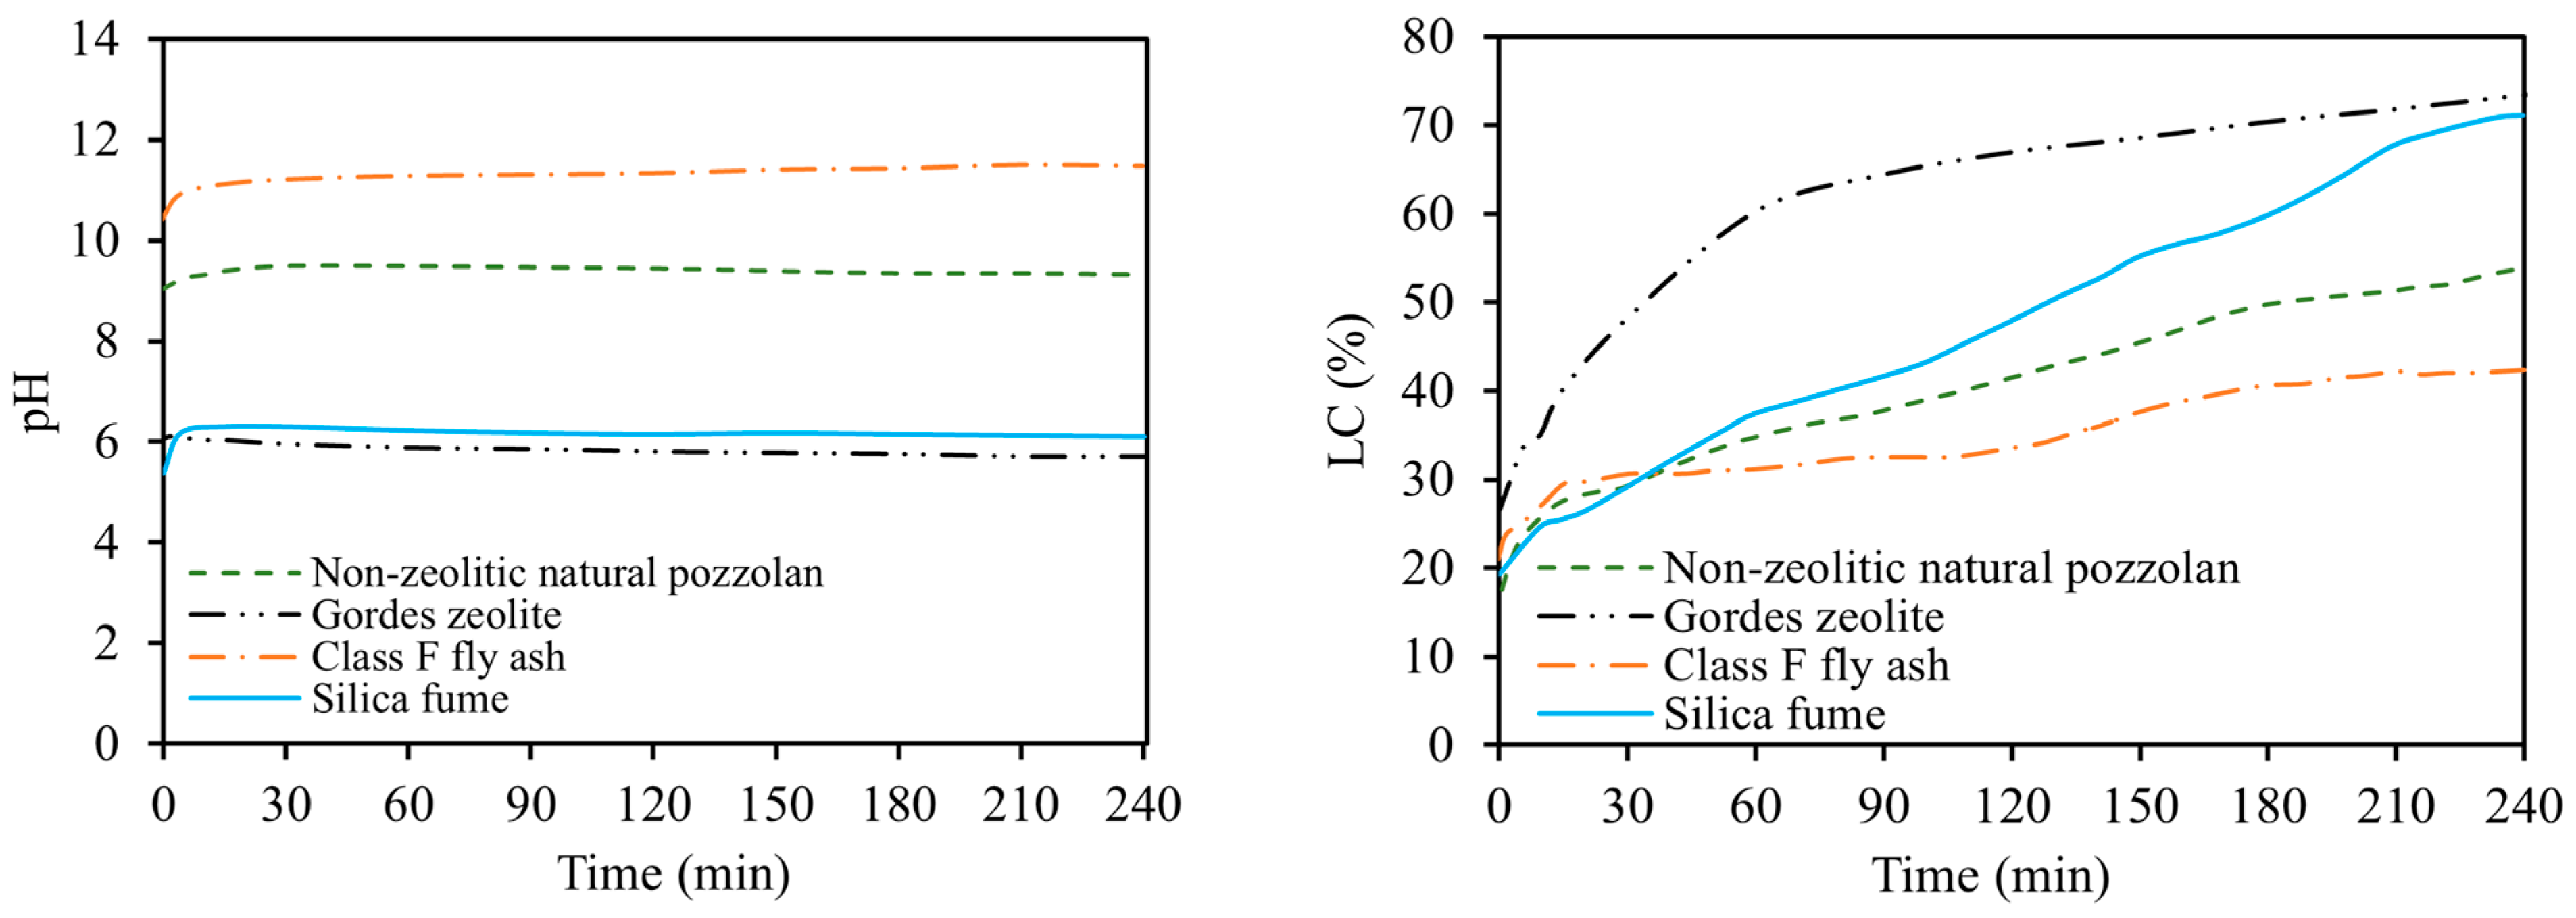
4.3. Electrical Conductivity and pH

Electrical conductivity and pH measurements are relatively easy and rapid tests to assess pozzolanic reactivity in comparison to the common reactivity tests, which are time-demanding and slow [24]. In these methods, a chemical reaction occurs between the pozzolan and calcium hydroxide that is dissolved in water [23]. Through the reaction of silica and alumina from the pozzolan with dissolved Ca2+ and OH ions in an aqueous suspension, insoluble and non-conductive products (e.g., C–S–H) form, which decrease the solution’s conductivity [23,24,88]. The decrease in the number of these ions in an unsaturated lime solution leads to declining electrical conductivity. A decrease in pH also occurs, since the concentration of OH ions decreases due to the pozzolanic reaction [23]. Thus, changes in electrical conductivity and pH are related to the removal of calcium hydroxide due to pozzolanic reactivity. Several researchers have referred to these tests as indirect methods for the pozzolanic reactivity assessment [9,22,23].
Luxán et al. [89] first proposed an electrical conductivity method for assessing natural pozzolans, such as opaline rocks and volcanic tuff. Later, other researchers used these methods for the evaluation of the reactivity of artificial pozzolans, such as sewage sludge ash [33]. According to Luxán et al. [89], a material’s pozzolanic reactivity can be determined based on the measurement of the electrical conductivity of a blended material with a lime-saturated solution at a minimum time (e.g., 2 min) (Table 3). The authors monitored the loss of electrical conductivity of 100 different pozzolans using 5 g of pozzolan in 200 mL of saturated calcium hydroxide at 40 ± 1 °C for 120 s [90].
In other studies, Uzal et al. [50] and Payá et al. [91] determined the contribution of pozzolanic materials to conductivity and then subtracted the results from the measured conductivity of the lime–pozzolan water suspension. Pozzolanic materials such as fly ash could contain several soluble ions that may contribute to conductivity in the aqueous solution [50]. Thus, the adjusted loss of electrical conductivity is calculated using Equations (9) and (10) [24].
L C   % = C 0 C t , c C 0   100
C t , c = C t C t , p o z z o l a n
where LC is the relative loss of electrical conductivity of lime–pozzolan suspensions at time t, C 0 is the electrical conductivity of lime suspension before adding pozzolanic material, C t is the measured electrical conductivity of lime–pozzolan suspensions at time t, C t , p o z z o l a n is the measured electrical conductivity of pozzolan–deionized water suspension at time t, and C t , c   is the corrected electrical conductivity at time t [24].
According to Tashima et al. [24], increasing temperature positively affects the reduction in electrical conductivity and pH due to increasing pozzolanic reaction. This finding was also confirmed in research conducted by Sinthaworn and Nimityongskul [92] and Velázquez et al. [23]. Tashima et al. [24] also reported that LC > 30% and variation of pH > 0.15 units are the thresholds for characterization of the pozzolanic reactivity.
In the method proposed by Uzal et al. [50], a lime–water suspension (200 mg Ca(OH)2 in 250 mL water) was mixed using an electric mixer at a constant temperature of 40 ± 1 °C. The initial pH and conductivity measurements were recorded for the lime–water suspension using digital pH and electrical conductivity meters. After the stabilization of the conductivity and pH, 5 g of pozzolan was added to the suspension, and the conductivity/pH parameters were continuously measured. The authors reported that the pH and electrical conductivity results provided consistent results in their experiment. In addition, the specific surface area and the reactive SiO2 content of the pozzolan were noted as important factors that affect conductivity and pH [50].
Figure 9 depicts pH and LC (%) variation for four different pozzolans including silica fume, class F fly ash, Gordes zeolite, and a non-zeolitic natural pozzolan [50]. Gordes zeolite and silica fume reduced the pH and electrical conductivity more than the other tested pozzolans due to the higher content of reactive silica and surface area.
Borges et al. [9] used a similar method based on electrical conductivity to evaluate the pozzolanic reactivity of glass powders with particle sizes of 150 µm, 75 µm, and 45 µm. In their approach, the lime solution was first homogenized at 80 °C for 1 h, then the temperature was reduced to 60 °C, and 5 g of glass powder was added to the solution to measure the relative loss of electrical conductivity for about 100,000 s. Their results indicated that the highest percentage of LC was related to the smallest particle size of glass powder (<45 µm) [9].

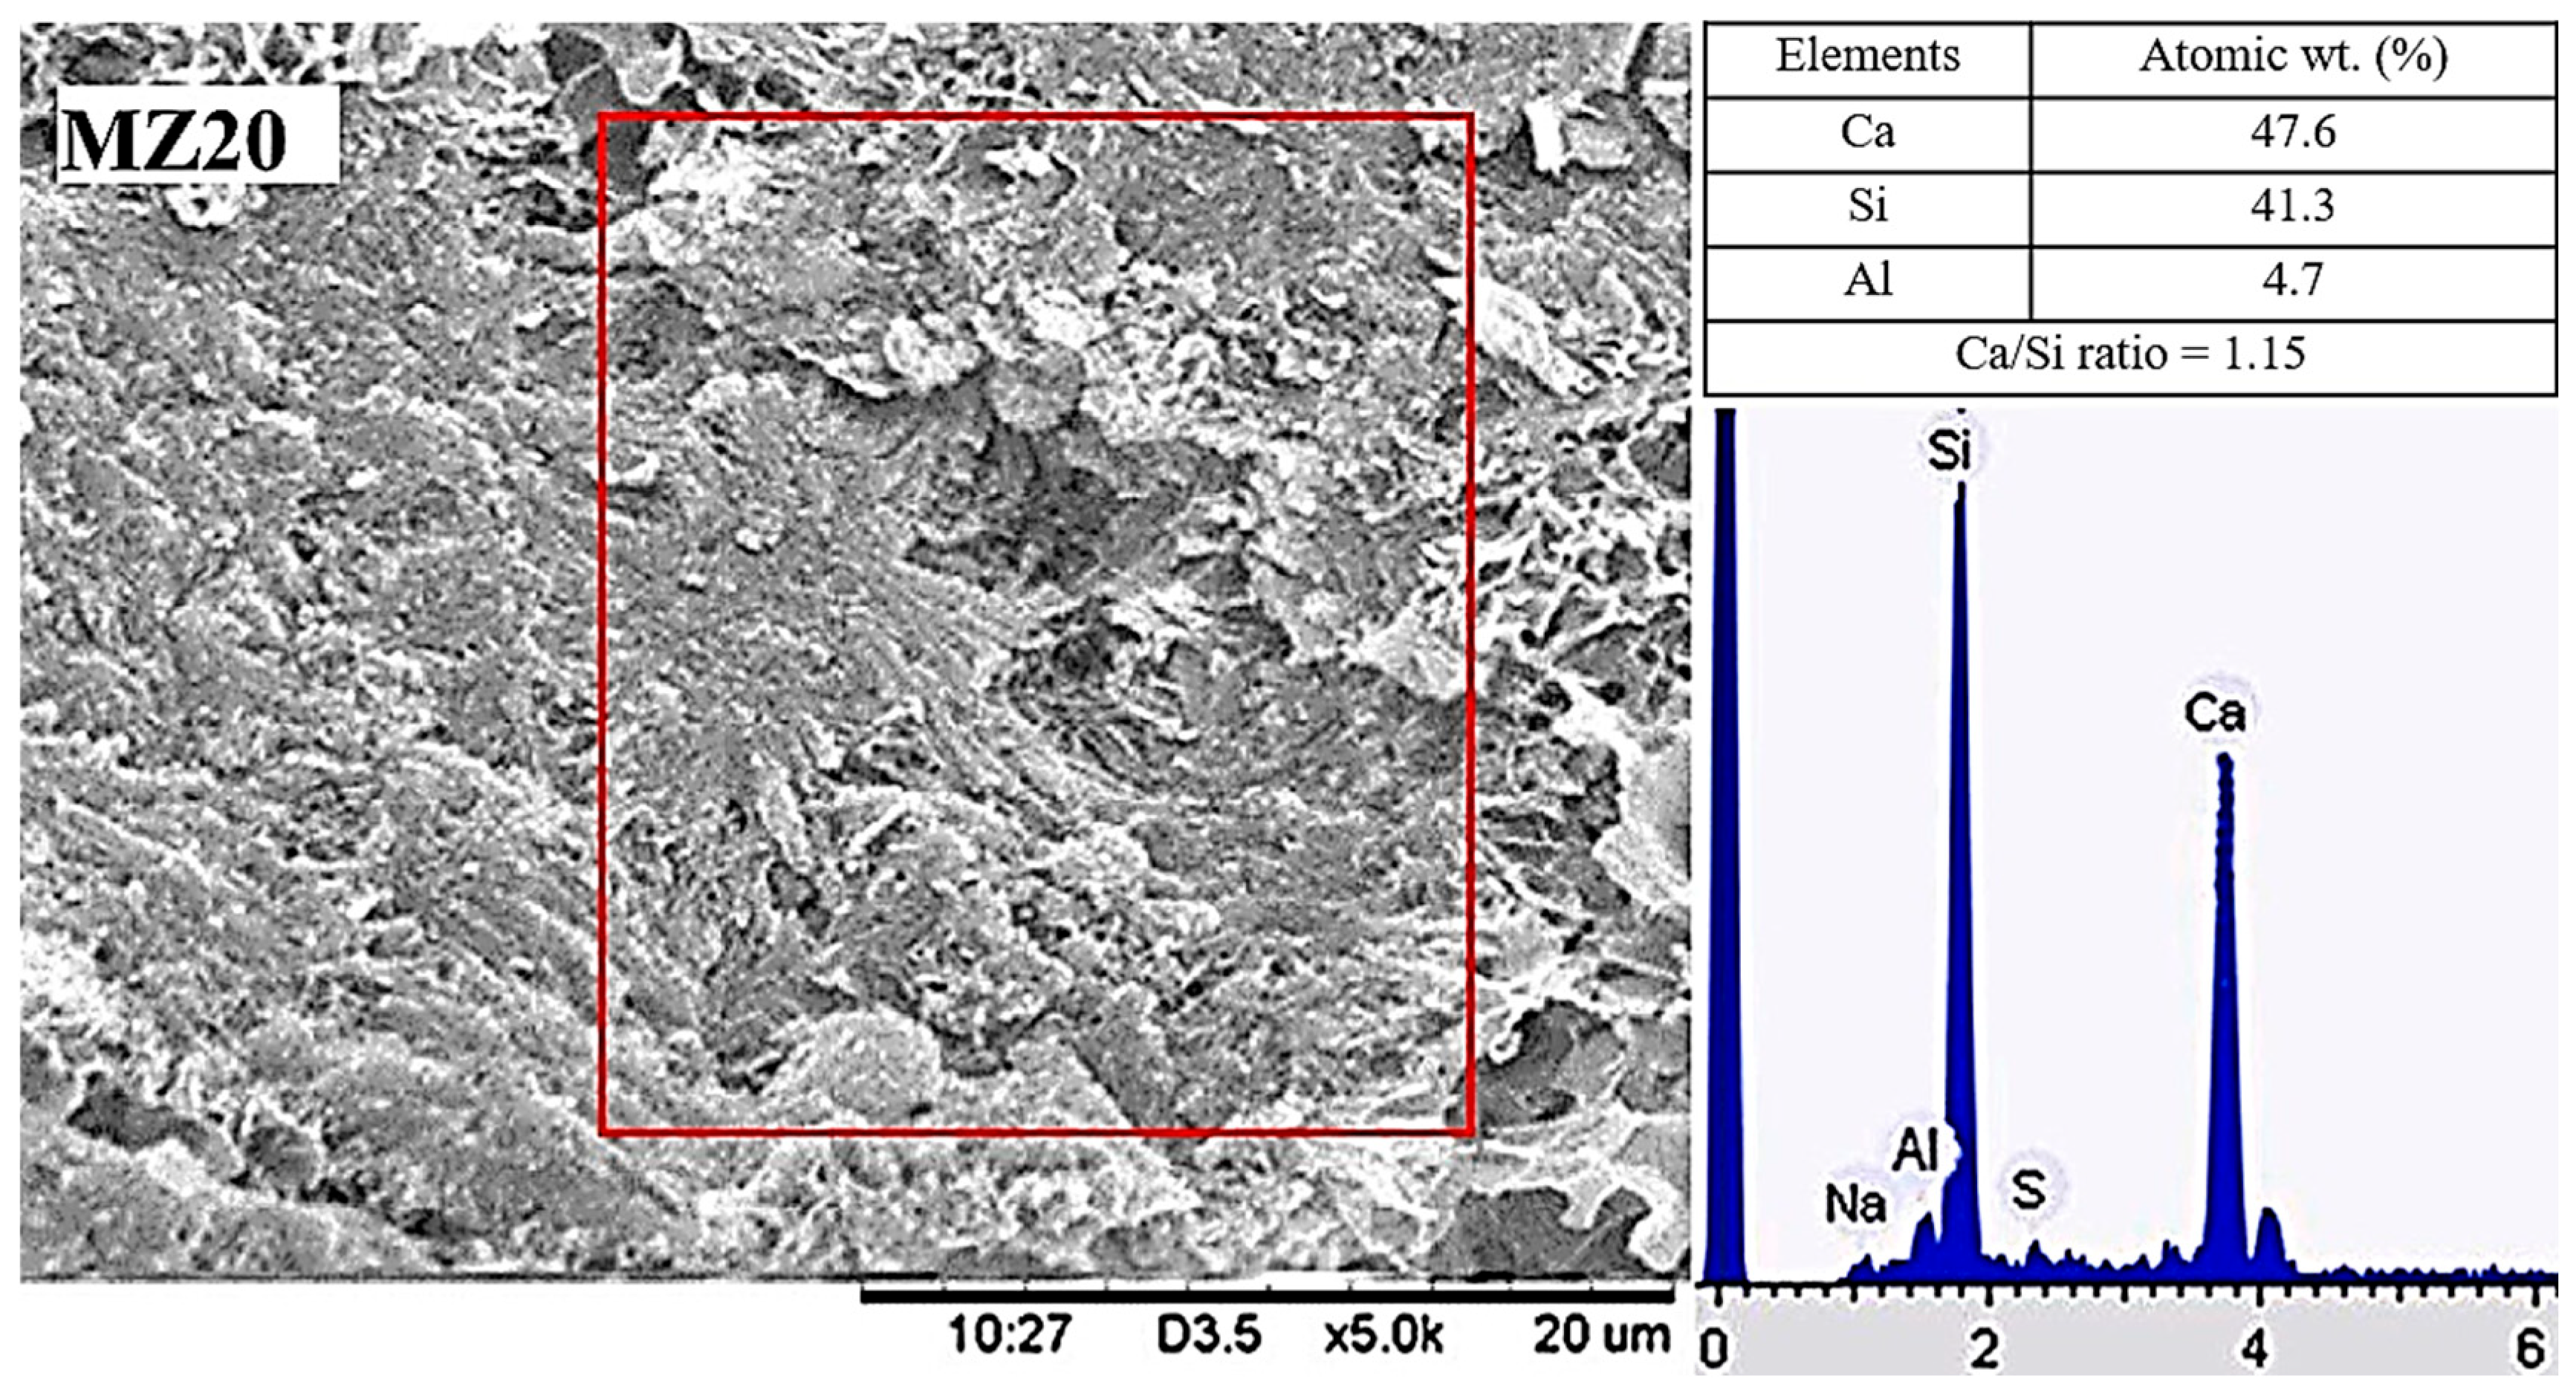
4.4. Scanning Electron Microscopy–Energy Dispersive X-ray Spectrometry

Although scanning electron microscopy is a recognized and useful method for analyzing the microstructure and characteristics of hardened concrete, its use for pozzolanic reactivity assessments is not widely understood. However, several researchers have used scanning electron microscopy (SEM) coupled with energy-dispersive X-ray spectrometry (EDS) for the indirect assessment of pozzolanic reactivity [93,94,95,96,97].
SEM/EDS is a widely applied analytical technique capable of identifying and quantifying elemental composition [98]. The SEM/EDS procedures involve using a scanning electron microscope to create high-resolution images of solid specimens and energy-dispersive X-ray spectroscopy to analyze the elemental and chemical composition of the sample [99,100].
SEM/EDS offers complete elemental composition that enables the exact separation, easy visual identification, and quantitative study of phases in pozzolans. The microstructure and contents of hydrated pozzolan–cement samples (such as the composition of C–S–H gel formed around the pozzolan particles due to pozzolanic reactivity) can therefore be analyzed using SEM/EDS [21,101,102,103]. Studies show that the reduction in the Ca/Si ratio increases the stiffness and hardness of the C–S–H [104]. The Ca/Si ratio of C–S–H gel produced as a result of the pozzolanic reaction is lower than the one produced through portland cement hydration. Regarding this, several studies evaluated the Ca/Si ratio of C–S–H that is produced during the pozzolanic reaction [19,20,21,105,106]. Figure 10 shows an example of an SEM image of a cement paste containing waste glass powder (GP) at 28 days of reaction. It is observed that C–S–H gel is formed around GP particles because of the pozzolanic reaction [96]. In the following step, EDS (which is coupled with an SEM image) evaluates the quality and quantity of pozzolanic reactivity by determining the Ca/Si ratio of C–S–H gel produced through pozzolanic reaction based on the mean atomic weight [101,107,108,109]. Figure 11 shows an example of an SEM image along with the EDS analysis of a hydrated cement sample that was partially replaced with a natural pozzolan at 20% (MZ20). The EDS analysis of the spot specified on the SEM image demonstrates a low Ca/Si ratio of 1.15 because of the pozzolanic reaction [108].
The C–S–H that is formed during the hydration of alite in plain portland cement has an average Ca/Si ratio of around 1.7–1.8 [94,104,110]. For instance, the alite hydration reaction, which is the main phase of portland cement with a Ca/Si ratio of 1.7, is reported as follows [111]:
C3S + 5.3H → C1.7SH4+ 1.3CH
where H is H2O, CH is Ca(OH)2 and C1.7SH4 is C–S–H produced in the cement hydration process. In the presence of silica fume, the Ca/Si ratio can reach as low as 1.0 upon the complete consumption of portlandite [94]. For instance, [112] reported that silica fume undergoes pozzolanic reaction with a Ca/Si ratio of 1.1 as follows:
S +1.1CH + 2.8 H ⇄ C1.1SH3.9
where S is SiO2 and C1.1SH3.9 is C–S–H produced through the pozzolanic reaction of silica fume.
Table 4 shows the Ca/Si ratios of the C–S–H gel for different pozzolans reported in a number of studies. A reactive pozzolan can be distinguished from portland cement by comparing the Ca/Si parameter.

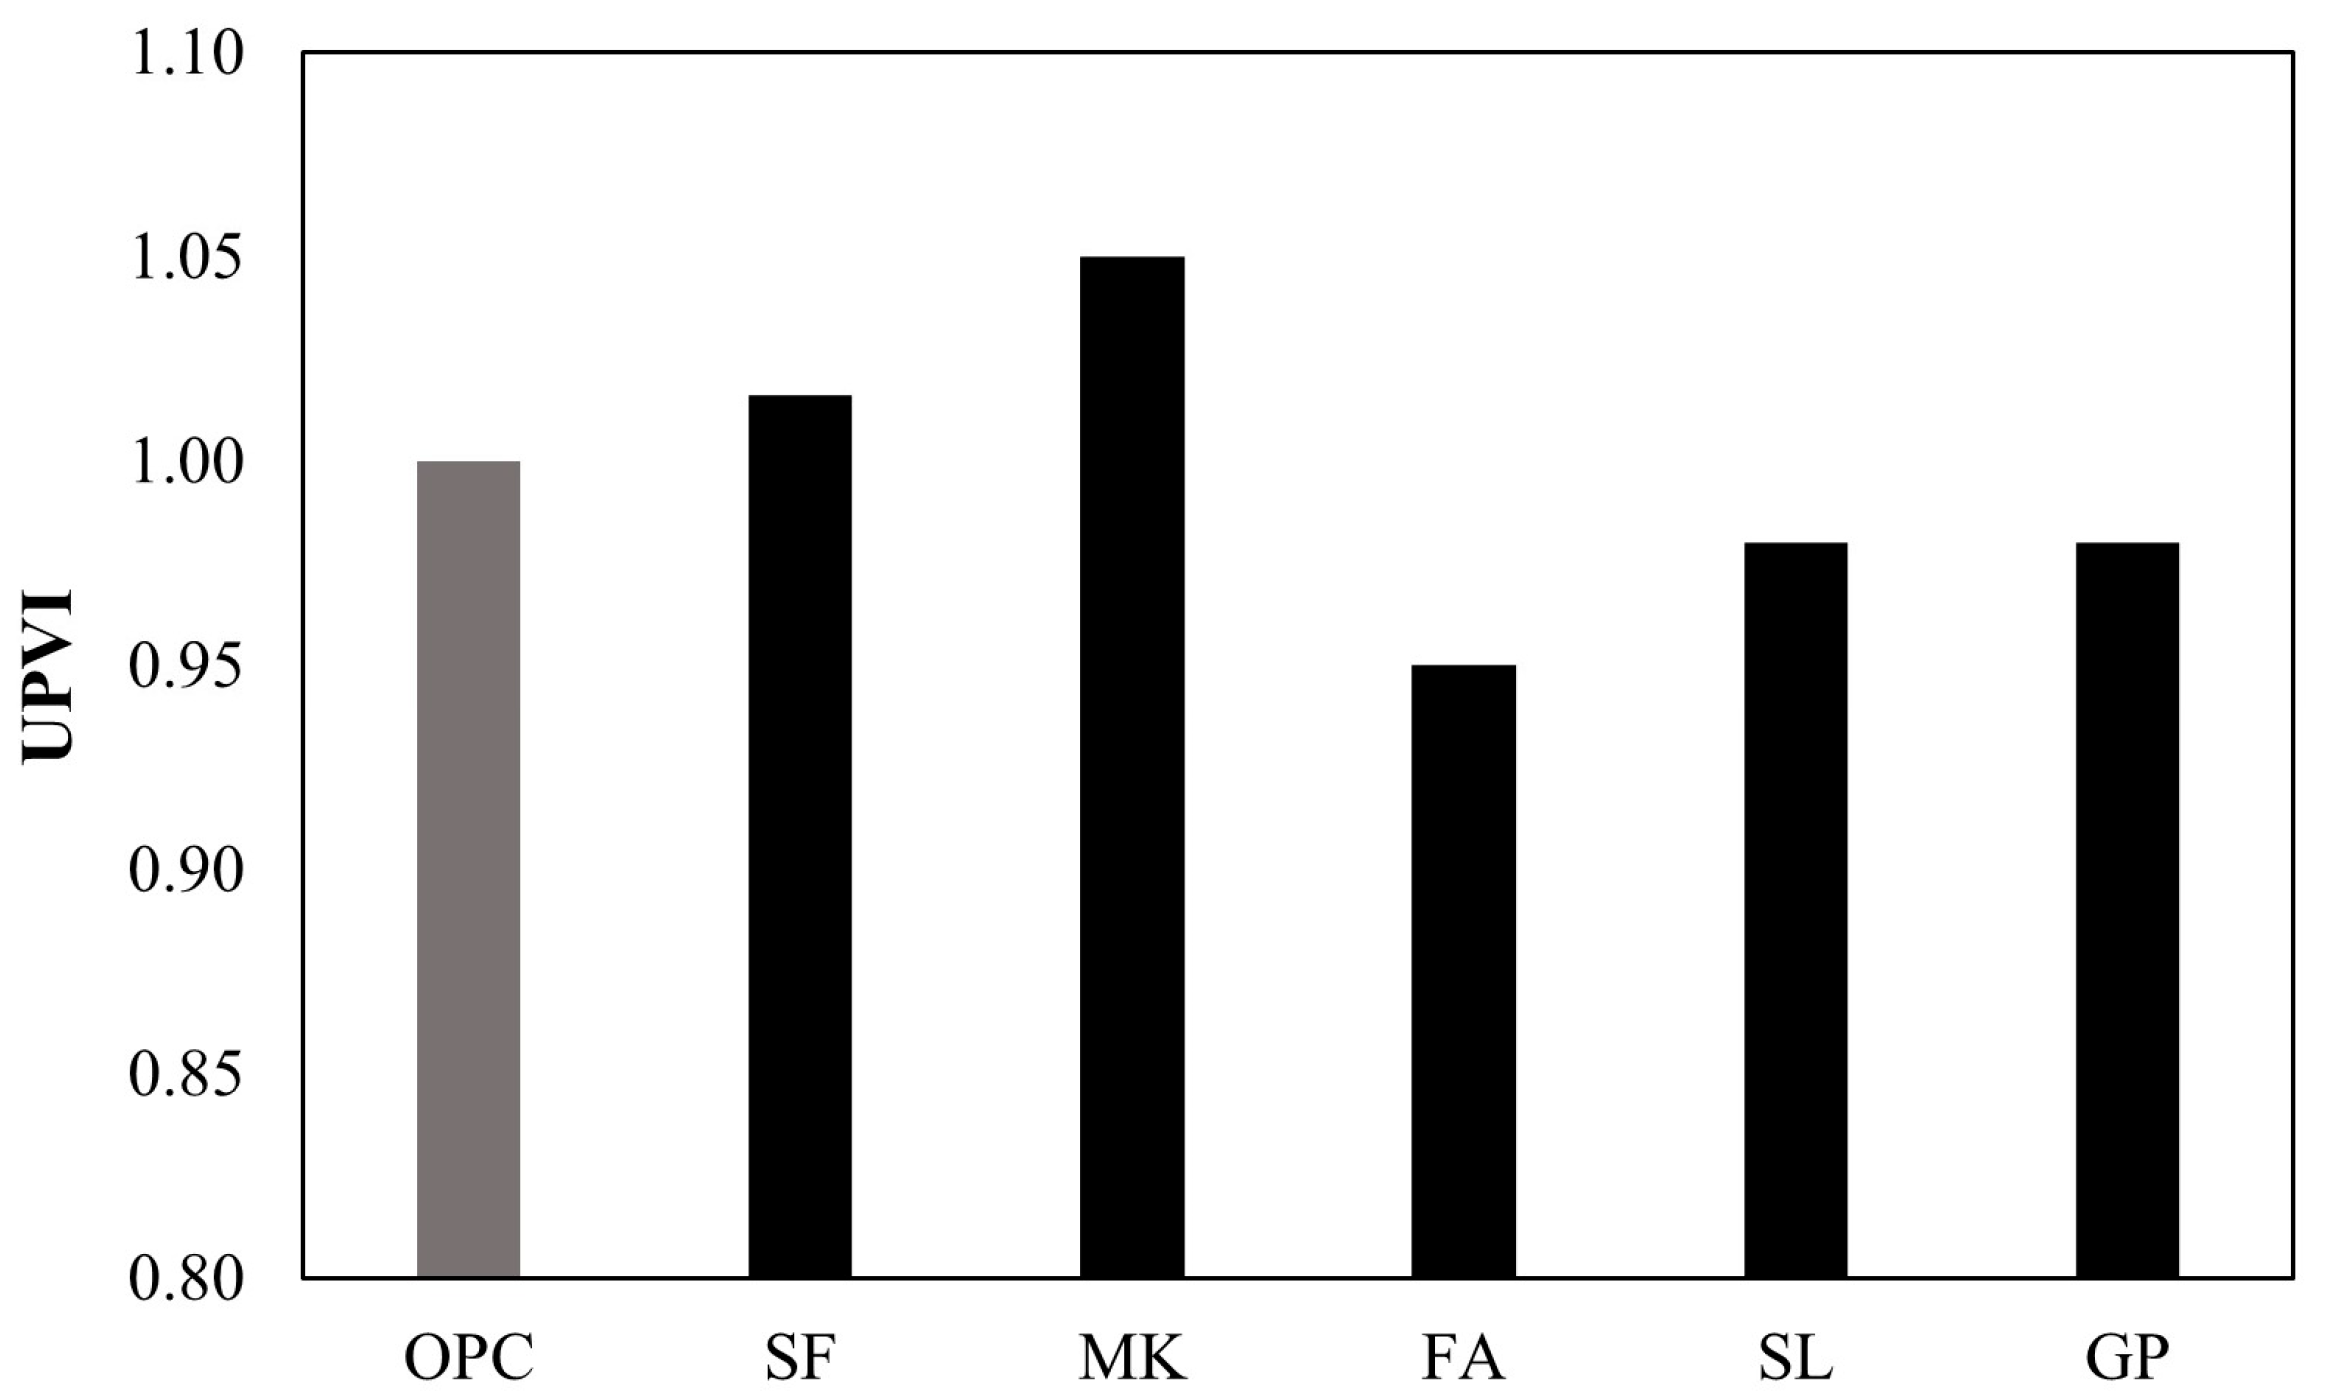
4.5. Ultrasonic Pulse Velocity Index (UPVI)

Ultrasonic pulse velocity is a test method used to determine the uniformity and relative quality of concrete [113]. It also serves as an indirect measure of durability and strength [114]. Although UPV is a useful and widely recognized method for analyzing the deterioration/cracking of hardened concrete, several studies have used UPV for the evaluation of pozzolanic reactivity [115,116,117,118].
Table 5 summarizes the correlation between the results of UPV and the compressive strength of cement–pozzolan specimens found by several researchers. Results from previous studies illustrate a high correlation between UPV and compressive strength for some common pozzolans, indicating the potential of the UPV method to assess the pozzolanic reactivity indirectly.
In performing the UPV test, it is important to mark the test locations on the structure to ensure repeatability over time [113]. UPV is calculated using Equation (11).
V = d t
where V is the pulse velocity, d is the distance between the center of transducer faces, and t is the transit time. Figure 12 illustrates the different approaches to UPV tests. Where d1, d2, d3 demonstrate distance between the transducers in direct, indirect and semi-direct approaches, respectively.
In general, the UPV is a function of porosity, and it decreases as porosity increases, meaning that UPV increases as the samples’ density increases [122]. Therefore, densification correlates with UPV [123]. UPV values associated with concrete mixtures are strongly influenced by mix proportions, material properties, pore structure, and characteristics of the ITZ [108]. Considering pozzolanic reactivity, UPV can be utilized to monitor the interaction between the pozzolanic material and Ca(OH)2 in cement composites [25]. UPV increases when additional C–S–H gel is formed due to the pozzolanic reaction, filling up the pores and refining them [26,27,28].
In terms of pozzolanic reactivity, UPV is significantly influenced by the type of pozzolan, replacement level, curing temperature, and curing period [124]. For example, Jiang et al. [125] studied the impact of fly ash replacement levels on pozzolanic reactivity using UPV. Their results showed that replacing portland cement with fly ash by 20% increased UPV by 18% at 28 days in comparison with the control sample. In contrast, by increasing the replacement level to 80%, the UPV decreased by about 41% compared to the control due to insufficient portlandite in the pore solution for pozzolanic reactivity.
The pore structure of the ITZ can have an adverse effect on the UPV measurements. Pozzolanic materials may refine the pores in the ITZ and in the matrix, depending on their fineness and reactivity [28,126]. It is important to note that replacing cement with pozzolanic materials can slow the hydration process, thus delaying the stabilization of the UPV values. Therefore, UPV needs to be measured at different stages over time [125]. For instance, UPV results of fly ash are lower at early stages due to its slow pozzolanic reactivity [28]. Mardani-Aghabaglou et al. [68] replaced cement with silica fume, metakaolin, and fly ash by 10% and conducted UPV after 7, 28, 90, 180, and 300 days after mixing. Silica fume showed the highest UPV at all tested ages due to higher surface area and rate of reactivity.
Finally, the UPV results can be defined as an index (UPVI) in a manner similar to SAI to reflect the effects of pozzolanic reactivity relative to the control. The UPVI can be determined by dividing the average value of UPV of the pozzolan–cement specimens by those of the control specimens (only portland cement). Figure 13 shows the UPVI results for various pozzolan–cement specimens with a 20% cement replacement level using the UPV results that were reported in several studies [115,116,117,118]. In comparison to UPV, UPVI values indicate the relative effect of pozzolans like metakaolin and silica fume on the concrete.

5. R3 Method

The R3 reactivity test method stands for “rapid, robust, and relevant,” based on work by Avet et al. [30] and the RILEM Technical Committee 267 [18]. This method was primarily developed to assess calcined clays’ pozzolanic reactivity [127]. It is a method that was established based on good Pearson correlations between strength development the and evolution of heat or bound water for detecting the reactivity of SCMs [127,128]. As this test method is relatively new, it recently underwent some modifications and complement studies were conducted before being standardized in North America as ASTM C1897 for measuring the reactivity of SCMs over a curing time of 7 days [32,128,129]. The two ASTM test options (A and B) are based on cumulative heat release and bound water of the hydrated pastes. The hydrated pastes contain SCM, calcium hydroxide, calcium carbonate and potassium hydroxide, potassium sulfate, and reagent water cured at 40 °C for 3 and 7 days [32]. Thus, the reactivity of SCM and pozzolans can be determined either by measuring heat release or bound water following this new approach.
The cumulative heat release of the paste containing SCM H S C M   is determined by isothermal calorimetry for 168 h (7 days) and can be calculated using Equation (12) [32].
H S C M = H m p   × 0.101
where H is cumulative heat release from 75 min until 3 days and 7 days after start of mixing, m p is the mass of the paste, and 0.101 is the mass fraction of the SCM in the paste sample.
In method B, the bound water content is measured using a muffle furnace [32]. First, sealed paste specimens are stored in an oven at 40 ± 2 °C for 168 h. Then, they are removed and demolded from the container and cut into three small samples. In the next step, the samples are crushed into particles less than 2 mm in size, transferred in small crucibles, and dried for approximately 24 ± 1 h at 40 °C. Following that, 5 ± 0.5 g of the dried crushed samples will be heated for two hours at 350 ± 10 °C in a pre-heated muffle furnace. Afterward, each sample’s mass value will be weighed and identified. Chemically bound water in g per 100 g of the dried paste at 40 °C will be determined according to Equation (13) [32].
H 2 O b o u n d ,   d r i e d   % = m 0   m h m 0   m c × 100
where m 0 is the total mass of the dried specimen and crucible, m c is the mass of the cooled, empty crucible, and m h is the total mass of the heated paste and crucible.
In order to measure corrected chemically bound water related to the presence of SCM in the paste, the same process of drying, heating, and weighing will be conducted on the samples that contain only SCM powder. The corrected chemically bound water will then be calculated by comparing the weight of the original sample to the sample with only SCM powder. The bound water is calculated in g per 100 g of SCM dried at 40 °C using Equation (14) [32].
H 2 O b o u n d , S C M % = m 0 ,   SCM   m h ,   SCM m 0 ,   SCM   m c , S C M × 100
where m 0 , SCM is the total mass of dried SCM and crucible, m c , SCM is the mass of the cooled, empty crucible, and m h , SCM is the total mass of the heated SCM and crucible.
The corrected bound water is then calculated using Equation (15) [32].
H 2 O b o u n d , c o r r e c t e d % = H 2 O b o u n d ,   d r i e d ( 0.101 × H 2 O b o u n d ,   S C M )
where H 2 O b o u n d , d r i e d is the chemically bound water content in g per 100 g of the dried paste at 40 °C, H 2 O b o u n d , S C M is the bound water in g per 100 g of SCM dried at 40 °C, and 0.101 is the mass fraction of the SCM in the paste specimen.
Good correlations with the other tests, such as compressive strength, and the utilization of basic concepts, such as the quantification of water bound in materials, are major advantages of this method. This method also requires fewer resources, simpler equipment, and less time to obtain results [18]. However, the technique has also been criticized for not distinguishing pozzolanic materials from latent hydraulic materials. Thus, a further measurement, such as portlandite consumption, could be used if such a distinction is important [130]. This would provide a more accurate assessment of the pozzolanic activity of the material. Additionally, it would be helpful to measure the amount of portlandite consumed by the pozzolan during the hydration process. Finally, it has been reported that there is a low level of multi-laboratory precision for the heat of hydration, so detailed instructions and a rigid calorimeter calibration procedure must be followed [131].

6. Summary and Statistical Evaluation

Figure 14 and Figure 15 represent a sample of studies with a range of years from 2014 to 2023 in order to demonstrate how many studies involved both direct and indirect pozzolanic reactivity methods. According to the findings, the most commonly used direct methods to assess the reactivity of pozzolans were XRD and TGA, while the most commonly used indirect methods were SAI and calorimetry.
Identifying pozzolans with the highest reactivity by using time-efficient yet simple direct and indirect methods reduces the cost of testing as well as decision-making time. Consequently, it is possible to determine the time-efficient and simple methods for detecting the reactivity of potential pozzolans based on the results of previous research. Among direct methods, Frattini, and indirect methods, electrical conductivity, and pH were found to be the most time-efficient methods. Electrical conductivity and pH, on the other hand, are the fastest and easiest methods. These methods are also relatively easy and affordable to use, and provide reliable results (Table 6).
In addition, Table 7 is a summary of the potential of each method to distinguish pozzolanic materials from other types of SCMs, as well as the advantages, disadvantages, required and cost equipment of each test method for the evaluation of pozzolans.

7. Conclusions

The following conclusions can be drawn based on this review of prior research on pozzolanic reactivity tests:
  • It is important to assess pozzolanic reaction by a combination of direct and indirect methods to evaluate the effect of pozzolanic reaction in concrete both physically and chemically to find a potential SCM for cement in concrete.
  • The Frattini test is a commonly used direct method to quantify portlandite’s consumption due to pozzolanic reaction. However, this method is based on titration on a liquid suspension and cannot be used to determine the consumption of calcium hydroxide in the hardened paste.
  • It is possible to estimate the relative amount of consumed portlandite using XRD through the identification of proper peaks associated with the portlandite remaining in the hydrated pozzolan-cement sample.
  • Indirect methods (e.g., SAI) are less conclusive, considering the potential of misidentifying the pozzolanic materials due to the filler effect instead of the pozzolanic effect.
  • Test methods such as TGA, Frattini, and SAI may not be suitable for the evaluation of low levels of pozzolanic reactivity at early ages of hydration (e.g., seven days).
  • SEM/EDS provides reliable visual and elemental composition evidence of the formation of C–S–H due to pozzolanic reactivity in the hydrated pozzolan-cement samples.
  • Calorimetry, electrical conductivity, and pH methods provide rapid assessments of pozzolans.
  • UPV provides an evaluation of the mechanical performance of hardened concrete samples containing a pozzolan. In a similar manner to SAI, this review suggests using UPVI instead of UPV for evaluating the relative effects of pozzolan on the physical characteristics of the test sample.
  • The R3 method provides good correlation with the strength test and can evaluate the reactivity of pozzolans in 3 and 7 days. On the other hand, it may be useful to also conduct an additional test, such as a direct method, to differentiate pozzolanic materials from latent hydraulic materials as suggested in previous studies. A direct method would involve measuring the amount of portlandite consumed by each pozzolan during the hydration process. The additional information would provide an accurate assessment of the pozzolanic materials’ behavior and allow for better selection, classification, and use of pozzolans in concrete mixtures.

8. Future Perspectives and Recommendations

This review provides guidance to investigators exploring the reactivity of many new pozzolanic materials using existing and emerging techniques. Expanded use of new and existing pozzolanic materials are key to reducing the environmental impacts of portland cement. To facilitate widespread future use, the tests should ideally be rapid, relatively easy to perform, and not cost prohibitive. The test or a combination of tests should also be able to distinguish pozzolanic reactivity from filler effects.

Author Contributions

Conceptualization, F.E.; methodology, F.E., F.F. and H.T.; software, S.E. and M.H.M.; formal analysis, F.E. and F.F.; investigation, F.E. and F.F.; writing—original draft preparation, F.E., F.F. and H.T.; review and editing, H.T., V.F. and Q.L.; supervision, H.T. All authors have read and agreed to the published version of the manuscript.

Funding

This research was funded by University of Wisconsin-Milwaukee.

Institutional Review Board Statement

Not applicable.

Informed Consent Statement

Not applicable.

Data Availability Statement

Some data generated or used during the study are available from the corresponding author by request.

Conflicts of Interest

The authors declare no conflict of interest.

References

  1. Robalo, K.; Costa, H.; do Carmo, R.; Júlio, E. Enhanced Mechanical and Durability Performances of Low Cement Concrete with Natural Pozzolan Addition. J. Adv. Concr. Technol. 2021, 19, 519–535. [Google Scholar] [CrossRef]
  2. Suraneni, P.; Weiss, J. Examining the Pozzolanicity of Supplementary Cementitious Materials Using Isothermal Calorimetry and Thermogravimetric Analysis. Cem. Concr. Compos. 2017, 83, 273–278. [Google Scholar] [CrossRef]
  3. Ramanathan, S.; Kasaniya, M.; Tuen, M.; Thomas, M.D.A.; Suraneni, P. Linking Reactivity Test Outputs to Properties of Cementitious Pastes Made with Supplementary Cementitious Materials. Cem. Concr. Compos. 2020, 114, 103742. [Google Scholar] [CrossRef]
  4. ASTM C618-19; Standard Specification for Coal Fly Ash and Raw or Calcined Natural Pozzolan for Use in Concrete. ASTM International: West Conshohocken, PA, USA, 2019.
  5. Mendoza, O.; Tobón, J.I. An Alternative Thermal Method for Identification of Pozzolanic Activity in Ca(OH)2/Pozzolan Pastes. J. Therm. Anal. Calorim. 2013, 114, 589–596. [Google Scholar] [CrossRef]
  6. Barman, D.; Dash, S.K. Stabilization of Expansive Soils Using Chemical Additives: A Review. J. Rock Mech. Geotech. Eng. 2022, 14, 1319–1342. [Google Scholar] [CrossRef]
  7. Tognonvi, M.T.; Tagnit-Hamou, A.; Konan, L.K.; Zidol, A.; N’Cho, W.C. Reactivity of Recycled Glass Powder in a Cementitious Medium. New J. Glass Ceram. 2020, 10, 29. [Google Scholar] [CrossRef]
  8. Wang, Y.; Suraneni, P. Experimental Methods to Determine the Feasibility of Steel Slags as Supplementary Cementitious Materials. Constr. Build. Mater. 2019, 204, 458–467. [Google Scholar] [CrossRef]
  9. Borges, A.L.; Soares, S.M.; Freitas, T.O.G.; de Oliveira Júnior, A.; Ferreira, E.B.; Ferreira, F.G. da S. Evaluation of the Pozzolanic Activity of Glass Powder in Three Maximum Grain Sizes. Mater. Res. 2021, 24. [Google Scholar] [CrossRef]
  10. Kramar, S.; Ducman, V. Evaluation of Ash Pozzolanic Activity by Means of the Strength Activity Index Test, Frattini Test and DTA/TG Analysis. Teh. Vjesn.-Tech. Gaz. 2018, 25, 1746–1752. [Google Scholar] [CrossRef]
  11. Donatello, S.; Tyrer, M.; Cheeseman, C.R. Comparison of Test Methods to Assess Pozzolanic Activity. Cem. Concr. Compos. 2010, 32, 121–127. [Google Scholar] [CrossRef]
  12. Jurić, K.K.; Carević, I.; Serdar, M.; Štirmer, N. Feasibility of Using Pozzolanicity Tests to Assess Reactivity of Wood Biomass Fly Ashes. J. Croat. Assoc. Civ. Eng. 2021, 72, 1145–1153. [Google Scholar] [CrossRef]
  13. Lima, S.C.L.; Costa, L.C.B.; Defáveri, K.C.S.; de Carvalho, J.M.F.; Peixoto, R.A.F.; Brigolini, G.J. Study on Assessment of Pozzolanic Activity: Slate Cutting Waste. ACI Mater. J. 2020, 117, 3–10. [Google Scholar]
  14. Martins Torres, S.; Estolano de Lima, V.; de Azevedo Basto, P.; de Araújo Júnior, N.T.; de Melo Neto, A.A. Assessing the Pozzolanic Activity of Sugarcane Bagasse Ash Using X-ray Diffraction. Constr. Build. Mater. 2020, 264, 120684. [Google Scholar] [CrossRef]
  15. Suraneni, P.; Fu, T.; Jafari Azad, V.; Isgor, O.B.; Weiss, J. Pozzolanicity of Finely Ground Lightweight Aggregates. Cem. Concr. Compos. 2018, 88, 115–120. [Google Scholar] [CrossRef]
  16. Seraj, S. Evaluating Natural Pozzolans for Use as Alternative Supplementary Cementitious Materials in Concrete. Available online: https://repositories.lib.utexas.edu/handle/2152/28052 (accessed on 7 February 2023).
  17. Snellings, R.; Kazemi-Kamyab, H.; Nielsen, P.; van den Abeele, L. Classification and Milling Increase Fly Ash Pozzolanic Reactivity. Front. Built Environ. 2021, 7, 670996. [Google Scholar] [CrossRef]
  18. Li, X.; Snellings, R.; Antoni, M.; Alderete, N.M.; ben Haha, M.; Bishnoi, S.; Cizer, Ö.; Cyr, M.; de Weerdt, K.; Dhandapani, Y.; et al. Reactivity Tests for Supplementary Cementitious Materials: RILEM TC 267-TRM Phase 1. Mater. Struct. 2018, 51, 151. [Google Scholar] [CrossRef]
  19. Siad, H.; Lachemi, M.; Sahmaran, M.; Hossain, K.M.A. Effect of Glass Powder on Sulfuric Acid Resistance of Cementitious Materials. Constr. Build. Mater. 2016, 113, 163–173. [Google Scholar] [CrossRef]
  20. Sargam, Y.; Wang, K. Quantifying Dispersion of Nanosilica in Hardened Cement Matrix Using a Novel SEM-EDS and Image Analysis-Based Methodology. Cem. Concr. Res. 2021, 147, 106524. [Google Scholar] [CrossRef]
  21. De Weerdt, K.; Ben Haha, M.; Le Saout, G.; Kjellsen, K.O.; Justnes, H.; Lothenbach, B. Hydration Mechanisms of Ternary Portland Cements Containing Limestone Powder and Fly Ash. Cem. Concr. Res. 2011, 41, 279–291. [Google Scholar] [CrossRef]
  22. de Azevedo Basto, P.; Savastano Junior, H.; de Melo Neto, A.A. Characterization and Pozzolanic Properties of Sewage Sludge Ashes (SSA) by Electrical Conductivity. Cem. Concr. Compos. 2019, 104, 103410. [Google Scholar] [CrossRef]
  23. Velázquez, S.; Monzó, J.; Borrachero, M.; Payá, J. Assessment of Pozzolanic Activity Using Methods Based on the Measurement of Electrical Conductivity of Suspensions of Portland Cement and Pozzolan. Materials 2014, 7, 7533–7547. [Google Scholar] [CrossRef] [PubMed]
  24. Tashima, M.M.; Soriano, L.; Monzó, J.; Borrachero, M.v.; Akasaki, J.L.; Payá, J. New Method to Assess the Pozzolanic Reactivity of Mineral Admixtures by Means of PH and Electrical Conductivity Measurements in Lime: Pozzolan Suspensions. Mater. Construcc. 2014, 64, e032. [Google Scholar] [CrossRef]
  25. Shooshpasha, I.; Hasanzadeh, A.; Kharun, M. Effect of Silica Fume on the Ultrasonic Pulse Velocity of Cemented Sand. Proc. J. Phys. Conf. Ser. 2020, 1687, 012017. [Google Scholar] [CrossRef]
  26. Ashraf, M.; Naeem Khan, A.; Ali, Q.; Mirza, J.; Goyal, A.; Anwar, A.M. Physico-Chemical, Morphological and Thermal Analysis for the Combined Pozzolanic Activities of Minerals Additives. Constr. Build. Mater. 2009, 23, 2207–2213. [Google Scholar] [CrossRef]
  27. Althoey, F.; El-Aal, A.K.A.; Shoukry, H.; Hakeem, I. Performance of Cement Mortars Containing Clay Exposed to High Temperature. Arab. J. Sci. Eng. 2022, 47, 591–599. [Google Scholar] [CrossRef]
  28. Bui, P.-T.; Huynh, T.-P. Performance and Microstructural Evaluation of Rice Husk Ash-Ground Granulated Blast Furnace Slag-CFBC Fly Ash Mixtures Produced as an Eco-Cement. J. Mater. Civ. Eng. 2022, 34, 04021485. [Google Scholar] [CrossRef]
  29. Elyasigorji, F. Reactivity Assessment of Pozzolanic Materials for Partial Replacement of Cement in Concrete. Available online: https://www.proquest.com/docview/2820202545/7B3FD5A4E17E461FPQ/1?accountid=15078 (accessed on 30 May 2023).
  30. Avet, F.; Snellings, R.; Alujas Diaz, A.; Ben Haha, M.; Scrivener, K. Development of a New Rapid, Relevant and Reliable (R3) Test Method to Evaluate the Pozzolanic Reactivity of Calcined Kaolinitic Clays. Cem. Concr. Res. 2016, 85, 1–11. [Google Scholar] [CrossRef]
  31. Yoon, J.; Jafari, K.; Tokpatayeva, R.; Peethamparan, S.; Olek, J.; Rajabipour, F. Characterization and Quantification of the Pozzolanic Reactivity of Natural and Non-Conventional Pozzolans. Cem. Concr. Compos. 2022, 133, 104708. [Google Scholar] [CrossRef]
  32. ASTM C1897; Standard Test Methods for Measuring the Reactivity of Supplementary Cementitious Materials by Isothermal Calorimetry and Bound Water Measurements. ASTM International: West Conshohocken, PA, USA, 2020.
  33. Alayish, O.; Çelik, T. Extending Disposal Route of Dewatered Sewage Sludge Produced from the New Wastewater Treatment Plant in Nicosia toward Sustainable Building Materials. Environ. Earth Sci. 2021, 80, 146. [Google Scholar] [CrossRef]
  34. Trusilewicz, L.; Fernández-Martínez, F.; Rahhal, V.; Talero, R. TEM and SAED Characterization of Metakaolin. Pozzolanic Activity. J. Am. Ceram. Soc. 2012, 95, 2989–2996. [Google Scholar] [CrossRef]
  35. Standrads, E. Methods of Testing Cement-Part 5: Pozzolanicity Test for Pozzolanic Cements; NSAI: Dublin Ireland, 2011; pp. 195–196. [Google Scholar]
  36. Sanou, I.; Seynou, M.; Zerbo, L.; Millogo, Y.; Ouedraogo, R.; Sana, A. Evaluation of Pozzolanic Activity of Illitic and Lateritic Raw Materials from Burkina Faso. Chem. Sci. Int. J. 2017, 18, 1–13. [Google Scholar] [CrossRef] [PubMed]
  37. Mohammed, S. Processing, Effect and Reactivity Assessment of Artificial Pozzolans Obtained from Clays and Clay Wastes: A Review. Constr. Build. Mater. 2017, 140, 10–19. [Google Scholar] [CrossRef]
  38. Torres Agredo, J.; Mejía de Gutiérrez, R.; Escandón Giraldo, C.E.; González Salcedo, L.O. Characterization of Sugar Cane Bagasse Ash as Supplementary Material for Portland Cement. Ing. Investig. 2014, 34, 5–10. [Google Scholar] [CrossRef]
  39. Baki, V.A.; Nayır, S.; Erdoğdu, Ş.; Ustabaş, İ. Determination of the Pozzolanic Activities of Trachyte and Rhyolite and Comparison of the Test Methods Implemented. Int. J. Civ. Eng. 2020, 18, 1053–1066. [Google Scholar] [CrossRef]
  40. Faleschini, F.; Toska, K.; Zanini, M.A.; Andreose, F.; Settimi, A.G.; Brunelli, K.; Pellegrino, C. Assessment of a Municipal Solid Waste Incinerator Bottom Ash as a Candidate Pozzolanic Material: Comparison of Test Methods. Sustainability 2021, 13, 8998. [Google Scholar] [CrossRef]
  41. Rahhal, V.F.; Trezza, M.A.; Tironi, A.; Castellano, C.C.; Pavlíková, M.; Pokorný, J.; Irassar, E.F.; Jankovský, O.; Pavlík, Z. Complex Characterization and Behavior of Waste Fired Brick Powder-Portland Cement System. Materials 2019, 12, 1650. [Google Scholar] [CrossRef]
  42. Lavat, A.E.; Trezza, M.A.; Poggi, M. Characterization of Ceramic Roof Tile Wastes as Pozzolanic Admixture. Waste Manag. 2009, 29, 1666–1674. [Google Scholar] [CrossRef]
  43. Pourkhorshidi, A.R.; Najimi, M.; Parhizkar, T.; Jafarpour, F.; Hillemeier, B. Applicability of the Standard Specifications of ASTM C618 for Evaluation of Natural Pozzolans. Cem. Concr. Compos. 2010, 32, 794–800. [Google Scholar] [CrossRef]
  44. Antiohos, S.K.; Papadakis, V.G.; Tsimas, S. Rice Husk Ash (RHA) Effectiveness in Cement and Concrete as a Function of Reactive Silica and Fineness. Cem. Concr. Res. 2014, 61–62, 20–27. [Google Scholar] [CrossRef]
  45. Caputo, D.; Liguori, B.; Colella, C. Some Advances in Understanding the Pozzolanic Activity of Zeolites: The Effect of Zeolite Structure. Cem. Concr. Compos. 2008, 30, 455–462. [Google Scholar] [CrossRef]
  46. Reddy, K.C.; Subramaniam, K.V.L. X-ray Diffraction-Based Quantification of Amorphous Phase in Alkali-Activated Blast Furnace Slag. Adv. Civ. Eng. Mater. 2021, 10, 20200167. [Google Scholar] [CrossRef]
  47. de Belie, N.; Scrivener, K.; Lothenbach, B.; Gruyaert, E.; Skibsted, J.; Snellings, R.; Vollpracht, A.; Villagrán, Y. Determination of the Degree of Reaction of Fly Ash in Blended Cement Pastes. In Proceedings of the 14th International Congress on the Chemistry of Cement (ICCC2015), Beijing, China, 13 October 2015; pp. 1–12. [Google Scholar]
  48. Du, H.; Tan, K.H. Waste Glass Powder as Cement Replacement in Concrete. J. Adv. Concr. Technol. 2014, 12, 468–477. [Google Scholar] [CrossRef]
  49. Tavares, L.R.C.; Junior, J.F.T.; Costa, L.M.; da Silva Bezerra, A.C.; Cetlin, P.R.; Aguilar, M.T.P. Influence of Quartz Powder and Silica Fume on the Performance of Portland Cement. Sci. Rep. 2020, 10, 21461. [Google Scholar] [CrossRef] [PubMed]
  50. Uzal, B.; Turanlı, L.; Yücel, H.; Göncüoğlu, M.C.; Çulfaz, A. Pozzolanic Activity of Clinoptilolite: A Comparative Study with Silica Fume, Fly Ash and a Non-Zeolitic Natural Pozzolan. Cem. Concr. Res. 2010, 40, 398–404. [Google Scholar] [CrossRef]
  51. Wang, Y.; Cao, Y.; Zhang, P.; Ma, Y. Effective Utilization of Waste Glass as Cementitious Powder and Construction Sand in Mortar. Materials 2020, 13, 707. [Google Scholar] [CrossRef] [PubMed]
  52. Moropoulou, A.; Bakolas, A.; Aggelakopoulou, E. Evaluation of Pozzolanic Activity of Natural and Artificial Pozzolans by Thermal Analysis. Thermochim. Acta 2004, 420, 135–140. [Google Scholar] [CrossRef]
  53. Suraneni, P.; Azad, V.J.; Isgor, B.O.; Weiss, W.J. Calcium Oxychloride Formation in Pastes Containing Supplementary Cementitious Materials: Thoughts on the Role of Cement and Supplementary Cementitious Materials Reactivity. RILEM Tech. Lett. 2016, 1, 24–30. [Google Scholar] [CrossRef]
  54. Deboucha, W.; Leklou, N.; Khelidj, A.; Oudjit, M.N. Hydration Development of Mineral Additives Blended Cement Using Thermogravimetric Analysis (TGA): Methodology of Calculating the Degree of Hydration. Constr. Build. Mater. 2017, 146, 687–701. [Google Scholar] [CrossRef]
  55. Kim, T.; Olek, J. Effects of Sample Preparation and Interpretation of Thermogravimetric Curves on Calcium Hydroxide in Hydrated Pastes and Mortars. Transp. Res. Rec. 2012, 2290, 10–18. [Google Scholar] [CrossRef]
  56. Pacewska, B.; Blonkowski, G.; Wilińska, I. Studies on the Pozzolanic and Hydraulic Properties of Fly Ashes in Model Systems. J. Therm. Anal. Calorim. 2008, 94, 469–476. [Google Scholar] [CrossRef]
  57. Oey, T.; Kumar, A.; Bullard, J.W.; Neithalath, N.; Sant, G. The Filler Effect: The Influence of Filler Content and Surface Area on Cementitious Reaction Rates. J. Am. Ceram. Soc. 2013, 96, 1978–1990. [Google Scholar] [CrossRef]
  58. Diaz-Loya, I.; Juenger, M.; Seraj, S.; Minkara, R. Extending Supplementary Cementitious Material Resources: Reclaimed and Remediated Fly Ash and Natural Pozzolans. Cem. Concr. Compos. 2019, 101, 44–51. [Google Scholar] [CrossRef]
  59. Matysík, M.; Vymazal, T.; Plšková, I. Effect of Superplasticizers on the Cement Hydration Process. Adv. Mat. Res. 2015, 1100, 3–6. [Google Scholar]
  60. Phung, Q.T.; Ferreira, E.; Seetharam, S.; Nguyen, V.T.; Govaerts, J.; Valcke, E. Understanding Hydration Heat of Mortars Containing Supplementary Cementitious Materials with Potential to Immobilize Heavy Metal Containing Waste. Cem. Concr. Compos. 2021, 115, 103859. [Google Scholar] [CrossRef]
  61. Pandel, B. Understanding the Retardation of Cement Hydration Caused by Zinc. Master’s Thesis, University of Illinois at Urbana, Champaign, IL, USA, 2018. [Google Scholar]
  62. Mostafa, N.Y.; Brown, P.W. Heat of Hydration of High Reactive Pozzolans in Blended Cements: Isothermal Conduction Calorimetry. Thermochim. Acta 2005, 435, 162–167. [Google Scholar] [CrossRef]
  63. Bobrowicz, J.; Chyliński, F. Comparison of Pozzolanic Activity of Ilmenite MUD Waste to Other Pozzolans Used as an Additive for Concrete Production. J. Therm. Anal. Calorim. 2021, 143, 2901–2909. [Google Scholar] [CrossRef]
  64. Siler, P.; Kratky, J.; de Belie, N. Isothermal and Solution Calorimetry to Assess the Effect of Superplasticizers and Mineral Admixtures on Cement Hydration. J. Therm. Anal. Calorim. 2012, 107, 313–320. [Google Scholar] [CrossRef]
  65. Jang, H.; Lim, Y.-T.; Kang, J.-H.; So, S.; So, H. Influence of Calcination and Cooling Conditions on Pozzolanic Reactivity of Paper Mill Sludge. Constr. Build. Mater. 2018, 166, 257–270. [Google Scholar] [CrossRef]
  66. Black, L. Low Clinker Cement as a Sustainable Construction Material. In Sustainability of Construction Materials; Elsevier: Amsterdam, The Netherlands, 2016; pp. 415–457. [Google Scholar]
  67. Tironi, A.; Trezza, M.A.; Scian, A.N.; Irassar, E.F. Assessment of Pozzolanic Activity of Different Calcined Clays. Cem. Concr. Compos. 2013, 37, 319–327. [Google Scholar] [CrossRef]
  68. Mardani-Aghabaglou, A.; İnan Sezer, G.; Ramyar, K. Comparison of Fly Ash, Silica Fume and Metakaolin from Mechanical Properties and Durability Performance of Mortar Mixtures View Point. Constr. Build. Mater. 2014, 70, 17–25. [Google Scholar] [CrossRef]
  69. Thorstensen, R.T.; Fidjestol, P. Inconsistencies in the Pozzolanic Strength Activity Index (SAI) for Silica Fume According to EN and ASTM. Mater. Struct. 2015, 48, 3979–3990. [Google Scholar] [CrossRef]
  70. ASTM C311-18 C311/C311M-18; Standard Test Methods for Sampling and Testing Fly Ash or Natural Pozzolans for Use in Portland-Cement Concrete. ASTM International: West Conshohocken, PA, USA, 2018.
  71. Rahman, M.A.; Sarker, P.K.; Shaikh, F.U.A.; Saha, A.K. Soundness and Compressive Strength of Portland Cement Blended with Ground Granulated Ferronickel Slag. Constr. Build. Mater. 2017, 140, 194–202. [Google Scholar] [CrossRef]
  72. Chao-Lung, H.; Le Anh-Tuan, B.; Chun-Tsun, C. Effect of Rice Husk Ash on the Strength and Durability Characteristics of Concrete. Constr. Build. Mater. 2011, 25, 3768–3772. [Google Scholar] [CrossRef]
  73. Patil, C.; Manjunath, M.; Hosamane, S.; Bandekar, S.; Athani, R. Pozzolonic Activity and Strength Activity Index of Bagasse Ash and Fly Ash Blended Cement Mortar. Mater. Today Proc. 2021, 42, 1456–1461. [Google Scholar] [CrossRef]
  74. Ramezanianpour, A.A.; Mousavi, R.; Kalhori, M.; Sobhani, J.; Najimi, M. Micro and Macro Level Properties of Natural Zeolite Contained Concretes. Constr. Build. Mater. 2015, 101, 347–358. [Google Scholar] [CrossRef]
  75. Aliabdo, A.A.; Abd Elmoaty, A.E.M.; Aboshama, A.Y. Utilization of Waste Glass Powder in the Production of Cement and Concrete. Constr. Build. Mater. 2016, 124, 866–877. [Google Scholar] [CrossRef]
  76. Xie, J.; Zhang, H.; Duan, L.; Yang, Y.; Yan, J.; Shan, D.; Liu, X.; Pang, J.; Chen, Y.; Li, X.; et al. Effect of Nano Metakaolin on Compressive Strength of Recycled Concrete. Constr. Build. Mater. 2020, 256, 119393. [Google Scholar] [CrossRef]
  77. Duan, P.; Shui, Z.; Chen, W.; Shen, C. Effects of Metakaolin, Silica Fume and Slag on Pore Structure, Interfacial Transition Zone and Compressive Strength of Concrete. Constr. Build. Mater. 2013, 44, 1–6. [Google Scholar] [CrossRef]
  78. Sanjuán, M.Á.; Argiz, C.; Gálvez, J.C.; Moragues, A. Effect of Silica Fume Fineness on the Improvement of Portland Cement Strength Performance. Constr. Build. Mater. 2015, 96, 55–64. [Google Scholar] [CrossRef]
  79. Kasaniya, M.; Thomas, M.D.A.; Moffatt, E.G. Pozzolanic Reactivity of Natural Pozzolans, Ground Glasses and Coal Bottom Ashes and Implication of Their Incorporation on the Chloride Permeability of Concrete. Cem. Concr. Res. 2021, 139, 106259. [Google Scholar] [CrossRef]
  80. Kasaniya, M.; Thomas, M.D.A.; Moffatt, E.G. Development of Rapid and Reliable Pozzolanic Reactivity Test Method. ACI Mater. J. 2019, 116, 145–154. [Google Scholar] [CrossRef]
  81. Kalina, R.D.; Al-Shmaisani, S.; Ferron, R.D.; Juenger, M.C.G. False Positives in ASTM C618 Specifications for Natural Pozzolans. ACI Mater. J. 2019, 116, 165–172. [Google Scholar] [CrossRef]
  82. Benli, A. Mechanical and Durability Properties of Self-compacting Mortars Containing Binary and Ternary Mixes of Fly Ash and Silica Fume. Struct. Concr. 2019, 20, 1096–1108. [Google Scholar] [CrossRef]
  83. Suraneni, P.; Burris, L.; Shearer, C.R.; Hooton, R.D. ASTM C618 Fly Ash Specification: Comparison with Other Specifications, Shortcomings, and Solutions. ACI Mater. J. 2021, 118, 157–167. [Google Scholar]
  84. Cordeiro, G.C.; Toledo Filho, R.D.; Tavares, L.M.; Fairbairn, E.M.R. Pozzolanic Activity and Filler Effect of Sugar Cane Bagasse Ash in Portland Cement and Lime Mortars. Cem. Concr. Compos. 2008, 30, 410–418. [Google Scholar] [CrossRef]
  85. Deschner, F.; Winnefeld, F.; Lothenbach, B.; Seufert, S.; Schwesig, P.; Dittrich, S.; Goetz-Neunhoeffer, F.; Neubauer, J. Hydration of Portland Cement with High Replacement by Siliceous Fly Ash. Cem. Concr. Res. 2012, 42, 1389–1400. [Google Scholar] [CrossRef]
  86. Shi, C.; Grattan-Bellew, P.E.; Stegemann, J.A. Conversion of a Waste Mud into a Pozzolanic Material. Constr. Build. Mater. 1999, 13, 279–284. [Google Scholar] [CrossRef]
  87. Tseng, Y.-S.; Huang, C.-L.; Hsu, K.-C. The Pozzolanic Activity of a Calcined Waste FCC Catalyst and Its Effect on the Compressive Strength of Cementitious Materials. Cem. Concr. Res. 2005, 35, 782–787. [Google Scholar] [CrossRef]
  88. Carneiro, L.R.S.; Garcia, D.C.S.; Costa, M.C.F.; Houmard, M.; Figueiredo, R.B. Evaluation of the Pozzolanicity of Nanostructured Sol-Gel Silica and Silica Fume by Electrical Conductivity Measurement. Constr. Build. Mater. 2018, 160, 252–257. [Google Scholar] [CrossRef]
  89. Luxán, M.P.; Madruga, F.; Saavedra, J. Rapid Evaluation of Pozzolanic Activity of Natural Products by Conductivity Measurement. Cem. Concr. Res. 1989, 19, 63–68. [Google Scholar] [CrossRef]
  90. Amar, M.; Benzerzour, M.; Abriak, N.-E.; Mamindy-Pajany, Y. Study of the Pozzolanic Activity of a Dredged Sediment from Dunkirk Harbour. Powder Technol. 2017, 320, 748–764. [Google Scholar] [CrossRef]
  91. Payá, J.; Borrachero, M.V.; Monzó, J.; Peris-Mora, E.; Amahjour, F. Enhanced Conductivity Measurement Techniques for Evaluation of Fly Ash Pozzolanic Activity. Cem. Concr. Res. 2001, 31, 41–49. [Google Scholar] [CrossRef]
  92. Sinthaworn, S.; Nimityongskul, P. Effects of Temperature and Alkaline Solution on Electrical Conductivity Measurements of Pozzolanic Activity. Cem. Concr. Compos. 2011, 33, 622–627. [Google Scholar] [CrossRef]
  93. Shao, J.; Gao, J.; Zhao, Y.; Chen, X. Study on the Pozzolanic Reaction of Clay Brick Powder in Blended Cement Pastes. Constr. Build. Mater. 2019, 213, 209–215. [Google Scholar] [CrossRef]
  94. Cuesta, A.; Santacruz, I.; De la Torre, A.G.; Dapiaggi, M.; Zea-Garcia, J.D.; Aranda, M.A.G. Local Structure and Ca/Si Ratio in C-S-H Gels from Hydration of Blends of Tricalcium Silicate and Silica Fume. Cem. Concr. Res. 2021, 143, 106405. [Google Scholar] [CrossRef]
  95. Wang, T.; Ishida, T.; Gu, R.; Luan, Y. Experimental Investigation of Pozzolanic Reaction and Curing Temperature-Dependence of Low-Calcium Fly Ash in Cement System and Ca-Si-Al Element Distribution of Fly Ash-Blended Cement Paste. Constr. Build. Mater. 2021, 267, 121012. [Google Scholar] [CrossRef]
  96. Kim, S.K.; Kang, S.T.; Kim, J.K.; Jang, I.Y. Effects of Particle Size and Cement Replacement of LCD Glass Powder in Concrete. Adv. Mater. Sci. Eng. 2017, 2017, 1–12. [Google Scholar] [CrossRef]
  97. Dadsetan, S.; Bai, J. Mechanical and Microstructural Properties of Self-Compacting Concrete Blended with Metakaolin, Ground Granulated Blast-Furnace Slag and Fly Ash. Constr. Build. Mater. 2017, 146, 658–667. [Google Scholar] [CrossRef]
  98. Newbury, D.E.; Ritchie, N.W.M. Is Scanning Electron Microscopy/Energy Dispersive X-Ray Spectrometry (SEM/EDS) Quantitative? Scanning 2013, 35, 141–168. [Google Scholar] [CrossRef]
  99. Nasrazadani, S.; Hassani, S. Modern Analytical Techniques in Failure Analysis of Aerospace, Chemical, and Oil and Gas Industries. In Handbook of Materials Failure Analysis with Case Studies from the Oil and Gas Industry; Elsevier: Amsterdam, The Netherlands, 2016; pp. 39–54. [Google Scholar]
  100. Wolfgong, W.J. Chemical Analysis Techniques for Failure Analysis. In Handbook of Materials Failure Analysis with Case Studies from the Aerospace and Automotive Industries; Elsevier: Amsterdam, The Netherlands, 2016; pp. 279–307. [Google Scholar]
  101. Maraghechi, H.; Maraghechi, M.; Rajabipour, F.; Pantano, C.G. Pozzolanic Reactivity of Recycled Glass Powder at Elevated Temperatures: Reaction Stoichiometry, Reaction Products and Effect of Alkali Activation. Cem. Concr. Compos. 2014, 53, 105–114. [Google Scholar] [CrossRef]
  102. Belfiore, C.M.; Fichera, G.V.; Ortolano, G.; Pezzino, A.; Visalli, R.; Zappalà, L. Image Processing of the Pozzolanic Reactions in Roman Mortars via X-Ray Map Analyser. Microchem. J. 2016, 125, 242–253. [Google Scholar] [CrossRef]
  103. Durdziński, P.T.; Dunant, C.F.; Ben Haha, M.; Scrivener, K.L. A New Quantification Method Based on SEM-EDS to Assess Fly Ash Composition and Study the Reaction of Its Individual Components in Hydrating Cement Paste. Cem. Concr. Res. 2015, 73, 111–122. [Google Scholar] [CrossRef]
  104. Wilson, W.; Rivera-Torres, J.M.; Sorelli, L.; Durán-Herrera, A.; Tagnit-Hamou, A. The Micromechanical Signature of High-Volume Natural Pozzolan Concrete by Combined Statistical Nanoindentation and SEM-EDS Analyses. Cem. Concr. Res. 2017, 91, 1–12. [Google Scholar] [CrossRef]
  105. Taylor, H.F.W.; Mohan, K.; Moir, G.K. Analytical Study of Pure and Extended Portland Cement Pastes: II, Fly Ash- and Slag-Cement Pastes. J. Am. Ceram. Soc. 1985, 68, 685–690. [Google Scholar] [CrossRef]
  106. Amin, M.N.; Hissan, S.; Shahzada, K.; Khan, K.; Bibi, T. Pozzolanic Reactivity and the Influence of Rice Husk Ash on Early-Age Autogenous Shrinkage of Concrete. Front. Mater. 2019, 6, 150. [Google Scholar] [CrossRef]
  107. Reimer, L. Scanning Electron Microscopy: Physics of Image Formation and Microanalysis, Second Edition. Meas. Sci. Technol. 2000, 11, 1826. [Google Scholar] [CrossRef]
  108. Chihaoui, R.; Siad, H.; Senhadji, Y.; Mouli, M.; Nefoussi, A.M.; Lachemi, M. Efficiency of Natural Pozzolan and Natural Perlite in Controlling the Alkali-Silica Reaction of Cementitious Materials. Case Stud. Constr. Mater. 2022, 17, e01246. [Google Scholar] [CrossRef]
  109. Figueiredo, R.L.; Pavía, S. A Study of the Parameters That Determine the Reactivity of Sugarcane Bagasse Ashes (SCBA) for Use as a Binder in Construction. SN Appl. Sci. 2020, 2, 1515. [Google Scholar] [CrossRef]
  110. Rossen, J.E.; Scrivener, K.L. Optimization of SEM-EDS to Determine the C–A–S–H Composition in Matured Cement Paste Samples. Mater. Charact. 2017, 123, 294–306. [Google Scholar] [CrossRef]
  111. Brown, P.W. Early-Age Cement Hydration Reactions. Transp. Res. Rec. 1990, 53–59. [Google Scholar]
  112. Liao, W.; Sun, X.; Kumar, A.; Sun, H.; Ma, H. Hydration of Binary Portland Cement Blends Containing Silica Fume: A Decoupling Method to Estimate Degrees of Hydration and Pozzolanic Reaction. Front. Mater. 2019, 6, 78. [Google Scholar] [CrossRef]
  113. ASTM, C.-16 597-16; Standard Test Method for Pulse Velocity through Concrete. Annual Book of ASTM Standards. ASTM International: West Conshohocken, PA, USA, 2016.
  114. Kamath, M.; Prashant, S.; Kumar, M. Micro-Characterisation of Alkali Activated Paste with Fly Ash-GGBS-Metakaolin Binder System with Ambient Setting Characteristics. Constr. Build. Mater. 2021, 277, 122323. [Google Scholar] [CrossRef]
  115. Hong, G.; Oh, S.; Choi, S.; Chin, W.-J.; Kim, Y.-J.; Song, C. Correlation between the Compressive Strength and Ultrasonic Pulse Velocity of Cement Mortars Blended with Silica Fume: An Analysis of Microstructure and Hydration Kinetics. Materials 2021, 14, 2476. [Google Scholar] [CrossRef] [PubMed]
  116. Madandoust, R.; Mousavi, S.Y. Fresh and Hardened Properties of Self-Compacting Concrete Containing Metakaolin. Constr. Build. Mater. 2012, 35, 752–760. [Google Scholar] [CrossRef]
  117. Durgun, M.Y.; Sevinç, A.H. High Temperature Resistance of Concretes with GGBFS, Waste Glass Powder, and Colemanite Ore Wastes after Different Cooling Conditions. Constr. Build. Mater. 2019, 196, 66–81. [Google Scholar] [CrossRef]
  118. Khatib, J.M. Performance of Self-Compacting Concrete Containing Fly Ash. Constr. Build. Mater. 2008, 22, 1963–1971. [Google Scholar] [CrossRef]
  119. Demirboğa, R.; Türkmen, İ.; Karakoç, M.B. Relationship between Ultrasonic Velocity and Compressive Strength for High-Volume Mineral-Admixtured Concrete. Cem. Concr. Res. 2004, 34, 2329–2336. [Google Scholar] [CrossRef]
  120. Ulucan, Z.Ç.; Türk, K.; Karataş, M. Effect of Mineral Admixtures on the Correlation between Ultrasonic Velocity and Compressive Strength for Self-Compacting Concrete. Russ. J. Nondestruct. Test. 2008, 44, 367–374. [Google Scholar] [CrossRef]
  121. Chandak, M.A.; Pawade, P. Compressive Strength and Ultrasonic Pulse Velocity of Concrete with Metakaolin. Civ. Eng. Arch. 2020, 8, 1277–1282. [Google Scholar] [CrossRef]
  122. Sasanipour, H.; Aslani, F. Effect of Specimen Shape, Silica Fume, and Curing Age on Durability Properties of Self-Compacting Concrete Incorporating Coarse Recycled Concrete Aggregates. Constr. Build. Mater. 2019, 228, 117054. [Google Scholar] [CrossRef]
  123. Özkan, İ.; Yayla, Z. Evaluation of Correlation between Physical Properties and Ultrasonic Pulse Velocity of Fired Clay Samples. Ultrasonics 2016, 66, 4–10. [Google Scholar] [CrossRef] [PubMed]
  124. Demirel, B.; Keleştemur, O. Effect of Elevated Temperature on the Mechanical Properties of Concrete Produced with Finely Ground Pumice and Silica Fume. Fire Saf. J. 2010, 45, 385–391. [Google Scholar] [CrossRef]
  125. Jiang, H.; Yi, H.; Yilmaz, E.; Liu, S.; Qiu, J. Ultrasonic Evaluation of Strength Properties of Cemented Paste Backfill: Effects of Mineral Admixture and Curing Temperature. Ultrasonics 2020, 100, 105983. [Google Scholar] [CrossRef]
  126. Khalaf, M.A.; Ban, C.C.; Ramli, M. The Constituents, Properties and Application of Heavyweight Concrete: A Review. Constr. Build. Mater. 2019, 215, 73–89. [Google Scholar] [CrossRef]
  127. Pinheiro, V.D.; Alexandre, J.; Xavier, G.d.C.; Marvila, M.T.; Monteiro, S.N.; Azevedo, A.R.G. de Methods for Evaluating Pozzolanic Reactivity in Calcined Clays: A Review. Materials 2023, 16, 4778. [Google Scholar] [CrossRef] [PubMed]
  128. Choudhary, A.; Bharadwaj, K.; Ghantous, R.M.; Isgor, O.B.; Weiss, W.J. Pozzolanic Reactivity Test of Supplementary Cementitious Materials. ACI Mater. J. 2022, 119, 255–268. [Google Scholar]
  129. Suraneni, P.; Hajibabaee, A.; Ramanathan, S.; Wang, Y.; Weiss, J. New Insights from Reactivity Testing of Supplementary Cementitious Materials. Cem. Concr. Compos. 2019, 103, 331–338. [Google Scholar] [CrossRef]
  130. Snellings, R.; Li, X.; Avet, F.; Scrivener, K. Rapid, Robust, and Relevant (R3) Reactivity Test for Supplementary Cementitious Materials. Mater. J. 2019, 116, 155–162. [Google Scholar] [CrossRef]
  131. Avet, F.; Li, X.; Ben Haha, M.; Bernal, S.A.; Bishnoi, S.; Cizer, Ö.; Cyr, M.; Dolenec, S.; Durdzinski, P.; Haufe, J.; et al. Report of RILEM TC 267-TRM Phase 2: Optimization and Testing of the Robustness of the R3 Reactivity Tests for Supplementary Cementitious Materials. Mater. Struct. 2022, 55, 92. [Google Scholar] [CrossRef]
Figure 1. Schematic mechanism of the strength development due to pozzolanic reaction products, adapted from [6].
Buildings 13 02789 g001
Figure 2. Pozzolanic assessment diagram adapted from [35].
Buildings 13 02789 g002
Figure 3. Frattini test results for different pozzolanic materials in different studies [10,11,33,38,39,40].
Buildings 13 02789 g003
Figure 4. XRD patterns for the hydrated cement sample replaced with brick powder by 20% after 28 curing days [29].
Buildings 13 02789 g004
Figure 5. TG/DTA of cement paste containing 10% limestone filler at 28 days, adapted from [54].
Buildings 13 02789 g005
Figure 6. A typical calorimetry plot for cement’s heat of hydration at 25 °C adapted from [62].
Buildings 13 02789 g006
Figure 7. The heat of hydration of blended cement–pozzolan samples adapted from Bobrowicz and Chyliński [63].
Buildings 13 02789 g007
Figure 8. SAI results for different pozzolans; OPC (only portland cement), SF (silica fume), MK (metakaolin), FA (fly ash), SL (slag), RHA (rice husk ash), BA (bagasse ash), ZE (zeolite), GP (glass powder) [11,71,72,73,74,75].
Buildings 13 02789 g008
Figure 9. pH and LC (%) variation curves with time for pozzolan–water suspensions, adapted from Uzal et al. [50].
Buildings 13 02789 g009
Figure 10. SEM image of the hydrated cement sample containing waste glass powder (GP) at 28 days (10% replacement) [96].
Buildings 13 02789 g010
Figure 11. SEM/EDS of MZ20 sample [108].
Buildings 13 02789 g011
Figure 12. Schematic view of UPV test: (a) direct, (b) indirect, and (c) semi-direct approach.
Buildings 13 02789 g012
Figure 13. Calculated UPVI values for silica fume (SF), metakaolin (MK), fly ash (FA), slag (SL), and glass powder (GP) [115,116,117,118].
Buildings 13 02789 g013
Figure 14. Percentages of studies that used Frattini, TGA, and XRD.
Buildings 13 02789 g014
Figure 15. Percentages of studies that used SAI, calorimetry, electrical conductivity, pH, UPV, and SEM-EDS.
Buildings 13 02789 g015
Table 1. A summary of the TGA method for common pozzolans, test conditions, and results.
Assessed PozzolansMixture w/b
or l/s *
AgeResultsReference
Five types of fly ash30% ash + 70% lime0.5, 0.41, 0.35, 0.60, and 0.817, 28, and 90 daysTwo ash types with a high surface area
showed considerable consumption of portlandite
[10]
Earth of Milos (a natural pozzolan) ceramic powder from handmade ground brick, metakaolinLime/pozzolan with ratios of 1/0.5, 1/1, 1/2, 1/3, 1/20.54–10, 3, 7, 14, and 28 daysLime/metakaolin pastes presented the highest activity with higher portlandite consumption.[52]
Reclaimed fly ash types and natural pozzolan20% fly ash + 80% portland cement type I0.407, 28, and 90All pozzolans showed a reduction in portlandite[58]
Waste glass powder (WGP)30% glass powder + 70% portland cement type I0.43 and 28The total molar amount of portlandite decreased from 3 to 28 days because of active silicas in WGP mortars[51]
Slate-cutting waste (SCW)25% SCW + 75% portland cement type III0.5528 and 56The total molar amount of portlandite was not significantly reduced through partial replacement of SCW [13]
Four types of fly ashes, four slags, two calcined clays, two silica fumes, a quartz, a limestoneCalcium hydroxide and SCMs in a mass ratio of 3:1 + 0.5 M potassium hydroxide 0.9240 hThe order of calcium hydroxide consumption from the greatest to the lowest: silica fume > calcined clay > fly ash > quartz > slag > limestone[2]
Waste glass powderGlass powder with 30% and 60% replacement of ordinary portland cement type I 0.4857, 28, and 91 daysThe content of consumed Ca(OH)2 decreased through increasing glass powder content and curing age.[48]
Densified silica fume, nano silica, and metakaolinCalcium hydroxide–pozzolan blended samples with a solid-to-water ratio of 111, 3, 7, 14, and 28 daysThere was more lime fixation at the late stage. Order of reduction in calcium hydroxide from greatest to the lowest: nano silica > metakaolin > silica fume [5]
* w/b: water-to-binder ratio, l/s: liquid-to-solid ratio.
Table 2. SAI mixture designation [70].
SpecimensWater (mL)Portland Cement (g)Tested Material (g)Graded Standard Sand (g)
Control mix24250001375
Blended mixRequired for flow ±5 of control mix4001001375
Table 3. Reduction in the electrical conductivity for determination of pozzolanic reactivity [89].
Non-PozzolanicVariable Pozzolanic ReactivityGood Pozzolanic Reactivity
<0.4 mS/cmBetween 0.4 and 1.2 mS/cm>1.2 mS/cm
Table 4. Ca/Si ratio of cement–pozzolan blended samples.
Cement–Pozzolan Blended SamplesReplacement Level (%)Testing Age (Days)Ca/SiReference
Fly ash301821.4[95]
Fly ash351401.4[22]
Fly ash40911.39[105]
Waste glass powder1030.33[96]
Rice husk ash15910.98[106]
Metakaolin20281.3[97]
Nanosilica330.60–0.90[21]
Natural pozzolan20141.15[108]
Table 5. Correlation between UPV and compressive strength.
Tested PozzolanCement Rep. Level (%)w/bPrediction Eq. R 2 Reference
Silica fume100.485 f c = 32.565 V c 101.35 0.99[68]
Fly ash100.485 f c = 33.42 V c 104.92 0.989[68]
Metakaolin100.485 f c = 28.312 V c 81.228 0.976[68]
Blast furnace slag50, 60, 700.35 f c = 0.0049 e 0.0021 V c 0.96[119]
Fly ash250.39 f c = 0.0003 e 2.4329 V c 0.99[120]
Metakaolin200.38 f c = 0.0723 V c 249.67 0.9982[121]
f c = c o m p r e s s i v e   s t r e n g t h   M P a , V c = x t , where x is the propagated path and t is the transmitted time (UPV).
Table 6. A summary of studied test methods based on the assessment time for the evaluation of pozzolanic reactivity.
Pozzolanic Reactivity
Test Method
Studied PozzolansTime for Detecting ReactivityReferences
FrattiniFly ash8 days[11]
TGAFly ash28 days[10]
XRDGlass powder28 days[48]
SAIFly ash28 days[11]
CalorimetryR-Mud24 h[63]
Electrical conductivityFly ash240 min[50]
pHSilica fume240 min[50]
SEM/EDSMetakaolin28 days[97]
UPV(I)Silica fume7 days[68]
R3Calcined clays7 days[131]
Table 7. Summary of studied pozzolanic reactivity test methods.
Test MethodsPotential to Distinguish Pozzolanic Materials from Other SCMsAdvantagesDisadvantageMajor EquipmentCost of Equipment
FrattiniHighIt is a reliable way to distinguish pozzolanic and non-pozzolanic materials.It does not provide information about the presence of portlandite in the hardened pastes (concrete).OvenMedium
XRDHighIt can reliably assess the consumption of portlandite by a pozzolan in a hydrated sample.It requires a precise selection of the peaks related to portlandite and hydrated phases in an XRD pattern.X-ray diffractometerHigh
TG/DTAHighIt accurately measures the consumed portlandite by pozzolan.Preparation and curing of test samples take a long time.Thermogravemetric analyserHigh
CalorimetryLowIt is an accurate and relatively rapid method.It requires specific conditions and careful calibration for the different mixtures.CalorimeterHigh
SAILowIt provides a comparative strength analysis of the pozzolan-cement and control (portland cement) samples.It fails to differentiate between filler and pozzolanic reactivity effects at early ages of hydration.Compression testing machineMedium
Electrical conductivityMediumIt is a rapid and easy method.It is influenced by temperature.Electrical conductivity meterLow
pHMediumIt is a rapid and easy method.It is influenced by temperature.pH meterLow
SEM/EDSHighIt distinguishes C–S–H gels formed during the hydration of cement and during the pozzolanic reaction.It requires a high-resolution SEM image and a precise selection of C–S–H gel in the hydrated sample.Scanning electron microscope with an energy-dispersive X-ray spectroscopy attachmentHigh
UPV(I)LowIt is highly correlated with compressive strength. It evaluates the durability of cement-pozzolan samples. It is affected by the mix proportions, material properties, and pore structure.Ultrasonic pulse velocity testerLow
R3LowIt has good correlation with compressive strength and is a less time-consuming method.It is not capable of measuring the amount of portlandite consumed during pozzolanic reaction. It requires rigid calorimeter calibration procedures for measuring the heat of hydration. Muffle furnace and an oven/CalorimeterHigh
Disclaimer/Publisher’s Note: The statements, opinions and data contained in all publications are solely those of the individual author(s) and contributor(s) and not of MDPI and/or the editor(s). MDPI and/or the editor(s) disclaim responsibility for any injury to people or property resulting from any ideas, methods, instructions or products referred to in the content.

