Abstract
This article analyses the combined effect of a mixture of natural zeolite and ground soda lime silicate glass on the durability properties of concrete. The specimens were prepared by replacing 25% of the cement with a mixture of zeolite and glass at different proportions with zeolite particles of two different sizes and cured for 28 and 90 days. Chloride migration, the depth of water penetration under pressure, and freeze–thaw cycle tests were performed, and compressive strength was determined. The combined effect of the mixture on the composition and microstructure of the cement matrix was studied by analysing the results of XRD, TGA, SEM-BSE, and porosity tests. The test results showed that irrespective of the cement “dilution” effect, the mixture of additives had a beneficial combined effect: increased durability of concrete, a denser structure of the cement matrix, the formation of calcium aluminate hydrates, faster rate, and higher degree of hydration.
1. Introduction
Detailed studies have indicated various measures to reduce the environmental impact of cement and concrete. One strategy to decrease concrete’s environmental impact is by replacing its cement with co-products and by-products. In relation to this strategy, most of the studies are focused only on the effect of supplementary cementitious material on the technical performance of concrete. However, this assumption may not be correct when the service life of concrete is not in consideration. Therefore, it is preferable to study simultaneously the concrete’s technical performance—durability and mechanical characteristics, energy consumption, eutrophication potential, acidification potential, economy of concrete [1].
Natural zeolite is a highly porous material (total porosity ranges from 24% to 32%) having a three-dimensional structure with voids interconnected by channels [2] (diameters range from 3.9 to 5.4 Å), with a good pozzolanic activity, high specific surface area, ion exchange capacity, absorption properties, etc. According to the literature analysis, the addition of zeolite has a positive effect on the stability of the mixture by reducing segregation and water separation, and consequently helping the mixture to remain homogeneous. Researchers who investigated these properties [3] point out that zeolite enhances fresh concrete properties by reducing the bleeding and segregation; however, the replacement of 10% or a higher amount of cement resulted in a lower slump of the paste or higher superplasticizer demand in order to maintain the same workability properties. Similar findings were reported by other authors [4], who believe that zeolite increases water demand, and more superplasticiser is required to control the workability properties. They state that absorption properties of zeolite have a negative effect on the consistency of the mix and accelerate the initial and final setting time.
The effects of different zeolite content were studied by the authors of [5] in the mix (0%, 8%, 16%, 24%, 32%, 40%) on the density, specific density, and open porosity of hardened cement matrix and it was found that the specimens containing zeolite had a higher open porosity than control specimens. Other research [6] where the effect of zeolite on the porosity and permeability of concrete was analysed showed that after 28 days of curing, the specimens where 5% of cement was replaced with zeolite had 10.4% higher compressive strength and 4.7% lower total porosity. Those effects were explained via the pozzolanic reactions of zeolites producing additional calcium and aluminium silicate hydrates, which improved the concrete microstructure. This finding is confirmed by other researchers [7], whose experimental tests showed that hardened cement paste modified with zeolite has less pores of >50 nm and therefore has better compressive strength and permeability properties. In addition, XRD tests of specimens modified with zeolite showed the presence of tetracalcium aluminate hydrates (4CaO·Al2O3·13H2O), which, presumably, make the microstructure of the cement matrix denser.
Detailed studies [8] of the effect of a zeolite additive and its different level of content (0%, 10%, 20%, 40%, 60%) on the durability of concrete were completed in terms of total porosity and pore size distribution. It was reported that total porosity increased in all specimens modified with zeolite and that the pore volume in the specimens modified with 10% and 20% of zeolite mainly increased due to the fine pores with a diameter from 0.01 to 0.1 µm which may be related to unreacted zeolite. Studies of water absorption and the depth of water penetration under pressure [9] showed an inverse relationship between water absorption and water penetration depth, i.e., higher water absorption and lower penetration depth values were recorded in the specimens modified with zeolites than in control specimens.
Soda lime silicate glass (hereinafter glass) is a transparent material with high resistance to alkali and acids widely used in different industries. Glass is mainly composed of amorphous SiO2 (65–75%), Na2O (12–15%), and CaO (6–12%), and could therefore be used as an alkaline activator for a wide range of pozzolanic materials, such as metakaolin, GGBS, fly ash, or other aluminosilicates. The use of glass in the cement industry is still controversial because, on the one hand, CaO can react with water and amorphous SiO2 present in the glass to form C-S-H of low alkalinity, and thus be an excellent pozzolanic material; meanwhile, on the other hand, the relatively high content of Na2O in the glass could cause alkali–silica reactions (ASR) in concrete.
From a theoretical point of view, ground glass contains a large amount of amorphous SiO2 and Na2O. The reaction of these materials with CH produces silica gel, which absorbs water, swells, and can cause internal stresses in the cement matrix leading to microcracking and deterioration of mechanical properties and resistance of cement concrete to environmental factors [10]. Actually, the ASR development in concrete containing ground glass depends on the pozzolanicity of the glass, the quantity of the glass particles, and their size, the type of glass, and its colour [11].
Studies show [12] that a higher amount of ground glass in cement mortars causes a slight increase in the flowability of the mortar. In the tests where cement was replaced with glass (0%, 5%, 10%, 15%, 20%), the slump flow of the paste increased from 132.5 mm to 135.2 mm. The same findings are supported by other researchers [13] who reported that the slump flow diameter increased from 27.2 to 29.1 cm when 20% of cement was replaced with glass powder. To explain this effect, it has been suggested [14] that non-absorbing glass particles increase the effective water/cement ratio because more water remains in the mix at a higher glass content and thus the flowability of the paste improves.
The authors of [15] analysed the effect of glass particle size on the compressive strength of the mortar and performed tests with particle sizes of 63 μm and 75 μm. They found that at 90 days the compressive strength of the specimens where 20% of cement was replaced with ground glass with a particle size smaller than 63 μm was similar to the strength of control specimens. Studies of the long-term effects of glass on concrete properties [16] showed that mechanical properties of concrete (compressive and flexural strength as well as elastic modulus) improved with the addition of glass powder to the mix. The pozzolanicity of glass powder improves the microstructure and subsequently the mechanical properties of concrete.
The research [17] into moisture absorption leads to the conclusion that modified concretes containing 10% of glass powder have similar or better resistance to water penetration compared to the control specimens at a later age and better resistance compared to concrete modified with 10% of fly ash at an early age. Measurements of water penetration depth in concrete in which 0%, 15%, 30%, 45%, or 60% of cement was replaced with ground glass [18] showed that all modified concrete mixes had a lower water penetration depth (compared to the control mix). Water penetration depth was 31, 9, 8, 6, or 8 mm correspondingly to the amount of cement replaced with glass. The study of the long-term effects of glass additives on concrete [19] confirmed that a more compact microstructure of concrete, especially at a late age, along with significant reduction in porosity and better durability performance, was the most beneficial effect of glass powder addition.
In summary, natural zeolite has significant properties such as pozzolanic activity, ion exchange capacity, and open crystal lattice structure. Therefore, it can be used to replace part of cement to improve mechanical and durability properties of structures, but its use is limited due to its water absorption capacity and the amount of entrained air. According to the literature review, the best results are obtained by replacing 10% or 15% of cement with zeolite; thus, indicating the limits of natural zeolite addition.
This shortcoming of zeolite could be eliminated by the addition of a pozzolanic additive, i.e., soda lime silicate glass, which is characterised by very low absorption, high amorphous SiO2 and Na2O content, and the ability to improve mechanical properties and durability of cementitious systems.
Until now, very few studies have been performed to understand the complex effects of natural zeolite and sodium silicate glass mixture on cement chemistry and properties of cement-based concretes; therefore, the aim of this work is to determine the complex effects of the mineral mixture on durability properties, and on the microstructure of the products of hydration.
2. Materials and Methods
2.1. Materials
Cement pastes and mortars were prepared with Portland cement CEM I 42.5 R that complies with EN 197-1 [20] requirements. The mineral composition of cement clinker without gypsum was as follows: tricalcium silicate (57.8%), β-dicalcium silicate (22.2%), tricalcium aluminate (6.7%), tetracalcium aluminoferrite (13.3%).
Natural zeolite of Transcarpathian origin contained clinoptilolite, heulandite, and quartz. The oxide compositions of cement, natural zeolite, and glass powder are given in Table 1. The physical properties of cement, natural zeolite, and glass are given in Table 2.

Table 1.
Chemical compositions of cement, natural zeolite, and soda lime silicate glass.
Table 2.
Physical properties of cement, natural zeolite, and glass.
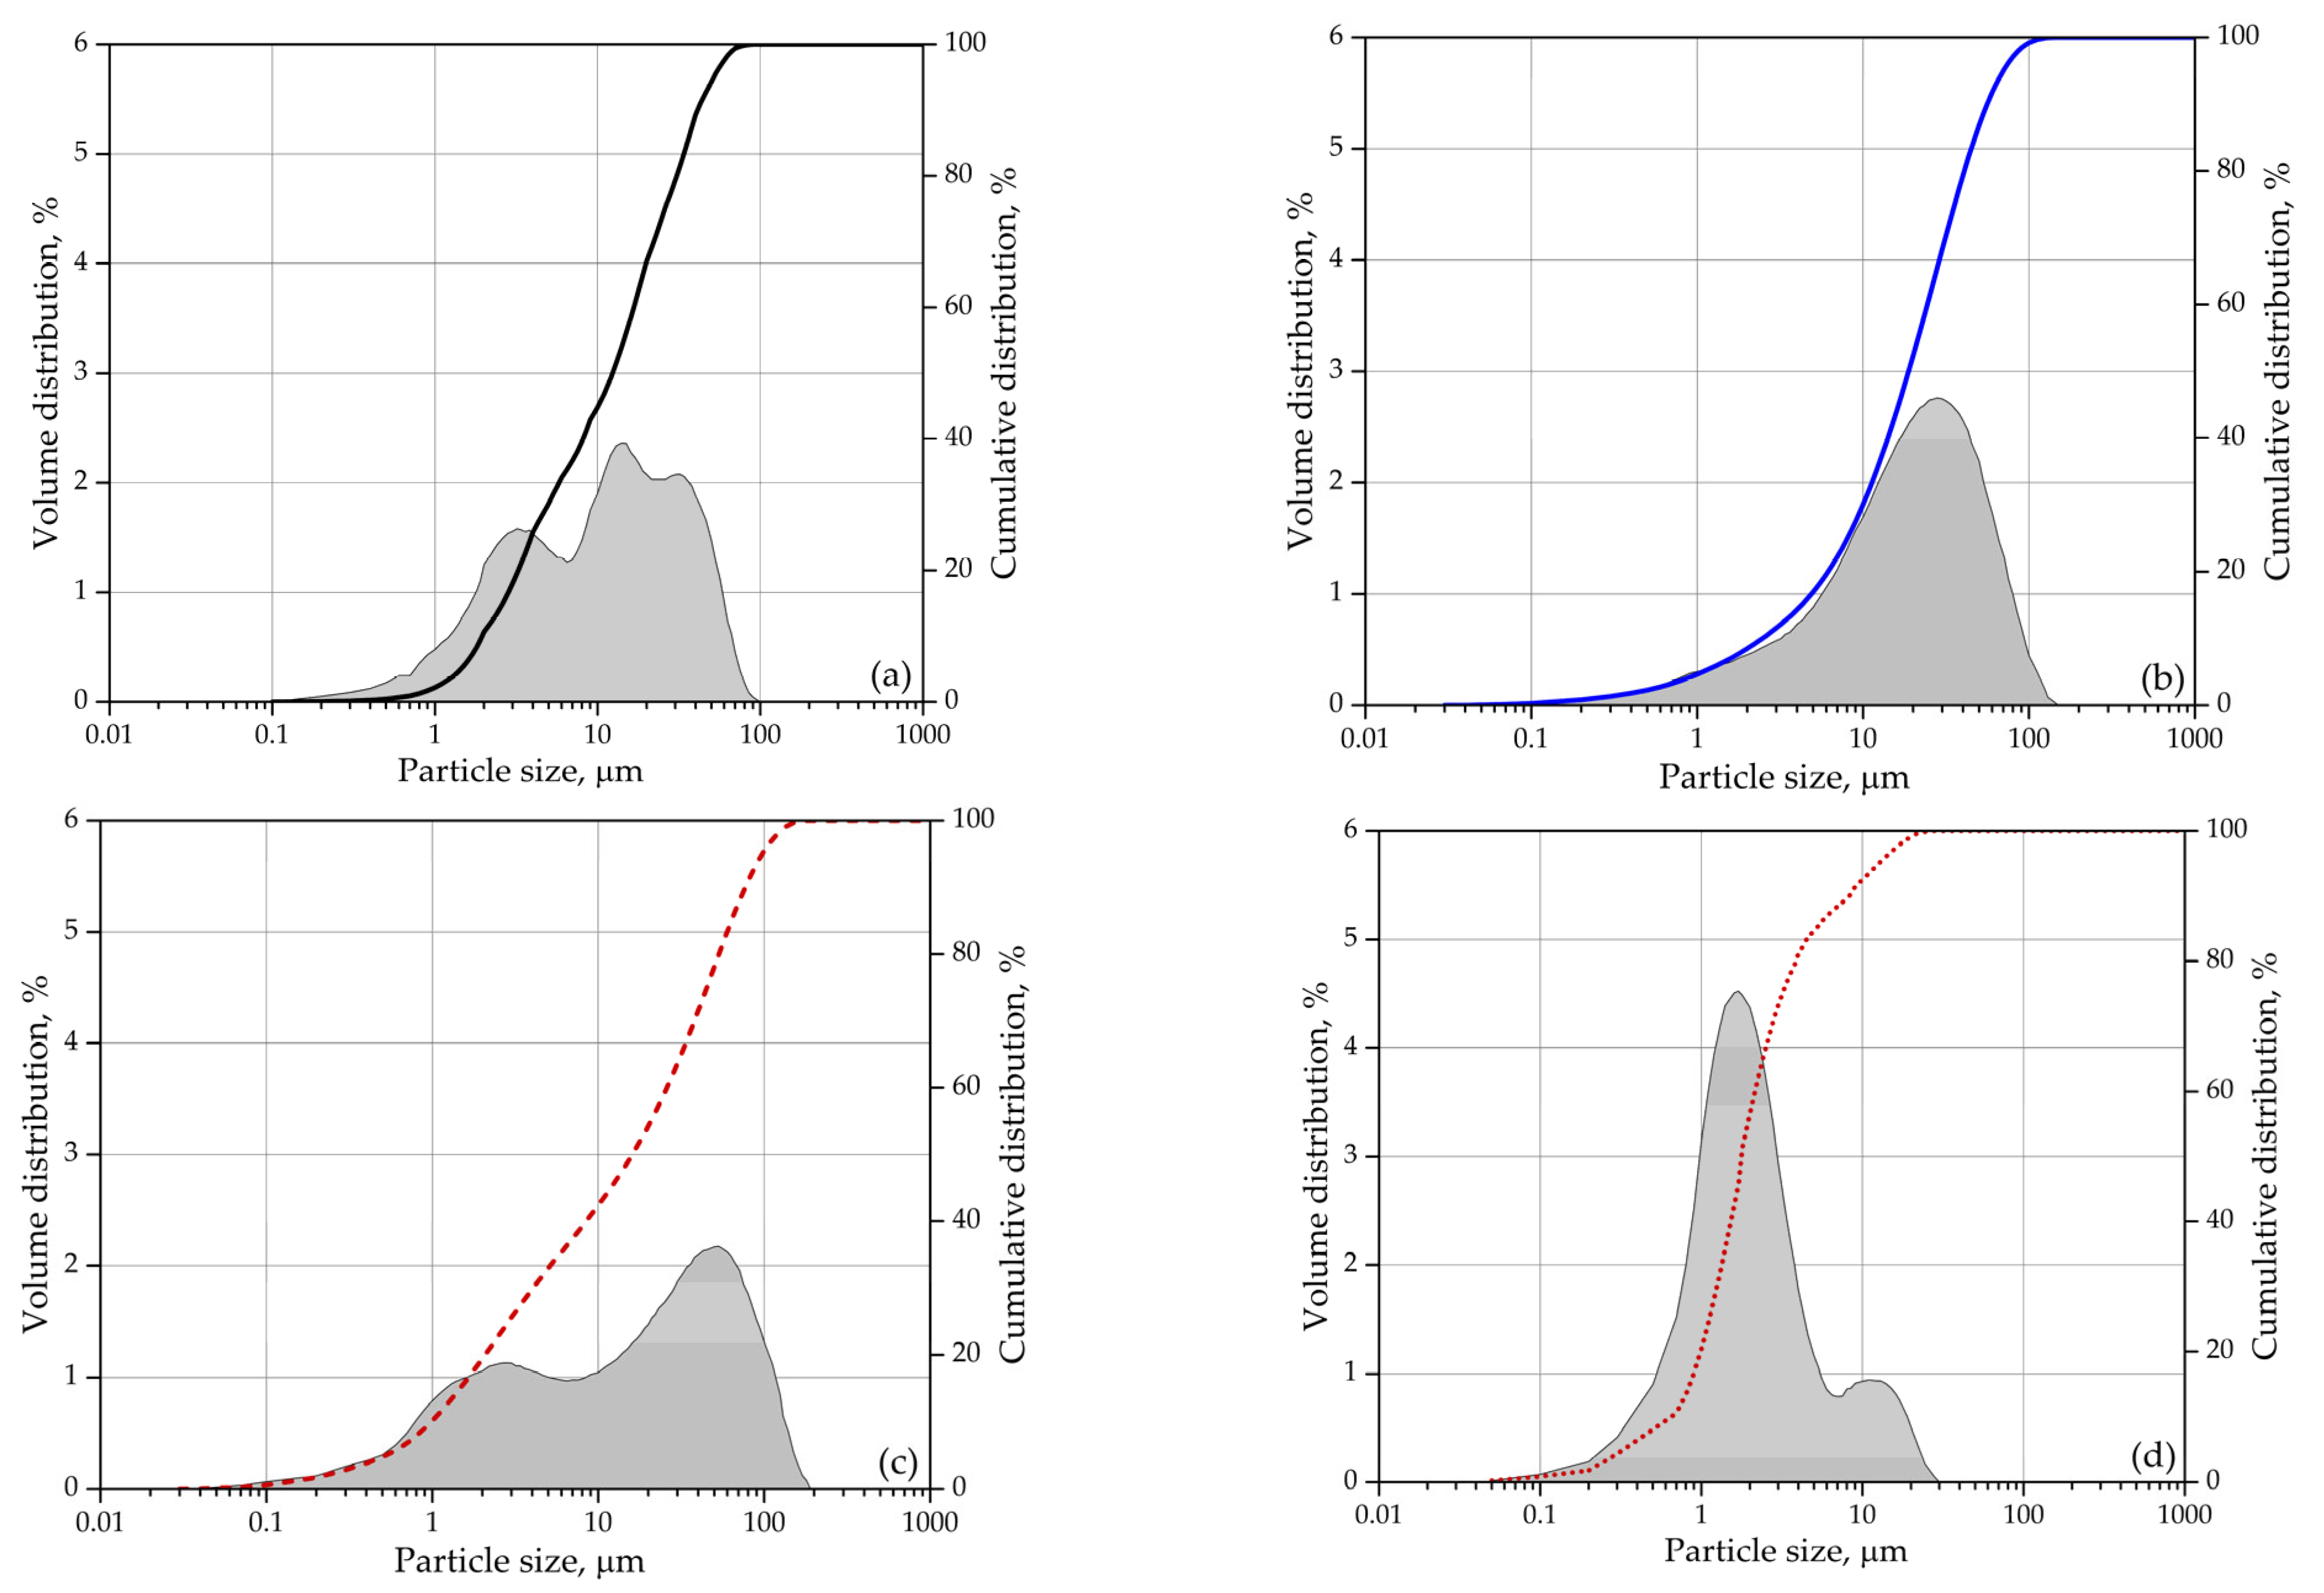
A polycarboxylate superplasticizer having the active substance content of 28%, pH of 4.4, and density of 1060 kg/m3 was added to the mix to improve the consistency of the mortars tested. Sand of fraction 0/2 mm and a fineness modulus of 2.11, and gravel of fraction 1/4 was used for the mix. The sand was dried at 110 °C before mixing. Figure 1 illustrates the cumulative particle size distribution of mineral binders.
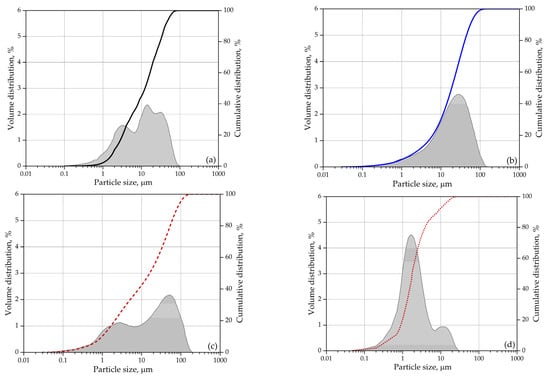
Figure 1.
Particle size: (a) cement; (b) glass powder (GA); (c) zeolite (ZA); (d) zeolite (ZF).
2.2. Concrete Test Methods
Compressive strength tests were performed according to EN 12390-3 [21]. The depth of penetration of water under pressure was evaluated according to EN 12390-8 [22]. The specimens were maintained under a pressure of 1.2 MPa for 72 h. Afterwards, the specimens were split and the depth of penetration of the waterfront was measured in ten points. Chloride migration was determined using the technique described in NT BUILD-492 [23] on the promotion of chloride migration using electric current.
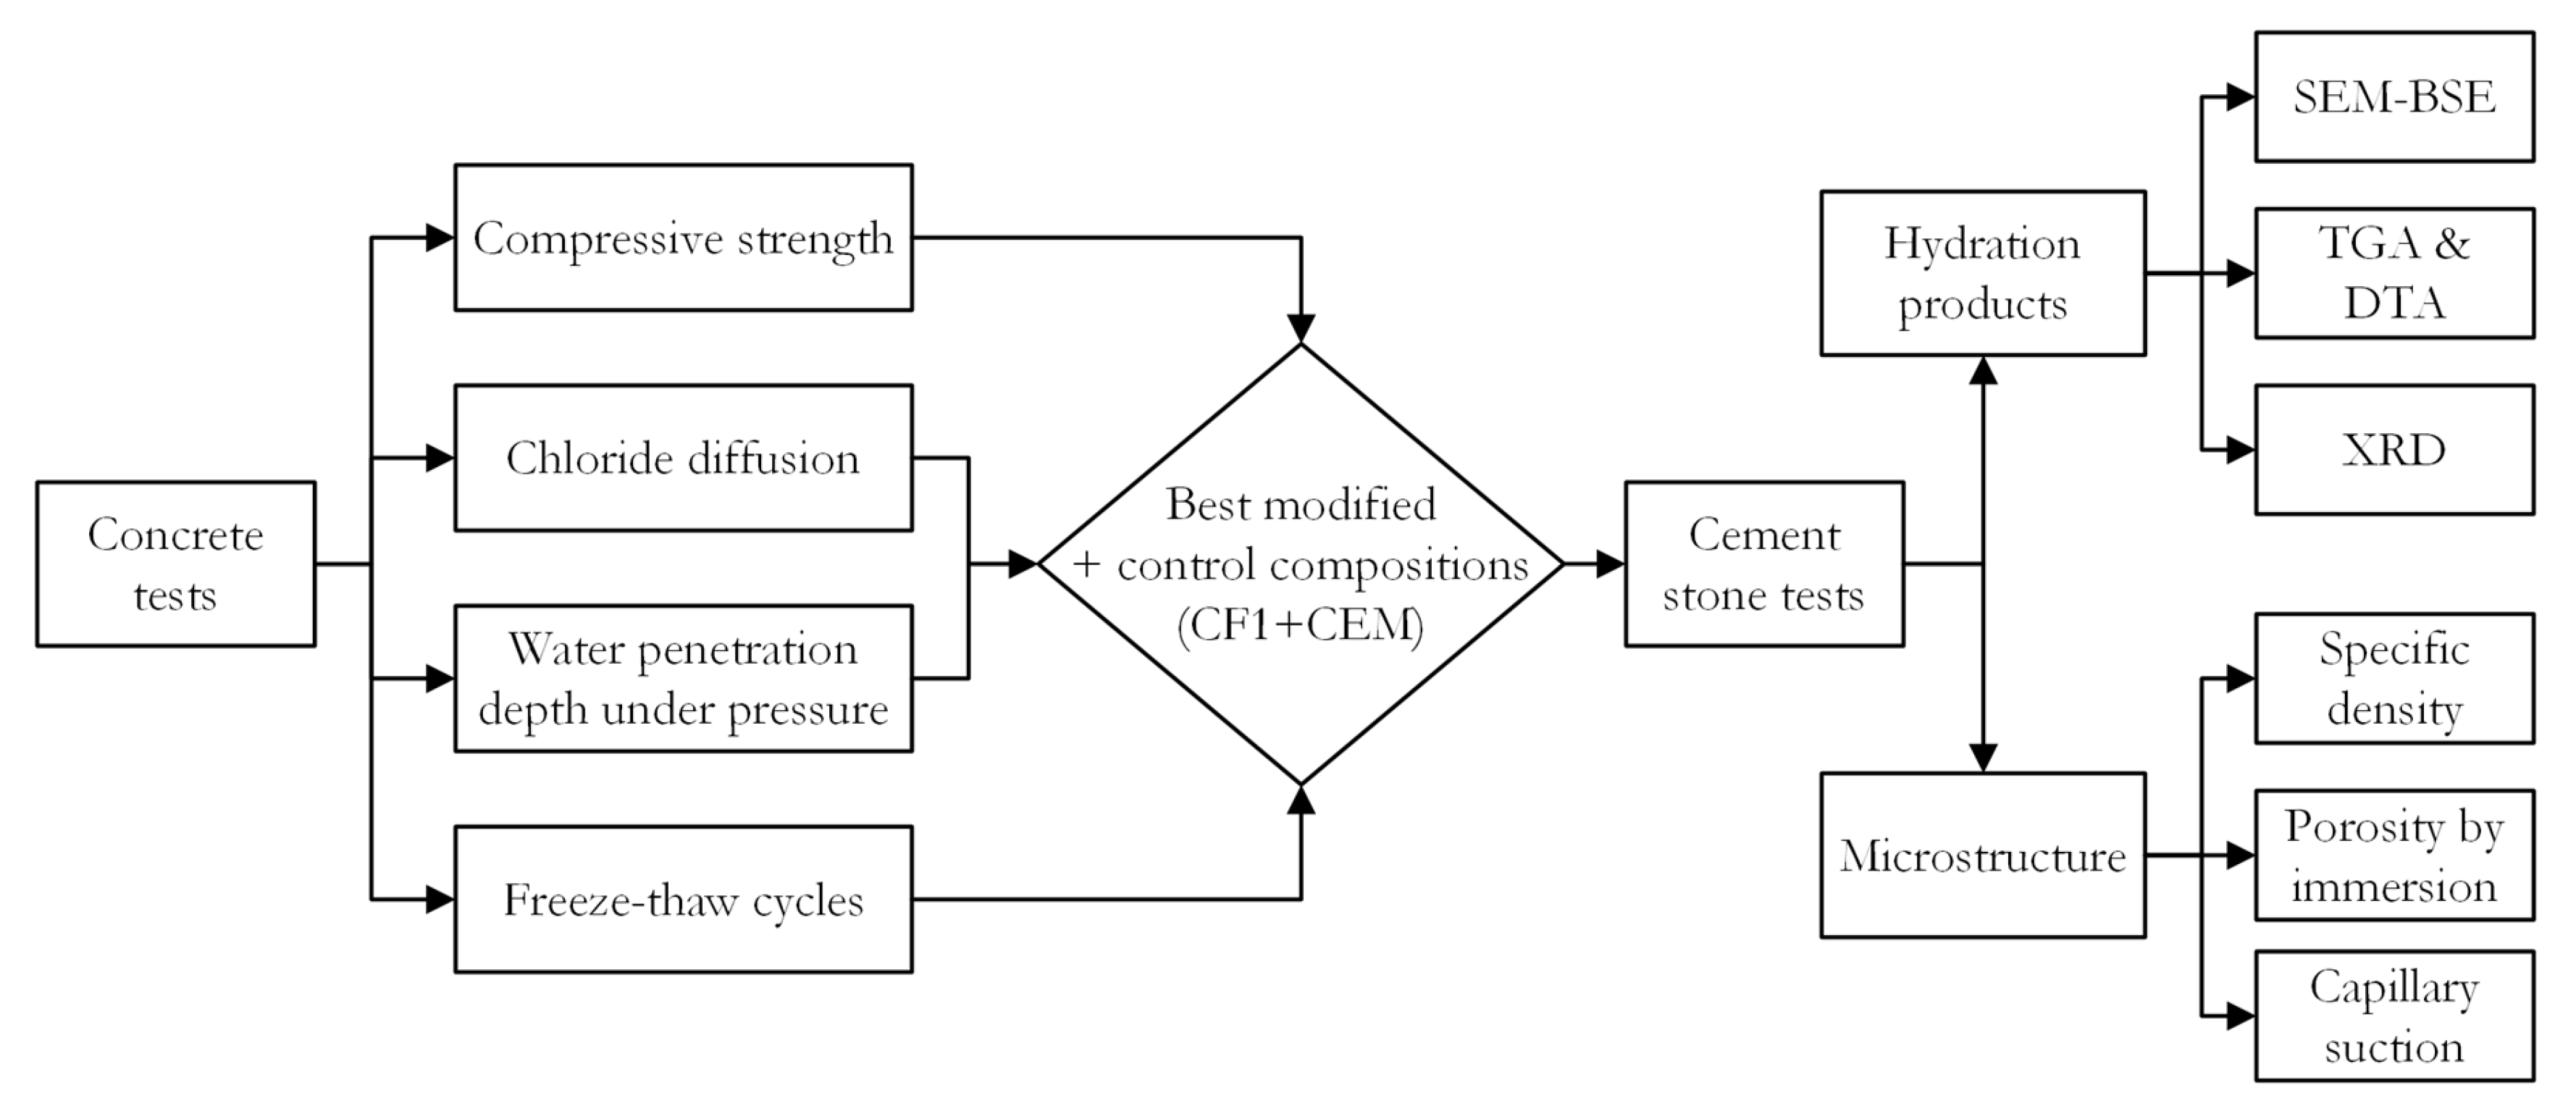
The freeze–thaw cycle tests were performed according to RILEM TC 176 [24] recommendations. Before the test, the sides of concrete specimens are insulated with a waterproofing material so that only the bottom of the specimen immersed in 3% NaCl solution is exposed. After 56 freeze–thaw cycles, the specimens are removed from the climatic chamber and placed in an ultrasonic bath for 3 min to remove the scaled material. Then, the scaled material is filtered together with the residues from the containers and dried at 110 °C for 24 h, then cooled at room temperature for 1 h, and weighed. Flowchart of the research methodology is presented in Figure 2.
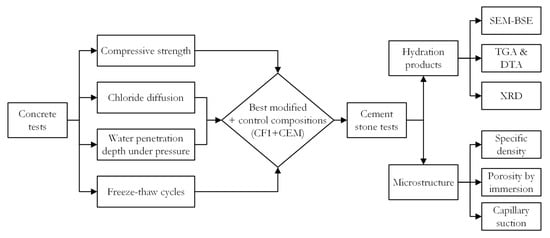
Figure 2.
Flowchart of research methodology.
2.3. Hardened Cement Paste Test Methods
The simultaneous thermobalance Linseis STA PT-1600 was used to perform thermogravimetric and differential thermal analysis. A corundum crucible containing a 50–60 mg specimen was heated in an air atmosphere at a rate of 10 °C/min until it reached a temperature of 1000 °C. The amount of calcium hydroxide formed was determined by normalizing the data based on the cement content in the mixtures, taking into account the effect of the cement “dilution” with mineral additives.
Mineral composition analysis was executed using the general-purpose X-ray diffractometer DRON-7 (Bourevestnik JSC, St. Petersburg, Russia) with high-voltage power source of 30 kV and X-ray tube with rotating Cu-Kα anode, horizontal type goniometer of 2θ at the interval of 5–60 degrees, Bragg–Brentano X-ray optics. The specimens were rotated at 0.02 degree and the detector rotated at 1 degree per minute. The X-ray diffraction results were analysed using the Crystallographica Search-Match programme v2.1 (Oxford Cryosystems, West Oxfordshire, UK) with the International Centre for Diffraction Data’s PDF-4+ (2019).
To conduct SEM-BSE microscopical analysis, the specimens were cut and embedded in epoxy resin blocks. The cut surface was subsequently polished. To prevent electrostatic charging, the polished resin-mounted cross-sections were coated with carbon. The microstructure analyses were performed using a Quanta 250 instrument equipped with an X-ray detector X-Max, an INCA X-stream digital pulse processor, and INCA Energy EDS software developed by Oxford Instruments (SEM-EDS) (https://nano.oxinst.com/products/eds/ accessed on 1 October 2023). Mineral formulas were determined using Gabbrosoft Mineralogical Spreadsheets. Images were captured using a backscattered electron detector (SEM BSE).
The open porosity of the cement pastes was determined using a modified version of the method for determining the dry bulk density of hardened mortars prescribed by EN 1015-10. After the scheduled curing period, wet specimens, with any excess water removed, were weighed (M1) in air. Then, the specimens, without any air bubbles on the sides, were weighed in water (M2). Subsequently, the weighted specimens were dried in a drying oven at a 60 ± 5 °C until a constant mass (M3) was reached (the difference in weight after 24 h of drying does not exceed 0.2% of the dry specimen mass). The open porosity (%) was calculated using the following equation:
The capillary suction test procedure was as follows: 5 mm-high spacers were placed on the bottom of the test container to have the test surface of the specimens elevated. The container was filled with water up to 10 ± 1 mm, making sure not to wet the top of the specimen. The test containers were closed and left for 2 days at 20 ± 2 °C temperature. After the capillary suction period, the specimen mass increase was measured at 0.25, 0.5, 1, 2, 4, 24, and 48 h.
The specific density of the hardened cement paste was determined by pycnometer. The specimen was dried to a constant weight and crushed to powder (≤80 µm) in a crusher. Approximately 15 g (m1) of the sieved powder was weighed, poured into a pycnometer, and filled with distilled water to about half the volume of the pycnometer, then heated on an electric stove. After heating the specimen for 10–15 min after boiling, it was cooled to room temperature. Distilled water was added to the pycnometer up to the line and weighed (m2). After weighing, the pycnometer was washed clean, distilled water was added up to the line, and the pycnometer was wiped and weighed again (m3). The specific density (g/cm3) was calculated from the equation:
2.4. Mix Proportioning and Specimen Preparation
Concrete mixtures (see Table 3) were mixed from dry raw materials in a forced action mixer complying with EN 196-1 [25] requirements. The aggregates (sand and gravel) were weighed with an accuracy of ±1 g on a laboratory scale and poured into the mixer. Then, half of the water required for the mix was weighed and added to the mixer bowl. The aggregates and water were then mixed for 2 min and then the mixer was stopped for a break of 2 min. The cement mixed with mineral additives, if any, was then added and mixed for 30 s. Then, the remaining water with dissolved superplasticiser was added to the mixer bowl during 30 s without stopping the mixer and mixed for 2 min. The total mixing time should not exceed 7 min.
Table 3.
Compositions of concrete (for the mixture volume of 1 m3).
Watertight moulds made of stainless steel were used to make the specimens. The dimensions of the moulded concrete cubes differed depending on the test to be conducted:
- -
- 100 × 100 × 50 mm specimens were moulded for freeze–thaw cycle tests;
- -
- 100 × 100 × 100 mm specimens were moulded for compressive strength tests;
- -
- 150 × 150 × 150 mm specimens were moulded for the depth of water penetration tests.
Watertight and non-absorbent plastic cylindrical moulds with a diameter of 100 mm and a height of 180 mm were used to determine the chloride migration coefficient. Three specimens were cut out of the moulded cylinders for the test. The moulds were filled in two layers by compacting the mixtures on a vibrating table. The specimens were covered with a waterproof film and kept in the moulds at an ambient temperature of 20 ± 2 °C for 1 day. Afterwards, the specimens were de-moulded and further cured in water at a similar temperature.
Cement pastes were mixed using the same proportions of mineral substances with the constant W/C ratio 0.4. Truncated conical moulds of 80 mL capacity were used. Watertight and non-absorbent moulds were made of polyethylene terephthalate. The moulds were filled with one layer of cement paste, which was compacted on the vibrating table. Cement paste specimens were cured in the same manner as concrete specimens.
3. Results and Discussion
The durability or resistance of concrete to aggressive environments depends essentially on two factors: the microstructure and the mineral composition of the cementitious matrix. Microstructure parameters, such as the type, number, volume, shape, and distribution of pores, determine how much of a detrimental substance can reach the concrete matrix from outside, i.e., water, which crystallises into ice at low temperatures, expands and destroys the concrete from inside, and substances dissolved in water (chlorides, sulphates, etc.), which, together with water, enter into the structure of the concrete and form new compounds with the minerals of the cement matrix.
3.1. Chloride Diffusion
Chloride diffusion is one of the most important parameters that defines the durability of reinforced concrete, as it causes the depassivation of reinforcing bars and initiates the corrosion. At the start of the corrosion process, the concrete starts cracking, followed by the scaling of the protective layer of concrete. After the reinforcing bars become exposed, the corrosion process and the destruction of the concrete structure accelerate. The microstructure of concrete, which determines the permeability parameters, and the mineral composition of the cement matrix, which determines the chemical bonding capacity of chlorides, can mitigate the negative effect of chlorides. The obtained results are illustrated in Figure 3 and the classification of chloride diffusion resistance proposed in [26] is used for the evaluation of results (see Table 4). Detailed studies of this classifier show that it is a reasonable indicator of the chloride penetration resistance of concrete, having been able to distinguish concrete produced with different types of aggregate and paste compositions, under distinct long-term exposure conditions [27].
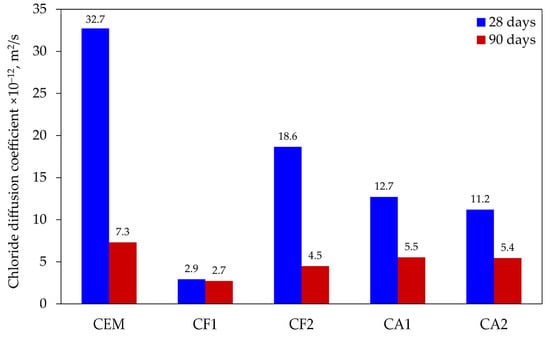
Figure 3.
Results of chloride diffusion testing.
Table 4.
Criteria for the evaluation of chloride diffusion resistance.
The test results after 28 days of curing showed that control specimens had the lowest resistance to chloride diffusion (32.7 × 10⁻¹² m2/s), which, according to the classification applied, was evaluated as “low”. The results of the specimens modified with the mix of mineral additives ranged between 11.2 × 10⁻¹² and 18.6 × 10⁻¹² m2/s and, according to the classification applied, their resistance was evaluated as “moderate” for specimens CA1 and CA2, and “low” for specimen CF2. The highest resistance to chloride diffusion (2.9 × 10⁻¹² m2/s) was found in specimen CF1 and it can be evaluated as “very high”. The lowest chloride diffusion was observed in the specimens where 25% of cement was substituted by the zeolite with the average particle size of 3.6 µm and the ground glass (10%) mixture showed the best resistance to chloride diffusion. Zeolite was added in the form of water suspension.
After 90 days of curing, the chloride diffusion coefficient decreased the most (from 32.7 × 10⁻¹² to 7.3 × 10⁻¹² m2/s) in control specimens; however, it was still the highest in comparison with the modified specimens, even though it should be considered as “high” according to the classification. The results of modified specimens showed that a longer hydration time had a positive effect on the chloride diffusion coefficient, with results ranging from 4.5 × 10⁻¹² to 5.5 × 10⁻¹² m2/s and changing from “very high” to “high”, respectively. The lowest chloride diffusion coefficient was found in the same specimen, which had a coefficient of 2.9 × 10⁻¹² m2/s after 28 days of curing and decreased to 2.7 × 10⁻¹² m2/s at 90 days, very close to the evaluation “excellent”.
3.2. Freeze-Thaw Cycle Testing
All outdoor concrete structures are exposed to freeze–thaw cycles, so resistance to frost damage is essential. Some horizontal structures are exposed to combined freeze–thaw attack, i.e., they are sprayed with de-icing salts, which, together with melting water, ingress the concrete structure and destroy it both physically and chemically.
Test results (see Figure 4) showed that after 28 days of curing all modified specimens, except for specimen CF1, had lower freeze–thaw resistance. Their mass loss ranged from 2.36 to 3.26 kg/m2. Throughout the testing cycle, the control specimens lost 2.04 kg/m2 on average. The lowest loss in mass, 1.59 kg/m2 on average, was observed in the specimens of mix composition CF1. Indeed, all the specimens had a high mass loss rate compared to the data published by other authors; however, it should be noted that none of the mixtures contained an air entraining admixture, which could reduce the rate of air entrainment by promoting the formation of closed pores.
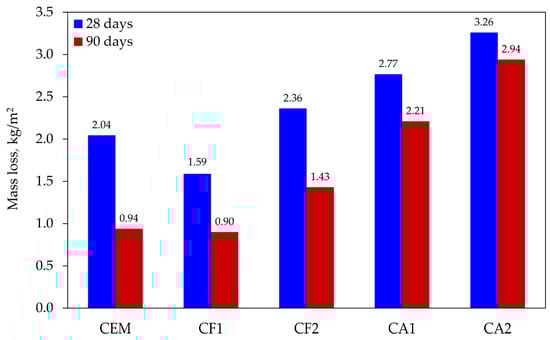
Figure 4.
Loss in specimen mass after 56 freeze–thaw cycles.
The specimens cured for a longer time of 90 days had a better resistance to freeze–thaw damage and, consequently, a lower mass loss from 9.8% to 54.0%. The control specimens had an average mass loss of 0.94 kg/m2 in this test, while CF1 specimens showed a slightly lower weight loss, but the difference between the results was insignificant at only 4.3%.
3.3. Water Penetration Depth under Pressure
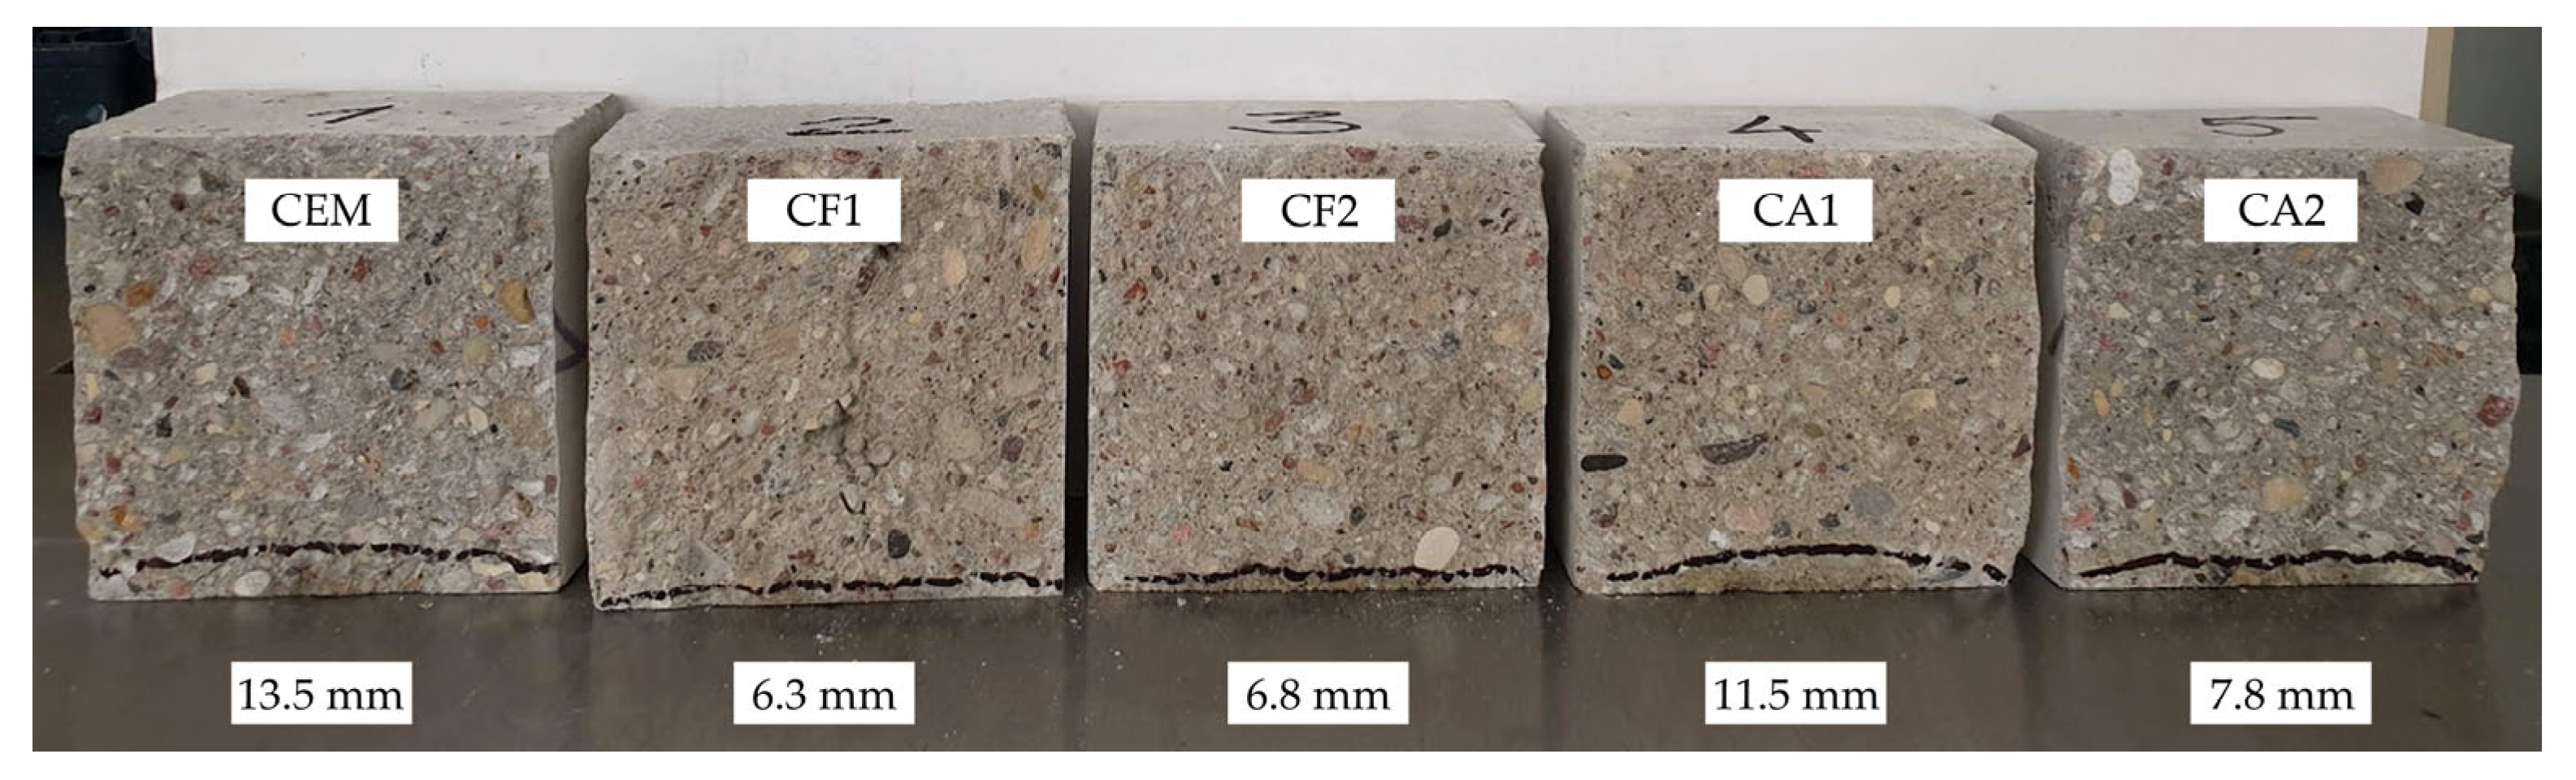
Figure 5 illustrates that after 28 days of curing the depth of water penetration in all modified specimens at the pressure of 1.2 MPa was lower than the penetration of 13.5 mm in control specimens. The difference between the results of control specimens and other specimens ranged from 2.0 to 6.7 mm and the difference between the control specimens and the best performing specimens was as much as 7.2 mm or 114%.
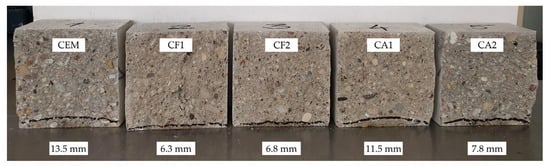
Figure 5.
Results of water penetration depth under pressure after 28 days.
The lowest water penetration was observed in specimen CF1 where cement content was reduced by 25% by replacing it with a mixture made of 10% ground glass and 15% zeolite (ZF) with an average particle size of 3.6 µm. Zeolite was added in the form of a water suspension. The specimens of this composition also performed the best in other tests.
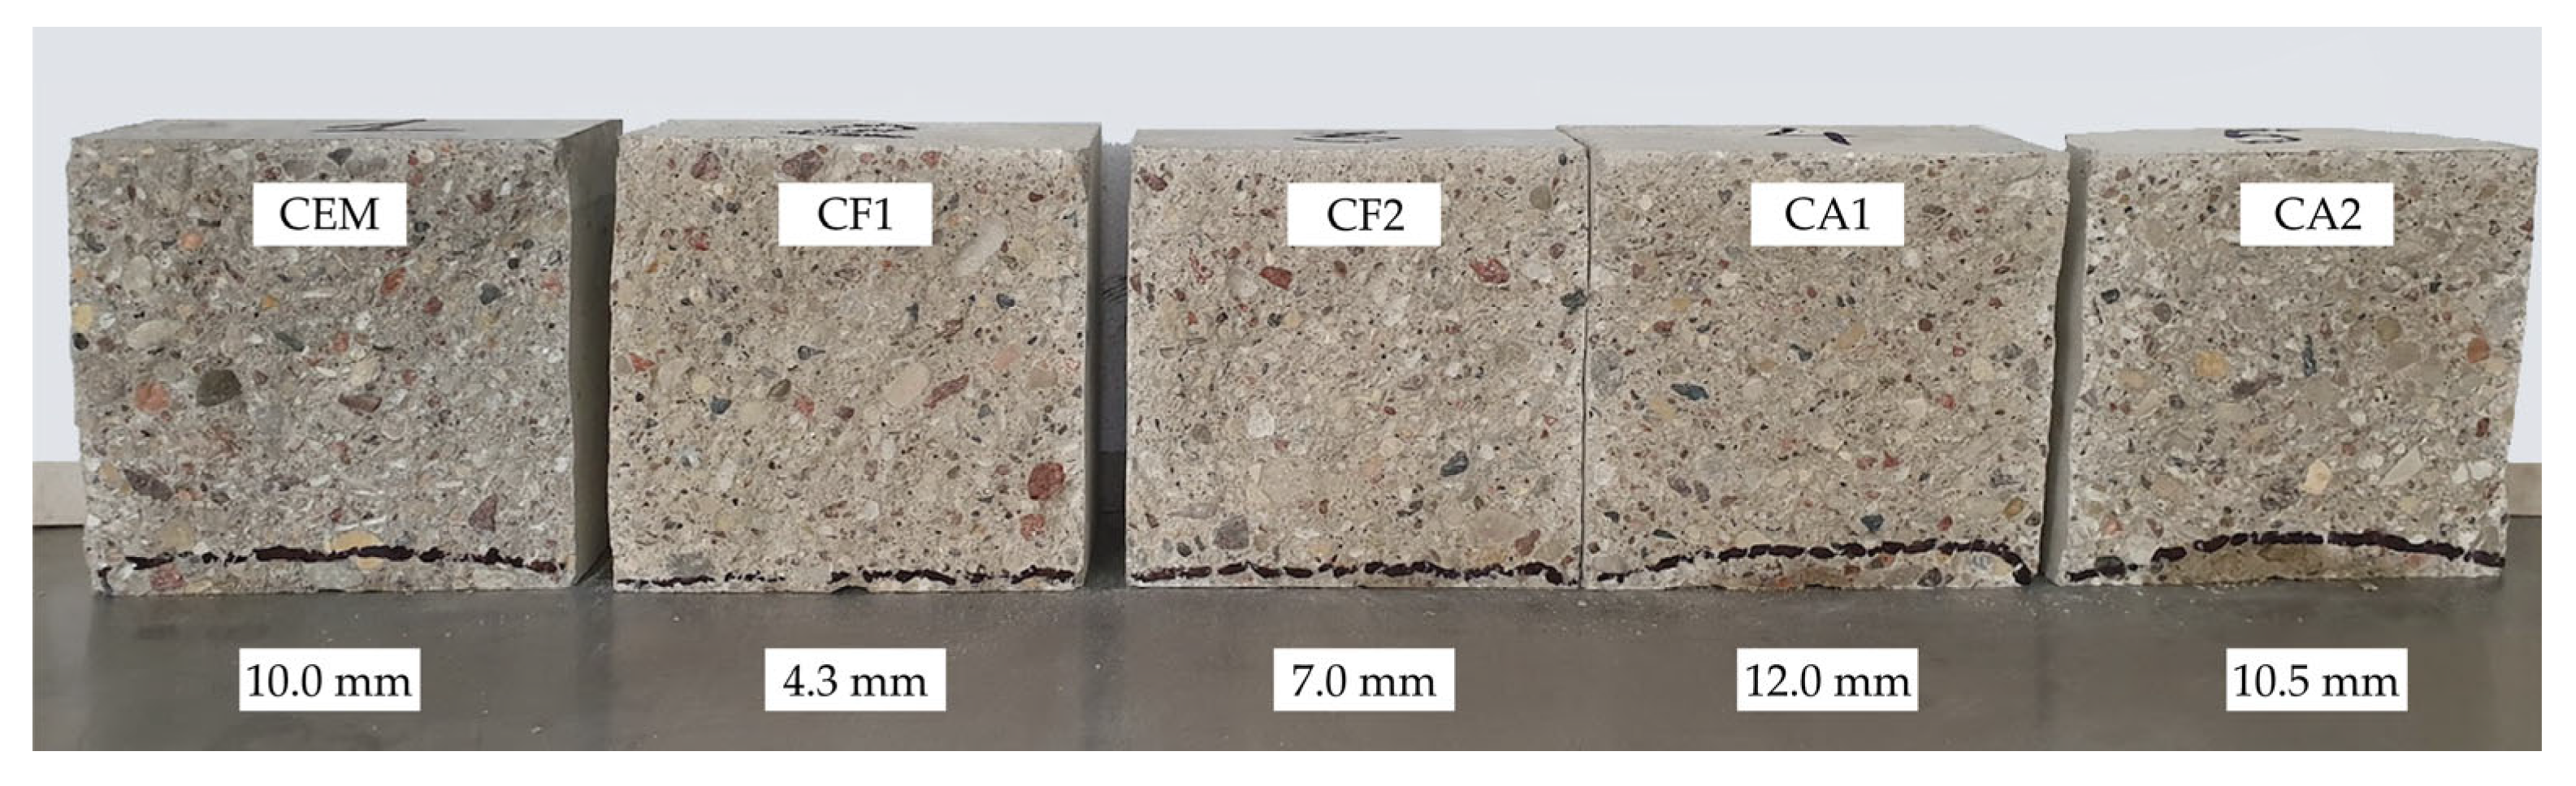
The test results showed that a mixture of mineral additives could significantly reduce water penetration and subsequently reduce the detrimental effect of freeze–thaw cycles. At 90 days (see Figure 6), the best results were recorded in the specimens of the same composition and, although the difference in absolute numbers between the values of these specimens and control specimens reduced to 5.7 mm, the difference in per cent increased to 133%. Strange as it may seem, the results of other composition specimens deteriorated and, in comparison with control specimens, only specimen CF1 showed better water penetration values.
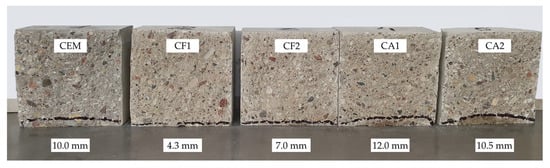
Figure 6.
Results of water penetration depth under pressure after 90 days.
3.4. Compressive Strength
Compressive strength testing was the last in the series of tests. Tests of cement mortars showed that the resistance of modified compositions only complied with the activity index prescribed by EN 450-1 in one case; therefore, it was very important to find out the relationship between mineral additives and strength.
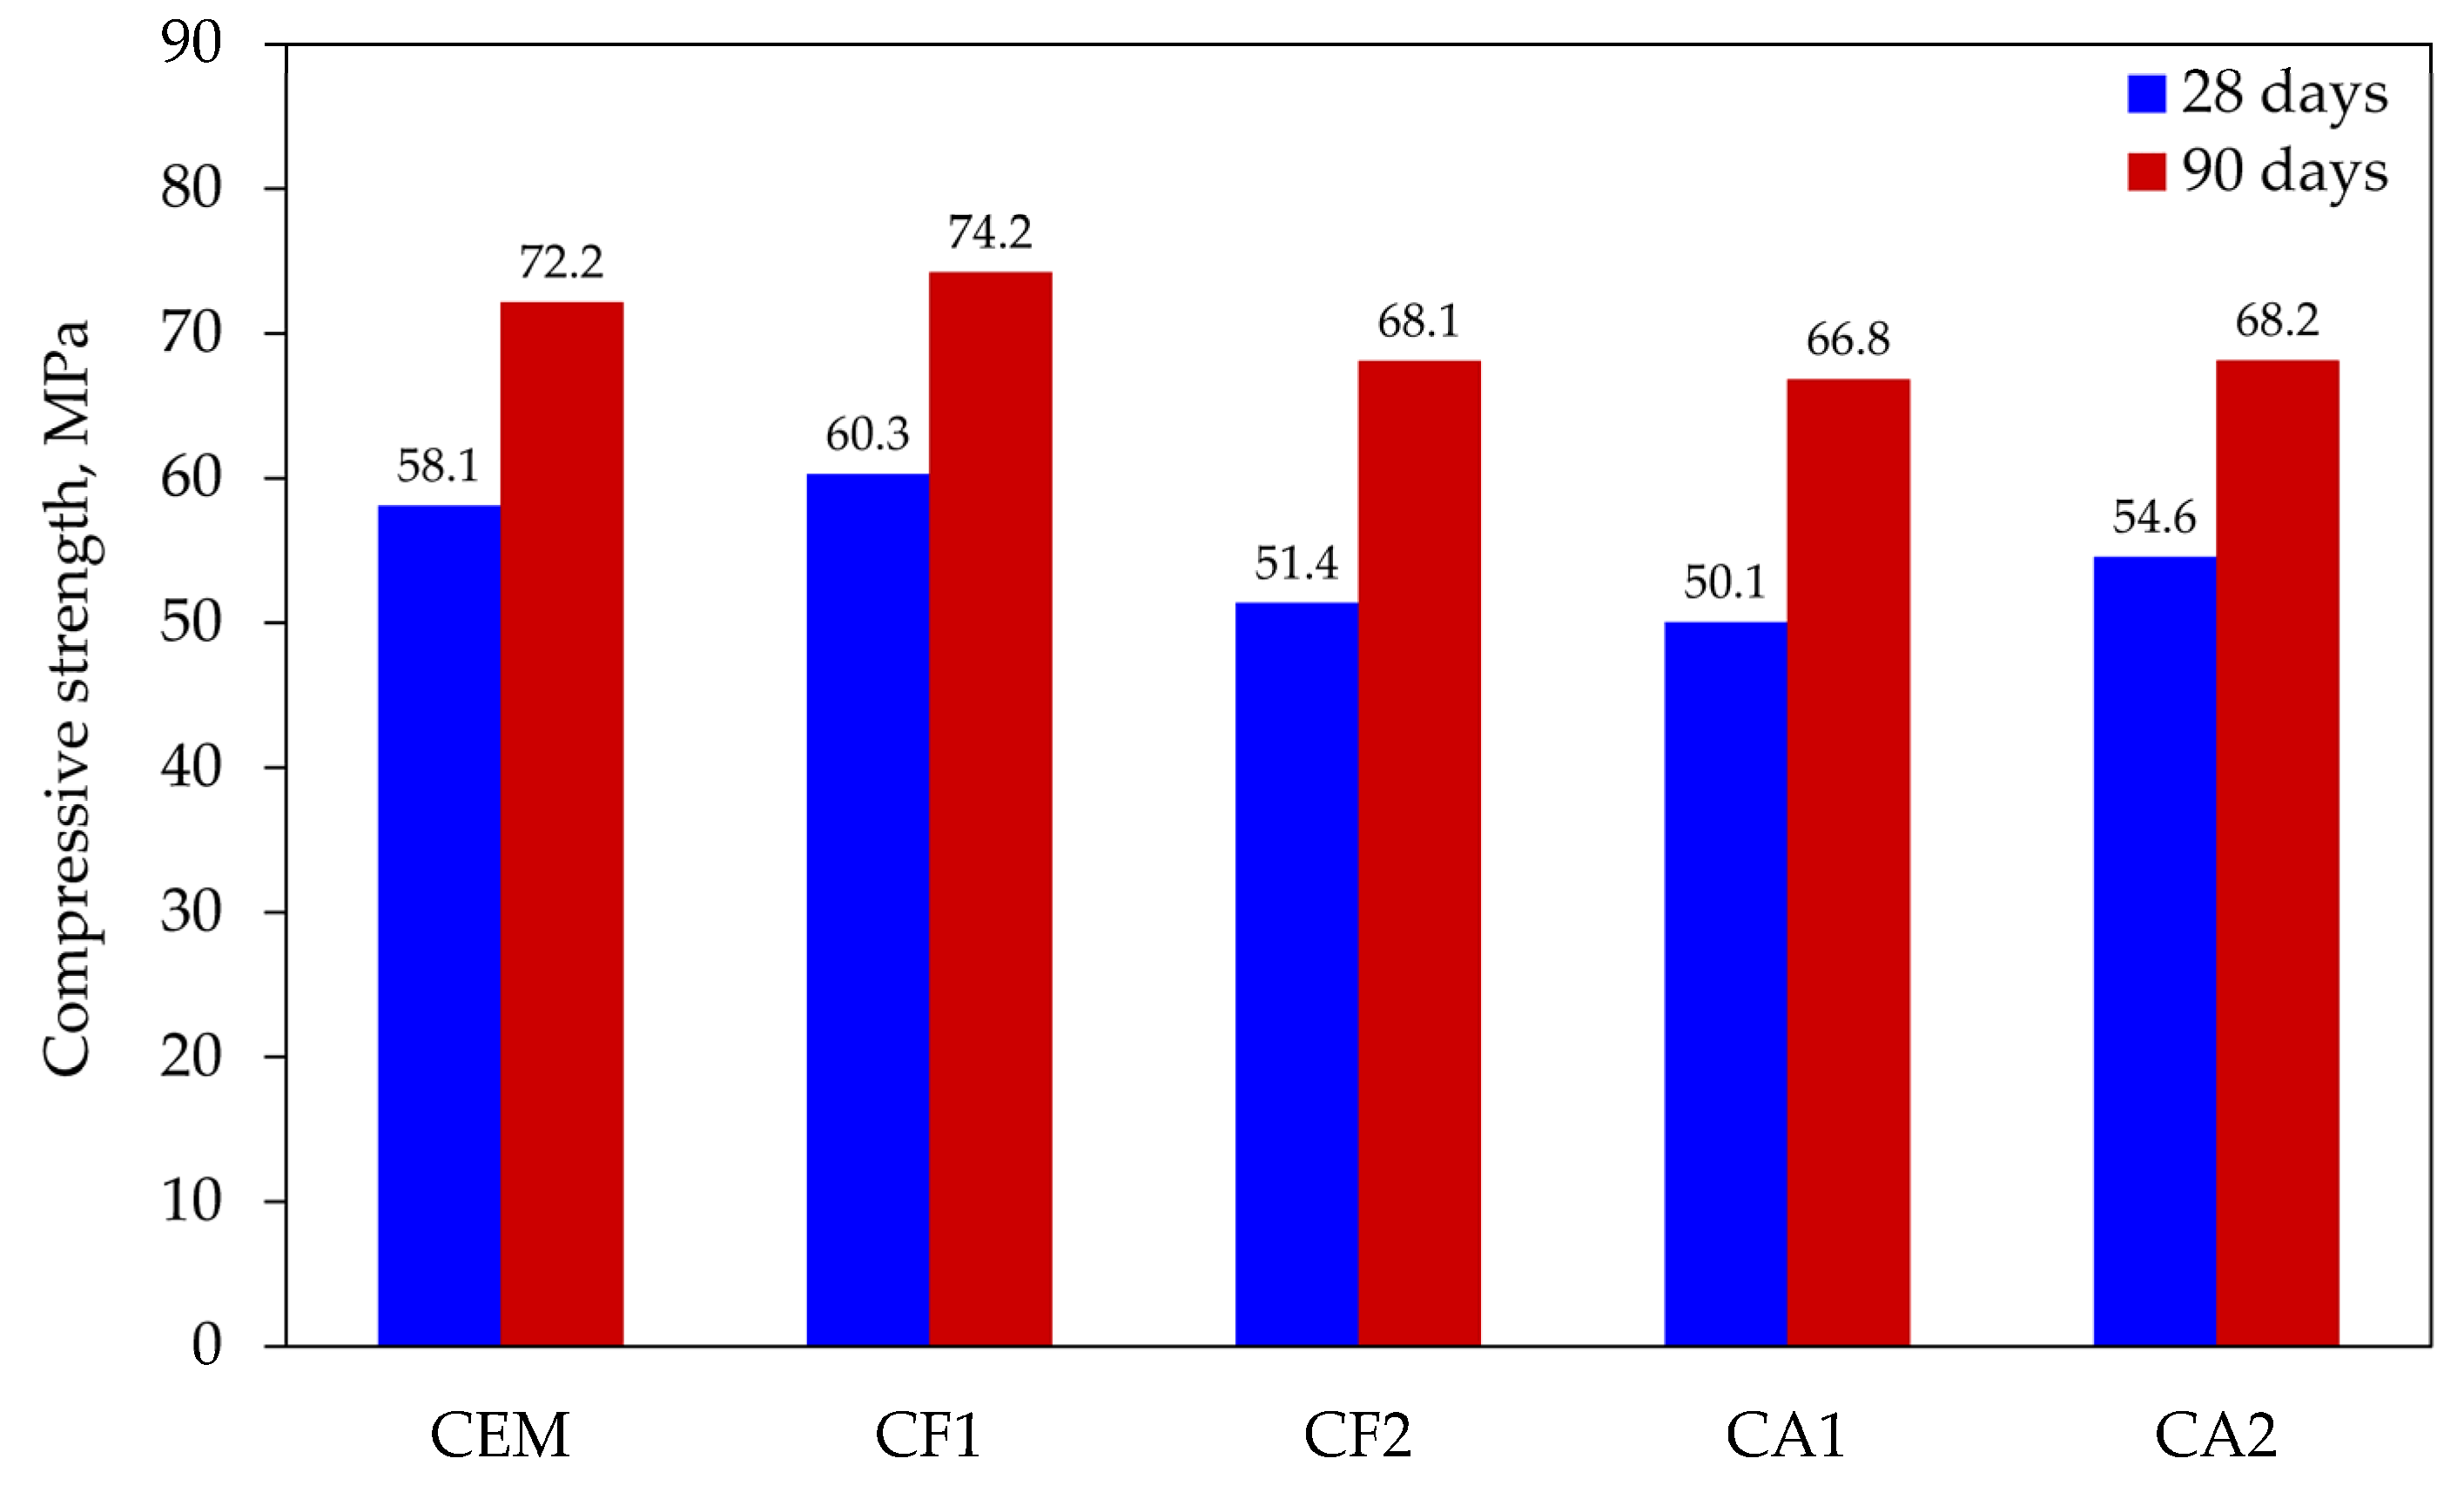
The compressive strength tests at 28 and 90 days (see Figure 7) showed that only one composition CF1 exceeded the least of the values obtained with control specimens. The results of other compositions were lower: from 6 to 14 MPa at 28 days and from 6 to 7 MPa at 90 days. In summary, the effect of the mix of mineral additives makes it possible to compensate almost completely for the effect of cement dilution at 25% and to obtain the same compressive strength results after 90 days of curing.

Figure 7.
Results of compressive strength tests.
3.5. Porosity Testing
The values in Table 5 show that porosity tests did not reveal any significant differences between the values of control specimens and the best values obtained with specimens CF1 that could explain why better durability results are obtained. The assessment of the results recorded at 28 days revealed that control specimens had higher density, which is not surprising because 25% of cement was replaced with materials of lower density. The main porosity values differed insignificantly. The results of capillary suction tests showed a greater difference. The capillary suction values in units of volume were 10% lower in control specimens than in modified specimens.
Table 5.
Main porosity values after 28 days.
The values obtained at 90 days of curing (see Table 6) show that densities of both compositions increased approx. 3%, the total and open porosities reduced but the same difference remained, and the most significant difference was the change in closed porosity. In both cases, it became lower; however, the volume of closed pores in control specimens changed approx. 3%, whereas in modified specimens the change was approx. 25%. Closed porosity is an important parameter for the assessment of the freeze–thaw resistance potential of cement-based concretes. It could be assumed that modified specimens should have a significantly higher resistance, but the tests did not confirm this assumption. The control specimens showed a more significant decrease in mass loss after 90 days of curing than the modified specimens, indicating that closed porosity results alone do not provide a higher resistance to freeze–thaw cycles. However, the testing methodology used did not make it possible to determine the pore size distribution, the volume and the size of closed pores, and volume and the spacing between pores and apparently for this reason there is no good correlation between the two results.
Table 6.
Main porosity values after 90 days.
The main point to note is the results of capillary suction. On the one hand, the trend changed, i.e., after 90 days of curing, the capillary suction of modified specimens became lower than that of control specimens. On the other hand, while control specimens showed a decrease of about 20% in capillary suction, the same indicator decreased 46% in modified specimens and these results also did not correlate with the freeze–thaw cycle test results, although capillary suction should be an important indicator from the point of view of the frost resistance test methodology. The specimens are soaked in NaCl solution for 7 days before the start of the tests so that they are saturated with the solution, which enhances the destructive effect of the cold; consequently, we should see a significant improvement in the results when comparing the values of the specimens cured for 28 and 90 days. These results only confirm the observations of other authors that it is often very difficult to establish a direct correlation between porosity and conductivity parameters [28] and that the transport properties of cement-based composites depend not only on capillary porosity but also on other pore parameters, such as the connectivity and tortuosity of capillary pores [29].
3.6. X-ray Diffraction Analysis
At 28 days, X-ray diffraction patterns (see Figure 8) did not show any significant differences between mineral compositions of the specimens. However, a few peaks specific to tricalcium silicate observed in several places in the pattern of control specimens suggest that the degree of hydration was higher in modified specimens as no cement clinker was detected in their patterns. The absence of ettringite in the specimens suggests that it had recrystallised into calcium aluminate sulphates (AFt or AFm). The peaks of calcium hydroxide in specimen CF1 were lower than in the control specimen CEM and that confirms the presence of pozzolanic reactions in the mixture of mineral additives. No minerals containing Na or Al were detected in the modified specimen. Apparently, these minerals had an amorphous structure and could not be detected by the method applied.
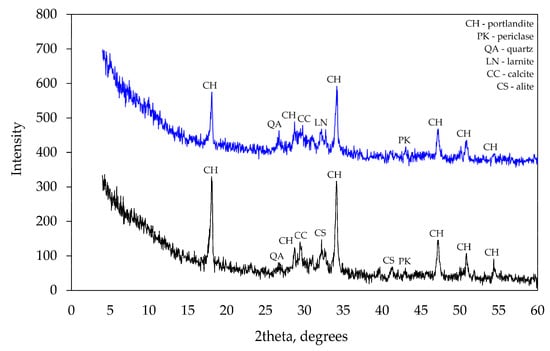
Figure 8.
XRD analysis after 28 curing days.
At 90 days, the same tests (see Figure 9) showed more significant differences in mineral composition. As previously reported [30], the modified specimen did not contain any ettringite, while two corner peaks characteristic of ettringite were observed in the control specimen.
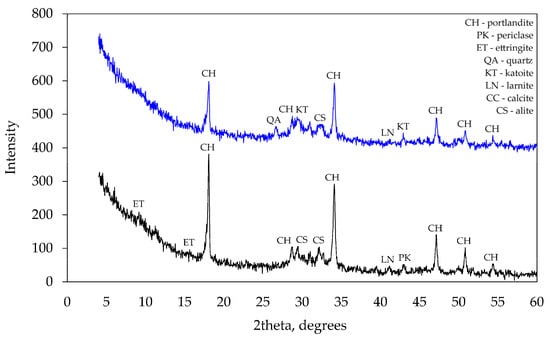
Figure 9.
XRD analysis after 90 days of curing.
The main difference was the presence of hydrogarnets (katoite) in the modified specimen. The presence of ettringite in the control specimen was also confirmed by thermogravimetric tests. After 90 days of curing at 180 °C, the control specimen showed the endothermic effect characteristic of ettringite disintegration. Such an effect was not observed in the modified specimen.
The obvious difference between mineral compositions is the presence of hydrogarnets (katoite) detected in the modified specimen. This mineral indicates the combined effect of the mixture of additives on hydration products because katoite was not detected in the previous test with the specimens containing the zeolite alone. Presumably, the introduction of Na into the system creates the conditions for the formation of katoite.
The effect of pozzolanic materials is two-fold in this regard. Firstly, they elevate the Al content, and simultaneously, they lower the Ca/Si ratio, thus promoting the uptake of Al by C-S-H. As the Al content rises, the crystallinity of C-A-S-H gels diminishes, leading to an increased presence of chemically bound water within the gels. [31]. The same was confirmed by other authors [32], whose results show that the amount of bound water, and consequently the amount of hydrate increases with the addition of aluminium.
The effect of aluminium on C-S-H structure and on hydration processes is not clear yet. The comparative analysis of available datasets providing the experimental measuring of Al uptake in C-S-H reveals a substantial dependence of Al uptake on the concentration of aqueous Al. Furthermore, when Al concentrations are elevated, the formation of katoite (3CaO·Al2O3·6H2O) and stratlingite (2CaO·Al2O3·SiO2·8H2O) [33] reduce Al concentration in the solution, consequently impacting the Al uptake in C-S-H. According to the published results, when the concentration of dissolved Al is below 0.019 mmol/l, the uptake of Al alone into the C-S-H structure is observed; at a concentration between 0.019 and 0.028 mmol/L, katoite is found in the system in addition to C-A-S-H; at an Al concentration above 0.028 mmol/L, stratlingite is observed in the matrix structure [34].
3.7. TGA and DTA Analysis
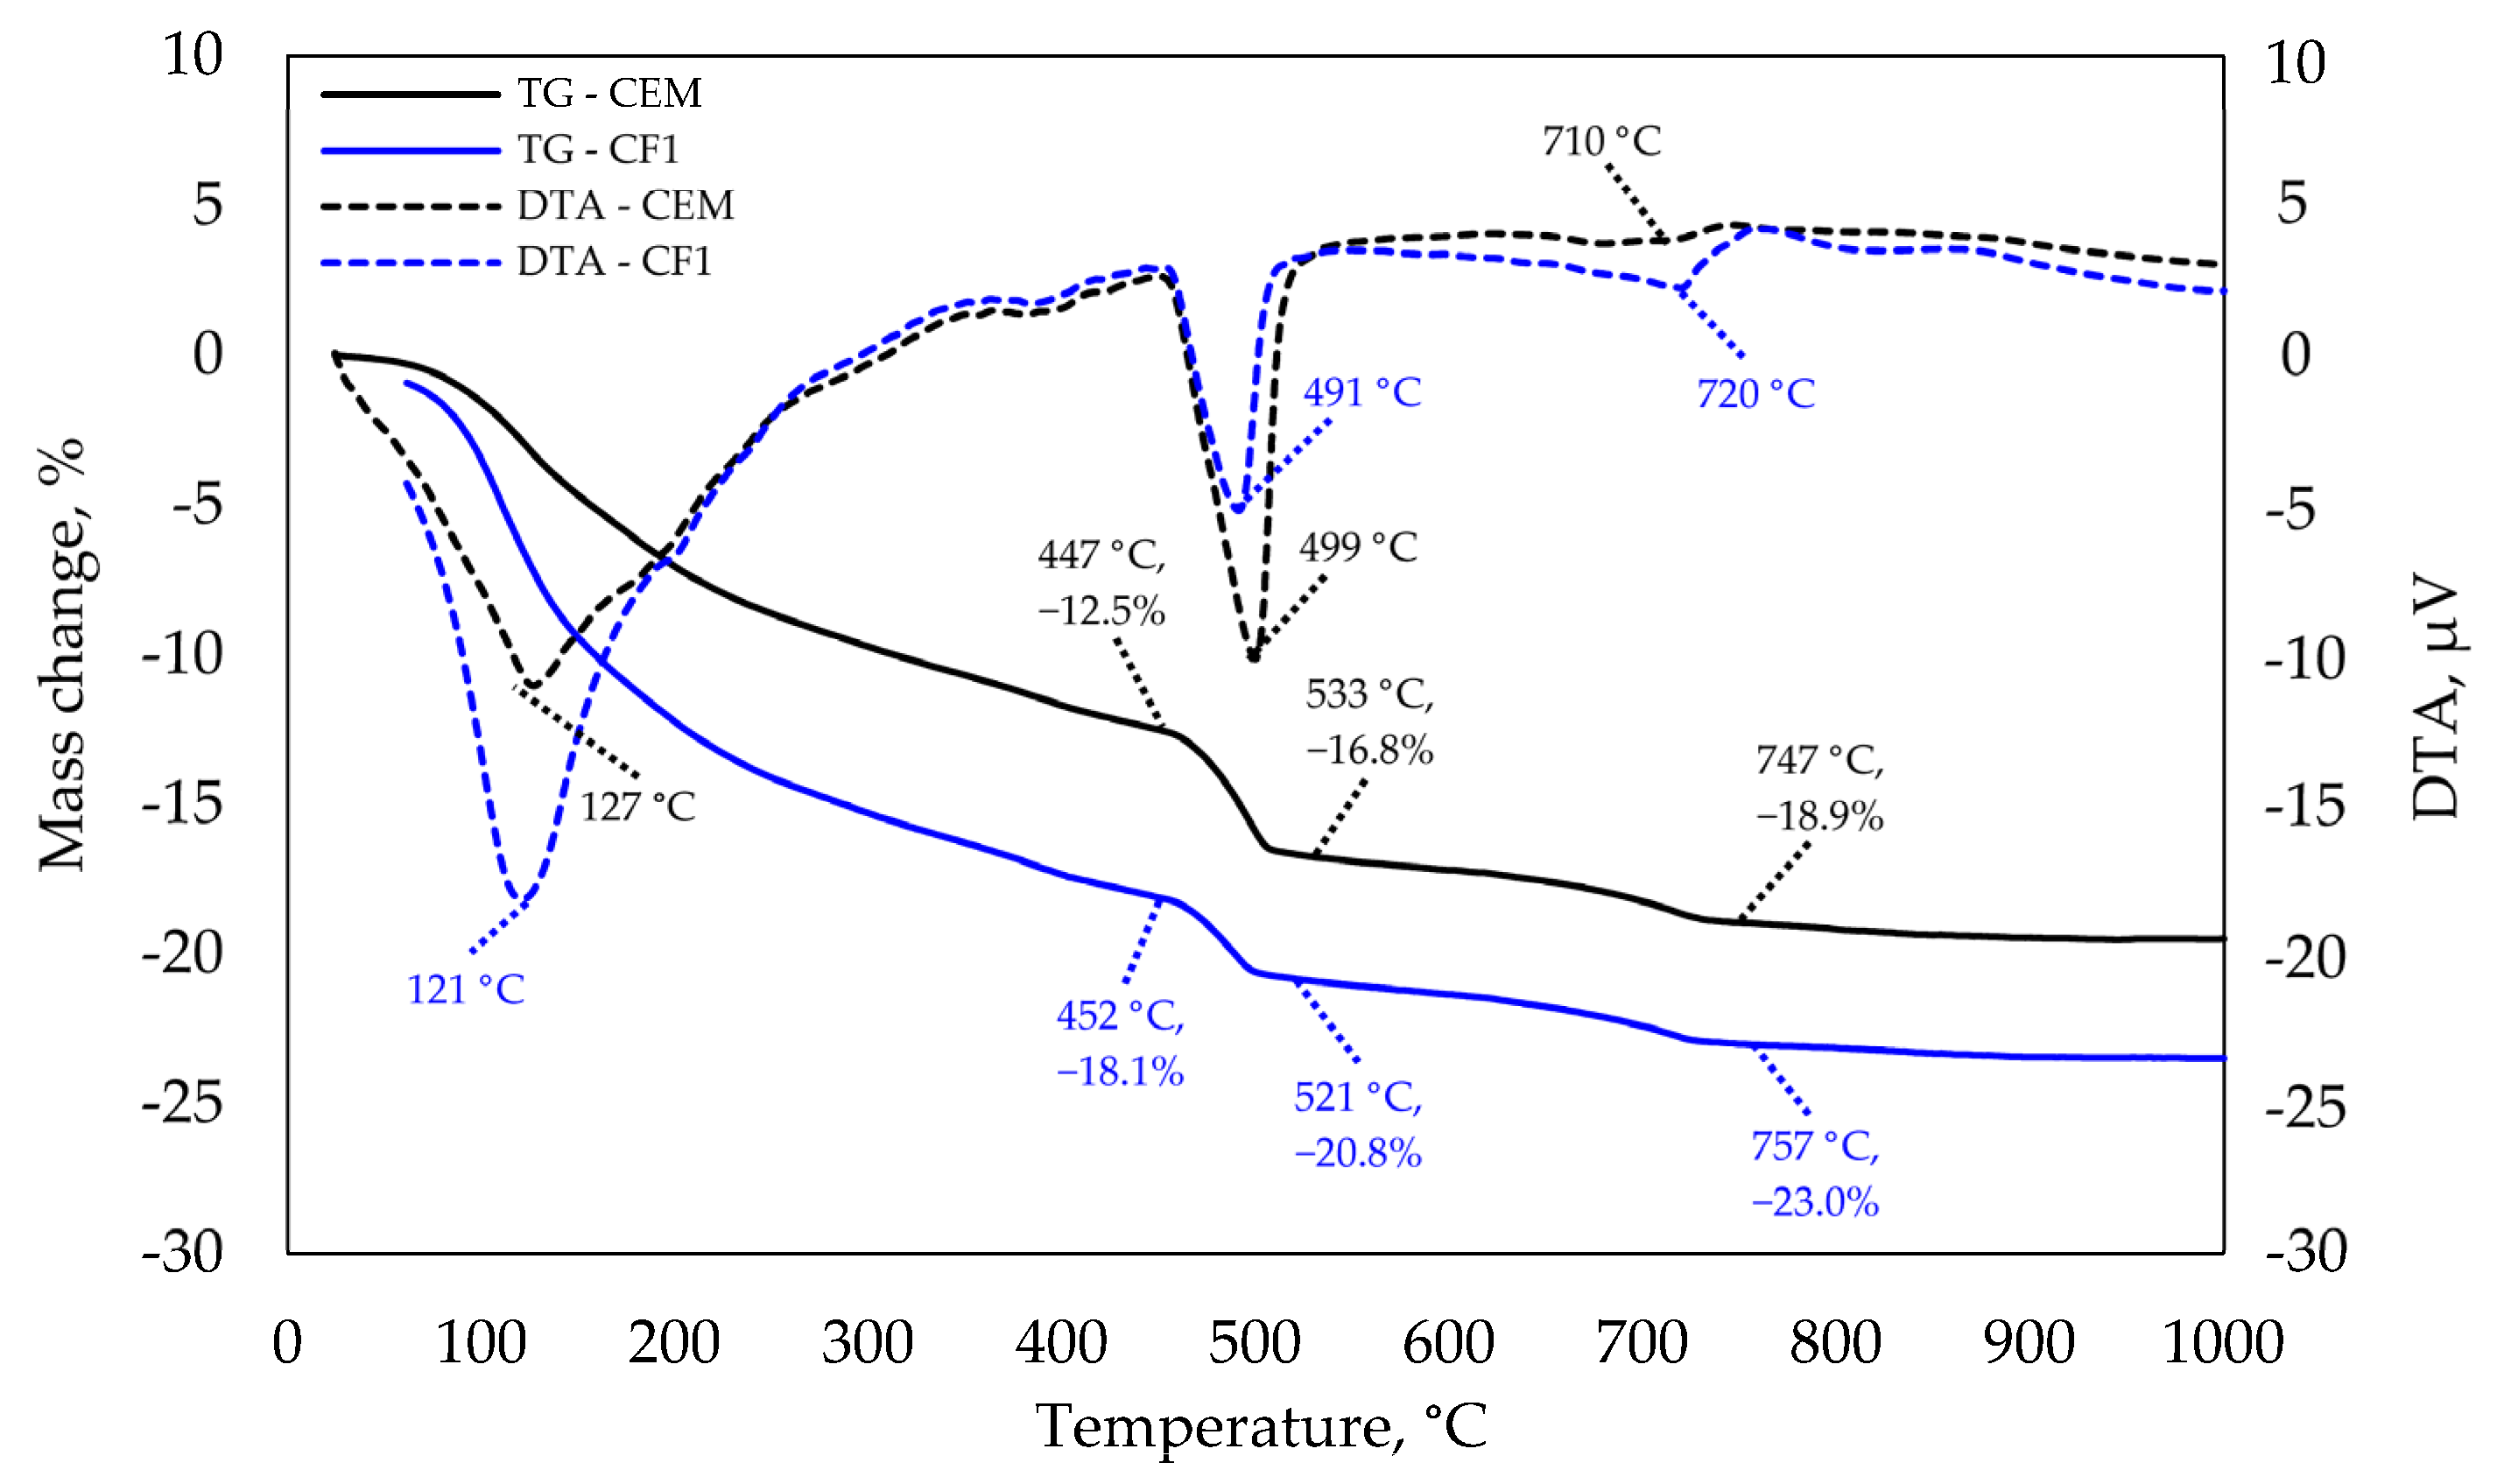
The results of thermogravimetric analysis presented in Figure 10 confirm that at 28 days there was a much higher amount of C-S-H and potentially CAH10 in the modified specimen than in the control specimen. This reasoning is backed by a significantly higher endothermic effect recorded at 120–130 °C temperature. According to the literature analysis [35,36], the majority of these minerals decompose at this temperature.
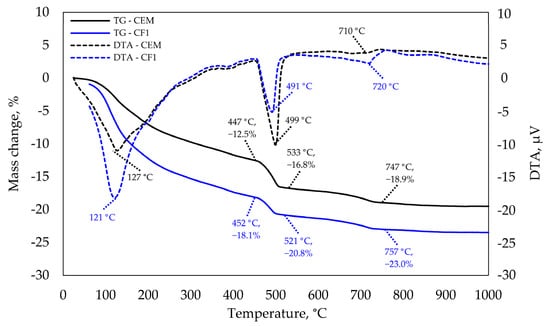
Figure 10.
TGA and DTA analysis after 28 days of curing.
This finding correlates with compressive strength results. The tests revealed that specimen CF1 had a higher compressive strength than control specimens. The next essential difference was observed at 490–500 °C temperature. Ca(OH)2 decomposes at this temperature and a significantly higher endothermic effect as well as mass loss is observed in the modified specimen.
These samples have different cement content and therefore, the mass loss caused by Ca(OH)2 decomposition is presented by the unit of cement mass in the table below. CaCO3 decomposition is observed at 740–760 °C temperature, but the difference is insignificant.
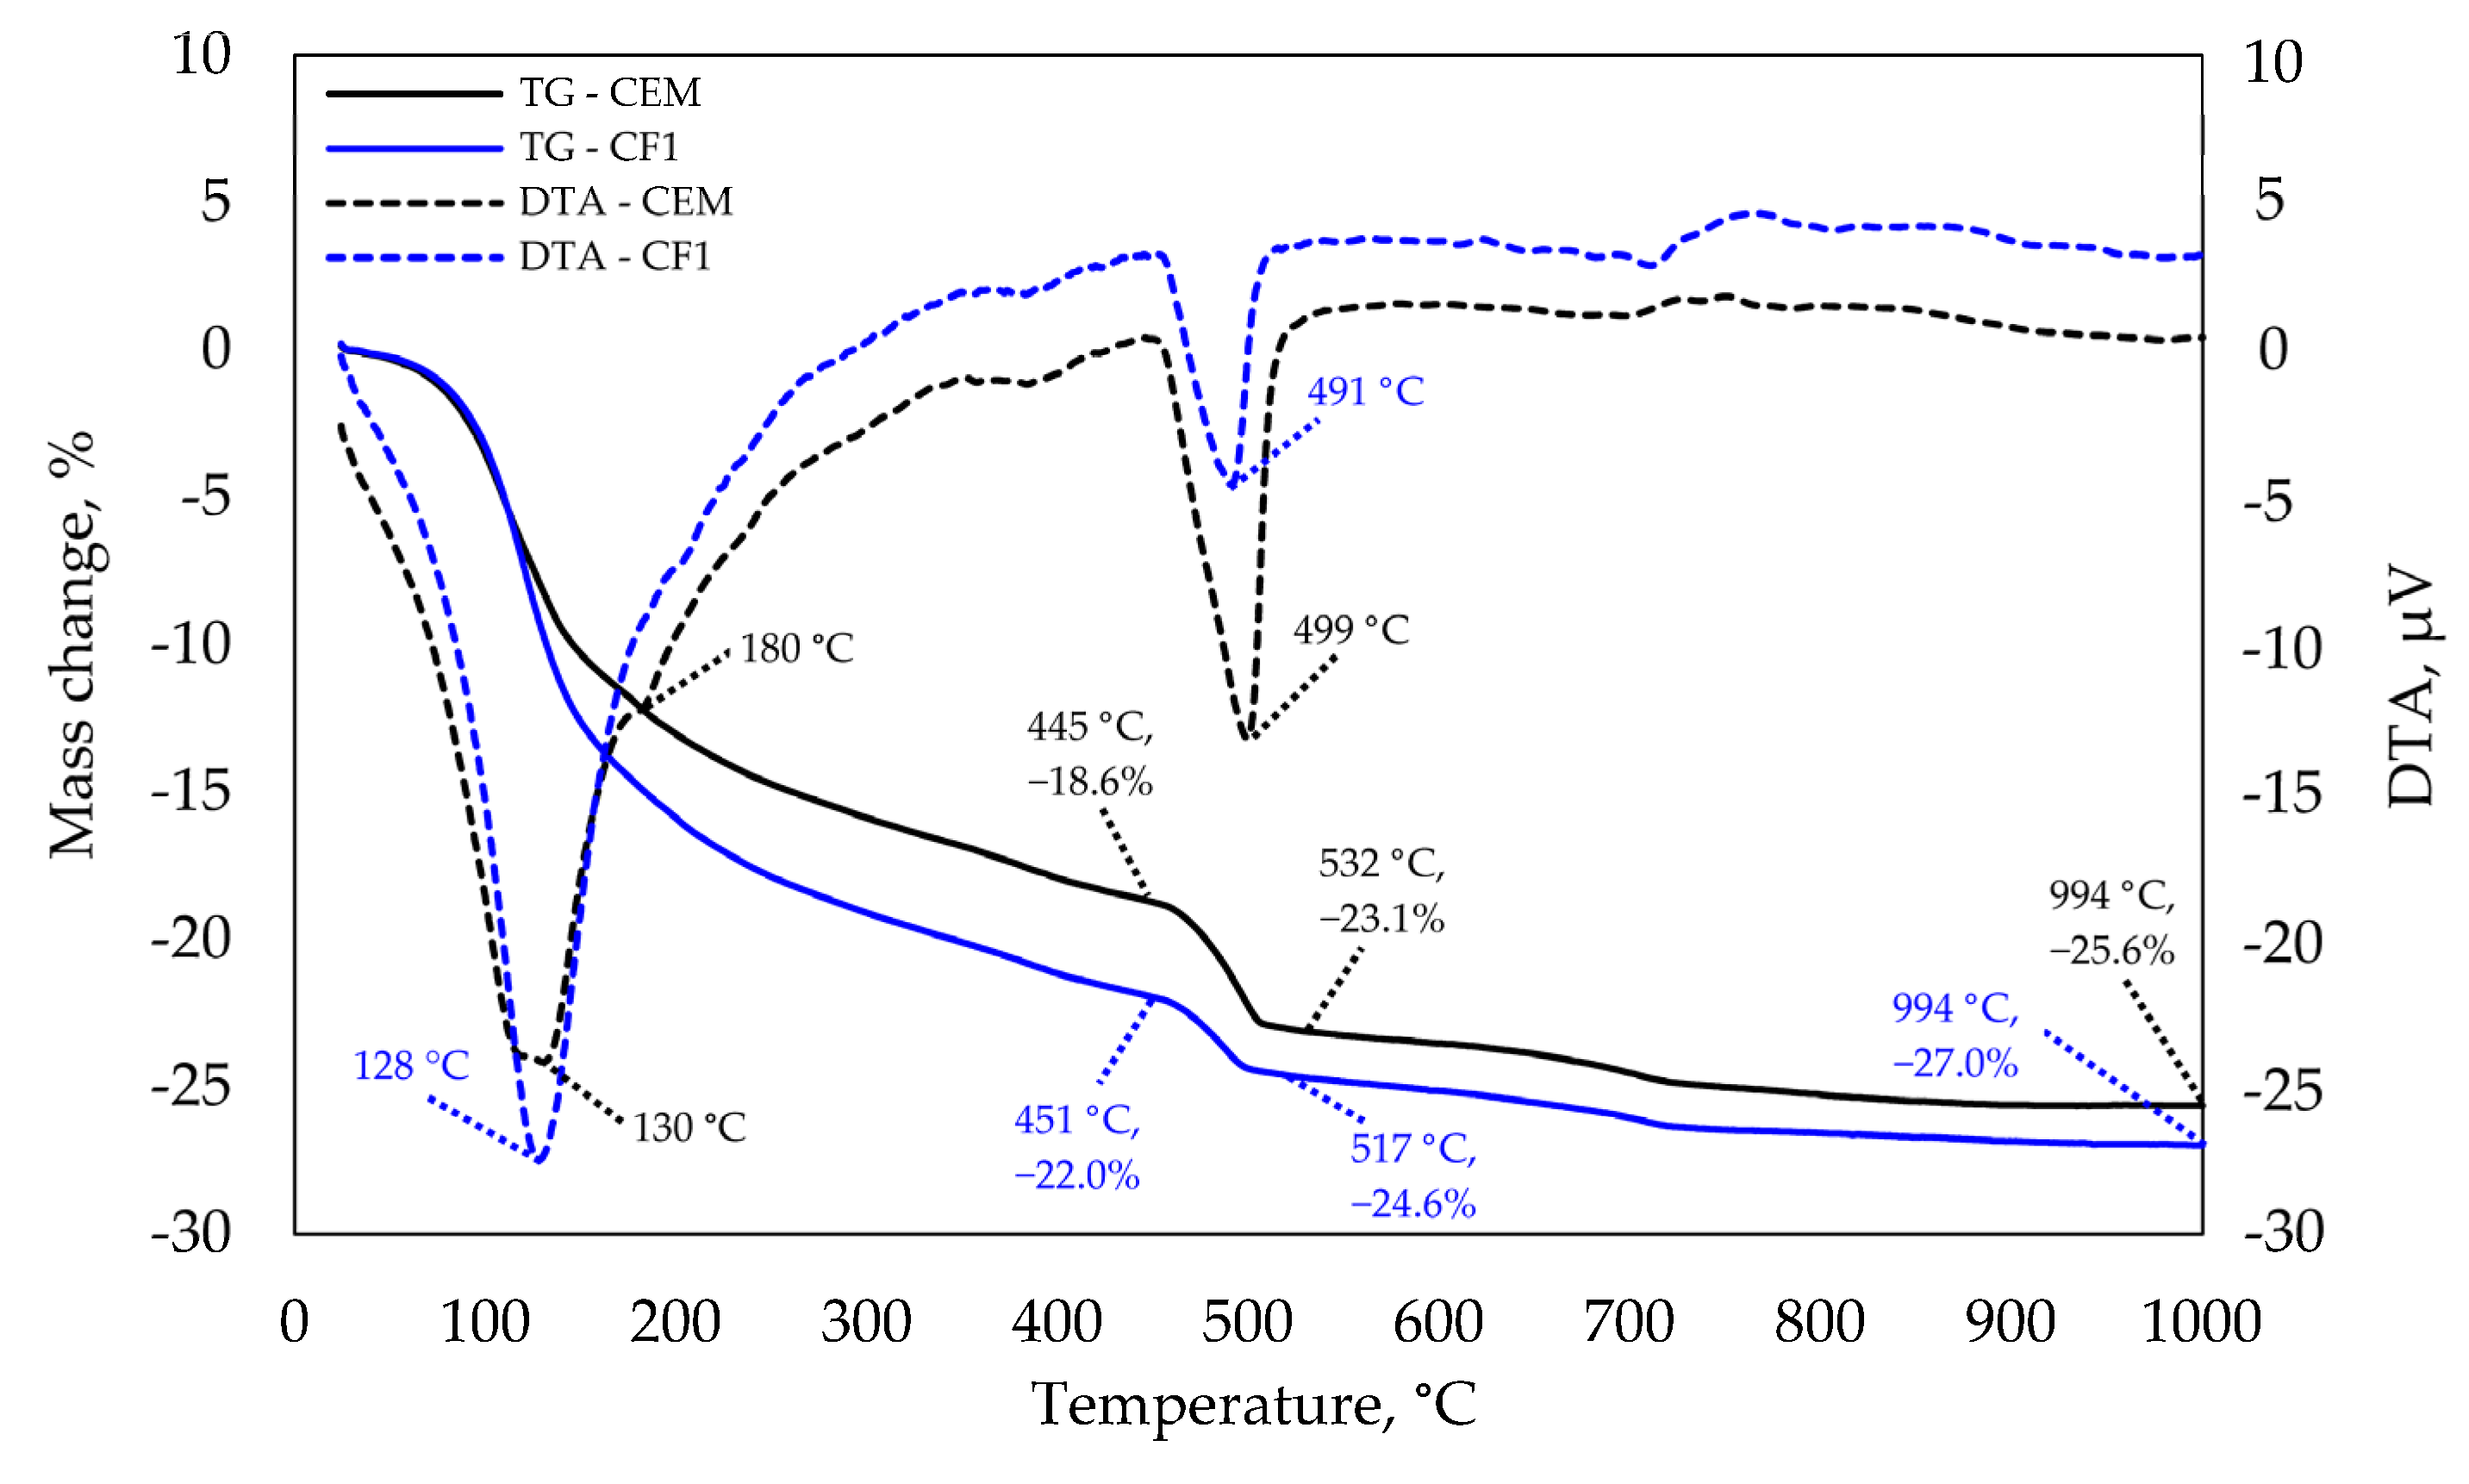
The same tests at 90 days (see Figure 11) did not show any significant difference at the 120–130 °C temperature and that implies that the difference between C-S-H amounts also decreased. A slight endothermic effect in the control specimen at 180 °C is characteristic of ettringite decomposition. The same is confirmed by XRD analysis that revealed ettringite peaks in the control specimen which were not observed in the modified specimen. The most significant difference was observed at 490–500 °C temperature. A higher difference between endothermic reaction temperatures was observed in the control specimen than the difference at 28 days as well as a higher mass loss; thus, leading to the conclusion that the intensity of pozzolanic reaction increases with the curing time. Different authors have stressed the importance of alkali metals, such as Na ions, which elevate aluminium and silica concentrations and lower calcium concentrations [37]. The concentrations of these elements have a significant effect on the Ca/Si ratio and consequently on the length of the silicate chains.
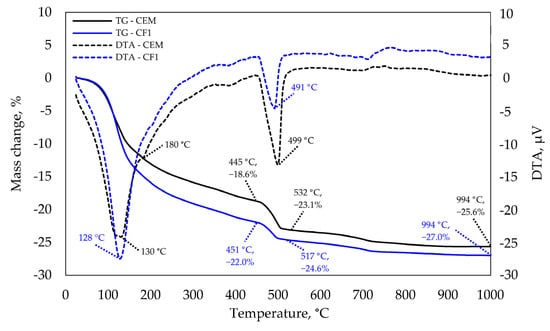
Figure 11.
TGA and DTA analysis after 90 days of curing.
In addition, the stability of stratlingite and katoite reduces in the presence of alkalis in the system [38]. In the systems without NaOH, the pH increases from 10.5 to 12.0 and up to 13.6 in the systems with alkali metals [39], leading to the increase in the deprotonation of silanols and the decrease in calcium concentrations compared to C-S-H [40]. According to authors, both of these factors contribute to a higher binding of sodium in alkaline solutions compared to nitrate or chloride solutions.
The calculation of Ca(OH)2 in Table 7 from the TGA data shows that after 28 days of curing the modified specimen had 17.0% less Ca(OH)2 per unit weight of cement, while the XRD analysis shows that the control sample had unreacted C3S, suggesting that despite the more intense hydration and higher degree of hydration, the modified specimen has less Ca(OH)2. These findings suggest that the pozzolanic reaction in modified specimens consumes some of the Ca(OH)2 hydrates that recrystallise to C-S-H or C-A-S-H.
Table 7.
Calcium hydroxide calculation results.
3.8. Scanning Electron Microscopy
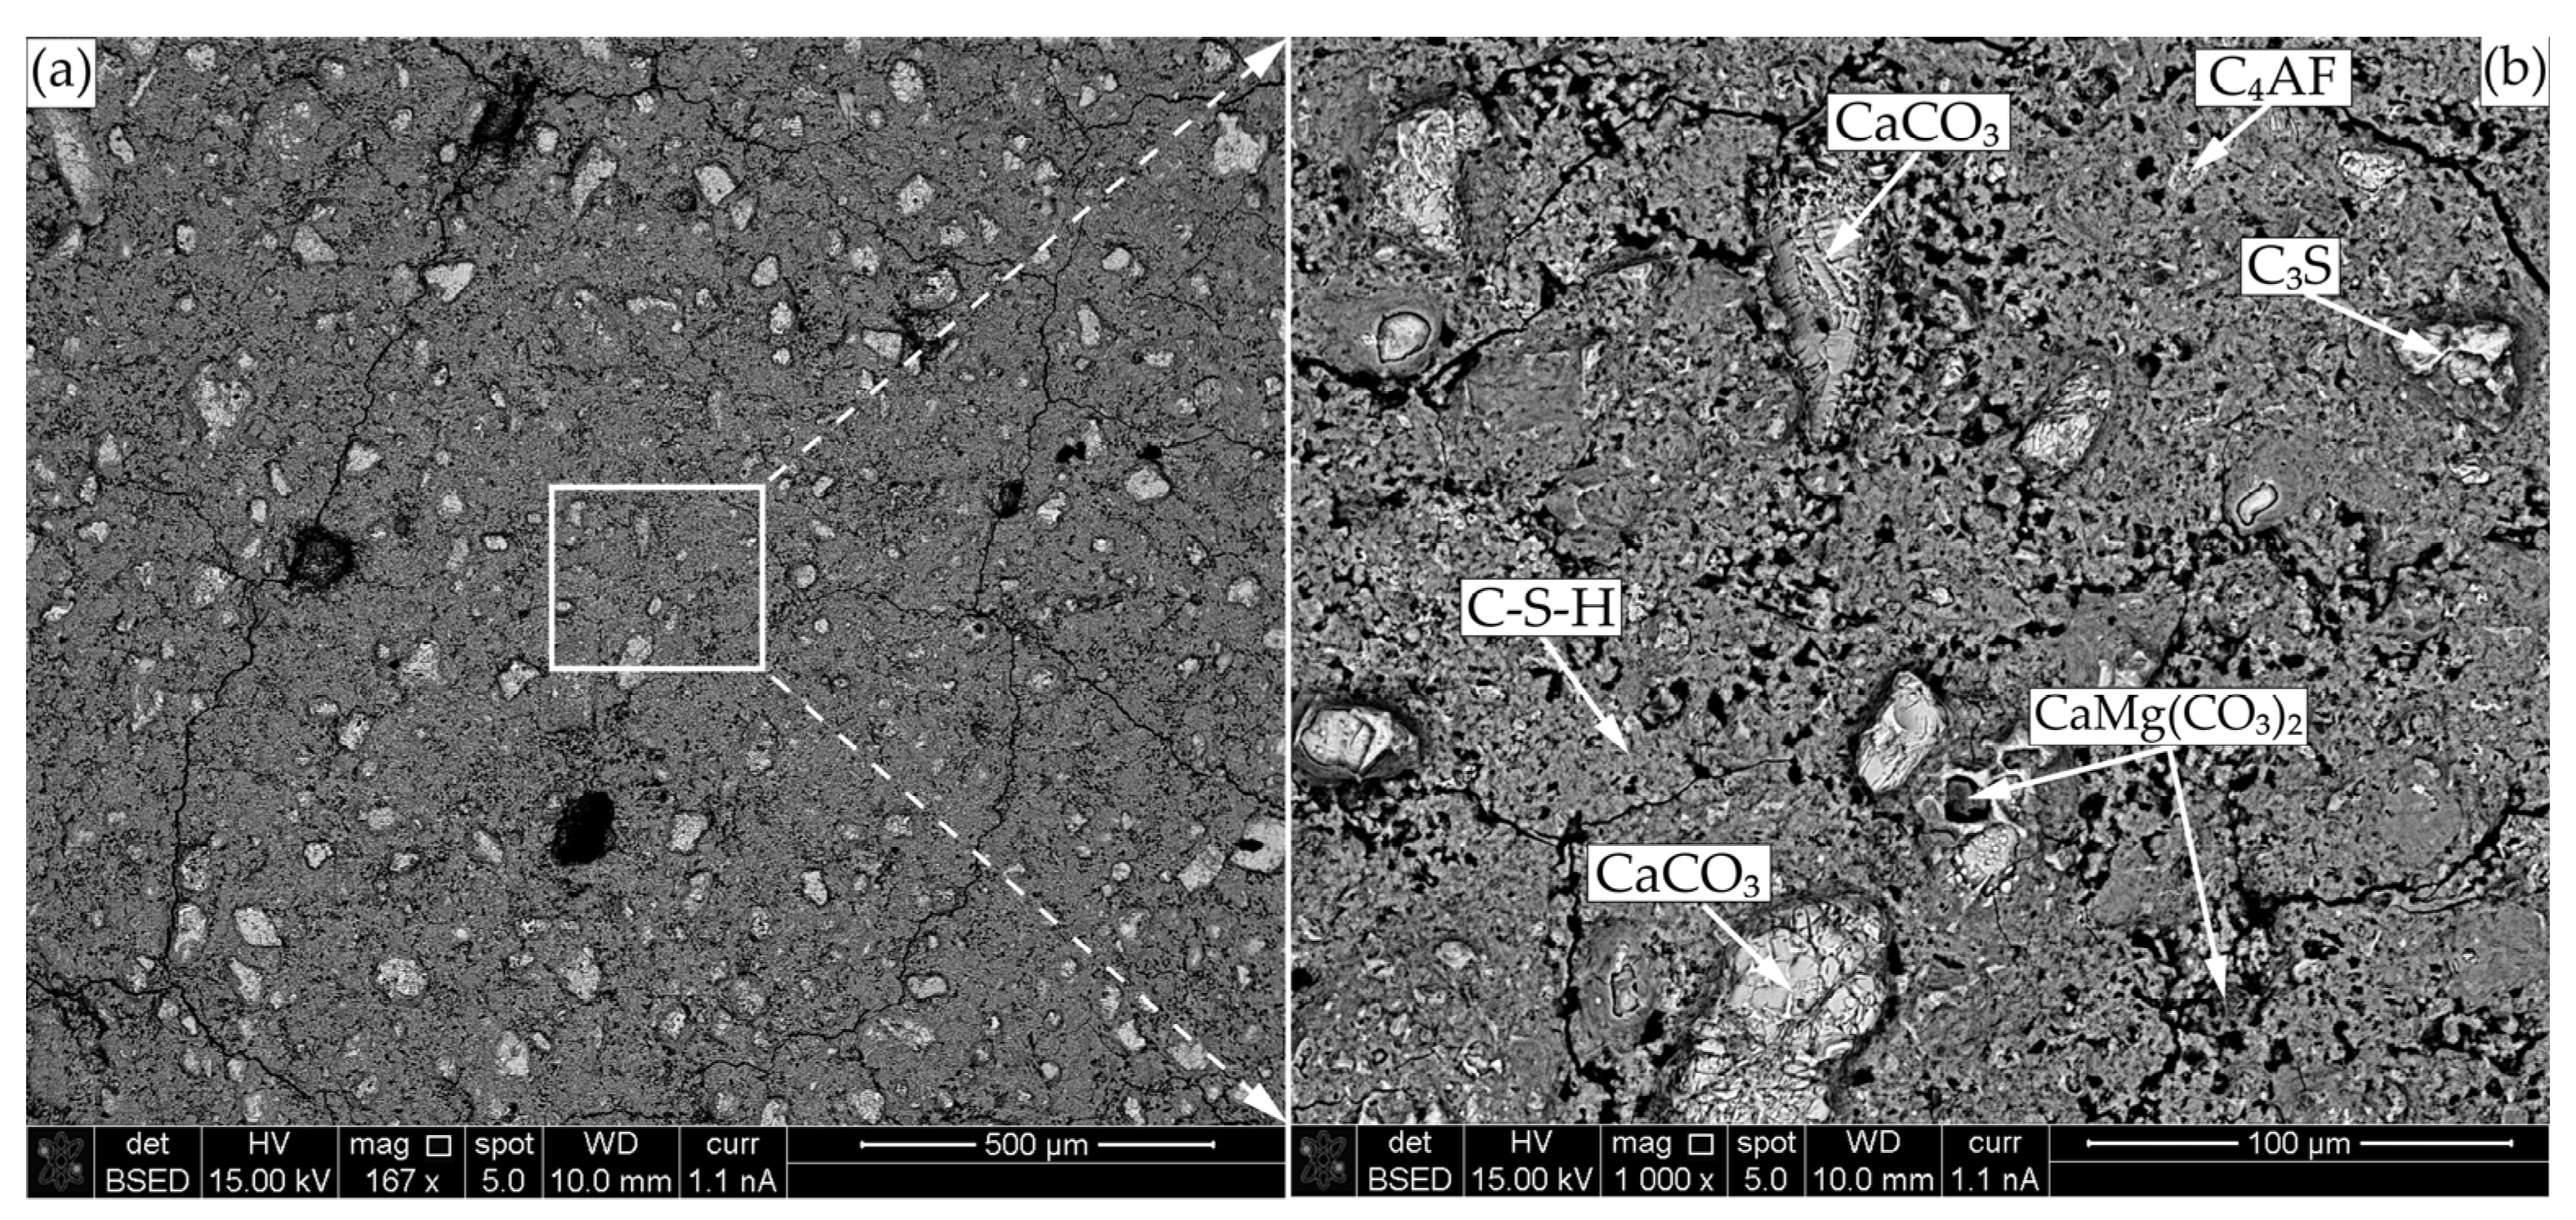
The results of XRD analysis and porosity tests were partly confirmed by SEM tests. The control specimen images taken at 90 days (Figure 12) show the presence of free cement clinker minerals (C3S and C4AF), dolomite (CaMg(CO3)2), which most probably entered the system from the cement raw materials, in XRD and TGA already identified calcite (CaCO3), and the prevailing C-S-H. Visually, the structure of C-S-H is not uniform, i.e., some areas are less compacted and not completely filled with hydration products which correlates well with a high number of free clinkers in the matrix indicating a relatively low degree of hydration.

Figure 12.
SEM-BSE microscopy of CEM after 90 days of curing: (a) ×167; (b) ×1000.
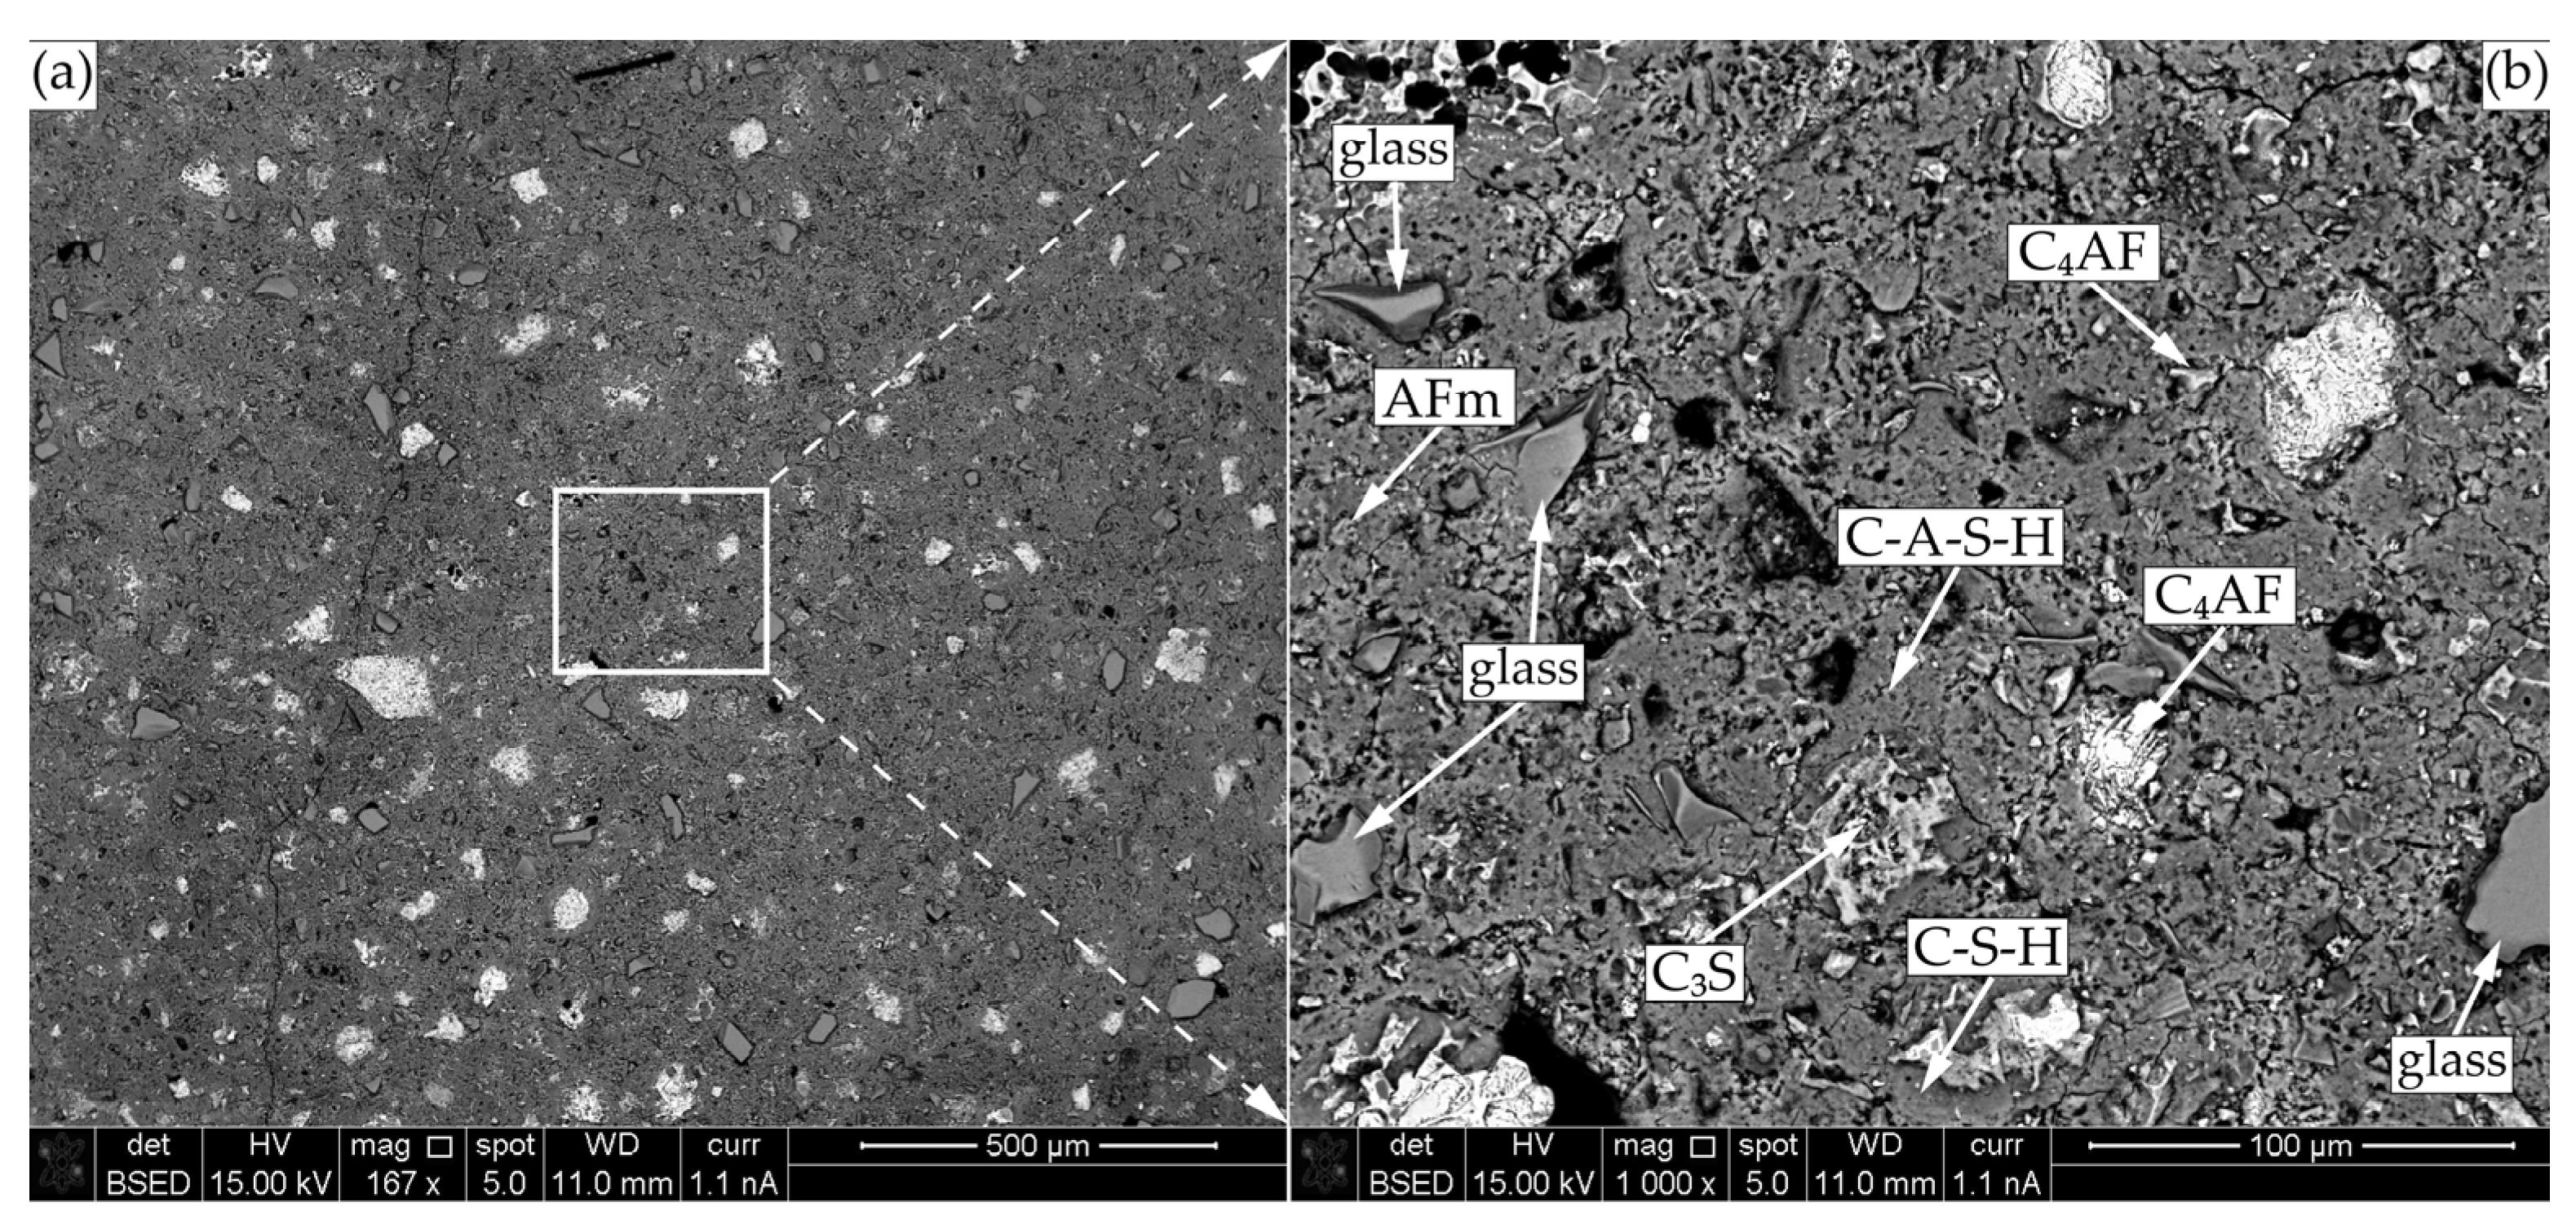
The image of the modified specimen cement matrix is presented in Figure 13. Here, free cement clinker minerals (C3S and C4AF), soda lime glass particles, mono-sulphoaluminates, and C-S-H as well as C-A-S-H are also observed.

Figure 13.
SEM-BSE microscopy of CF1 after 90 days of curing: (a) ×167; (b) ×1000.
The glass particles are well-embedded in the cementitious matrix structure, no micro-cracks are observed in the contact zone, and small amounts of incorporated Na are detected in the C-S-H structure around the glass particle. The composition of gel shell around the glass particle was very similar to that of liquid glass (Na2O(SiO2)x·xH2O) and the same was observed by other authors [41].
The detected uptake of Al into C-S-H structure in the modified specimen only confirms the findings of other authors, who claimed that both amorphous C-S-H and crystalline phases, tobermorite 11 Å in particular, can uptake Al, which is present in the interlayer and/or substitutes for Si at the connections of Si silicate chains [33]. Authors [42] noticed that in synthetic C-A-S-H phases, the interlayer distance can increase from 11.7 Å in the absence of aluminium to 14.4 Å when Al/Si = 0.1. These findings confirm that Al uptake modified the C-S-H structure.
It was found that at a higher Ca/Si ratio, the number of connecting tetrahedra decreases [43]. Experimental data [39] show that the concentration of dissolved Al increases in the presence of alkaline hydroxide due to higher pH values and destabilisation of stratlingite and aluminium hydroxide caused by the addition of NaOH. However, a higher pH of the system limits the uptake of Al in C-S-H. In the absence of alkali, all Al is incorporated in the silicate chains of the C-S-H when the Al/Si ratio is ≤0.05. At the Al/Si ratio ≥0.1, however, some aluminium is deposited as stratlingite and katoite; thus, limiting the development of Al/Si ratio in C-S-H to a maximum of ~0.06. The highest Al/Si ratio in C-S-H of ~0.23 was reached when the molar concentration of potassium hydroxide was 0.5 mol/l [38].
Figure 11 and Figure 12 compared with each other show that the microstructure of the modified specimen is visually denser than the microstructure of the control specimen and the modified specimen contains less non-hydrated C3S, which confirms that the mixture zeolite and glass accelerates cement hydration.
Thus, it can be concluded that glass in the cementitious matrix is not so much involved in the pozzolanic reactions as it is in the compaction of the microstructure of cementitious matrix leading to improved properties of concrete. The compressive strength and durability of concrete, which was “diluted” by a mixture of zeolite and glass and had a higher w/c ratio of 0.69, was equal to, or better than, the same properties of control specimens. These results also confirm the positive combined effect of natural zeolite and sodium silicate lime glass.
4. Conclusions
This study was conducted to test the sufficiency of the combined effect of the mixture of natural zeolite and glass on the mineral composition and microstructure of the cement matrix in order to compensate for the 25% cement “dilution” effect and at the same time to obtain similar compressive strength parameters and improve durability properties of concrete. This objective has been achieved as the test results showed that:
- The concrete, in which 25% of cement was replaced with a mixture containing 15% of zeolite with the average particle size of 3.6 μm and 10% of glass showed approximately a twice better resistance to the penetration of chloride diffusion, the same decrease in the depth of water penetration under pressure, while the compressive strength remained similar to the strength of control specimens. The mass loss of modified specimens of the best composition (CF1) was about 30% lower at 28 days and 4% lower at 90 days than the mass loss of control specimens.
- At 28 days, no significant differences in the mineral composition of hardened cement paste with similar binder composition (CEM and CF1) were observed; however, the C3S observed in control specimen suggests that the mixture of additives accelerates cement hydration. At 90 daFys, the formation of katoite was observed in modified specimen whereas in the control specimen this mineral was not detected. The amount of calcium hydroxide converted to cement mass units showed that the modified specimen had 17.0% and 23.1% less Ca(OH)2 at 28 and 90 days, respectively. This reduction indicates intensive pozzolanic reactions of zeolite and glass mixture.
- No significant differences in porosity parameters were found between the specimens, but a visually evident denser structure of the cementitious matrix of the modified specimen, and the incorporation of Al in C-S-H structure indicate that Na promotes the compaction of cemenFtitious systems; thus, supporting the findings of other researchers. Glass particles are well-embedded in the overall structure of the matrix. The contact zone is homogeneous with no visible microcracks. As the glass particles are only slightly melted, the effect of this material is probably not related to the pozzolanic reactions, but rather to its influence on the chemical reactions in cement and the acceleration of the cement–zeolite pozzolanic reactions.
In conclusion, it can be said that the combined effect of the mixture changes the cement chemistry leading to the formation of diverse types and/or different amounts of hydrates. This has an impact on microstructure parameters and durability properties of concrete. A mixture of zeolite and glass sufficiently compensates for the cement “dilution” effect and makes it possible to reach the compressive strength and porosity values similar to those of unmodified concrete.
In this study, the main focus was to determine the complex effect of the mineral mixture on durability properties, and to the microstructure of the products of hydration. Future studies should include detailed analysis of capillary porosity using mercury intrusion porosimetry and nuclear magnetic resonance techniques. It is very likely that the effect of the mixture on the porosity values is not limited to a reduction in pore size and volume, but also on possible ink-bottles, tortuosity and connectivity of pore structure.
Author Contributions
Conceptualization, D.K. and G.G.; methodology, D.K. and G.G.; validation, G.G., E.I. and A.K.; formal analysis, D.K. and G.G.; investigation, D.K.; resources, E.I. and A.K.; data curation, A.K.; writing—original draft preparation, D.K.; writing—review and editing, A.K.; visualization, D.K.; supervision, E.I. and A.K.; project administration, G.G. All authors have read and agreed to the published version of the manuscript.
Funding
This research received no external funding.
Data Availability Statement
Data are contained within the article.
Conflicts of Interest
The authors declare no conflict of interest.
References
- De Brito, J.; Kurda, R. The past and future of sustainable concrete: A critical review and new strategies on cement-based materials. J. Clean. Prod. 2021, 281, 123558. [Google Scholar] [CrossRef]
- Babic, V. Increasing the Porosity of Zeolites. Ph.D. Thesis, Normandie Université, Catalysis, Caen, France, 2021. [Google Scholar]
- Ranjbar, M.M.; Madandoust, R.; Mousavi, S.Y.; Yosefi, S. Effects of natural zeolite on the fresh and hardened properties of self-compacted concrete. Constr. Build. Mater. 2013, 47, 806–813. [Google Scholar] [CrossRef]
- Yu, R.; Wang, Z.; Sun, M.; Yu, Z.; Dong, E.; Fan, D. Effect of natural zeolite on water distribution and migration in low water/binder cement-based composites (LW/B-CC) mixed with seawater: An experimental and computational investigation. Constr. Build. Mater. 2023, 379, 131242. [Google Scholar] [CrossRef]
- Pavlík, Z.; Fořt, J.; Pavlíková, M.; Kulovaná, T.; Černý, R. Characterization of Cement Pastes Containing Natural Zeolite as a Pozzolanic Admixture. Appl. Mech. Mater. 2015, 719–720, 206–209. [Google Scholar] [CrossRef]
- De la Cruz, J.C.; Colorado, D.; del Campo, J.M. Comparative study on porosity and permeability of conventional concrete and concrete with variable proportions of natural zeolite additions. Rev. Construcción 2015, 14, 72–78. [Google Scholar] [CrossRef]
- Uzal, B.; Turanlı, L. Blended cements containing high volume of natural zeolites: Properties, hydration and paste microstructure. Cem. Concr. Compos. 2012, 34, 101–109. [Google Scholar] [CrossRef]
- Vejmelková, E.; Koňáková, D.; Kulovaná, T.; Keppert, M.; Žumár, J.; Rovnaníková, P.; Keršner, Z.; Sedlmajer, M.; Černý, R. Engineering properties of concrete containing natural zeolite as supplementary cementitious material: Strength, toughness, durability, and hygrothermal performance. Cem. Concr. Compos. 2015, 55, 259–267. [Google Scholar] [CrossRef]
- Lee, H.; Hanif, A.; Usman, M.; Sim, J.; Oh, H. Performance evaluation of concrete incorporating glass powder and glass sludge wastes as supplementary cementing material. J. Clean. Prod. 2018, 170, 683–693. [Google Scholar] [CrossRef]
- Paul, S.C.; Šavija, B.; Babafemi, A.J. A comprehensive review on mechanical and durability properties of cement-based materials containing waste recycled glass. J. Clean. Prod. 2018, 198, 891–906. [Google Scholar] [CrossRef]
- Khan, N.N.; Saha, A.K.; Sarker, P.K. Reuse of waste glass as a supplementary binder and aggregate for sustainable cement-based construction materials: A review. J. Build. Eng. 2020, 28, 101052. [Google Scholar] [CrossRef]
- Islam, G.S.; Rahman, M.; Kazi, N. Waste glass powder as partial replacement of cement for sustainable concrete practice. Int. J. Sustain. Built Environ. 2017, 6, 37–44. [Google Scholar] [CrossRef]
- Gao, X.; Yu, Q.; Li, X.; Yuan, Y. Assessing the modification efficiency of waste glass powder in hydraulic construction materials. Constr. Build. Mater. 2020, 263, 120111. [Google Scholar] [CrossRef]
- Nahi, S.; Leklou, N.; Khelidj, A.; Oudjit, M.N.; Zenati, A. Properties of cement pastes and mortars containing recycled green glass powder. Constr. Build. Mater. 2020, 262, 120875. [Google Scholar] [CrossRef]
- Patel, D.; Tiwari, R.P.; Shrivastava, R.; Yadav, R.K. Effective utilization of waste glass powder as the substitution of cement in making paste and mortar. Constr. Build. Mater. 2019, 199, 406–415. [Google Scholar] [CrossRef]
- Nwaubani, S.O.; Poutos, I.I. The Influence of Waste Glass Powder Fineness on the Properties of Cement Mortars. Int. J. Appl. Or Innov. Eng. Manag. 2013, 2, 110–116. [Google Scholar]
- Kameche, Z.E.-A.; Djelil, M.; Dahmani, B. Effects of incorporating silica glass powder as a supplementary cementitious material on selected properties of portland cement mortar. J. Build. Eng. 2023, 78, 107550. [Google Scholar] [CrossRef]
- Du, H.; Tan, K.H. Properties of high volume glass powder concrete. Cem. Concr. Compos. 2017, 75, 22–29. [Google Scholar] [CrossRef]
- Omran, A.F.; D.-Morin, E.; D.-Morin, E.; Harbec, D.; Tagnit-Hamou, A. Long-term performance of glass-powder concrete in large-scale field applications. Constr. Build. Mater. 2017, 135, 43–58. [Google Scholar] [CrossRef]
- EN 197-1; Cement—Part 1: Composition, Specifications, and Conformity Criteria for Common Cements. European Standard: Brussels, Belgium, 2004.
- EN 12390-3; Testing Hardened Concrete—Part 3: Compressive Strength of Test Specimens. European Standard: Brussels, Belgium, 2019.
- EN 12390-8; Testing Hardened Concrete—Part 8: Depth of Penetration of Water under Pressure. European Standard: Brussels, Belgium, 2019.
- NT Build 492; Concrete, Mortar and Cement-Based Repair Materials: Chloride Migration Coefficient from Non-Steady-State Migration Experiments. Nordic Council of Ministers. 1999. Available online: http://www.nordtest.info/wp/category/methods/building/ (accessed on 1 October 2023).
- Setzer, M.J.; Heine, P.; Kasparek, S.; Palecki, S.; Auberg, R.; Feldrappe, V.; Siebel, E. RILEM TC 176-IDC: Internal damage of concrete due to frost action. Mater. Struct. 2004, 37, 743–753. [Google Scholar] [CrossRef]
- EN 196-1; Methods of Testing Cement—Part 1: Determination of Strength. European Standard: Brussels, Belgium, 2016.
- Gjorv, O.E. Performance and Serviceability of Concrete Structures in the Marine Environment. In Symposium on Concrete for Marine Structures; Mehta, P.K., Ed.; CANMET/ACI: Ottawa, ON, Canada, 1996; pp. 259–279. [Google Scholar]
- Pontes, J.; Bogas, J.A.; Real, S.; Silva, A. The rapid chloride migration test in assessing the chloride penetration resistance of normal and lightweight concrete. Appl. Sci. 2021, 11, 7251. [Google Scholar] [CrossRef]
- Nguyen, Q.H.; Lorente, S.; Duhard-Barone, A. Effect of the pore size of cement based materials on ionic transport. Constr. Build. Mater. 2017, 147, 160–167. [Google Scholar] [CrossRef]
- Chang, H.; Zuo, Z.; Qu, M.; Wang, F.; Ge, Z.; Liu, J. Influence of pore structure on chloride penetration in cement pastes subject to wetting-drying cycles. Adv. Mater. Sci. Eng. 2019, 2019, 3909348. [Google Scholar] [CrossRef]
- Kriptavičius, D.; Girskas, G.; Skripkiūnas, G. Use of Natural Zeolite and Glass Powder Mixture as Partial Replacement of Portland Cement: The Effect on Hydration, Properties and Porosity. Materials 2022, 15, 4219. [Google Scholar] [CrossRef] [PubMed]
- Kapeluszna, E.; Kotwica, Ł.; Różycka, A.; Gołek, Ł. Incorporation of Al in C-A-S-H gels with various Ca/Si and Al/Si ratio: Microstructural and structural characteristics with DTA/TG, XRD, FTIR and TEM analysis. Constr. Build. Mater. 2017, 155, 643–653. [Google Scholar] [CrossRef]
- Myers, R.J.; L’Hôpital, E.; Provis, J.L.; Lothenbach, B. Effect of temperature and aluminium on calcium (alumino)silicate hydrate chemistry under equilibrium conditions. Cem. Concr. Res. 2015, 68, 83–93. [Google Scholar] [CrossRef]
- Qu, X.; Zhao, Z.; Zhao, X. Microstructure and characterization of aluminum-incorporated calcium silicate hydrates (C–S–H) under hydrothermal conditions. RSC Adv. 2018, 8, 28198–28208. [Google Scholar] [CrossRef]
- L’hôpital, E.; Lothenbach, B.; Le Saout, G.; Kulik, D.; Scrivener, K. Incorporation of aluminium in calcium-silicate-hydrates. Cem. Concr. Res. 2015, 75, 91–103. [Google Scholar] [CrossRef]
- Taylor, H.F.W. Cement Chemistry, 2nd ed.; Academic Press: Cambridge, MA, USA, 1997; Volume 20, No. 4. [Google Scholar]
- Bushnell-Watson, S.M.; Sharp, J.H. The application of thermal analysis to the hydration and conversión Reactions of calcium alumínate Cements. Mater. Construcción 1992, 42, 13–32. [Google Scholar] [CrossRef]
- Yan, Y.; Ma, B.; Miron, G.; Kulik, D.; Scrivener, K.; Lothenbach, B. Al uptake in calcium silicate hydrate and the effect of alkali hydroxide. Cem. Concr. Res. 2022, 162, 106957. [Google Scholar] [CrossRef]
- Skibsted, J.; Andersen, M.D. The effect of alkali ions on the incorporation of aluminum in the calcium silicate hydrate (C-S-H) phase re-sulting from portland cement hydration studied by 29Si MAS NMR. J. Am. Ceram. Soc. 2013, 96, 651–656. [Google Scholar] [CrossRef]
- Barzgar, S.; Lothenbach, B.; Tarik, M.; Di Giacomo, A.; Ludwig, C. The effect of sodium hydroxide on Al uptake by calcium silicate hydrates (C S H). J. Colloid Interface Sci. 2020, 572, 246–256. [Google Scholar] [CrossRef]
- Pegado, L.; Labbez, C.; Churakov, S.V. Mechanism of aluminium incorporation into C–S–H from ab initio calculations. J. Mater. Chem. A 2014, 2, 3477–3483. [Google Scholar] [CrossRef]
- Shafaatian, S.M.; Akhavan, A.; Maraghechi, H.; Rajabipour, F. How does fly ash mitigate alkali–silica reaction (ASR) in accelerated mortar bar test (ASTM C1567)? Cem. Concr. Compos. 2013, 37, 143–153. [Google Scholar] [CrossRef]
- Wang, T.; Ishida, T.; Gu, R.; Luan, Y. Experimental investigation of pozzolanic reaction and curing temperature-dependence of low-calcium fly ash in cement system and Ca-Si-Al element distribution of fly ash-blended cement paste. Constr. Build. Mater. 2021, 267, 121012. [Google Scholar] [CrossRef]
- Kunther, W.; Ferreiro, S.; Skibsted, J. Influence of the Ca/Si ratio on the compressive strength of cementitious calcium–silicate–hydrate binders. J. Mater. Chem. A 2017, 5, 17401–17412. [Google Scholar] [CrossRef]


Disclaimer/Publisher’s Note: The statements, opinions and data contained in all publications are solely those of the individual author(s) and contributor(s) and not of MDPI and/or the editor(s). MDPI and/or the editor(s) disclaim responsibility for any injury to people or property resulting from any ideas, methods, instructions or products referred to in the content. |
© 2023 by the authors. Licensee MDPI, Basel, Switzerland. This article is an open access article distributed under the terms and conditions of the Creative Commons Attribution (CC BY) license (https://creativecommons.org/licenses/by/4.0/).