Article

Analysis of the Operational Outcomes of an Energy-Sharing System for Low-Carbon Energy Community in South Korea

1
Department of Building Energy Research, Korea Institute of Civil Engineering and Building Technology, Goyang 10223, Republic of Korea
2
Department of Energy Grid, Sangmyung University, Seoul 03016, Republic of Korea
3
Department of Civil and Environmental Engineering, University of Science Technology, Deajeon 34113, Republic of Korea
*
Author to whom correspondence should be addressed.
Buildings 2023, 13(11), 2797; https://doi.org/10.3390/buildings13112797
Submission received: 10 October 2023 / Revised: 3 November 2023 / Accepted: 6 November 2023 / Published: 7 November 2023
(This article belongs to the Special Issue Research on Energy Performance in Buildings)

Abstract

:
The transition to a net-zero energy system is being promoted in the energy sector, which has led to the creation of energy prosumers. These produce, consume, and trade energy using renewable energy systems installed in buildings or complexes. Here, a community was set as the target to apply the concept of an energy prosumer at the individual building and regional levels. Energy-sharing systems were divided into three categories: energy production, energy storage, and energy management. Energy-sharing systems centered on electrical energy—photovoltaic, battery energy storage, and energy management systems—were installed in two communities located in South Korea, and the energy-sharing effects of the system operation were reported. Monthly power consumption in spring and fall exhibited significant savings of approximately three times that of winter consumption, owing to the energy-sharing systems. Daily hourly power-consumption patterns differed on weekdays and weekends because of the weekday working and building-use hours of the communities. Energy could be shared between communities and buildings because of surplus energy. More surplus power was available for energy sharing on weekends because power consumption was lower. Because energy trading and sharing are restricted, the related laws are being revised. Therefore, a low-carbon community can be realized through surplus energy trading and sharing technology between communities and buildings as renewable energy systems spread owing to low carbonization.

1. Introduction

The number of countries declaring carbon neutrality in response to climate crises continues to increase. The Intergovernmental Panel on Climate Change announced that to limit the global average temperature rise to 1.5 °C by 2100, carbon dioxide emissions must be reduced globally by at least 45% by 2030 compared with those of 2010 and that carbon neutrality must be achieved by approximately 2050 [1]. The International Energy Agency has presented a roadmap for the global energy sector to transition into a net-zero energy system by 2050 [2]. The energy sector is largely based on renewable energy sources instead of fossil fuels. This has led to the creation of energy prosumers.
A prosumer is a compound word for producers and consumers and is a productive consumer. The term energy prosumer combines the words energy and prosumer and is a subject of energy production and consumption that can directly produce, use, and trade energy simultaneously, using renewable energy systems installed in buildings or complexes. Energy trading involves the trading of different energy commodities, such as selling surplus energy.
Energy trading involves selling surplus produced energy to neighbors. Three types of energy trading methods exist: offset trading, brokerage market trading, and peer-to-peer (P2P) trading. Offsetting transactions is a method of transmitting surplus power to a power company and then deducting electricity charges for settlement, and a brokerage market transaction is a method of selling produced electricity to the wholesale market through a distributed resource brokerage business. P2P energy trading empowers prosumers and consumers to trade energy directly without the need for an intermediary [3]. With P2P energy trading, prosumers can share the benefits of producing energy with the communities to which they belong, thereby further encouraging the consumption and deployment of distributed renewable generation. In addition, energy flexibility, balance, and congestion management can be achieved using energy storage systems (ESSs). To domestically and internationally revitalize this energy–prosumer industry, revisions to related laws, regulations, and verification projects are being promoted.
A community is composed of buildings with various purposes, and each building and community are energy consumers or prosumers. The general dictionary definition of a community is a common society or a group of people who reside in the same area, such as a city, town, or neighborhood, or who have the same interests, religion, or race [4]. A community can be viewed as the spatial scope of small living areas and neighborhood living areas. The composition of a community is based on space and purposes, such as use, characteristics, and functions. In this study, a community was set as the target to apply the concept of an energy prosumer at the individual building and regional levels.
Energy transactions can be classified as trading or sharing, depending on whether they are financial transactions. Trading is an event in which a monetary transaction occurs, and sharing is one in which a monetary transaction does not occur. Energy trading and sharing can be possible between both individual buildings within a community and between communities. Individual communities are composed of buildings for various purposes, and energy-sharing systems are installed in individual buildings, complexes, and common spaces within the community. Energy consumers are individual buildings or community units, whereas energy suppliers are companies and energy-sharing systems that produce and store energy.
Energy-sharing systems can be divided into three categories: energy production, energy storage, and energy management [5]. Energy production systems are renewable energy systems that produce energy, such as photovoltaic (PV), solar thermal, and geothermal systems. Depending on the energy source, ESSs are subdivided into battery energy storage systems (BESSs) for electricity and thermal energy storage systems (TESSs) for heat. An energy management system (EMS) measures and collects energy data, monitors it in real time, and provides the necessary analysis information for energy management. The components of the EMS are hardware, which comprises measurement, communication, and control equipment, and software, which consists of monitoring equipment.
Several countries have conducted empirical research on energy trading and sharing. Shi et al. [6] established flexible resource models and constructed a low-carbon dispatching framework for multiple integrated regional gas–electric energy systems. Liu et al. [7] proposed a comprehensive framework to investigate community-based virtual power plants and conducted a case study in the City of Greater Bendigo for Australian communities. The target size (that is, one city) was considerably large, and the energy trading results were presented as scenario-based simulations rather than actual data. Alaifan et al. [8] presented a unique empirical techno-economic optimization and evaluation approach for net-zero energy community potential and enablers through its application in Kuwait. The community system was modeled through simulation, and the results of the optimal combination were derived. In Sweden, research comprised communities of different sizes based on apartment data and evaluated the profitability of shared PV systems by simulating electricity trading between prosumers within the community [9,10]. Contrary to the previous reference paper, the target size was limited to 48 apartments; therefore, no transactions were conducted between various building types. Saarloos et al. [11] used the National Western Center in Denver, CO, USA, as a case study to quantify and optimize the economic costs and grid independence of a net-zero energy district. In addition, studies have been conducted on the effects of energy trading on energy communities in Portugal and Nepal [12,13]. In general, the research was mainly conducted on complex system concepts and simulations. In Korea, the Jincheon eco-friendly energy town was constructed and has operated since 2017 with the goal of regional power and heat energy independence by utilizing various new and renewable energy sources, such as PV, solar thermal, geothermal, and sewage heat [14,15,16]. In the empirical case of Busan Smart Village, a single-family housing complex produces thermal energy for cooling, heating, and domestic hot water using ground-source heat pumps integrated with thermal energy storage and solar energy systems [16]. These energy trade studies focused on thermal energy. For thermal energy trading, a separate physical network is required. The target energy-production systems in this research were PV and BESSs, and the community was implemented on a small scale, such as on a campus or several buildings [17,18,19]. Unlike previous studies, research on energy trading focused on electrical energy. Additionally, the biggest difference from previous studies is that the system was installed at an actual site rather than a virtual site or system to examine the effects. Emerging research endeavors to develop a scenario in which energy is shared among energy prosumers using ESS, PV, and wind power generation systems installed in each building within the community [20,21,22,23]. Various energy-sharing scenarios have been developed in relation to this study; however, various scenarios will be applied in practice after stabilizing the system for one year.
In this study, PV, BESS, and EMS, which are energy-sharing systems centered on electrical energy, were installed in two communities located in South Korea, and the energy-sharing effects of the system operation from November 2022 to June 2023 were reported. Measurements of the energy-sharing systems in two communities were analyzed, revealing that surplus power for energy sharing was obtained on weekends and, in some cases, even weekdays. Such surplus energy is expected to increase as more renewable energy systems are installed in zero-energy buildings.

2. Materials and Methods

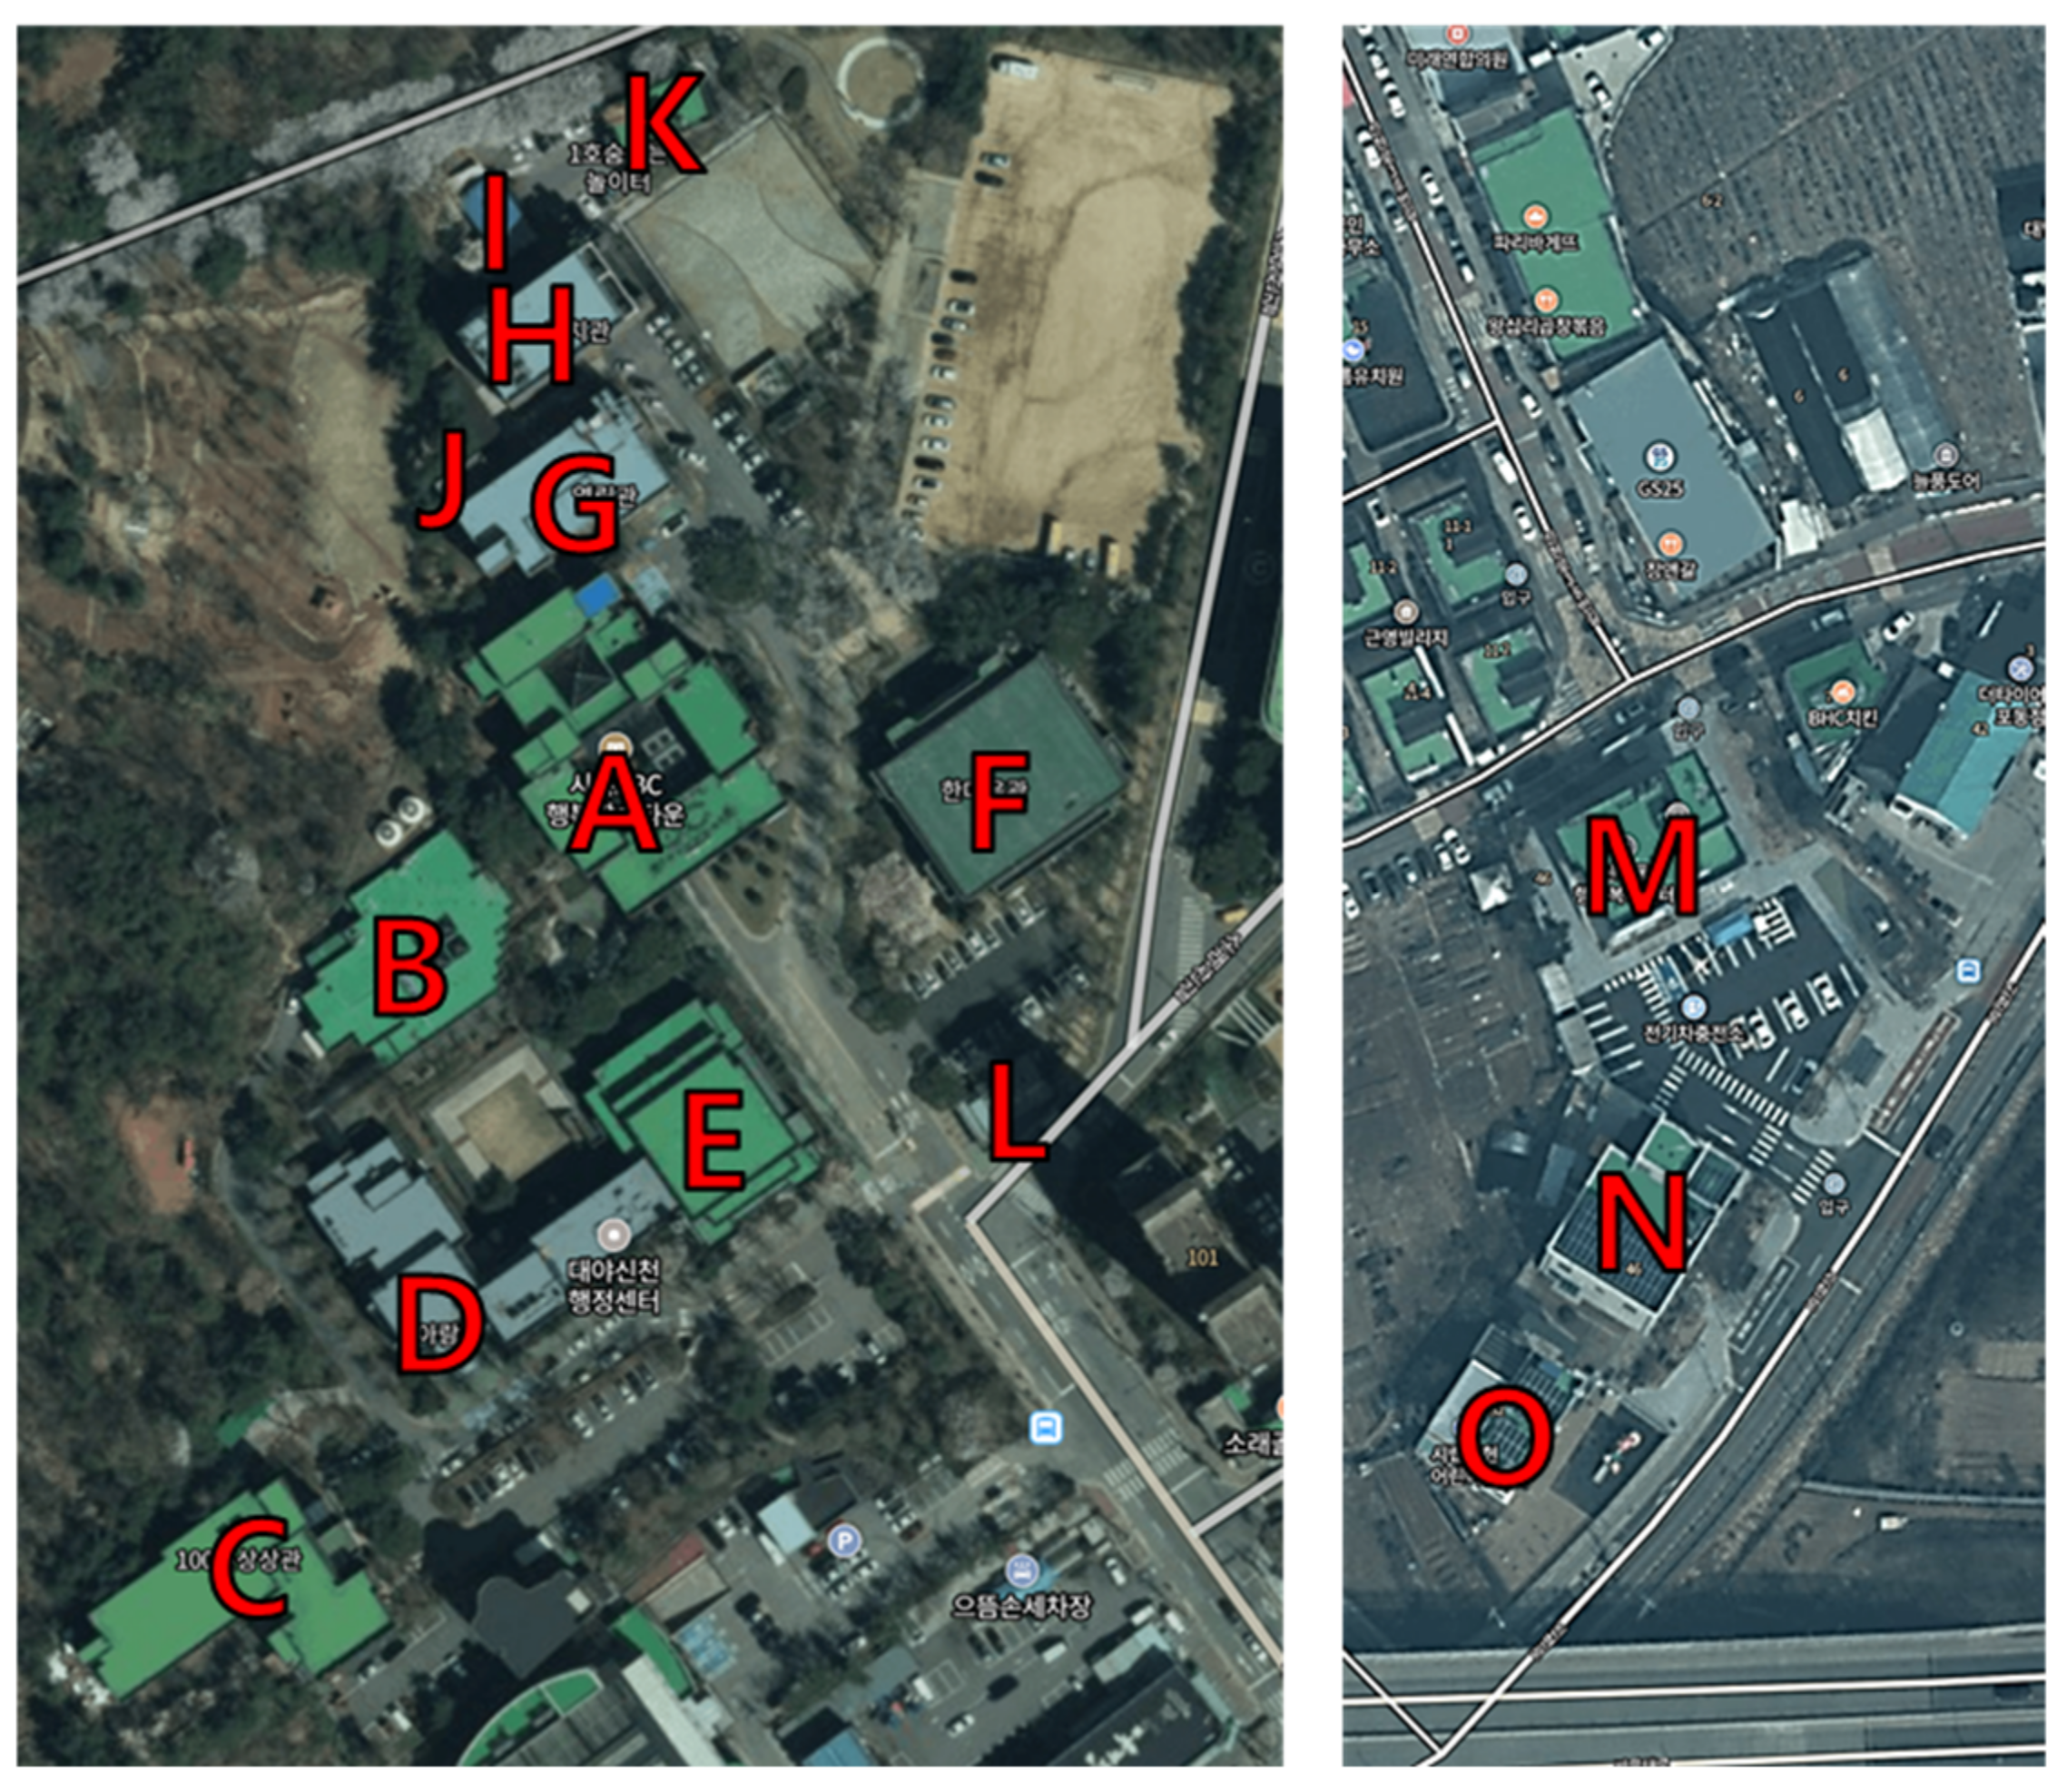
2.1. Target Community

The communities targeted for the installation of the energy-sharing system were Communities I and II, located in Siheung-si, Gyeonggi-do, South Korea. Community I is a complex area of learning, culture, and the arts, with a land area size of 47,253.00 m2, a building area of 8161.85 m2, and a total floor area of 17,809.72 m2. Community I consists of buildings designed for various purposes, including offices, classrooms, exhibition halls, libraries, cafeterias, restaurants, auditoriums, accommodations, theaters, and gymnasiums. Community II consists of a total of three buildings, including two office buildings for administrative and welfare work and one daycare center. Figure 1 shows the building layouts of Communities I and II. Table 1 summarizes the basic information of the buildings, including the usage type, number of floors, and gross floor area. The grid power supply to both communities is provided at a voltage of 22.9 kV (high), three-phase, four-wire system. The contracted power for Community I is 1500 kW. For Community II, Buildings M and N are combined for 250 kW, and the daycare center is contracted separately.
Community I has electrical, mechanical, and disaster prevention rooms located in the basement of Building E, which supplies grid power to each building. Eight primary buildings have a total floor area of >1000 m2. Other smaller buildings, from I to L, are connected to the eight nearby buildings to receive power. In Community II, grid power is supplied to building N and distributed to building M. In building O, it is supplied directly to the electrical room on the first floor.

2.2. System Configuration

Electricity was selected as the shared energy source for the target communities. Therefore, the energy-sharing systems included PV systems, BESSs, and EMSs.
In Community I, three PV systems were installed individually on the rooftops of the three buildings, and one BESS was installed for collective use. The total installed capacity of the PV system within Community I was 105.84 kW. The individual installation capacity was designed to be 45.36 kW in Building C, 37.8 kW in Building E, and 22.68 kW in Building G, considering the installable area and shading. For reference, the PV systems were installed in the form of a solar roof integrated with a rooftop rather than a general structure, considering the insulation, water leakage, and design. Figure 2 shows images of the rooftop PV system installed in each building. The same PV module and inverter were used: a PV module from JA Solar company (Beijing, China, model name JAM54S30 MR, rated output power of 540 W, efficiency of 20.9%) and a grid-connected PV inverter from OPI company (Seoul, Republic of Korea, model name OCIP50-TL3-M3-OD-FM, rated output power of 50 kW, efficiency of 98.3%). The specifications of the rooftop PV systems for the individual buildings are listed in Table 2. The PV power was supplied to the building where the PV system was installed, through a rooftop distribution board. However, because Building E did not have a distribution board on the rooftop, the PV system was connected to the distribution board of Building D, which is adjacent to Building E.
The BESS capacity consisted of a power conversion system (PCS) with a rating of 100.5 kW and a battery with a capacity of 216 kWh. The capacity was designed considering a scale of >5% of the contracted power (>75 kWh), which is the legal BESS installation capacity in Korea, and the total installed capacity of the PV system (105.84 kW); the system was custom-made by KD Power company (Chuncheon-si, Republic of Korea). A BESS consists of a battery pack, PCS (including a DC/DC converter and an AC/DC inverter), a battery management system, and a power management system/EMS. Figure 3 displays the images of the BESS installed in Community I, and Table 3 lists the specifications of the BESS. The BESS was manufactured as a single container type, including firefighting equipment—such as automatic fire warning equipment—automatic fire detection equipment, and discharge equipment. The installation location of the BESS was an empty lot between Building G and the playground, and the BESS was connected to the basement distribution board of Building G. The operating settings were set to a general schedule control with a state of charge of approximately 10–90% charging during light load times and discharging during peak-load times.
Community II has only two PV systems that produce energy. They were installed on the rooftops of Buildings N and O using a general installation method. The PV system of Building N has a capacity of 20.40 kW and used the PV module from Solariver company (Incheon, Republic of Korea, model name SR72DH340C YKMO, rated output power of 340 W, and efficiency of 18.2%) and the PV inverter from KACO company (Neckarsulm, Germany, model name Blueplanet 15.0-20.0 TL3, rated output power of 24 kW, and efficiency of 98.4%). Building O has a capacity of 10.08 kW and used PV modules from S-Energy company (Haman, Republic of Korea, model name SN360N-32, rated output of 360 W, and efficiency of 18.5%) and PV inverters from HEX POWER SYSTEM company (Seoul, Republic of Korea, model name PV-C310ML, rated output of 10.5 kW, and efficiency of 97.37%). Table 4 lists the specifications of the individual PV systems in Community II.
The EMSs were identically constructed in Communities I and II. These measure and provide real-time power supplies and demand-related data for the community, individual buildings, individual rooftop PV systems, and BESSs. Data measurement and collection involved installing hardware in each building and system and transmitting data to a web server in one-second increments through wireless communication. Figure 4 shows images of the EMS hardware installed in Community 1. The hardware included measurement sensors—such as power meters installed in the distribution board, PV system, and ESS of the building—as well as measurement information transmission devices, communication devices, and controllers. The software included a separately developed energy management program, a data storage server, a PC, and a monitor. The hardware and software were separately manufactured products requested from DAEGUNSOFT company (Daejeon, Republic of Korea). Figure 5 presents an image of the EMS software (Community Energy Sharing System 2023 Version) screens. The program consists of screens, such as the real-time data status of the entire community, individual buildings, and each system, past data history inquiries, and statistical analysis information. Historical and analytical data are presented in tables and graphs and can be downloaded as an Excel file.

3. Results and Discussion

3.1. Monthly Energy Analysis

Communities I and II exhibited the highest power consumption in the following order: winter, summer, and spring–fall. Figure 6 summarizes the monthly power consumption and the average for the current and past six years. In Community I, the energy-sharing PV system, ESS, and EMS were installed in October 2022, and Community II had PV installed in 2018 and 2019. The target communities were subject to seasonal and time-based rate systems [24]. However, weekends were measured as medium- and light-load times and applied to the rate. This study analyzed the results of energy-sharing system operations using data from November 2022 to June 2023.
Figure 7a and Table 5 summarize the monthly power consumption, PV power, and ESS charge/discharge power of Community I from November 2022 to June 2023 after the installation of the energy-sharing system. Power consumption is the power supplied from the grid and reflects the power reduction owing to the operation of the energy-sharing system. In Community I, monthly power consumption showed significant savings in spring and fall due to the influence of the PV system. The average monthly power consumption was 125,569.7 kWh, and the PV power was 9637.9 kWh. The BESS experienced mechanical failure in January and February; therefore, excluding that period, the average monthly BESS charging power was 3297.4 kWh, and the BESS discharging power was 3012.0 kWh. The average monthly power consumption reduced was 9403.9 kWh (7.0%), and the power rates were reduced by $905 (8.6%). The power consumption rates were calculated based on the applied rate system. In Table 5, the parentheses express the percentage of reduced power consumption and power rates compared with the total load.
Figure 7b and Table 6 present the monthly power consumption and PV power of Community II. The average monthly power consumption was 10,068.4 kWh, and the PV power was 3351.2 kWh (25.0%). Power consumption was reduced by the installed PV system. Accordingly, the power rates were reduced by $204 (24.5%). The meteorological data given in Table 6 are the average monthly temperature and total solar irradiance at a location (Incheon) similar to the demonstration site (Siheung) provided by the Korea Meteorological Administration [25].
The monthly PV power of the total and individual PV systems in each community is shown in Figure 8. The PV power was the lowest in December, which is winter, and PV power appeared to increase in March, when spring began. Individual PV power was affected by installation conditions, such as the PV module azimuth and inclination angle.
Reducing power consumption leads to a reduction in carbon emission. The average monthly carbon dioxide emissions were 4.464 tCO2 for Community I and 1.591 tCO2 for Community II. Carbon dioxide emissions were calculated by converting power consumption into heat (0.229 10−3 toe/kWh) and using the carbon-emission factor (0.4747 tCO2/MWh).

3.2. Daily Energy Analysis

The power-consumption patterns differed on weekdays, Saturdays, and Sundays because of the influence of weekday working and building use hours in the target communities. When an energy-sharing system was not installed, the power consumption of the buildings was high during the day, beginning from 08:00 AM on weekdays. Figure 9 shows the power consumption and system power of Community I in 1 min increments during specific weeks (21−27 November 2022 and 15–21 May 2023) with fair weather. After the installation of the energy-sharing system, the daily power-consumption pattern decreased during the PV power time (06:00–18:00), increased during the light load time (00:00–05:00), owing to BESS charging, and decreased during the separately set discharge time periods (10:00–12:00, 13:00–17:00), owing to BESS discharge. The BESS in May 2023 was different from that in November 2022 because the operation schedule and output settings were changed in consideration of community operation. Because power consumption was low on Sundays, a large amount of PV power increased the possibility of PV surplus power. The surplus power is expressed as negative power consumption in the graph. On Sunday, 21 May 2023, the BESS was charged, owing to its low power consumption.
The power consumption and PV power of a specific week (8−14 May 2023) for Community II is shown in Figure 10. The PV power time (06:00–18:00) and power consumption time were similar. Surplus power was available on weekends, Saturdays, and Sundays. At the community level, surplus power was available for energy sharing between the two communities on weekends. Energy sharing was thoroughly examined through the building energy reviews of each community.
Figure 11 shows the daily operation characteristics of individual PV systems and power consumption per minute for a specific week (12−18 June 2023) in Buildings C, D, and G. These buildings were supplied with PV power from Community I. The PV surplus power refers to the power remaining after the self-consumption of PV power in individual buildings where PV systems are installed. Through Building D and Building G, PV surplus power was generated not only on weekends but also on weekdays and was shared with surrounding buildings. Notably, Building D underwent maintenance inspection from 18:00 on 12 June to 6:00 on 13 June, showing a different power-demand pattern than usual. For reference, Building G experienced a slight data loss owing to a network issue from 13:00 to 17:00 on weekdays.
In Community II, Buildings N and M shared the PV power of Building N. Figure 12 shows the power patterns of Buildings N, M, and O during a specific week (15–21 May 2023). Surplus PV power was confirmed in Building O, regardless of whether it was a weekday or weekend. In particular, the building was scarcely used on weekends; therefore, the surplus power was considerable. The surplus power in Building O can be shared between Buildings N and M. Even after power is shared between the two buildings, the remaining power can be shared with other communities.
In this study, the analysis data was limited to the first 8 months following the energy-sharing system installation and did not include some summer and fall data. In the future, a detailed annual data analysis will be conducted based on the stabilization of the energy-sharing system operation. Additionally, because the electricity in each targeted community was connected to the mains, confirming which building and how much surplus power was shared was impossible. In addition, research is currently underway to develop and apply sharing and transaction control algorithms for energy-sharing systems.

4. Conclusions

To realize a low-carbon community, this study analyzed the energy from the operation of energy-sharing systems using actual measurement data in one-minute increments for approximately 8 months, from November 2022 to June 2023, in two communities.
The communities comprise resources required for buildings with various purposes. Community I has a total of twelve buildings, and Community II has a total of three buildings. The EMS was installed as the energy-sharing system in each community; in Community I, three PV systems were individually installed on the rooftops of three buildings, and one BESS was installed for collective use. Community II has two rooftop PV systems. Both communities had the highest power consumption in the following order: winter, summer, and spring–fall. The monthly power consumption showed significant savings in spring and fall owing to the influence of the PV system. The daily hourly power-consumption patterns differed on weekdays, Saturdays, and Sundays because of the influence of the weekday working and building use hours of the target community.
After the installation of the energy-sharing system, the daily power-consumption pattern decreased during the PV power time (06:00–18:00), increased during the light load time (00:00–05:00), owing to BESS charging, and decreased during discharge times (10:00–12:00, 13:00–17:00). Because power consumption was low on weekends, the possibility of PV surplus power was high. At the community level, surplus power was available for energy sharing between the two communities on weekends. After a detailed analysis of the buildings within the communities, Buildings D and G of Community I and Building O of Community II produced PV surplus power not only on weekends but also on weekdays and shared it with surrounding buildings.
To address the limitations of the current study, a detailed annual data analysis will be conducted in the future, focused on stabilizing the operation of the energy-sharing system. In addition, algorithms that control individual energy sharing and trading will be demonstrated. The demonstration site in this study focuses on electricity, and implementing energy sharing and trading in connection with other demonstration sites focused on thermal energy is planned. As the installation of renewable energy systems, such as PV systems, in buildings continues to increase in relation to zero-energy buildings, surplus energy is expected to further increase in the future. If energy sharing is expanded not only at the individual building level but also at the community level, it is expected to contribute to reducing carbon emissions and energy use at the national level.

Author Contributions

Methodology, data collection and analysis, visualization, writing—original draft preparation, and editing, J.E.; methodology and data collection, H.L.; conceptualization, methodology, writing—review, and supervision, G.-S.C. All authors have read and agreed to the published version of the manuscript.

Funding

This work was supported by the Korea Agency for Infrastructure Technology Advancement (KAIA) grant funded by the Ministry of Land, Infrastructure and Transport (Grant RS-2019-KA153277).

Data Availability Statement

Data are contained within the article.

Conflicts of Interest

The authors declare no conflict of interest.

References

  1. IPCC (International Panel on Climate Change). Global Warming of 1.5 °C; IPCC (International Panel on Climate Change): Geneva, Switzerland, 2019. [Google Scholar]
  2. IEA (International Energy Agency). Net Zero by 2050: A Roadmap for the Global Energy Sector; IEA (International Energy Agency): Paris, France, 2021. [Google Scholar]
  3. IRENA (International Renewable Energy Agency). Peer-to-Peer Electricity Trading: Innovation Landscape Brief; IRENA (International Renewable Energy Agency): Masdar City, United Arab Emirates, 2020. [Google Scholar]
  4. Merriam-Webster’s Advanced Learner’s English Dictionary. Available online: https://www.merriam-webster.com/dictionary/community (accessed on 11 September 2023).
  5. Eum, J.; Choi, G.S. Case study on the construction and operation of energy sharing systems to realize a low-carbon community. In Architectural Sustainable Environment and Building Systems; Korean Institute of Architectural Sustainable Environment and Building Systems: Seoul, Republic of Korea, 2023; Volume 17, pp. 6–13. [Google Scholar]
  6. Shi, Z.; Han, W.; Zhang, G.; Bai, Z.; Zhu, M.; Lv, X. Research on low-carbon energy sharing through the alliance of integrated energy systems with multiple uncertainties. Energies 2022, 15, 9604. [Google Scholar] [CrossRef]
  7. Liu, C.; Yang, R.; Wang, K.; Zhang, J. Community-Focused Renewable Energy Transition with Virtua Power Plant in an Australian City—A Case Study. Buildings 2023, 13, 844. [Google Scholar] [CrossRef]
  8. Alaifan, B.; Azar, E. Potential for net-zero energy communities in Kuwait an empirical techno-economic modeling and optimization approach. Buildings 2023, 13, 2096. [Google Scholar] [CrossRef]
  9. Pasina, A.; Canoilas, A.; Johansson, D.; Bagge, H.; Fransson, V.; Davidsson, H. Shared PV systems in multi-scaled communities. Buildings 2022, 12, 1846. [Google Scholar] [CrossRef]
  10. Lovati, M.; Zhang, X.; Huang, P.; Olsmats, C.; Maturi, L. Optimal simulation of three peer to peer (P2P) business models for individual PV prosumers in a local electricity market using agent-based modelling. Buildings 2020, 10, 138. [Google Scholar] [CrossRef]
  11. Saarloos, B.A.; Quinn, J.C. Net-Zero energy districts and the grid: An energy-economic feasibility case-study of the national western center in Denver, CO, USA. Buildings 2021, 11, 638. [Google Scholar] [CrossRef]
  12. Luz, G.P.; Silva, R.A. Modeling energy communities with collective photovoltaic self-consumption: Synergies between a small city and a winery in Portugal. Energies 2021, 14, 323. [Google Scholar]
  13. Shrestha, A.; Bishwokarma, R.; Chapagain, A.; Banjara, S.; Aryal, S.; Mali, B.; Thapa, R.; Bista, D.; Hayes, B.P.; Papadakis, A.; et al. Peer-to-Peer energy trading in micro/mini-grids for local energy communities: A review and case study of Nepal. IEEE Access 2019, 7, 131911–131928. [Google Scholar] [CrossRef]
  14. Kim, D.; Heo, J.; Kim, M.; Lee, D. Operational result analysis of renewable heat energy system in eco-friendly energy town. J. Korean Sol. Energy Soc. 2021, 41, 51–62. [Google Scholar] [CrossRef]
  15. Kim, M.H.; Kim, D.; Heo, J.; Lee, D.W. Techno-economic analysis of hybrid renewable energy system with solar district heating for net zero energy community. Energy 2019, 187, 115916. [Google Scholar] [CrossRef]
  16. Kim, M.H.; An, Y.; Joo, H.J.; Lee, D.W.; Yun, J.H. Self-sufficiency and energy savings of renewable thermal energy systems for an energy-sharing community. Energies 2021, 14, 4284. [Google Scholar] [CrossRef]
  17. An, Y.S.; Kim, H.; Kim, J.; Kim, M.H. Renewable energy penetration rate investigation of low carbon energy sharing residential community with building integrated photovoltaic systems. Korean J. Air-Cond. Refrig. Eng. 2023, 7, 20–27. [Google Scholar]
  18. An, Y.S.; Kim, J.; Joo, H.J.; Han, G.W.; Kim, H.; Lee, W.; Kim, M.H. Retrofit of renewable energy systems in existing community for positive energy community. Energy Rep. 2023, 9, 3733–3744. [Google Scholar] [CrossRef]
  19. Liu, C.; Wang, Z.; Yu, M.; Gao, H.; Wang, W. Optimal peer-to-peer energy trading for buildings based on data envelopment analysis. Energy Rep. 2023, 9, 4604–4616. [Google Scholar] [CrossRef]
  20. Gul, E.; Baldinelli, G.; Bartocci, P.; Bianchi, F.; Piergiovanni, D.; Cotana, F.; Wang, J. A techno-economic analysis of a solar PV and DC battery storage system for a community energy sharing. Energy 2022, 244, 123191. [Google Scholar] [CrossRef]
  21. Zheng, S.; Huang, G.; Lai, A.C. Techno-economic performance analysis of synergistic energy sharing strategies for grid-connected prosumers with distributed battery storages. Renew. Energy 2021, 178, 1261–1278. [Google Scholar] [CrossRef]
  22. Huang, P.; Sun, Y.; Lovati, M.; Zhang, X. Solar-photovoltaic-power-sharing-based design optimization of distributed energy storage systems for performance improvements. Energy 2021, 222, 119931. [Google Scholar] [CrossRef]
  23. Eum, J.Y.; Choi, G.S.; Hong, G. Development of energy sharing scenarios between buildings for low-carbon community. J. Korean Soc. Living Environ. Syst. 2022, 29, 604–612. [Google Scholar] [CrossRef]
  24. Korea Electric Power Corporation (KEPCO). Electric Rates Table. Available online: https://cyber.kepco.co.kr/ckepco/front/jsp/CY/E/E/CYEEHP00102.jsp (accessed on 30 August 2023).
  25. Korea Meteorological Administration (KMA). Past Observation. Available online: https://www.weather.go.kr/w/obs-climate/land/past-obs/obs-by-day.do (accessed on 21 September 2023).
Figure 1. Building layout of Communities I (left) and II (right): The English characters from A to O are the names of the buildings.
Buildings 13 02797 g001
Figure 2. Images of rooftop photovoltaic (PV) systems in Community I.
Buildings 13 02797 g002
Figure 3. Images of the battery energy storage systems (BESSs) in Community I.
Buildings 13 02797 g003
Figure 4. Installation images of EMS hardware in Community I.
Buildings 13 02797 g004
Figure 5. Screen-capture images of the EMS software (Community Energy Sharing System 2023 Version).
Buildings 13 02797 g005
Figure 6. Monthly power consumption and average for the current and past six years.
Buildings 13 02797 g006
Figure 7. Monthly power consumption and energy-sharing system (PV, BESS) power.
Buildings 13 02797 g007
Figure 8. Monthly PV power of individual PV systems.
Buildings 13 02797 g008
Figure 9. Daily operation characteristics of the energy-sharing system (PV, BESS) and power consumption within Community I.
Buildings 13 02797 g009
Figure 10. Daily operation characteristics of the energy-sharing system (PV) and power consumption within Community II (8−14 May 2023).
Buildings 13 02797 g010
Figure 11. Daily operation characteristics of individual PV systems and power consumption within Community I (12−18 June 2023).
Buildings 13 02797 g011
Figure 12. Daily operation characteristics of individual PV systems and power consumption within Community II (8−14 May 2023).
Buildings 13 02797 g012
Table 1. Information about buildings in Communities I and II.
CommunityBuildingUsage TypeFloorsGross Floor Area (m2)
IAOffice, Classroom, Exhibition roomThree floors,
one basement floor
3916.58
BLibrary, Cafeteria, RestaurantTwo floors,
one basement floor
1103.08
CAccommodation, Seminar roomThree floors,
one basement floor
2743.36
DOffice, Classroom, Exhibition room, TheaterThree floors,
one basement floor
2732.87
EAuditoriumTwo floors,
one basement floor
1808.69
FGymnasiumTwo floors1357.22
GOfficeThree floors,
one basement floor
2013.18
HOfficeFour floors1485.05
IWorkshopOne floor98.00
JWorkshop warehouseOne floor71.50
KIndoor children playgroundTwo floors302.40
LCitizen’s LoungeOne floor97.83
IIMOfficeTwo floors,
one basement floor
678.81
NOffice, AuditoriumTwo floors668.02
ODaycare centerTwo floors398.36
Table 2. Specifications of the PV system for individual buildings in Community I.
CategoryBuilding CBuilding EBuilding G
ArrayCapacity [kW]45.3637.8022.68
Module quantity [ea]847042
Array Configuration14 series × 6 parallel14 series × 5 parallel14 series × 3 parallel
Module inclination angle and Azimuth0° South, 15° North7° East, 7° West0° South, 15° North, 7° East
ModuleRated output power [W]540
Efficiency [%]20.90
Open voltage [V]49.60
Short-circuit current [A]13.86
Maximum output voltage [V]41.64
Maximum output current [A]12.97
Cell typemonocrystalline
Size [mm]2279 × 1134 × 35
Weight [kg]28.6
InverterRated output power [kW]50
Efficiency [%]98.30
DC input voltage range [V]200–1000
MPPT voltage range [V]480–800
MPPT: Maximum power point tracking.
Table 3. Specifications of the BESSs in Community I.
ComponentContent
PCSRated output power [kW]100.5
Efficiency [%]>95%
DC input voltage range [V]600–1010
Rated output voltage [V]three-phase 380 V
BatteryCapacity [kWh]216
Nominal voltage [V]≥725
Operating voltage range [V]580–1000
Efficiency [%]>95%
TypeLithium-ion
C-rate≥0.5C (SOC 10–90%)
LifespanOver 3500 cycles
BMS
-
Collection and display of battery information
-
(cell voltage, current, temperature, SOC, SOH, etc.)
-
Cell-balancing control
-
Protection for overvoltage, undervoltage, overcurrent, etc.
PMS/EMS
-
Collection and display of BMS information
-
Collection and display of PCS information (status, operation, etc.)
-
Provides PCS control and setting functions
BESS room
-
Container type
-
Including electricity, heating, cooling, and fire extinguishing equipment
SOC: State of charge; SOH: State of health; BMS: Battery management system; PMS: Power management system; EMS: Energy management system; PCS: Power conversion system.
Table 4. Specifications of PV systems for individual buildings in Community II.
CategoryBuilding NBuilding O
ArrayCapacity [kW]20.4010.08
Module quantity [ea]6028
Array Configuration15 series × 4 parallel14 series × 2 parallel
Module inclination angle and Azimuth25° Southwest20° Southwest
ModuleRated output power [W]340360
Efficiency [%]18.2018.50
Open voltage [V]37.6047.00
Short-circuit current [A]9.059.72
Maximum output voltage [V]46.1639.10
Maximum output current [A]9.459.21
Cell typemonocrystalline
Size [mm]1918 × 974 × 481970 × 990 × 40
Weight [kg]21.223
InverterRated output power [kW]2410.5
Efficiency [%]98.4097.37
DC input voltage range [V]200–950400–900
MPPT voltage range [V]515–800450–720
Table 5. Monthly consumption power, PV power, BESS charge/discharge power, and power-saving rates of Community I.
Month-YearPower
Consumption [kWh]
PV
Power [kWh]
BESS Charging Power [kWh]BESS Discharging Power [kWh]Power Saving [kWh]Power-Saving Rates [USD]
11-202293,957.78132.63234.62956.47854.4 (7.7%)810 (10.2%)
12-2022211,577.45672.93226.52950.65397.0 (2.5%)604 (3.6%)
01-2023202,939.67297.3463.5306.57140.3 (3.4%)676 (3.9%)
02-2023161,240.48934.11195.51193.38931.9 (5.2%)932 (6.6%)
03-2023118,816.112,371.03498.03198.212,071.2 (9.2%)980 (11.4%)
04-202375,513.010,279.43174.52910.910,015.8 (11.7%)805 (14.3%)
05-202364,182.910,379.03349.32873.99903.6 (13.4%)781 (14.5%)
06-202376,330.914,036.63301.43301.413,917.2 (15.4%)1650 (19.2%)
Table 6. Monthly weather data, power consumption, PV power, and power-saving rates of Community II.
Month-YearAverage Temperature [℃],
Solar Irradiance [kWh/m2]
Power Consumption [kWh]PV Power
(Power Saving) [kWh]
Power-Saving Rates [USD]
11-202210.2, 82.87373.32720.7 (27.0%)155 (28.2%)
12-2022−2.6, 74.017,326.42551.9 (12.8%)164 (12.8%)
01-2023−1.6, 80.517,388.82800.1 (13.9%)191 (14.8%)
02-20231.6, 100.013,603.13206.4 (19.1%)206 (16.4%)
03-20238.1, 142.18632.23963.0 (31.5%)232 (33.7%)
04-202312.7, 141.85231.33544.7 (40.4%)169 (42.4%)
05-202318.0, 173.34639.74151.2 (47.2%)198 (49.1%)
06-202321.8, 173.96342.53871.5 (37.9%)314 (39.8%)
Disclaimer/Publisher’s Note: The statements, opinions and data contained in all publications are solely those of the individual author(s) and contributor(s) and not of MDPI and/or the editor(s). MDPI and/or the editor(s) disclaim responsibility for any injury to people or property resulting from any ideas, methods, instructions or products referred to in the content.

