Article

Assessing Distributional and Perceived Equity of Urban Green Spaces in Qingdao’s Historic Urban Area

College of Architecture and Urban Planning, Qingdao University of Technology, Qingdao 266033, China
*
Author to whom correspondence should be addressed.
Buildings 2023, 13(11), 2822; https://doi.org/10.3390/buildings13112822
Submission received: 4 October 2023 / Revised: 31 October 2023 / Accepted: 2 November 2023 / Published: 10 November 2023
(This article belongs to the Section Architectural Design, Urban Science, and Real Estate)

Abstract

:
Urban green spaces (UGSs) satisfy citizens’ physical and psychological demands and are considered an integral part of sustainable urban development. However, the distribution of UGS is often uneven, especially in historic urban areas with high building density and limited facilities, thus leading to issues of green inequity. This study examines two dimensions of green equity in Qingdao’s historic urban area, distributional equity and perceived equity, based on a fine-grained division of units and districts. Distributional equity is analyzed using the Gaussian two-step floating catchment area (G2SFCA) method and Gini coefficient to accurately calculate the equity in distribution and accessibility of UGSs. The perceived equity is assessed through the green view index (GVI) and location quotient of the streets, which represents citizens’ visual perception of green quality. Based on these analyses, a dual-perspective evaluation model of green equity is conducted, and the results show a significant imbalance of greenery supply and population demand in the historical urban area of Qingdao. This disequilibrium in green spaces leads to 62.20% of people living with low green equity, while only 8.12% experience high green equity. To maximize social justice, priority should be given to improving the 15 districts with low green equity; doing so could effectively reduce green inequity within historic urban areas where facilities and resources are relatively scarce, thereby improving the efficiency of urban renewal efforts.

1. Introduction

Urban green spaces play a crucial role in enhancing the quality of urban life, particularly by promoting environmental sustainability and improving human well-being [1,2]. Multiple studies have provided confirmation that urban green spaces, including parks of various sizes and street greenery, can be considered as biophilic elements. These elements positively impact human health and influence neurological reactions, while also promoting social inclusion [3,4,5]. Considering the numerous benefits they provide, UGSs have become an essential resource for urban residents that they should have equal access to, as well as fair enjoyment of. This aligns with the goal of biophilic urbanism [6].
The distribution of UGSs in China is still uneven. The cities with low economic developments tended to have better urban green space availability than developed cities [7,8], which exemplifies environmental injustice. Additionally, this issue is particularly evident in historic urban areas where resources are more concentrated. The narrow roads and complex internal functions lead to more prominent issues like high population density, traffic congestion, and a poor green space environment compared to other areas in the city [9]. Taking Qingdao as an example, according to the “Statistical Bulletin on National Economic and Social Development of Qingdao”, the green coverage rate of the city’s built-up areas was 45.2%, with a per capita park green space area of 17.4 square meters at the end of 2022 [10]. However, the per capita park green space area in the historic urban areas is only 6.67 square meters, indicating a highly unequal development. Many studies have confirmed that the equity of UGSs has an increasing trend from the city center to the fringe of the city [11,12,13]. Consequently, the historic urban area in the city center requires a more urgent analysis and optimization of green space equity compared to the newly developed areas of the city.
People prefer UGS within walking distance, making spatial distribution the main factor influencing the use of green space. According to Alexander [14], urban green spaces are most frequently used within a three-minute walk or within a two-to-three-block radius of 250 m, which is considered a typical threshold value. After a distance exceeding 300 m, the frequency of use starts to decline [15,16]. However, given the current land use and planning situation in China, achieving a three-minute green walking circle is difficult. Therefore, in the Chinese context, the government has proposed the idea of a fifteen-minute living and walking circle with a service radius of 800–1000 m [17]. Existing studies assess the spatial distribution of urban green spaces by evaluating their accessibility [18,19,20,21]. Early measurement approaches, such as the buffer analysis method [22], gravity model [23], nearest neighbor distance method [24], and network analysis method [25], lacked consideration of residents’ needs or supply capacity. By effectively incorporating both supply and demand factors in evaluating accessibility, the latest two-step floating catchment area (2SFCA) method addresses these previous limitations, and has been widely used in recent studies [26,27,28]. Improved models and methods have emerged based on it, including the Gaussian two-step floating catchment area (G2SFCA) method, providing a comprehensive assessment of accessibility [29,30]. Furthermore, the Gini coefficient has also been proven to be an effective indicator for evaluating the social equity of UGSs. Compared to accessibility evaluation, the Gini coefficient can more intuitively reflect equity and does not require data visualization [31]. Therefore, in the latest studies, the combination of accessibility modeling and Gini coefficient analysis has become the trend for evaluating the equity in the spatial distribution of UGSs. Ren [32] measured community-level park accessibility using Gaussian-based 2SFCA accessibility and explored geographic and social inequities by calculating the Gini index and conducting correlation analysis. Chen [13] applied the G2SFCA method and Gini coefficient to evaluate the accessibility and equity of UGS in order to optimize and simulate the spatial patterns of UGS. In summary, compared to others, the G2SFCA method is more scientific and accurate in assessing UGS accessibility by integrating a distance-decay function and considering the supply scale and population demand of green spaces [33]. The application of Lorenz curves and the Gini index is to assess the evenness of UGS accessibility [34]. The combination method provides a more accurate and comprehensive assessment to evaluate and compare the distributional equity of UGS.
Urban green spaces include street greenery (e.g., street trees, shrubs, and grasslands), parks, gardens, and forests [35]. Previous research had mainly focused on the spatial equity of urban green space distribution based on information about parks, while there has been insufficient attention given to the equity of street greenery, which is closely related to people’s daily travel. Traditionally, the quality of street greenery is typically assessed through questionnaires [36] or field audits [37], both of which are time-consuming and labor-intensive. More efficient approaches assess the density of green by using remote sensing images to explore the normalized difference vegetation index (NDVI) from an overhead perspective [38,39]. However, studies have found that measurements taken from an aerial view primarily focus on the quantity of green space rather than people’s perceptions and may not accurately represent the visual experience and actual greenness perceived by residents compared to eye-level perspectives [40,41]. Based on the reviewed articles, the green view index (GVI) represents an eye-level visual of greenness and is more related to people’s actual perceived greenness and psychological perceptions [42]. It begins in the field of environmental psychology and has proven to be an effective method for assessing street greenery [43,44]. The availability of street view data and advancements in deep learning and semantic segmentation techniques have provided a strong foundation for conducting large-scale studies on street-level GVI [45,46]. Based on these techniques, the method can be further applied to understand green inequality and environmental injustice [47]. Studies have shown a positive correlation between the visual quality of street greenery and human environmental perceptions [48,49,50]. An analysis between urban greenery and human visual perceptions has been conducted using GVI [51,52,53]. It has been proven by many scholars that streets with a GVI greater than 25% will generate positive visual perceptions of greenery [46,54,55]. In conclusion, unlike distributional equity, the evaluation of GVI has enabled assessments of green equity from a visual and perceived perspective.
Few studies have examined both the distributional and perceived equity of urban green spaces in the same context. Therefore, this study focuses on the historic urban area of Qingdao as the study area. Distributional equity is analyzed using the G2SFCA method and Gini coefficient to accurately calculate the equity in distribution and accessibility of UGSs. After that, GVI and location quotient are applied to assess the perceived equity of street greenery, which represents citizens’ visual perception of green quality. Finally, by integrating the data, the spatial pattern of green equity in the Qingdao historic urban area is obtained. This paper aims to precisely measure green equity, identify unequal regions, explore influential factors, and ultimately address urban green equity. It will provide a refined perspective for urban renewal, thereby enhancing the well-being of residents.

2. Materials and Methods

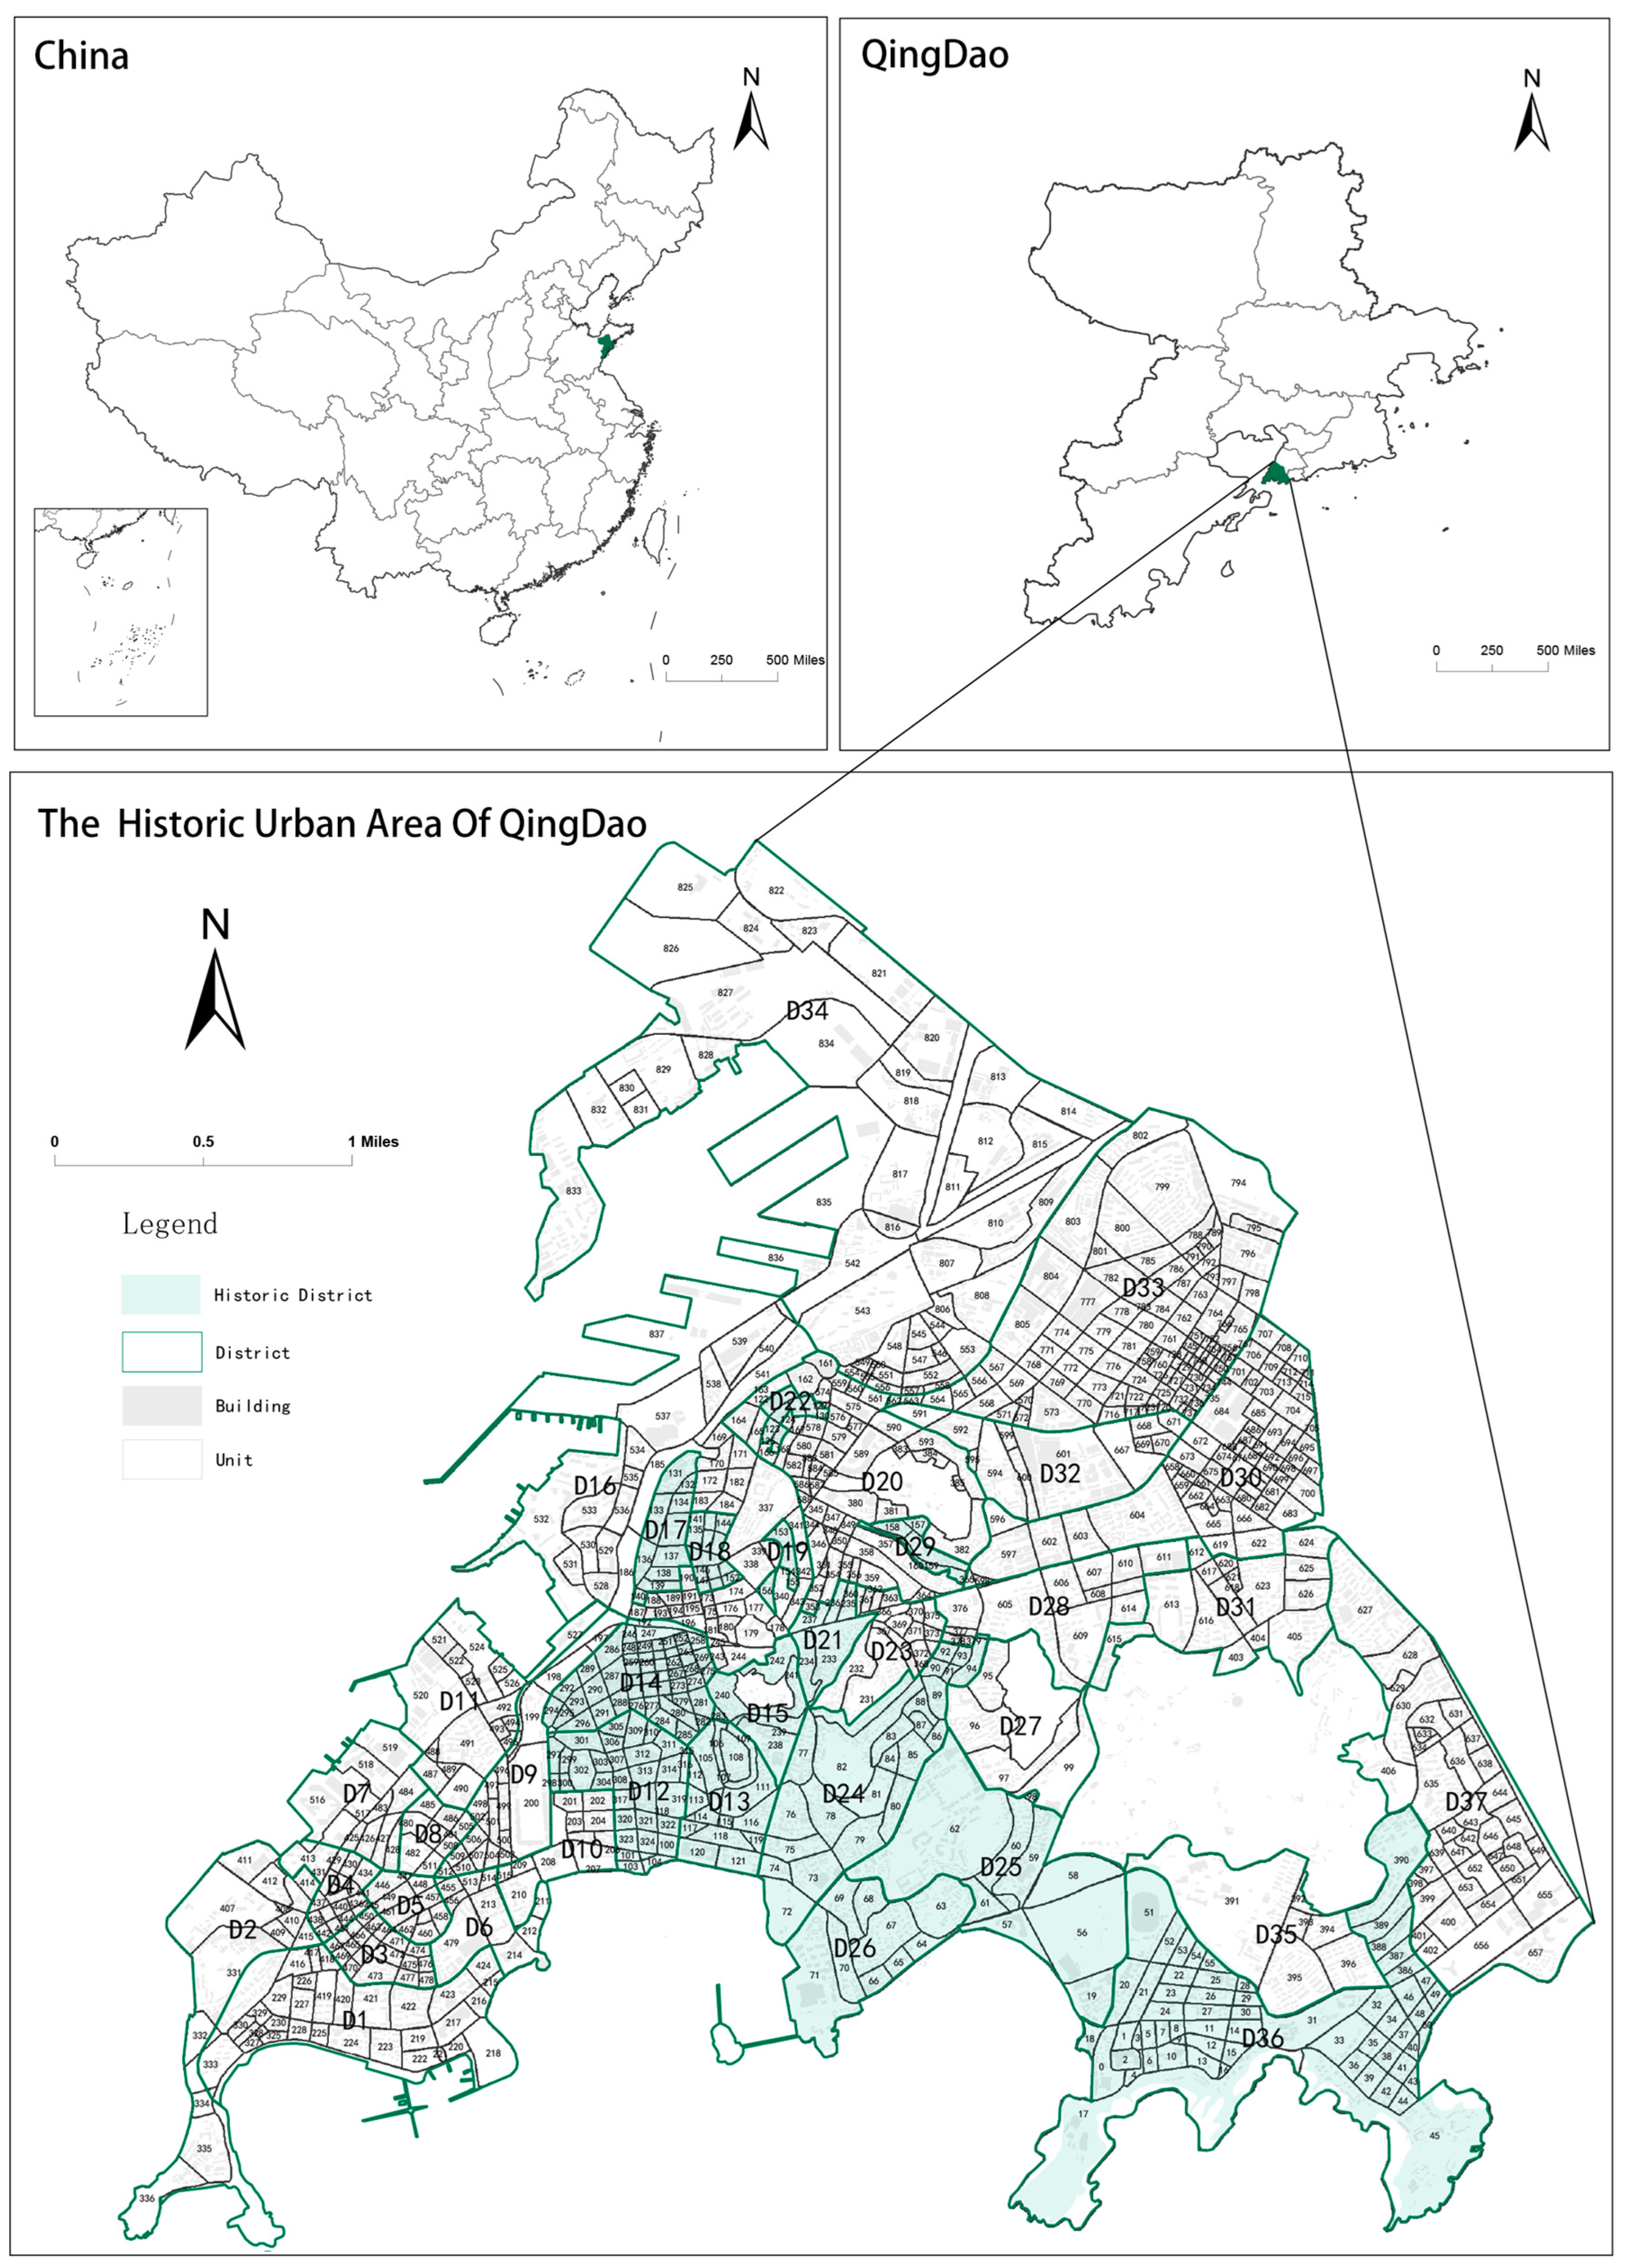
2.1. Study Area and Data

Qingdao, located in the southern part of the Shandong Peninsula, is a renowned leisure tourism city in China. In particular, the historic urban area of Qingdao, with its rich coastal public spaces, undulating hills, and unique cultural history, has great tourism appeal. The current population of the area is 506,000, with a population density of approximately 18,000 people per square kilometer. The millions of tourists that visit Qingdao each year only exacerbate the issue of green inequity within the area, making the contradiction between overpopulation and insufficient greenery even more pronounced. Therefore, while developing cultural tourism, efforts should be made to improve both the quantity and quality of green spaces in order to enhance the green environment in the historic urban area. The study focuses on the historic urban area of Qingdao, which covers approximately 28 square kilometers, including 14 existing historic districts according to the Qingdao Historic and Cultural City Protection Plan (2020–2035) issued by the government. The units are divided based on the principle of being enclosed by secondary roads. Within the research scope, 37 districts were divided and further subdivided into 851 units, marked with numbers ranging from 1 to 851 (Figure 1).
Distributional equity is measured based on quantity and distribution data of urban green space and population. According to the Urban Green Spaces Classification Standard CJJ/T 85-2017 [56], parks are divided into comprehensive parks, theme parks, community parks, and leisure parks. The data on green space shape and location, as well as road network data, were collected from Amap. A total of 10 comprehensive parks, 47 theme parks, 8 community parks, and 3 leisure parks are selected, with a total green space area of approximately 3.32 square kilometers. The spatial distribution of UGSs is shown in Figure 2. This project collects residential data from the Anjuke and Lianjia platforms within the historic urban area of Qingdao. After data collection, the residential communities under construction and unoccupied areas were excluded. A total of 345 residential units were identified (Figure 2). Using the average of 2.55 people per household as the standard, as reported in the Seventh National Census of Qingdao (http://qdsq.qingdao.gov.cn, accessed on 21 September 2022), the population of each residential area was calculated.
This project utilizes Baidu Street View (BSV) images as the main data source for calculating perceived equity. The road network was obtained using OpenStreetMap 5.1 and ArcGIS 10.3. Street sample points were set every 60 m, and the latitude and longitude coordinates of each point were extracted. Additionally, Python was used to access various street sample points and retrieve 360° panoramic street images using the Baidu Map Panoramic Static Image API 2.0, with a shooting angle of 0° (horizontal view). After verification, 2857 street sample points were selected in the historic urban area of Qingdao, and approximately 2857 valid BSV images were obtained (Figure 2). These street view images were captured in August 2020 and have a resolution of 3276 × 819 pixels.

2.2. Evaluating Distributional Equity of UGS

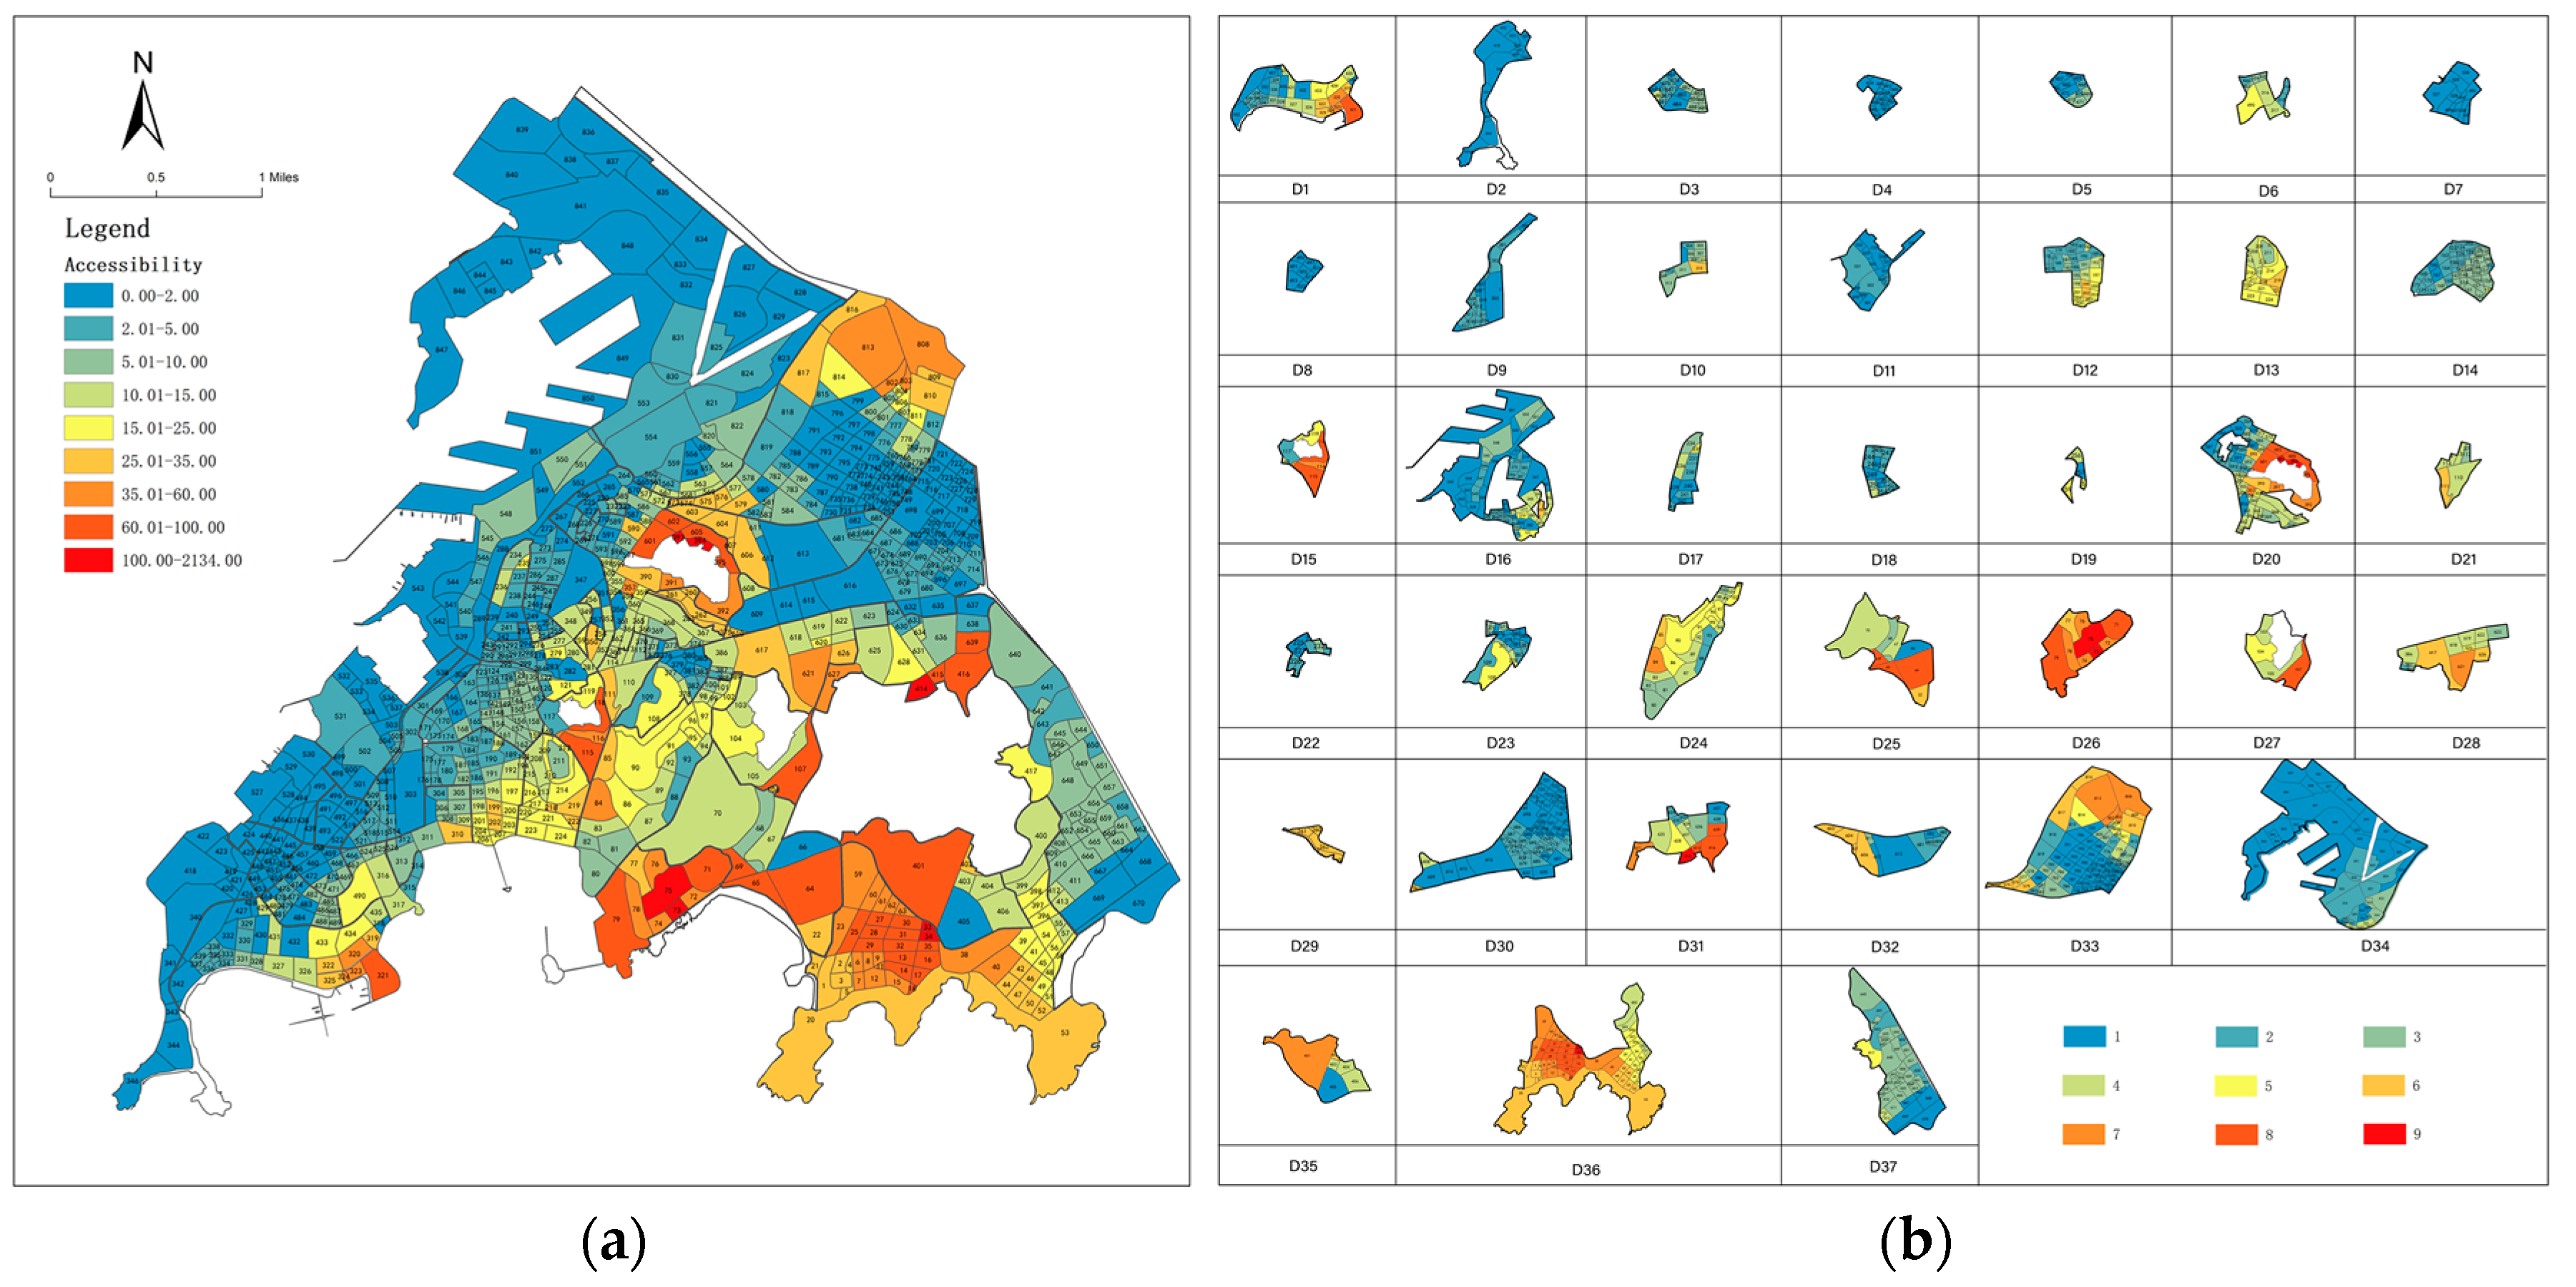
2.2.1. Accessibility of UGS: G2SFCA Method

G2SFCA accessibility considers both supply and demand factors to comprehensively and accurately calculate the accessibility of urban green spaces [13,32]. The approach is performed in two steps. Firstly, the supply–demand ratio is evaluated. The distance threshold ( d 0 ) for each green space (j) is determined by calculating the population demand within the threshold range. The Gaussian function (G) can be used to assign weights according to the distance decay function.
R j = S j k d k j d 0 G d i j P k
In the formula, R j is the park-to-population ratio within a certain radius, and represents the supply; S j is the size of the green space (j); P k is the population at location (k), and represents the demand; d k j is the distance between the supply and the demand points; d 0 is set to 1 km according to the fifteen-minute living and walking circle proposal [17]; and G d i j is the Gaussian equation:
G d i j = e 1 2 × d y d 0 2 e 1 2 1 e 1 2 ,               d i j d 0 0 ,                                                       d i j > d 0  
Secondly, accessibility is calculated by searching all parks within the threshold range for each demand point (i). The park’s supply–demand ratio ( R j ) is multiplied by the Gaussian function to obtain the accessibility index ( A i D ) of each demand point. A higher value indicates a higher level of accessibility.
A i D = j d i d 0 G d i j R j

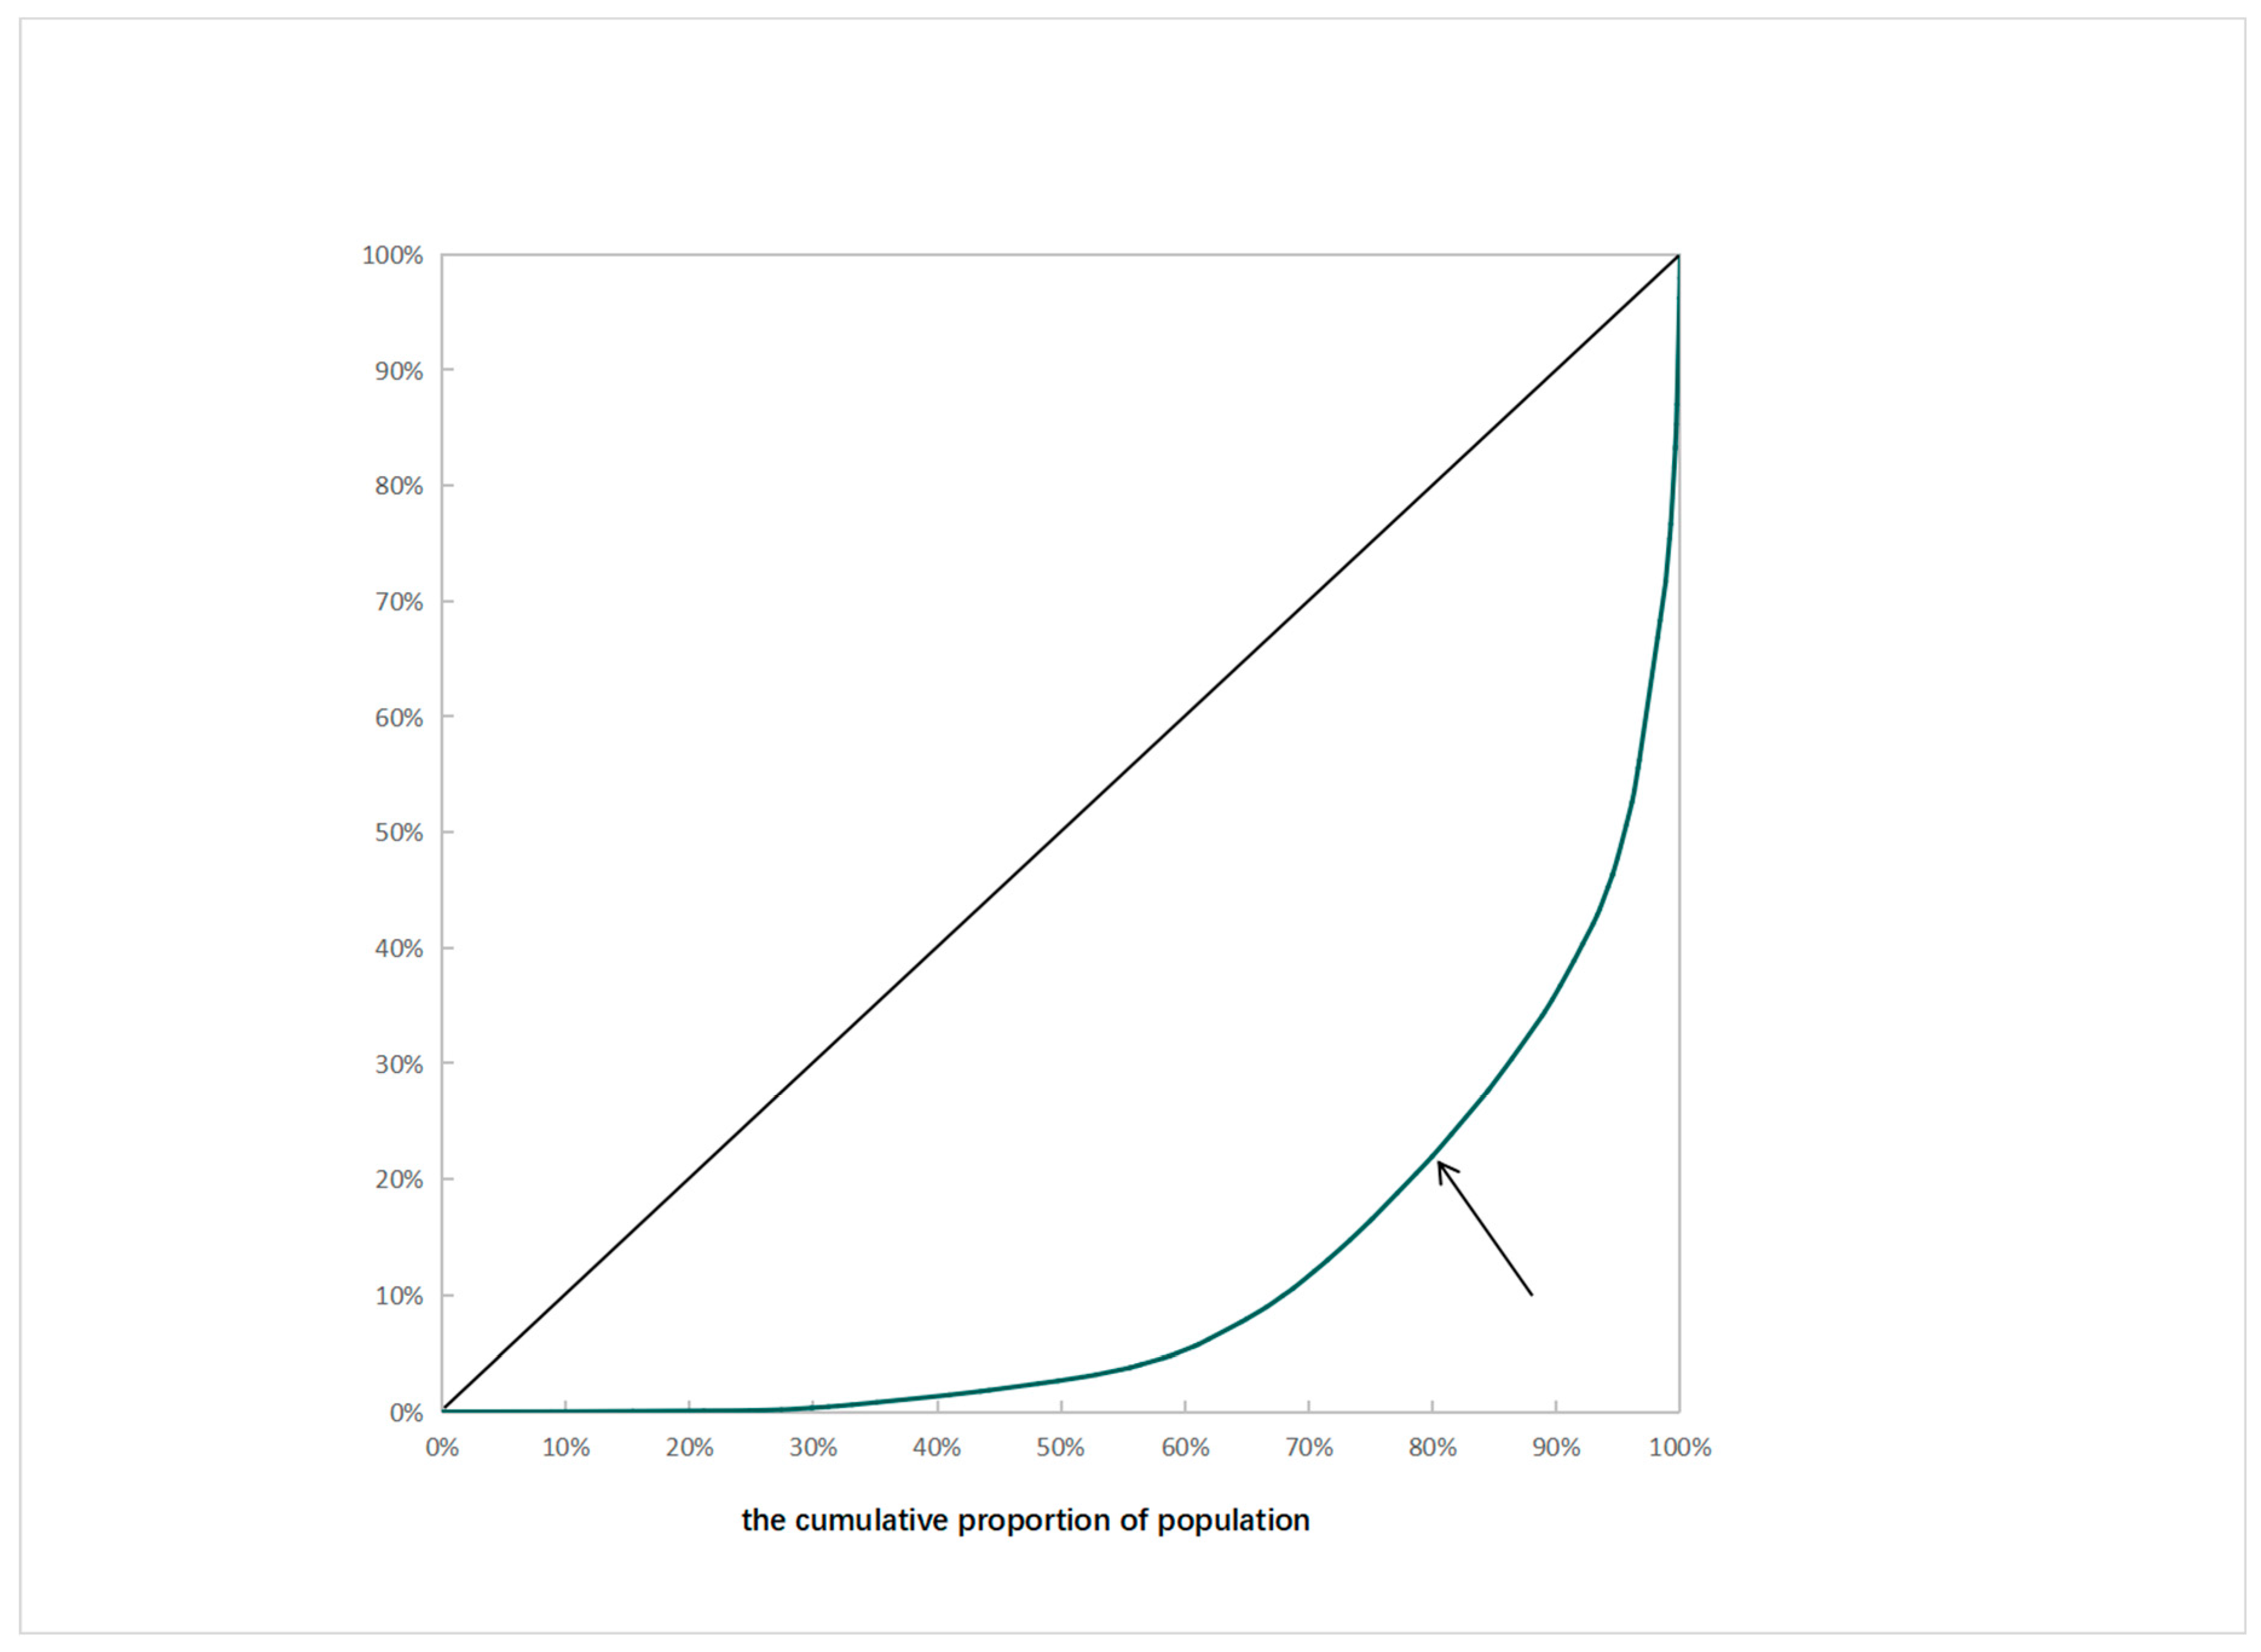
2.2.2. Equity of UGS: Lorenz Curve and Gini Index

The Gini coefficient and the Lorenz curve have a wide range of applications in evaluating the level of public resource services. The Gini coefficient is based on the Lorenz curve, which plots the cumulative proportion of the population and accessibility. The line of perfect equality is represented by a 45° angle, and the Gini coefficient is calculated by measuring the ratio of the area between the 45° line and the Lorenz curve. The formula is as follows:
G = 1 n = 1 k P n P n 1 A n + A n 1
where n = 1, 2, 3, …, k represents the number of streets; P n is the cumulative proportion of population; and A n is the cumulative proportion of green space accessibility. The Gini coefficient typically ranges from 0 to 1. A higher Gini coefficient indicates a more inequitable distribution of UGSs.

2.3. Evaluating Perceived Equity of UGS

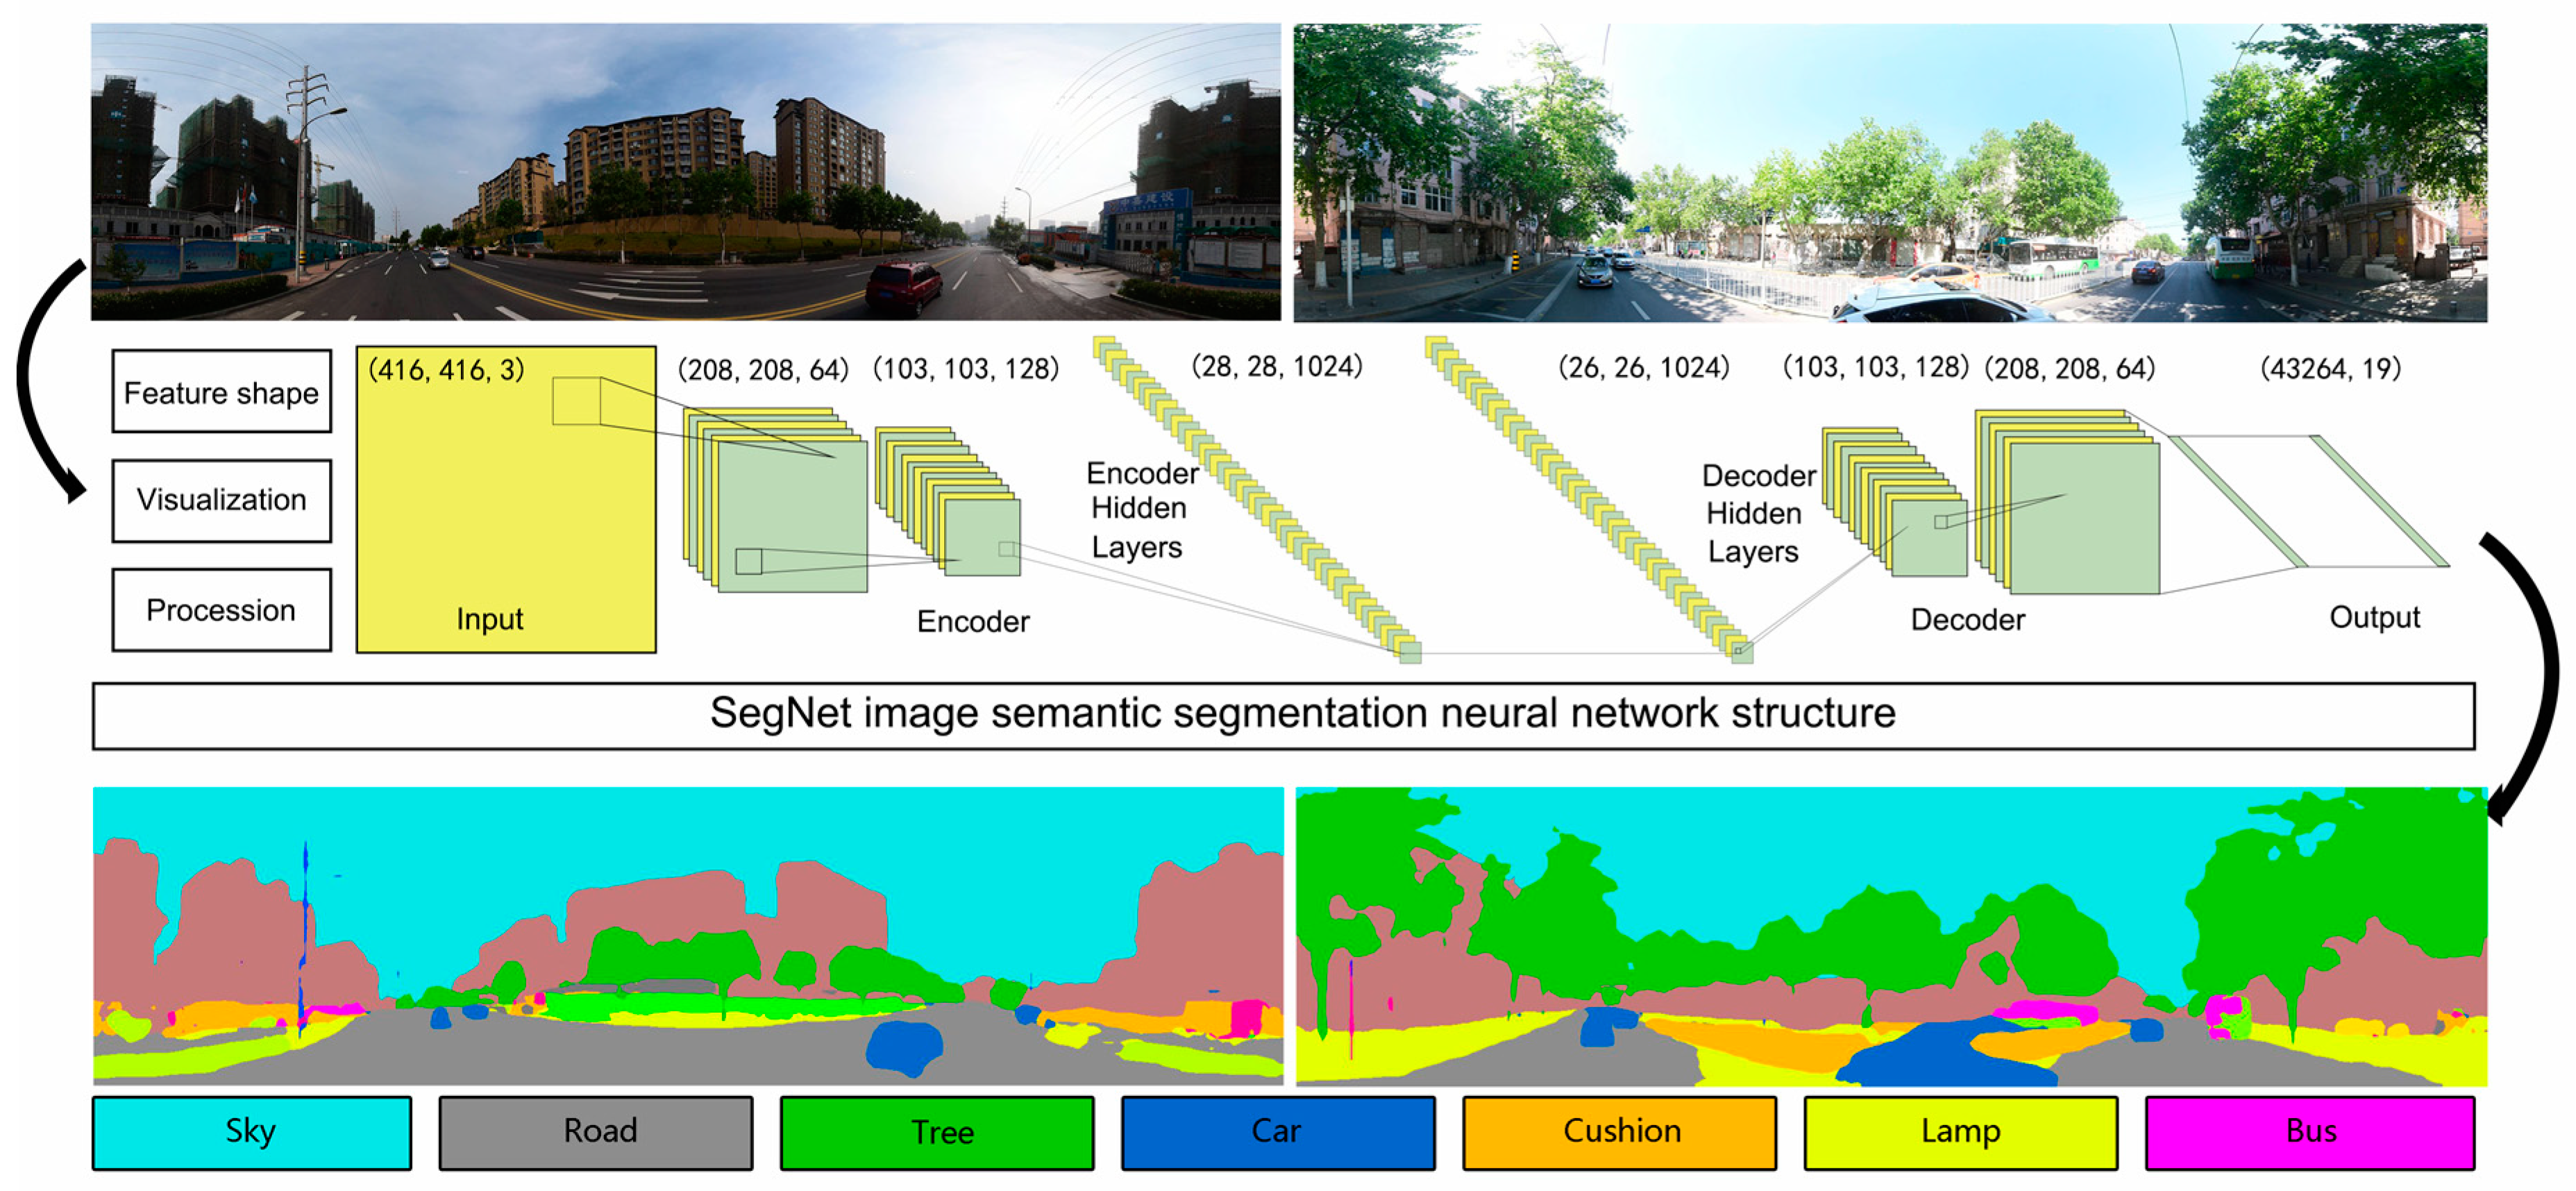
2.3.1. Visual Perception of UGS: Green View Index

The green view index (GVI) represents the proportion of greenery within the field of view, and is a metric used to quantify the visual perception of greenery in streets. In this study, the visibility of street greenery was analyzed using semantic segmentation (SegNet), a convolutional neural network based on machine learning algorithms, to extract image features. The greenery information extracted by the SegNet model is complete and retains details well, as shown in Figure 3. By calculating the proportion of pixels representing the sky, sidewalk, road, buildings, and greenery in 2857 existing images, the GVI is derived using the following formula:
G j = i = 1 4 g i j i = 1 4 A i j × 100 %
where G j is the GVI at sample point (j); g i j is the pixel area of greenery at sample point (j) at angle (i); and A i j is the pixel area of the entire image.

2.3.2. Equity of GVI: Location Quotient

The location quotient is a widely used indicator that studies the spatial distribution of specific features and is now widely used in evaluating the equity of green spaces [33]. The location quotient is the ratio of the green visibility of the population in a street to the green visibility of the population in the entire research area. This measurement can effectively reflect the distribution and equity of the GVI. The formula is as follows:
Q i = q i p i / q p
where Q i is the location quotient of sample point (i); q i and p i are the GVI and population at sample point (i), respectively; and q and p denote the GVI and population of the entire area, respectively. If the location quotient is greater than 1, it indicates that the GVI of the location is higher than the average value of the research area. The larger the value, the greater the green visibility.

3. Results

3.1. Distributional Equity of UGS

Based on the G2SFCA method, an origin–destination (OD) cost matrix was used to analyze the accessibility of 345 residential units in the Qingdao historic urban area by walking, with a travel time threshold of 15 min. The park accessibilities of 851 units were classified into nine levels using the natural breaks method in ArcGIS 10.7, with red being more accessible and blue being less accessible (Figure 4). Levels 1–3 indicate low accessibility with 563 units, levels 4–6 indicate medium accessibility with 220 units, and levels 7–9 indicate high accessibility with 65 units. The proportions are 66%, 26%, and 8%, respectively (Table 1). The accessibility decreases from the southeast to the northwest part of the historic urban area, with the lowest value recorded in the west and north areas, at 0.002. This can be attributed to the presence of denser residential neighborhoods and a concentration of industrial activities in that area. The disequilibrium of UGS supply and demand leads to 64.34% of people living with low accessibility and 27.25% with medium accessibility.
To further demonstrate the inequity of UGS accessibility in the Qingdao historic urban area, the Gini coefficient and the Lorenz curve were measured based on Equation (4). Figure 5 illustrates that the Gini coefficient of green space accessibility is 0.775, indicating an unequal distribution. There is a significant disparity in the distributional equity of UGS in the historic urban area, as only 8.41% of the population lives in green spaces with high accessibility. This shows that the allocation and planning of green spaces are unrelated to population distribution and needs, resulting in an unequal distribution of green spaces in the Qingdao historic urban area. Improvements need to be made in the urban renewal process for the 15 districts with low accessibility, including D2-5, D7-9, D11, D14, D16, D18, D22-23, D30, and D34 (Table A1).

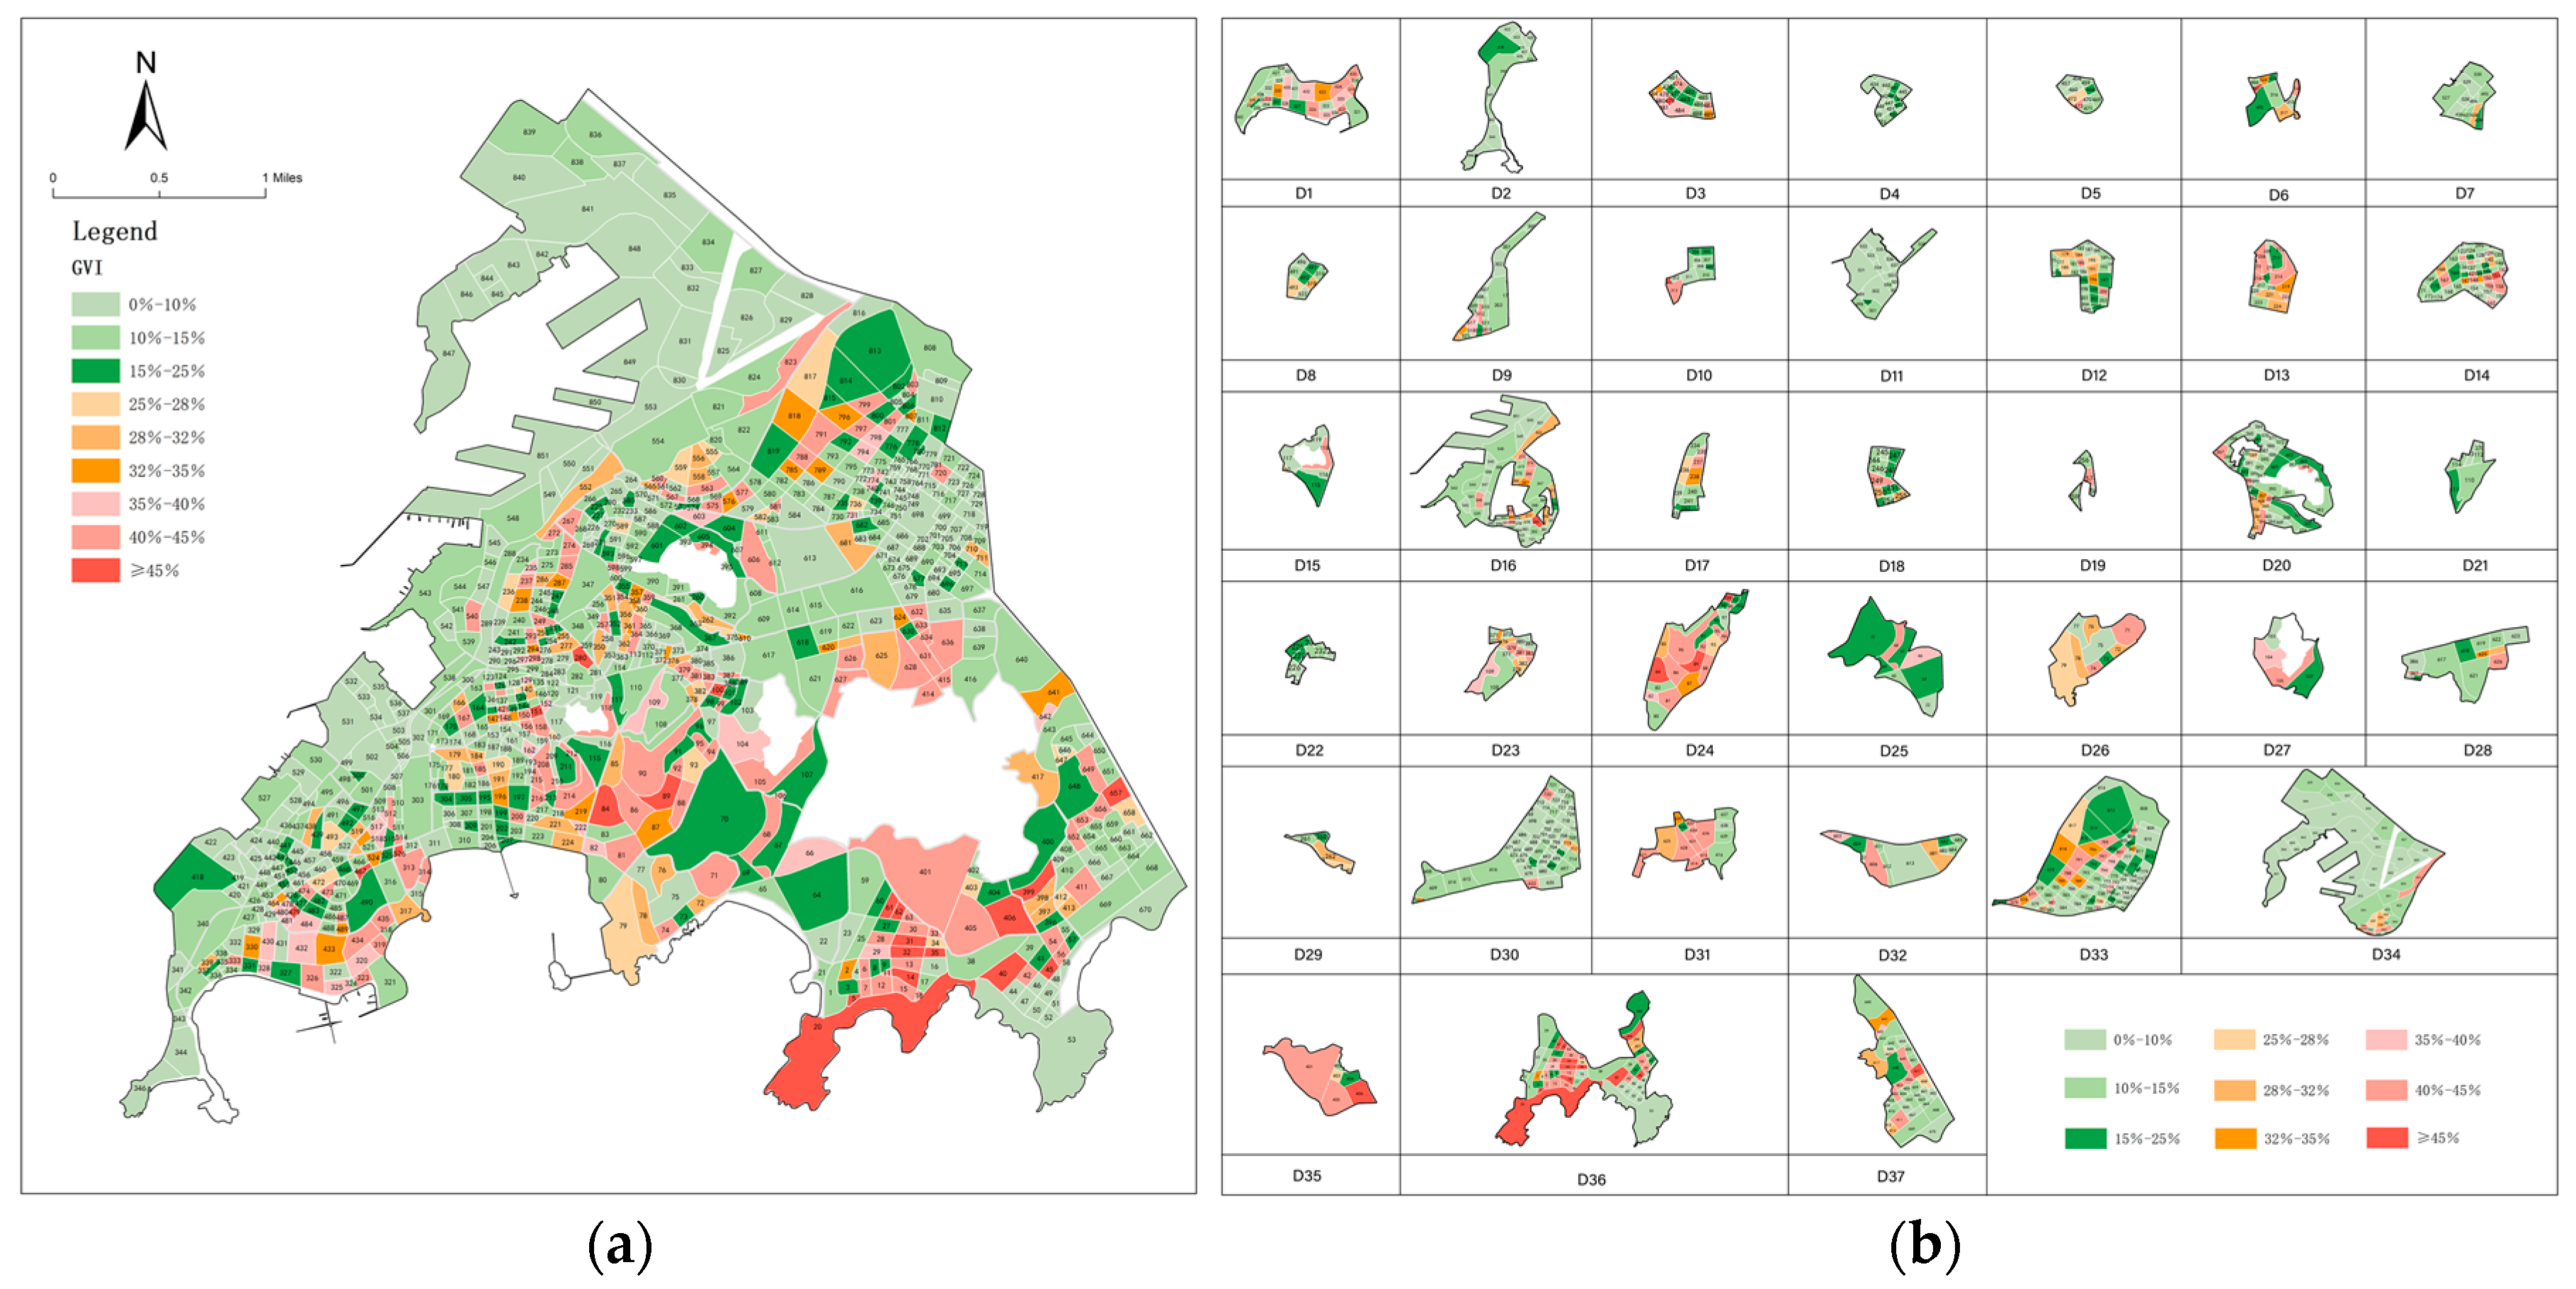
3.2. Perceived Equity of UGS

According to the criteria proposed by researchers, the GVI level can be divided into five categories: 0–5%, 5–15%, 15–25%, 25–35%, and more than 35%. Among these categories, a GVI of 25% is considered to be a relatively good perception of greenery, while a GVI above 35% indicates an excellent perception of greenery. During the research, ArcGIS 10.7 was used to visualize the GVI of 2857 street sample points in order to obtain the overall distribution of greenery in the study area. Furthermore, the data were rasterized to calculate the GVI within each unit. Therefore, the GVI has been divided into nine levels, with 25% and 35% as values to differentiate between low, medium, and high levels of greenery (Figure 6). The results show that the average GVI of the Qingdao historic urban area is 18.23%, which is lower than 25%. The areas with high GVI values, at 25% and above, are primarily concentrated in the southern and eastern parts of the historic urban area, whereas the northern districts have the lowest GVI values, at 15% and below. As a result, there are 598 units with low greenery, 95 units with medium greenery, and 158 units with high greenery, accounting for 70%, 11%, and 19% of the total, respectively. The distribution of greenery is uneven, and there is a significant regional disparity (Table 2 and Table A1).
To examine the spatial differentiation of perceived equity in greenery, this research calculated the location quotient and categorized it into five levels. The overall perceived equity is relatively low, with an average value of 0.27. The highest location quotient, at 5.0, is in Badaguan and Taipingjiao historic district (D36), which is a national AAA-level tourism attraction with pleasant road greening. Fourteen districts lack greenery, with location quotients less than 0.3. Areas with low equity are mainly distributed in the central and western parts, which are predominantly old residential areas (Figure 7).

3.3. Classification of UGS Spatial Patterns

The normalized spatial distribution of the two approaches, weighted equally at 0.5 each, is shown in Figure 8, representing the assessment of green equity in the historic urban area of Qingdao. Levels 1–3 indicate low green equity, levels 4–6 indicate medium green equity, and levels 7–9 indicate high green equity. The results show that the green equity in the historic districts of Qingdao is relatively low, and its distribution is extremely uneven. Specifically, 75% of the units have low green equity, 20% have medium green equity, and 5% have high green equity (Table 3, Table A1). Areas with higher green equity are concentrated on the east and south sides, near Zhongshan Park, reaching a maximum value of 0.89 in Liaoning District (D20). The lowest value is distributed in the western and northern areas, with values below 0.05. The disequilibrium of green spaces leads to 62.20% of people living with low green equity, while only 8.12% have high green equity. To minimize environmental injustice, it is essential to identify units and districts that require urgent optimization during future green planning processes in order to improve green equity. In future renovations, it is recommended to maintain the current state of D25, D26, D29, D31, and D35-36. The priority should be on the renovation of D2, D4-5, D7-9, D11, D16-17, D21-22, D28, D30, D34, and D37, especially D2, D4, D5, and D11, with a green equity value lower than 0.05.

4. Discussion

4.1. Methodological Contributions

By 2050, approximately two-thirds of the global population will reside in urban areas, as stated in the World Urbanization Prospects [57]. The growing population will result in increased environmental pressure on urban spaces, particularly in historic urban areas that have limited green spaces. Therefore, this study focuses on the current state of green equity in Qingdao’s historic urban area in order to identify unequal areas with limited access to green spaces and minimal visibility of greenery. The contributions of this paper are in the following aspects:
Firstly, the scale of the research is fine-grained. Detailed units and districts are divided, allowing for the display of research results in a more accurate spatial context and improving research precision related to the equity of green spaces. It responds to the requirements of fine-grained urban management within the context of urban renewal in China.
Secondly, the evaluation of green equity, which is a combination of distributional and perceived equity of UGSs, is more comprehensive. In this study, we first focused on the distributional equity of green space. The G2SFCA method has been used to improve the drawbacks of the traditional 2SFCA method, which neglects distance decay factors and different service radii [29,30,31,32,33,34]. This enhances the accuracy of accessibility evaluation. However, the measurement of distributional equity does not consider street greenery, which is also an important component of urban green spaces. Knez [58] demonstrated the challenges of identifying differences in urban greenery using remote sensing images, while obvious discrepancies in greenery can be perceived by people based on eye-level perspectives in Gothenburg, Sweden. It represents an eye-level visual of greenness that is more related to people’s actual visual perceptions. With the development of deep learning techniques and the availability of street view data, the GVI offers a potential solution for measuring the eye-level perception of greenness. Most of the results from previous studies support the association between urban greenery (using GVI as an indicator) and human environmental and visual perceptions [48,49,50,51,52,53,54,55]. Therefore, the perceived equity of UGS is assessed based on GVI and location quotient. In conclusion, this study integrates the implications of both perspectives, considers not only the distributional equity but also the perceived equity, and spatially matches the findings from both aspects. This comprehensive approach is an innovation in this paper.

4.2. Implications for Urban Green Space Planning

Providing equitable green spaces is crucial for sustainable urban development, fostering social harmony, and improving the overall well-being of residents [59,60]. The study utilized improved methods, including G2SFCA and GVI, to analyze the distribution pattern of green space accessibility and street greenery in the historic urban area. The Gini coefficient and location quotient are applied to analyze the green inequality. By considering the accessibility of green space, street green visual index, and population density, a detailed map of green equity in Qingdao’s historic urban area is generated. The results highlight a significant imbalance in urban green space, with only 8.12% of the population residing in areas that have sufficient green spaces. This indicates that the supply of green spaces and street greenery is not meeting the demand of the population, leading to this disequilibrium. To maximize social justice, priority should be given to improving the 15 districts with low green equity. Among them, D4-5, D8-9, D16, D28, D30, and D37 are primarily residential areas with high population pressure, where optimization ideas such as pocket parks and other informal small and functional parks have the potential to meet residents’ demands for UGS. On the other hand, D17 and D21-22 are mainly commercial and tourism areas, so the optimization should prioritize improving street-level greenery and shaping a pleasant and green tourism environment. In the second phase of urban renewal, efforts can be focused on improving the green spaces in the 16 districts with medium green equity, among which are 6 districts with residential areas and 7 districts with tourism attractions.
It is necessary to accurately identify areas with an inadequate supply of urban green spaces in order to provide a basis for government decision-making on the optimization of urban green spaces, thereby improving the efficiency of urban renewal efforts. The research results are of great significance in evaluating the equity of green space in the historic urban area of Qingdao and provide a refined perspective for urban renewal, thereby enhancing the well-being of residents.

4.3. Limitations and Future Research

From the perspective of distributional green equity, there are two main limitations. Firstly, the Ministry of Housing and Urban-Rural Development encourages cities to promote the development of green spaces and walking networks within communities. It emphasizes the importance of coordinating public buildings, parks, and other facilities, connecting multiple residential units to create a fifteen-minute living circle with a service radius of 800–1000 m [17]. Therefore, in this study, UGS accessibility is measured based on a fifteen-minute walking distance, with a maximum service radius of 1000 m. However, there are various forms of travel modes under different time thresholds [33]. In the subsequent study, different travel mode preferences and travel scenarios will be taken into consideration. Secondly, the G2SFCA method represents the supply and demand between UGS and the population but does not consider the differences in demand among population groups. UGS accessibility can be affected by non-spatial and self-selection factors, such as personal preferences and social activities. The majority of studies focus on park accessibility without considering people’s willingness to self-move and self-select [32], which calls for future research to explore green equity based on attractiveness or desirability to people with different levels of activity or self-selection.
From the perspective of perceived green equity, although GVI has advantages for urban greenery research, this assessing method also has shortcomings. It could not distinguish non-vegetation green pixels from vegetation pixels, such as green light or green cars [61]. Compared with manual extraction, the accuracy of SegNet for measuring street view data is between 80% and 99% [62]. The result can be affected by lighting conditions and weather [63]. In this study, Baidu Street View images were collected in the summer, thus potentially overlooking any seasonal variations in street greenery. Numerous studies have confirmed that seasonal changes in vegetation can result in fluctuations in the benefits provided by street greenery in regions with varying climates throughout the year [64]. In future studies, we will collect representative samples from different months to observe street greenery in different seasons, allowing for the measurement of changes in street greenery on a more detailed time scale. Furthermore, scholars have measured the correlation between the quality of street greenery and resident satisfaction through a combination of questionnaires and street view data. Helbich [50] examined the linkage between mental disorders and street greenery among elderly people in China through the shortened Geriatric Depression Scale (GDS-15). Wang [53] suggested that eye-level greenery affects mental health mainly by impacting stress levels, social cohesion, physical activity, and life satisfaction through the World Health Organization Well-Being Index (WHO-5). Due to time and resource constraints, this study did not analyze the correlation between GVI and the satisfaction of individuals through direct interaction. In future research, studying the satisfaction and emotions associated with the perception of green spaces will be a focus of green equity studies.

5. Conclusions

By analyzing the spatial distribution of accessibility and the green view index of green spaces, this study has developed a dual-perspective evaluation model for assessing green equity. The result showed that (1) the Gini coefficient of green space accessibility is 0.775, which means that 64.34% of people live with low accessibility and 27.25% with medium accessibility, indicating unequal distributional equity. The accessibility decreases from the southeast to the northwest; the allocation of green spaces is not related to population distribution or needs; and 15 districts are in urgent need of renovation. However, the lack of green spaces in historic urban areas cannot be overcome simply by planning new parks due to the limited open land. Optimization ideas such as pocket parks, informal parks, and roof gardens have the potential to meet residents’ demands. (2) The average GVI of the historic urban area in Qingdao is 18.23%, which is below 25%. This level of GVI indicates a lack of positive visual perception. The average value of the location quotient is 0.27, indicating unequal perceived equity in greenery. Areas with lower levels of equity are primarily located in the old residential areas in the central and western parts. Data show that 14 districts require more efforts to improve street-level greenery. (3) The study has provided evidence for the unequal distribution of greenery supply and population demand in the historical urban area of Qingdao, with only 8.12% of the population experiencing high green equity. To minimize green injustice, priority and more targeted strategies should be given to improving the 15 districts with low green equity, particularly in the western and northern areas where the lowest values are distributed. These strategies should take into account areas that are facing significant residential or tourism pressures, with phased urban renewal plans.
In recent years, as China’s urban development has shifted its emphasis from quantity to quality, the era of unbalanced, uncoordinated, and unsustainable bulldozer-style demolitions and large-scale construction has now faded into history [65]. Currently, urban renewal has reached a stage where the focus is on improving the urban environment in a more refined direction. Therefore, analyzing the green equity in historic urban areas based on the fine-grained division of units and districts and accurately identifying the spaces in need of greenery renovation are essential in this context. In the subsequent urban renewal, more precise guidance and optimization priorities can be provided to districts with low green equity, maximizing environmental justice and the effectiveness of government greening projects.

Author Contributions

Conceptualization, methodology, writing, N.J.; software, data curation, X.L.; validation, Z.P. and Q.B.; investigation, X.L. and Y.F. All authors have read and agreed to the published version of the manuscript.

Funding

This research was funded by 2023 Qingdao Social Science Planning Research Project (Grant number: QDSKL2301139) and National Undergraduate Innovative Entrepreneurship Training Program (Grant number: 202210429037).

Data Availability Statement

The data presented in this study are available on request from the corresponding author. The data are not publicly available due to privacy.

Conflicts of Interest

The authors declare no conflict of interest.

Appendix A

Table A1. Detailed data and information for each district in the historic urban area of Qingdao.
Name of DistrictZoneList/Number of UnitsArea of DistrictRange of Values
UGS AccessibilityGVIGreen Equity
Badaxia DistrictD1318–339, 432, 427–4350.82 km20.24–70.872.4–40.2%0.04–0.39
Tuandao DistrictD2340–341, 343–344, 346, 419–423, 425–4260.73 km20.10–1.182.1–16.3%0.01–0.20
TaiXi DistrictD3461–464, 474–4890.16 km21.07–11.303.9–57.7%0.03–0.25
XiZang DistrictD4424, 440–4560.16 km20.02–1.082.7–24.1%0.01–0.14
Nuozhuang DistrictD5475–460, 468–4730.13 km20.14–5.813.5–43.1%0.01–0.25
Xizhen DistrictD6314–316, 466–467, 490, 524–5250.24 km24.51–19.811.2–55.5%0.02–0.37
Sichuan DistrictD7436–439, 494–495, 527–5300.35 km20.32–1.551.5–28.0%0.01–0.20
Yunnan DistrictD8491–493, 496–497, 516, 519, 5220.13 km20.41–1.034.0–28.6%0.01–0.02
Shouzhang DistrictD9300–303, 507–518, 520–521, 5230.04 km21.59–5.335.2–42.3%0.00–0.22
Taiping DistrictD10304–313, 5260.23 km21.44–30.413.7–58.2%0.02–0.27
Guangzhou DistrictD11498, 499, 500–506, 531–5380.55 km21.99–2.220.4–15.6%0.00–0.18
Zhongshan Historic DistrictD12175–2070.41 km23.47–29.127.5–40.2%0.04–0.41
Guanhaishan Historic DistrictD13208–2240.34 km24.46–31.854.1–41.5%0.07–0.42
Sifang Historic DistrictD14123–171, 173–1740.42 km20.55–10.103.6–57.3%0.04–0.40
Guanxiangshan Historic DistrictD15115–119, 1600.23 km24.95–55.640.5–40.7%0.01–0.35
Jimo DistrictD16120–122, 276–280, 286–299, 347–353, 539–552, 8512.18 km20.50–27.502.4–55.1%0.00–0.26
Guantao Historic DistrictD17234–2430.17 km20.41–19.322.8–40.1%0.00–0.28
Shanghai–Wuding Historic DistrictD18244–2550.09 km20.65–10.620.5–43.7%0.08–0.46
Xinyang Historic DistrictD19256–2590.04 km21.55–18.757.4–42.9%0.08–0.38
Liaoning DistrictD20264–271, 354–367, 390–395,
601–602, 605
1.07 km21.20–302.783.4–45.0%0.02–0.89
Wudi Historic DistrictD21110–114, 3710.15 km29.54–33.775.2–16.3%0.03–0.18
Changshan Historic DistrictD22225–2330.06 km21.99–5.892.1–15.1%0.03–0.28
Jiangsu DistrictD23108–109, 371–373, 376–3840.26 km21.90–18.682.0–40.7%0.04–0.39
Xinhaoshan Historic DistrictD2480–1020.84 km24.37–34.433.6–58.2%0.09–0.61
Baguanshan Historic DistrictD2522, 64–70, 1060.98 km214.38–72.974.2–44.7%0.17–0.56
Yushan Historic DistrictD2671–790.56 km233.95–647.154.0–41.2%0.15–0.77
Fushan DistrictD27103–105, 1070.52 km213.26–32.515.4–42.3%0.02–0.37
Qingdao Zoo DistrictD28386–389, 617–623, 6260.52 km24.44–28.778.5–43.3%0.04–0.30
Huangtai Historic DistrictD29260–2620.07 km230.92–32.4515.7–28.4%0.29–0.44
Yanan DistrictD30608–610
614–616, 632, 635, 671–721
1.10 km20.50–27.642.1–44.1%0.02–0.16
Qingdao TV Tower DistrictD31414–416, 624–625, 627–628, 630–631, 633–634, 636–6390.61 km21.83–21344.27–43.0%0.09–0.79
Dengzhou DistrictD32603–604, 606–607, 611–613, 681–6850.63 km20.95–28.143.0–44.2%0.02–0.40
Taidong DistrictD33573–584, 730–8192.02 km20.54–48.332.8–47.2%0.01–0.38
Dagang DistrictD34554–569, 821–8474.47 km20.002–15.122.5–47.2%0.02–0.35
Xianggangxi DistrictD35401–4060.65 km21.42–43.7713.4–50.3%0.08–0.55
Badaguan and Taipingjiao historic districtD361–58, 396–4002.10 km214.53–483.224.7–64.4%0.12–0.54
Zhanshan DistrictD37417, 640–6701.45 km20.653–18.952.7–57.2%0.01–0.36

References

  1. Graça, M.; Alves, P.; Gonçalves, J.; Nowak, D.J.; Hoehn, R.; Farinha-Marques, P.; Cunha, M. Assessing how green space types affect ecosystem services delivery in Porto, Portugal. Landsc. Urban Plan. 2018, 170, 195–208. [Google Scholar] [CrossRef]
  2. Yu, Z.; Yang, G.; Zuo, S.; Jørgensen, G.; Koga, M.; Vejre, H. Critical review on the cooling effect of urban blue-green space: A threshold-size perspective. Urban For. Urban Green. 2020, 49, 126630. [Google Scholar] [CrossRef]
  3. el-Baghdadi, O.; Desha, C. Conceptualising a biophilic services model for urban areas. Urban For. Urban Green. 2017, 27, 399–408. [Google Scholar] [CrossRef]
  4. Salingaros, N.A. The Biophilic Index Predicts Healing Effects of the Built Environment. J. Biourbanism 2019, 8, 13–14. [Google Scholar]
  5. Lee, S.; Kim, Y. A framework of biophilic urbanism for improving climate change adaptability in urban environments. Urban For. Urban Green. 2021, 61, 127104. [Google Scholar] [CrossRef]
  6. Mehaffy, M.W.; Kryazheva, Y.; Rudd, A.; Salingaros, N.A. A New Pattern Language for Growing Regions: Places, Networks, Processes; BIOPHILIC URBANISM; Sustasis Press: Portland, OR, USA, 2020; Volume 2.4, ISBN 978-0-9893469-8-6. [Google Scholar]
  7. Huang, Y.; Lin, T.; Xue, X.; Zhang, G.; Liu, Y.; Zeng, Z.; Zhang, J.; Sui, J. Spatial patterns and inequity of urban green space supply in China. Ecol. Indic. 2021, 132, 108275. [Google Scholar] [CrossRef]
  8. Huang, Y.; Lin, T.; Zhang, G.; Jones, L.; Xue, X.; Ye, H.; Liu, Y. Spatiotemporal patterns and inequity of urban green space accessibility and its relationship with urban spatial expansion in China during rapid urbanization period. Sci. Total Environ. 2022, 809, 151123. [Google Scholar] [CrossRef]
  9. Jiang, N. Vitality Creation of Cultural Tourism in Historic Conservation Area of Shandong Province; Qingdao Publishing House: Qingdao, China, 2022; ISBN 978-7-5552-8548-9. [Google Scholar]
  10. Statistical Bulletin on National Economic and Social Development of Qingdao. 2023. Available online: http://dpc.qingdao.gov.cn/fzgggz_45/zhc_45/gzdt_45/202304/t20230406_7106527.shtml (accessed on 31 March 2023).
  11. Sun, C.; Lin, T.; Zhao, Q.; Li, X.; Ye, H.; Zhang, G.; Liu, X.; Zhao, Y. Spatial pattern of urban green spaces in a long-term compact urbanization process—A case study in China. Ecol. Indic. 2019, 96, 111–119. [Google Scholar] [CrossRef]
  12. Koprowska, K.; Łaszkiewicz, E.; Kronenberg, J. Is urban sprawl linked to green space availability? Ecol. Indic. 2020, 108, 105723. [Google Scholar] [CrossRef]
  13. Chen, Y.; Men, H.; Ke, X. Optimizing urban green space patterns to improve spatial equity using location-allocation model: A case study in Wuhan. Urban For. Urban Green. 2023, 84, 127922. [Google Scholar] [CrossRef]
  14. Alexander, C.; Ishikawa, S.; Silverstein, M.; Jacobson, M.; Fiksdahl-King, I.; Angel, S. A Pattern Language: Towns, Buildings, Construction; Oxford University Press: New York, NY, USA, 1977; ISBN 13-978-0-19-501919-3. [Google Scholar]
  15. Nielsen, T.S.; Hansen, K.B. Do green areas affect health? Results from a Danish survey on the use of green areas and health indicators. Health Place 2007, 13, 839–850. [Google Scholar] [CrossRef] [PubMed]
  16. Bashneen, S.S.; Faeza, H.S.; Farjana, R. Rethinking spatial performance to address liveability of accessible neighbourhood greens (angs) in mohammadpur, dhaka. AUST J. Sci. Eng. 2017, 06, 100–115. [Google Scholar]
  17. Comprehensive Guide to Residential Community Development. 2021. Available online: https://www.gov.cn/zhengce/zhengceku/2022-01/12/content_5667815.htm (accessed on 17 December 2021).
  18. Lucas, K.; van Wee, B.; Maat, K. A method to evaluate equitable accessibility: Combining ethical theories and accessibility-based approaches. Transportation 2016, 43, 473–490. [Google Scholar] [CrossRef]
  19. Xiao, Y.; Wang, Z.; Li, Z.; Tang, Z. An assessment of urban park access in Shanghai–Implications for the social equity in urban China. Landsc. Urban Plan. 2017, 157, 383–393. [Google Scholar] [CrossRef]
  20. Nesbitt, L.; Meitner, M.J.; Sheppard, S.R.J.; Girling, C. The dimensions of urban green equity: A framework for analysis. Urban For. Urban Green. 2018, 34, 240–248. [Google Scholar] [CrossRef]
  21. Fasihi, H.; Parizadi, T. Analysis of spatial equity and access to urban parks in Ilam, Iran. J. Environ. Manag. 2020, 260, 110122. [Google Scholar] [CrossRef]
  22. Nicholls, S. Measuring the accessibility and equity of public parks: A case study using GIS. Manag. Leis. 2001, 6, 201–219. [Google Scholar] [CrossRef]
  23. Hillsdon, M.; Panter, J.; Foster, C.; Jones, A. The relationship between access and quality of urban green space with population physical activity. Public Health 2006, 120, 1127–1132. [Google Scholar] [CrossRef]
  24. Akpinar, A. How is quality of urban green spaces associated with physical activity and health? Urban For. Urban Green. 2016, 16, 76–83. [Google Scholar] [CrossRef]
  25. Wang, S.; Wang, M.; Liu, Y. Access to urban parks: Comparing spatial accessibility measures using three GIS-based approaches. Comput. Environ. Urban Syst. 2021, 90, 101713. [Google Scholar] [CrossRef]
  26. Langford, M.; Higgs, G.; Fry, R. Multi-modal two-step floating catchment area analysis of primary health care accessibility. Health Place 2016, 38, 70–81. [Google Scholar] [CrossRef] [PubMed]
  27. Xing, L.; Liu, Y.; Liu, X. Measuring spatial disparity in accessibility with a multi-mode method based on park green spaces classification in Wuhan, China. Appl. Geogr. 2018, 94, 251–261. [Google Scholar] [CrossRef]
  28. Xing, L.; Liu, Y.; Wang, B.; Wang, Y.; Liu, H. An environmental justice study on spatial access to parks for youth by using an improved 2SFCA method in Wuhan, China. Cities 2020, 96, 102405. [Google Scholar] [CrossRef]
  29. Hu, S.; Song, W.; Li, C.; Lu, J. A multi-mode Gaussian-based two-step floating catchment area method for measuring accessibility of urban parks. Cities 2020, 105, 102815. [Google Scholar] [CrossRef]
  30. Li, Z.; Fan, Z.; Song, Y.; Chai, Y. Assessing equity in park accessibility using a travel behavior-based G2SFCA method in Nanjing, China. J. Transp. Geogr. 2021, 96, 103179. [Google Scholar] [CrossRef]
  31. Li, X.; Huang, Y.; Ma, X. Evaluation of the accessible urban public green space at the community-scale with the consideration of temporal accessibility and quality. Ecol. Indic. 2021, 131, 108231. [Google Scholar] [CrossRef]
  32. Ren, X.; Guan, C. Evaluating geographic and social inequity of urban parks in Shanghai through mobile phone-derived human activities. Urban For. Urban Green. 2022, 76, 127709. [Google Scholar] [CrossRef]
  33. Li, Y.; Xie, Y.; Sun, S.; Hu, L. Evaluation of Park Accessibility Based on Improved Gaussian Two-Step Floating Catchment Area Method: A Case Study of Xi’an City. Buildings 2022, 12, 871. [Google Scholar] [CrossRef]
  34. Guo, S.; Song, C.; Pei, T.; Liu, Y.; Ma, T.; Du, Y.; Chen, J.; Fan, Z.; Tang, X.; Peng, Y.; et al. Accessibility to urban parks for elderly residents: Perspectives from mobile phone data. Landsc. Urban Plan. 2019, 191, 103642. [Google Scholar] [CrossRef]
  35. Konijnendijk, C.C.; Ricard, R.M.; Kenney, A.; Randrup, T.B. Defining urban forestry—A comparative perspective of North America and Europe. Urban For. Urban Green. 2006, 4, 93–103. [Google Scholar] [CrossRef]
  36. Feng, X.; Astell-Burt, T. Residential Green Space Quantity and Quality and Child Well-being: A Longitudinal Study. Am. J. Prev. Med. 2017, 53, 616–624. [Google Scholar] [CrossRef] [PubMed]
  37. De Vries, S.; van Dillen, S.M.E.; Groenewegen, P.P.; Spreeuwenberg, P. Streetscape greenery and health: Stress, social cohesion and physical activity as mediators. Soc. Sci. Med. 2013, 94, 26–33. [Google Scholar] [CrossRef] [PubMed]
  38. Ma, B.; Hauer, R.J.; Ostberg, J.; Koeser, A.K.; Wei, H.; Xu, C. A global basis of urban tree inventories: What comes first the inventory or the program. Urban For. Urban Green. 2021, 60, 127087. [Google Scholar] [CrossRef]
  39. Neyns, R.; Canters, F. Mapping of Urban Vegetation with High-Resolution Remote Sensing: A Review. Remote Sens. 2022, 14, 1031. [Google Scholar] [CrossRef]
  40. Ye, Y.; Richards, D.; Lu, Y.; Song, X.; Zhuang, Y.; Zeng, W.; Zhong, T. Measuring daily accessed street greenery: A human-scale approach for informing better urban planning practices. Landsc. Urban Plan. 2019, 191, 103434. [Google Scholar] [CrossRef]
  41. Lu, Y.; Yang, Y.; Sun, G.; Gou, Z. Associations between overhead-view and eye-level urban greenness and cycling behaviors. Cities 2019, 88, 10–18. [Google Scholar] [CrossRef]
  42. Wang, R.; Helbich, M.; Yao, Y.; Zhang, J.; Liu, P.; Yuan, Y.; Liu, Y. Urban greenery and mental wellbeing in adults: Cross-sectional mediation analyses on multiple pathways across different greenery measures. Environ. Res. 2019, 176, 108535. [Google Scholar] [CrossRef]
  43. Seiferling, I.; Naik, N.; Ratti, C.; Proulx, R. Green streets—Quantifying and mapping urban trees with street-level imagery and computer vision. Landsc. Urban Plan. 2017, 165, 93–101. [Google Scholar] [CrossRef]
  44. Wang, J.; Liu, W.; Gou, A. Numerical characteristics and spatial distribution of panoramic Street Green View index based on SegNet semantic segmentation in Savannah. Urban For. Urban Green. 2022, 69, 127488. [Google Scholar] [CrossRef]
  45. Li, X.; Zhang, C.; Li, W.; Ricard, R.; Meng, Q.; Zhang, W. Assessing street-level urban greenery using Google Street View and a modified green view index. Urban For. Urban Green. 2015, 14, 675–685. [Google Scholar] [CrossRef]
  46. Liu, Y.; Pan, X.; Liu, Q.; Li, G. Establishing a Reliable Assessment of the Green View Index Based on Image Classification Techniques, Estimation, and a Hypothesis Testing Route. Land 2023, 12, 1030. [Google Scholar] [CrossRef]
  47. Lu, Y.; Ferranti, E.J.S.; Chapman, L.; Pfrang, C. Assessing urban greenery by harvesting street view data: A review. Urban For. Urban Green. 2023, 83, 127917. [Google Scholar] [CrossRef]
  48. Quercia, D.; O’Hare, N.K.; Cramer, H. Aesthetic capital: What makes london look beautiful, quiet, and happy? In Proceedings of the 17th ACM conference on Computer Supported Cooperative work & Social Computing; Association for Computing Machinery, New York, NY, USA, 15–19 February 2014.
  49. Yu, X.; Zhao, G.; Chang, C.; Yuan, X.; Heng, F. BGVI: A New Index to Estimate Street-Side Greenery Using Baidu Street View Image. Forests 2019, 10, 3. [Google Scholar] [CrossRef]
  50. Helbich, M.; Yao, Y.; Liu, Y.; Zhang, J.; Liu, P.; Wang, R. Using deep learning to examine street view green and blue spaces and their associations with geriatric depression in Beijing, China. Environ. Int. 2019, 126, 107–117. [Google Scholar] [CrossRef]
  51. Cheng, L.; Chu, S.; Zong, W.; Li, S.; Wu, J.; Li, M. Use of Tencent Street View Imagery for Visual Perception of Streets. ISPRS Int. J. Geo-Inf. 2017, 6, 265. [Google Scholar] [CrossRef]
  52. Dai, L.; Zheng, C.; Dong, Z.; Yao, Y.; Wang, R.; Zhang, X.; Ren, S.; Zhang, J.; Song, X.; Guan, Q. Analyzing the correlation between visual space and residents’ psychology in Wuhan, China using street-view images and deep-learning technique. City Environ. Interact. 2021, 11, 100069. [Google Scholar] [CrossRef]
  53. Wang, R.; Feng, Z.; Pearce, J.; Liu, Y.; Dong, G. Are greenspace quantity and quality associated with mental health through different mechanisms in Guangzhou, China: A comparison study using street view data. Environ. Pollut. 2021, 290, 117976. [Google Scholar] [CrossRef]
  54. Aoki, Y. Relationship between percieved greenery and width of visual fields. J. Jpn. Inst. Landsc. Archit. 1987, 51, 1–10. [Google Scholar] [CrossRef]
  55. Sun, D.; Ji, X.; Gao, W.; Zhou, F.; Yu, Y.; Meng, Y.; Yang, M.; Lin, J.; Lyu, M. The Relation between Green Visual Index and Visual Comfort in Qingdao Coastal Streets. Buildings 2023, 13, 457. [Google Scholar] [CrossRef]
  56. CJJ/T 85-2017; Urban Green Spaces Classification Standard. China Architecture Publishing: Beijing, China, 2018.
  57. World Urbanization Prospects: The 2018 Revision|United Nations iLibrary. Available online: https://www.un-ilibrary.org/content/books/9789210043144 (accessed on 12 September 2023).
  58. Knez, I.; Ode Sang, Å.; Gunnarsson, B.; Hedblom, M. Wellbeing in Urban Greenery: The Role of Naturalness and Place Identity. Front Psychol. 2018, 9, 491. [Google Scholar] [CrossRef]
  59. Cheesbrough, A.E.; Garvin, T.; Nykiforuk, C.I.J. Everyday wild: Urban natural areas, health, and well-being. Health Place 2019, 56, 43–52. [Google Scholar] [CrossRef] [PubMed]
  60. Zheng, Z.; Shen, W.; Li, Y.; Qin, Y.; Wang, L. Spatial equity of park green space using KD2SFCA and web map API: A case study of zhengzhou, China. Appl. Geogr. 2020, 123, 102310. [Google Scholar] [CrossRef]
  61. Larkin, A.; Hystad, P. Evaluating street view exposure measures of visible green space for health research. J Expo. Sci. Environ. Epidemiol. 2019, 29, 447–456. [Google Scholar] [CrossRef] [PubMed]
  62. Liang, J.; Gong, J.; Sun, J.; Zhou, J.; Li, W.; Li, Y.; Liu, J.; Shen, S. Automatic Sky View Factor Estimation from Street View Photographs—A Big Data Approach. Remote Sens. 2017, 9, 411. [Google Scholar] [CrossRef]
  63. Lauko, I.G.; Honts, A.; Beihoff, J.; Rupprecht, S. Local color and morphological image feature based vegetation identification and its application to human environment street view vegetation mapping, or how green is our county? Geo-Spat. Inf. Sci. 2020, 23, 222–236. [Google Scholar] [CrossRef]
  64. Han, Y.; Zhong, T.; Yeh, A.G.O.; Zhong, X.; Chen, M.; Lü, G. Mapping seasonal changes of street greenery using multi-temporal street-view images. Sustain. Cities Soc. 2023, 92, 104498. [Google Scholar] [CrossRef]
  65. Zhang, S. The Idea and Path of Establishing the Mechanism of Preserving the Urban Living Heritage: Shanghai’s Experience and Challenges in Historic Townscape Preservation. Urban Plan. Forum. 2021, 100–108. [Google Scholar] [CrossRef]
Figure 1. Study area and zoning in the historic urban area of Qingdao.
Buildings 13 02822 g001
Figure 2. Park distribution, residential unit distribution, and distribution of sample points in the historic urban area.
Buildings 13 02822 g002
Figure 3. The working process of SegNet.
Buildings 13 02822 g003
Figure 4. (a) Spatial distribution of accessibility in the historic urban area; (b) spatial distribution of accessibility in each district.
Buildings 13 02822 g004
Figure 5. Lorenz curve of UGS accessibility.
Buildings 13 02822 g005
Figure 6. (a) Spatial distribution of GVI in the historic urban area; (b) spatial distribution of GVI in each district.
Buildings 13 02822 g006
Figure 7. Location quotient distribution of GVI.
Buildings 13 02822 g007
Figure 8. (a) Spatial distribution of green equity in the historic urban area; (b) spatial distribution of green equity in each district.
Buildings 13 02822 g008
Table 1. Accessibility level of Qingdao’s historic urban area.
AccessibilityLevelRange of ValuesNumber of UnitsArea of Units
Low Accessibility10.00 ≤ A ≤ 2.0031012.27 km2
22.01 ≤ A ≤ 5.001472.90 km2
35.01 ≤ A ≤ 10.001092.37 km2
Medium Accessibility410.01 ≤ A ≤ 15.00922.71 km2
515.01 ≤ A ≤ 25.00750.16 km2
625.01 ≤ A ≤ 35.00532.14 km2
High Accessibility735.01 ≤ A ≤ 60.00421.90 km2
860.01 ≤ A ≤ 100.00150.91 km2
9100.01 ≤ A ≤ 2134.0080.17 km2
Table 2. GVI level of Qingdao’s historic urban area.
GVILevelRange of ValuesNumber of UnitsArea of Units
Low greenery10% G j < 10%2908.97 km2
210% G j < 15%2026.77 km2
315% G j < 25%1063.11 km2
Medium greenery425% G j < 28%220.64 km2
528% G j < 32%390.96 km2
632% G j < 35%340.57 km2
High greenery735% G j < 40%300.65 km2
840% G j < 45%1062.95 km2
9 G j 4 5%220.91 km2
Table 3. Green equity level of Qingdao’s historic urban area.
Green EquityLevelRange of ValuesNumber of UnitsArea of Units
Low10.00 ≤ F < 0.0534417.45 km2
20.05 ≤ F < 0.101733.04 km2
30.10 ≤ F < 0.201262.03 km2
Medium40.20 ≤ F < 0.25560.27 km2
50.25 ≤ F < 0.35910.50 km2
60.35 ≤ F < 0.45220.18 km2
High70.45 ≤ F < 0.55130.89 km2
80.55 ≤ F < 0.65181.01 km2
90.65 ≤ F ≤ 0.9080.15 km2
Disclaimer/Publisher’s Note: The statements, opinions and data contained in all publications are solely those of the individual author(s) and contributor(s) and not of MDPI and/or the editor(s). MDPI and/or the editor(s) disclaim responsibility for any injury to people or property resulting from any ideas, methods, instructions or products referred to in the content.

