Abstract
Previous studies show that moderate thermal mass in school building elements can positively impact the winter indoor thermal environment in a temperate climate with mild, humid winters. Based on a field study, this research contributes new physical data of the summer indoor thermal environment of Auckland school buildings with different designs of moderate thermal mass in their building elements to add to the previous winter field-study data and demonstrates that a school building with moderate thermal mass is adequate in a temperate climate with mild, humid winters and warm, dry summers. This field study compared and evaluated the summer indoor thermal environment of classrooms with different moderate thermal mass in their building elements during the summer school term and the summer school holidays. This study found that a classroom with thermal mass in its building elements has 19% to 21% more time in summer than a classroom without any thermal mass in its building elements when indoor air temperatures are within the thermal comfort zone, which was solely impacted by the building’s thermal performance. This study established a suitable research method to analyse the field-study data and identify the differences in the indoor thermal environments of the school buildings with different designs of moderate thermal mass in their building elements.
1. Introduction
Auckland, New Zealand, has a temperate climate with warm, dry summers and mild, wet winters [1]. An Auckland school commonly includes a number of isolated, low-rise buildings with timber structures and lightweight envelopes, spread over a large site. Most Auckland schools have a number of isolated, low-rise (one or two-storey) buildings with up to four classrooms in rows. Most classrooms have a big external surface area that includes two sides (in the middle of a row) or three sides (on the end of a row) of external walls, and roof surface areas. For this type of school building, the building envelope becomes the most important element for thermal performance. During the summer, most conventional Auckland school buildings rely on natural ventilation through windows, plus ceiling fans, with no air-conditioning. The previous studies [2,3] show that classrooms with thermal mass in their building elements have a better winter indoor thermal environment in relation to students’ thermal comfort and health. Since a construction system will only prove to be adequate when considering the performance in both winter and summer conditions, this study focused on the summer indoor thermal environment of classrooms with or without thermal mass in their building elements under the local temperate climate conditions with a warm and dry summer.
According to a review of thermal comfort studies in classrooms over the last fifty years, most previous studies were mainly related to energy efficiency in school buildings rather than indoor environment quality and lacked available standards and sufficient reference documents related to the impact of school building design on indoor environment quality [4]. There are recent field studies of the summer thermal comfort of free-running or naturally ventilated classrooms in primary schools [5,6,7], secondary schools [8,9], both primary and secondary schools [10,11], and institutes [12,13,14] in different countries and climates. These field studies mainly focused on indoor thermal environment quality, and there are limited studies [7,11] related to the impact of school building design on indoor thermal environment. Information on the correlations between indoor environments, health and educational outcomes are sorely limited in New Zealand [15]. There are also limited data and studies on measurements of the indoor environment quality of New Zealand schools, especially for indoor thermal conditions and indoor air quality [16]. There are recent studies of the impact of thermal mass on summer indoor thermal environment related to occupants’ thermal comfort of school buildings in other countries [7,17,18,19,20]. Research methods used for those studies on summer indoor thermal environment of school buildings are mainly building simulations (mathematical model) [17,18,19,20] and limited field studies of indoor thermal environments [7]. Research methods for students’ thermal comfort are survey questionnaires. Those studies were mainly carried out in hot-dry or semi-arid climates or more severe summer conditions than in Auckland. Based on the field studies, this study identified differences of indoor thermal environments of school buildings with different thermal mass in their building elements in a temperate climate with relatively comfortable warm and dry summer conditions.
As a classroom’s thermal environment quality is very important for students’ health and performance, the classroom should provide a conducive environment to promote teaching and learning. Several review articles are available on the thermal environment in classrooms or relationships between thermal conditions and students’ performance or health [4,15,16]. Due to high occupant density in classrooms, an unsatisfactory thermal environment can have a negative impact on students’ learning and performance [21,22,23]. Designers and architects use the most recent thermal comfort standards such as ISO 7730 [24], ASHRAE Standard 55 [25], and EN 16789-1 [26] as reference documents for school building design [27,28,29]. The database for these standards is mainly collected from healthy adults in public buildings, which are not directly related to school students in education buildings. In accordance with these standards, the adaptive thermal comfort principal and predicted mean vote (PMV) are used to evaluate the indoor thermal comfort of classrooms. Previous studies have found that both the adaptive and PMV methods underestimate thermal sensation and predict higher temperatures for the comfort of students [7,30,31,32]. The air temperature in classrooms should be kept a few degrees lower than in office buildings to maintain thermal comfort for students [33,34,35]. The definition of thermal comfort as “a condition of mind, which expresses satisfaction with the thermal environment” indicates the subjective nature of thermal comfort, based on 80% of acceptation by occupants [24,25]. The acceptable measure of thermal comfort across the world can be influenced by the type of climate, geographical conditions, and the built environment [36,37,38]. This study also compared and evaluated indoor thermal environment related to occupants’ thermal comfort in classrooms with different thermal mass in their building elements, which can be used in the processes of thermo-modernisation of school buildings in New Zealand or overseas under similar climatic conditions.
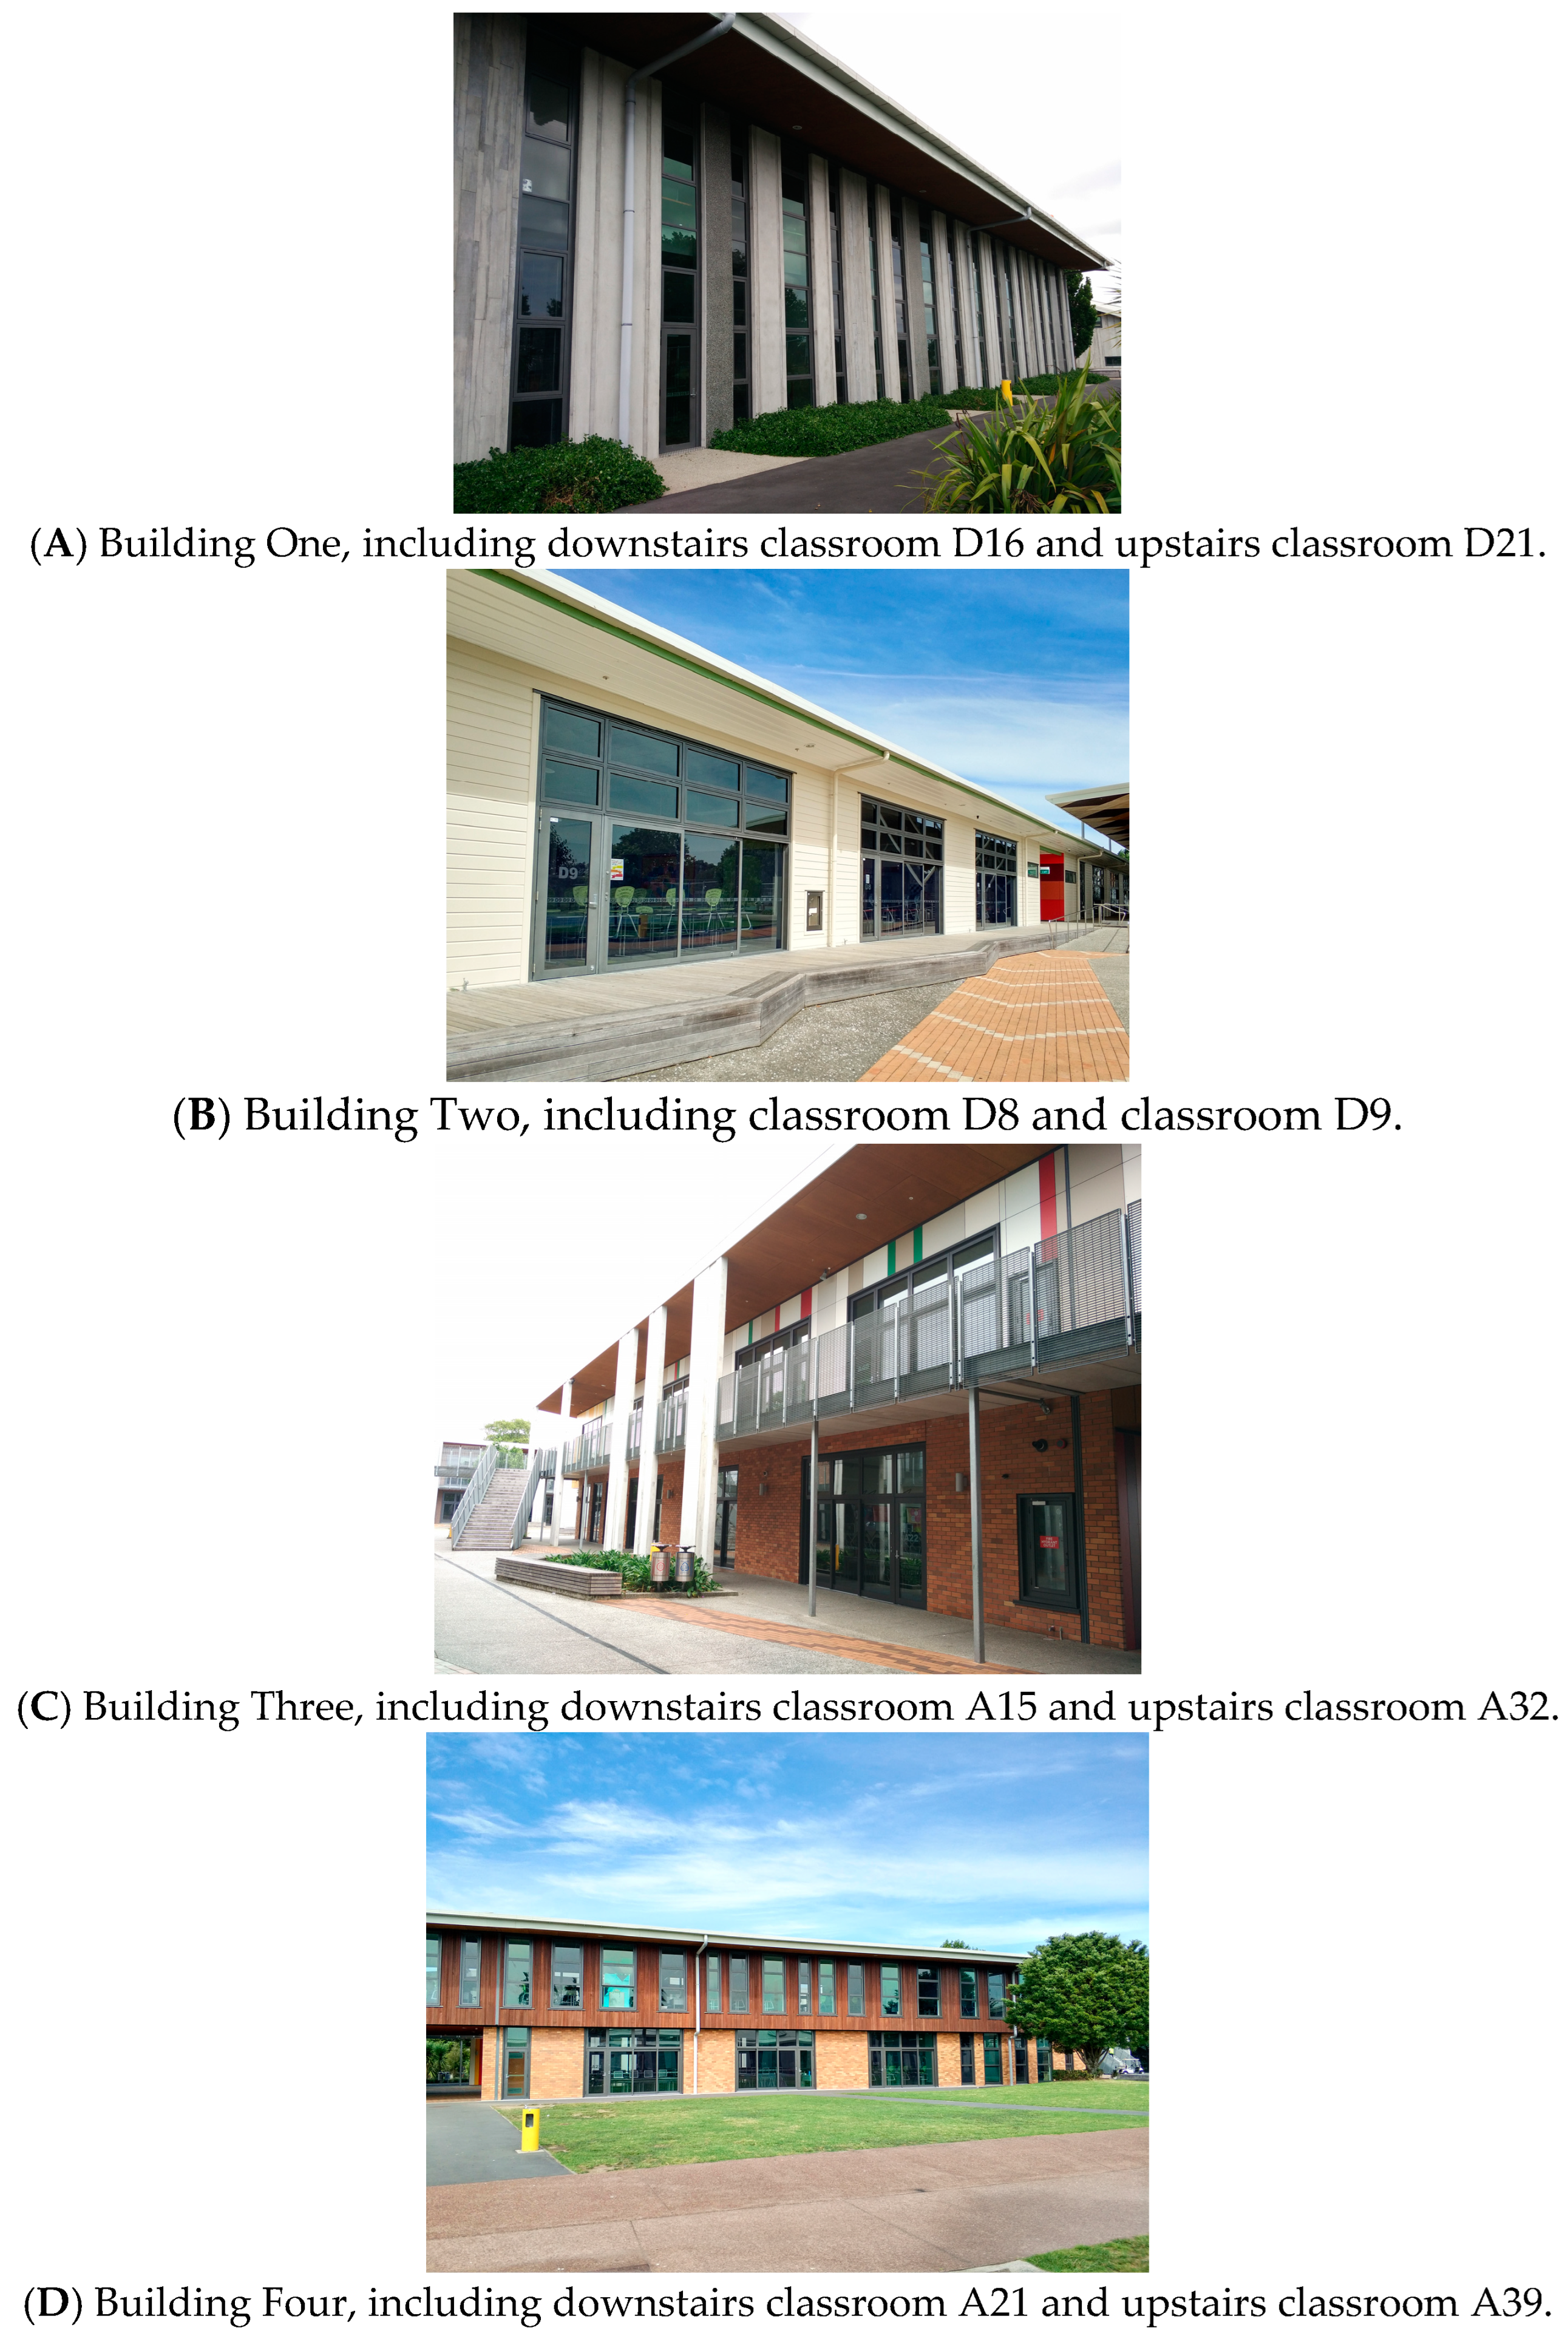
The first field study of the summer indoor thermal environment of classrooms with different moderate thermal mass in their building elements was carried out during the summer of 2015–16 at Avondale College, Auckland. As several important data loggers were damaged, the inadequate data could not be used for the study. The second field study of the summer indoor thermal environment of eight classrooms (A15, A32, A21, A39, D16, D21, D8, and D9) with different moderate thermal mass in their building structures, walls, floors, and partitions was carried out at Avondale College during the summer months from 14 December 2017 to 12 March 2018. The eight classrooms are in the middle of four buildings with a north-facing orientation. Figure 1 illustrates the four school buildings used for this study. Classrooms D16 and D21 are in Building One (Figure 1A), classrooms D8 and D9 are in Building Two (Figure 1B), classrooms A15 and A32 are in Building Three (Figure 1C), and classrooms A21 and A39 are in Building Four (Figure 1D). Materials used in the building elements of the eight classrooms are listed in Table 1. Construction characteristics related to thermal mass of the building elements are listed in Table 2.

Figure 1.
The four school buildings used for this study.

Table 1.
Materials used in the building elements of the eight classrooms.
Table 2.
Construction characteristics related to thermal mass of the four buildings (key: NTM = no thermal mass).
2. Material and Methods
Air temperatures and relative humidity (RH) adjacent to the ceiling and the floor, and in the shaded outdoor spaces under the roof eaves of the eight classrooms, were continuously measured at 15 min intervals, 24 h a day, from 14 December 2017 to 12 March 2018 using a HOBO UX100 Temp/RH Data Logger (ONSET, Bourne, MA, USA; environment temperature range: −20 to 70 °C, accuracy: ±0.21 °C from 0 to 50 °C; ±3.5% or ±2.5% accuracy from 15 to 95% or from 1 to 95% RH, respectively; memory for 84,650 measurements, user-selectable sampling rates, 1 s to 18 h intervals). The field-study timeframe includes the summer school holiday without students, from 14 December 2017 to 30 January 2018, and the summer school term with students, from 31 January 2018 to 12 March 2018. The measuring points adjacent to the ceiling and the floor were located close to the south internal walls. The measuring points under the roof eaves were on the south side of classrooms, which can minimise the impact of solar gain during the daytime.
The field-study data gathered during the summer school holiday, without the impact of natural and mechanical ventilation and occupants’ heat gain, were used to compare and evaluate the summer indoor thermal environment in the classrooms, which was purely impacted by the building’s thermal performance (building thermal design) under the local climate conditions.
During school hours of the summer school term, the indoor thermal environment of classrooms can be strongly impacted by opening windows and using ceiling fans, and by the occupants’ heat gain. The field-study data of school hours in the summer school term were used to generally compare and evaluate the indoor thermal environment, which was impacted by all the factors, including the buildings’ thermal design with or without thermal mass in their building elements, natural ventilation, mechanical ventilation, and occupants’ heat gain. During school hours of the summer school term, each sample classroom could be used for different courses, and could accommodate about 25 students. As the daily occupancy of each classroom during the summer school term (the field-study time) could be different, it was difficult to monitor or account for the heat gain of occupants, and time with open windows and fans in use for this study. As one of the data the loggers in one of the classrooms did not work and stopped recording after 10 February 2018 for unknown reasons, the field study data in the seven remaining classrooms during the summer school term were used for this study.
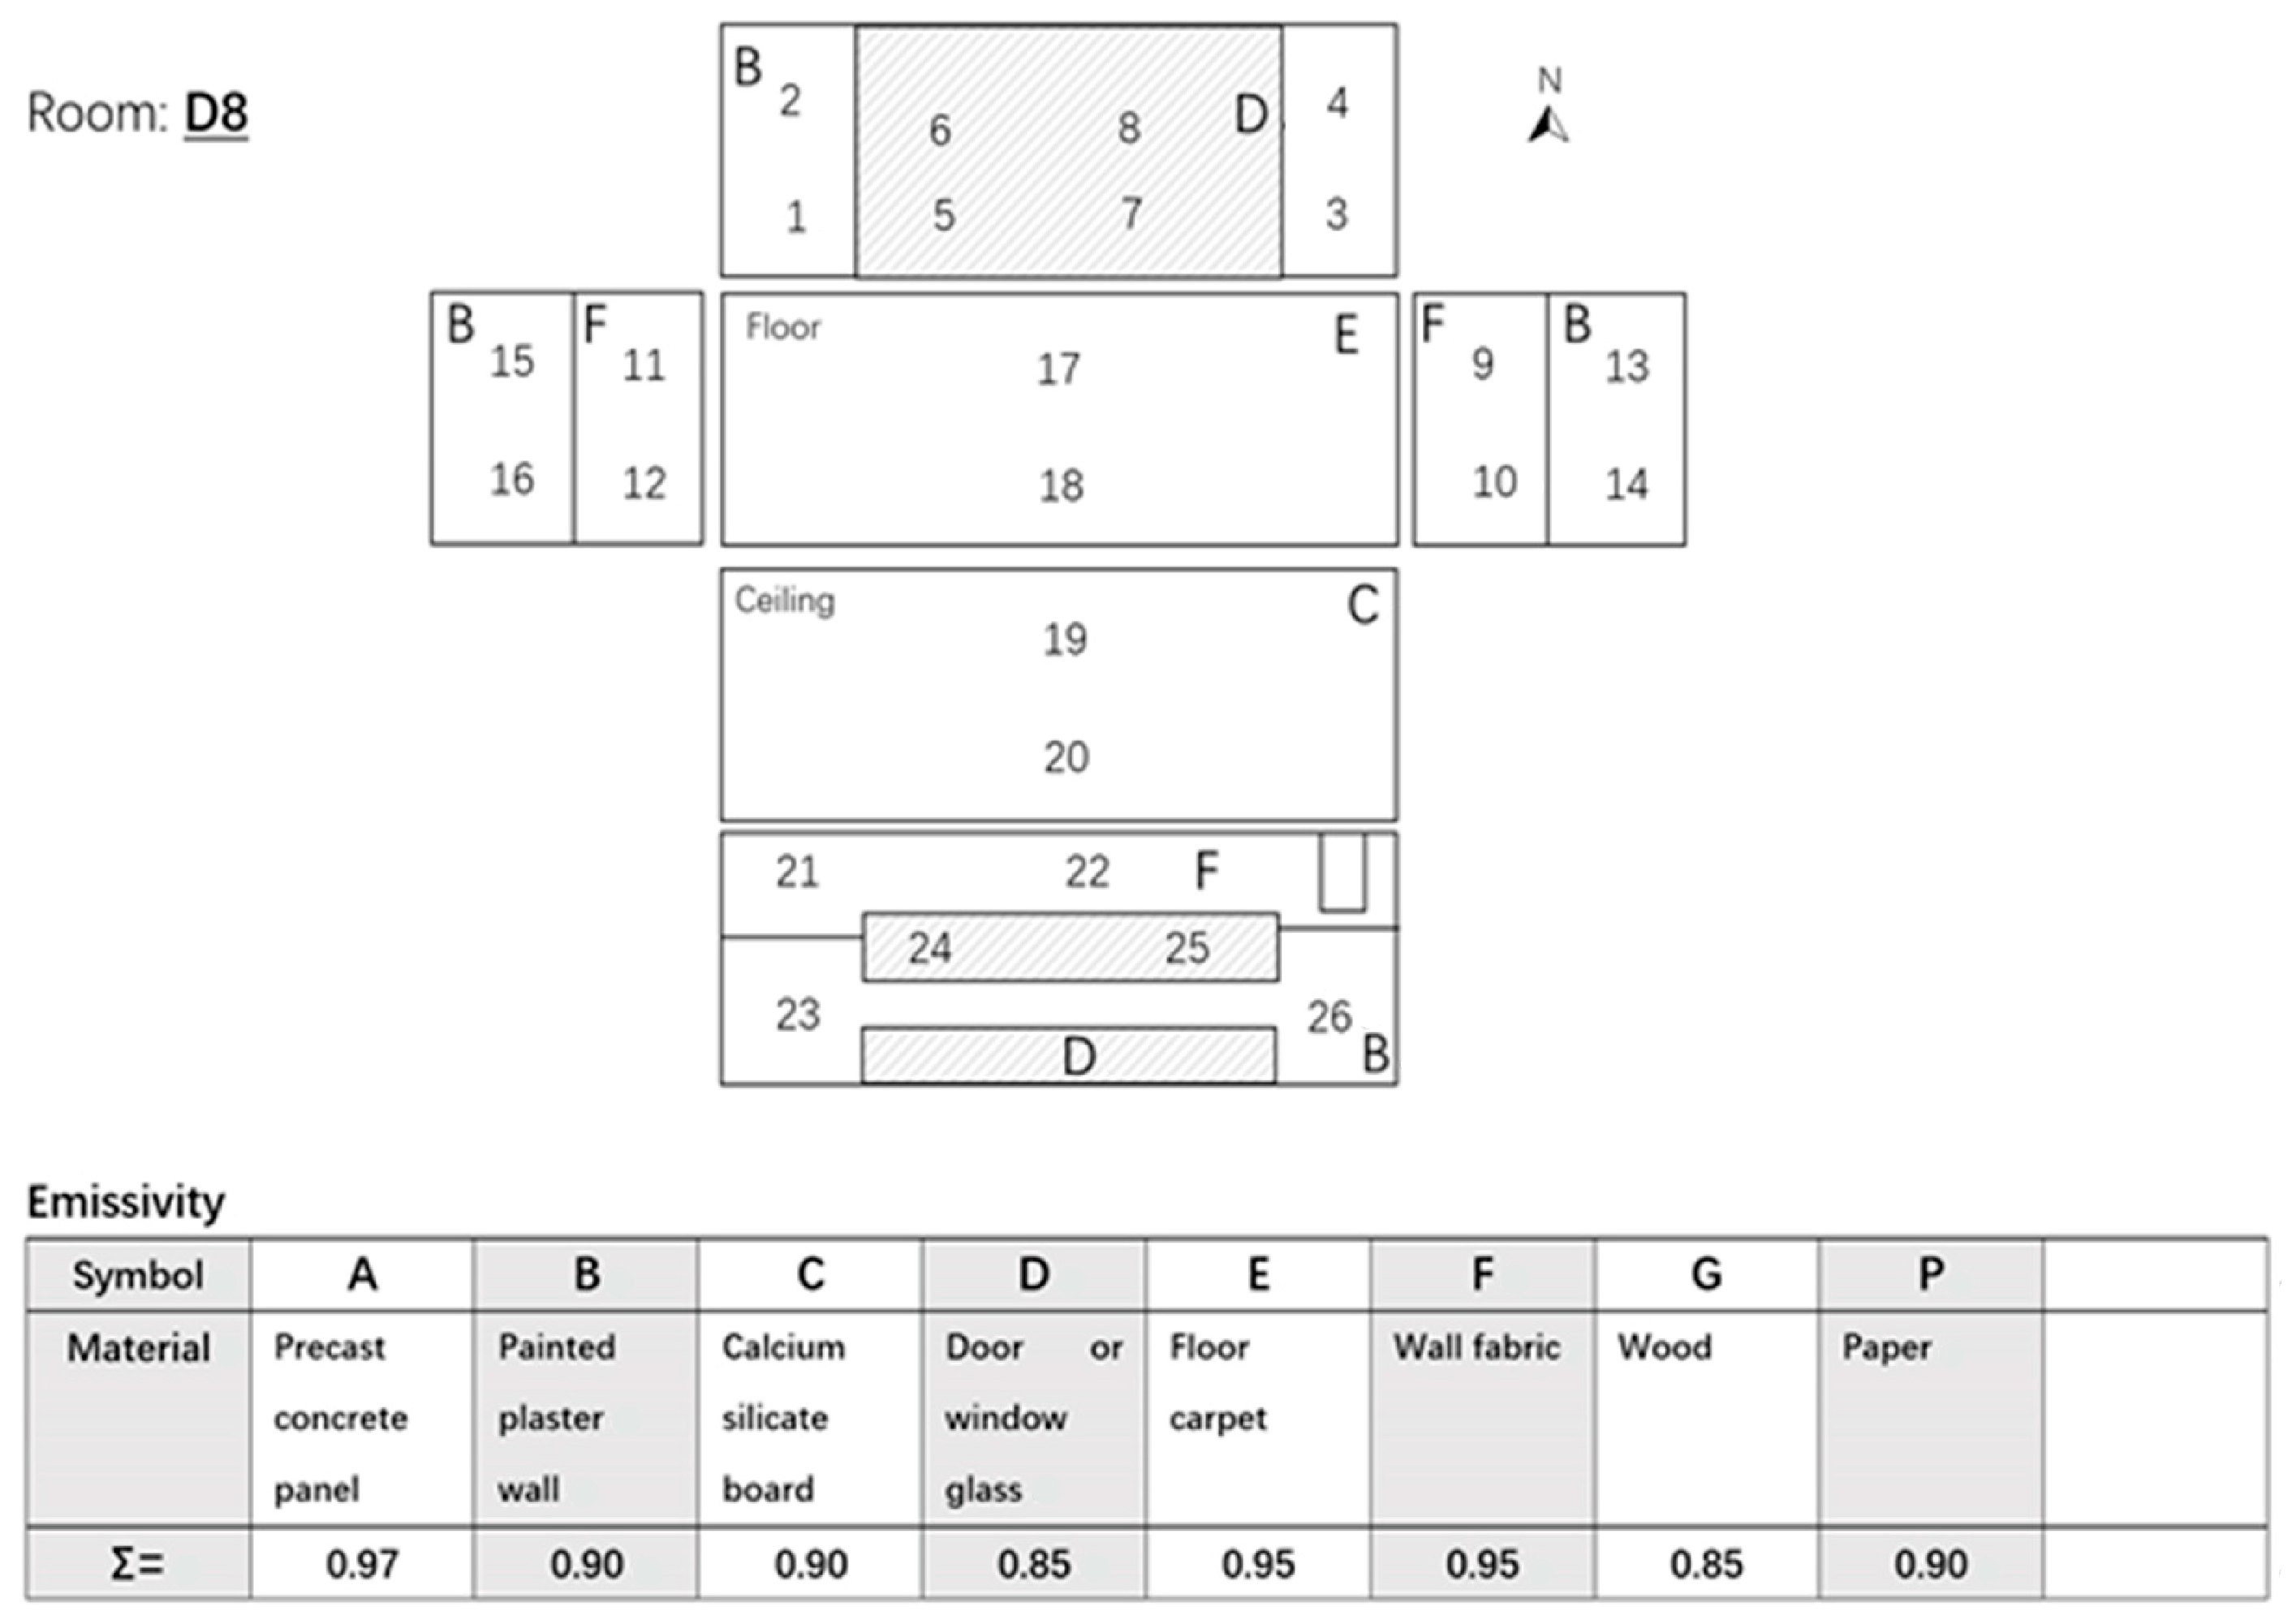
Surface temperatures of the ceilings, floors, walls and windows of four of the classrooms (D8, D9, D16, and D21) with or without thermal mass in their building elements were measured over several weekends, while empty, with windows and doors closed and ceiling fans turned off. Indoor surface temperatures were measured at about 45 min intervals from 11 a.m. to 3 p.m. (the warmest period) under different weather conditions (sunny, overcast, and rainy) using an FLIR E4 thermal imaging camera (object temperature range: −20 °C to +250 °C; thermal accuracy: ±2 °C or ±2% of reading, for ambient temperature 10 °C to 35 °C and object temperature above +0 °C; emissivity correction: variable from 0.1 to 1.0). The emissivity of the FLIR E4 thermal imaging camera was set up according to the surface material. There were at least two testing points for different surface materials or areas. Figure 2 illustrates a sample of the indoor surface temperature testing plan. Meanwhile, indoor dry bulb temperature, wet bulb temperature, globe temperature, and RH were also measured in the four classrooms with or without thermal mass in their building envelopes, structures, and partitions. Temperatures were taken using a 3M QUES Temp 36 Thermal Environmental Heat Stress Monitor (operating temperature range: −5 °C to +100 °C for sensor assembly and −5 °C to 60 °C for electronics; accuracy: ±0.5 °C between 0 °C and 120 °C temperature, ±5% between 20 to 95% RH) at seating height, on a desk in the middle of each of the four classrooms, at about 45 min intervals from 11 a.m. to 3 p.m. The dry bulb temperatures measured at seating height were used as indoor mean air temperature (ambient air temperature) to calculate the difference between surface temperature and air temperature for a comparison study.

Figure 2.
Test points (1–26) of indoor surface temperatures and their emissivity in classroom D8.
Indoor air movements were measured to compare the indoor thermal environment without ventilation (as described above) and with ventilation, and to evaluate ventilation design for restoring thermal comfort. Measurements were taken with a TSI Hot Wire Anemometer (air velocity range: 0 to 30 m/s, accuracy: ±3% of reading or ±0.015 m/s, resolution: 0.01 m/s) at seating height in the middle of the two classrooms D9 and D21 with or without thermal mass in their building elements at about 45 min intervals from 11 a.m. to 3 p.m. (the warmest period). Measurements were taken in different weather conditions (sunny, overcast, and rainy) on weekends (with no students in the classrooms); doors and windows were opened, and ceiling fans were turned on from 8.30 a.m.
The CBE thermal comfort tool for ASHRAE Standard 55 to calculate thermal comfort (https://comfort.cbe.berkeley.edu/ (accessed on 20 November 2023)) [39] was used to calculate predicted mean vote (PMV) and predicted percentage of dissatisfied (PPD), where the metabolic rate is 1.0 met for seating occupants and the clothing level (thermal insulation) is 0.57 clo for summer clothing. Mean radiant temperatures (MRT) were calculated according to globe temperature and air velocity at seating height in the middle of classrooms (Equation (1) [40]) for the comparison study.
where
MRT = mean radiant temperature (°C);
GT = globe temperature (°C);
V = air velocity (m/s);
T = air temperature (°C).
3. Results
3.1. Indoor Relative Humidity during the Summer School Holiday
Indoor RH and percentages of time related to different ranges of RH throughout the summer school holiday in the eight sample classrooms, based on the field-study data, are listed in Table 3; the summer indoor mean RH of these classrooms was 58–60%; the indoor RH was lower than 70% for 75–94% of the time, and lower than 80% for 96.2–100% of the time. The indoor hourly mean RH of the eight sample classrooms was lower than 65% (Figure 3). Indoor RH is not a major issue for the summer indoor thermal environment related to occupants’ thermal comfort [33,34], and this study mainly used indoor air temperatures to evaluate indoor thermal comfort related to students’ thermal comfort.
Table 3.
Indoor relative humidity and percentages of time related to different ranges of RH throughout the summer school holiday in the eight sample classrooms.
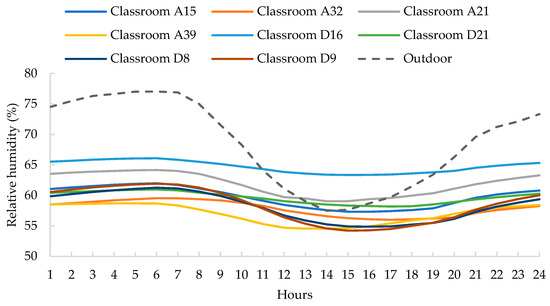
Figure 3.
Hourly mean relative humidity of the eight sample classrooms during the summer school holiday.
3.2. Indoor Air Temperature of Classrooms during the Summer School Holiday
Table 4 lists indoor temperatures and percentages of time related to different ranges of temperature of the eight classrooms during the summer school holiday without students. The eight classrooms are in the middle of buildings with north orientation and have sufficient insulation according to the current building codes [41,42]. Mean indoor air temperatures of the downstairs classrooms A15, A21, and D16 were 0.4 °C, 0.7 °C, and 1.1 °C lower than those of the upstairs classrooms A39, A32, and D21, respectively. The probable reason for this is because the downstairs classrooms have fewer external surface areas (north and south walls) than the upstairs classrooms (roof, north and south walls) for outdoor heat exchange (heat gain from outdoors). The downstairs classrooms have more buffering spaces (roof space and upstairs classroom) than the upstairs classrooms (roof space only) and have more resistance to prevent downward heat flow through the ceiling.
Table 4.
Indoor temperatures and percentages of time related to different ranges of temperature in the eight classrooms during the summer school holiday, without students.
Upstairs classroom D21 and classrooms D8 and D9 have the same external surface areas (roof, north and south walls), but D21 has thermal mass in its building elements, while D8 and D9 do not. The indoor mean air temperature of classroom D21 was 0.6 °C lower than those of classrooms D8 and D9. Classroom D21 had 15% and 17% more time when indoor air temperatures were lower than 25 °C than classrooms D8 and D9, respectively, and had 19% and 21% more time when indoor air temperatures were lower than 26 °C than classrooms D8 and D9, respectively. According to the field-study data, the summer indoor thermal environment of a classroom with thermal mass in its north wall, structure, floor, and partition is significantly better than that of a classroom without any thermal mass in its building elements. Without the impact of occupants’ heat gain, natural window ventilation, and mechanical ceiling-fan ventilation, the summer thermal performance of a school building with thermal mass in its north wall, structure, floor, and partition is significantly better than that of a conventional school building without any thermal mass.
Classrooms D8 and D9, without thermal mass, had larger fluctuations (11.3 °C and 11.4 °C, respectively) of indoor air temperatures than classroom D21 (7.0 °C), and the standard deviation of classrooms D8 and D9 (2.3 °C) was significantly higher than that of classroom D21 (1.4 °C). Classrooms D8 and D9 had about 21% of time when indoor temperatures were higher than 27 °C; classroom D21 only had 5% of such time. Classrooms D8 and D9 had 12% of time when indoor temperatures were higher than 28 °C; indoor temperatures of classroom D21 never reached 28 °C. Large fluctuations in indoor air temperatures can result in very high indoor air temperatures during the summer.
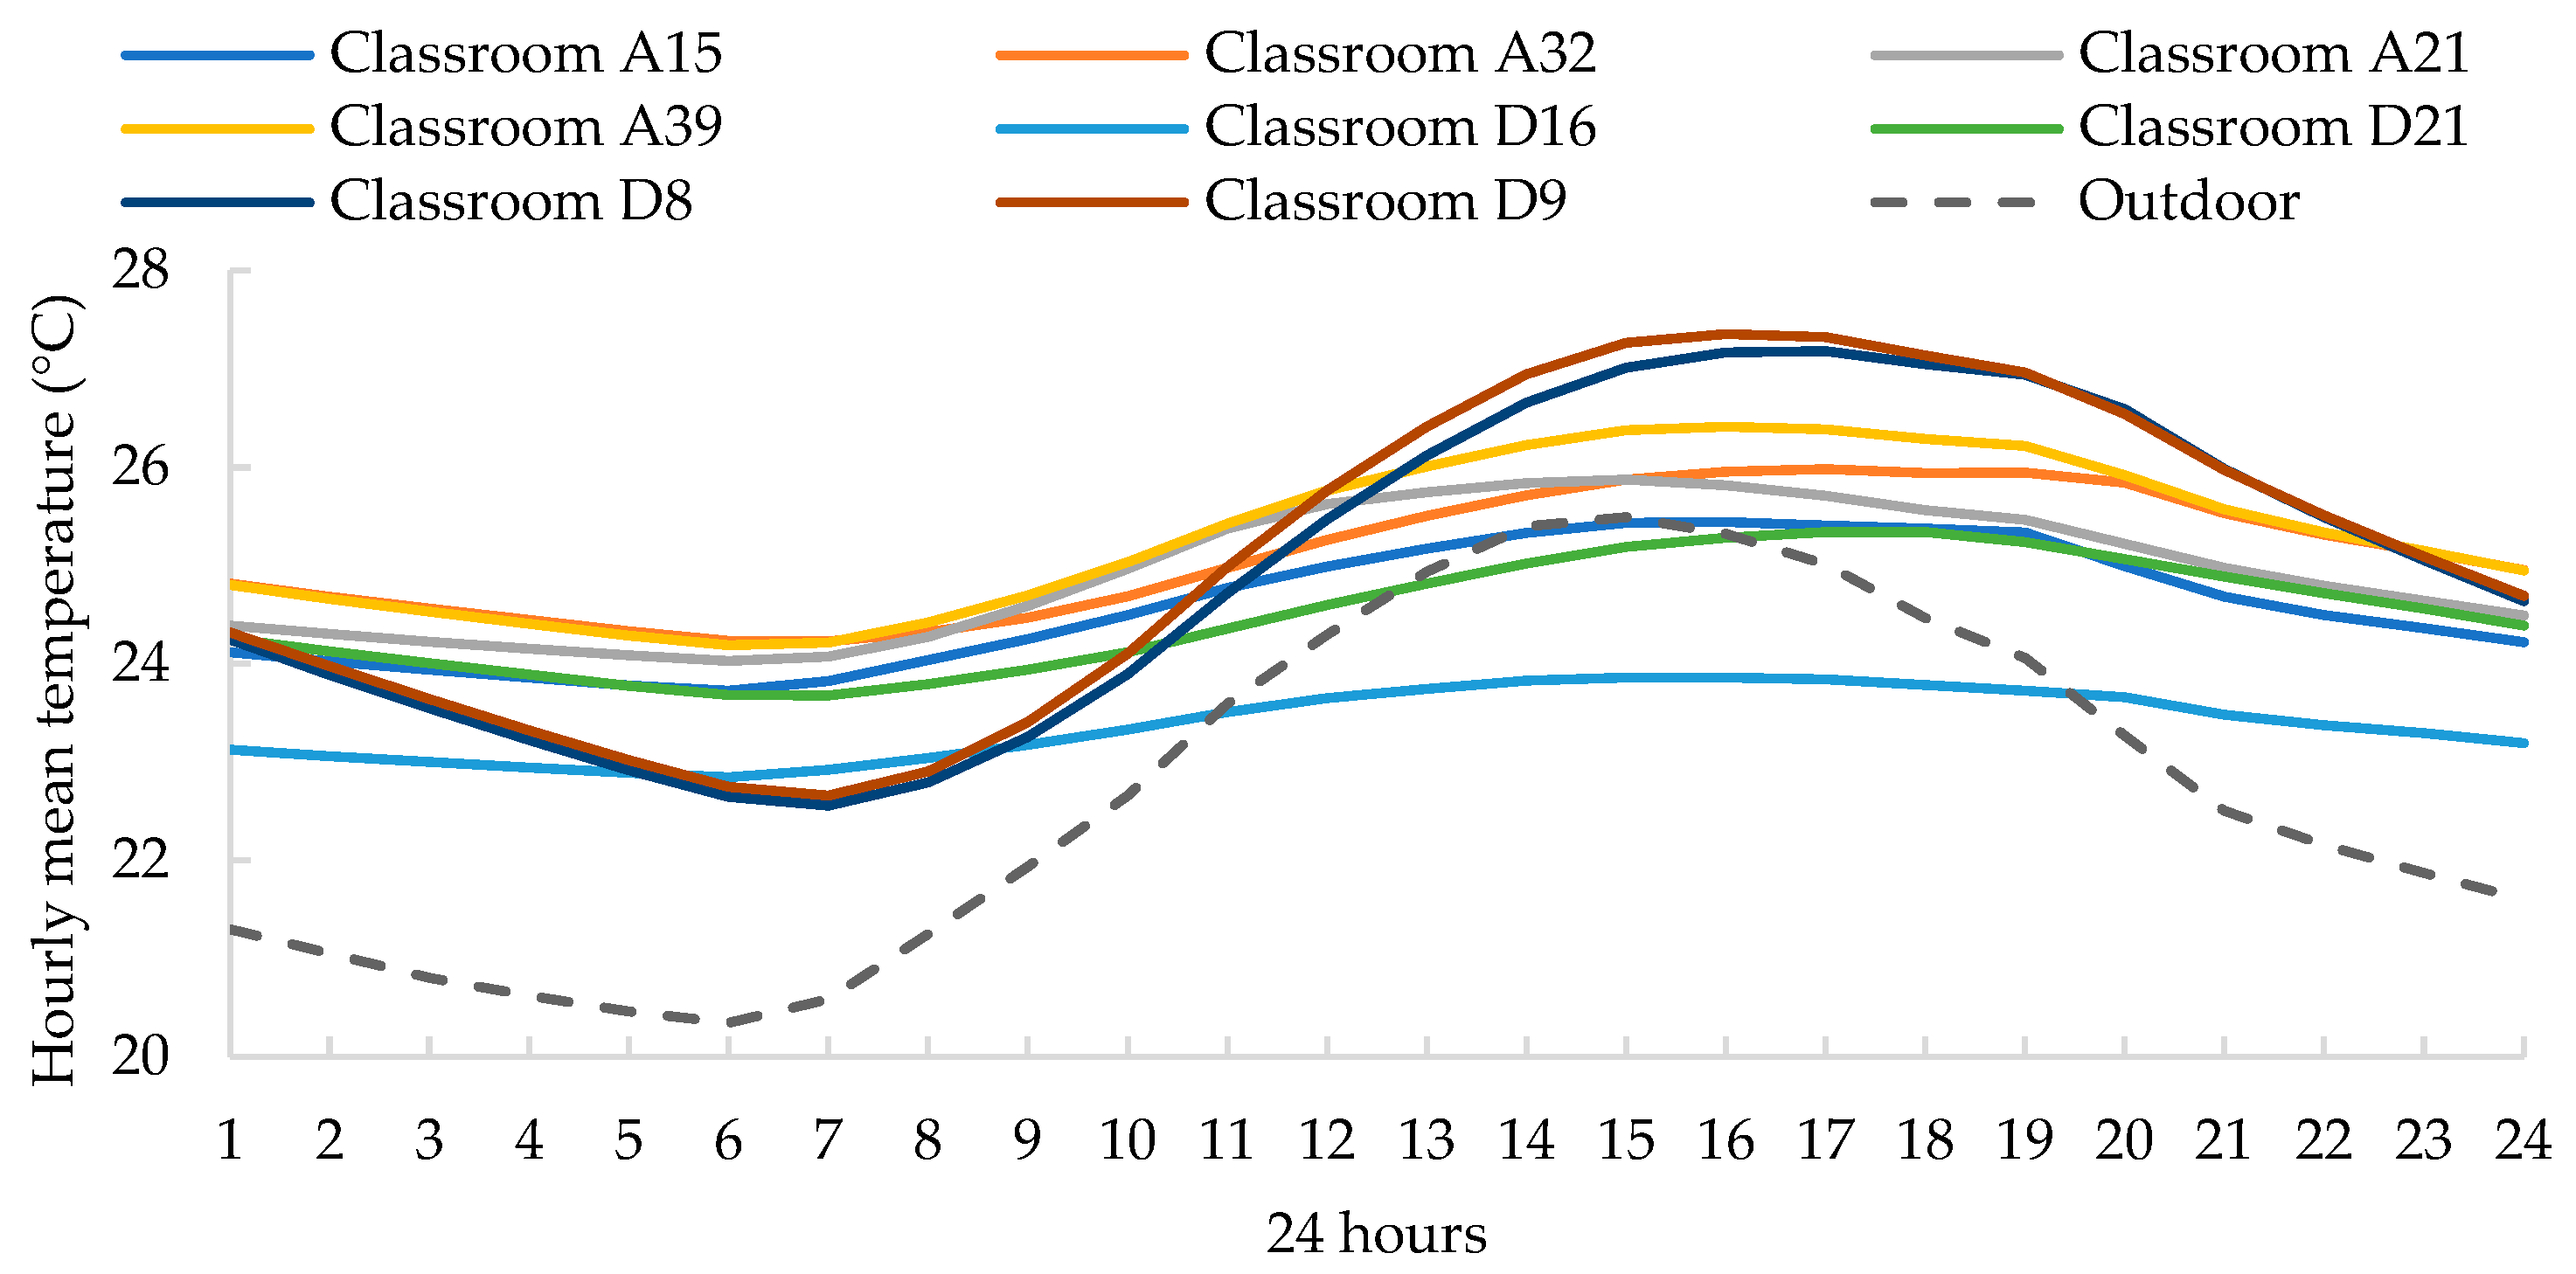
The recorded indoor hourly mean air temperatures show variation of indoor mean air temperatures of the four classrooms during the summer school holiday (Figure 4). Classrooms D8 and D9 had large variations of indoor hourly mean air temperatures during the summer school holiday, which were closely related to variations of outdoor temperatures. The lightweight building envelopes of classrooms D8 and D9 were easily and quickly heated up by solar radiation and rising outdoor temperatures during the daytime and cooled down during the night-time, which can result in large fluctuations and very high indoor hourly mean air temperatures. From noon to 9 p.m., indoor hourly mean air temperatures of classrooms D8 and D9 were higher than 26 °C, and from afternoon (2 p.m. to 3 p.m.) to 7 p.m., indoor hourly mean air temperatures of classrooms D8 and D9 were higher than 27 °C. Classrooms D21 and D16 (which had thermal mass in their building elements) had more stable indoor hourly mean air temperatures than classrooms D8 and D9 (without any thermal mass in their building elements). Indoor hourly mean air temperatures of upstairs classroom D21 were at times higher than 25 °C but never reached 26 °C. Indoor hourly mean air temperatures of downstairs classroom D16 never reached 25 °C. The thermal mass in the wall panels (PCIP—precast concrete insulated panel), especially on the north wall, can delay heat flow through the wall (time lag) and reduce heat gain from the outdoors (solar radiation and rising outdoor temperature). The thermal mass in the indoor surfaces (such as the floor, the indoor side of precast concrete insulated wall panels, and structural panels exposed to indoor space) can continuously absorb and store the heat from warm indoor air when the indoor air temperature is higher the thermal mass surface temperature. This can further reduce very high indoor air temperatures and improve the indoor summer thermal environment. Indoor hourly mean air temperatures of classrooms A15, A32, A21, and A39, with limited thermal mass in their floors and walls, were more stable than classrooms D8 and D9, with no thermal mass in their building elements.
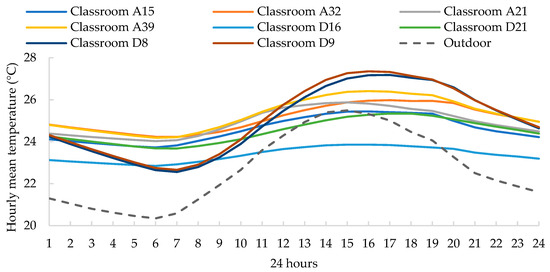
Figure 4.
Hourly mean air temperatures of the eight classrooms during the summer school holiday without students.
With fewer external surface areas (north and south walls only), the indoor mean air temperature of downstairs classroom D16, with thermal mass in its building elements (structure, walls, floor, and partition), was about 1.7 °C lower than classrooms D8 and D9, with no thermal mass in their building elements. Classroom D16 had 42% more time than classrooms D8 and D9, and had 26% more time than the upstairs classroom D21, when indoor air temperatures were lower than 25 °C. Generally, the summer thermal performance of a two-storey school building is better than that of a one-storey school building.
Classrooms A32 and A39 have the same external surface areas (roof, north and south walls) as classrooms D8 and D9. A32 and A39 have limited thermal mass (A32: floor and south wall; A39: floor), and classrooms D8 and D9 have no thermal mass in their building elements. The indoor mean air temperatures (25.3 °C and 25.3 °C, respectively) of upstairs classrooms A32 and A39 were slightly higher than the indoor mean air temperatures (25.0 °C and 25.1 °C, respectively) of classrooms D8 and D9. The upstairs classroom A39 had slightly more time than classrooms D8 and D9 when indoor air temperatures were lower than 25 °C. Classroom A39 clearly had less time than classrooms D8 and D9 when indoor air temperatures were higher than 26 °C, 27 °C, and 28 °C. The fluctuation of the indoor air temperature of classroom A39 (7.0 °C) was clearly lower than that of classrooms D8 and D9. As the concrete (thermal mass) in the floor is a high heat-capacity material, it can absorb more heat from the indoor environment (e.g., warm air) and store it longer than other low heat-capacity materials such as timber floors (classrooms D8 and D9: HF (hardwood floorboards)). The concrete (thermal mass) continuously absorbs heat if the indoor air temperature is warmer than its surface temperature, which can positively impact the summer indoor thermal environment. Based on the field study data, a classroom with thermal mass in the floor has a slightly better summer indoor thermal environment than a classroom without any thermal mass in its building elements.
With the same external surface areas (roof, north and south walls) and some more thermal mass (PCIP (precast concrete insulated panel)) on the south wall, the upstairs classroom A32 had a slightly better summer indoor thermal environment for students’ thermal comfort than classroom A39, with no thermal mass in its walls (north wall: TW (timber weatherboard); south wall: LCP (laminate cladding panel)). If the precast concrete insulated panels were located on the north wall, as in classrooms D16 and D21, the thermal mass could delay and reduce the major heat gain from the outdoors through the north wall, and the indoor thermal conditions could be better. Carefully selecting materials for a school building envelope can potentially impact the summer indoor thermal environment.
Upstairs classroom D21 has the same external surface areas (roof, north and south walls) as upstairs classrooms A39 and A32. Classroom D21 has thermal mass in its north wall, structure, floor, and partition; classroom A39 has thermal mass in its floor only; and classroom A32 has thermal mass in its floor and south wall. Classroom D21 had 22% and 18% more time when indoor air temperatures were lower than 25 °C than classrooms A39 and A32, respectively. Classroom D21 had 16% and 13% more time when indoor air temperatures were lower than 26 °C than classrooms A39 and A32, respectively. Downstairs classroom D16 has the same external surface areas (north and south walls) as downstairs classrooms A15 and A21. Classroom D16 has thermal mass in its north wall, structure, floor, and partition; classroom A15 has some thermal mass in its walls (north wall: BV (brick veneer); south wall: PCIP (precast concrete insulated panel); and floor); classroom A21 has limited thermal mass in its walls (north and south walls: BV). Classroom D16 had 29% and 36% more time when indoor air temperatures were lower than 25 °C than classrooms A15 and A21, respectively. Classroom D16 had 14% and 20% more time when indoor air temperatures were lower than 26 °C than classrooms A15 and A21, respectively. Based on the field study data, the more moderate thermal mass there is in the walls (especially in the north wall) and in the indoor surfaces of the wall, partitions, floor, and structure, the better the summer indoor thermal environment (for students’ thermal comfort) of the classroom is in the local climate.
With the same external surface areas (north and south walls), the downstairs classroom A15, with some thermal mass in its walls (north wall: BV, south wall: PCIP) and floor, had 7% and 6% more time than the downstairs classroom A21, with limited thermal mass in its walls (north wall: BV; south wall: BV) and floor, when indoor air temperatures were lower than 25 °C and 26 °C, respectively. The only difference between classroom A15 and classroom A21 was the south wall material. The south wall of classroom A15 (PCIP) has higher thermal mass than the hollow brick veneer; in addition, the precast concrete insulated panel has one side with concrete exposed to the indoor space, but the brick veneer does not have any thermal mass exposed to the indoor space, which results in some differences of indoor air temperatures between the two classrooms.
3.3. Indoor Air Temperature of Classrooms during Summer School Hours and the Summer School Term
Table 5 lists indoor temperatures and percentages of time related to different ranges of temperature of the seven classrooms during school hours in the summer school term, with students present. As one of data loggers in classroom D16 did not work, for unknown reasons, and stopped recording data after 10 February 2018, Table 5 excludes the field-study data of that classroom. During school hours, the daily occupancies, time with open windows, and time using ceiling fans in the seven classrooms were different and were difficult to monitor. Classrooms D21, D8, and D9 all have the same external surface areas (roof, north and south walls). D21 has thermal mass in its building elements, while classrooms D8 and D9 have none. Under the influence of unstable heat gain from students, uncertain natural ventilation from windows, and mechanical ventilation from ceiling fans, the fluctuation of indoor air temperatures of classroom D21 (8.5 °C) was still clearly smaller than that of classrooms D8 (10.9 °C) and D9 (11.6 °C). Though the indoor mean air temperature (25.2 °C) of classroom D21 was slightly lower than that of classrooms D8 (25.4 °C) and D9 (25.7 °C) during school hours, classroom D21 had 11% and 18% more time when indoor air temperatures were lower than 26 °C than classrooms D8 and D9, respectively. Classroom D21 had significantly more time than classrooms D8 and D9 when indoor air temperatures were lower than 27 °C, 28 °C, 29 °C, and 30 °C. The fluctuation of indoor air temperatures of classroom D21 was still clearly smaller than that of classrooms D8 and D9. The indoor thermal environmental condition of classroom D21 was more stable than that of classrooms D8 and D9. During school hours, the positive impact of thermal mass on the summer indoor thermal environment can still be identified.
Table 5.
Indoor temperature and percentages of time related to different ranges of temperatures during summer school hours in the summer school term with students present (9 a.m. to 3:30 p.m.).
With the same external surface areas (roof, north and south walls), mean indoor air temperatures during summer school hours of upstairs classrooms A32 (26.1 °C) and A39 (26.0 °C), with limited thermal mass in their building elements, were slightly higher than those of classrooms D8 (25.4 °C) and D9 (25.7 °C), with no thermal mass. Classrooms A32 and A39 had more time than classrooms D8 and D9 when indoor air temperatures were higher than 26 °C. Other factors, such as unstable heat gain from occupants, uncertain natural window ventilation, and irregular mechanical ceiling-fan ventilation, could have more impact on the indoor thermal environment than the positive impact of the limited thermal mass in the buildings; in addition, different daily usages of the classrooms could also impact the indoor thermal environment of the classrooms positively or negatively. For example, classroom A32 was used as a projector room (movie room) and the windows were covered by black curtains, which could negatively impact the indoor thermal environment. The fluctuations of indoor air temperatures of classrooms A32 (9.1 °C) and A39 (8.9 °C), with limited thermal mass, were still smaller than those of classrooms D8 (10.9 °C) and D9 (11.6 °C), with no thermal mass. Classrooms A32 and A39 had less time than classrooms D8 and D9 when indoor air temperatures were higher than 28 °C, 29 °C, and 30 °C. Based on the field study data, limited moderate thermal mass in school building elements can still moderate indoor air temperature, which reduces very high or extremely high indoor temperatures during summer school hours.
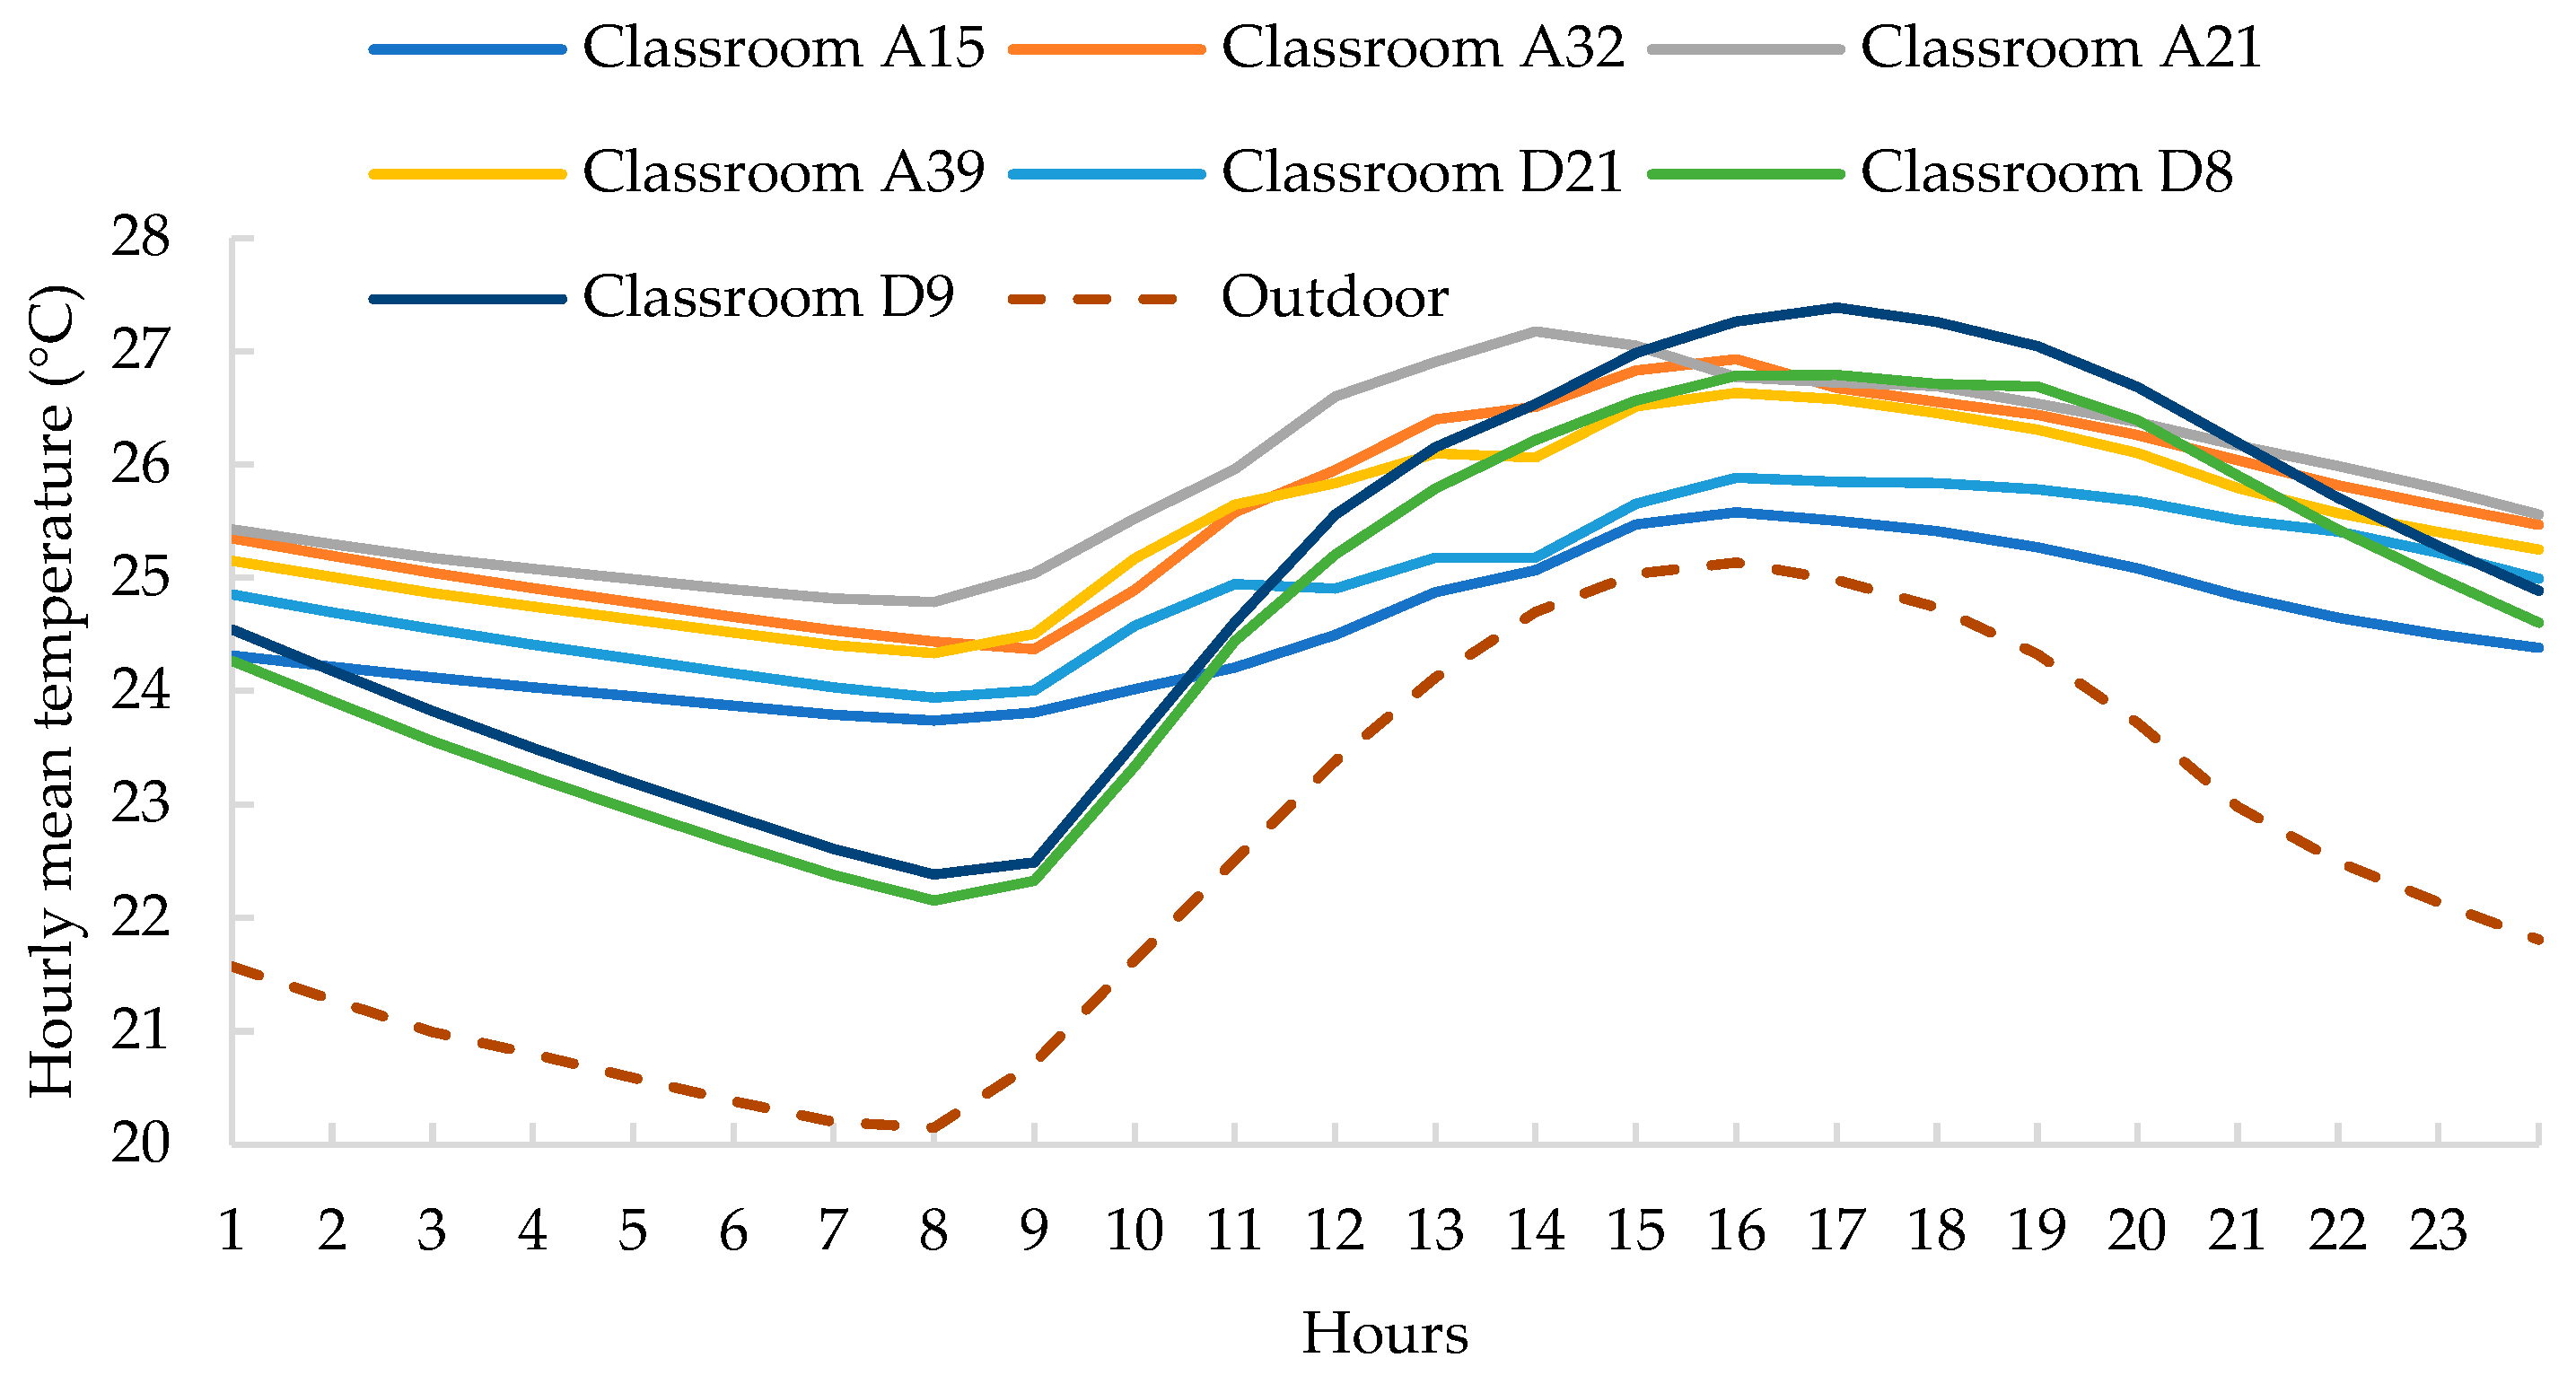
Figure 5 illustrates the hourly mean air temperatures of the seven classrooms during the summer school term. Because of the impact of unstable heat gain from occupants, uncertain natural window ventilation, and irregular mechanical ceiling-fan ventilation during school hours, indoor hourly mean air temperatures of the seven sample classrooms during the summer school term (and especially during school hours) were not as stable as temperatures in the seven classrooms during the summer school holiday (see Figure 4. Generally, fluctuations of indoor hourly mean air temperatures of the classrooms with limited thermal mass or more thermal mass (A15, A32, A21, A39, and D21) are still smaller than those of the classrooms without any thermal mass (D8 and D9) during the summer school term. Indoor hourly mean air temperatures of classroom D21, with more thermal mass in its building elements, were clearly more stable and lower than those of classrooms D8 and D9, with no thermal mass in their building elements, and classrooms A15, A32, A21, and A39, with some thermal mass in their building elements, during the summer school hours. This reveals very good summer thermal performance of a classroom with thermal mass in its structure, walls, floor, and partitions.
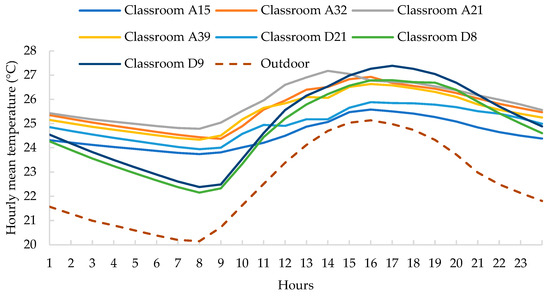
Figure 5.
Hourly mean air temperatures of the seven classrooms during the summer school term with students present.
3.4. Indoor Surface Temperature, Mean Temperature and Thermal Comfort without Ventilation
Table 6 lists indoor surface temperatures and air temperatures at seating height in classrooms D8, D9, D16, and D21 without the impact of natural and mechanical ventilation during weekends under different weather conditions. In different weather conditions, internal surface temperatures of the north windows of the four classrooms were comparatively higher than other indoor surfaces. On sunny days, the north window surface temperatures of classrooms D8 and D9 were more than 3 or 4 °C higher than the mean air temperature at seating height in the middle of the classrooms, and some indoor surface temperatures of classrooms D8 and D9 were over 2 °C higher than the mean air temperature at seating height in the middle of the classrooms. Those indoor surfaces with high temperatures can negatively impact on students’ thermal comfort due to excessive radiative heat gain from the warmer indoor surfaces [43,44,45]. On overcast and rainy days, some north window surface temperatures were more than 2 or 3 °C higher than the mean air temperature at seating height in the middle of the classrooms; other indoor surface temperatures were less than 1 °C higher than the mean air temperature at seating height in the middle of the classrooms. The high north window surface temperatures could result in radiant asymmetry and negatively impact summer indoor thermal comfort for students, as the excessively warm surfaces can make individuals feel excessively warm.
Table 6.
Indoor surface temperatures and air temperatures at seating height in classrooms D8, D9, D16, and D21 without the impact of natural and mechanical ventilation during weekends under different weather conditions.
With the same external surface areas (roof, north and south walls), during sunny afternoons, the indoor mean air temperature at seating height in classroom D21 (with thermal mass in its building elements) was 0.5 °C and 0.8 °C lower than those in classrooms D8 and D9 (without any thermal mass in their building elements), respectively. The indoor surface temperatures of classroom D21 (with thermal mass in its building elements) were significantly lower than those in classrooms D8 and D9 (without any thermal mass in their building elements); the mean difference of indoor surface temperatures between classroom D21 and classrooms D8 and D9 was 2.3 °C, with a range from 1.4 °C to 3.7 °C. With less external surface area (north and south walls only), the indoor mean air temperature at seating height in classroom D16 (with thermal mass in its building elements) was 0.4 °C and 0.1 °C lower than those of classrooms D8 and D9 (without any thermal mass in their building elements), respectively. The indoor surface temperatures of classroom D16 (with thermal mass in its building elements) were significantly lower than those of classrooms D8 and D9 (without any thermal mass in their building elements); the mean difference of indoor surface temperatures between classroom D16 and classrooms D8 and D9 was 3.1 °C, with a range from 1.3 °C to 4.8 °C. The presence of thermal mass in a building’s envelope (especially in the north wall, facing the sun) allows for the storage of heat gain from the outdoor environment. This can delay the heat passing through the building envelope and mitigate temperature increases of indoor surfaces and indoor space during hot summer conditions. Furthermore, the internal thermal mass in the floor, ceiling, and internal walls can absorb the heat from warmer indoor air and can also reduce indoor air temperature. In a building without thermal mass in its walls, the heat from the outdoor environment can more easily and quickly penetrate through the building’s envelope and result in high indoor surface and air temperatures.
Table 7 lists the indoor thermal environmental conditions at seating height in classrooms D8, D9, D16, and D21 without the impact of natural and mechanical ventilation during weekends under different weather conditions. The indoor MRT of classrooms D8 and D9 were 1.8 °C and 2.1 °C higher, respectively, than that of classroom D21. The indoor MRT of classrooms D8 and D9 were 2.2 °C and 2.7 °C higher, respectively, than that of classroom D16. The thermal sensation of classrooms D8 and D9 was slightly warm (PMV: 1.46, close to warm) and warm. The thermal sensation of both classrooms D21 and D16 was slightly warm. Based on the field study data, high indoor mean surface temperature results in high mean radiant temperature, which can negatively impact the indoor thermal environment related to students’ thermal comfort. Although classrooms D21 and D16 (with thermal mass in their building elements) clearly had better summer indoor thermal environments than classrooms D8 and D9 (without thermal mass in their building elements), the indoor thermal environments of all four classrooms did not meet the requirements of thermal comfort for students, and they do need ventilation to achieve summer thermal comfort for students.
Table 7.
Indoor thermal conditions at seating height in classrooms D8, D9, D16, and D21 without the impact of natural and mechanical ventilation during weekends under different weather conditions.
3.5. Indoor Thermal Comfort with Ventilation
Table 8 lists the indoor thermal environmental conditions at seating height in classrooms D9 and D21 with the impact of natural and mechanical ventilation during weekends under different weather conditions. The recorded mean air velocity at seating height in classrooms D21 and D9 was 0.2 m/s, with a range from 0.1 to 0.3 m/s, which is used to calculate indoor thermal comfort (predicted mean vote (PMV), thermal sensation, and predicted percentage of dissatisfied (PPD)). With natural window ventilation and mechanical ceiling-fan ventilation, the indoor thermal sensation at seating height in the middle of classrooms D9 and D21 was neutral or marginal slightly cool. The current thermal-control design, with natural window ventilation and mechanical ceiling-fan ventilation, can efficiently maintain the indoor thermal comfort for classrooms with and without thermal mass in their building structures, walls, floors, and partitions during the summer.
Table 8.
Indoor thermal environmental conditions at seating height in classrooms D9 and D21 with the impact of natural and mechanical ventilation during weekends under different weather conditions.
Under the same weather conditions and with the same indoor ventilation conditions, indoor air temperature, globe temperature and MRT at seating height in the middle of classroom D21 were clearly lower than in classroom D9 in different weather conditions (sunny, overcast and raining). The PMV of classroom D21 was clearly lower than that of classroom D9 in different weather conditions during the summer. For example, the summer indoor thermal environment of classroom D21 (slightly cool) was cooler than that of classroom D9 (neutral) during a sunny day. With the current thermal-control design of natural window ventilation and mechanical ceiling-fan ventilation, a school building with thermal mass in its building structure, envelope and partitions can provide better indoor thermal conditions for maintaining students’ thermal comfort during the Auckland summer.
4. Discussion
The redevelopment of Avondale College from 2010 to 2014 (design by Jasmax) represented one of the biggest school rebuilding programmes in New Zealand’s history. The project provided the school’s 2750 students with 92 new and refurbished teaching and resource spaces. It was the first time that Thermomass precast concrete insulated panels (thermal mass) had been used as the main structure and building envelope of a new two-storey school building. Other one- or two-storey, new or refurbished buildings at Avondale College are of conventional lightweight timber-frame construction with internal insulation and external cladding. This redevelopment project provided an opportunity to study indoor thermal environments of school buildings with different moderate thermal mass in building elements in a temperate climate with warm, dry summers and mild, wet winters.
According to the authors’ previous winter field-studies [2,3], a school building with thermal mass in its building structure, walls, floors, and partitions has a significantly better winter indoor thermal environment, related to students’ thermal comfort and health, than a school building without any thermal mass in its building elements. Based on the winter field-study data, a classroom with thermal mass in its building elements had 30%, 35%, and 10% more time than a classroom without thermal mass in its building elements when indoor air temperatures were greater than or equal to 16 °C, 18 °C, and 20 °C, respectively. The minimum threshold of indoor temperature required for limiting respiratory infections is 16 °C [46]; 18 °C is the minimum indoor air temperature required by the WHO [47], and 20 °C the WHO’s minimum for young children and ill or elderly people. A classroom with thermal mass in its building elements had 21.4% more time than a classroom without thermal mass in its building elements when indoor relative humidity was in the optimal range from 40% to 60% during the winter, which can minimise indirect indoor health effects such as bacteria, viruses, fungi, mites, respiratory infections, allergic rhinitis, asthma, etc. [48]. This study contributes the summer field-study data to add to the previous winter field-study data and demonstrates that a school building with thermal mass in its building elements is adequate for students’ thermal comfort in the local climate.
Findings of this study can draw architects’ attention to the relationship between summer indoor environment and a school building’s thermal design with moderate thermal mass in the building elements for the local climate. The findings can be used as a general strategy for retrofitting old school buildings or for new school building development. The study was focused on school buildings in Auckland, New Zealand, but the findings can be applicable to school building design in a temperate climate with a warm and dry summer. If the findings are applied, this will lead to the improvement of the summer indoor environmental quality of school buildings, related to students’ thermal comfort. The findings can apply not only to local school buildings, but also potentially to other types of free-running buildings of similar size—such as a small library, a small office building or a small commercial building—mainly being occupied during the daytime, using ceiling fans as the only mechanical thermal-control method during the summer.
The heat-storage capacity of thermal mass in the buildings is closely related to the local diurnal temperature range. Thermal mass is most appropriate in a climate with a larger diurnal temperature range. Recent studies of the impact of thermal mass on the summer indoor thermal environments of school buildings [7,17,18,19,20] were mainly carried out in hot-dry or semi-arid climates, with larger diurnal temperature ranges (over 10 °C), or more severe summer conditions than Auckland has. Auckland has a temperate climate and a relatively comfortable warm and dry summer with a 7.6–7.9 °C summer diurnal temperature ranges (Table 9) within the medium diurnal temperature range (6–10 °C). Building elements with moderate thermal mass, such as concrete floor slabs, brick veneer, or precast concrete cladding panels, are normally used in a climate with the medium diurnal temperature range [49]. According to the rule of thumb [50], adequate thermal mass in a building can increase the upper limit of the local summer comfort zone by a quarter of the local diurnal temperature. For example, the Auckland summer maximum diurnal temperature is 7.9 °C in February, and the maximum effectiveness of thermal mass is about 2 °C. According to this study, there is a difference of only 0.6–1.7 °C of indoor mean air temperature between the classrooms with or without thermal mass in their building elements (Table 4). It is hard for this study to only use indoor mean air temperature to identify the differences of indoor thermal environments of classrooms with different moderate thermal mass in their building elements. This study has tried to establish a suitable research method to identify the differences in indoor thermal environments in school buildings with different moderate thermal mass in their building elements, under summer conditions with a medium range of diurnal temperatures. It is also crucial to establish an appropriate research method to analyse the field-study data. For example, this study used not only the mean indoor air temperatures but also the percentage of time in summer when the indoor air temperatures were within the summer comfort zone.
Table 9.
Auckland mean climate data provided by NIWA (National Institute of Water and Atmospheric Research).
There are not universally accepted thermal comfort conditions across the world. For a tropical climate, early studies suggest that the summer thermal comfort zone is from 23–29 °C with 30–70% RH [51] or from 22–26 °C with 30–80% RH [52]. A temperature range from 22–27 °C with an optimum temperature of 25 °C and 60% RH has been proposed as a summer thermal comfort zone [53,54]. In accordance with the Graphic Comfort Zone Method of ASHRAE Standard 55 [25], the acceptable range of summer operative temperatures for indoor space is from 24.5–28 °C for 80% occupant acceptability and 10% dissatisfaction, where the occupants have activity levels that result in metabolic rates between 1.0 and 1.3 met, clothing is worn that provides 0.5 clo of thermal insulation, and the air speeds are not greater than 0.20 m/s.
Auckland has a warm and relatively dry summer from December to February. According to Auckland climate data (Table 9), February is the warmest month. Based on the adaptive model [25] and the mean outdoor temperature To (19.7 °C) in February, the neutral temperature (Tn) (Equation (2)) is 23.3 °C and the summer comfort zone is from 21.9 °C (the lower comfort limit: Tn − 2 °C) to 25.9 °C (the upper comfort limit: Tn + 2 °C). Based on another study (using the adaptive model) [55] and the average outdoor temperature (To.av), the summer comfort zone has been set at 2.5 °C above and below the neutral temperature (Tn) (Equation (3)) for 90% acceptability. The neutral temperature (Tn) during the hottest summer month (February) in Auckland is 21.7 °C, and the summer comfort zone for local people is from 21.2 °C (the lower comfort limit: Tn − 2.5 °C) to 26.2 °C (the upper comfort limit: Tn + 2.5 °C). The local researchers used 20–25 °C as the summer comfort zone [56,57,58], or 16–26 °C for both winter and summer comfort zones for their housing studies [59].
where
To = the mean monthly outdoor temperature (°C);
Tn = neutral temperature (°C).
where
To.av. = the average monthly outdoor temperature (°C);
Tn = neutral temperature (°C).
This study tried to identify the difference in indoor thermal environment between classrooms with different moderate thermal mass in their building elements. According to previous studies and thermal standards [25,52,55,56,57,58,59], 25 °C or 26 °C are more commonly used as the upper summer comfort limit. This study used percentages of time related to different ranges of indoor air temperature, especially when the temperatures were higher or lower than 25 °C or 26 °C (the upper limit of the summer comfort zone), to compare and evaluate the summer indoor thermal environment related to potential summer thermal comfort of the sample classrooms. The field study data of indoor and outdoor air temperatures were converted into percentages of time in summer related to different ranges of indoor mean air temperatures using Microsoft Excel spreadsheet software 2021.
The study also used hourly mean temperatures to compare the differences and the variations of indoor air temperatures through the summer. All field-study data were converted into hourly mean temperatures and RH through Microsoft Excel spreadsheet software, which can be used to represent mean variation of indoor temperatures and RH and compare differences throughout the summer. The hourly mean temperature or RH was derived from averaging all temperature or RH data within a particular hour (e.g., at 1 a.m., 1:15 a.m., 1:30 a.m., and 1:45 a.m.) for all summer days. The hourly mean temperature and RH data used in this study are the averages of the hundreds of temperature and RH measurements within a particular hour on all summer days. As the temperature and RH at a particular testing time on different summer days could be significantly different, the hourly mean temperatures and the hourly mean RH for the whole summer (or partial summer: summer school term or summer school holiday) may not precisely follow the correlation between air temperature and RH (RH decreases or increases in association with increasing or decreasing temperature), but the correlation between ranges of their variations can still be identified and used to compare the variations of summer indoor thermal environments.
During the summer, indoor surface temperatures must be cool enough to avoid occupant discomfort due to excessive radiant heat gain from warm indoor surfaces [43]. A previous study showed that ceiling temperatures that are more than 4 °C above ambient air temperature are likely to result in occupants experiencing radiant heat gain from the ceiling [44]. Another study suggested that indoor air temperature should be between 20 °C and 24 °C, RH should be between 40% and 60%, and the surface temperature of nearby objects should not be more than 2–3 °C higher than the air temperature to maintain summer thermal comfort for occupants [45]. The current study also used indoor surface temperatures and the difference between indoor surface temperature to indoor mean air temperature at seating height (ambient air temperature) to compare and evaluate the indoor thermal environment for students’ thermal comfort.
A high mean radiant temperature (MRT) and radiation asymmetry can negatively impact summer indoor thermal comfort, a factor which is often ignored. The effect of a one-degree difference between MRT and air temperature in a traditional air-conditioning space equates to raising the air temperature by approximately one degree [60]. Radiant asymmetry can cause local thermal discomfort, and people are generally more sensitive to asymmetric radiation caused by a warm ceiling than that caused by a hot vertical surface. A difference of one comfort vote interval could be attributed to a frontal radiant temperature difference of about 2.8 °C. A 33 °C difference brought about a one vote difference for persons side-on to the radiant source [61]. According to the ASHRAE thermal comfort standard, the allowable radiant temperature asymmetry for a warm ceiling is less than 7 °C, and for a hot vertical surface less than 23 °C, for maintaining indoor thermal comfort [25]. The current study also used globe temperature and air velocity at seating height in the middle of classrooms to calculate and compare indoor MRT and thermal comfort.
A limitation of this study is the lack of survey data on students’ thermal comfort. During the school term, the sample classrooms could be used for different courses or by different groups of students; the original plan of a survey could not be carried out as it was difficult to identify the appropriate participants (students) for the survey related to the sample classrooms.
5. Conclusions
Based on the field studies, this study contributes new physical data of the summer indoor thermal environments of school buildings, either with, with limited, or without moderate thermal mass in their building elements (structure, walls, floor, and partitions), in a temperate climate with a relatively comfortable warm and dry summer and a summer diurnal temperature in the medium range. This study identified the differences in summer indoor thermal environments between those school buildings with different moderate thermal mass in their building elements. This study provided evidence to prove that moderate thermal mass in school building elements can positively impact the summer indoor thermal environment of school buildings in a temperate climate with a relatively comfortable warm and dry summer.
During the summer school holiday, without the impact of occupants’ heat gain and natural or mechanical ventilation, the indoor thermal environment of a classroom was solely impacted by the building’s thermal performance. During the school holiday, the classrooms with moderate thermal mass in their building elements had an average of 16% and 18% more time than classrooms without any thermal mass in their building elements when indoor air temperatures were lower than 25 °C and 26 °C, respectively. Temperatures of 25 °C and 26 °C are commonly used as the upper summer comfort limit according to previous studies and building codes. The north window surface temperatures of the classrooms without any thermal mass in their building elements were over 3 °C or 4 °C higher than the mean air temperatures at seating height in the middle of the classrooms, and some indoor surface temperatures of those classrooms were over 2 °C higher than the mean air temperatures at seating height. Those high indoor-surface temperatures can negatively impact the thermal comfort of occupants. Architects and designers should pay more attention to the high surface temperatures of north-facing windows. The indoor surface temperatures of the classrooms without any thermal mass in their building elements were significantly higher than those of the classrooms with thermal mass in their building elements; the mean difference of indoor surface temperatures between the classrooms with and without thermal mass in their building elements was 2.3 °C, with a range from 1.4 °C to 3.7 °C. On sunny days, the indoor MRTs of the classrooms without any thermal mass in their building elements were significantly higher than those of the classrooms with thermal mass in their building elements; the mean difference of indoor MRTs between the classrooms with and without any thermal mass in their building elements was 2.15 °C, with a range from 1.6 °C to 2.7 °C. The thermal sensation scale of the classrooms without any thermal mass in their building elements was from 1.48, slightly warm (but very close to 1.5, warm), to 1.5, warm; the thermal sensation scale of the classrooms with thermal mass in their building elements was from 1.03 to 1.05 (slightly warm only).
During school hours in the summer term, the indoor thermal environment of a classroom was also impacted by occupants’ heat gain, natural window ventilation, and mechanical ceiling-fan ventilation. During summer school hours, the classrooms with moderate thermal mass in their building elements had an average 15% more time when indoor air temperatures were lower than 26 °C than classrooms without any thermal mass in their building elements. The classrooms with moderate thermal mass in their building elements had significantly less time when indoor air temperatures were higher than 26 °C than the classrooms without any thermal mass in their building elements. The fluctuation of indoor air temperatures in classrooms with moderate thermal mass in their building elements (8.5 °C) was still clearly smaller than that of classrooms without any thermal mass in their building elements (10.9–11.6 °C). Under the influence of occupants’ heat gain, natural window ventilation, and mechanical ceiling-fan ventilation, based on the field-study data, the positive impact of thermal mass on the summer indoor thermal environment can still be identified during school hours.
Based on the field-study data, the current design of natural window ventilation and mechanical ceiling-fan ventilation can restore summer thermal comfort for students under the local climate. When the windows were opened and ceiling fans were used, without students, the PMV value of the classrooms with thermal mass in their building elements (−1.05, marginal slightly cool) was clearly lower than that of the classrooms without any thermal mass in their building elements (0.22, neutral) for summer conditions. With natural window ventilation and mechanical ceiling-fan ventilation, a school building with thermal mass in its structure, walls, floor, and partitions can provide better indoor thermal conditions to maintain students’ thermal comfort during the Auckland summer than a building without any thermal mass.
This study established suitable research methods to identify the differences in the indoor thermal environments of school buildings with different moderate thermal mass in their building elements under summer conditions with a medium range of diurnal temperatures. The research method included the field study of recording air temperature and relative humidity adjacent to the ceiling, the floor, and shaded outdoor spaces, measuring indoor surface temperatures, indoor dry bulb temperatures, wet bulb temperatures, globe temperatures, relative humidity, and air velocity at seating height in the middle of the sample classrooms. Indoor mean air temperature, percentage of time related to different indoor air temperature ranges, indoor surface temperature, mean radiant temperature, PMV, thermal sensation, and PPD were used to compare and evaluate the indoor thermal environment.
Author Contributions
Conceptualization, B.S.; Methodology, B.S.; Validation, B.S. and R.J.M.; Formal analysis, B.S.; Investigation, B.S.; Resources, B.S., P.M., R.J.M., X.W. and S.S.; Data curation, B.S. and Y.L.; Writing—original draft, B.S.; Writing—review & editing, B.S., P.M., R.J.M., X.W. and S.S.; Project administration, B.S. and P.M.; Funding acquisition, B.S. All authors have read and agreed to the published version of the manuscript.
Funding
This work was supported and funded by Jasmax, Nauhria, and New Zealand Ministry of Education.
Data Availability Statement
Data are contained within the article.
Acknowledgments
The authors would like to thank Jerome Partington, and Justin Evatt, who gave us help and support for the field studies, and staff at Avondale College.
Conflicts of Interest
Author Yifeng Liang was employed by the company Architon. The remaining authors declare that the research was conducted in the absence of any commercial or financial relationships that could be construed as a potential conflict of interest. The authors declare that this study received funding from Jasmax, Nauhria, and New Zealand Ministry of Education. The funders were not involved in the study design, collection, analysis, interpretation of data, the writing of this article or the decision to submit it for publication.
References
- Hessell, J.W.D. The Climate and Weather of Auckland; New Zealand Meteorological Service: Wellington, New Zealand, 1988. [Google Scholar]
- Su, B.; Jadresin Milic, R.; McPherson, P.; Wu, L. Thermal Performance of School Buildings: Impacts beyond Thermal Comfort. Int. J. Environ. Res. Public Health 2022, 19, 5811. [Google Scholar] [CrossRef]
- Su, B. Field Study to Compare and Evaluate Winter Indoor Thermal and Health Conditions of School Buildings with Different Envelopes. Arch. Sci. Rev. 2017, 60, 40–48. [Google Scholar] [CrossRef]
- Singh, M.K.; Ooka, R.; Rijal, H.B.; Kumar, S.; Kumar, A.; Mahapatra, S. Progress in Thermal Comfort Studies in Classrooms over Last 50 years and Way Forward. Energy Build. 2019, 188–189, 149–174. [Google Scholar] [CrossRef]
- Aparicio-Ruiz, P.; Barbadilla-Martín, E.; Guadix, J.; Muñuzuri, J. A Field Study on Adaptive Thermal Comfort in Spanish Primary Classrooms during Summer Season. Build. Environ. 2021, 203, 108089. [Google Scholar] [CrossRef]
- Trebilcock, M.; Soto-Muñoz, J.; Yañez, M.; Figueroa-San Martin, R. The Right to Comfort: A Field Study on Adaptive Thermal Comfort in Free-Running Primary Schools in Chile. Build. Environ. 2017, 114, 455–469. [Google Scholar] [CrossRef]
- Teli, D.; Jentsch, M.F.; James, P.A.B. The Role of a Building’s Thermal Properties on Pupils’ Thermal Comfort in Junior School Classrooms as Determined in Field Studies. Build. Environ. 2014, 82, 640–654. [Google Scholar] [CrossRef]
- Dias Pereira, L.; Raimondo, D.; Corgnati, S.P.; Gameiro Da Silva, M. Assessment of Indoor Air Quality and Thermal Comfort in Portuguese Secondary Classrooms: Methodology and Results. Build. Environ. 2014, 81, 69–80. [Google Scholar] [CrossRef]
- Katafygiotou, M.C.; Serghides, D.K. Thermal Comfort of a Typical Secondary School Building in Cyprus. Sustain. Cities Soc. 2014, 13, 303–312. [Google Scholar] [CrossRef]
- Jindal, A. Thermal Comfort Study in Naturally Ventilated School Classrooms in Composite Climate of India. Build. Environ. 2018, 142, 34–46. [Google Scholar] [CrossRef]
- Liang, H.; Lin, T.; Hwang, R. Linking Occupants’ Thermal Perception and Building Thermal Performance in Naturally Ventilated School Buildings. Appl. Energy 2012, 94, 355–363. [Google Scholar] [CrossRef]
- de Abreu-Harbich, L.V.; Chaves, V.L.A.; Brandstetter, M.C.G.O. Evaluation of Strategies that Improve the Thermal Comfort and Energy Saving of a Classroom of an Institutional Building in a Tropical Climate. Build. Environ. 2018, 135, 257–268. [Google Scholar] [CrossRef]
- Khambadkone, N.K.; Madhumati, P.; Ranganath, M.N. Thermal Comfort Evaluation in Architectural Studio Classrooms: A Summer Study in a Warm to Moderate Indian Climate. Ind. Built Environ. 2022, 31, 2331–2365. [Google Scholar] [CrossRef]
- Aguilar, A.J.; de la Hoz-Torres, M.L.; Martínez-Aires, M.D.; Ruiz, D.P. Monitoring and Assessment of Indoor Environmental Conditions after the Implementation of COVID-19-Based Ventilation Strategies in an Educational Building in Southern Spain. Sensors 2021, 21, 7223. [Google Scholar] [CrossRef] [PubMed]
- Zomorodian, Z.S.; Tahsildoost, M.; Hafezi, M. Thermal Comfort in Educational Buildings: A Review Article. Renew. Sustain. Energy Rev. 2016, 59, 898–906. [Google Scholar] [CrossRef]
- Mendell, M.J.; Heath, G.A. Do Indoor Pollutants and Thermal Conditions in Schools Influence Student Performance? A Critical Review of the Literature. Indoor Air 2005, 15, 27–52. [Google Scholar] [CrossRef]
- Shrestha, M.; Rijal, H.B. Investigation on Summer Thermal Comfort and Passive Thermal Improvements in Naturally Ventilated Nepalese School Buildings. Energies 2023, 16, 1251. [Google Scholar] [CrossRef]
- Kovac, M.; Kovacova, K. Analysis of Night-Time Pre-Cooling in a School Building. Appl. Mech. Mater. 2019, 887, 443–450. [Google Scholar] [CrossRef]
- Zahiri, S.; Altan, H. The Effect of Passive Design Strategies on Thermal Performance of Female Secondary School Buildings during Warm Season in a Hot and Dry Climate. Front. Built. Environ. 2016, 2, 3. [Google Scholar] [CrossRef]
- Di Perna, C.; Stazi, F.; Casalena, A.U.; D’Orazio, M. Influence of the internal inertia of the building envelope on summertime comfort in buildings with high internal heat loads. Energy Build. 2011, 43, 200–206. [Google Scholar] [CrossRef]
- Brink, H.W.; Loomans, M.G.L.C.; Mobach, M.P.; Kort, H.S.M. Classrooms’ Indoor Environmental Conditions Affecting the Academic Achievement of Students and Teachers in Higher Education: A Systematic Literature Review. Indoor Air 2021, 31, 405–425. [Google Scholar] [CrossRef]
- Barrett, P.; Davies, F.; Zhang, Y.; Barrett, L. The Impact of Classroom Design on Pupils’ Learning: Final Results of a Holistic, Multi-Level Analysis. Build. Environ. 2015, 89, 118–133. [Google Scholar] [CrossRef]
- Hassanain, M.A.; Iftikhar, A. Framework Model for Post-Occupancy Evaluation of School Facilities. Struct. Surv. 2015, 33, 322–336. [Google Scholar] [CrossRef]
- ISO 7730; Moderate Thermal Environments—Determinations of the PMV and PPD Indices and Specifications of the Conditions for Thermal Comfort. International Organization for Standardization: Geneva, Sitzerland, 2005.
- ASHRAE Standard 55:2020; Thermal Environmental Conditions for Human Occupancy. American Society of Heating, Refrigeration and Air-Conditioning: Atlanta, GA, USA, 2020.
- EN 16789-1:2019; Energy Performance of Buildings—Ventilation for Buildings—Part 1: Indoor Environmental Input Parameters for Design and Assessment of Energy Performance of Buildings Addressing Indoor Air Quality, Thermal Environment, Lighting and Acoustics—Module M1-6. European Committee for Standardization: Brussels, Belgium, 2019.
- Huang, K.T.; Huang, W.P.; Lin, T.P.; Hwang, R.L. Implementation of Green Building Specification Credits for Better Thermal Conditions in Naturally Ventilated School Buildings. Build. Environ. 2015, 86, 141–150. [Google Scholar] [CrossRef]
- Carlucci, S.; Bai, L.; de Dear, R.; Yang, L. Review of Adaptive Thermal Comfort Models in Built Environmental Regulatory Documents. Build. Environ. 2018, 137, 73–89. [Google Scholar] [CrossRef]
- Montazami, A.; Gaterell, M.; Nicol, F. A Comprehensive Review of Environmental Design in UK Schools: History, Conflicts and Solutions. Renew. Sustain. Energy Rev. 2015, 46, 249–264. [Google Scholar] [CrossRef]
- Teli, D.; Bourikas, L.; James, P.A.B.; Bahaj, A.S. Thermal Performance Evaluation of School Buildings Using a Children-Based Adaptive Comfort Model. Procedia Environ. Sci. 2017, 38, 844–851. [Google Scholar] [CrossRef]
- Wong, N.H.; Khoo, S.S. Thermal Comfort in Classrooms in the Tropics. Energy Build. 2003, 35, 337–351. [Google Scholar] [CrossRef]
- Hamzah, B.; Gou, Z.; Mulyadi, R.; Amin, S. Thermal Comfort Analyses of Secondary School Students in the Tropics. Buildings 2018, 8, 56. [Google Scholar] [CrossRef]
- Haddad, S.; Osmond, P.; King, S. Application of Adaptive Thermal Comfort Methods for Iranian School Children. Build. Res. Inf. 2019, 47, 173–189. [Google Scholar] [CrossRef]
- Montazami, A.; Gaterell, M.; Nicol, F.; Lumley, M.; Thoua, C. Developing an Algorithm to Illustrate the Likelihood of the Dissatisfaction Rate with Relation to the Indoor Temperature in Naturally Ventilated Classrooms. Build. Environ. 2017, 111, 61–71. [Google Scholar] [CrossRef]
- Montazami, A.; Gaterell, M.; Nicol, F.; Lumley, M.; Thoua, C. Impact of Social Background and Behaviour on Children’s Thermal Comfort. Build. Environ. 2017, 122, 422–434. [Google Scholar] [CrossRef]
- Humphreys, M.A.; Nicol, J.F. Understanding the Adaptive Approach to Thermal Comfort. ASHRAE Trans. 1998, 104, 991–1004. [Google Scholar]
- Brager, G.S.; de Dear, R.J. Thermal Adaptation in the Built Environment: A Literature Review. Energy Build. 1998, 27, 83–96. [Google Scholar] [CrossRef]
- Karjalainen, S. Thermal Comfort and Gender: A Literature Review. Indoor Air 2012, 22, 96–109. [Google Scholar] [CrossRef]
- CBE Center for the Built Environment. CBE Thermal Comfort Tool. Available online: https://comfort.cbe.berkeley.edu/ (accessed on 11 July 2023).
- NovaLynx Corporation. Model 210-4417 Globe Thermometer Instruction Manual; NovaLynx Corporation: Grass Valley, CA, USA, 2010. [Google Scholar]
- NZS 4218:2009; Thermal Insulation—Housing and Small Buildings. Standards New Zealand: Wellington, New Zealand, 2009.
- NZS 4243:2007; Energy Efficiency—Large Buildings. Standards New Zealand: Wellington, New Zealand, 2007.
- NRCC. National Building Code of Canada v2010: Section A-5.3.1.2. (1) Use of Thermal Insulation or Mechanical Systems for Environmental Control; National Research Council Canada: Ottawa, ON, Canada, 2010. [Google Scholar]
- Koenigsberger, O.H.; Lynn, R. Roofs in the Warm Humid Tropics; Lund Humphries: London, UK, 1965. [Google Scholar]
- Humphreys, M.A. Outdoor Temperatures and Comfort Indoors. Build. Res. Pract. 1978, 6, 92–105. [Google Scholar] [CrossRef]
- WHO. WHO Guidelines for Indoor Air Quality: Dampness and Mould; World Health Organization, Regional Office for Europe: Copenhagen, Denmark, 2009. [Google Scholar]
- WHO. Health Impact of Low Indoor Temperatures; World Health Organisation, Regional Office for Europe: Copenhagen, Denmark, 1987. [Google Scholar]
- Arundel, A.B.; Sterling, E.M.; Biggin, J.H.; Sterling, T.D. Indirect Health Effects of Relative Humidity in Indoor Environments. Environ. Health Perspect. 1986, 65, 351–361. [Google Scholar] [PubMed]
- Your Home. Thermal Mass. Available online: https://www.yourhome.gov.au/passive-design/thermal-mass (accessed on 11 July 2023).
- Docherty, M.; Szokolay, S.V. Climate Analysis, 1st ed.; The University of Queensland Printery: Brisbane, Australia, 1999. [Google Scholar]
- Olgyay, V. Design with Climate: Bio-Climatic Approach to Architectural Regionalism, 1st ed.; Princeton University Press: Princeton, NJ, USA, 1963. [Google Scholar]
- Ferstl, K. Fundamentals of Climatically Appropriate Building and Relevant Design Principles. In Tropical Architecture, 1st ed.; Lauber, W., Ed.; Prestel Verlag: Munich, Germany, 2005. [Google Scholar]
- Koenigsberger, O.H.; Ingersoll, T.G.; Mayhew, A.; Szokolay, S.V. Manual of Tropical Housing and Building: Part One, Climatic Design, 1st ed.; Longman Inc.: New York, NY, USA, 1974. [Google Scholar]
- Keneally, V. An Introduction to Energy Efficiency in Air Conditioned Tropical Buildings, Environmental Design Guide, p. 4. 2002. Available online: www.hku.hk/mech/cmhui/sbs/GEN14.pdf (accessed on 15 March 2010).
- Szokolay, S. Introduction to Architectural Science: The Basis of Sustainable Design, 1st ed.; Architectural Press: Oxford, UK, 2004. [Google Scholar]
- Camilleri, M.T. Implications of Climate Change for the Construction Sector: Houses; BRANZ Ltd. Study Report 94; Judgeford: Porirua, New Zealand, 2000. [Google Scholar]
- Jaques, R.A. Summertime Overheating in New Zealand Houses—Influences, Risks and Mitigation Strategies; BRANZ Ltd. Study Report 89; Judgeford: Porirua, New Zealand, 2000. [Google Scholar]
- French, L.J.; Camilleri, M.T.; Isaacs, N.P.; Pollard, A.R. Exploration of Summer Temperatures in New Zealand Houses and the Temperature Drivers, 2006. Available online: https://www.researchgate.net/publication/237514614_Exploration_of_Summer_Temperatures_in_New_Zealand_Houses_and_the_Temperature_Drivers (accessed on 1 January 2020).
- Donn, M.; Thomas, G. Designing Comfortable Homes; Cement and Concrete Association of NZ and EECA: Wellington, New Zealand, 2001. [Google Scholar]
- Halawa, E.; van Hoof, J.; Soebarto, V. The Impacts of the Thermal Radiation Field on Thermal Comfort, Energy Consumption and Control: A Critical Overview. Renew. Sustain. Energy Rev. 2014, 37, 907–918. [Google Scholar] [CrossRef]
- Rowe, D. Effect on Thermal Comfort of Radiant Heat Exchange Near Single Glazed Windows. Arch. Sci. Rev. 2003, 46, 29–35. [Google Scholar] [CrossRef]

Disclaimer/Publisher’s Note: The statements, opinions and data contained in all publications are solely those of the individual author(s) and contributor(s) and not of MDPI and/or the editor(s). MDPI and/or the editor(s) disclaim responsibility for any injury to people or property resulting from any ideas, methods, instructions or products referred to in the content. |
© 2023 by the authors. Licensee MDPI, Basel, Switzerland. This article is an open access article distributed under the terms and conditions of the Creative Commons Attribution (CC BY) license (https://creativecommons.org/licenses/by/4.0/).