
Exploration of Campus Environmental Health Issues and Individual Disparities in Environmental Perceptions Based on Daily Activity Path

Abstract
:1. Introduction
2. Methodology
2.1. Research Design
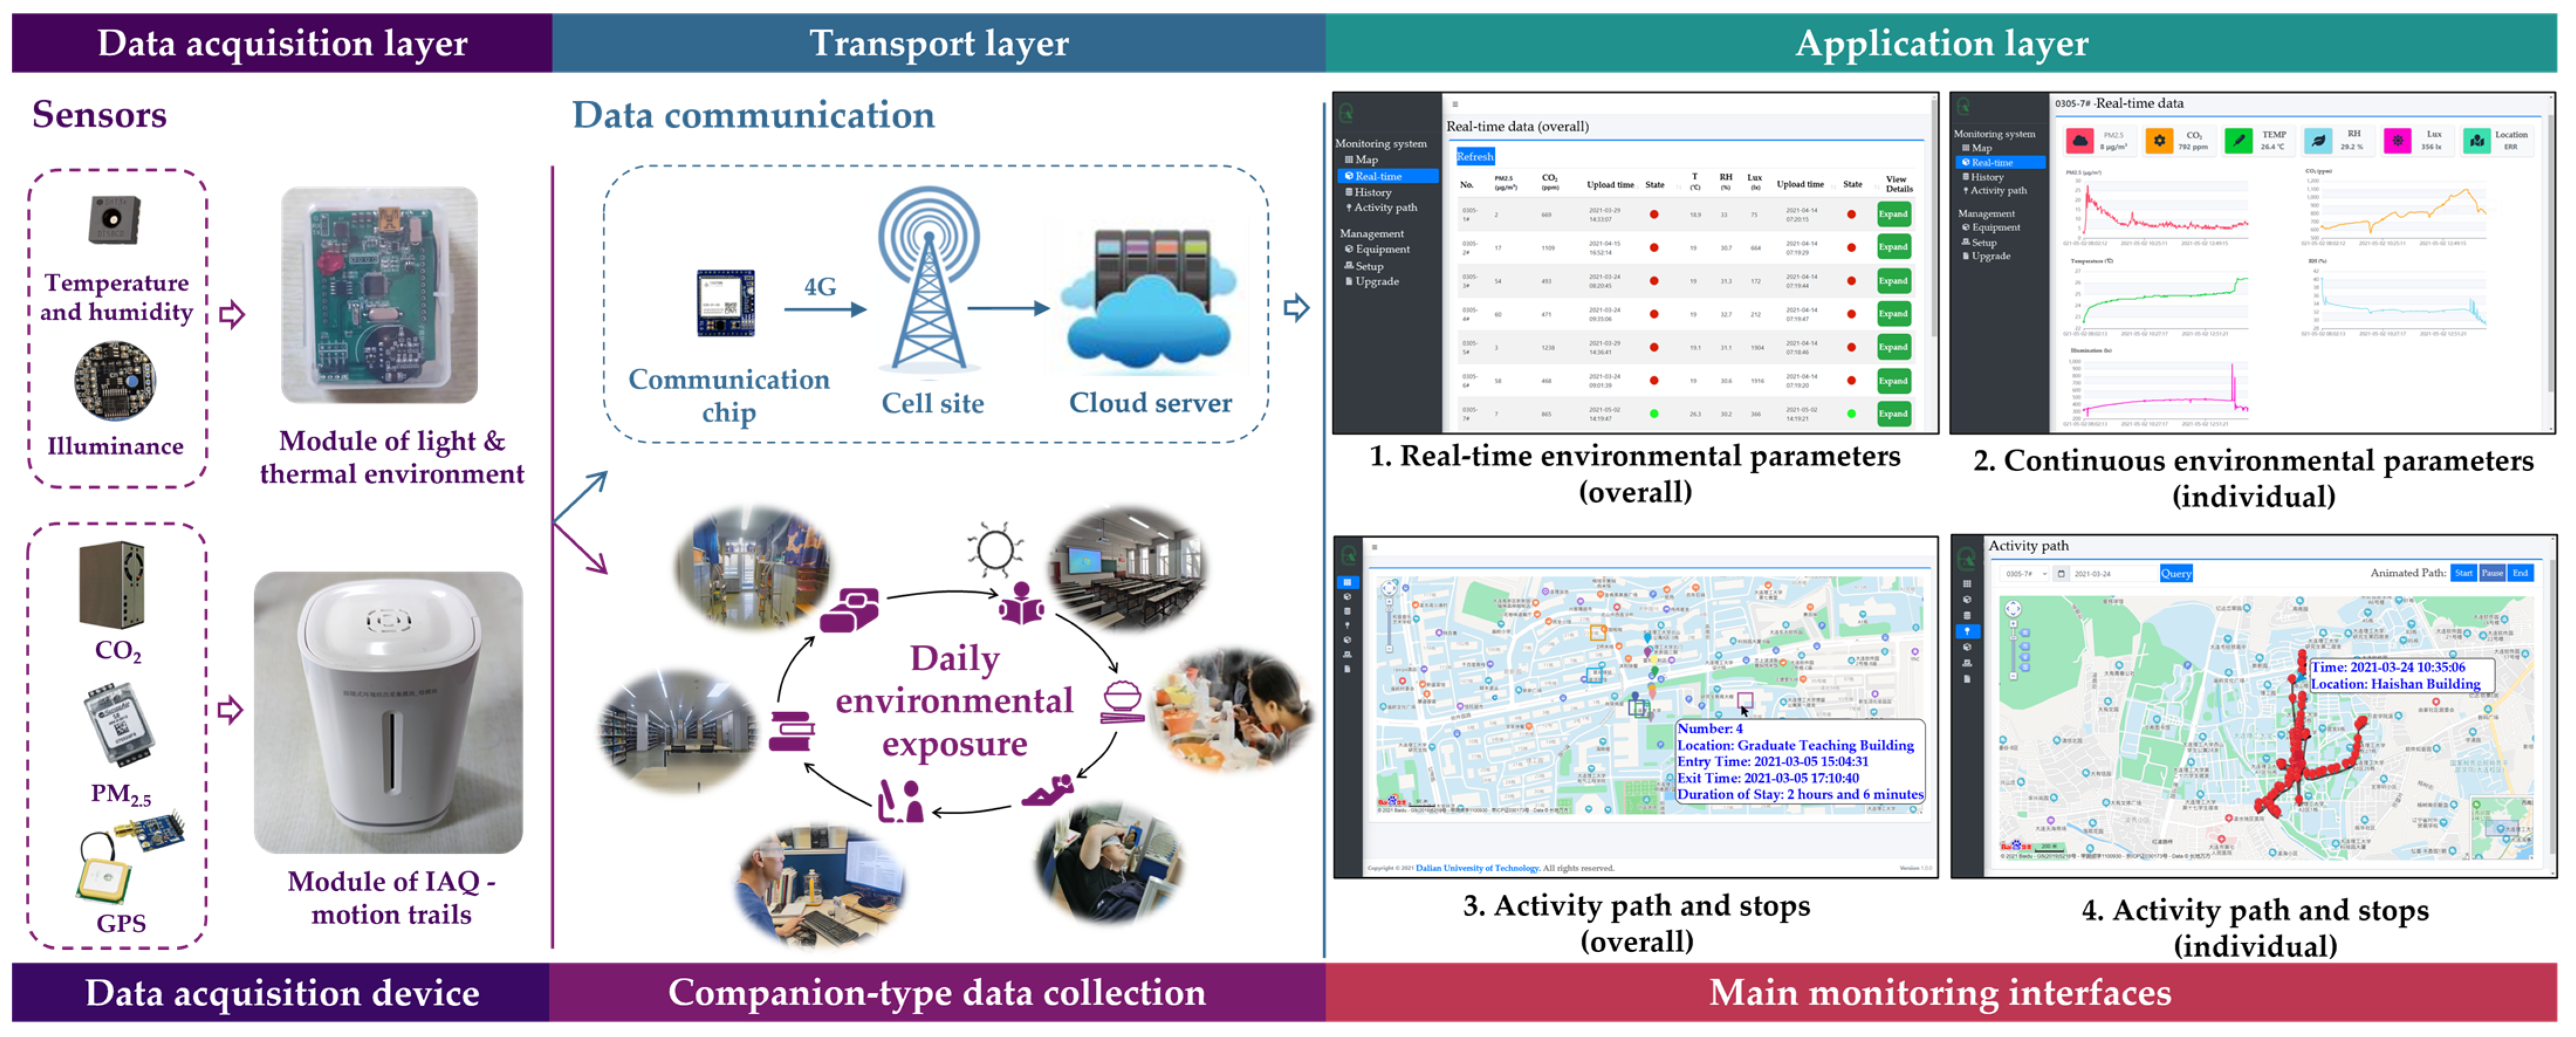
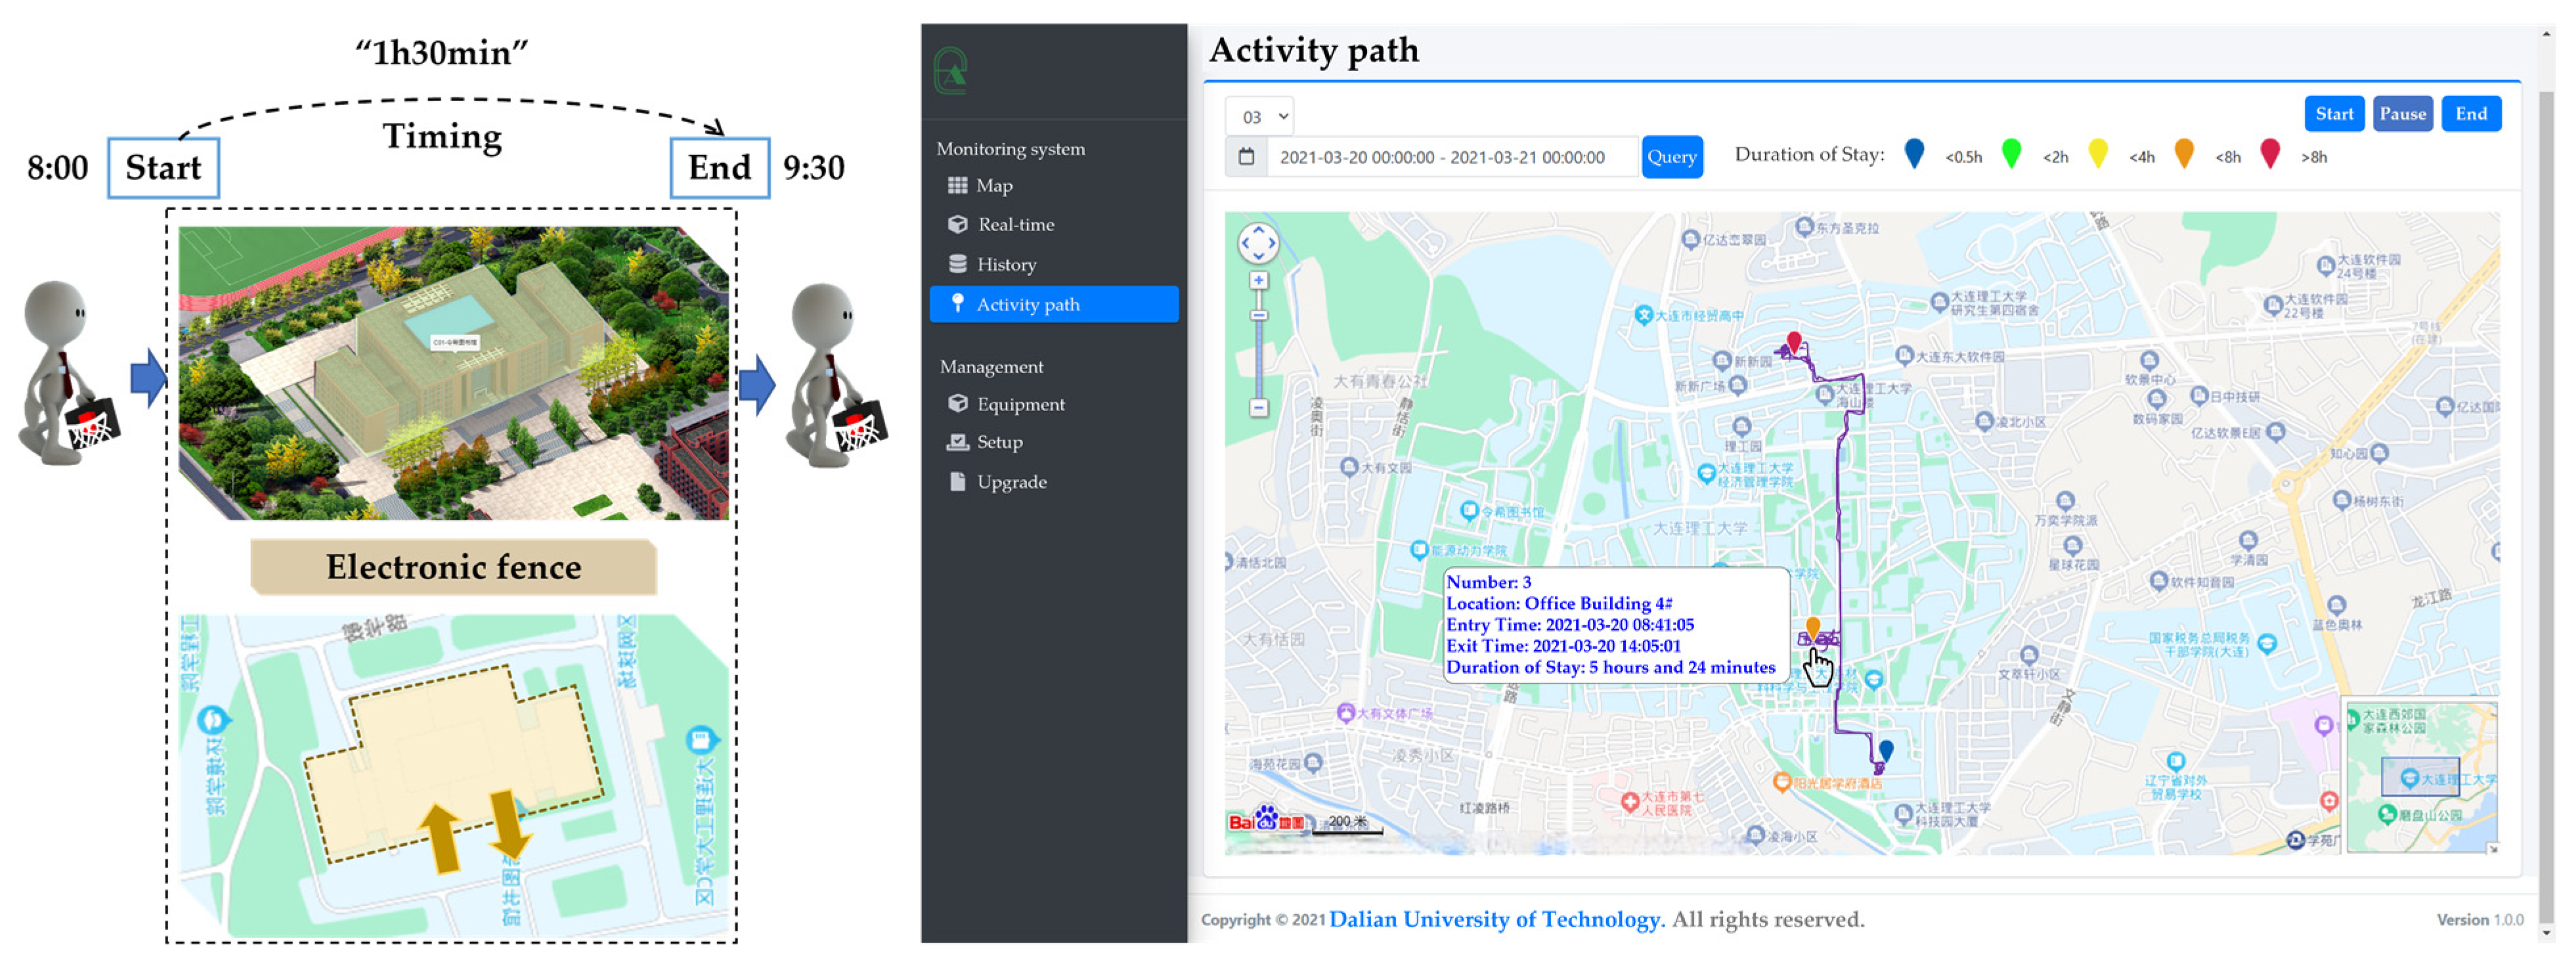
2.1.1. The Companion-Type Data Collection System
2.1.2. Questionnaire Design
2.2. Data Collection
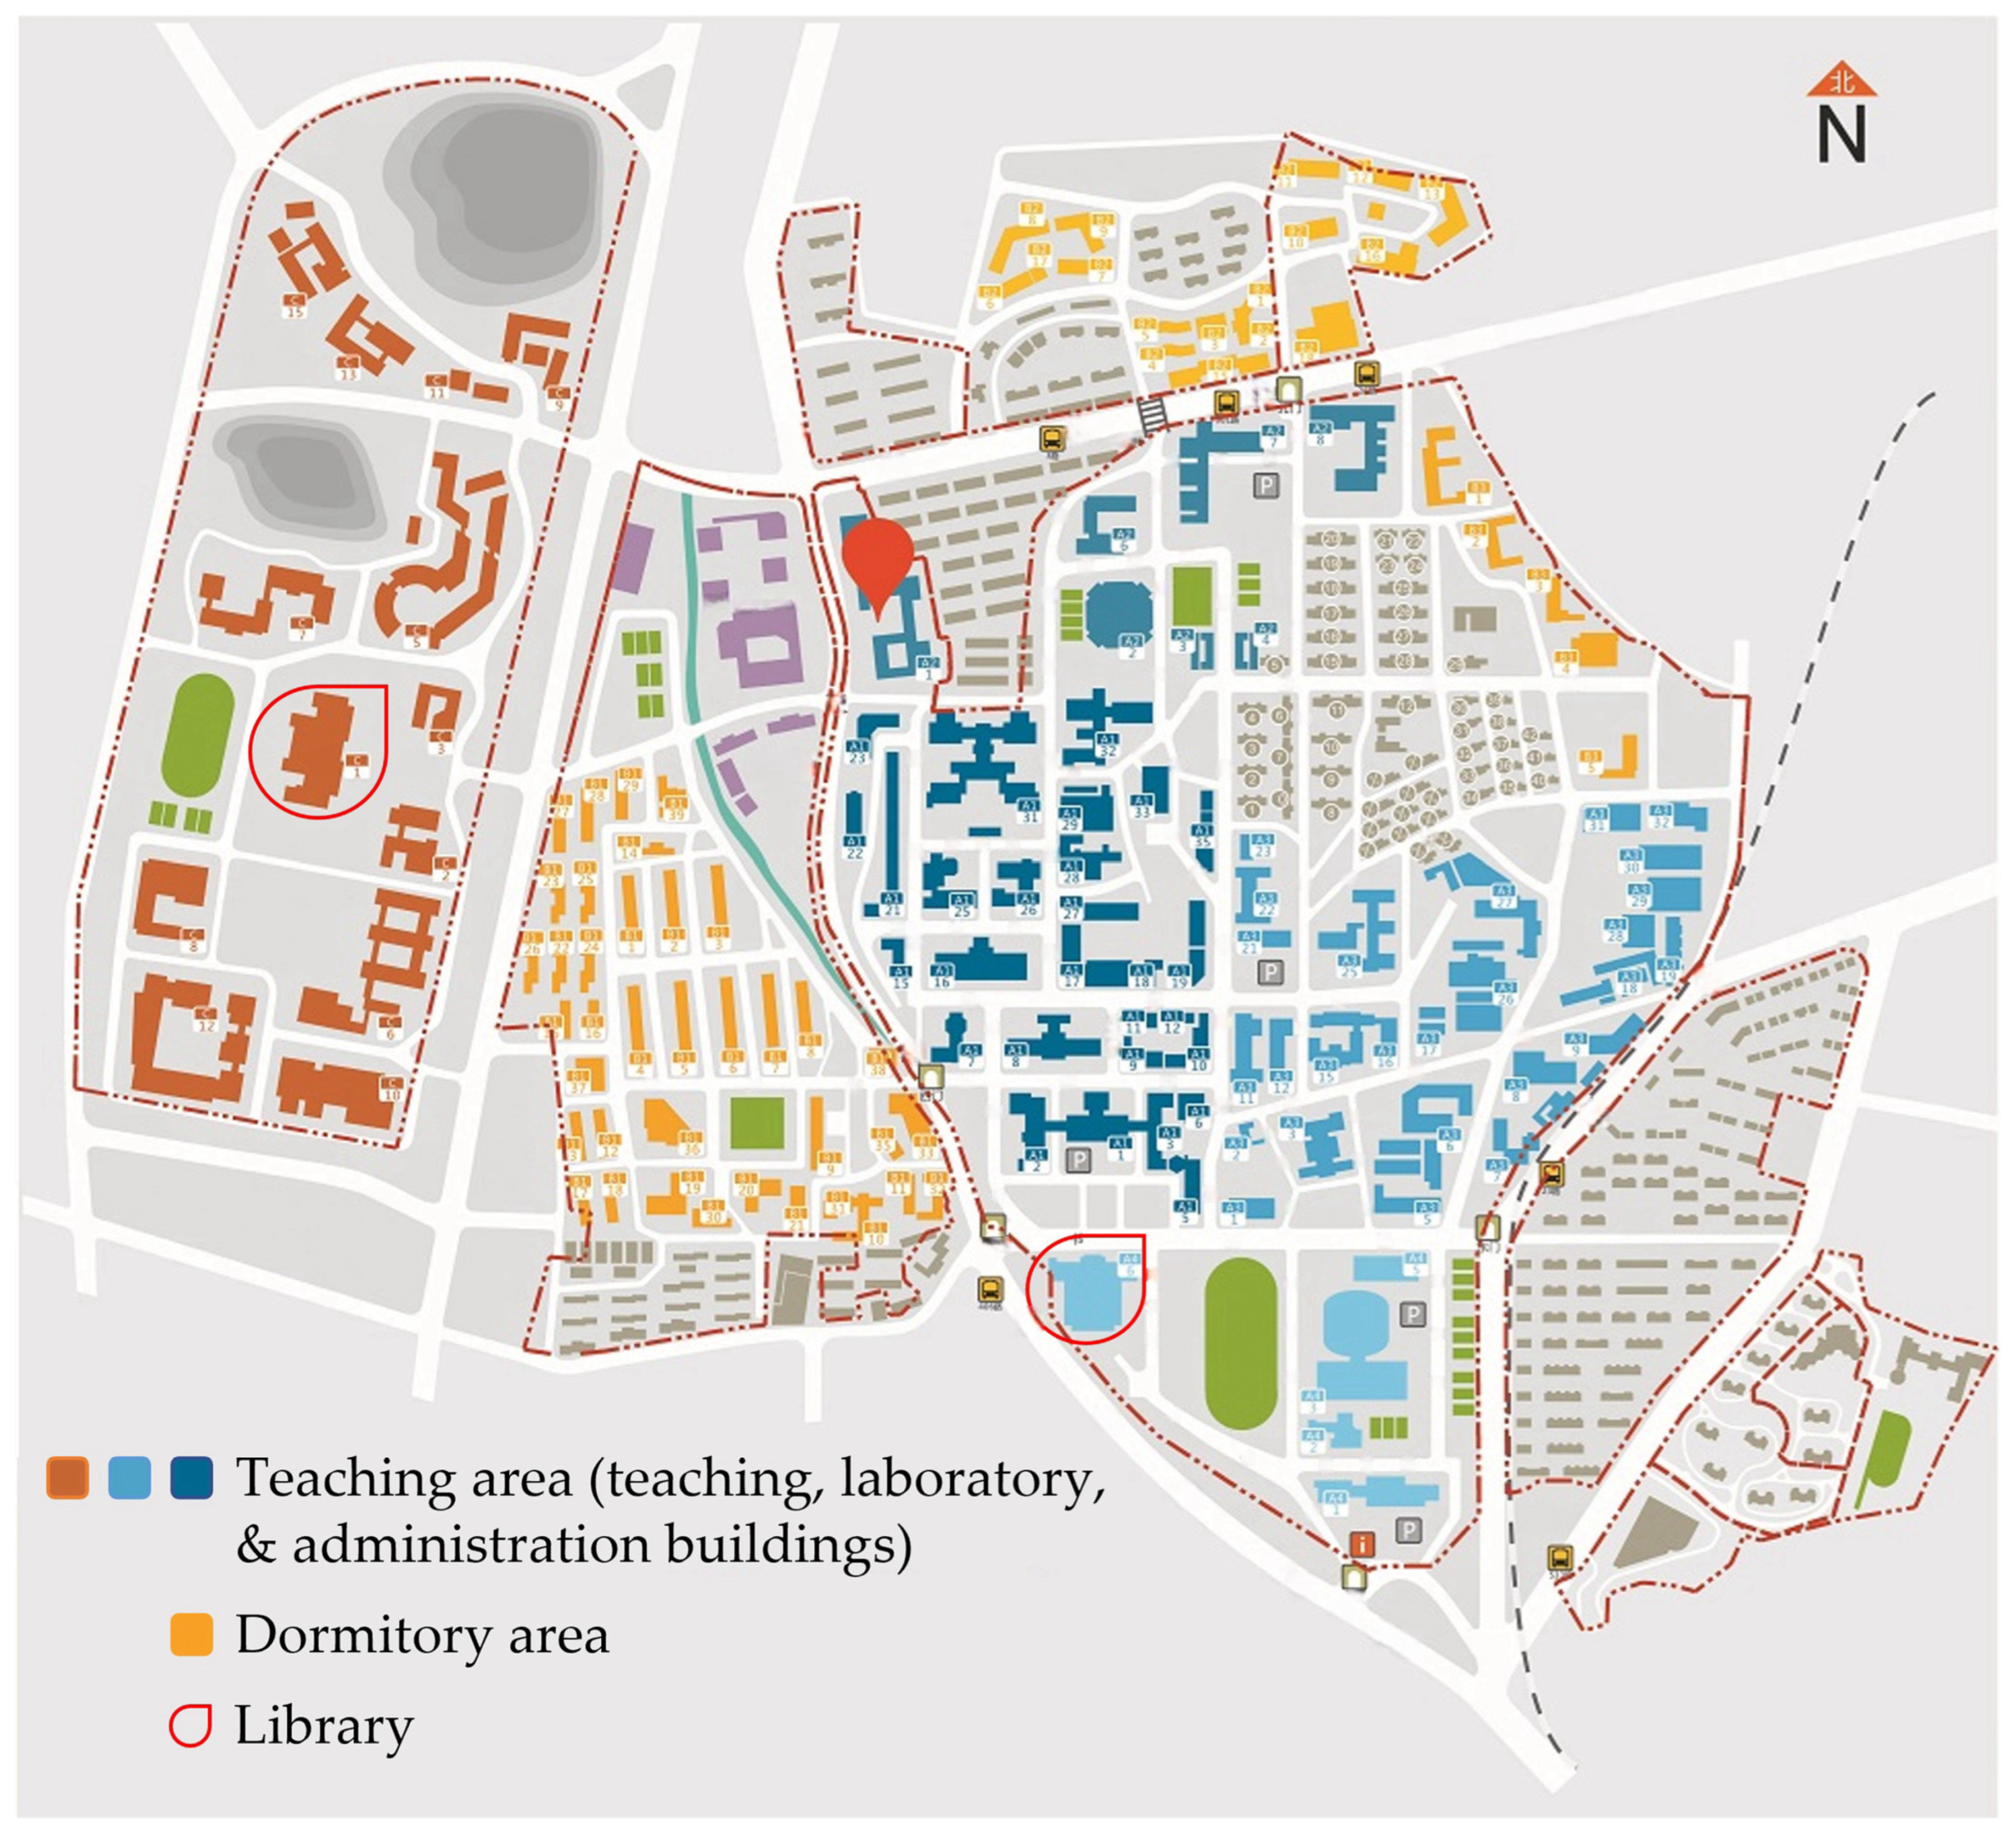
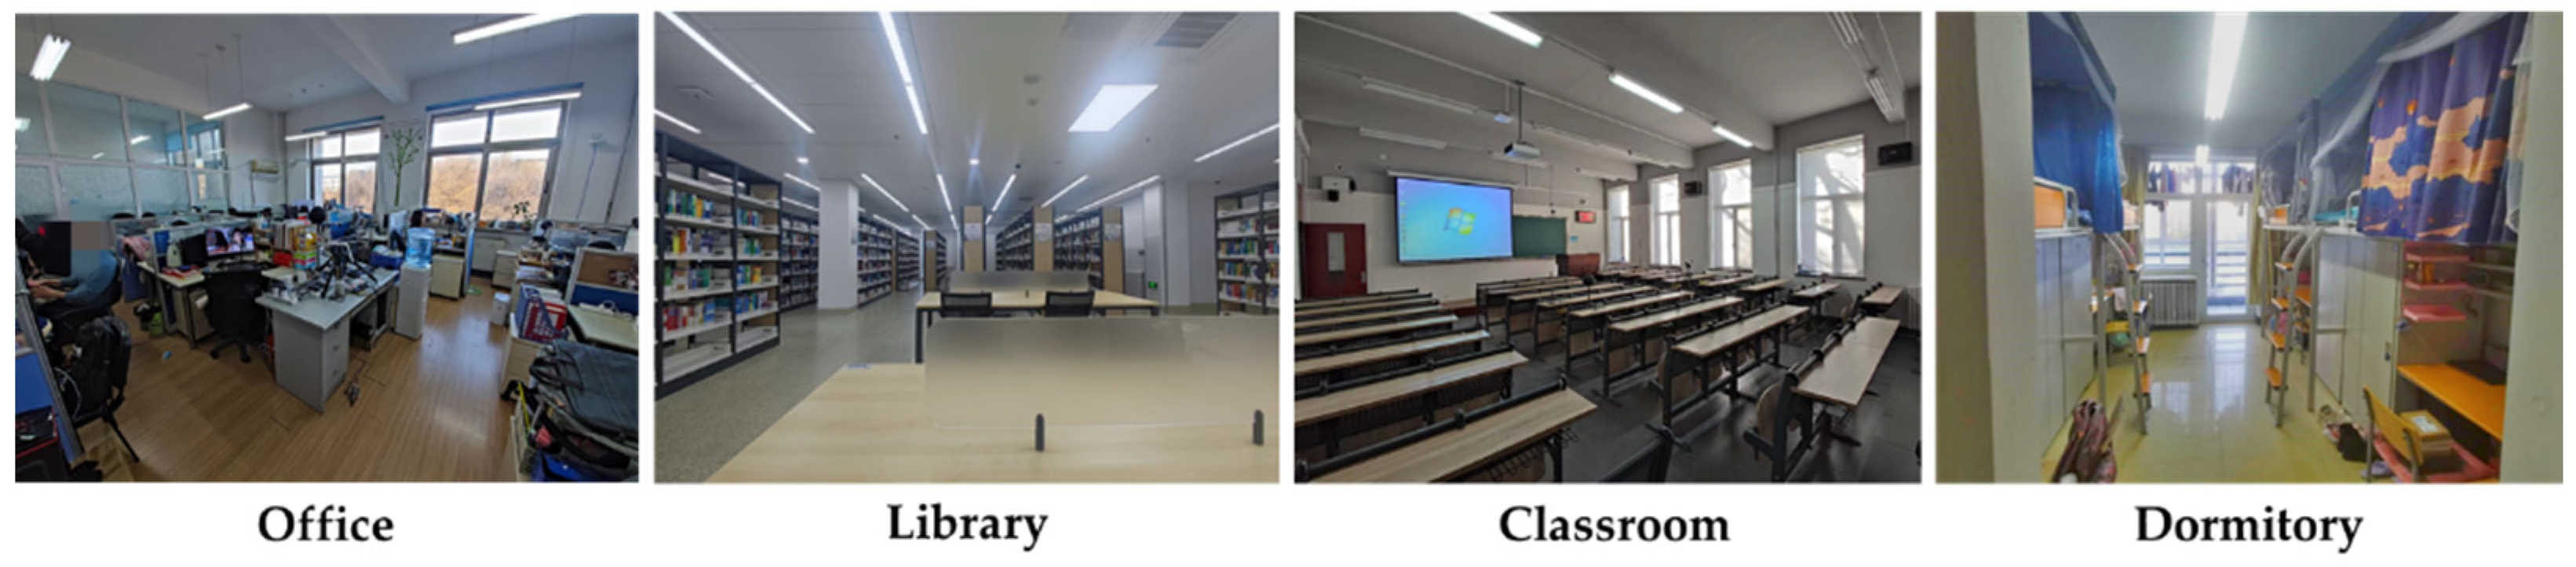
2.2.1. Location and Local Weather
2.2.2. Experimental Procedure
2.2.3. Collection of Environmental Parameters
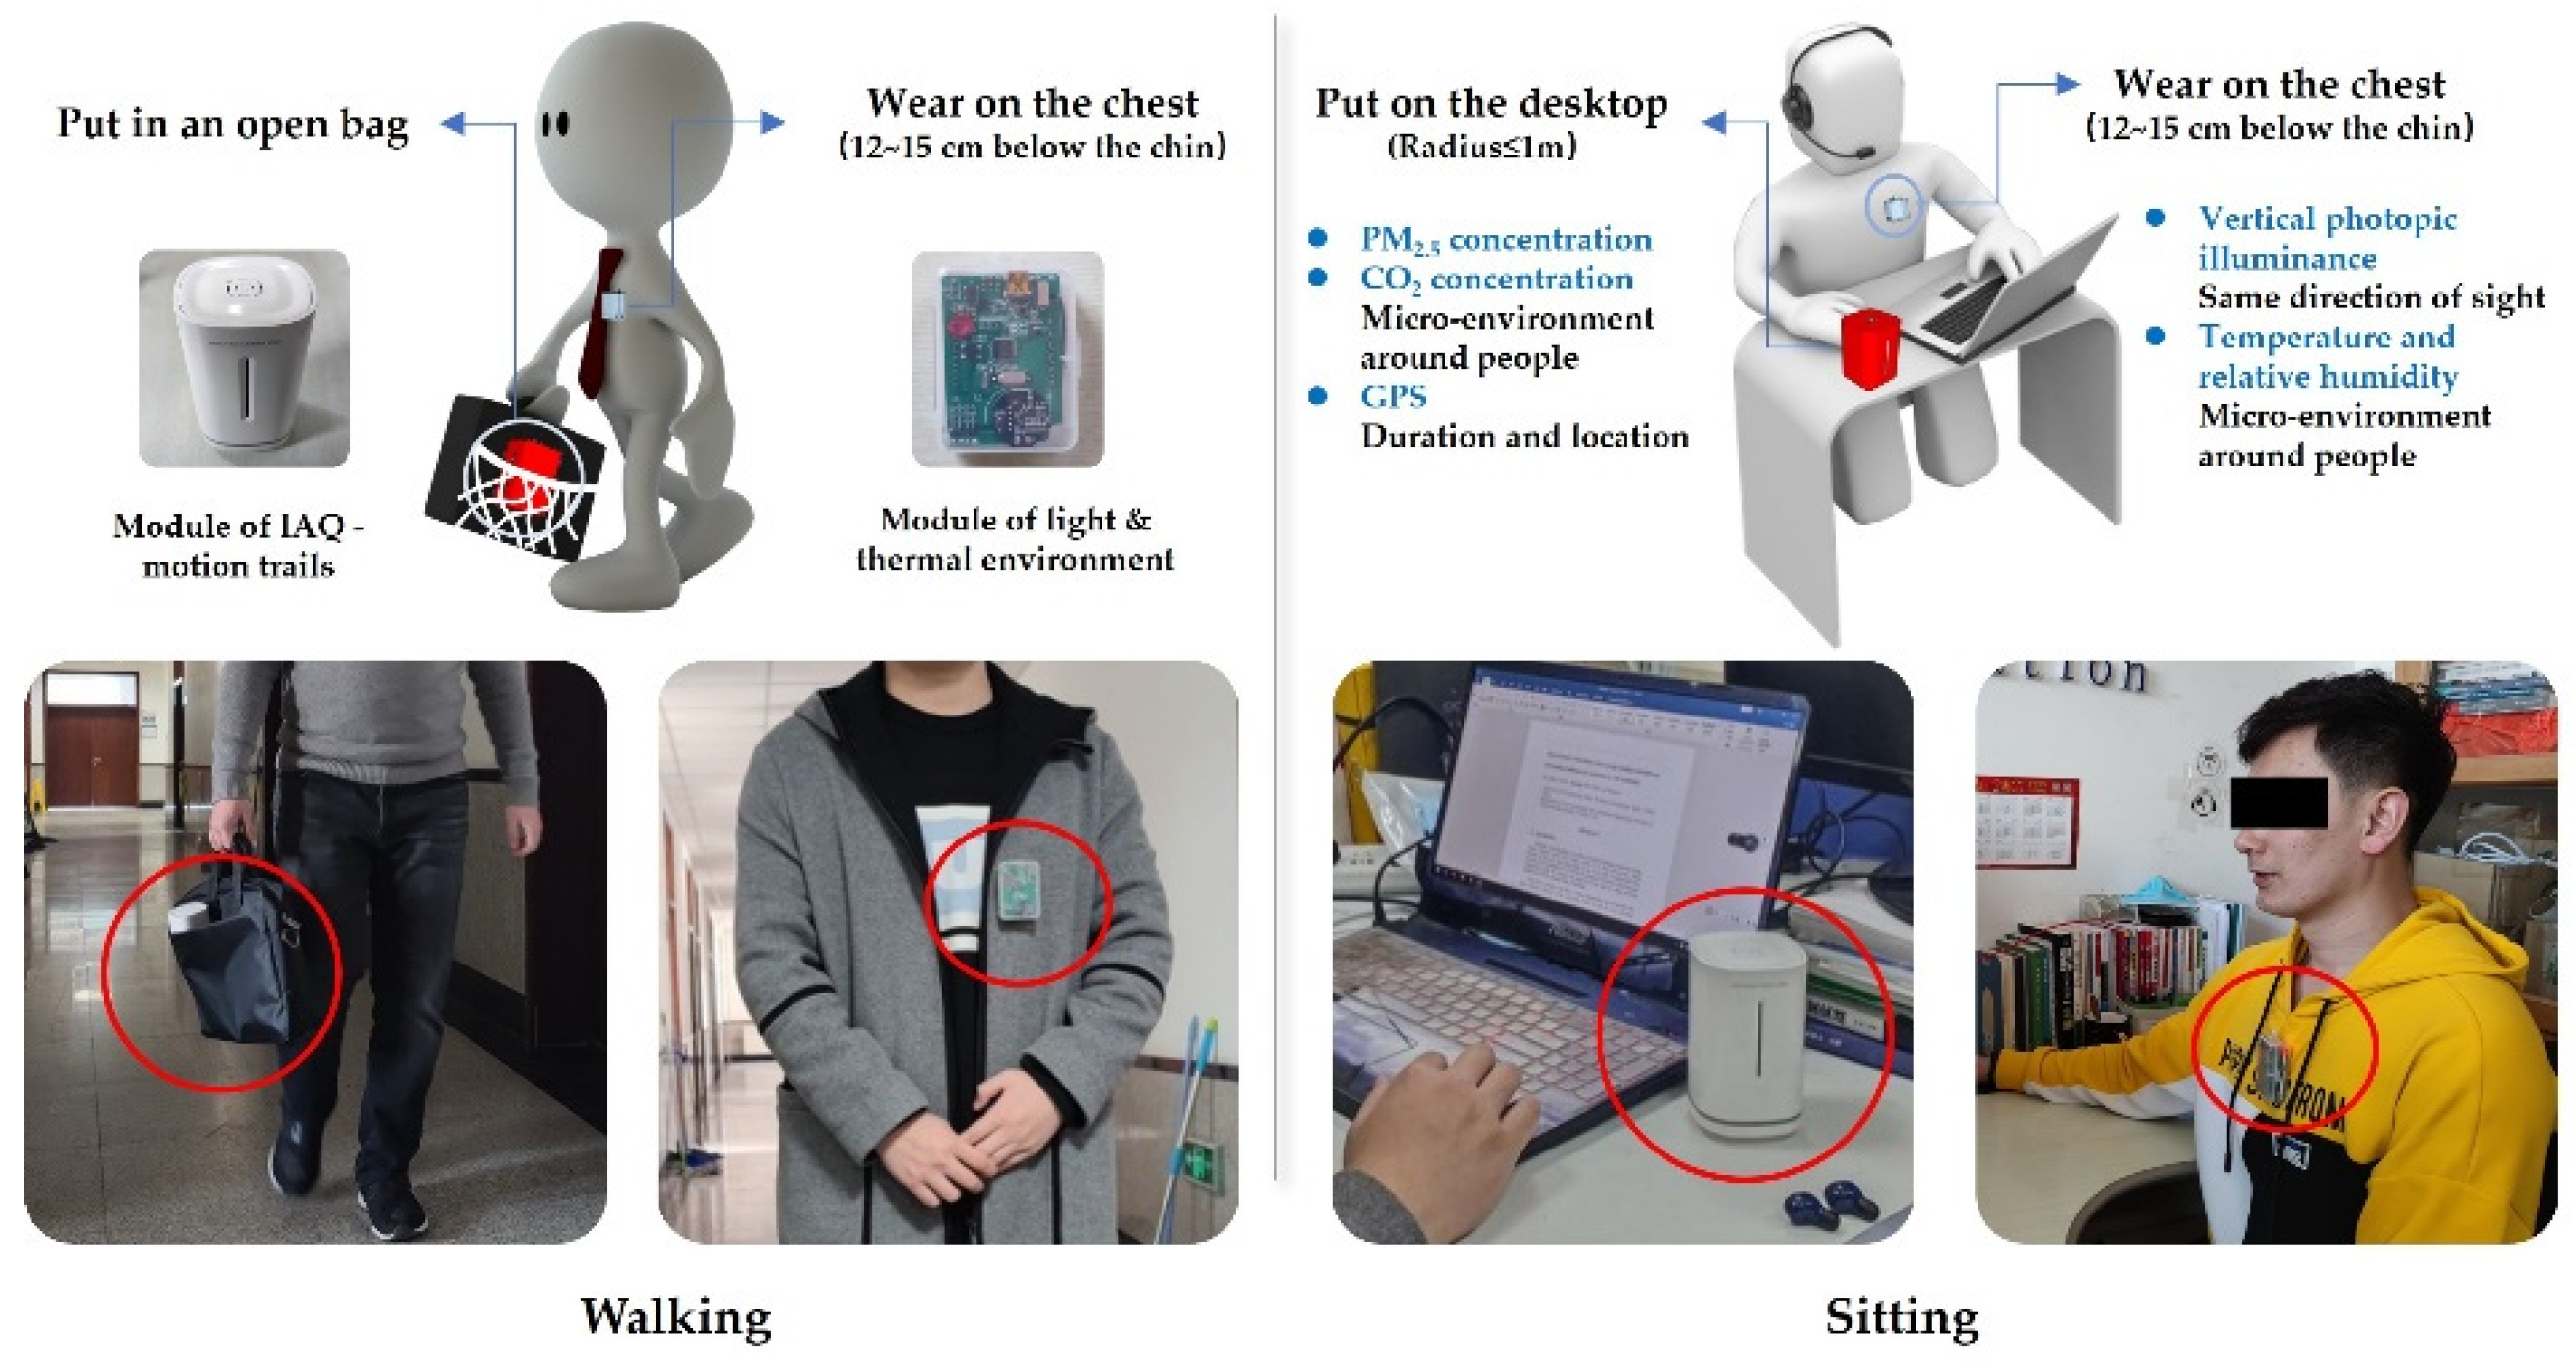
2.2.4. Correction for Sensor Placement Effects
- (1)
- Illuminance
- (2)
- Temperature
- (3)
- PM2.5 and CO2
2.2.5. Collection of Activity Path
2.2.6. Participant Selection
- (1)
- Selection Criteria
- (2)
- Selection Results
2.2.7. Distribution and Return of Questionnaire
2.2.8. Ethical Considerations
2.3. Data Analysis Methods
2.3.1. Eye Light Experience and Arousal State in the Morning
2.3.2. Dietary Preferences and Environmental Exposure during Meal Times
2.3.3. Ventilation Behavior and Air Quality during Sleep
2.3.4. Statistical Analysis
3. Results
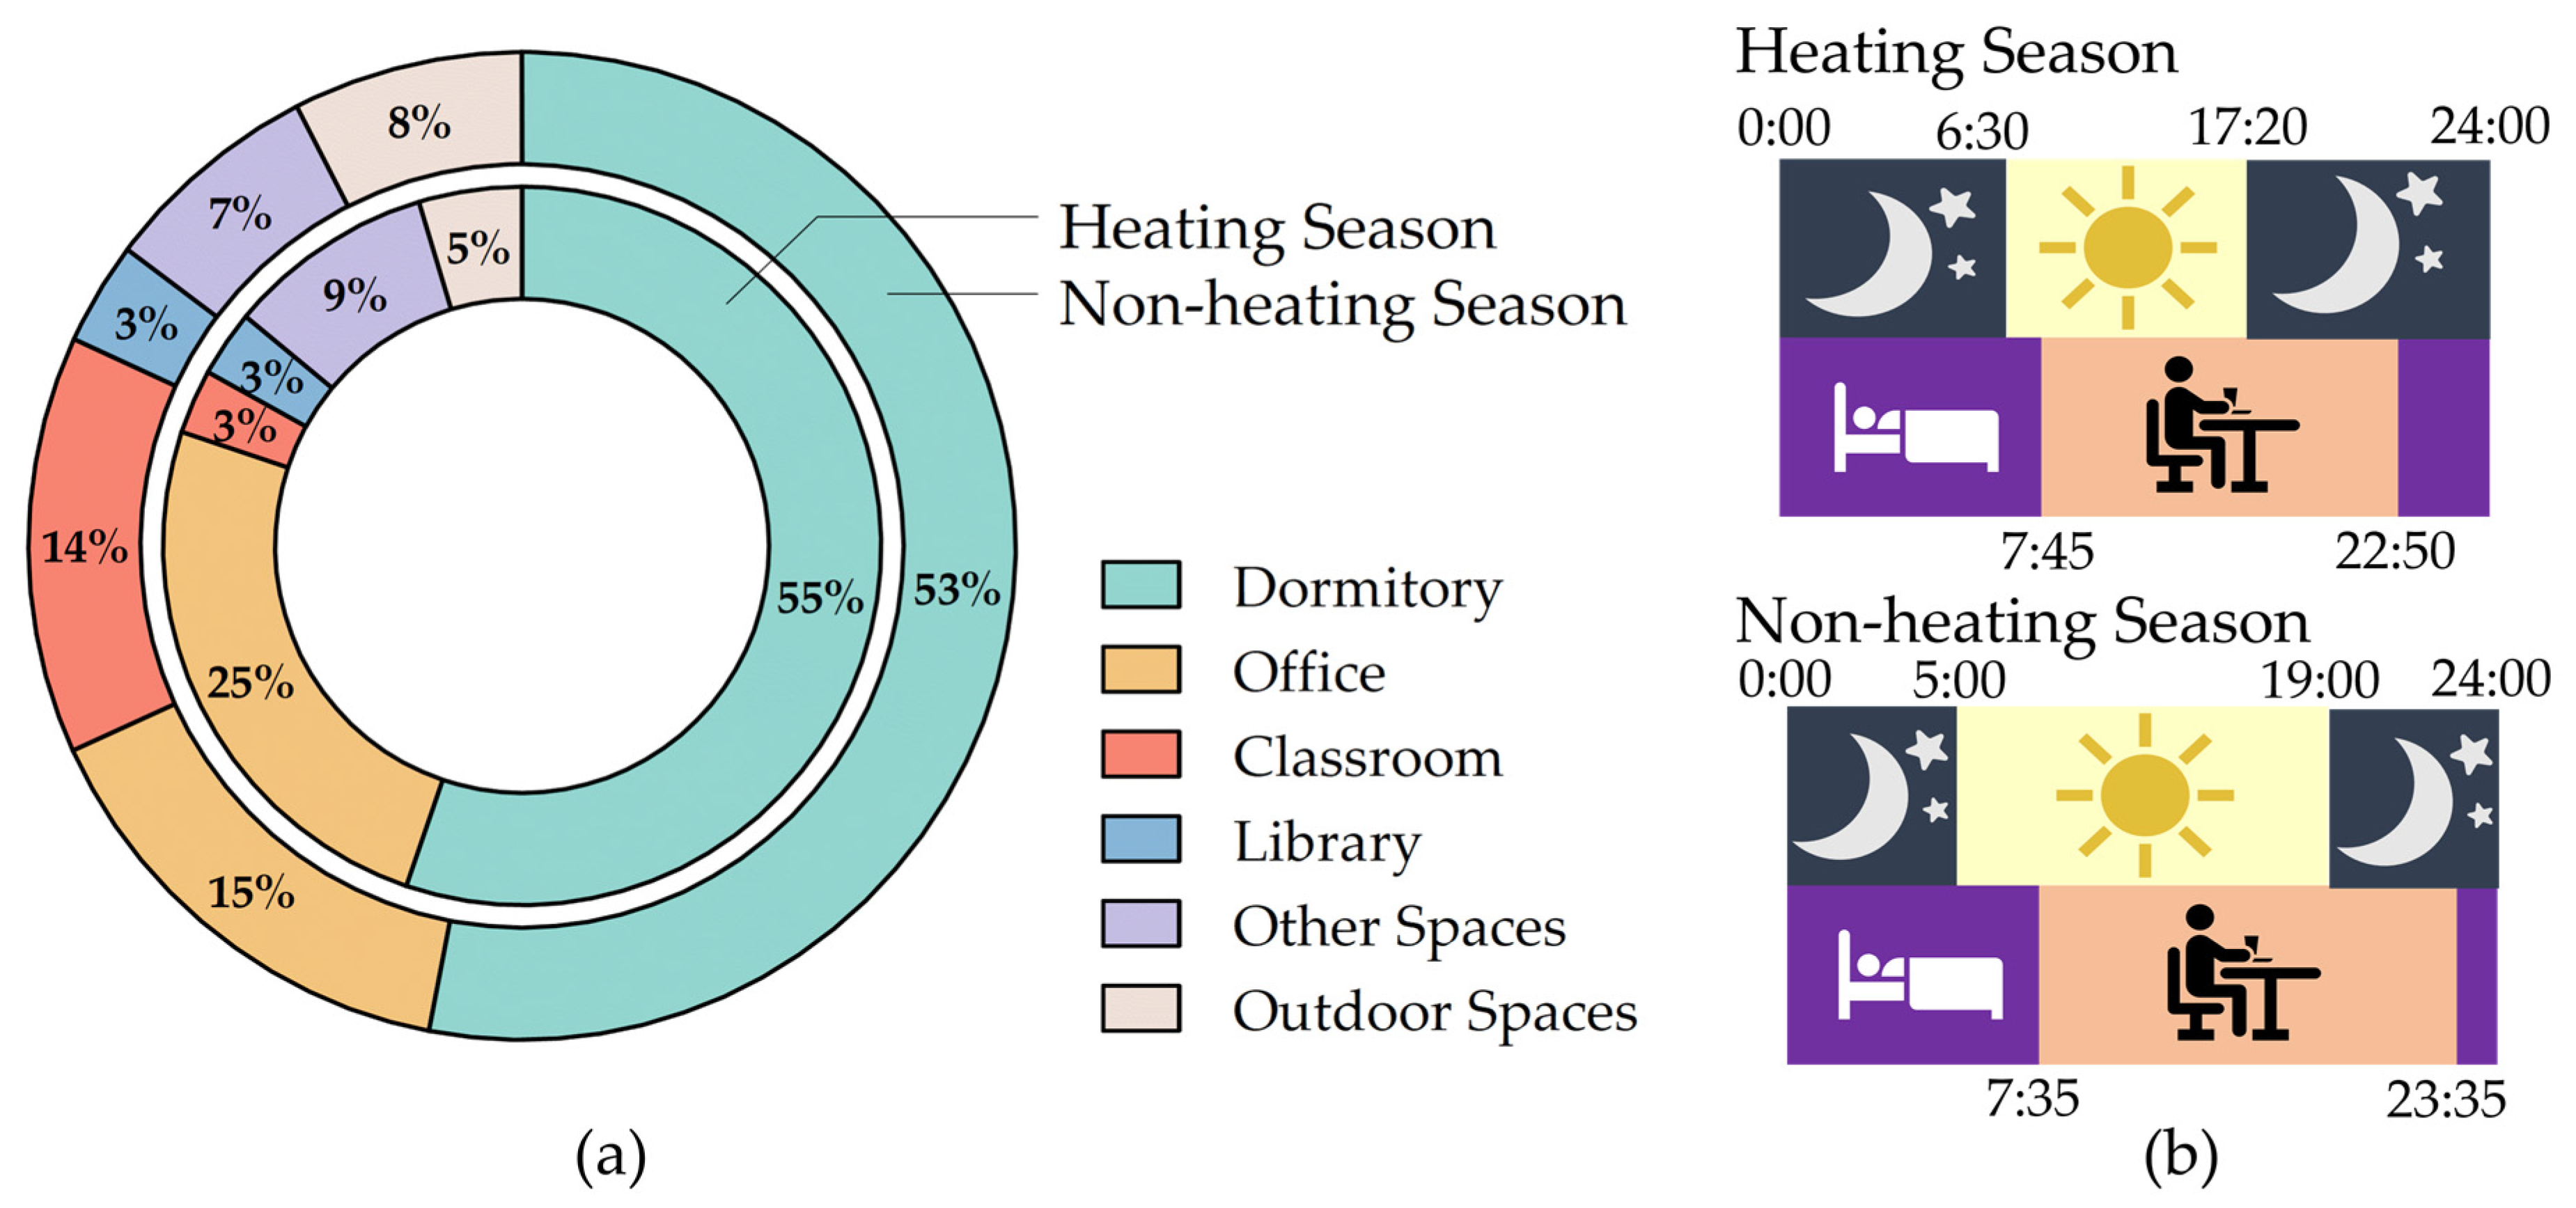
3.1. Daily Rhythms
3.2. Daily Cumulative Environmental Exposure Characteristics
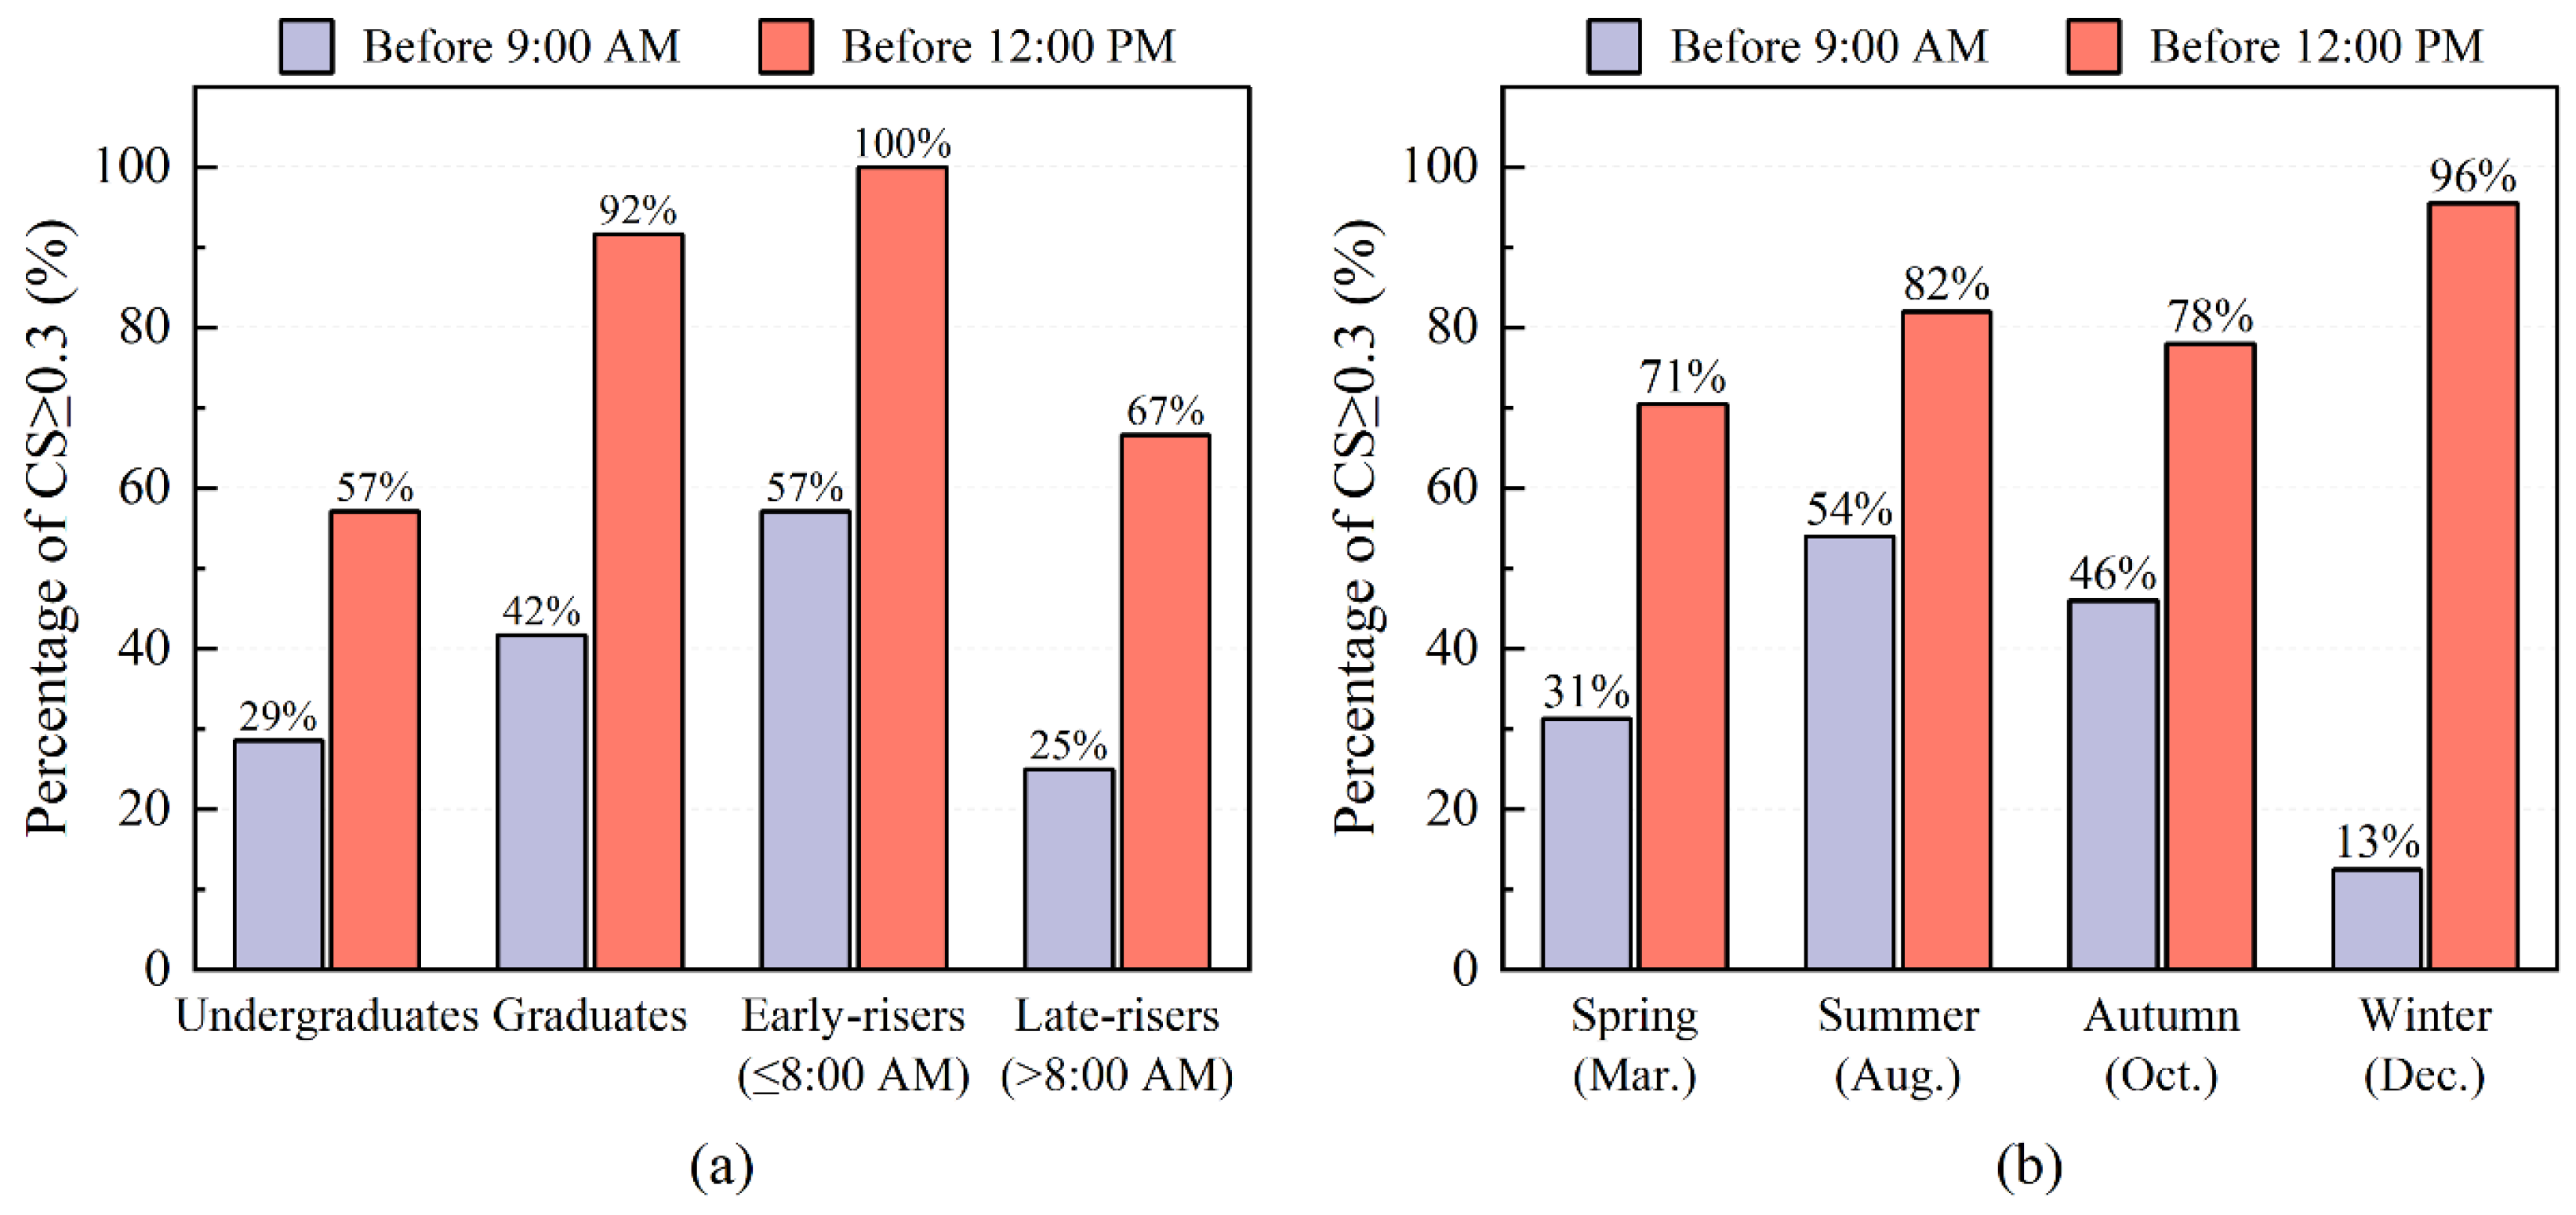
3.2.1. Daylighting and Alertness
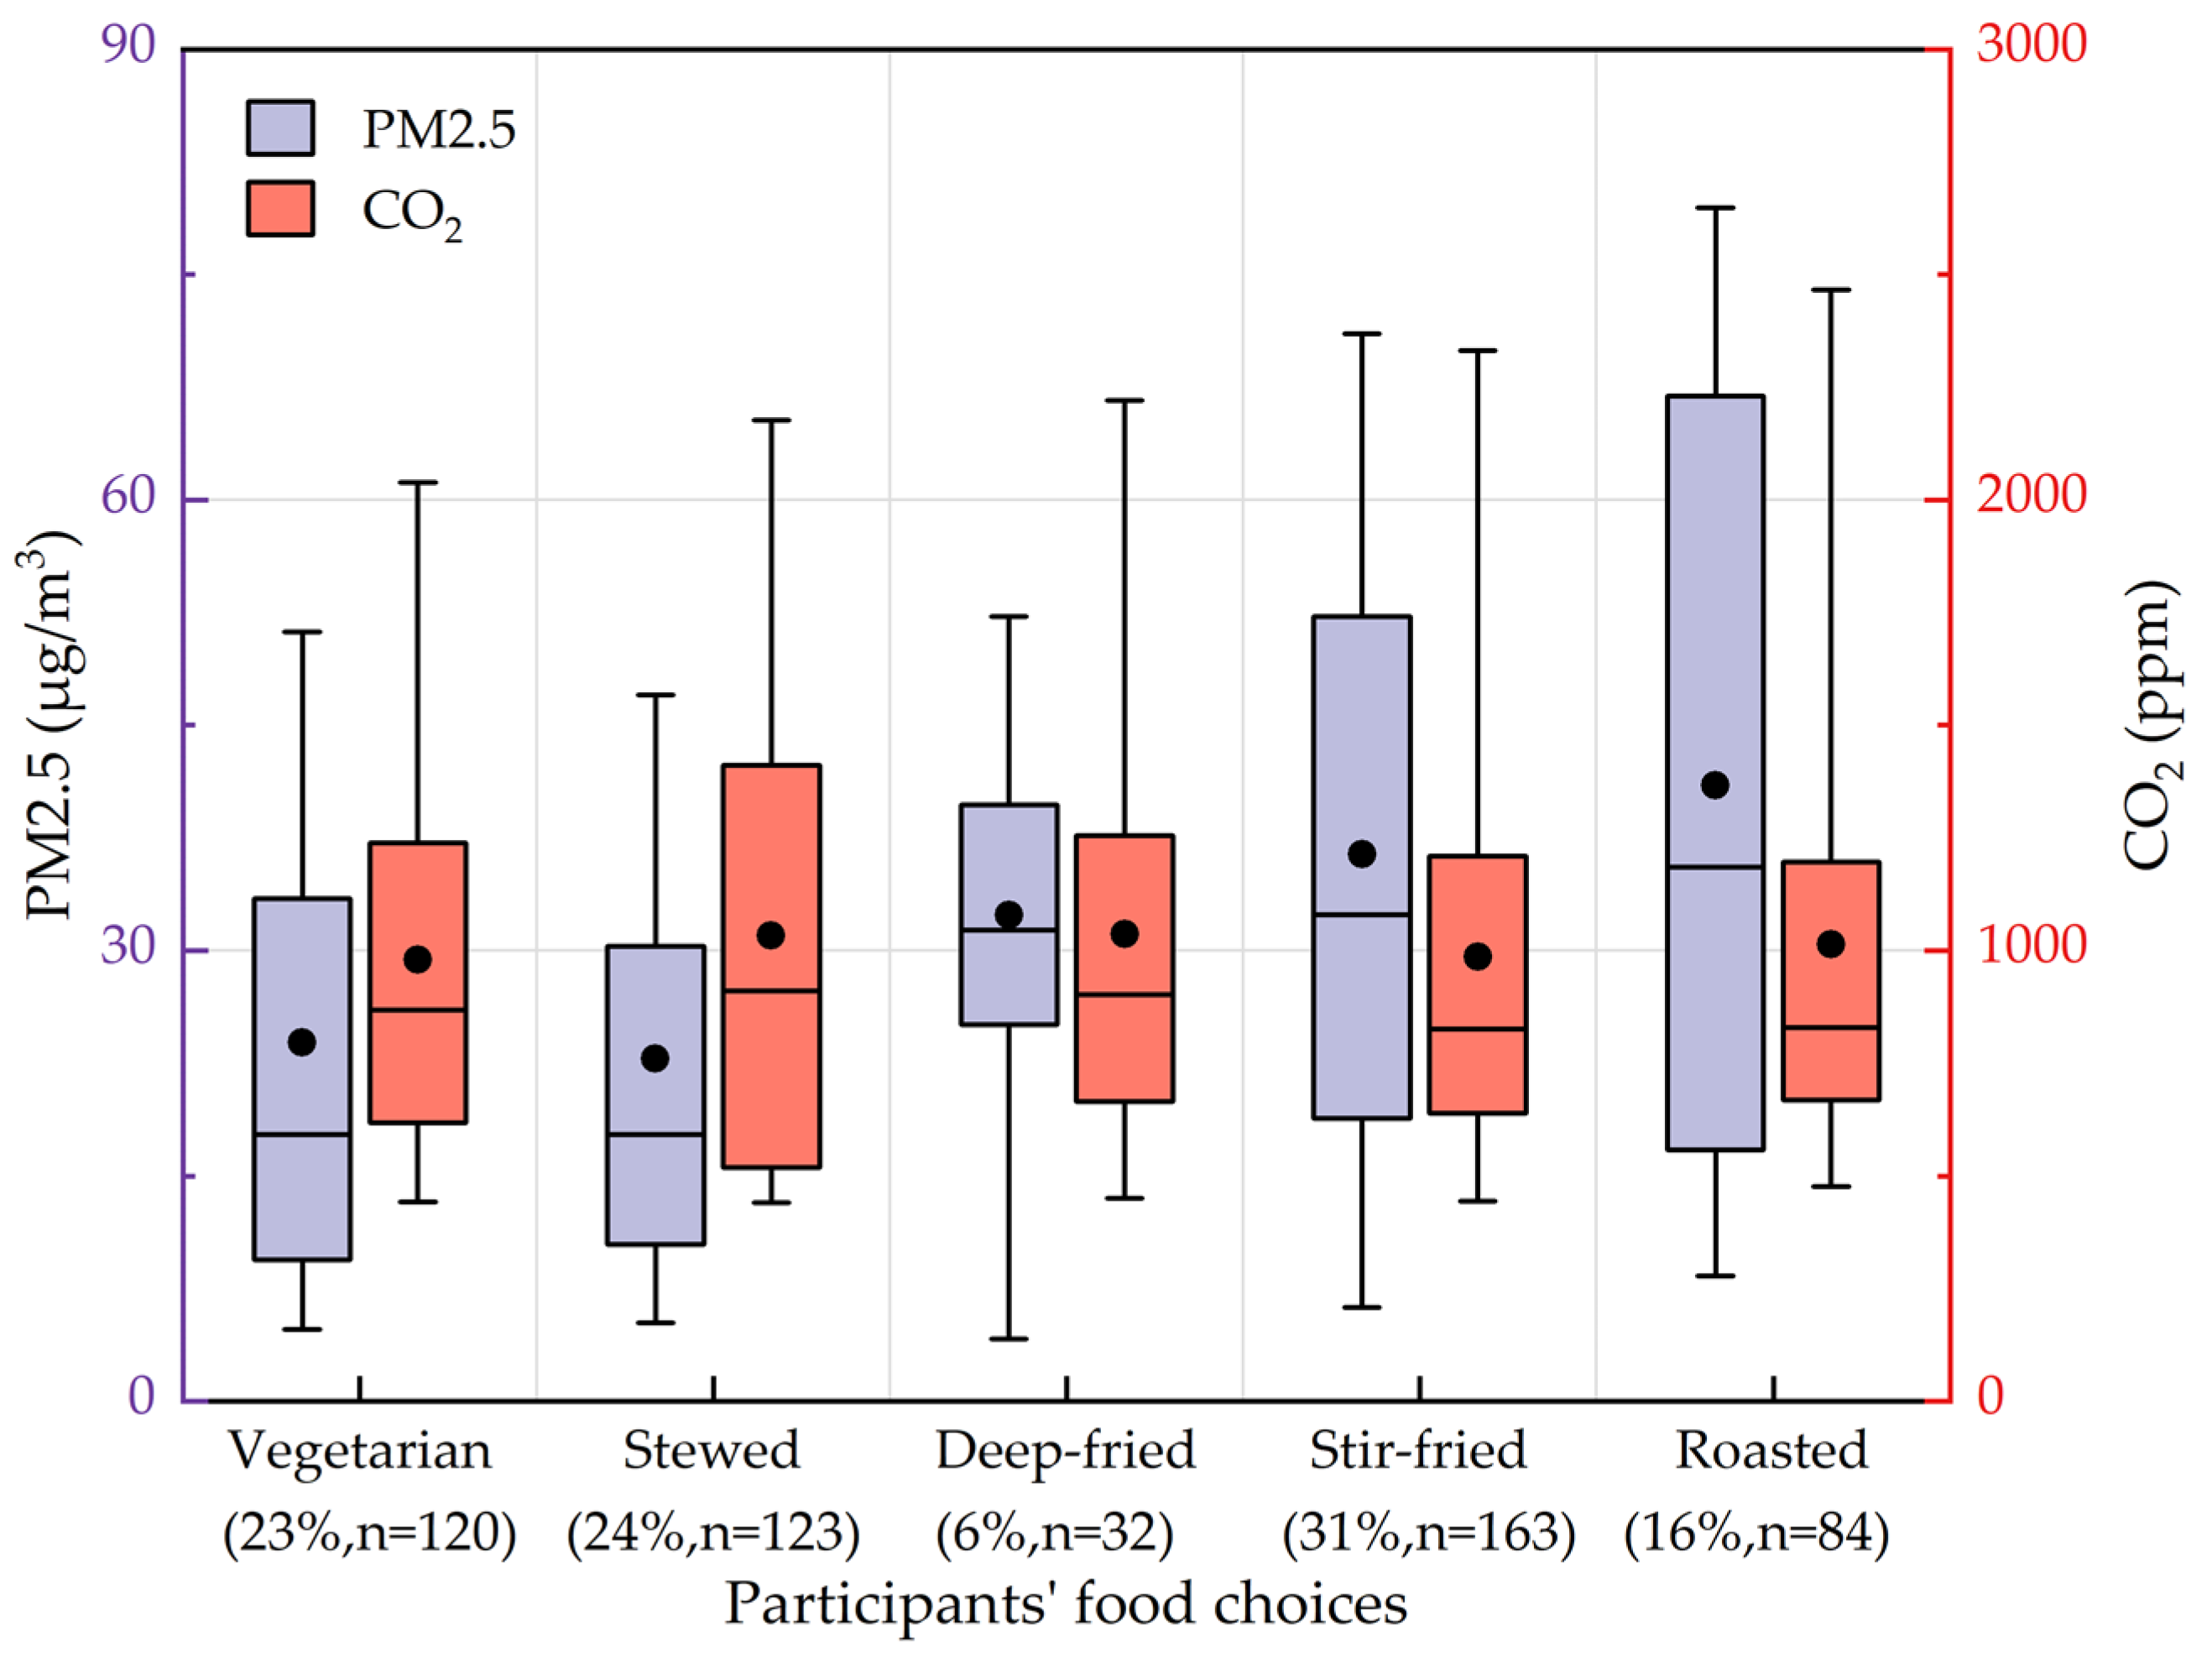
3.2.2. Mealtime: The Correlation between Dietary Choices and Air Quality in Dining Areas
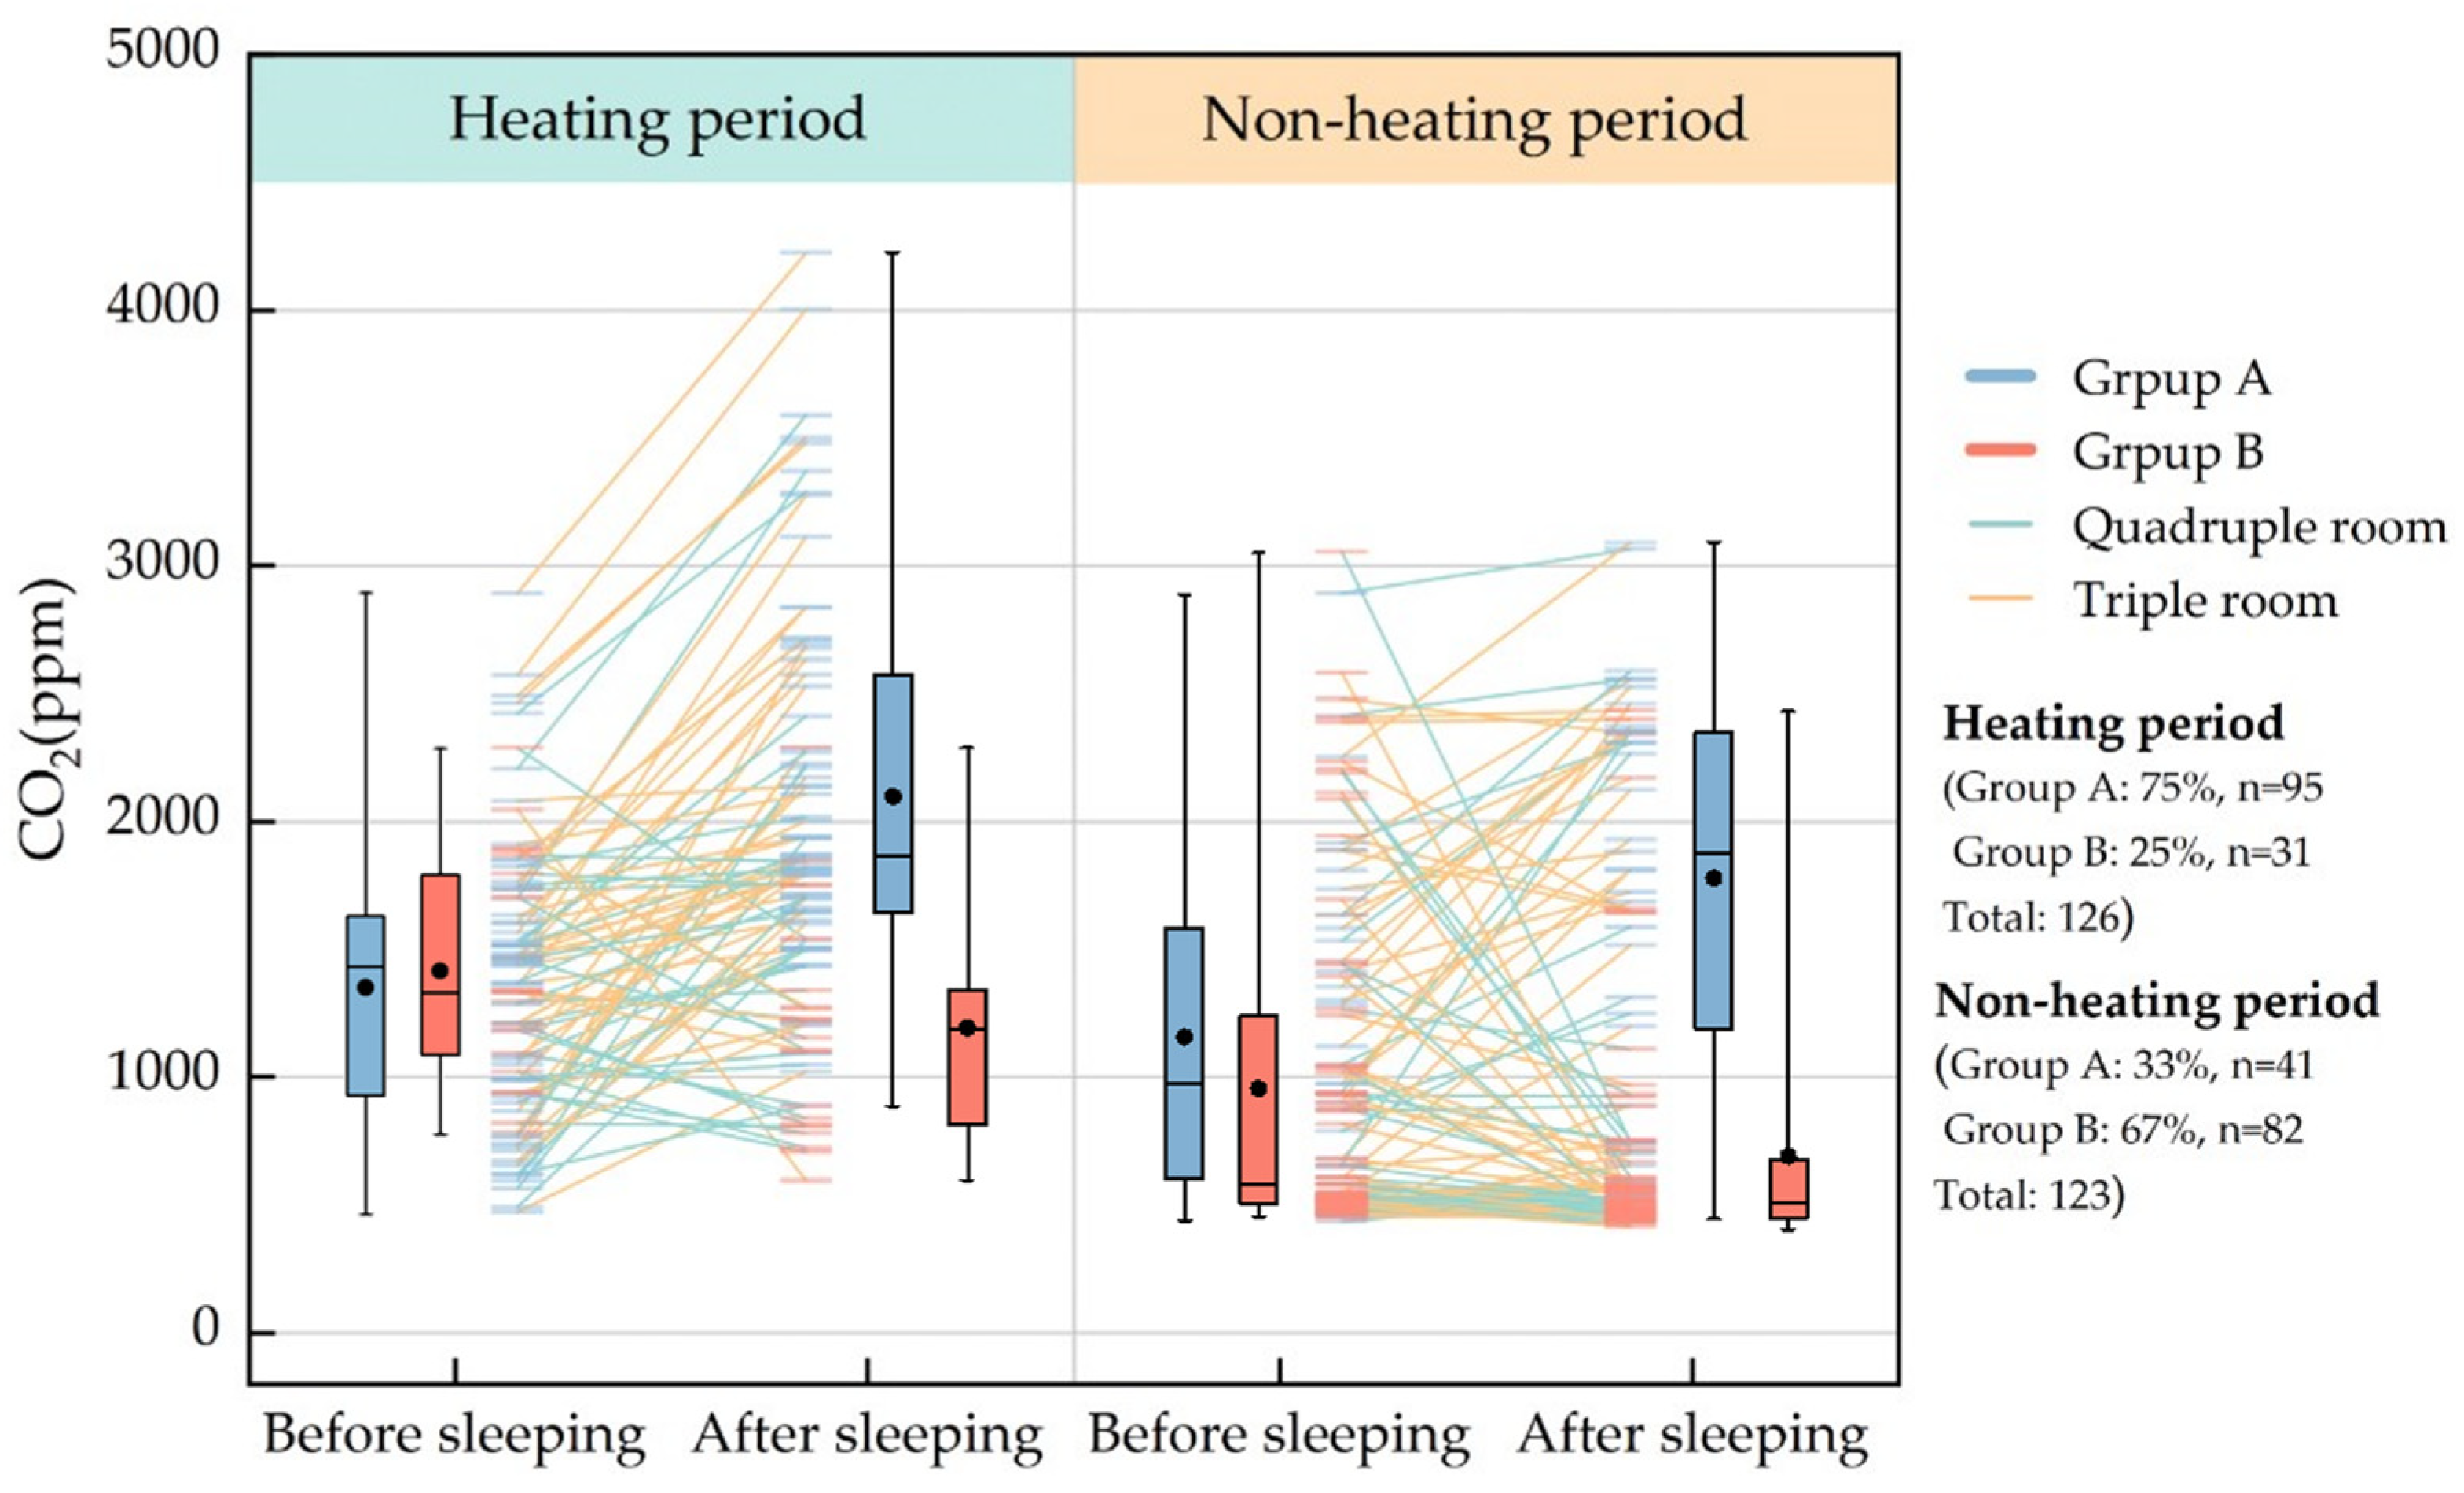
3.2.3. Nighttime Sleep Period: Air Environment and Bedtime Window Opening Behavior
3.3. Adaptability to Environment (TCM Constitutions) and Clothing, Environmental Acceptability
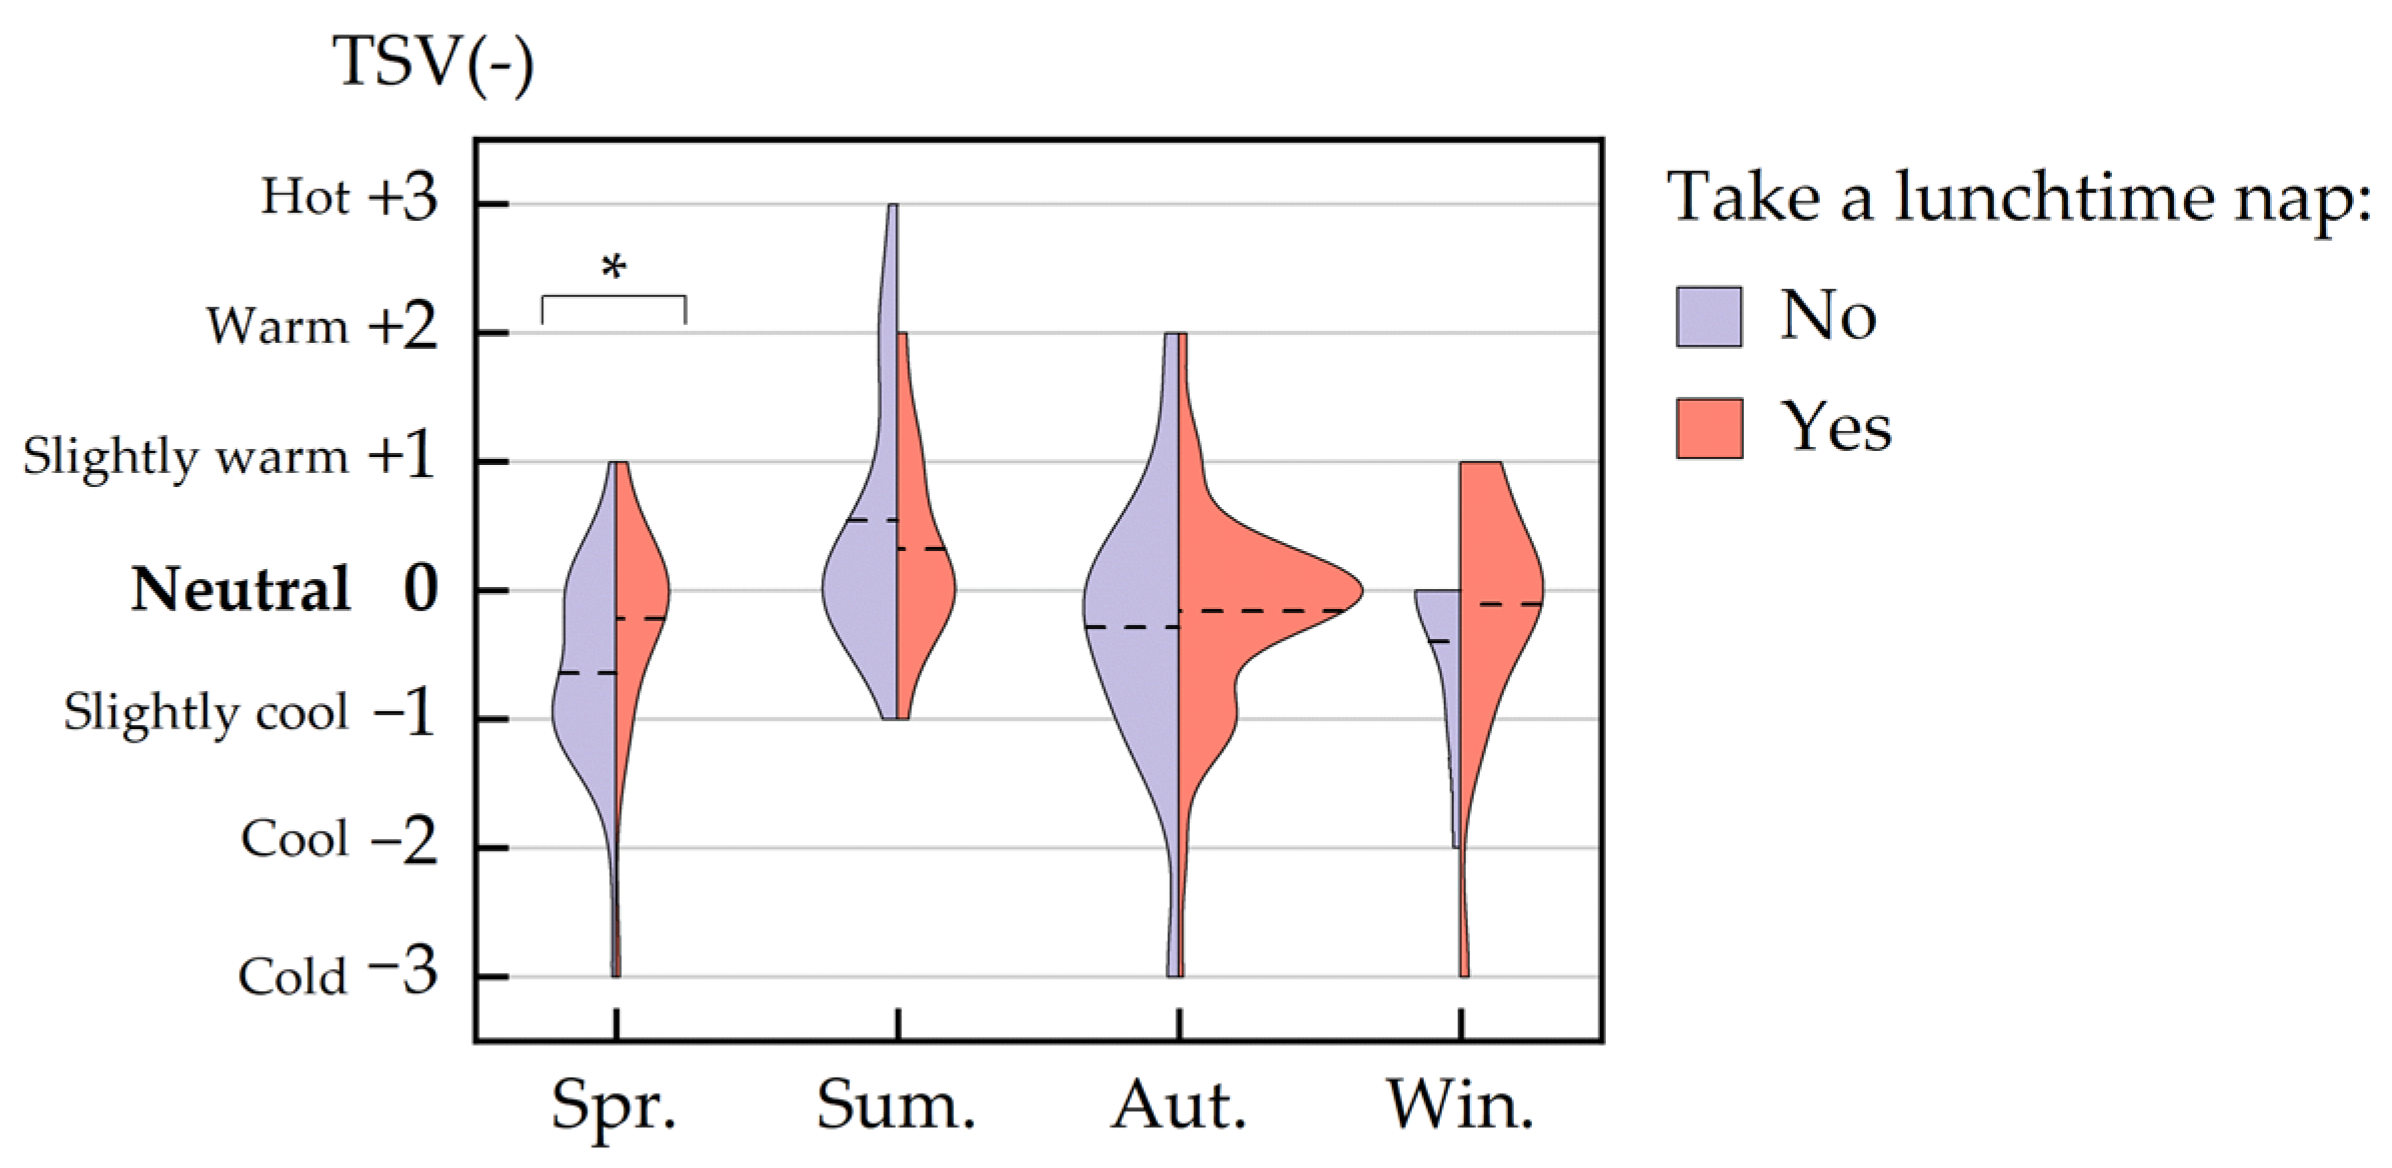
3.4. Lunchtime Nap: The Impact of Lunchtime Nap on Environmental Acceptability
4. Discussion
4.1. Applicability and Limitations of the Companion-Type Data Collection Method
4.2. Discoveries of Daily Environmental Exposure Characteristics
5. Conclusions
- (1)
- The companion-type environmental data collection and monitoring system based on IoT technology provides an effective data collection method to identify potential health risks of students in universities during the pandemic lockdown.
- (2)
- Only 57% of undergraduate students fulfilled their light exposure requirements (CS ≥ 0.3) due to inadequate exposure to morning light. Moreover, the rate was 67% among students who woke up after 8:00 a.m.
- (3)
- The presented measurements indicate that the PM2.5 concentration levels in dining areas selected by participants who prefer roasted, stir-fried, or deep-fried food were generally higher than those selected by those who prefer vegetables or stewed food.
- (4)
- In accordance with the questionnaire surveys, participants who took naps at lunchtime showed better heat acclimatization and tended to rate their heat sensation as neutral throughout the survey month.
- (5)
- Participants with BC constitution demonstrate greater adaptability to seasonal temperature changes.
6. Patents
Author Contributions
Funding
Data Availability Statement
Acknowledgments
Conflicts of Interest
Appendix A
- Indoor attire during the day: Please fill in:
- Outdoor attire during the day: Please fill in:
- Nap situation at noon:Please select: □1 No nap □2 Lie down and sleep □3 Sleep on a chair □4 Sleep on a desk
- Record today’s diet: Please fill in:
- Record your sleep period (check with the mobile app): Please fill in:
- Type of room you are currently in:Please select: □1 Classroom □2 Office □3 Library □4 Dormitory □5 Other:
- Indoor ventilation situation:Please select: □1 Completely closed □2 Slightly open □3 Quarter-open □4 Half-open □5 Fully open
- Room lighting situation:Please select: □1 Fully on □2 Partially on □3 Off
- Type of indoor light source (multiple choice):Please select: □1 Daylight □2 Incandescent lamp □3 Fluorescent lamp □4 LED □5 Other:
- Your current thermal sensation (TSV):Please select: □1 Hot □2 Warm □3 Slightly warm □4 neutral □5 Slightly cool □6 Cool □7 Cold
- How do you expect the surrounding environment to change?Please select: □1 A little cooler □2 No change □3 A little warmer
- Your current perception of humidity:Please select: □1 Very dry □2 Dry □3 Slightly dry □4 Moderate □5 Slightly humid □6 Humid □7 Very humid
- Control strategy of the building you are currently in:Please select: □1 Air conditioning □2 Heating □3 Natural ventilation □4 Mixed mode: ()
- Which of the following activity statuses did you most closely resemble in the past 15 minutes?Please select: □ Lying (0.8 met) □ Sitting (relaxed) (1.0 met) □ Sitting (working, studying) (1.2 met) □ Slow walking (2 km/h) (1.9 met) □ Fast walking (4 km/h) (2.8 met) □ Light activity (shopping, laboratory work) (1.6 met) □ Moderate activity (household chores, manual labor) (2.0 met) □ Other:
References
- Stewart-Brown, S.; Evans, J.; Patterson, J.; Petersen, S.; Doll, H.; Balding, J.; Regis, D. The health of students in institutes of higher education: An important and neglected public health problem? J. Public Health Med. 2000, 22, 492–499. [Google Scholar] [CrossRef] [PubMed]
- Victorino, G.; Bandeira, R.; Painho, M.; Henriques, R.; Coelho, P.S. Rethinking the Campus Experience in a Post-COVID World: A Multi-Stakeholder Design Thinking Experiment. Sustainability 2022, 14, 7655. [Google Scholar] [CrossRef]
- Liu, S.; Zhang, X.; Zhan, C.; Zhang, J.; Xu, J.; Wang, A.; Zhang, H.; Xu, J.; Guo, J.; Liu, X. Evaluating heavy metals contamination in campus dust in Wuhan, the university cluster in Central China: Distribution and potential human health risk analysis. Environ. Earth Sci. 2022, 81, 1–13. [Google Scholar] [CrossRef]
- Jin, S.; Zhong, L.; Zhang, X.; Li, X.; Li, B.; Fang, X. Indoor Volatile Organic Compounds: Concentration Characteristics and Health Risk Analysis on a University Campus. Int. J. Environ. Res. Public Health 2023, 20, 5829. [Google Scholar] [CrossRef]
- Liu, H.; Zhang, Z.; Wen, N.; Wang, C. Determination and risk assessment of airborne endotoxin concentrations in a university campus. J. Aerosol. Sci. 2018, 115, 146–157. [Google Scholar] [CrossRef]
- Cichowicz, R.; Dobrzanski, M. Spatial Analysis (Measurements at Heights of 10 m and 20 m above Ground Level) of the Concentrations of Particulate Matter (PM10, PM2.5, and PM1.0) and Gaseous Pollutants (H2S) on the University Campus: A Case Study. Atmosphere 2021, 12, 62. [Google Scholar] [CrossRef]
- Gao, P.; Lei, T.; Jia, L.; Song, Y.; Lin, N.; Du, Y.; Feng, Y.; Zhang, Z.; Cui, F. Exposure and health risk assessment of PM2.5-bound trace metals during winter in university campus in Northeast China. Sci. Total Environ. 2017, 576, 628–636. [Google Scholar] [CrossRef]
- Mundackal, A.; Ngole-Jeme, V.M. Evaluation of indoor and outdoor air quality in university academic buildings and associated health risk. Int. J. Environ. Health Res. 2022, 32, 1076–1094. [Google Scholar] [CrossRef]
- Sumalla-Cano, S.; Forbes-Hernández, T.; Aparicio-Obregón, S.; Crespo, J.; Eléxpuru-Zabaleta, M.; Gracia-Villar, M.; Giampieri, F.; Elío, I. Changes in the Lifestyle of the Spanish University Population during Confinement for COVID-19. Int. J. Environ. Res. Public Health 2022, 19, 2210. [Google Scholar] [CrossRef]
- Walsh, A.; Taylor, C.; Brennick, D. Factors That Influence Campus Dwelling University Students’ Facility to Practice Healthy Living Guidelines. Can. J. Nurs. Res. 2018, 50, 57–63. [Google Scholar] [CrossRef]
- Ozden, G.; Parlar Kilic, S. The Effect of Social Isolation during COVID-19 Pandemic on Nutrition and Exercise Behaviors of Nursing Students. Ecol. Food Nutr. 2021, 60, 663–681. [Google Scholar] [CrossRef] [PubMed]
- Mnich, C.; Bachert, P.; Kunkel, J.; Waesche, H.; Neumann, R.; Nigg, C.R. Stand Up, Students! Decisional Cues Reduce Sedentary Behavior in University Students. Front. Public Health 2019, 7, 230. [Google Scholar] [CrossRef] [PubMed]
- Lu, J.X.; Zhao, C.; Li, Z.Z.; Shao, Z.R.; Pi, K.Y. The Researches on Food Traceability System of University takeout. In Proceedings of the 2018 4th International Conference on Energy Materials and Environment Engineering (ICEMEE 2018), Kuala Lumpur, Malaysia, 13–15 April 2018. [Google Scholar]
- Lefevre, A.; Agarwal, S.; Zeller, K.; Vasudevan, L.; Labrique, A. Monitoring and Evaluating Digital Health Interventions: A Practical Guide to Conducting Research and Assessment; World Health Organization: Geneva, Switzerland, 2016.
- Montagni, I.; Cariou, T.; Feuillet, T.; Langlois, E.; Tzourio, C. Exploring Digital Health Use and Opinions of University Students: Field Survey Study. JMIR mHealth uHealth 2018, 6, e65. [Google Scholar] [CrossRef]
- Gilliland, J.; Maltby, M.; Xu, X.; Luginaah, I.; Loebach, J.; Shah, T. Is active travel a breath of fresh air? Examining children’s exposure to air pollution during the school commute. Spat. Spatio-Temporal Epidemiol. 2019, 29, 51–57. [Google Scholar] [CrossRef] [PubMed]
- Chen, L.A.; Olawepo, J.O.; Bonanno, F.; Gebreselassie, A.; Zhang, M. Schoolchildren’s exposure to PM 2.5: A student club–based air quality monitoring campaign using low-cost sensors. Air Qual. Atmos. Health 2020, 13, 543–551. [Google Scholar] [CrossRef]
- Kane, F.; Abbate, J.; Landahl, E.C.; Potosnak, M.J. Monitoring particulate matter with wearable sensors and the influence on student environmental attitudes. Sensors 2022, 22, 1295. [Google Scholar] [CrossRef]
- DaSilva, A.W.; Huckins, J.F.; Wang, R.; Wang, W.; Wagner, D.D.; Campbell, A.T. Correlates of stress in the college environment uncovered by the application of penalized generalized estimating equations to mobile sensing data. JMIR mHealth uHealth 2019, 7, e12084. [Google Scholar] [CrossRef]
- Cislo, C.; Clingan, C.; Gilley, K.; Rozwadowski, M.; Gainsburg, I.; Bradley, C.; Barabas, J.; Sandford, E.; Olesnavich, M.; Tyler, J.; et al. Monitoring beliefs and physiological measures using wearable sensors and smartphone technology among students at risk of COVID-19: Protocol for a mHealth study. JMIR Res. Protoc. 2021, 10, e29561. [Google Scholar] [CrossRef]
- Ferrier, B.; Lee, J.; Mbuli, A.; James, D.A. Translational Applications of Wearable Sensors in Education: Implementation and Efficacy. Sensors 2022, 22, 1675. [Google Scholar] [CrossRef]
- Huckins, J.F.; DaSilva, A.W.; Wang, W.; Hedlund, E.; Rogers, C.; Nepal, S.K.; Wu, J.; Obuchi, M.; Murphy, E.I.; Meyer, M.L. Mental health and behavior of college students during the early phases of the COVID-19 pandemic: Longitudinal smartphone and ecological momentary assessment study. J. Med. Internet Res. 2020, 22, e20185. [Google Scholar] [CrossRef]
- Greene, G.W.; White, A.A.; Hoerr, S.L.; Lohse, B.; Phillips, B.W. Impact of an Online Healthful Eating and Physical Activity Program for College Students. Am. J. Health Promot. AJHP 2012, 27, e47–e58. [Google Scholar] [CrossRef]
- Asberg, K.; Lundgren, O.; Henriksson, H.; Henriksson, P.; Bendtsen, P.; Lof, M.; Bendtsen, M. Multiple lifestyle behaviour mHealth intervention targeting Swedish college and university students: Protocol for the Buddy randomised factorial trial. BMJ Open 2021, 11, e051044. [Google Scholar] [CrossRef]
- Lee, J.; Ham, Y. Physiological sensing-driven personal thermal comfort modelling in consideration of human activity variations. Build. Res. Inf. 2020, 49, 512–524. [Google Scholar] [CrossRef]
- Gao, N.; Marschall, M.; Burry, J.; Watkins, S.; Salim, F.D. Understanding occupants’ behaviour, engagement, emotion, and comfort indoors with heterogeneous sensors and wearables. Sci. Data 2022, 9, 261. [Google Scholar] [CrossRef]
- Tsouros, A.D.; Dowding, G.; Thompson, J.; Dooris, M. Health Promoting Universities: Concept, Experience and Framework for Action; World Health Organization Regional Office for Europe: Copenhagen, Denmark, 1998; pp. 5–31.
- Ji Wang, Y.L.C.N. Cognition research and constitutional classification in Chinese medicine. Am. J. Chin. Med. 2011, 39, 1100909. [Google Scholar] [CrossRef] [PubMed]
- Qi, W. Classification and diagnosis basis of nine basic constitutions in Chinese medicine. J. Beijing Univ. Tradit. Chin. Med. 2005, 28, 1–8. [Google Scholar]
- Ru, J.; Ji, W.; Qi, W. Preliminary Compiling of English Version of Constitution in Chinese Medicine Questionnaire. J. Anhui Univ. Chin. Med. 2015, 34, 21–25. [Google Scholar]
- Hui-Ru, J.; Ji, W.; Qi, W. Study on the Performance Evaluation of the English Version of Tcm Constitution Scale. Chin. J. Basic. Med. Tradit. Chin. Med. 2018, 5, 16–28. [Google Scholar]
- ANSI/ASHRAE Standard 55; Thermal Environmental Conditions for Human Occupancy. ASHRAE: New York, NY, USA, 2020.
- Bierman, A.; Klein, T.R.; Rea, M.S.; Rea, M.S. The Daysimeter: A device for measuring optical radiation as a stimulus for the human circadian system. Meas. Sci. Technol. 2006, 16, 2292–2299. [Google Scholar] [CrossRef]
- The Dimesimeter: A User-friendly Circadian Light and Activity Sensor. Available online: https://www.lrc.rpi.edu/resources/newsroom/pdf/2011/DimesimeterPoster8511.pdf (accessed on 1 October 2022).
- Figueiro, M.G.; Bierman, A.; Higgins, P.; Hornick, T.; Rea, M. The Dime-Simeter: A User-friendly Circadian Light Mete. Available online: https://www.lrc.rpi.edu/programs/lightHealth/pdf/mHealth_DimesimeterPoster.pdf (accessed on 1 October 2022).
- Figueiro, M.G.; Kalsher, M.; Steverson, B.C.; Heerwagen, J.; Kampschroer, K.; Rea, M.S. Circadian-effective light and its impact on alertness in office workers. Light. Res. Technol. 2019, 51, 171–183. [Google Scholar] [CrossRef]
- Lewy, A.J.; Wehr, T.A.; Goodwin, F.K.; Newsome, D.A.; Markey, S.P. Light suppresses melatonin secretion in humans. Science 1980, 210, 1267–1269. [Google Scholar] [CrossRef]
- Rea, M.S.; Figueiro, M.G.; Bullough, J.D.; Bierman, A. A model of phototransduction by the human circadian system. Brain Res. Rev. 2005, 50, 213–228. [Google Scholar] [CrossRef]
- CS Calculator. Available online: https://www.lrc.rpi.edu/cscalculator/ (accessed on 1 October 2022).
- Canha, N.; Teixeira, C.; Figueira, M.; Correia, C. How is indoor air quality during sleep? A review of field studies. Atmosphere 2021, 12, 110. [Google Scholar] [CrossRef]
- Pandey, R. Selection of appropriate statistical methods for data analysis. Ann. Card. Anaesth. 2019, 22, 297–301. [Google Scholar]
- Acosta, I.; Laborda, M.Á.C.; Leslie, R.; Radetski, L. Daylighting design for healthy environments: Analysis of educational spaces for optimal circadian stimulus. Sol. Energy 2019, 193, 584–596. [Google Scholar] [CrossRef]
- Iskra-Golec, I.; Smith, L. Daytime Intermittent Bright Light Effects on Processing of Laterally Exposed Stimuli, Mood, and Light Perception. Chronobiol. Int. 2008, 25, 471. [Google Scholar] [CrossRef]
- Zheng, S.; Shen, H.; Shen, G.; Chen, Y.; Ma, J.; Cheng, H.; Tao, S. Vertically-resolved indoor measurements of air pollution during Chinese cooking. Environ. Sci. Ecotech. 2022, 12, 100200. [Google Scholar] [CrossRef] [PubMed]
- Wang, L.; Xiang, Z.; Stevanovic, S.; Ristovski, Z.; Salimi, F.; Gao, J.; Wang, H.; Li, L. Role of Chinese cooking emissions on ambient air quality and human health. Sci. Total. Environ. 2017, 589, 173–181. [Google Scholar] [CrossRef]
- Deliens, T.; Clarys, P.; De Bourdeaudhuij, I.; Deforche, B. Determinants of eating behaviour in university students: A qualitative study using focus group discussions. BMC Public Health 2014, 14, 53. [Google Scholar] [CrossRef]
- Hakro, S.; Jameel, A.; Hussain, A.; Aslam, M.S.; Nisar, A. A Lunch Break Time and Its Impact on Employees Health, Performance and Stress on Work. J. Pharm. Res. Int. 2021, 33, 84–97. [Google Scholar] [CrossRef]
- Ru, T.; Chen, Q.; You, J.; Zhou, G. Effects of a short midday nap on habitual nappers’ alertness, mood and mental performance across cognitive domains. J. Sleep. Res. 2019, 28, e12638. [Google Scholar] [CrossRef] [PubMed]
- Lei, Z.; Liu, C.; Wang, L.; Li, N. Effect of natural ventilation on indoor air quality and thermal comfort in dormitory during winter. Build. Environ. 2017, 125, 240–247. [Google Scholar] [CrossRef]
- Yubei, L. Research on the Field Evidence of Environmental Adaptability Based on CTCM. Master’s Thesis, Dalian University of Technology, Dalian, China, 2021. [Google Scholar]
- Jian, Y.; Hou, Y.; Liu, J.; Guo, R.; Sun, R. Thermal Preference Classification Based on TCM Constitution and Its Influence on the Behavior of Turning on Air Conditioning in Summer. Build. Sci. 2021, 37, 79–85. [Google Scholar]


| Parameters | Sensor Model | Range | Accuracy | Standard Limits |
|---|---|---|---|---|
| Air temperature | SHT3-DIS | −10~80 °C | ±0.3 °C | ±0.5 °C 1 |
| Relative humidity | SHT3-DIS | 5~100% | ±2% | ±5% 1 |
| Illuminance | B-LUX-V22 | 1~65,535 lx | ±5% | ±8% 2 |
| PM2.5 | PMS5003 | 0~500 μg/m3 | ±5 μg/m3 (0~100 μg/m3); ±10% (100~500 μg/m3) | ±10% 2 |
| CO2 | SenseAir-S8 | 0~10,000 ppm | ±8 ppm (≤2000 ppm); ±3% (>2000 ppm) | ±50 ppm 2 |
| GPS | ATGM332D5N | - | 2.5 m | - |
| Number | Dimension | Filling Time |
|---|---|---|
| 0 | Basic Information | Completed during participant recruitment |
| A | Clothing, Diet, Sleep | Complete one copy each day |
| B | Environmental Assessment, Activity Intensity, Environmental Adjustment Behavior | Once at getting up in the morning, once in the forenoon, and once in the afternoon, once before bedtime |
| Location | Season | Duration | Participants | Building Type |
|---|---|---|---|---|
| Dalian | Spring | 13/03/2021~21/03/2021 | 20 | Office, Library, Classroom, Dormitory |
| Summer | 02/08/2021~06/08/2021 | 10 | ||
| Autumn | 25/10/2021~29/10/2021 | 20 | ||
| Winter | 14/12/2022~17/12/2022 | 8 |
| Building Type | Area (m2) | Blind Type | Air Conditioning | Radiator |
|---|---|---|---|---|
| Office | 40~60 | Rolling curtain, Venetian blinds | √ | √ |
| Library | 300~500 | Rolling curtain | √ | √ |
| Classroom | 50~200 | Rolling curtain, Fabric curtain | × | √ |
| Dormitory | 18~24 | Fabric curtain | × | √ |
| Questions |
|---|
| What is your academic status? |
| What is your original province? |
| How long have you lived in the university? |
| What is your gender? |
| TCM constitutions |
| What is your academic status? |
| Characteristics | N | % | |
|---|---|---|---|
| Academic status | Undergraduate | 19 (6/3/6/4) | 33 |
| Post-graduate | 39 (14/7/14/4) | 67 | |
| Original province | Northern China | 36 (14/5/13/4) | 62 |
| Southern China | 22 (6/5/7/4) | 38 | |
| Duration of Stay in School Location | Less than one year | 15 (4/1/5/5) | 26 |
| 1~3 years | 32 (12/7/12/1) | 55 | |
| More than three years | 11 (4/2/3/2) | 19 | |
| Sex | Female | 30 (10/6/10/4) | 52 |
| Male | 28 (10/4/10/4) | 48 | |
| TCM constitutions | BC | 18 (5/6/4/3) | 31 |
| QDC | 19 (7/4/6/2) | 33 | |
| YADC | 11 (6/0/5/0) | 19 | |
| YIDC | 10 (2/0/5/3) | 17 |
| Window Opening Degree and Mode 1 (Percentage) | Changes before and after Sleep 2 | ||
|---|---|---|---|
| Average Change in CO2 (ppm) | Average Change in Indoor AT (°C) | Outdoor AT (°C) | |
| Winter | +640 (+52%) | −1.3 (−7%) | |
| Quarter-open (13%) | −110 (−11%) | −1.5 (−8%) | −6.2~−4.8 |
| Slightly open (20%) | +180 (+10%) | −1.2 (−6%) | |
| Completely closed (67%) | +930 (+80%) | −0.2 (−1%) | |
| Always off (33%) | +910 (+70%) | −0.4 (−2%) | |
| Intermittently on (60%) | +570 (+45%) | −1.2 (−6%) | |
| Always on (7%) | −10 (−2%) | −1.5 (−8%) | |
| Spring | +430 (+32%) | −1.0 (−5%) | |
| Quarter-open (28%) | −180 (−12%) | −1.1 (−5%) | 7.6~9.5 |
| Slightly open (24%) | +180 (+13%) | −1.3 (−7%) | |
| Completely closed (49%) | +890 (+71%) | −0.3 (−1%) | |
| Always off (15%) | +680 (+61%) | −0.5 (−2%) | |
| Intermittently on (75%) | +410 (+30%) | −1.1 (−5%) | |
| Always on (10%) | +200 (+15%) | −1.0 (−5%) | |
| Summer | −330 (−31%) | −0.8 (−3%) | |
| Fully open (20%) | −1500 (−72%) | −1.6 (−6%) | 23.2~27.4 |
| Half-open (33%) | −250 (−28%) | −1.3 (−5%) | |
| Quarter-open (28%) | 0 (0%) | −0.3 (−1%) | |
| Slightly open (20%) | +250 (+21%) | −0.1 (−0.4%) | |
| Always on (100%) | −330 (−31%) | −0.8 (−3%) | |
| Autumn | +350 (+31%) | −0.4 (−2%) | |
| Half-open (25%) | −180 (−19%) | −2.0 (−9%) | 8.8~12.8 |
| Quarter-open (26%) | −40 (−5%) | −0.7 (−4%) | |
| Slightly open (12%) | +220 (+19%) | −0.3 (−1%) | |
| Completely closed (37%) | +1030 (+75%) | +0.9 (+5%) | |
| Intermittently on (79%) | +450 (+40%) | −0.3 (−1%) | |
| Always on (21%) | −40 (−4%) | −0.8 (−4%) | |
| TCM Constitutions | TSV (Percentage of Votes) | Average TSV (−) | Indoor AT (℃) | RH (%) | Average Iclo (clo) | ||||||
|---|---|---|---|---|---|---|---|---|---|---|---|
| −3 | −2 | −1 | 0 | +1 | +2 | +3 | |||||
| Winter | 2% | 8% | 19% | 48% | 21% | 2% | 0% | −0.16 | 12.6~25.5 avg. = 20.7 | 25~37 avg. = 30 | |
| BC | 0% | 0% | 20% | 57% | 23% | 0% | 0% | 0.03 | 1.08 | ||
| QDC | 6% | 15% | 18% | 30% | 27% | 3% | 0% | −0.33 | 1.32 | ||
| YIDC | 0% | 9% | 17% | 61% | 9% | 4% | 0% | −0.17 | 1.20 | ||
| Spring | 2% | 5% | 13% | 63% | 16% | 0% | 1% | −0.08 | 16.7~26.6 avg. = 21.9 | 22~63 avg. = 38 | |
| BC | 0% | 2% | 13% | 68% | 15% | 0% | 2% | 0.04 | 1.10 | ||
| QDC | 2% | 6% | 14% | 61% | 16% | 0% | 1% | −0.15 | 1.48 | ||
| YADC | 0% | 14% | 0% | 71% | 14% | 0% | 0% | −0.14 | 1.53 | ||
| YIDC | 0% | 0% | 0% | 63% | 38% | 0% | 0% | 0.38 | 1.35 | ||
| Summer | 0% | 0% | 3% | 57% | 29% | 10% | 0% | 0.47 | 24.1~32.4 avg. = 27.7 | 33~76 avg. = 59 | |
| BC | 0% | 0% | 1% | 65% | 23% | 11% | 0% | 0.43 | 0.43 | ||
| QDC | 0% | 0% | 6% | 40% | 45% | 9% | 0% | 0.57 | 0.38 | ||
| Autumn | 7% | 4% | 15% | 65% | 9% | 0% | 0% | −0.34 | 17.4~26.7 avg. = 22 | 45~74 avg. = 58 | |
| BC | 0% | 0% | 9% | 82% | 9% | 0% | 0% | 0.00 | 0.93 | ||
| QDC | 5% | 2% | 18% | 68% | 7% | 0% | 0% | −0.30 | 1.08 | ||
| YADC | 21% | 14% | 14% | 43% | 7% | 0% | 0% | −1.00 | 1.03 | ||
| YIDC | 0% | 0% | 0% | 60% | 40% | 0% | 0% | 0.40 | 0.96 | ||
Disclaimer/Publisher’s Note: The statements, opinions and data contained in all publications are solely those of the individual author(s) and contributor(s) and not of MDPI and/or the editor(s). MDPI and/or the editor(s) disclaim responsibility for any injury to people or property resulting from any ideas, methods, instructions or products referred to in the content. |
© 2023 by the authors. Licensee MDPI, Basel, Switzerland. This article is an open access article distributed under the terms and conditions of the Creative Commons Attribution (CC BY) license (https://creativecommons.org/licenses/by/4.0/).
Share and Cite
Deng, J.; Chen, B.; Fu, C.; Du, J. Exploration of Campus Environmental Health Issues and Individual Disparities in Environmental Perceptions Based on Daily Activity Path. Buildings 2023, 13, 2544. https://doi.org/10.3390/buildings13102544
Deng J, Chen B, Fu C, Du J. Exploration of Campus Environmental Health Issues and Individual Disparities in Environmental Perceptions Based on Daily Activity Path. Buildings. 2023; 13(10):2544. https://doi.org/10.3390/buildings13102544
Chicago/Turabian StyleDeng, Jie, Bin Chen, Changfeng Fu, and Jia Du. 2023. "Exploration of Campus Environmental Health Issues and Individual Disparities in Environmental Perceptions Based on Daily Activity Path" Buildings 13, no. 10: 2544. https://doi.org/10.3390/buildings13102544