Article

Experimental and Numerical Investigation of the Shear Performance of an Innovative Keyway Joint for Prefabricated Concrete Wall Panels

1
School of Resources and Architectural Engineering, Gannan University of Science and Technology, Ganzhou 341000, China
2
School of Civil Engineering, Central South University, Changsha 410075, China
*
Authors to whom correspondence should be addressed.
Buildings 2023, 13(12), 2978; https://doi.org/10.3390/buildings13122978
Submission received: 22 October 2023 / Revised: 16 November 2023 / Accepted: 20 November 2023 / Published: 29 November 2023
(This article belongs to the Section Building Structures)

Abstract

:
To improve the shear performance and construction efficiency of horizontal joints in prefabricated concrete wall panel structures, an innovative keyway joint for prefabricated concrete wall panels is presented to maximize the contact area and joint friction, enhancing both the shear performance and the installation efficiency. Shear tests on eight prefabricated concrete wall panels were conducted to investigate the effects of the axial compression ratio, interface mortar strength, and keyway depth on the shear performance of these novel joints. Concurrently, a finite element model for prefabricated concrete wall panel keyway connections was established via ABAQUS, and a parametric analysis approach was employed to study various factors such as the axial compression ratio, the interface mortar strength, and the keyway construction type, as well as their impact on the shear performance of joints. The findings showed that, as the axial compression ratio increased, the failure mode of the keyway joint transitioned from shear brittle failure to compressive shear plastic failure, accompanied by evident crack propagation. The recommended keyway depth parameter remains between 40 and 80 mm, with the inclination angle of the keyway joint ideally ranging from 0° to 20°. Compared to the straight joint, the shear capacity of the innovative keyway joint increased by 16.5%.

1. Introduction

With the ongoing transformation of the construction industry and the rapid pace of urbanization, the construction sector is increasingly seeking solutions that are faster, more efficient, and of higher quality. In response to this demand, prefabricated concrete structures have emerged as a highly promising construction method [1,2,3,4,5,6]. These structures offer several advantages, including shorter construction periods, high-quality production, and sustainability, making them the focus of considerable attention and widespread applications [7,8]. Many scholars have conducted extensive research covering various aspects of precast concrete structures, including precast columns [9,10,11], beams [12,13], and beam–column joints [14,15,16]. These studies have not only focused on structural design and performance but have also addressed issues related to construction efficiency and sustainability. This body of research has not only enriched the theoretical foundations of precast concrete structures but has also provided strong support for practical engineering applications.
In the realm of building structures, concrete wall panel systems are often considered integral components. The prefabricated construction of concrete wall panel structures plays an important role in improving the efficiency, quality, and sustainability of buildings. However, unlike cast-in-place concrete structures [17,18,19], prefabricated concrete wall panel structures have a significant number of joint seams, which are critical locations for structural integrity. Poor shear performance at the horizontal joints can directly impact the overall reliability of these prefabricated concrete structures [20]. Currently, horizontal joint connection methods for prefabricated concrete wall panel structures include grouted sleeve connections, mortar anchorage overlaps, and bolt connections [21,22,23]. Research has shown that the interface connections between the horizontal joint layer and both the top and bottom prefabricated concrete components should not be overlooked [24,25].
Furthermore, to improve the shear performance of the horizontal joints in prefabricated concrete wall panel structures, some researchers have proposed and investigated various connection methods [26,27] and strategies, including surface roughening or the incorporation of shear keys at the interfaces [28,29]. Alternatively, reinforcement measures or detection methods from other civil engineering fields can be applied to horizontal joints [30,31,32,33]. Xiao et al. [34] introduced a novel alveolar-type joint for prefabricated concrete wall panels and examined various parameters, like the axial compression ratio, joint size, and interface mortar strength, to evaluate their impacts on the performance of the horizontal joints. Cheng et al. [35] proposed a novel bolted C-shaped steel plate for the horizontal joints of precast shear walls and investigated the mechanical performance of precast shear wall structures under reversed cyclic loading. It was found that the bolted C-shaped steel plate could significantly improve the ductility of the joint. Biswal et al. [36] examined the shear performance of precast concrete wall panels with vertical grouted joints. Zhao et al. [37] investigated the shear behaviors of multilayer concrete–grout–concrete joints for precast concrete structures under both monotonic and cyclic loading. Zhou et al. [38] introduced an innovative steel sleeve and box connections suitable for precast concrete shear walls. Meanwhile, Cholewicki et al. [39] implemented shear keys at the joints of precast concrete components and conducted shear performance tests. Studies have revealed that the shear performance of joints primarily relies on the frictional forces at the bonding surfaces and the geometric characteristics of shear keys. Rizkalla et al. [29] highlighted the profound effects of external loads, particularly axial loads and shear keys, on the shear performance of joints. Soudki et al. [40] determined that shear keys effectively restrained the horizontal slip of joints. Although the aforementioned methods for interface construction effectively enhance the shear capacity of joints, practical on-site construction encounters issues such as high levels of assembly complexity, low construction tolerance, stringent precision needs, extensive wet operations, suboptimal grout compaction, and week resistance to water infiltration at horizontal joints [41,42,43]. Such challenges prevent users from maximizing the benefits of rapid assembly.
The above research confirms that there are still some shortcomings in prefabricated concrete wall panel structures, such as challenges in construction and the poor shear performance of horizontal joints. These issues restrict the maximum potential of the structure in assembly applications. Therefore, this study aims to address these challenges by proposing an innovative horizontal keyway joint as a potential solution to improve the shear performance and construction efficiency of horizontal joints, thereby advancing the development of prefabricated concrete wall panel structures. This innovative keyway joint offers distinctive advantages. On the one hand, it maximizes the contact area and joint friction, enhancing both the shear performance and the installation efficiency. On the other hand, the structure relied on the weight of the wall panel for grouting, ensuring the complete filling of the joint and eliminating issues related to inadequate joint sealing. To provide a more comprehensive evaluation of the shear performance of this innovative keyway joint, unidirectional shear load tests were conducted on eight prefabricated concrete wall panels with keyway joints. The effects of the axial compression ratio, interface mortar strength, and keyway depth on the shear performance of these novel joints were studied. Subsequently, numerical simulations were performed using ABAQUS, and the accuracy of the model was verified based on experimental results. Finally, systematic parameter analysis methods were used to evaluate the effects of factors such as the axial compression ratio, the keyway construction type, the interface mortar strength, and the shear span ratio on the shear performance of the keyway joint. The research findings contribute to a better understanding of the novel keyway joint and its potential applications in low-rise or multi-story prefabricated wall panel structures.

2. Experimental Analysis
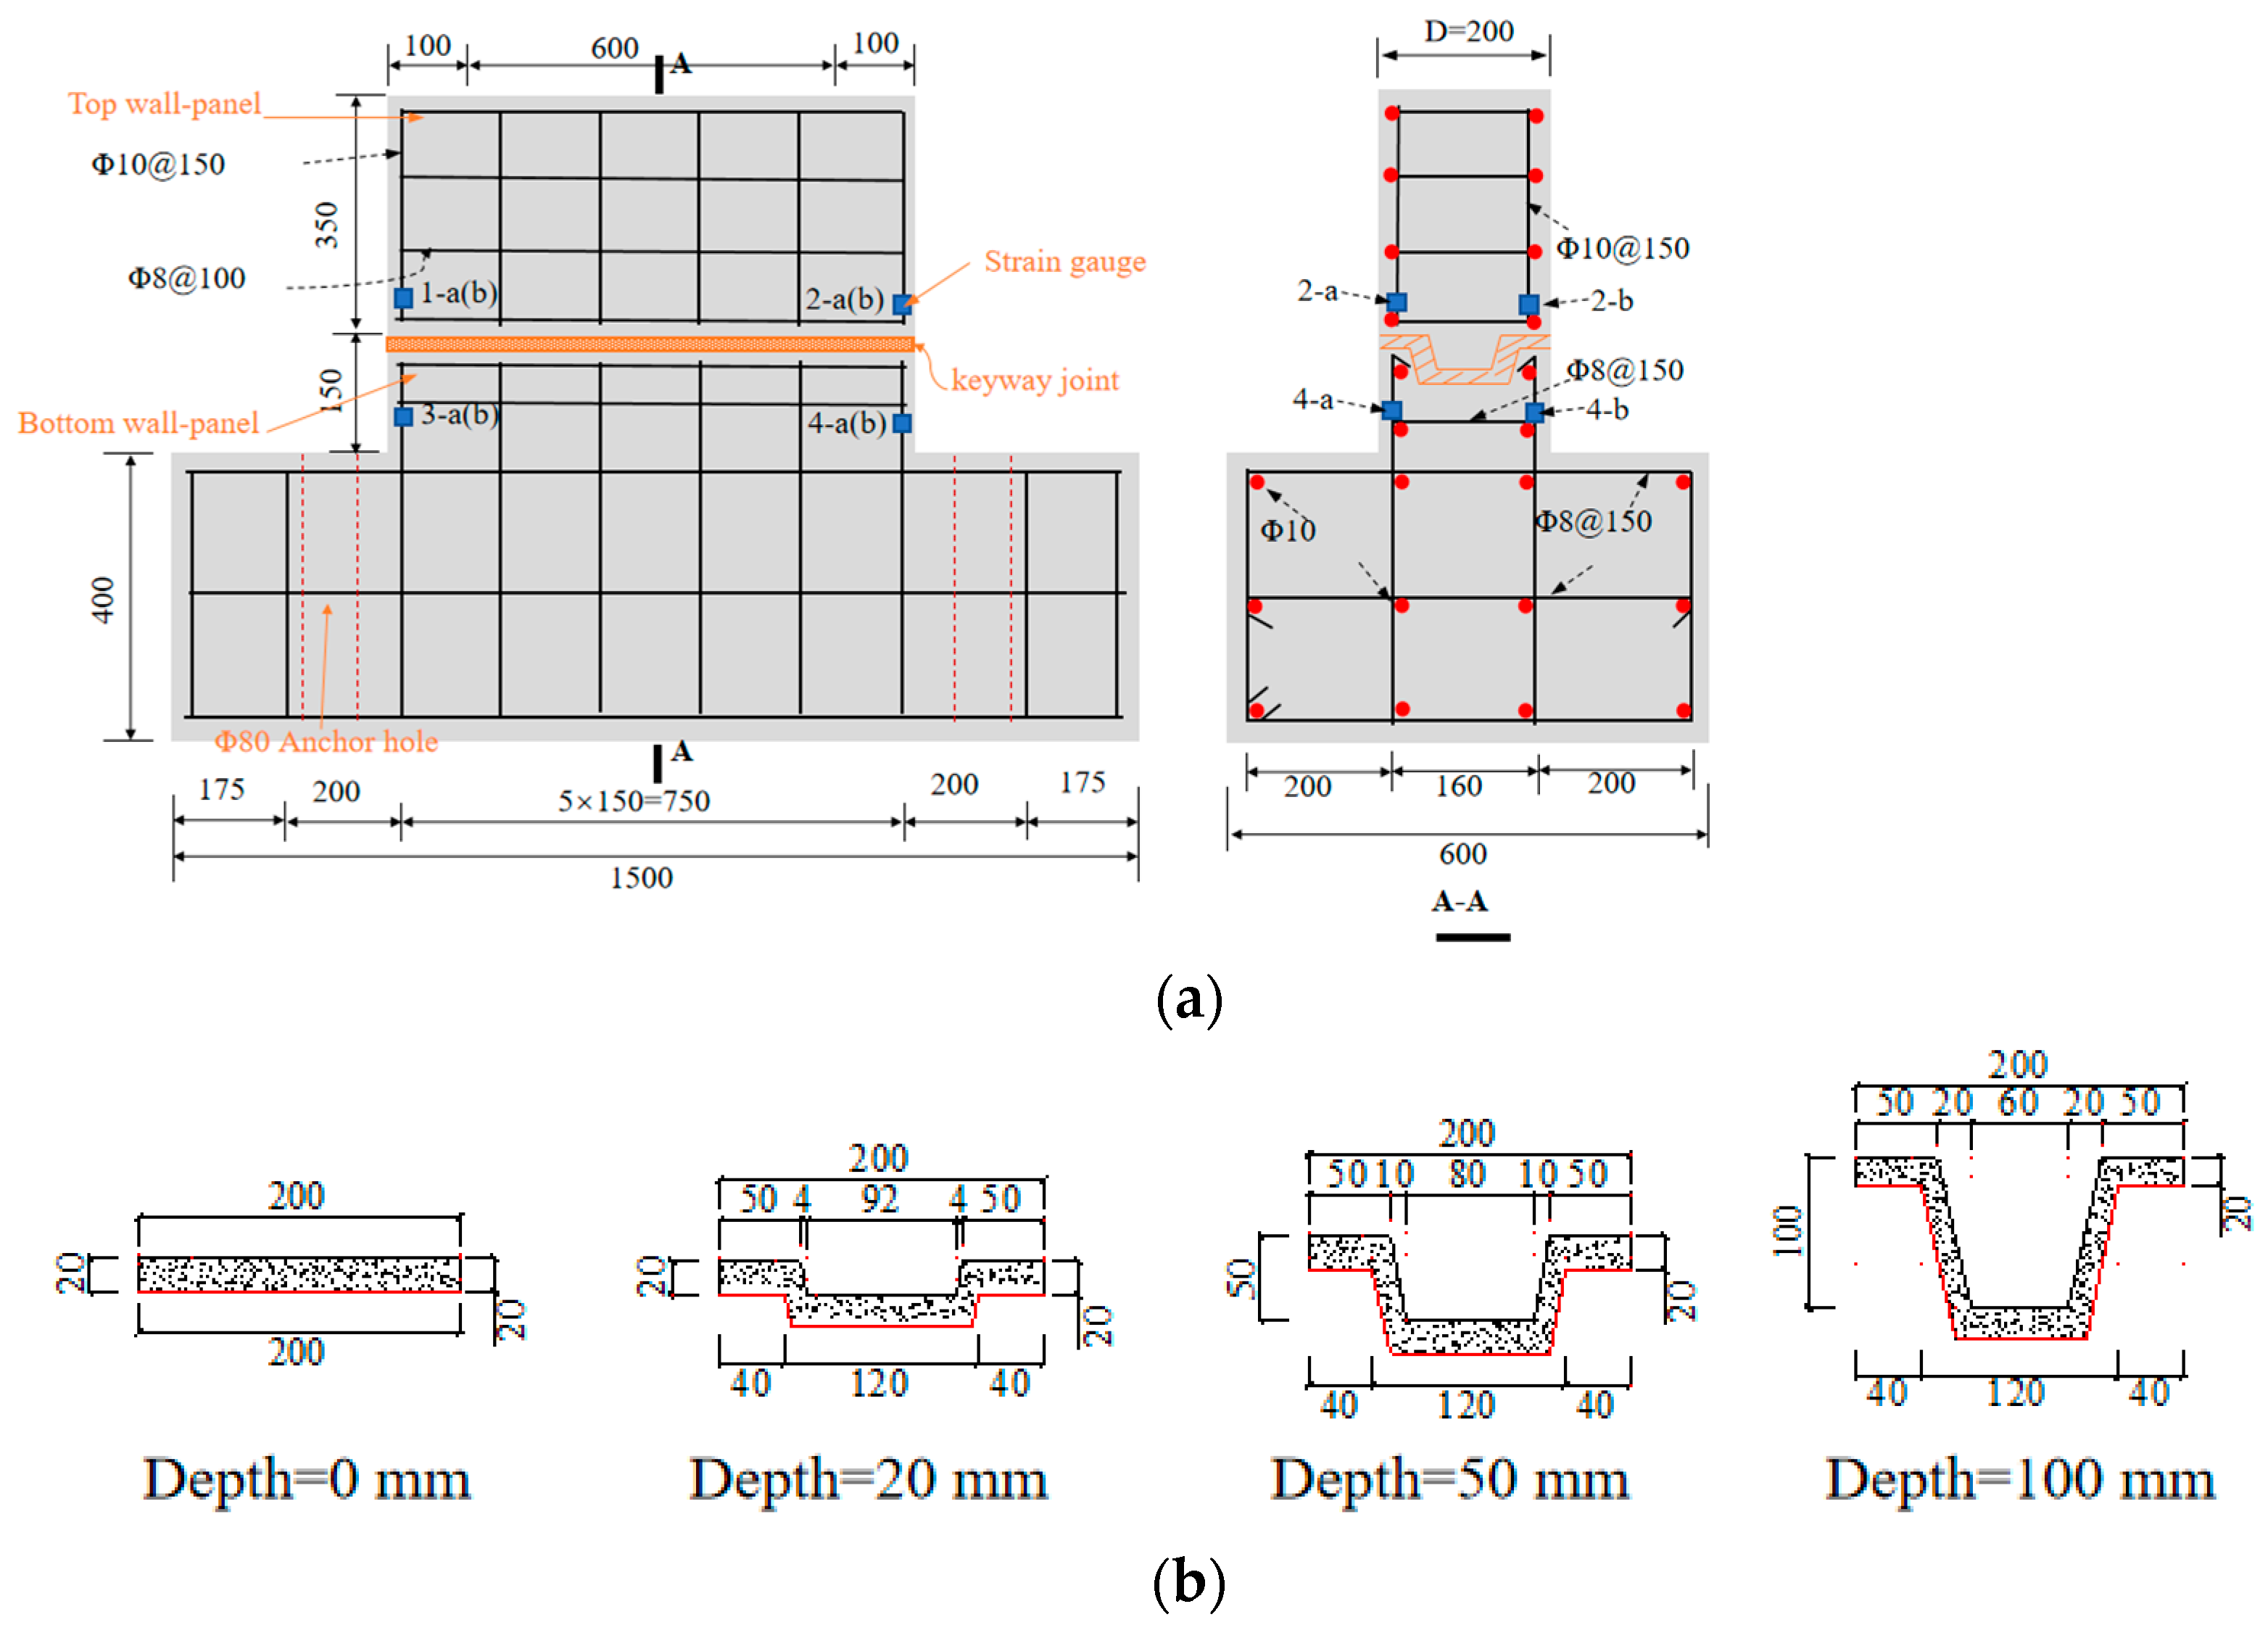
2.1. Test Design

An innovative keyway joint designed for prefabricated concrete wall panels was proposed, as illustrated in Figure 1. The prefabricated concrete wall panels are composed of both top and bottom wall panels, bottom load-bearing bases, and innovative horizontal keyway joints. This study primarily aims to investigate the impact of various parameters, including the axial compression ratio, the shear span ratio, the interface mortar strength, and the keyway depth, on the shear performance of these keyway joint. Consequently, a total of eight prefabricated concrete wall panel specimens with keyway joints were designed and manufactured, labelled as KTAF-1 to KTAF-3 and KTKD-1 to KTKD-5. Meanwhile, shear tests were carried out on these specimens under monotonic loads. The key information on the test specimens is summarized in Table 1.
Specimens KTAF-1 to KTAF-3 were designed to explore the effects of different axial compression ratios (0, 0.1, and 0.2) on the shear performance of the keyway joint, and the shear span ratio was 0.49. Each specimen measured 900 mm in total height, with the bottom load-bearing base dimensions set to 1500 mm × 600 mm × 400 mm. The prefabricated concrete wall panels were divided into top and bottom wall panels, each measuring 600 mm in length and 200 mm in thickness. The height of the top wall panel was fixed at 350 mm, while the bottom wall panel measured 130 mm in height. The keyway joint was standardized at a thickness of 20 mm.
Specimens KTKD-1 to KTKD-5 were used to investigate the impacts of both the interface mortar strength and the keyway depth on the shear performance of the keyway joint for the prefabricated concrete wall panels, and the shear span ratio was 0.37. These specimens had varying total heights, ranging from 870 mm to 950 mm, adjusted in accordance with the keyway depth. As with the specimens KTAF-1 to KTAF-3, the top wall panel had a height of 350 mm, while the height of the bottom wall panel varied from 100 mm to 180 mm. The length and thickness of the prefabricated concrete wall panels were consistently kept at 800 mm and 200 mm, respectively. Further details for the prefabricated wall panels are shown in Figure 2.

2.2. Materials

The prefabricated concrete wall panels and bottom load-bearing bases were constructed using C30 concrete with a compressive strength of 39.6 MPa (the average value measured for three 150 mm cubes) after 28 days. The grade of the reinforcing bars used in the test was HRB400, and the yield strength and tensile strength of the steel bars were 428.3 MPa and 577.1 MPa, respectively.

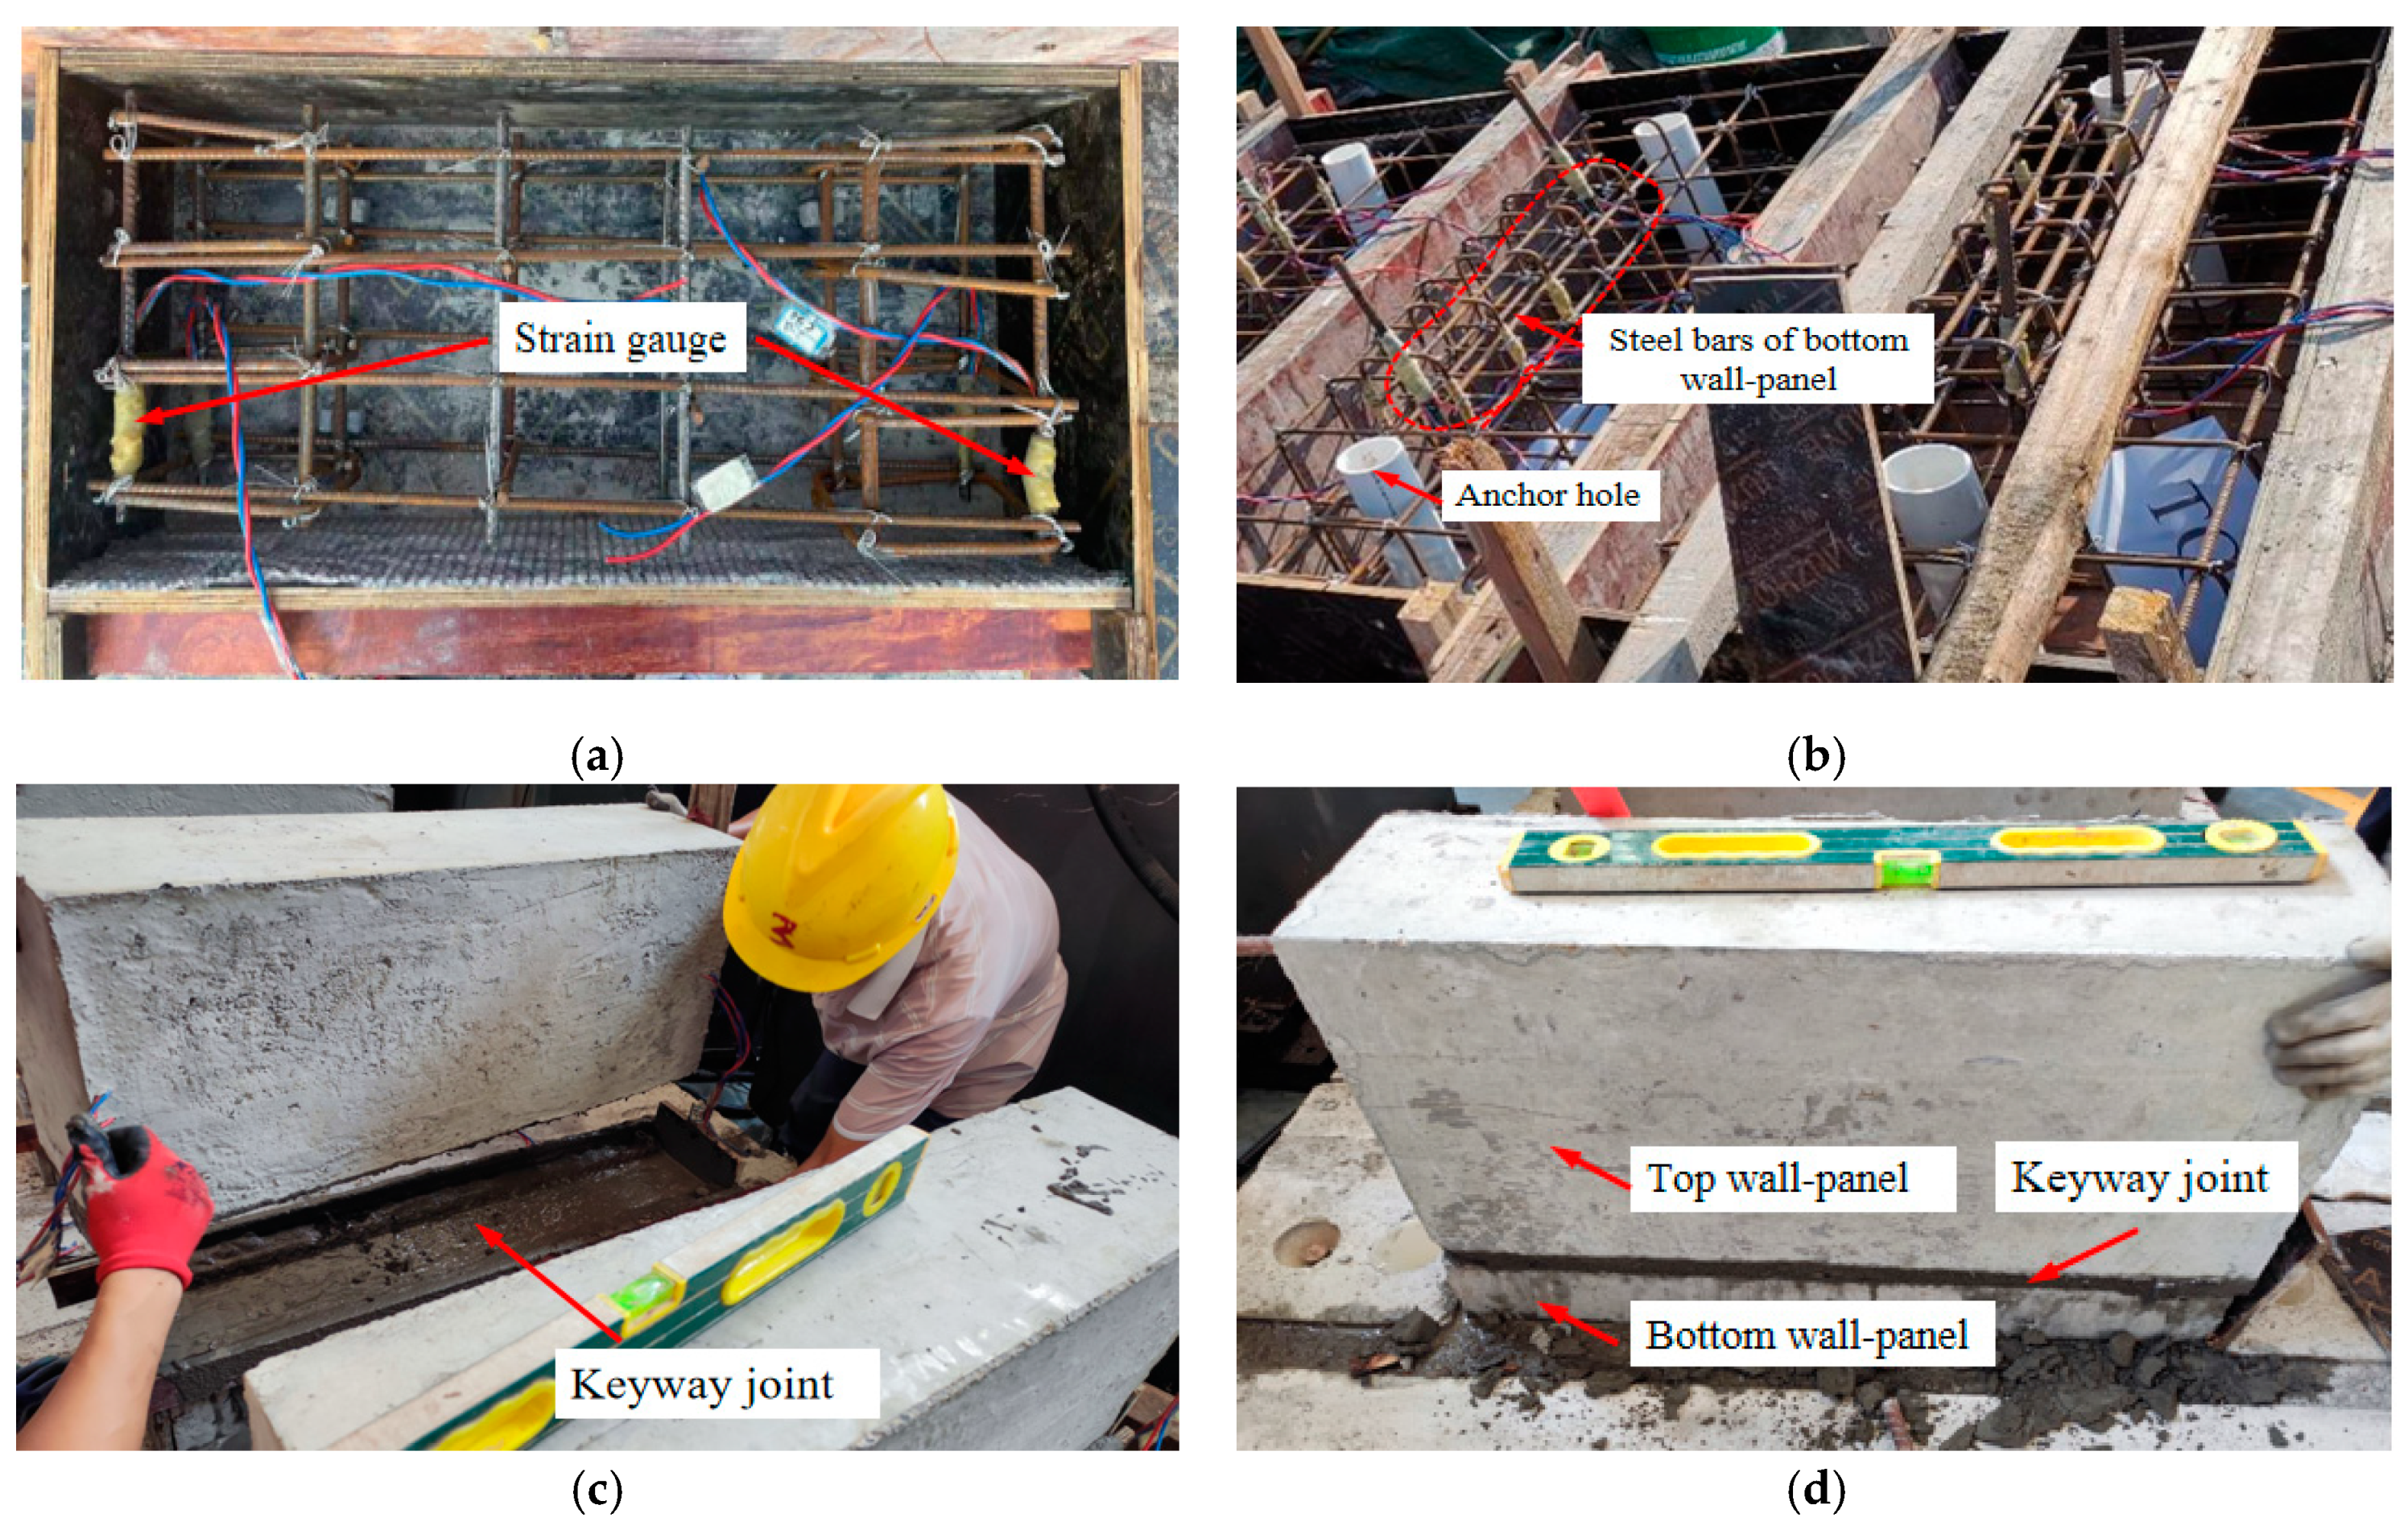
2.3. Specimen Preparation

Figure 3 shows the manufacturing and assembly procedure for the prefabricated concrete wall panels. The prefabricated concrete wall panels were divided into two parts for casting. In this case, the bottom load-bearing base and the bottom wall panel were cast together as one unit, while the top wall panel was cast separately. During the process of manufacturing the prefabricated components, steel reinforcement cages were placed into the molds, followed by the direct pouring of the concrete, as shown in Figure 3a,b. After fabricating all the prefabricated concrete components, they were cured at room temperature for 28 days. Subsequently, the assembly process began; the mortar was first poured at the keyway, and the assembly of the top and bottom wall panels was mainly reliant on the self-weight of the top wall panel for a tight and reliable connection, as shown in Figure 3c,d.

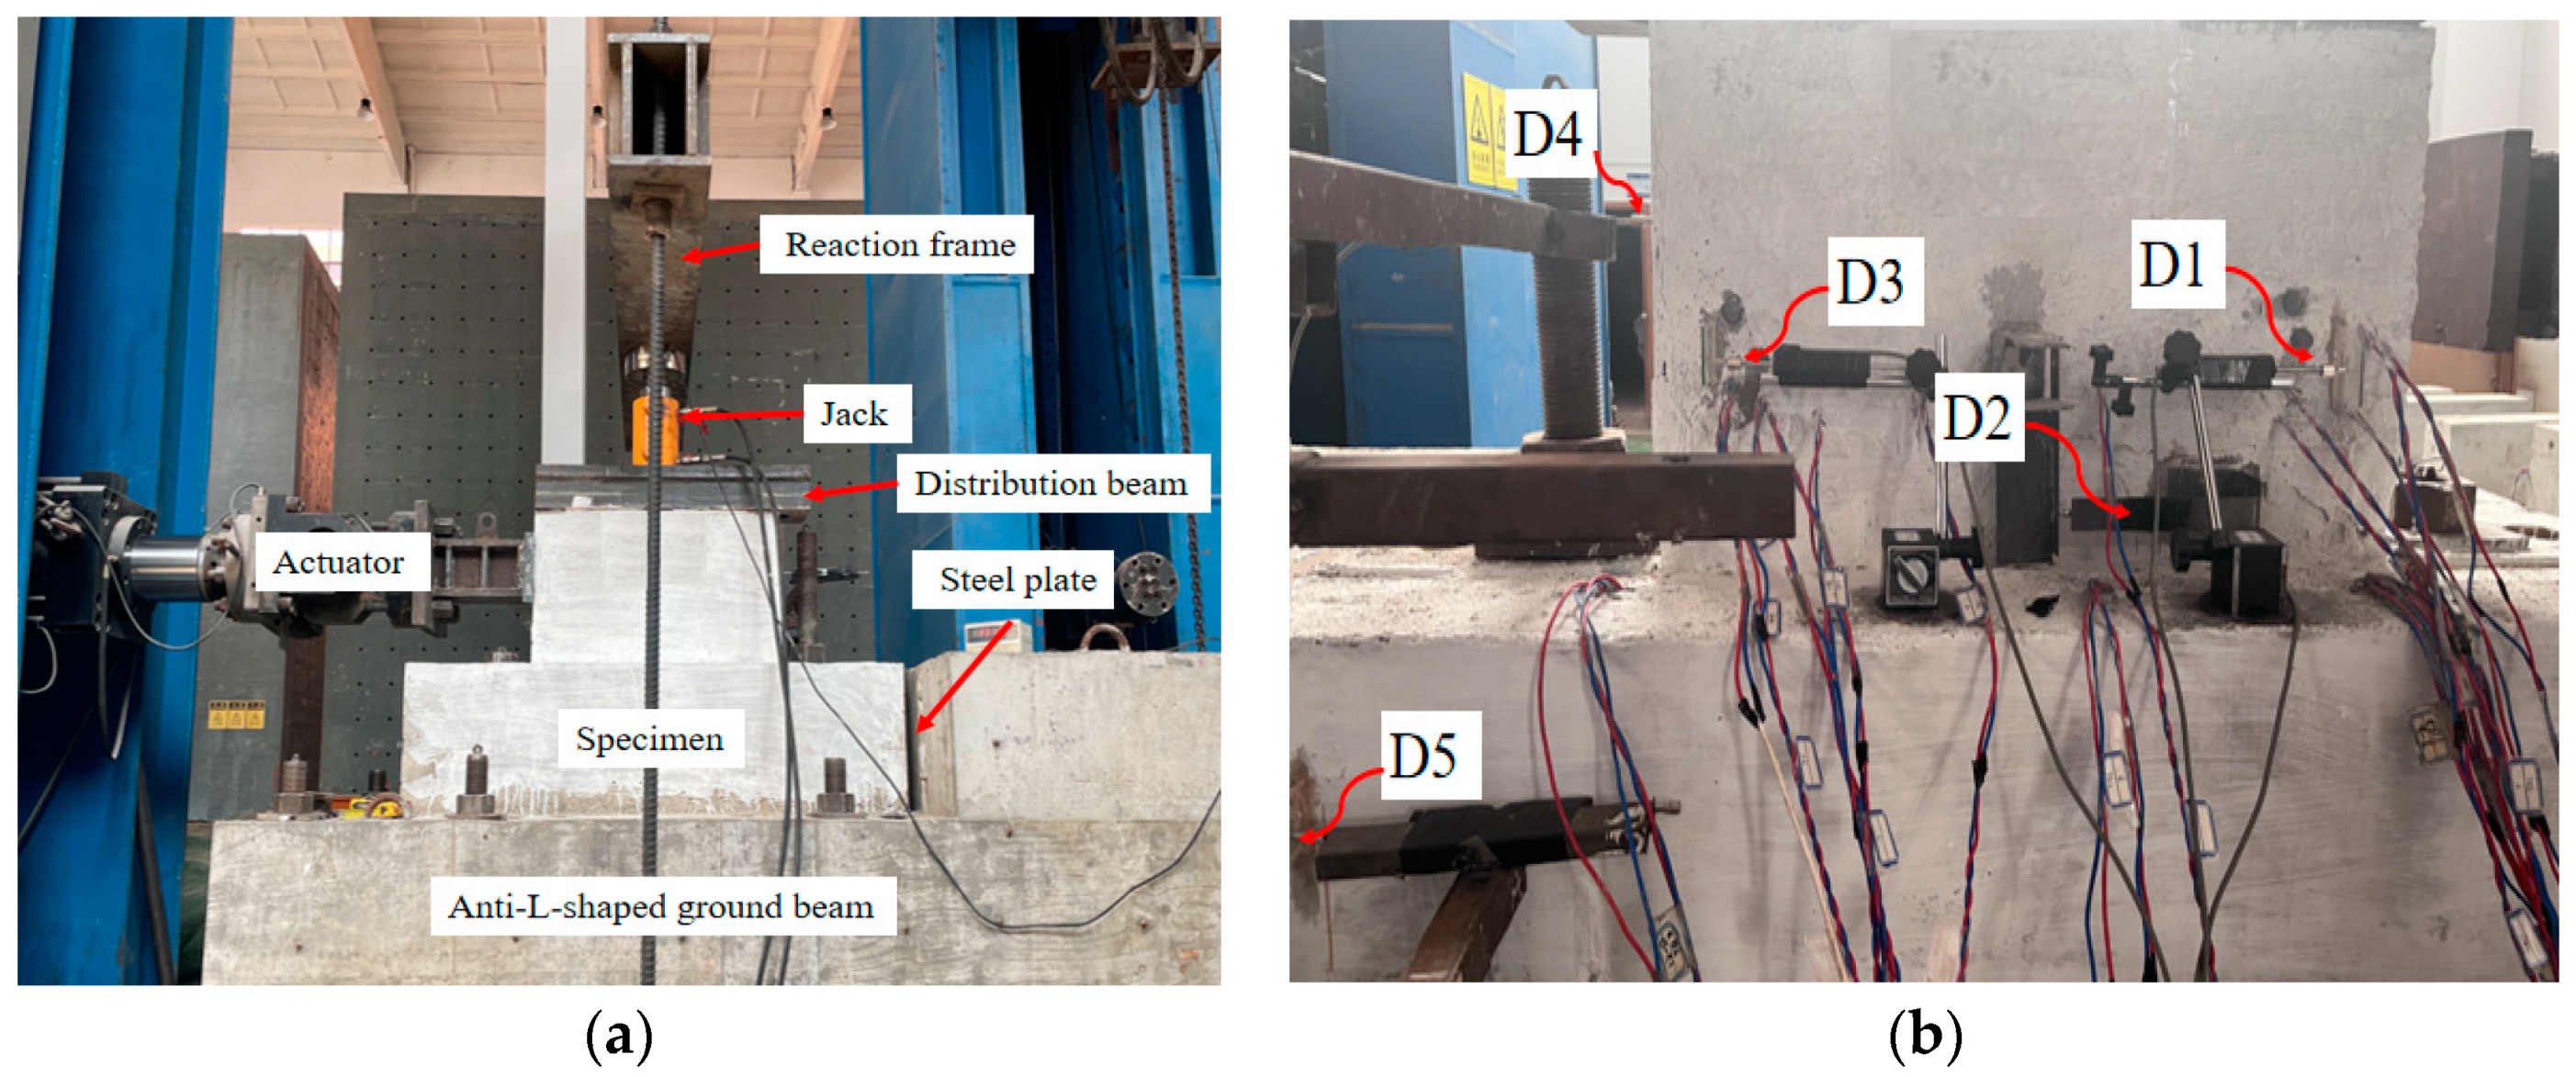
2.4. Test Setup and Measuring Instruments

The testing procedure for each specimen was conducted using a versatile structural testing system, as illustrated in Figure 4. The prefabricated concrete wall panel was securely anchored to the anti-L-shaped ground beam with high-strength bolts, and an additional steel plate was added on the right side to prevent any slippage of the bottom load-bearing base. Horizontal loads were applied by the left-side actuator. Meanwhile, vertical loads were applied through the reaction frame and hydraulic jacks, ensuring even distribution across the top surface of the wall panel by employing a distribution beam. It is crucial to maintain a constant axial load during tests. As a result, a force transducer, positioned between the reaction frame and the jack, monitored the axial force, as shown in Figure 4a. Furthermore, in order to further investigate the impact of keyway depth on the mechanical properties of longitudinal reinforcing bars located at the corners of the prefabricated concrete wall panel, strain gauges were symmetrically attached to the steel bars of both the top and bottom wall panels (Figure 2a). Figure 4b depicts the measurement of interface slippage for keyway joints, where a total of five displacement meters (labelled D1–D5) were arranged. In this case, D1, D2, and D3 were employed to measure the horizontal interface slippage. The calculation of slip involves taking the average of D1 and D3, and then comparing them with D2 to obtain their average value. In addition, D4 and D5 were used to monitor whether there was a corner for the prefabricated wall panels and the slippage of the base, respectively. D1, D2, and D3 were employed to measure the horizontal interface slippage.

2.5. Loading Method

The loading method for all specimens was determined based on the guidelines of JGJ/T101-2015 [44]. The procedure began with a preloading phrase, during which vertical loads were applied incrementally until the design value was attained. Subsequently, a unidirectional horizontal load was applied using a horizontal actuator that employed a force-displacement hybrid mechanism. The horizontal load was progressively increased in 30 kN increments until reaching 120 kN, and then loading continued with 10 kN increments. Displacement loading began either when the applied load reached 75% of the estimated shear capacity or minor cracks appeared at the horizontal joint. During displacement loading, the loading rate was maintained at 0.2 mm/min. Loading was maintained until no significant change in the horizontal force was observed or until the slippage of the horizontal interface between the top and bottom wall panels reached 8 mm. Once this occurred, the specimen was deemed to have failed, and the loading was terminated.

3. Experimental Results

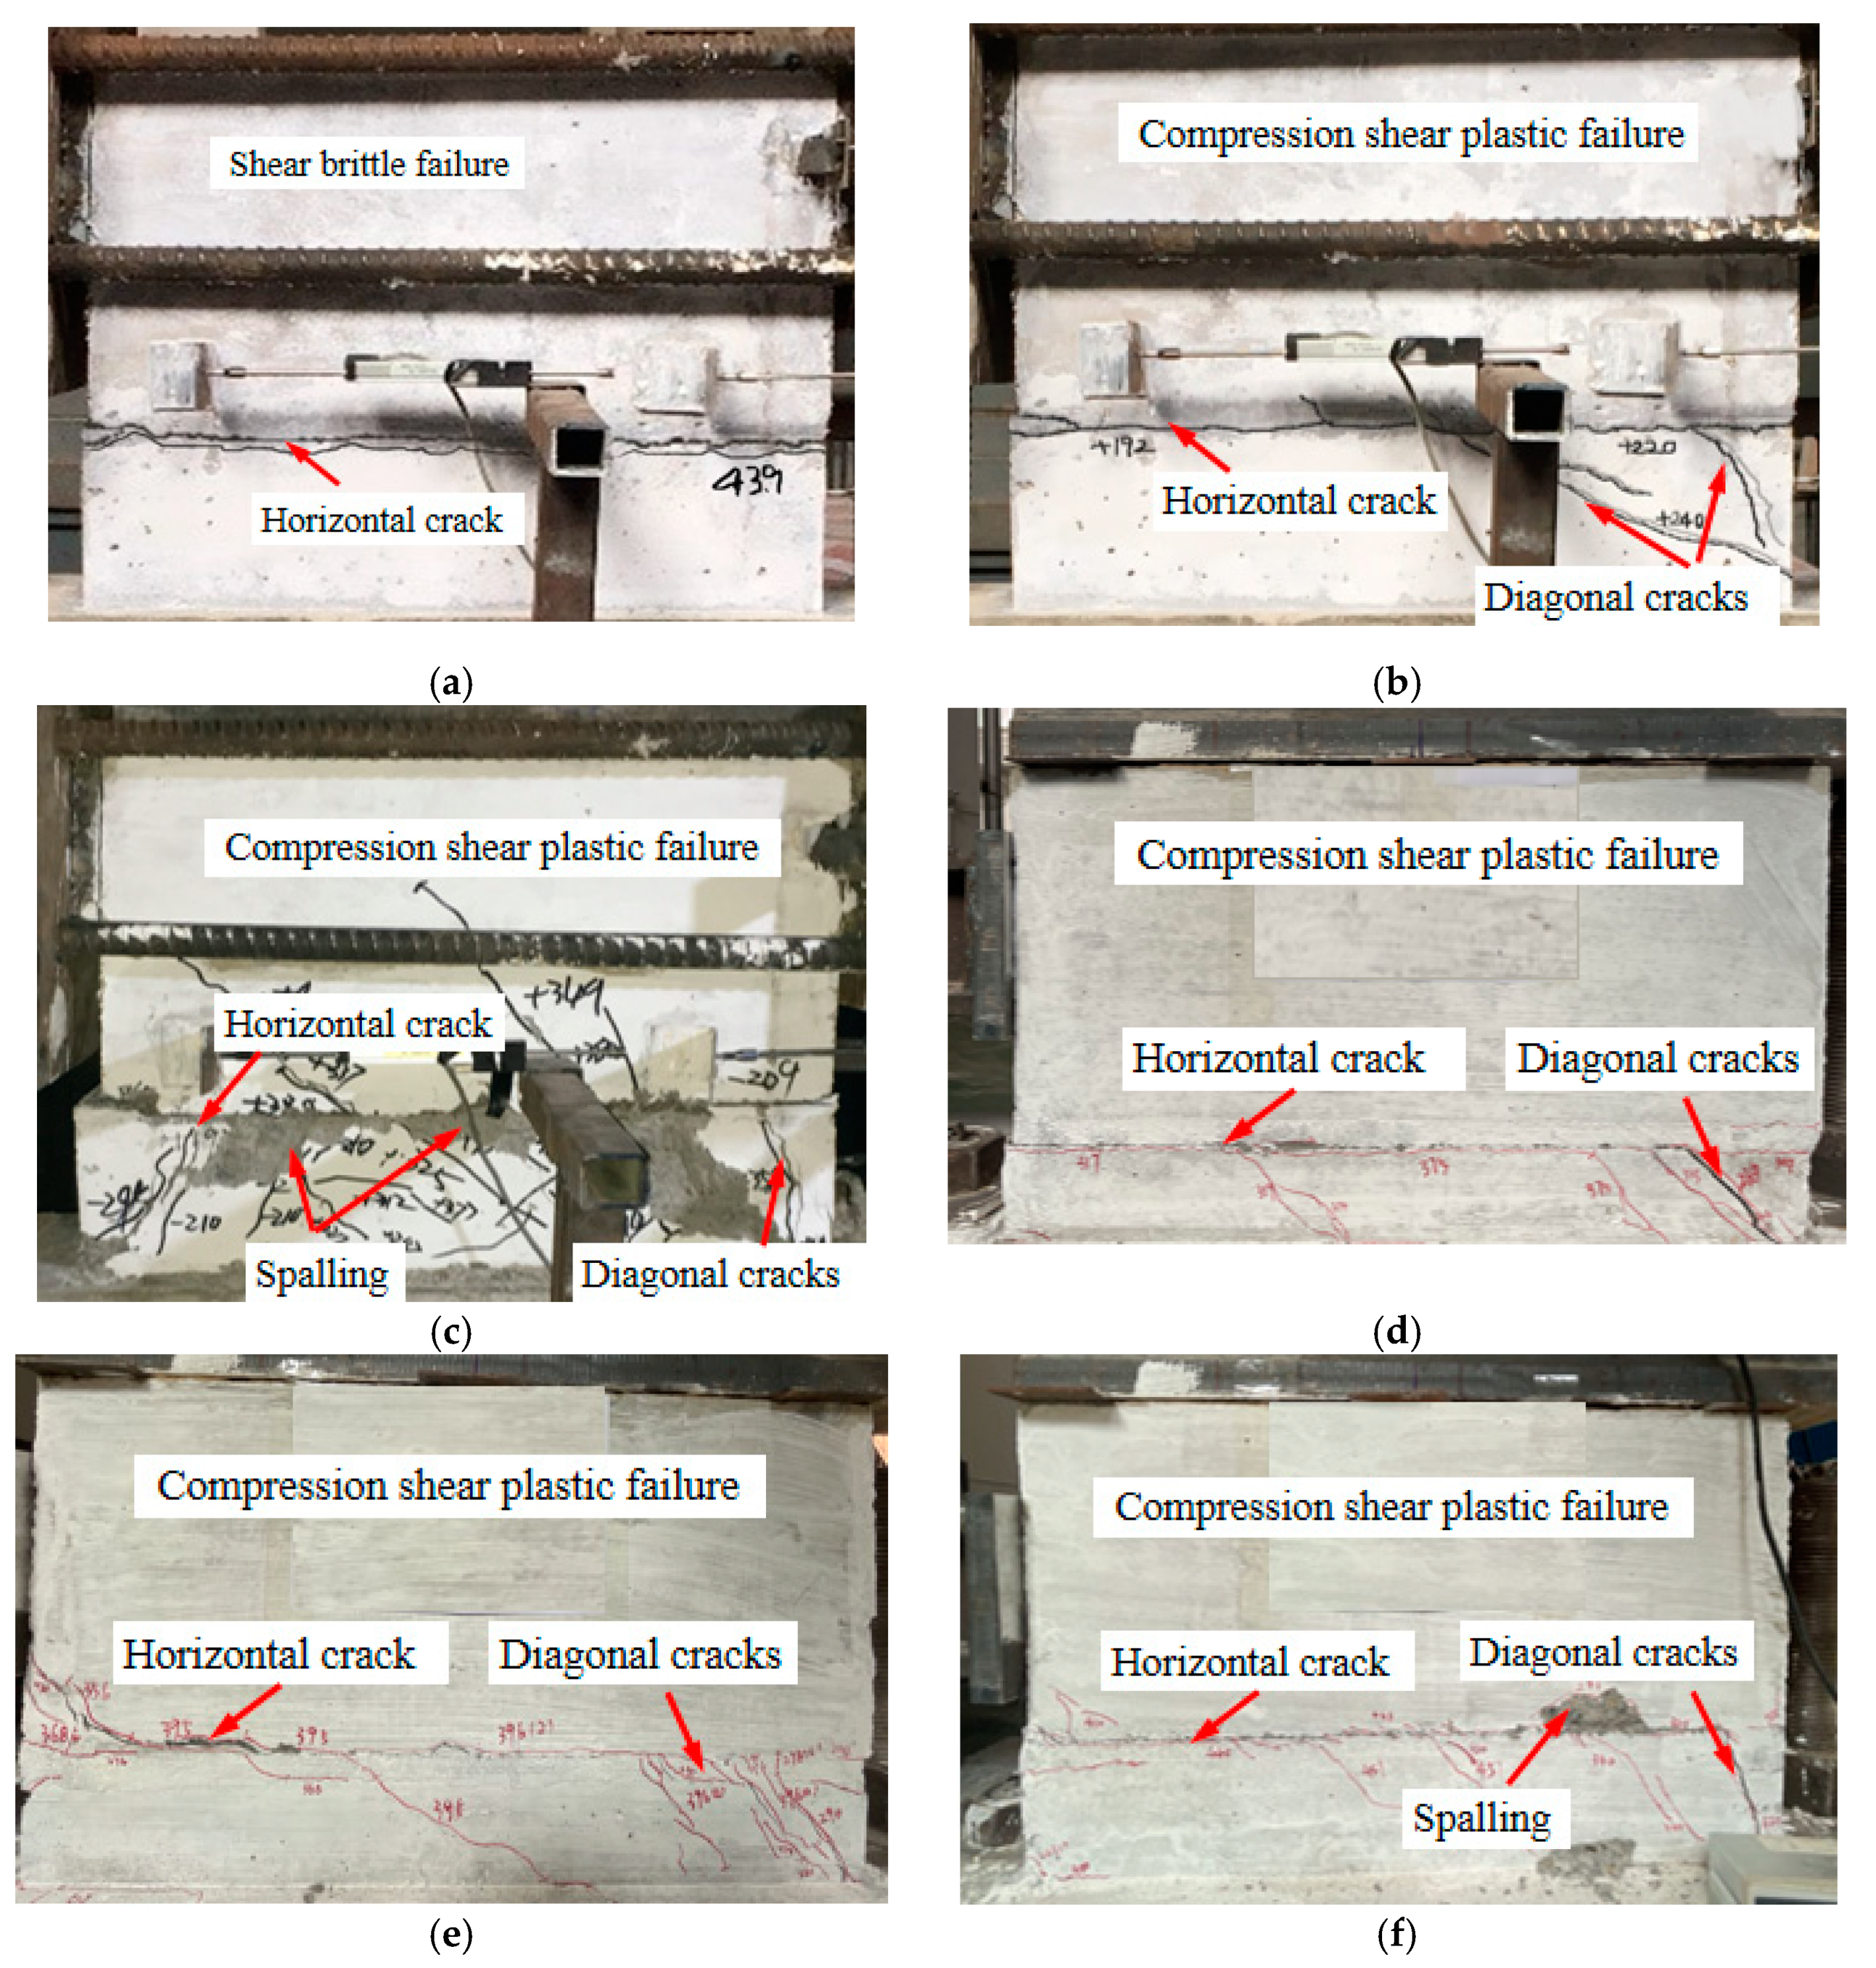
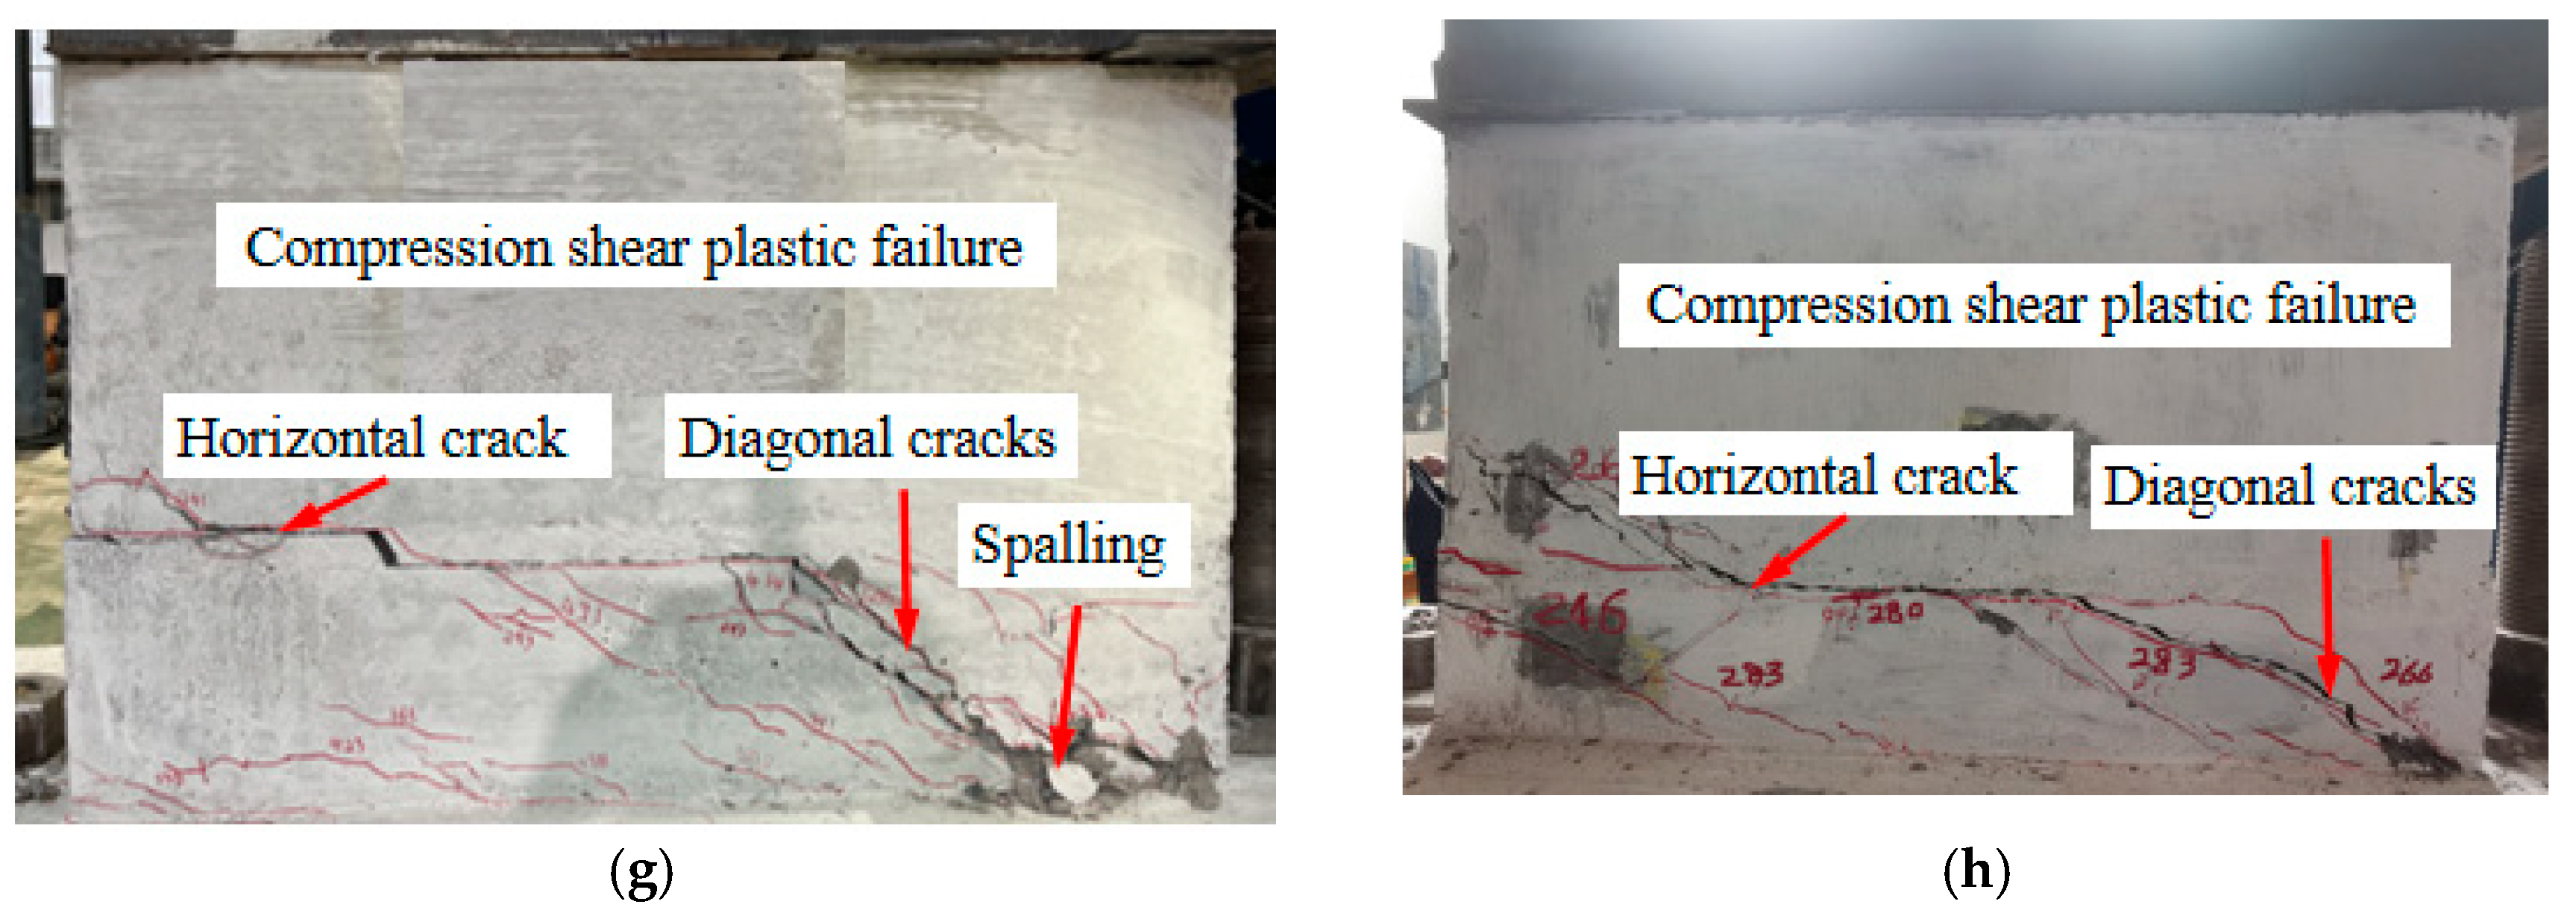
3.1. Experimental Observations

During monotonic horizontal loading, all keyway joints experienced cracking, subsequent crack propagation, and interface sliding stages. Figure 5 illustrates the failure modes and crack distributions in the keyway joints. It can be observed that the failure modes of all keyway joints exhibit consistent properties. They all manifest with initial cracking propagating along the keyway joint, and some of these cracks diagonally extend downward in the bottom wall panels. Eventually, pronounced sliding and localized concrete crushing were evident in the bottom wall panels.
The specimens KTAF-1, KTAF-2, KTAF-3 had cracking loads of 30.4 kN, 192 kN, and 256 kN, respectively. Conversely, the loads for KTKD-1 through KTKD-5 were 357 kN, 351 kN, 386 kN, 416 kN, and 212 kN, in that order. It can be observed that the cracking loads of the keyway joint significantly increased with the increase in the axial force and the interface mortar strength, whereas they showed only a slight increase as the keyway depth increased. This phenomenon can be attributed to the fact that the increased vertical axial force enhances the normal compressive stress at the interface. The complete hydration reaction of high-strength mortar provides a stronger mechanical interlocking force at the wall panel and mortar interface, effectively increasing the interfacial shear stress and requiring a larger load for crack initiation. As the keyway depth increased, the contact area between the wall panel interface and mortar slightly increased, leading to a slight rise in the interfacial shear stress, delaying the initiation of joint cracking.
As shown in Figure 5a–c, a comparison of specimens KTAF-1, KTAF-2, and KTAF-3 revealed that the axial compression ratio significantly affects the failure modes of the keyway joint for prefabricated concrete wall panels. It can be clearly seen from KTAF-2 and KTAF-3 that the crack initially appeared on the loading side of the keyway joints, coupled with diagonal cracks extending to the bottom wall panel. Increasing the axial compression ratio leads to denser crack distribution and localized concrete spalling, exhibiting a compression–shear plastic failure. In contrast, in KTAF-1, with an axial compression ratio of 0, the crack initially appeared on the loading side of the keyway joints and then rapidly penetrated and failed, resulting in a shear brittle failure.
Upon examining KTKD-1 through KTKD-5, as shown in Figure 5d–h, it can be determined that cracks initiate from the keyway joint, followed by the formation of 45° downward diagonal cracks in the bottom wall panel, exhibiting a compression–shear failure mode. However, as the keyway depth increased, the crack distribution became denser, leading to squeezing at the corners of the wall panel. Specimens KTKD-3 and KTKD-5 were characterized by varying interface mortar strengths. A comparative analysis showed that a decrease in the interface mortar strength led to reduced crack propagation, resulting in more rapid failures.

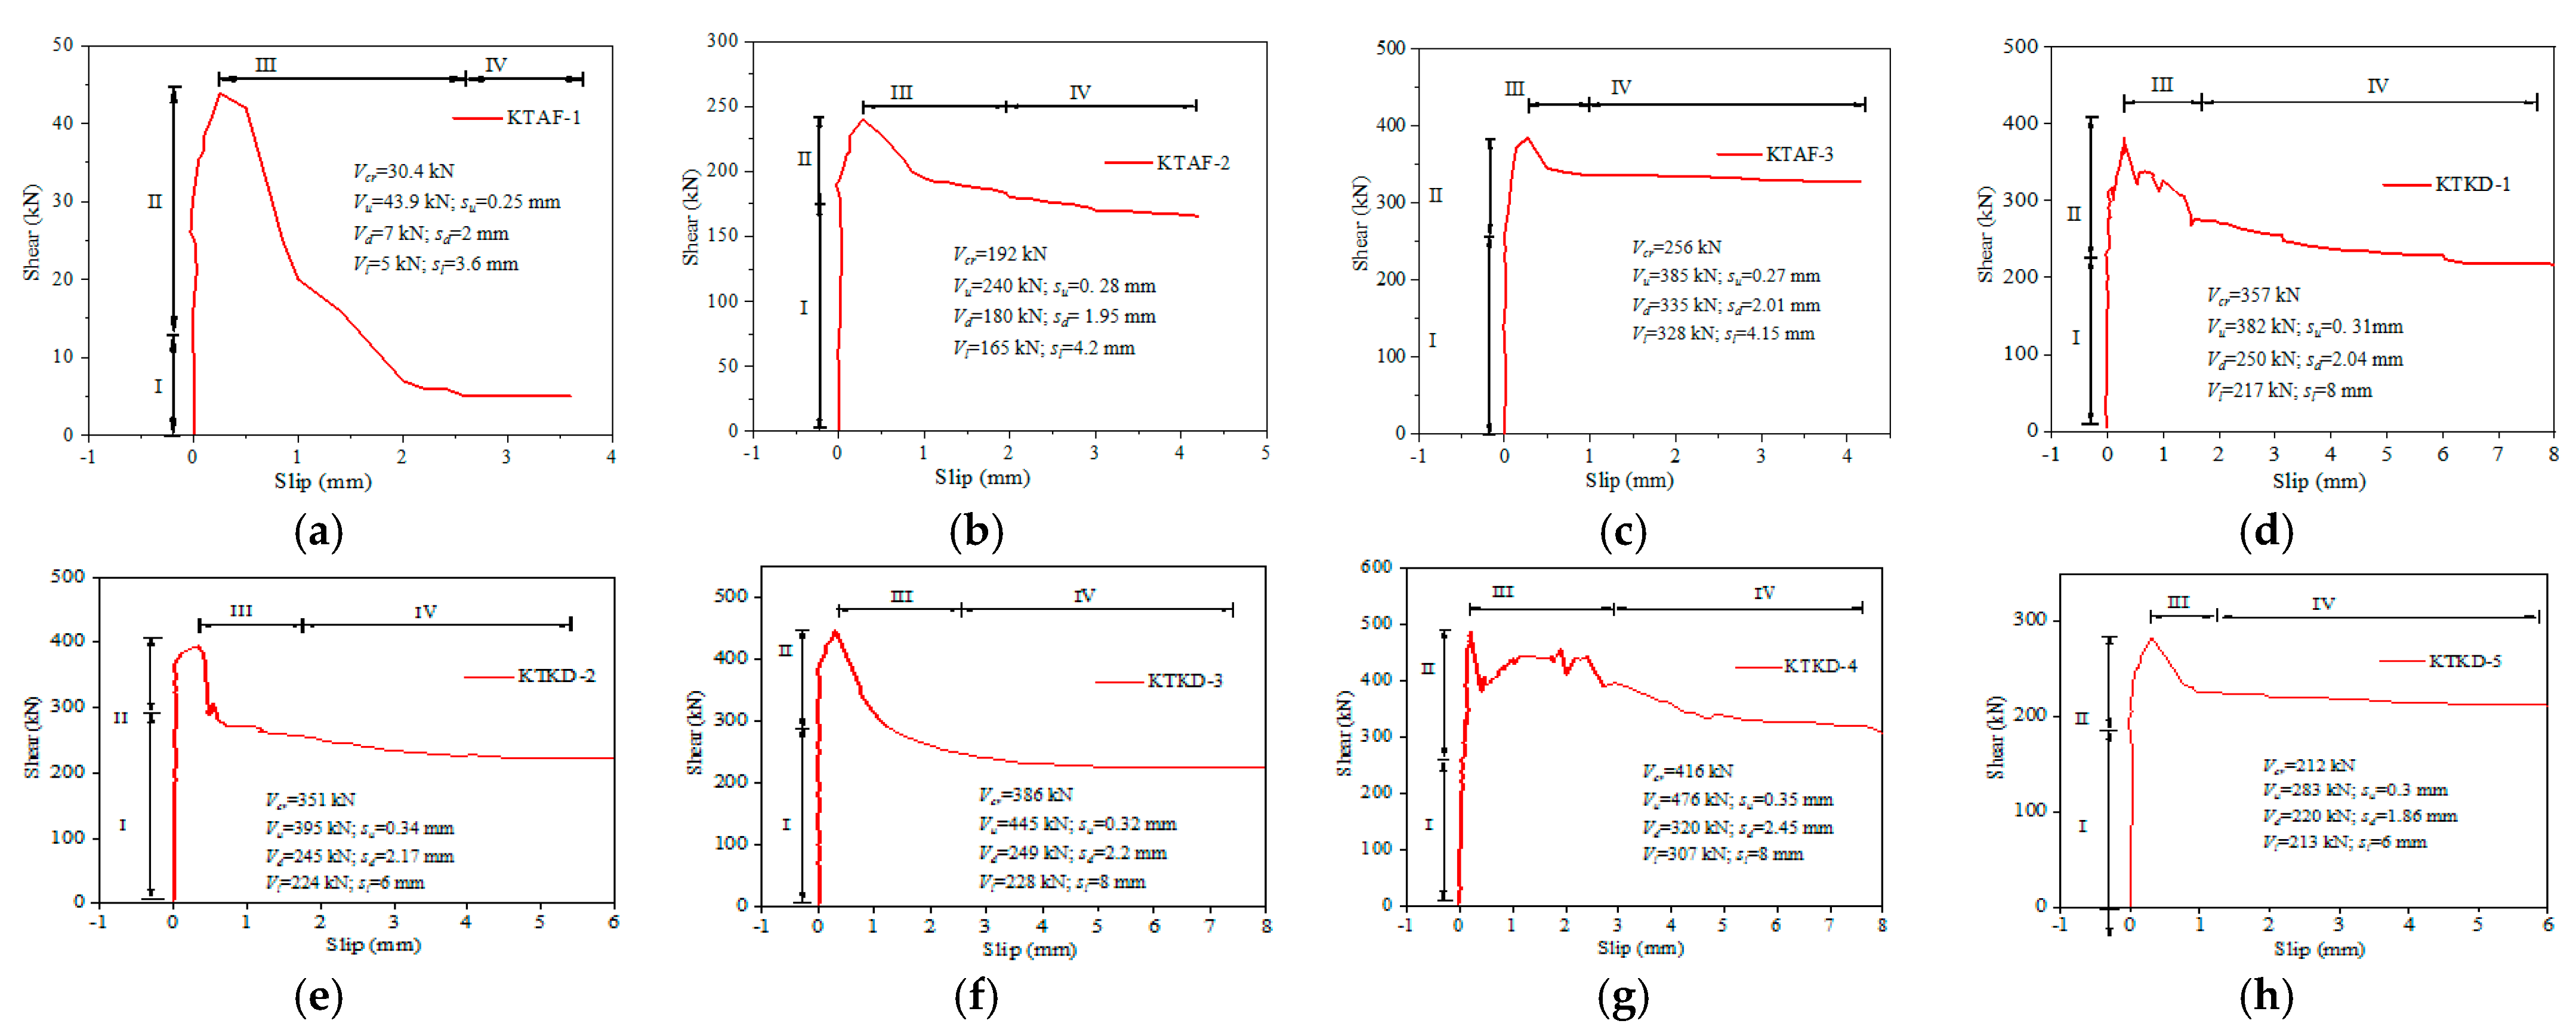
3.2. Shear–Slip Curves

Figure 6 shows the shear–slip curves of the keyway joints for all specimens, exhibiting consistent trends under monotonic loading. Meanwhile, the characteristic points for each stage of the keyway joint and their corresponding loads and slip values were shown in Figure 6. Vcr represents the cracking load, with a corresponding slip of 0. Vu, Vd and Vl represent the peak load, sudden drop load, and residual load, respectively, and Su, Sd, and Sl represent their corresponding slip values. According to the failure mode of the specimens, the shear–slip curves of the keyway joints can be divided into four stages: linear elasticity (I), elastic–plastic deformation (II), strength degradation (III), and failure (IV). Initially, the keyway joint demonstrated a linear elastic response, with the load increasing linearly (Stage I). As loading persisted, the keyway joint entered the elastic–plastic deformation stage, accompanied by the appearance of cracks in the keyway joint, and shear and slip also increased accordingly (Stage II). Upon reaching the peak load, the slip rapidly increased, whereas the shear force experienced a sudden drop (Stage III), indicating the onset of the strength degradation stage. Ultimately, the keyway joint failed (Stage IV), resulting in the slip and misalignment of the interface between the top and bottom wall panels.
Table 2 lists the ratio of forces in each stage. Figure 6 and Table 2 show that the average ratio of the cracking load to the peak load for all specimens was 0.8075, and the sudden drop load was close to the residual load. Additionally, compared to KTAF-1, the peak load of specimens KTAF-2 and KTAF-3 increased by 5.5 and 8.8 times, respectively, and the peak load and residual load drastically increased with the increase in the axial compression ratio (Figure 6a–c). This observation indicates that increasing the axial compression ratio can significantly improve the shear performance of the keyway joint.
Figure 6d–g shows the load–slip curves of the keyway joint for specimens KTKD-1, KTKD-2, KTKD-3, and KTKD-4. Compared to specimen KTKD-1, the peak loads for specimens KTKD-2, KTKD-3, and KTKD-4 increased by 3.7%, 16.5%, and 24.6%, respectively, whereas their residual loads remained similar. This indicates that increasing the keyway depth significantly affected the peak load of specimens but exerted minimal impact on the residual load. This is because the interface contact area increased with the increase in the keyway depth, which enhanced the adhesive locking effect in the keyway joint. Thus, increasing the keyway depth has a significant impact on the peak load of the specimen. After the interface of the keyway joint underwent slip failure, the adhesive locking effect became ineffective, and the shear performance was mainly provided by normal compressive stress, resulting in similar residual loads.
Figure 6f,h also compares the shear–slip curves between specimens KTKD-3 and KTKD-5. Compared to specimen KTKD-5, the peak load of KTKD-3 increased by 57.2%, and its descending load trend was more gradual. This is because the connection performance of the keyway joint predominantly relies on the interaction between the mortar and the wall panel interface. High-strength mortar, characterized by its high strength and low shrinkage, can densely fill the surface gaps of the wall panel interface. This action strengthened the bond performance between the wall panel interface and the mortar, thereby enhancing the shear strength of the keyway joint, leading to the obvious increase in the peak load for KTKD-3. This indicates that the utilization of high-strength mortar not only significantly enhances the shear performance of the keyway joint but also retards load reduction, demonstrating a more favorable plastic deformation trend.

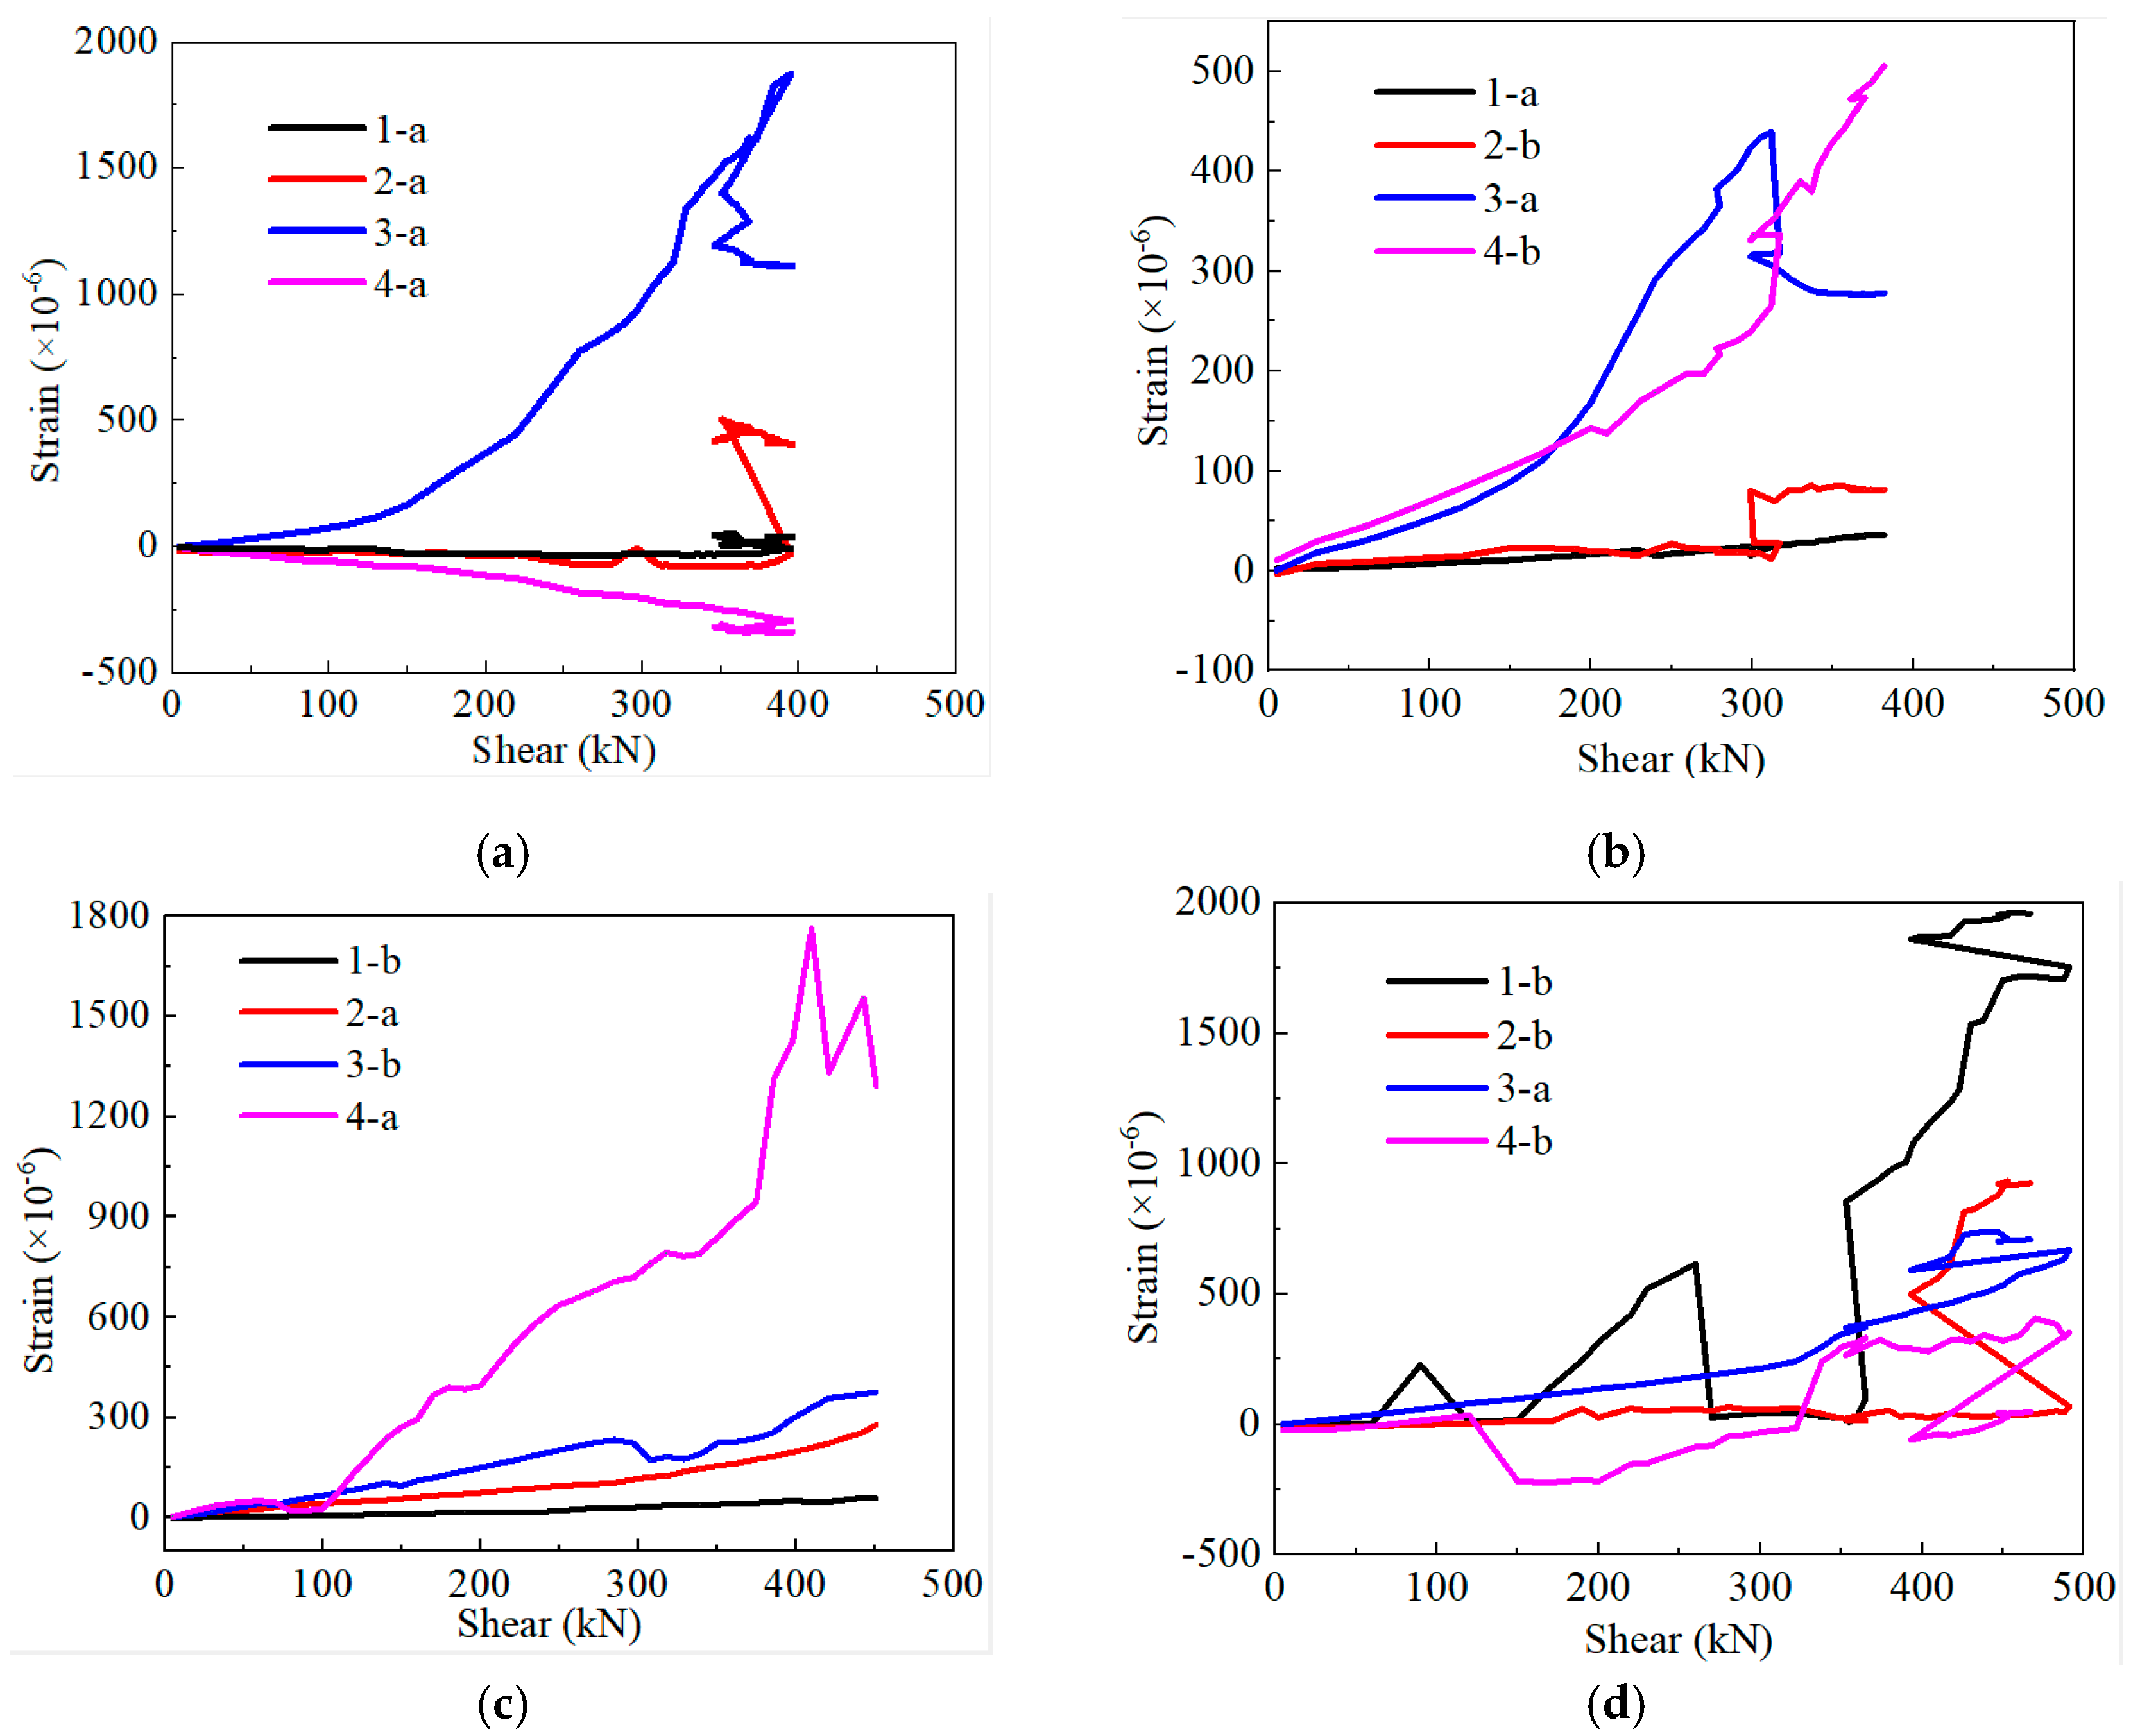
3.3. Strain Analysis of Steel Bars

The shear–strain envelope curves of longitudinal steel bars for specimens KTKD-1 to KTKD-4 under monotonic loads are depicted in Figure 7, and the layout of strain gauges is shown in Figure 2. In specimen KTKD-1, the variation in steel bar strain was relatively low, primarily remaining within the elastic stage (Figure 7a). This can be attributed to the straight joint connection between the top and bottom wall panels. Under monotonic loading, the wall panel experienced shear brittle failure along the straight joint, resulting in limited plastic deformation, thus keeping the steel bar primarily within the elastic range. In contrast, the steel bar strain values in specimens KTKD-2, KTKD-3, and KTKD-4 were significantly greater than those in KTKD-1, as shown in Figure 7b–d. This difference can be attributed to the enhanced depth of the keyway joint, resulting in a distinct compressive–shear plastic failure mode in the wall panels. As a result, the steel bars experienced more substantial loading, leading to a noticeable increase in the steel bar strain values.

4. Numerical Simulations

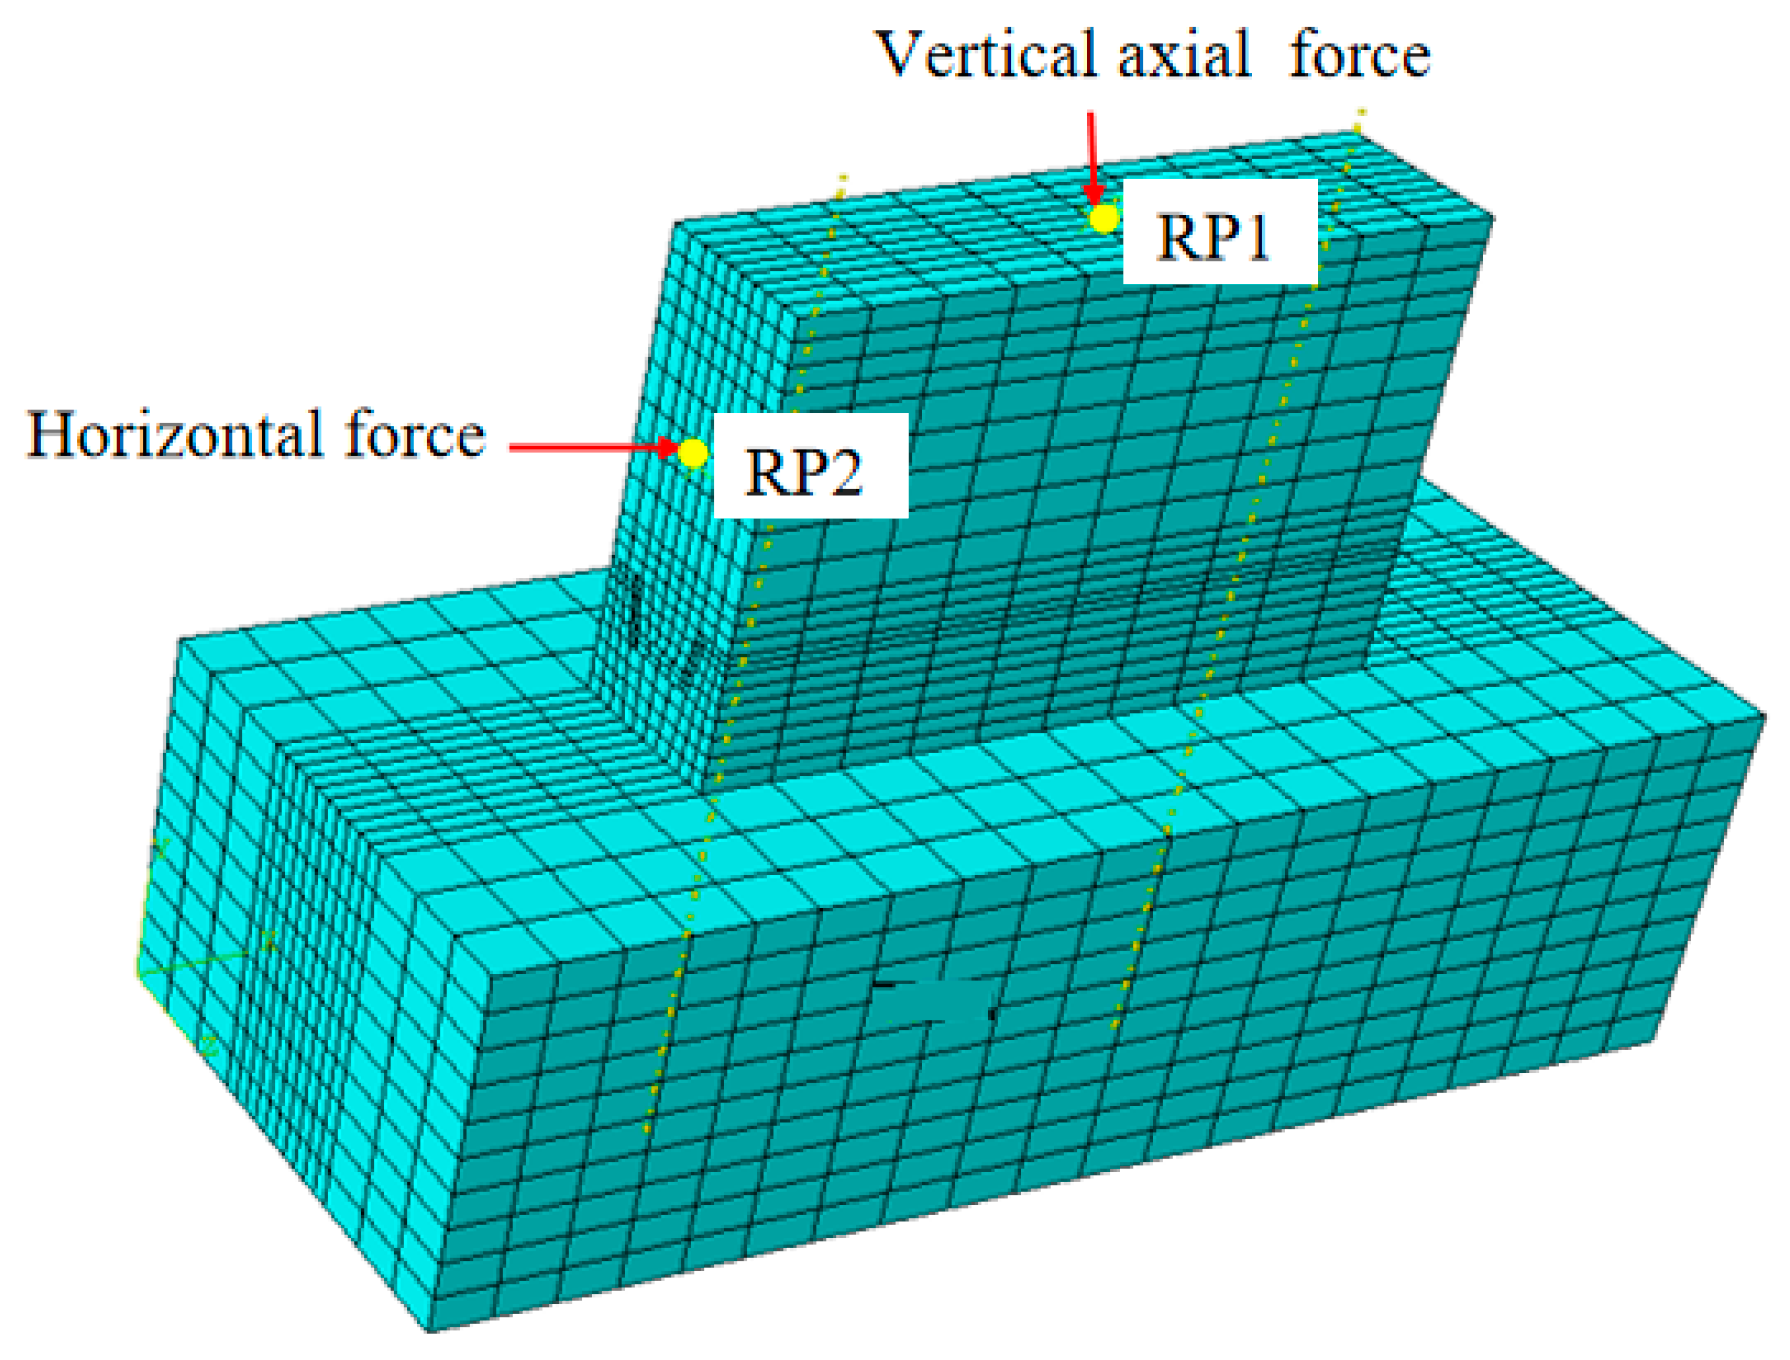
4.1. Finite Element Model

The finite element analysis model of prefabricated concrete wall panels with keyway joints was developed using ABAQUS 6.14 software, incorporating both C3D8R three-dimensional solid elements and T3D2 truss elements to represent concrete and steel bars, as shown in Figure 8. Structured meshing techniques in ABAQUS were applied to create the mesh, ensuring that grid nodes were shared at the joint interfaces. Consequently, the mesh size for the keyway was chosen to be 30 mm, whereas the mesh dimensions for the concrete and steel bars were 80 mm.

4.2. Material Constitutive and Contact Behavior

The concrete material was simulated using the concrete damage plastic model, which followed the stress–strain constitutive relationship for concrete as specified in the “Code for the Design of Concrete Structures” [45]; the stress–strain curve is shown in Figure 9a. The concrete damage plastic model accounts for material nonlinearity, stiffness degradation, and the influence of the strain rate on material properties. This model is integrated with fracture energy considerations to guarantee results that are not dependent on the mesh size. For more details, see [46,47,48,49]. In addition, the elastic modulus, Poisson’s ratio, and the density of the concrete were 3 × 10⁴ N/mm2, 0.2 and 2.4 × 10³ kg/m3, respectively.
Plastic damage factors were determined based on the principle of energy equivalence. The steel bar was represented using a bilinear elastic-strengthening model, and the stress–strain curve was approximated as a linear line after yielding (Figure 9b). For more details on the material properties of the steel bar and concrete, refer to Section 2.1.
The contact between the keyway mortar joint and the top and bottom wall panels was modeled as face-to-face contact behavior. Specifically, the interface was defined as “hard contact” in the normal direction (-n direction) and utilized a combination of “surface-based cohesive behavior” and the Coulomb friction model in the tangential direction (+n, ±s, and ±t directions). During the initial stages of loading when the forces were relatively small and had not caused any damage, the interface maintained adhesive contact. At this point, the adhesive contact model was employed to resist shear forces. However, once damage occurred, the stiffness of the interface decreased, and the Coulomb friction model was introduced. Subsequently, both the adhesive contact model and the Coulomb friction model worked together to resist shear forces. As the adhesive stiffness gradually diminished and became inactive, the interface transitioned from finite sliding to small sliding, at which stage only Coulomb friction was utilized to resist interface sliding. According to the horizontal joint shear values in the design specifications for concrete structures, the friction coefficient is typically taken as 0.8 [45].
The interface model in this study employed traction–separation behavior within ABAQUS to describe the relationship between interface stress and relative displacement. This behavior was characterized using a bilinear model, representing both the linear elastic ascending segment and the damage softening segment as straight lines, as shown in Figure 10. To comply with the requirements for setting parameters related to face-to-face contact adhesive behavior in ABAQUS, certain values needed to be provided, including the contact adhesive stiffness (Knn, (ss, tt)), the maximum initial stress (σnn, (ss, tt)), and the fracture energy (Gc). To simplify the calculations and ensure result convergence, the maximum initial stress and stiffness were set to be the same for both the normal and tangential directions. However, the normal direction was configured to soften more rapidly, with the fracture energy in the normal direction being one-tenth of that in the tangential direction. The maximum initial stress was determined as the tensile strength of the material, using the smaller value between the mortar and concrete. The stiffness and fracture energy were calculated using Formulas (1) and (2). For the elastic phase, the maximum displacement (dcr) was set to 0.3 mm based on experimental data, while the ultimate displacement (du) was set to 6 mm. The values for the contact interface parameters are provided in Table 3.
E = σ c r d c r
G c = σ c r × d u 2

4.3. Boundary Conditions and Loading Methods
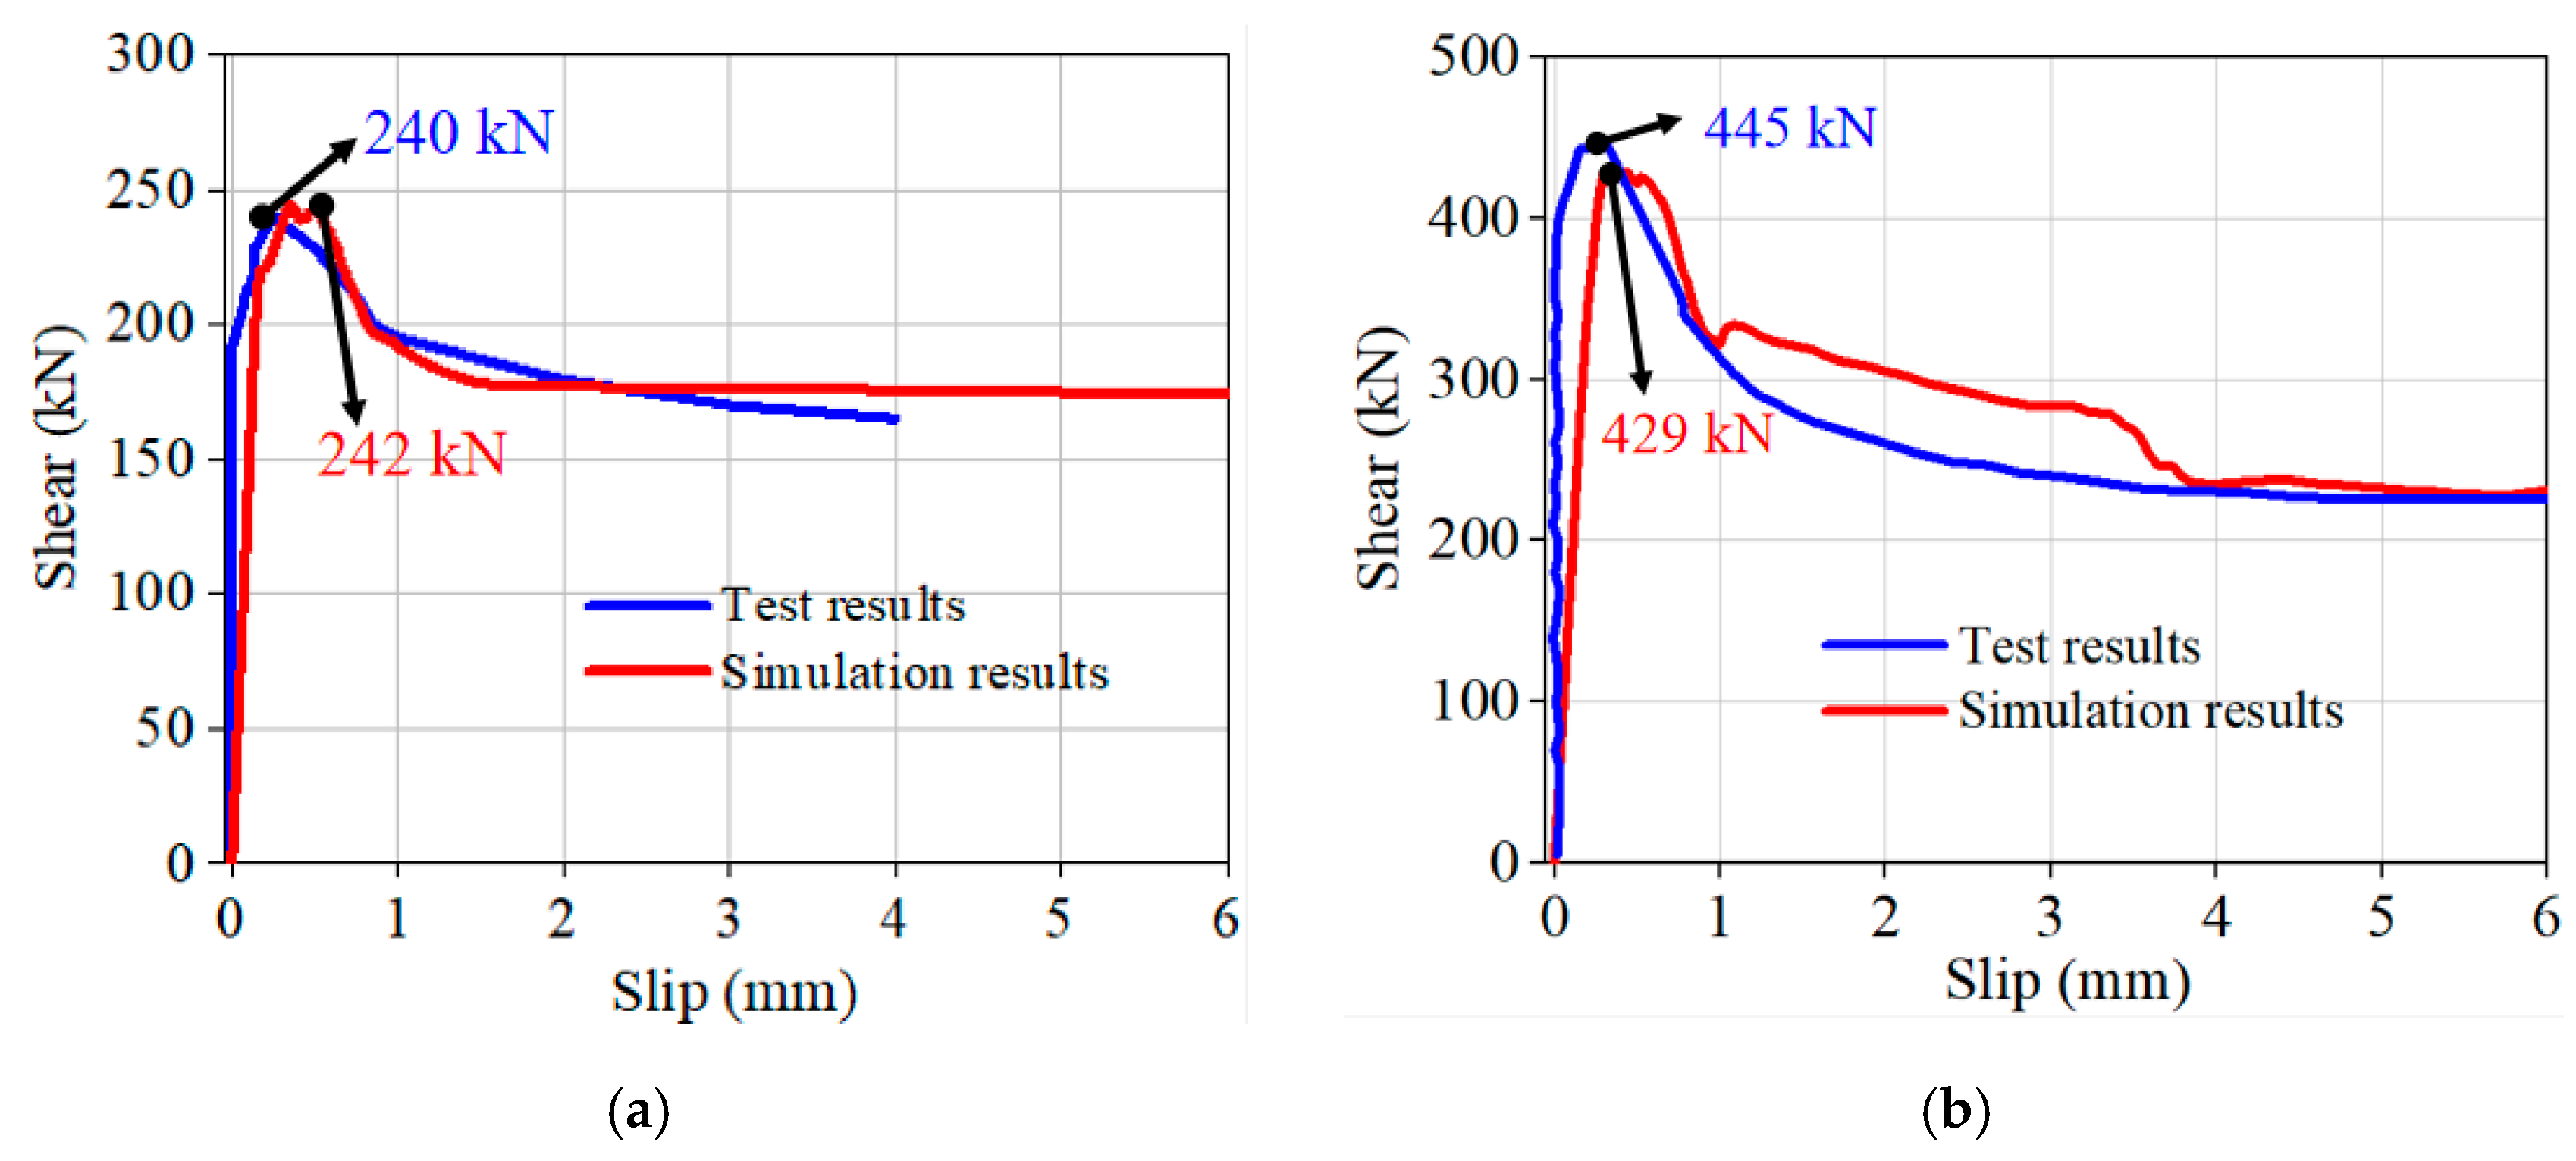
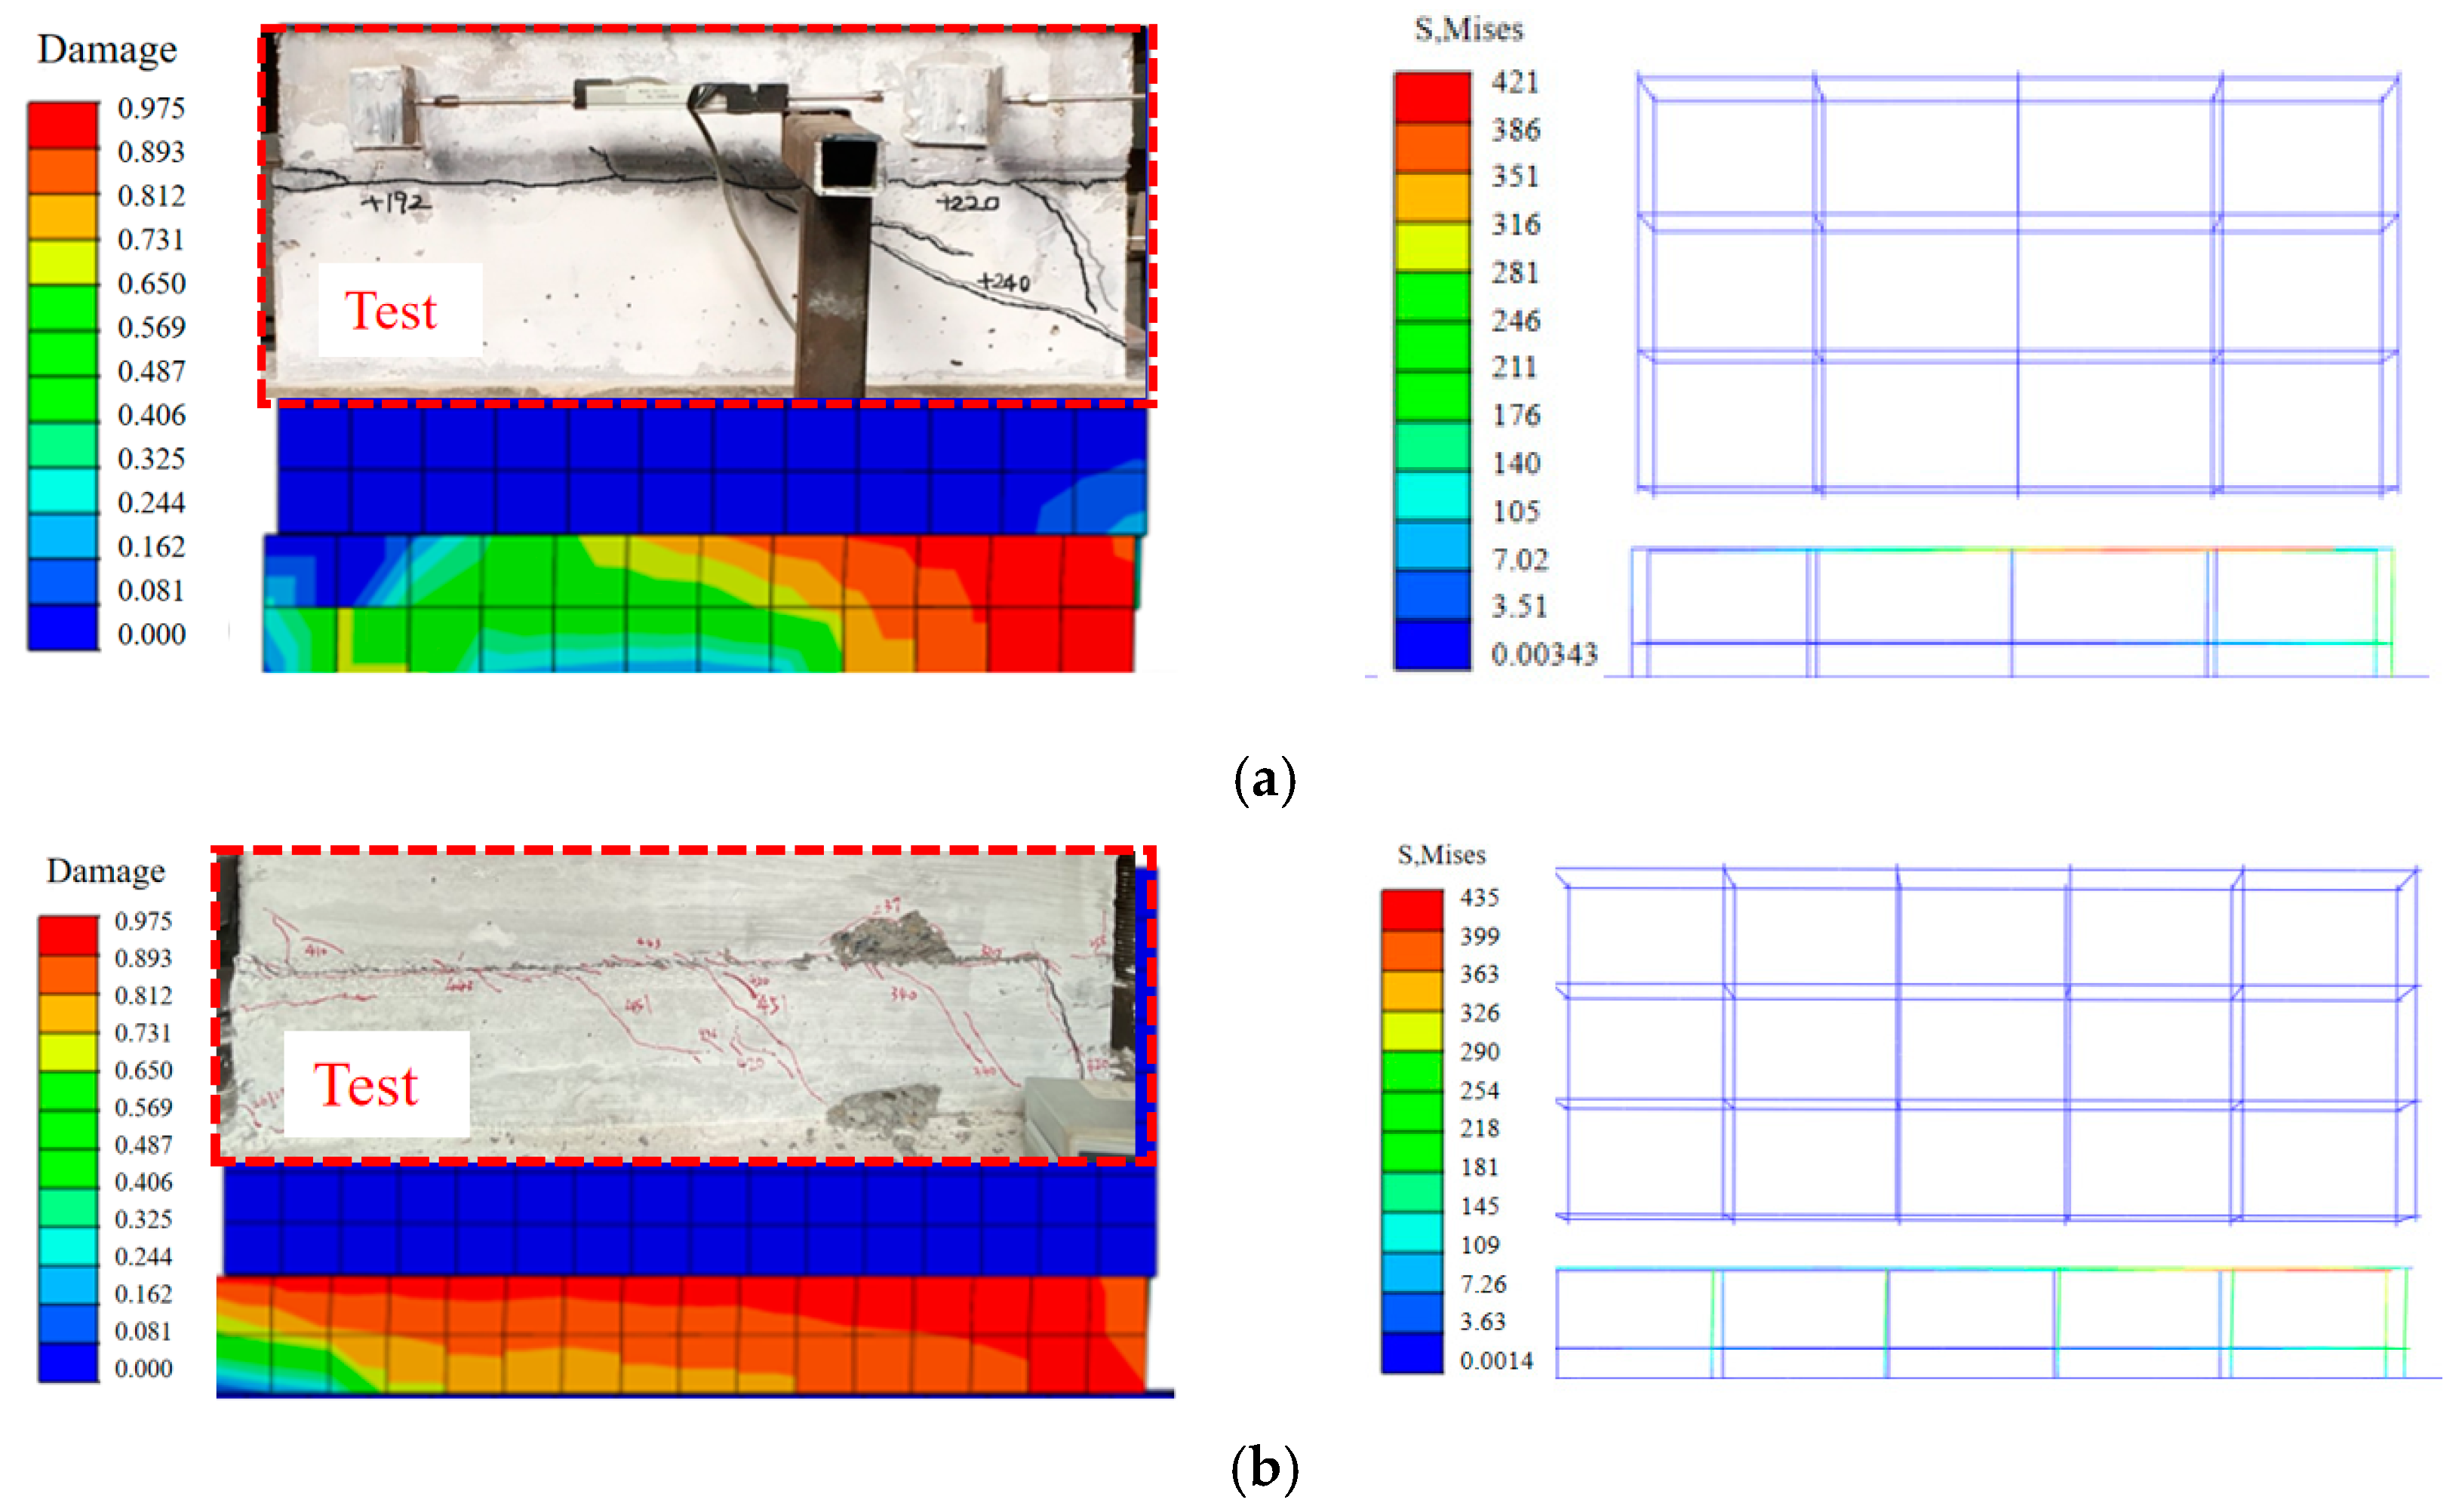
The boundary conditions and loading methods of the finite element model were consistent with the experimental setup. To simulate the anchoring relationship between the bottom load-bearing bases and the ground, a fixed connection was employed for the bottom surface of bottom load-bearing base. A reference point was positioned at the center of the top surface of the wall-panel and coupled with the upper surface to apply a vertical axial force. Additionally, an additional reference point was established at the center of the height range 200 mm above the keyway joint, and its translations in the Y and Z axes, as well as rotations about the X and Y axes, were constrained and then coupled with the loading surface. Eventually, a horizontal load was applied at the reference point.
In ABAQUS, the loading methods for the specimen were divided into two steps: Step 1 involved the application of a vertical axial force at the reference point on the top surface of the wall panel to simulate the vertical axial force in the experiment. Step 2 was performed after the vertical axial force was completed, where horizontal displacement was input in the X direction at the coupled reference point to replicate horizontal loading (Figure 11).

4.4. Validation

By simulating specimens KTAF-2 and KTKD-3, the shear–slip curves and failure modes were obtained, as shown in Figure 12 and Figure 13. It can be observed (Figure 12) that the curve trends in the simulation results closely matched the experimental results, with the peak load and residual load values having errors within 10%. Comparing the experimental and simulation results, it was found that the initial stiffness of the simulation results was relatively low, and the slip at peak load was slightly greater than the experimental values. This discrepancy is attributed to the initial stiffness of the adhesive behavior being defined with finite values rather than infinity in the simulation. Additionally, it is challenging for finite element analysis to capture the discreteness and the initial defects of concrete, which led to the residual load in the experiments being smaller than the simulated results.
It is evident from KTAF-2 and KTKD-3 that significant concrete damage occurred primarily at the keyway joint and the ends of the bottom wall panels, which was consistent with the experimental observations (Figure 12c and Figure 13a). In Figure 12d and Figure 13b, the horizontal and longitudinal distribution of steel stress in the bottom wall panel was locally close to yielding, which is consistent with the steel strain of the experimental results. Overall, the finite element results can effectively reproduce the experimental results, verifying the accuracy of the finite element model.

5. Parameter Analysis

In this section, the influence of various key parameters on the shear performance of innovative keyway joints for prefabricated concrete wall panels are discussed and analyzed. The systematic parameter analysis includes the axial compression ratio, the keyway depth, and the inclination angles in the keyway joint.

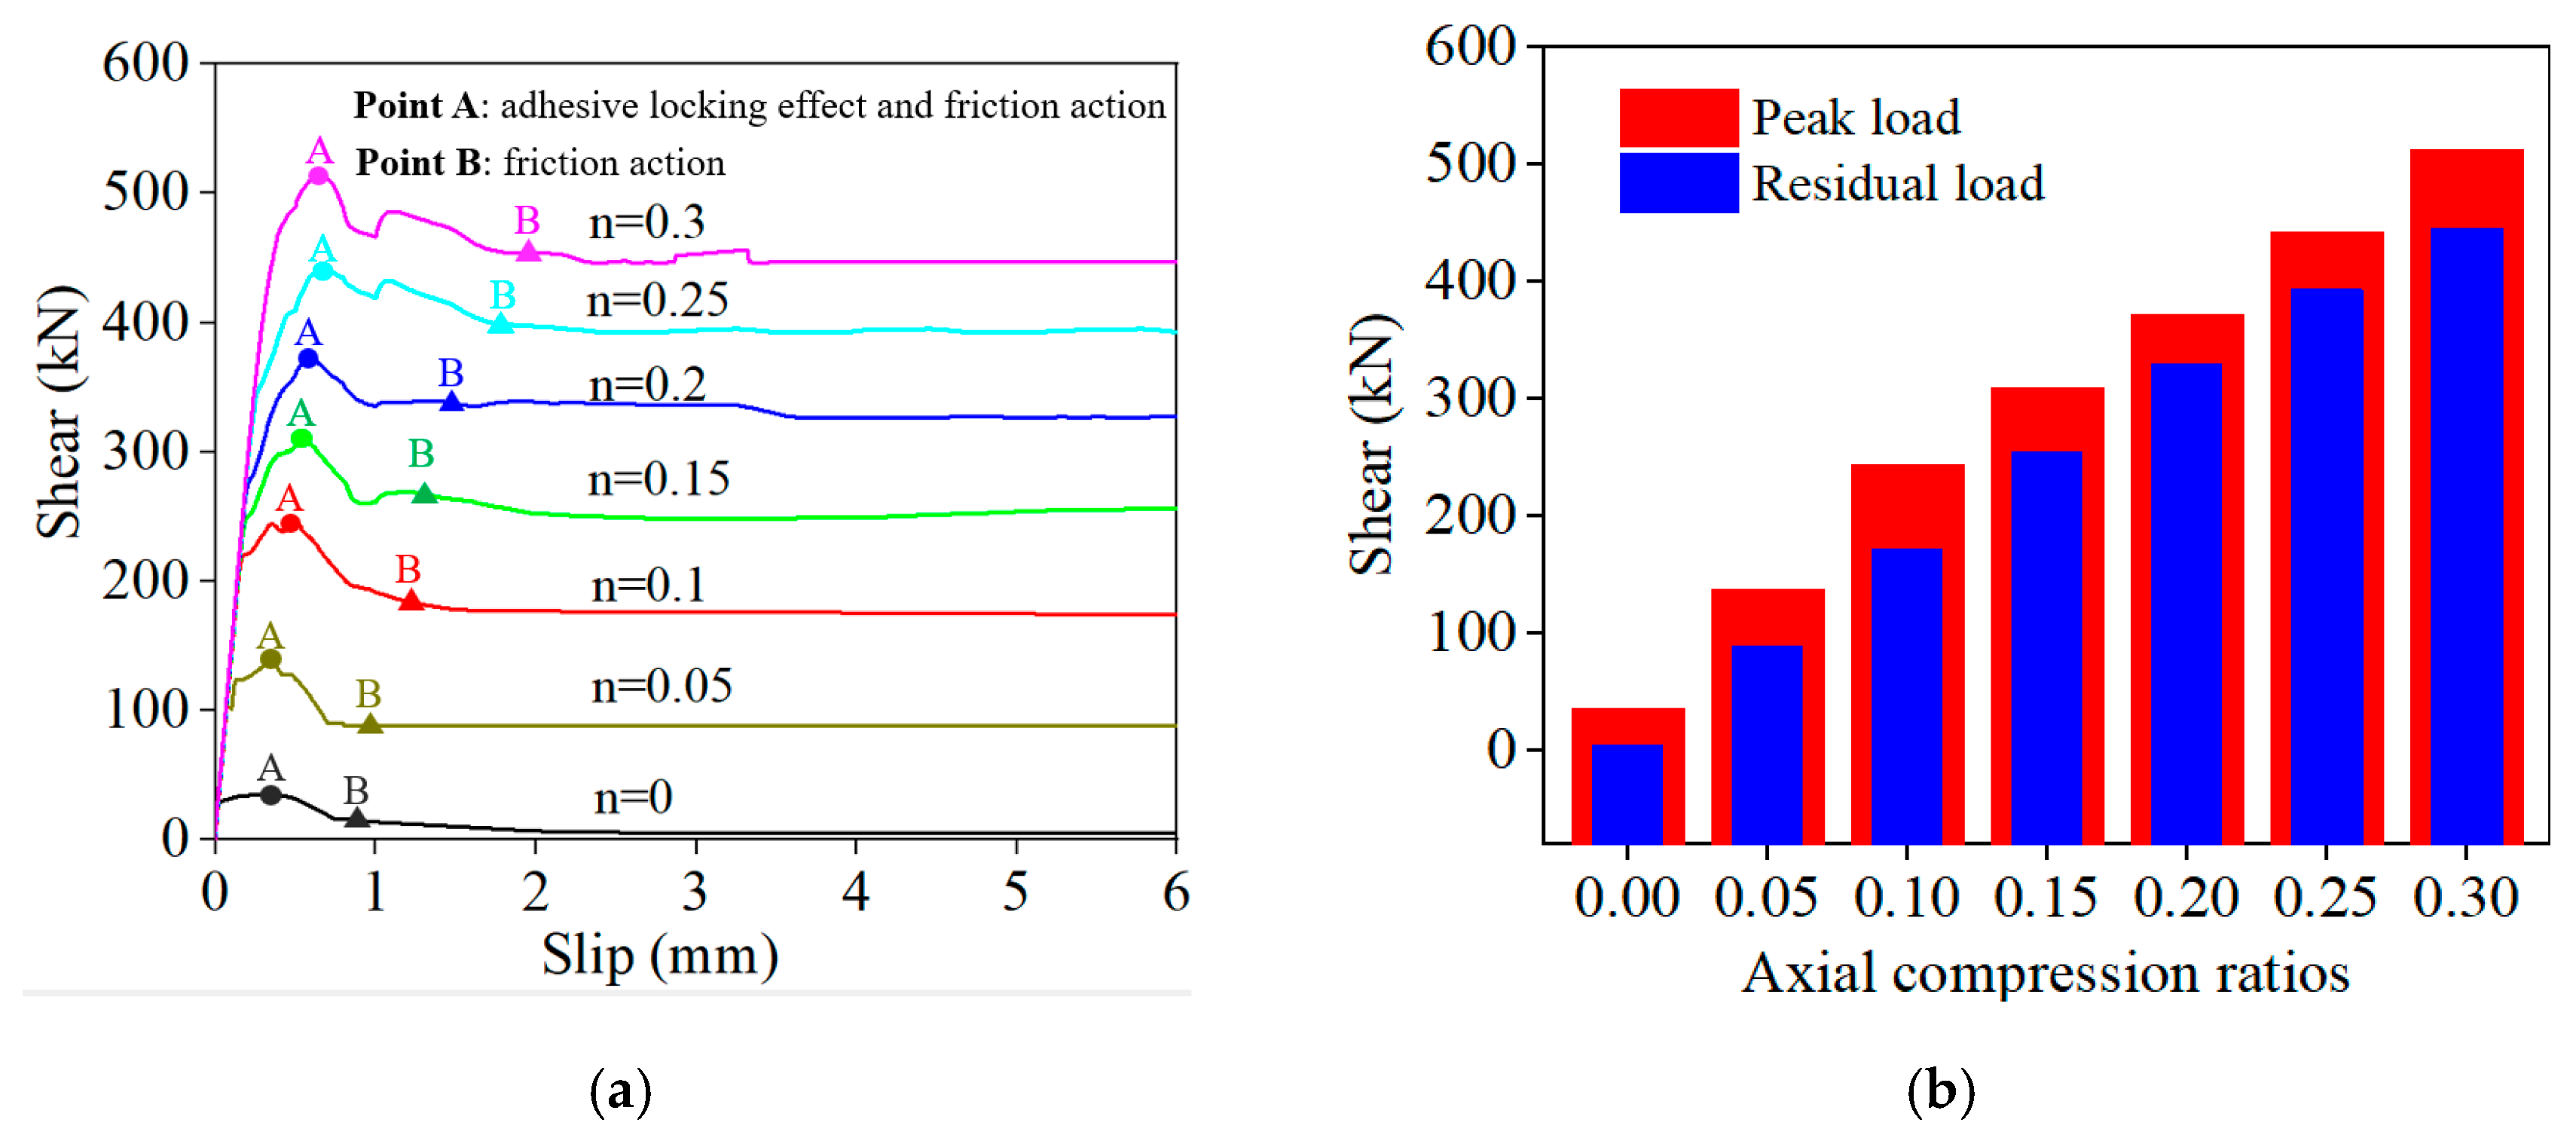
5.1. Axial Compression Ratio
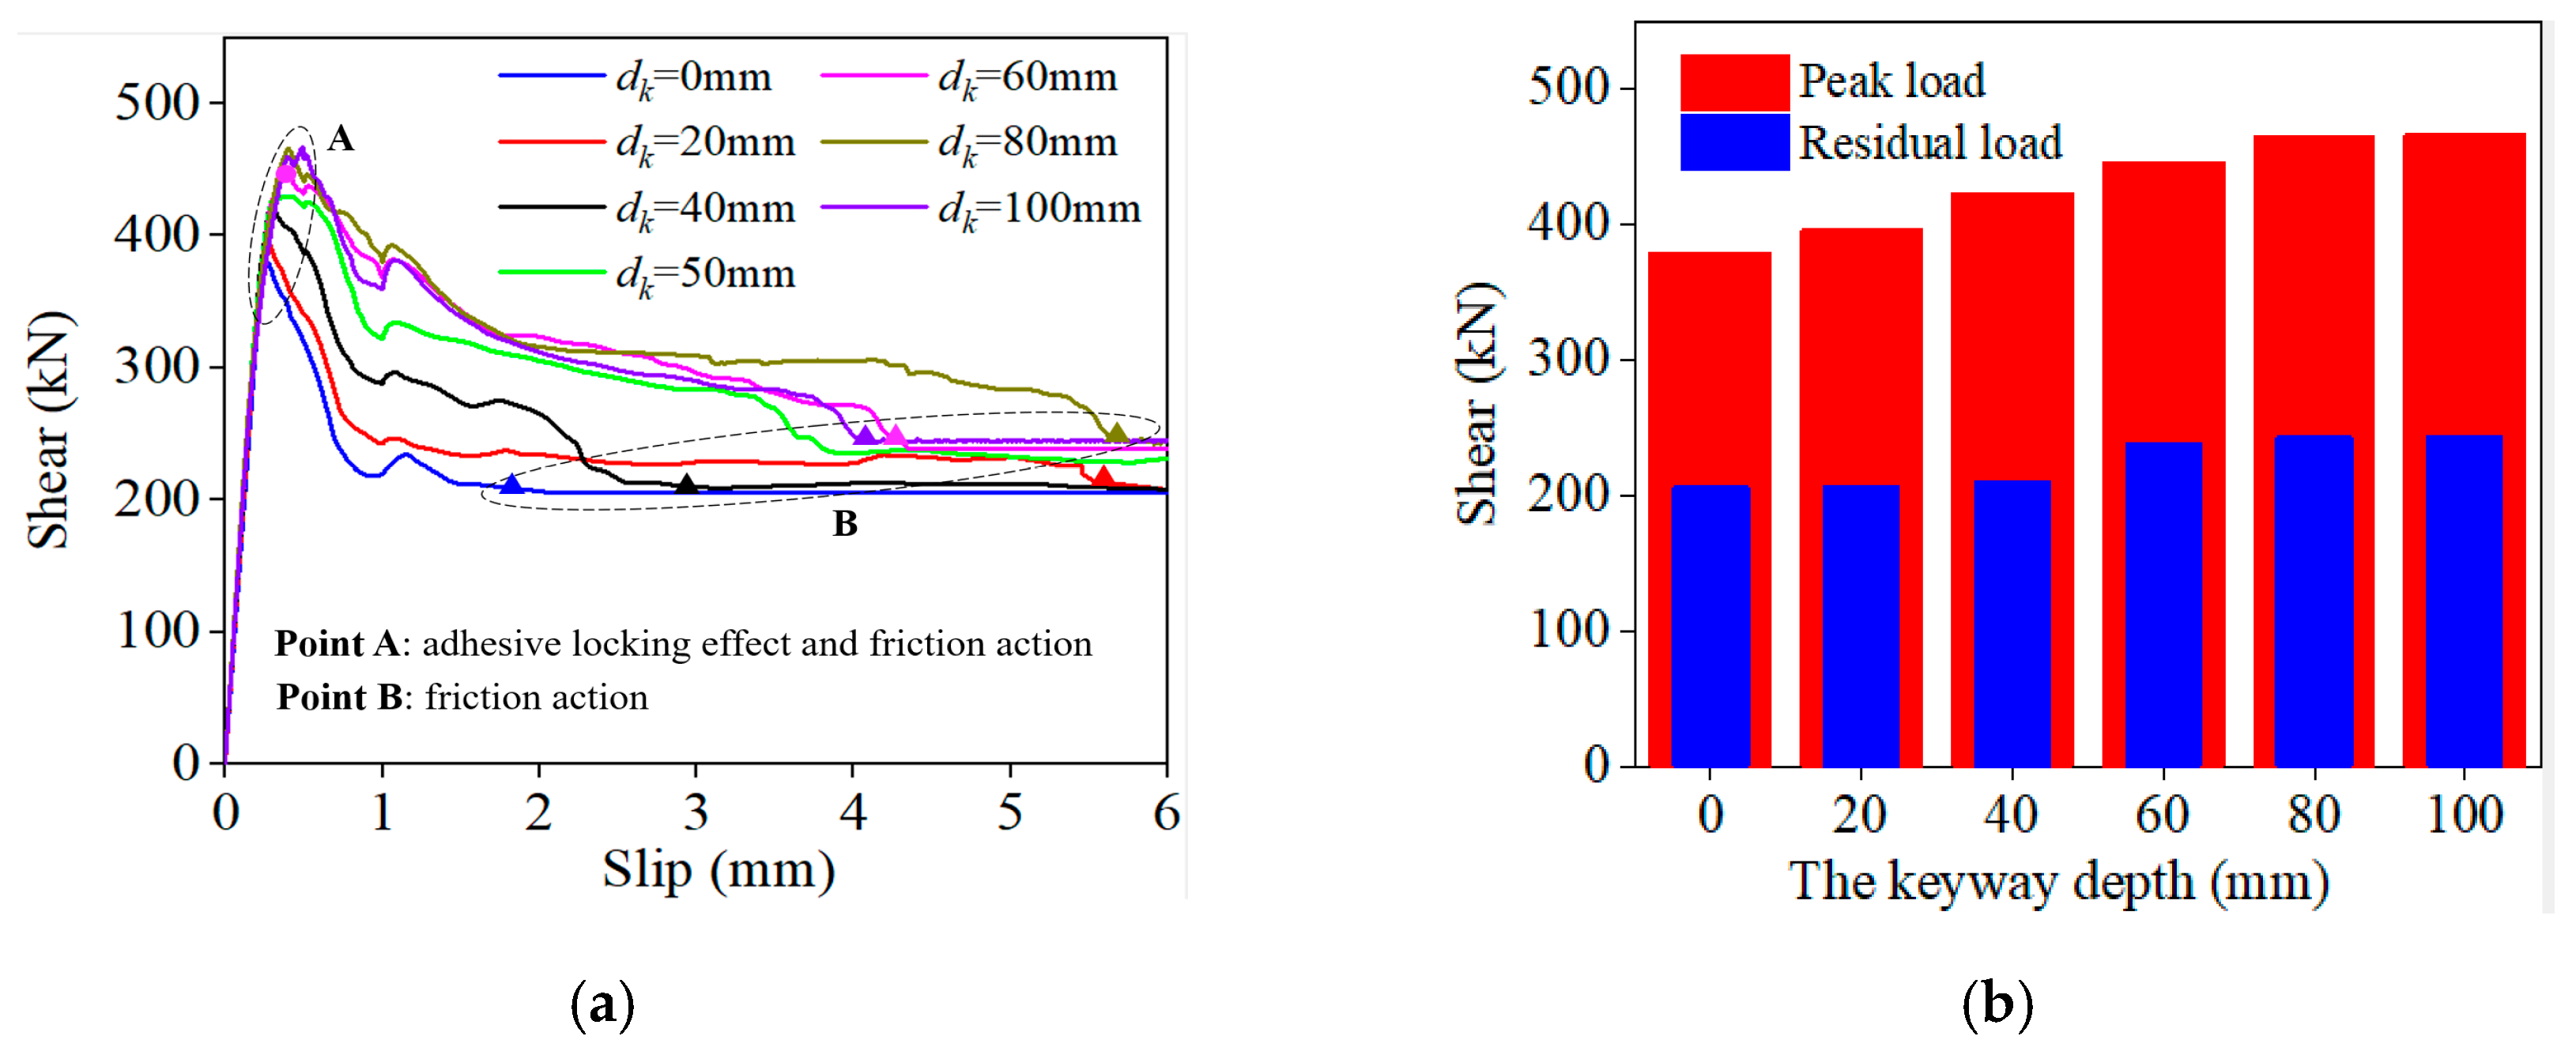
To investigate the variation in the shear performance of the keyway joint for prefabricated concrete wall panels under different axial forces, the axial compression ratios (n) of 0, 0.05, 0.1, 0.15, 0.2, 0.25, and 0.3 were selected for analysis, with all parameters matching those of specimen KTAF-2. Figure 14 presents the shear–slip curves of the keyway joint under different axial forces. It can be observed that an increase in the axial force has a significant effect on both the peak and residual loads. In comparison to specimens without an axial compression ratio (n = 0), the specimens with axial compression ratios of 0.1, 0.2, and 0.3 exhibited shear capacities that increased by 6.7 times, 10.3 times, and 14.2 times, respectively. This can be attributed to the fact that greater vertical loads not only limit slip at the keyway joints but also subject the specimen to a bidirectional stress state at the keyway joint location, resulting in increased peak and residual loads with the growing axial force. As a result, the axial compression ratio drastically affected the shear performance of the novel keyway joints for prefabricated concrete wall panels.

5.2. Keyway Depth

To further explore the impact of the keyway depth on the shear performance of the keyway joint, using KTKD-3 as a reference, a parameter analysis was conducted on wall panels with different keyway depths (dk); the shear–slip curves of the keyway joints are depicted in Figure 15. In comparison to the straight joint (dk = 0 mm), the peak load increased by 4.2%, 11.6%, 13.2%, 17.7%, 22.7%, and 22.7% for keyway depths of 20 mm, 40 mm, 50 mm, 60 mm, 80 mm, and 100 mm, respectively. Increasing the keyway depth effectively improved the shear capacity of the horizontal interface. However, when the keyway depth exceeded 40 mm, the improvements in the peak load became less significant. Furthermore, when the keyway depth dk exceeded 80 mm, the increase in the peak load became more gradual. This effect can be attributed to the more severe damage to the keyway joint. Considering that an excessively deep keyway hindered construction and transportation, we recommend keeping the keyway depth dk within the range of 40 mm to 80 mm.

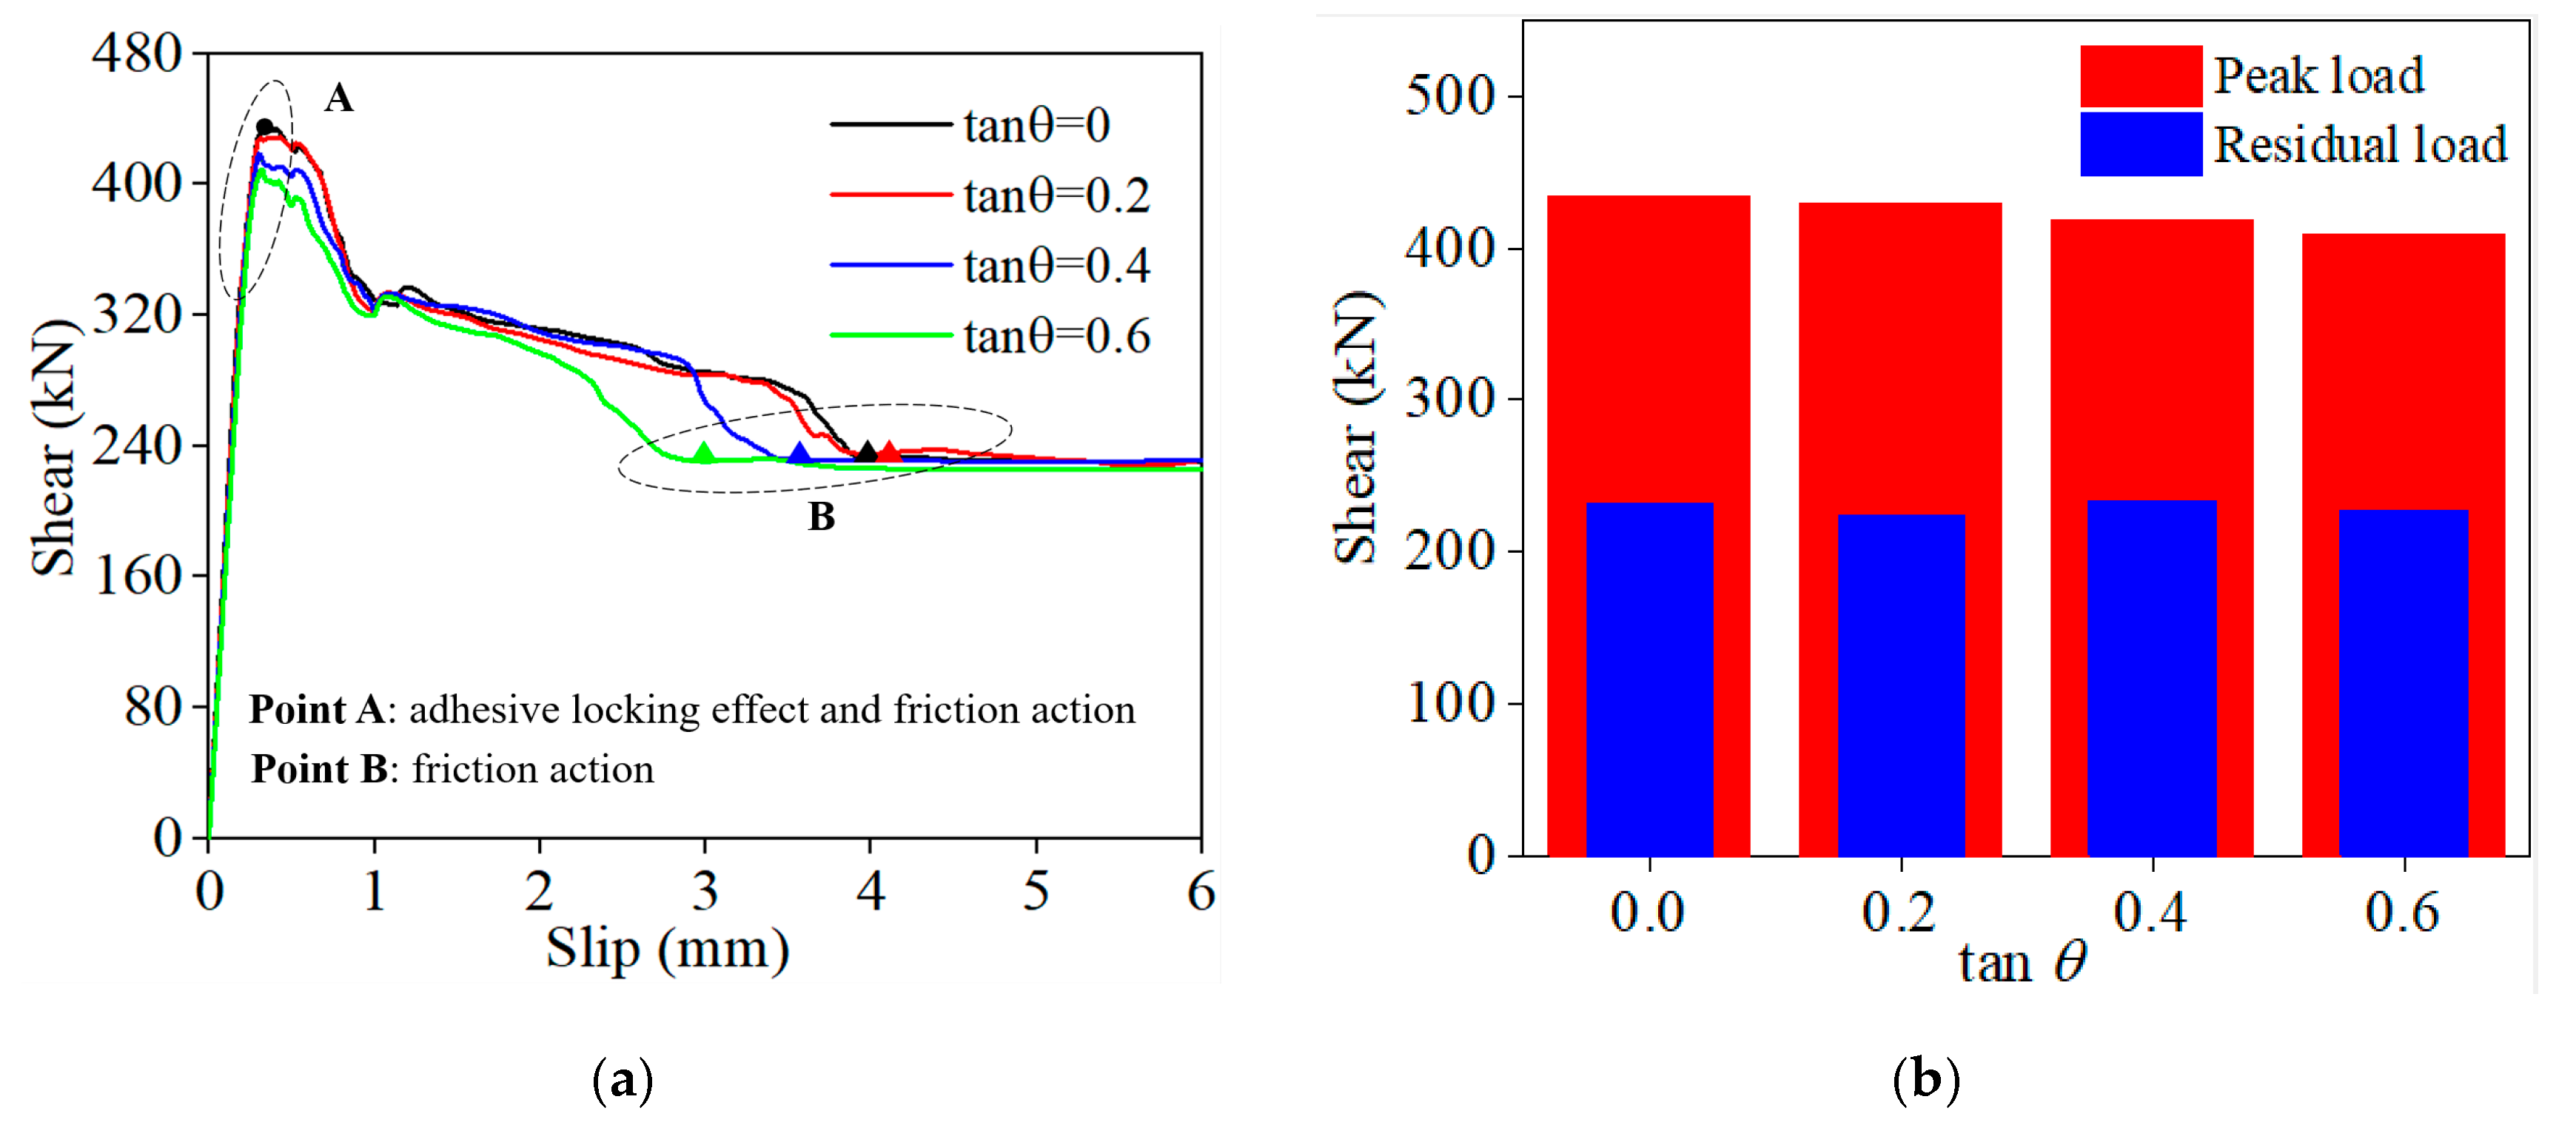
5.3. Inclination Angles in the Keyway Joint

The keyway interface consists of the upper and lower interfaces and the two inclined interfaces, as shown in Figure 16. To explore the optimal range of inclination angles θ for the inclined interface, using specimen KTKD-3 as a reference (tan θ = 0.2, α = 11.3°), we examined the impact of tan θ values of 0, 0.4, and 0.6, which correspond to angles of 0°, 21.8°, and 31°, on the shear behavior of the keyway joint.
Figure 17 shows the load–slip curves of the specimens at different inclination angles. It can be observed that the inclination angle has a limited impact on the shear performance of the keyway joint. With a constant keyway depth, the peak load decreased with the increase in the inclination angle, while the residual load remained relatively stable. This is because increasing the inclination angle weakens the frictional effect on the two inclined interfaces while reducing the contact area between the wall panel interface and the keyway joint, thereby weakening the adhesive locking effect of the keyway joint. Therefore, it is advisable to choose inclination angles for the keyway joint within the range of 0° to 20°.

6. Conclusions

This study experimentally investigated the effects of various parameters, such as the axial compression ratio, the shear span ratio, the interface mortar strength, and the keyway depth, on the shear performance of the innovative keyway joint in prefabricated concrete wall panels. Based on the experiment results, a finite element analysis model was developed and its accuracy was validated. Subsequent systematic parameter analyses evaluated the impacts of the axial compression ratio, the interface mortar strength, the keyway depth, and the inclination angles of keyway joints on the shear performance of the keyway joint for prefabricated concrete wall panels. The primary conclusions are summarized as follows:
  • The axial compression ratio had a significant impact on the failure mode of the keyway joints for prefabricated concrete wall panels. Without an axial force, the keyway joints exhibited shear brittle failure. Conversely, with an axial force, they showed compressive–shear plastic failure. As the axial compression ratio increased, both the peak and residual shear capacities of the keyway joints in the wall panels increased dramatically.
  • The interface mortar strength significantly affected the shear performance of the keyway joint for prefabricated wall panels, though its influence on the residual capacity was minimal. Compared to KTKD-5 (32.3 MPa interface mortar strength), KTKD-3, with a 59 MPa interface mortar strength, exhibited a 57.2% increase in shear capacity.
  • We recommend maintaining an optimal keyway depth within the range of 40 to 80 mm, resulting in an approximately 20% increase in the shear capacity of the keyway joint.
  • The inclination angles for the keyway joint should be set within the range of 0° to 20°, which enhances the shear capacity of the keyway joint by about 10%.
  • The innovative keyway joint exhibited a 16.5% higher shear capacity than the straight joint. Such a keyway-type joint is deemed suitable for either low-rise or multi-story prefabricated concrete wall panel structures.
In order to gain a more comprehensive understanding of the performance of the keyway joint, future research can be directed towards several areas. First, it is essential to explore the interplay between different parameters to comprehensively determine the performance of the keyway joint. Second, conducting research on multiple scales, including small-scale experiments and large-scale model tests, is imperative to better understanding the behavior of the keyway joint in actual structural settings. Additionally, future studies should expand into the realm of durability, exploring the long-term performance of keyway joints and their durability in specific environmental conditions, such as high humidity and elevated temperatures. Finally, the method for calculating the shear bearing capacity of keyway joints is supplemented and revised, and a shear sliding model for keyway nodes is established.

Author Contributions

Conceptualization, L.C. and J.C.; methodology, Y.G.; software, Y.G., J.C. and M.X.; validation, L.C. and Y.G.; investigation, L.C., J.C. and Y.G.; resources, L.C.; data curation, L.C.; writing—original draft preparation, L.C.; writing—review and editing, J.C. and M.X.; visualization, Y.G. and M.X.; project administration, L.C.; funding acquisition, L.C. and J.C. All authors have read and agreed to the published version of the manuscript.

Funding

This study was funded by the Science and Technology Research Program of the Jiangxi Provincial Education Department (Grant No. GJJ209408) and the Hunan Provincial Innovation Foundation for Postgraduates (Grant No. CX20190127).

Data Availability Statement

Some or all data used during the study are available from the corresponding author upon request. The data are not publicly available due to confidentiality.

Conflicts of Interest

The authors declare no conflict of interest.

References

  1. Kurama, Y.C.; Sritharan, S.; Fleischman, R.B.; Restrepo, J.I.; Henry, R.S.; Cleland, N.M.; Ghosh, S.; Bonelli, P. Seismic-resistant precast concrete structures: State of the art. J. Struct. Eng. 2018, 144, 03118001. [Google Scholar] [CrossRef]
  2. Pheng, L.S.; Chuan, C.J. Just-in-time management of precast concrete components. J. Constr. Eng. Manag. 2001, 127, 494–501. [Google Scholar] [CrossRef]
  3. Reichenbach, S.; Kromoser, B. State of practice of automation in precast concrete production. J. Build. Eng. 2021, 43, 102527. [Google Scholar] [CrossRef]
  4. Cao, X.; Feng, D.; Wu, G. Seismic performance upgrade of RC frame buildings using precast bolt-connected steel-plate reinforced concrete frame-braces. Eng. Struct. 2019, 195, 382–399. [Google Scholar] [CrossRef]
  5. Cao, X.; Shi, J.; Xu, J.; Ji, E.; She, Y.; Wang, Z. The combined influence of bond–slip and joint-shear in the seismic upgrading via externally-attached BFRP-bar reinforced precast sub-frames. J. Build. Eng. 2023, 80, 107984. [Google Scholar] [CrossRef]
  6. Cao, X.; Wu, G.; Ju, J.W. Seismic performance improvement of existing RCFs using external PT-PBSPC frame sub-structures: Experimental verification and numerical investigation. J. Build. Eng. 2022, 46, 103649. [Google Scholar] [CrossRef]
  7. Cheng, J.; Luo, X.; Cheng, Q.; Xing, M. Seismic performance of precast concrete walls with grouted sleeve connections using large-diameter bars. Soil Dyn. Earthq. Eng. 2023, 169, 107905. [Google Scholar] [CrossRef]
  8. Sha, M.; Liu, P.; Gao, J.; Ma, H. Research status and application of prefabricated concrete frame joints. E3S Web Conf. 2021, 260, 03025. [Google Scholar] [CrossRef]
  9. Peng, W.; Sui Pheng, L. Managing the embodied carbon of precast concrete columns. J. Mater. Civ. Eng. 2011, 23, 1192–1199. [Google Scholar] [CrossRef]
  10. Pul, S.; Senturk, M.; Ilki, A.; Hajirasouliha, I. Experimental and numerical investigation of a proposed monolithic-like precast concrete column-foundation connection. Eng. Struct. 2021, 246, 113090. [Google Scholar] [CrossRef]
  11. Rave-Arango, J.F.; Blandón, C.A.; Restrepo, J.I.; Carmona, F. Seismic performance of precast concrete column-to-column lap-splice connections. Eng. Struct. 2018, 172, 687–699. [Google Scholar] [CrossRef]
  12. Korkmaz, H.H.; Tankut, T. Performance of a precast concrete beam-to-beam connection subject to reversed cyclic loading. Eng. Struct. 2005, 27, 1392–1407. [Google Scholar] [CrossRef]
  13. Li, H.; Chen, W.; Hao, H. Dynamic response of precast concrete beam with wet connection subjected to impact loads. Eng. Struct. 2019, 191, 247–263. [Google Scholar] [CrossRef]
  14. Choi, H.-K.; Choi, Y.-C.; Choi, C.-S. Development and testing of precast concrete beam-to-column connections. Eng. Struct. 2013, 56, 1820–1835. [Google Scholar] [CrossRef]
  15. Ghayeb, H.H.; Razak, H.A.; Sulong, N.R. Development and testing of hybrid precast concrete beam-to-column connections under cyclic loading. Constr. Build. Mater. 2017, 151, 258–278. [Google Scholar] [CrossRef]
  16. Guan, D.; Jiang, C.; Guo, Z.; Ge, H. Development and seismic behavior of precast concrete beam-to-column connections. J. Earthq. Eng. 2018, 22, 234–256. [Google Scholar] [CrossRef]
  17. Gudonis, E.; Timinskas, E.; Gribniak, V.; Kaklauskas, G.; Arnautov, A.K.; Tamulėnas, V. FRP reinforcement for concrete structures: State-of-the-art review of application and design. Eng. Struct. Technol. 2013, 5, 147–158. [Google Scholar] [CrossRef]
  18. Li, W.; Li, Q.-N.; Jiang, W.-S.; Jiang, L. Seismic performance of composite reinforced concrete and steel moment frame structures–state-of-the-art. Compos. Part B Eng. 2011, 42, 190–206. [Google Scholar] [CrossRef]
  19. Williams, M.S.; Sexsmith, R.G. Seismic damage indices for concrete structures: A state-of-the-art review. Earthq. Spectra 1995, 11, 319–349. [Google Scholar] [CrossRef]
  20. Santos, P.M.; Júlio, E.N. A state-of-the-art review on shear-friction. Eng. Struct. 2012, 45, 435–448. [Google Scholar] [CrossRef]
  21. Divan, M.; Madhkhan, M. Determination of behavior coefficient of prefabricated concrete frame ith prefabricated shear walls. Procedia Eng. 2011, 14, 3229–3236. [Google Scholar] [CrossRef]
  22. Gu, Q.; Wu, R.; Ren, J.; Tan, Y.; Tian, S.; Wen, S. Effect of position of non-contact lap splices on in-plane force transmission performance of horizontal joints in precast concrete double-face superposed shear wall structures. J. Build. Eng. 2022, 51, 104197. [Google Scholar] [CrossRef]
  23. Cheng, J.; Luo, X.; Cheng, L.; Cheng, Q.; Chen, L. Experimental Study on Seismic Behavior of PC Walls with Alveolar-Type Horizontal Joint under Pseudo-Static Loading. Materials 2022, 15, 2301. [Google Scholar] [CrossRef] [PubMed]
  24. Dang, L.; Pang, R.; Liu, Y.; Wang, Y.; Wang, L.; Yang, J. Research on seismic performance of precast steel–concrete composite tube shear walls with horizontal joint. Eng. Struct. 2022, 250, 113409. [Google Scholar] [CrossRef]
  25. Guri, M.; Brzev, S.; Lluka, D. Performance of prefabricated large panel reinforced concrete buildings in the November 2019 Albania earthquake. J. Earthq. Eng. 2022, 26, 5799–5825. [Google Scholar] [CrossRef]
  26. Chuai, J.; Hou, Z.; Wang, Z.; Wang, L. Mechanical properties of the vertical joints of prefabricated underground silo steel plate concrete wall. Adv. Civ. Eng. 2020, 2020, 6643811. [Google Scholar] [CrossRef]
  27. Liu, J.; Wang, B.; Chu, M.; Zhang, P.; Wang, B. Influence of the axial load ratio on the mechanical behaviour of prefabricated concrete shear walls with Mortise–Tenon joints. Structures 2023, 53, 83–97. [Google Scholar] [CrossRef]
  28. Ibrahim, I.S.; Padil, K.H.; Mansoor, H.; Bady, A.; Saim, A.A.; Sarbini, N.N.; Bady, H.; Saim, A.; Sarbini, N. Ultimate shear capacity and failure of shear key connection in precast concrete construction. Malays. J. Civ. Eng. 2014, 26, 414–430. [Google Scholar]
  29. Rizkalla, S.H.; Serrette, R.L.; Heuvel, J.S.; Attiogbe, E.K. Multiple shear key connections for precast shear wall panels. PCI J. 1989, 34, 104–120. [Google Scholar] [CrossRef]
  30. Al-Bared, M.A.; Harahap, I.S.; Marto, A.; Mohamad, H.; Abad, S.V.A.N.K.; Mustaffa, Z. Cyclic behavior of RT-cement treated marine clay subjected to low and high loading frequencies. Geomech. Eng. 2020, 21, 433–445. [Google Scholar]
  31. Chaiyasarn, K.; Buatik, A.; Mohamad, H.; Zhou, M.; Kongsilp, S.; Poovarodom, N. Integrated pixel-level CNN-FCN crack detection via photogrammetric 3D texture mapping of concrete structures. Autom. Constr. 2022, 140, 104388. [Google Scholar] [CrossRef]
  32. Mohamad, H.; Bennett, P.J.; Soga, K.; Klar, A.; Pellow, A. Distributed optical fiber strain sensing in a secant piled wall. In Proceedings of the 7th FMGM 2007: Field Measurements in Geomechanics, Boston, MA, USA, 24–27 September 2007; pp. 1–12. [Google Scholar]
  33. Rashid, A.S.A.; Shirazi, M.G.; Mohamad, H.; Sahdi, F. Bearing capacity of sandy soil treated by Kenaf fibre geotextile. Environ. Earth Sci. 2017, 76, 431. [Google Scholar] [CrossRef]
  34. Xiao, Y.; Luo, X.; Xing, M.; Pan, Z.; Cheng, J.; Liu, J. Simplified Analytical Methods for Prefabricated Concrete Wall Panel Building System with Alveolar-Type Joints. Buildings 2023, 13, 1177. [Google Scholar] [CrossRef]
  35. Cheng, B.; Cai, Y.; Looi, D.T. Experiment and numerical study of a new bolted steel plate horizontal joints for precast concrete shear wall structures. Structures 2021, 32, 760–777. [Google Scholar] [CrossRef]
  36. Biswal, A.; Prasad, A.M.; Sengupta, A.K. Study of shear behavior of grouted vertical joints between precast concrete wall panels under direct shear loading. Struct. Concr. 2019, 20, 564–582. [Google Scholar] [CrossRef]
  37. Zhao, Y.; Zou, R.; Ding, T.; Xiao, J. Experimental study of the shear behaviour of concrete-grout-concrete joints. J. Build. Eng. 2021, 43, 103095. [Google Scholar] [CrossRef]
  38. Zhou, Y.; Zhang, B.; Hwang, H.-J.; Xi, S.; Fang, L.; Huang, Y.; Yi, W. Tensile and shear behavior of box connector for precast concrete shear walls. Eng. Struct. 2021, 245, 112983. [Google Scholar] [CrossRef]
  39. Cholewicki, A. Loadbearing capacity and deformability of vertical joints in structural walls of large panel buildings. Build. Sci. 1971, 6, 163–184. [Google Scholar] [CrossRef]
  40. Soudki, K.A.; West, J.S.; Rizkalla, S.H.; Blackett, B. Horizontal connections for precast concrete shear wall panels under cyclic shear loading. PCI J. 1996, 41, 64–80. [Google Scholar] [CrossRef]
  41. Castillo, T.; Paredes, M.; Andrade, A.; Arroba, V.; Guerrero, J. Off-Site Construction of Concrete Housing in the Andean Region: Advantages and Disadvantages. Civ. Eng. Archit. 2022, 10, 477–489. [Google Scholar] [CrossRef]
  42. Ding, K.W.; Ling, R.; Yin, W.Y.; Liu, S.C.; Ni, S.M. Reviews on the research status and prospect of the prefabricated concrete shear wall structure. Appl. Mech. Mater. 2013, 291, 1021–1024. [Google Scholar] [CrossRef]
  43. Yang, S. The Development and Application of Prefabricated Buildings. Highlights Sci. Eng. Technol. 2022, 18, 162–167. [Google Scholar] [CrossRef]
  44. JGJ/T101-2015; Specification for Seismic Test of Buildings. China Academy of Building Research: Beijing, China, 2015.
  45. GB 50010-2010; Code for Design of Concrete Structures. China Academy of Building Research: Beijing, China, 2010.
  46. Wriggers, P. Computational Contact Mechanics; Springer: Berlin, Germany, 2006. [Google Scholar]
  47. ABAQUS. ABAQUS 6.14: User’s Manual; Dassault Systemes Simulia Corporation: Providence, RI, USA, 2014. [Google Scholar]
  48. Grassl, P.; Jirásek, M. Plastic model with non-local damage applied to concrete. Int. J. Numer. Anal. Methods Geomech. 2006, 30, 71–90. [Google Scholar] [CrossRef]
  49. Grassl, P.; Nystrom, U.; Rempling, R.; Gylltoft, K. A damage-plasticity model for the dynamic failure of concrete. arXiv 2011, arXiv:1103.1288. [Google Scholar]
Figure 1. A 3D diagram of prefabricated concrete wall panels with an innovative keyway joint.
Buildings 13 02978 g001
Figure 2. Reinforcement configuration and geometric dimensions of the specimens (mm): (a) details of the prefabricated concrete wall panels; (b) details of the keyway.
Buildings 13 02978 g002
Figure 3. Manufacture and assembly procedure for the specimens: (a) pouring the top wall panel; (b) pouring the foundation and bottom wall panel; (c) pouring the mortar at the keyway interface; (d) completion of assembly.
Buildings 13 02978 g003
Figure 4. On-site loading device and measuring instruments: (a) testing apparatus; (b) displacement meter arrangement.
Buildings 13 02978 g004
Figure 5. Failure models of the specimens: (a) KTAF-1; (b) KTAF-2; (c) KTAF-3; (d) KTKD-1; (e) KTKD-2; (f) KTKD-3; (g) KTKD-4; (h) KTKD-5.
Buildings 13 02978 g005aBuildings 13 02978 g005b
Figure 6. Shear–slip curves of the test specimens: (a) KTAF-1; (b) KTAF-2; (c) KTAF-3; (d) KTKD-1; (e) KTKD-2; (f) KTKD-3; (g) KTKD-4; (h) KTKD-5.
Buildings 13 02978 g006
Figure 7. Shear–stain curves of KTKD-1 to KTKD-4: (a) KTKD-1; (b) KTKD-2; (c) KTKD-3; (d) KTKD-4.
Buildings 13 02978 g007
Figure 8. Finite element model.
Buildings 13 02978 g008
Figure 9. Constitutive relationship of the concrete and steel bar: (a) uniaxial constitutive model for concrete; (b) bilinear hardening model for steel.
Buildings 13 02978 g009
Figure 10. Contact interface traction–separation relationship.
Buildings 13 02978 g010
Figure 11. Loading methods.
Buildings 13 02978 g011
Figure 12. Shear–slip curves of the simulation and experimental results: (a) KTAF-2; (b) KTKD-3.
Buildings 13 02978 g012
Figure 13. Finite element analysis results: (a) KTAF-2; (b) KTKD-3.
Buildings 13 02978 g013
Figure 14. Effect of axial compression ratios: (a) shear–slip curves; (b) peak load and residual load.
Buildings 13 02978 g014
Figure 15. Effect of keyway depth: (a) shear–slip curves; (b) peak load and residual load.
Buildings 13 02978 g015
Figure 16. Details of the keyway joint. Notes: θ represents the inclination angle of the keyway. lb represents the length of the lower interface of the keyway joint. b represents the thickness of the wall panel.
Buildings 13 02978 g016
Figure 17. Effect of the inclination angle of the keyway joint: (a) shear–slip curves; (b) peak load and residual load.
Buildings 13 02978 g017
Table 1. Main information regarding the test specimens.
Specimens No.dk (mm)λAK (mm2)nAxial Force (kN)fc,p (MPa)
KTAF-1500.49600 × 2820032.3
KTAF-2500.49600 × 2820.1171.632.3
KTAF-3500.49600 × 2820.2343.232.3
KTKD-100.37800 × 2000.1228.859
KTKD-2200.37800 × 2320.1228.859
KTKD-3500.37800 × 2820.1228.859
KTKD-41000.37800 × 3440.1228.859
KTKD-5500.37800 × 2820.1228.832.3
Notes: dk stands for the keyway depth. λ represents the shear span ratio, which is the ratio of the distance from the loading point to the top of the load-bearing base to the length of the wall panel. AK represents the cross-sectional area of the keyway, where AK = lc × lb, in which, lc represents the length of the wall panel, and lb denotes the length of the inclined edge of the bottom section of the keyway joint. n represents the axial compression ratio. fc,p represents the interface mortar strength.
Table 2. The ratio of forces in each stage of the specimen.
Specimens V c r / V u V d / V l
KTAF-10.691.40
KTAF-20.81.09
KTAF-30.661.02
KTKD-10.931.15
KTKD-20.891.09
KTKD-30.871.09
KTKD-40.871.04
KTKD-50.751.03
Table 3. Parameter settings of the contact interface.
ContactNormal BehaviorTangential BehaviorSpecimensSurface-Based Cohesive Behavior
Face-to-face contactHard contact Penalty   function   ( μ = 0.8 )For KTAF-1~ KTAF-3 σ nn = σ ss = σ tt = 2.67 MPa ;
K nn = K s s = K t t = 8 MPa ;
G c = 0.8   MPa mm
For KTKD-1~KTKD-5 σ nn = σ ss = σ tt = 2.87 MPa ;
K nn = K ss = K tt = 9.6 MPa
G c = 0.86   MPa mm
Disclaimer/Publisher’s Note: The statements, opinions and data contained in all publications are solely those of the individual author(s) and contributor(s) and not of MDPI and/or the editor(s). MDPI and/or the editor(s) disclaim responsibility for any injury to people or property resulting from any ideas, methods, instructions or products referred to in the content.

