Abstract
Modular integrated construction (MiC) is a new type of assembled building structure system that consists of prefabricated concrete modules connected using post-cast concrete. To reduce material consumption and realize casting without supporting molds, thin and lightweight concrete formworks (MiC formworks) with a thickness of 30 mm are installed as part of the shear wall. Due to the thinness, concrete pouring tends to cause MiC formwork cracking, mold rising, and other problems. Its stress performance and damage mechanism are not clear. For this reason, three groups of MiC formworks with different material composition types are designed. The static load test is carried out in a graded partition loading mode, and parametric analysis is combined with numerical simulation to systematically study the influence of different material components on the mechanical properties of MiC formworks. The results show that the front cracks of the MiC formworks are mainly distributed under the truss tendons, and the back cracks are mainly distributed in the span position of the adjacent truss tendons. These cracks both occur along the span direction of the MiC formworks. Increasing the concrete strength has a significant effect on improving the load-bearing capacity of MiC formworks, while incorporating steel fibers can significantly improve its deformation and crack resistance. Parametric analysis showed that the steel fiber admixture exhibited limited improvements in the cracking resistance of the panels as the concrete matrix grade increased. The research results provide a practical basis for optimizing the production process of MiC formworks.
1. Introduction
Contrary to traditional building construction methods, modular building is a construction form in which modular units are manufactured in a factory and then transported to the construction site to be assembled into a complete building [1,2]. The building’s integrity is a major consideration in the design. Connections between modular units play a central role in providing the integrity of a modular building [3]. To improve this integrity, most structural wall panels used in construction are made by pouring concrete into precast formwork in advance [4], so that the two work together, in which the molded shell wall panels play an important role [5].
As part of a shear wall, a molded shell wall panel is regarded as a permanent formwork that participates in the overall forces of the building. Currently, many scholars have carried out extensive and in-depth studies on the performance of permanent formwork in the process of working in concert with cast-in-place concrete. The research mainly focuses on two aspects. One is to investigate the bond performance of the interface between the permanent formwork and the cast-in-place concrete from the formwork material [6,7] and the formwork shape [8]. The damage pattern of the formwork is related to the length of the formwork. At shorter lengths, the damage occurs mainly at the textile–matrix interface; while at longer lengths, the damage begins to transform into a textile fracture [9]. In addition, the use of 3D concrete printing technology to produce permanent formwork for building components can maximize the material, time, and cost savings, especially when formwork with complex geometries is required [10]. Studies have shown that casting can only take place when the 3D printed model has been molded for 7 days [11]. Appropriate addition of micro-expanders or increasing the proportion of small and medium size coarse aggregates in cast-in-place concrete to create structural elements will result in better bonding [12,13]. On the other hand, many scholars have conducted preliminary studies on the mechanical properties of permanent formwork composite members. These mainly focus on exploring the effect of permanent formwork made of different matrix materials on composite members. For example, the use of engineered cementitious composite (ECC) [14,15], ultra-high-toughness cementitious composites (UHTCC) [16], reinforced ultra-high-toughness cementitious composites (RUHTCC) [17], ultra-high-performance concrete (UHPC) [9], textile-reinforced concrete (TRC) [18,19,20], and other materials are all able to improve the load carrying capacity and deformation capacity of composite members to different degrees. In addition, the shape of the formwork also affects the composite members. The ultimate load capacity of flat formwork composite columns is higher than that of L-shaped formwork composite columns [18]. U-shaped permanent formwork shows better performance than flat formwork, which improves the load carrying capacity and toughness [15].
The final geometry and surface quality of the completed concrete structure are highly dependent on the formwork system employed in the construction [21]. Therefore, the selection criteria and basic requirements of the formwork system should be fully considered before starting the construction [22,23]. Permanent formwork commonly used in engineering is not suitable for MiC modular units due to its high self-weight. Fabric formwork can solve this problem. However, due to the self-weight of the concrete and the low stiffness of the fabric formwork, the large deviation from the desired concrete shell shape is still the core problem [24]. Therefore, the development of a lightweight permanent formwork with low deadweight and sufficient stiffness is necessary.
We propose a thin and lightweight permanent formwork with a thickness of only 30 mm, which is called MiC formwork. Its construction is similar to precast concrete laminated panels. Tie bolts are welded at the truss reinforcement nodes of MiC formworks. When used as an outer shear wall formwork, it is bolted to the outer timber formwork. When used as an inner shear wall formwork, the bolts are passed through the opposite wall plate and fixed to form a shear wall by pouring concrete (Figure 1). From the structural engineering point of view, the formwork should be designed for different ultimate loads and applicable loads, including the lateral pressure of filling materials. Due to the thinness of the MiC formwork, the lateral pressure exerted on the slab by the concrete pouring will lead to mold rise, cracking, and slurry leakage. Adding fibers to concrete is a good solution for its stress cracking. Steel fibers, as a commonly used fiber addition, can significantly improve the tensile strength, toughness, and cracking resistance of the concrete matrix [25,26]. Therefore, three groups of commonly used MiC formworks with different material component types are designed for static loading tests. We establish a refined numerical model based on the established specifications and carry out parametric analysis of important parameters, such as the concrete strength class and the fiber content of the steel fiber concrete. The aim is to find the MiC formwork with the best working performance and to provide a theoretical reference for its application in practical engineering.
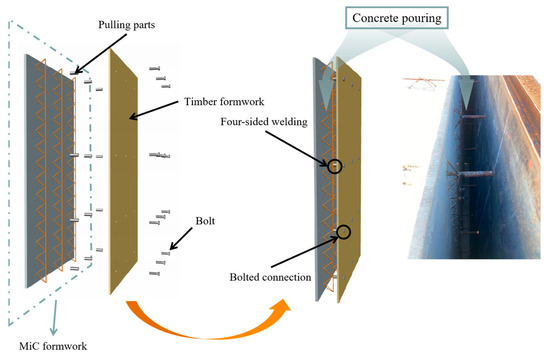
Figure 1.
Pouring of concrete.
2. Materials and Methods
2.1. Materials
2.1.1. Concrete
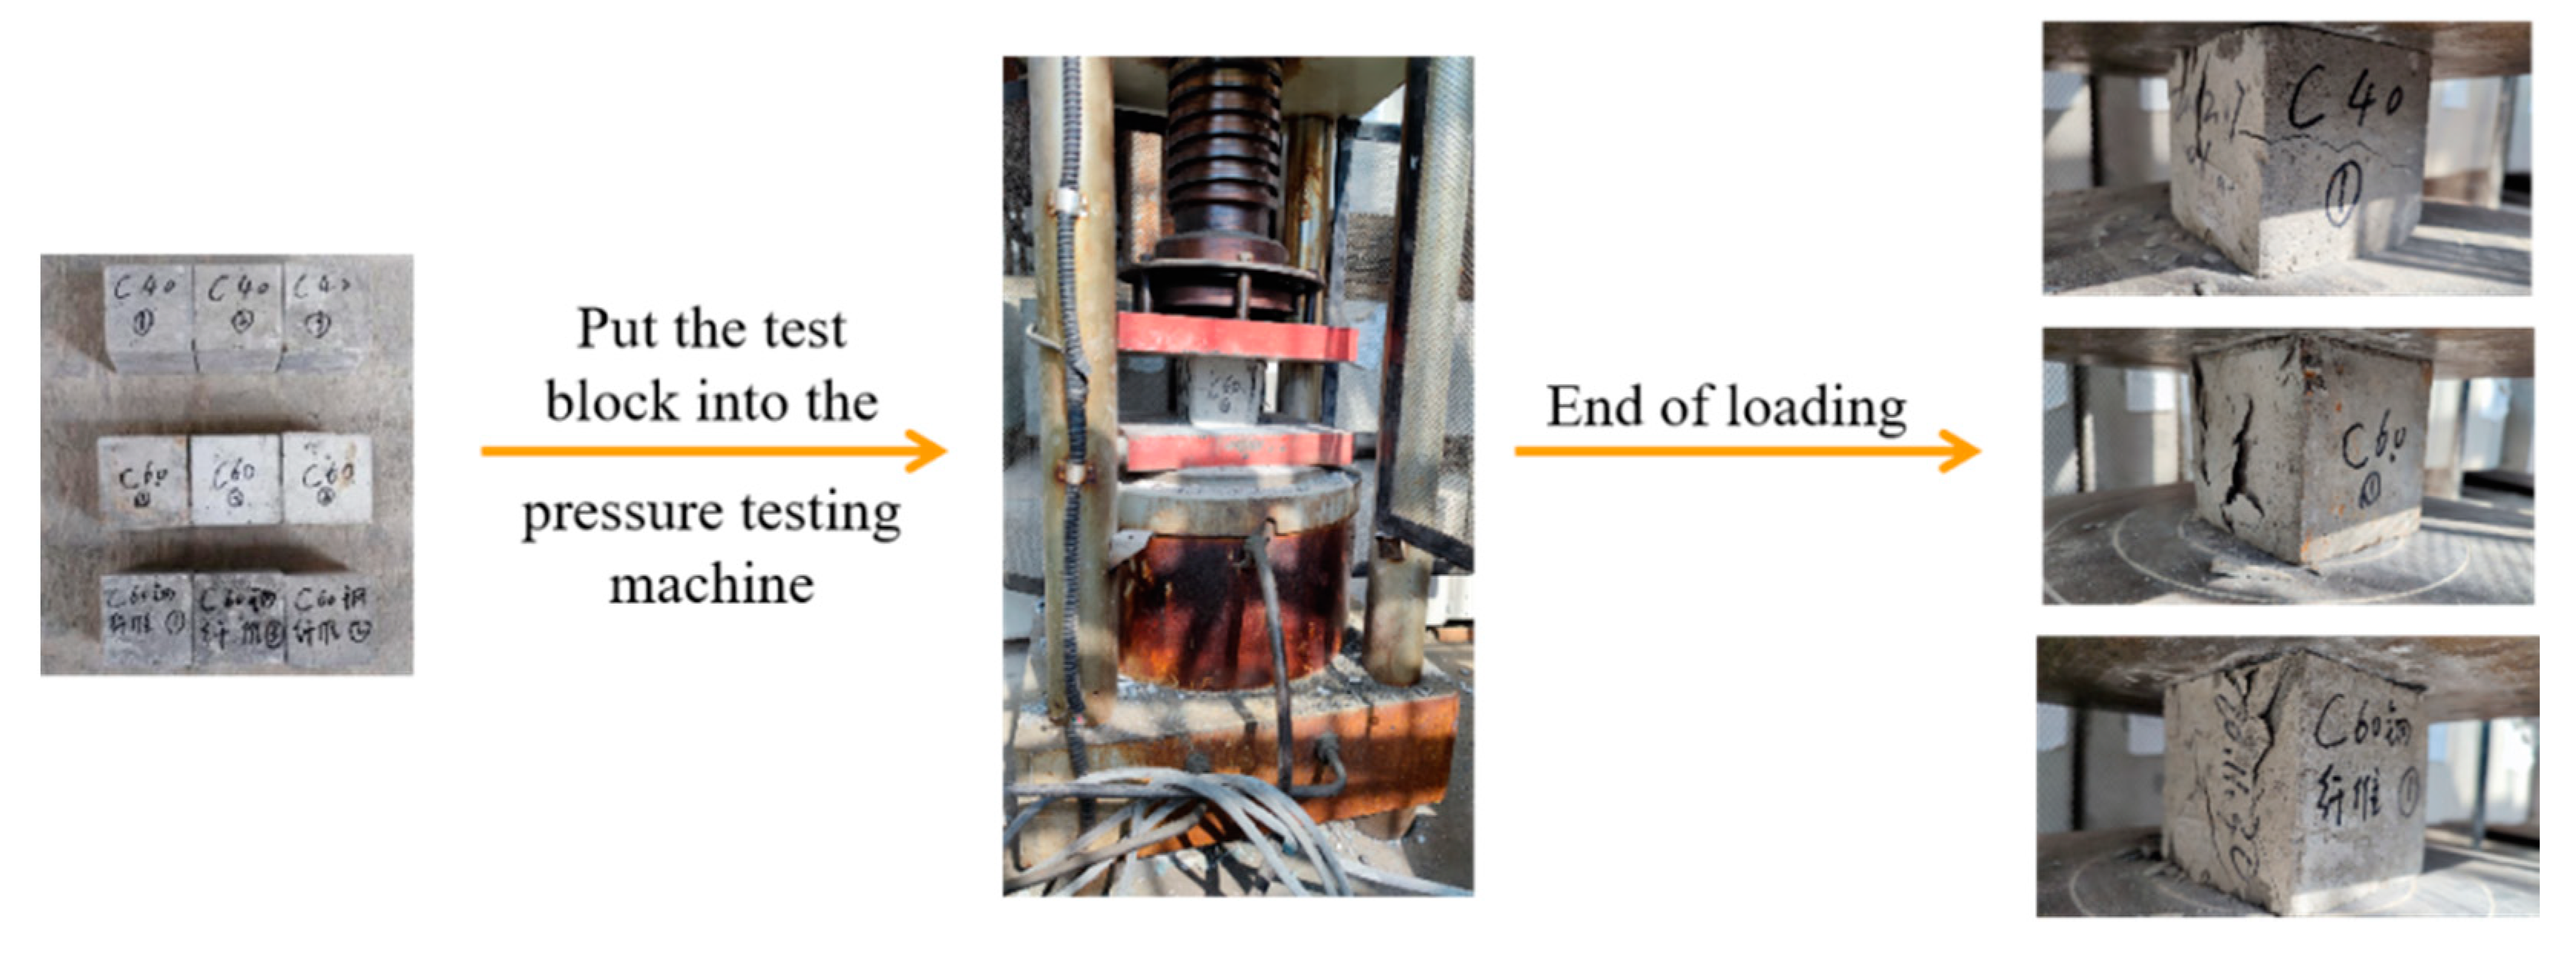
Three types of concrete were used in the test: ordinary C40 concrete, ordinary C60 concrete, and C60 steel fiber concrete. C60 steel fiber concrete contains 1% steel fibers by volume, and the steel fibers are 0.5 mm in diameter and 15–30 mm in length. Each grade of concrete has three standard specimen samples of 150 mm × 150 mm × 150 mm. The compressive strength of concrete was measured after 28 days of curing (Figure 2). The results were multiplied by a conversion factor of 0.95, as shown in Table 1. The compressive strengths of the C40 concrete, C60 concrete, and C60 steel fiber concrete were 41.42 MPa, 60.99 MPa, and 62.35 MPa, respectively. These were the average values of three identical tests conducted on each material. The measured compressive strengths of these three types of concrete all meet the specification requirements.
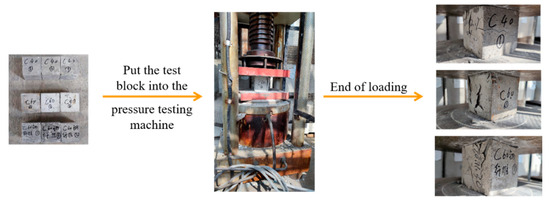
Figure 2.
Concrete material test.

Table 1.
Test results of the concrete material properties.
2.1.2. Steel Bars
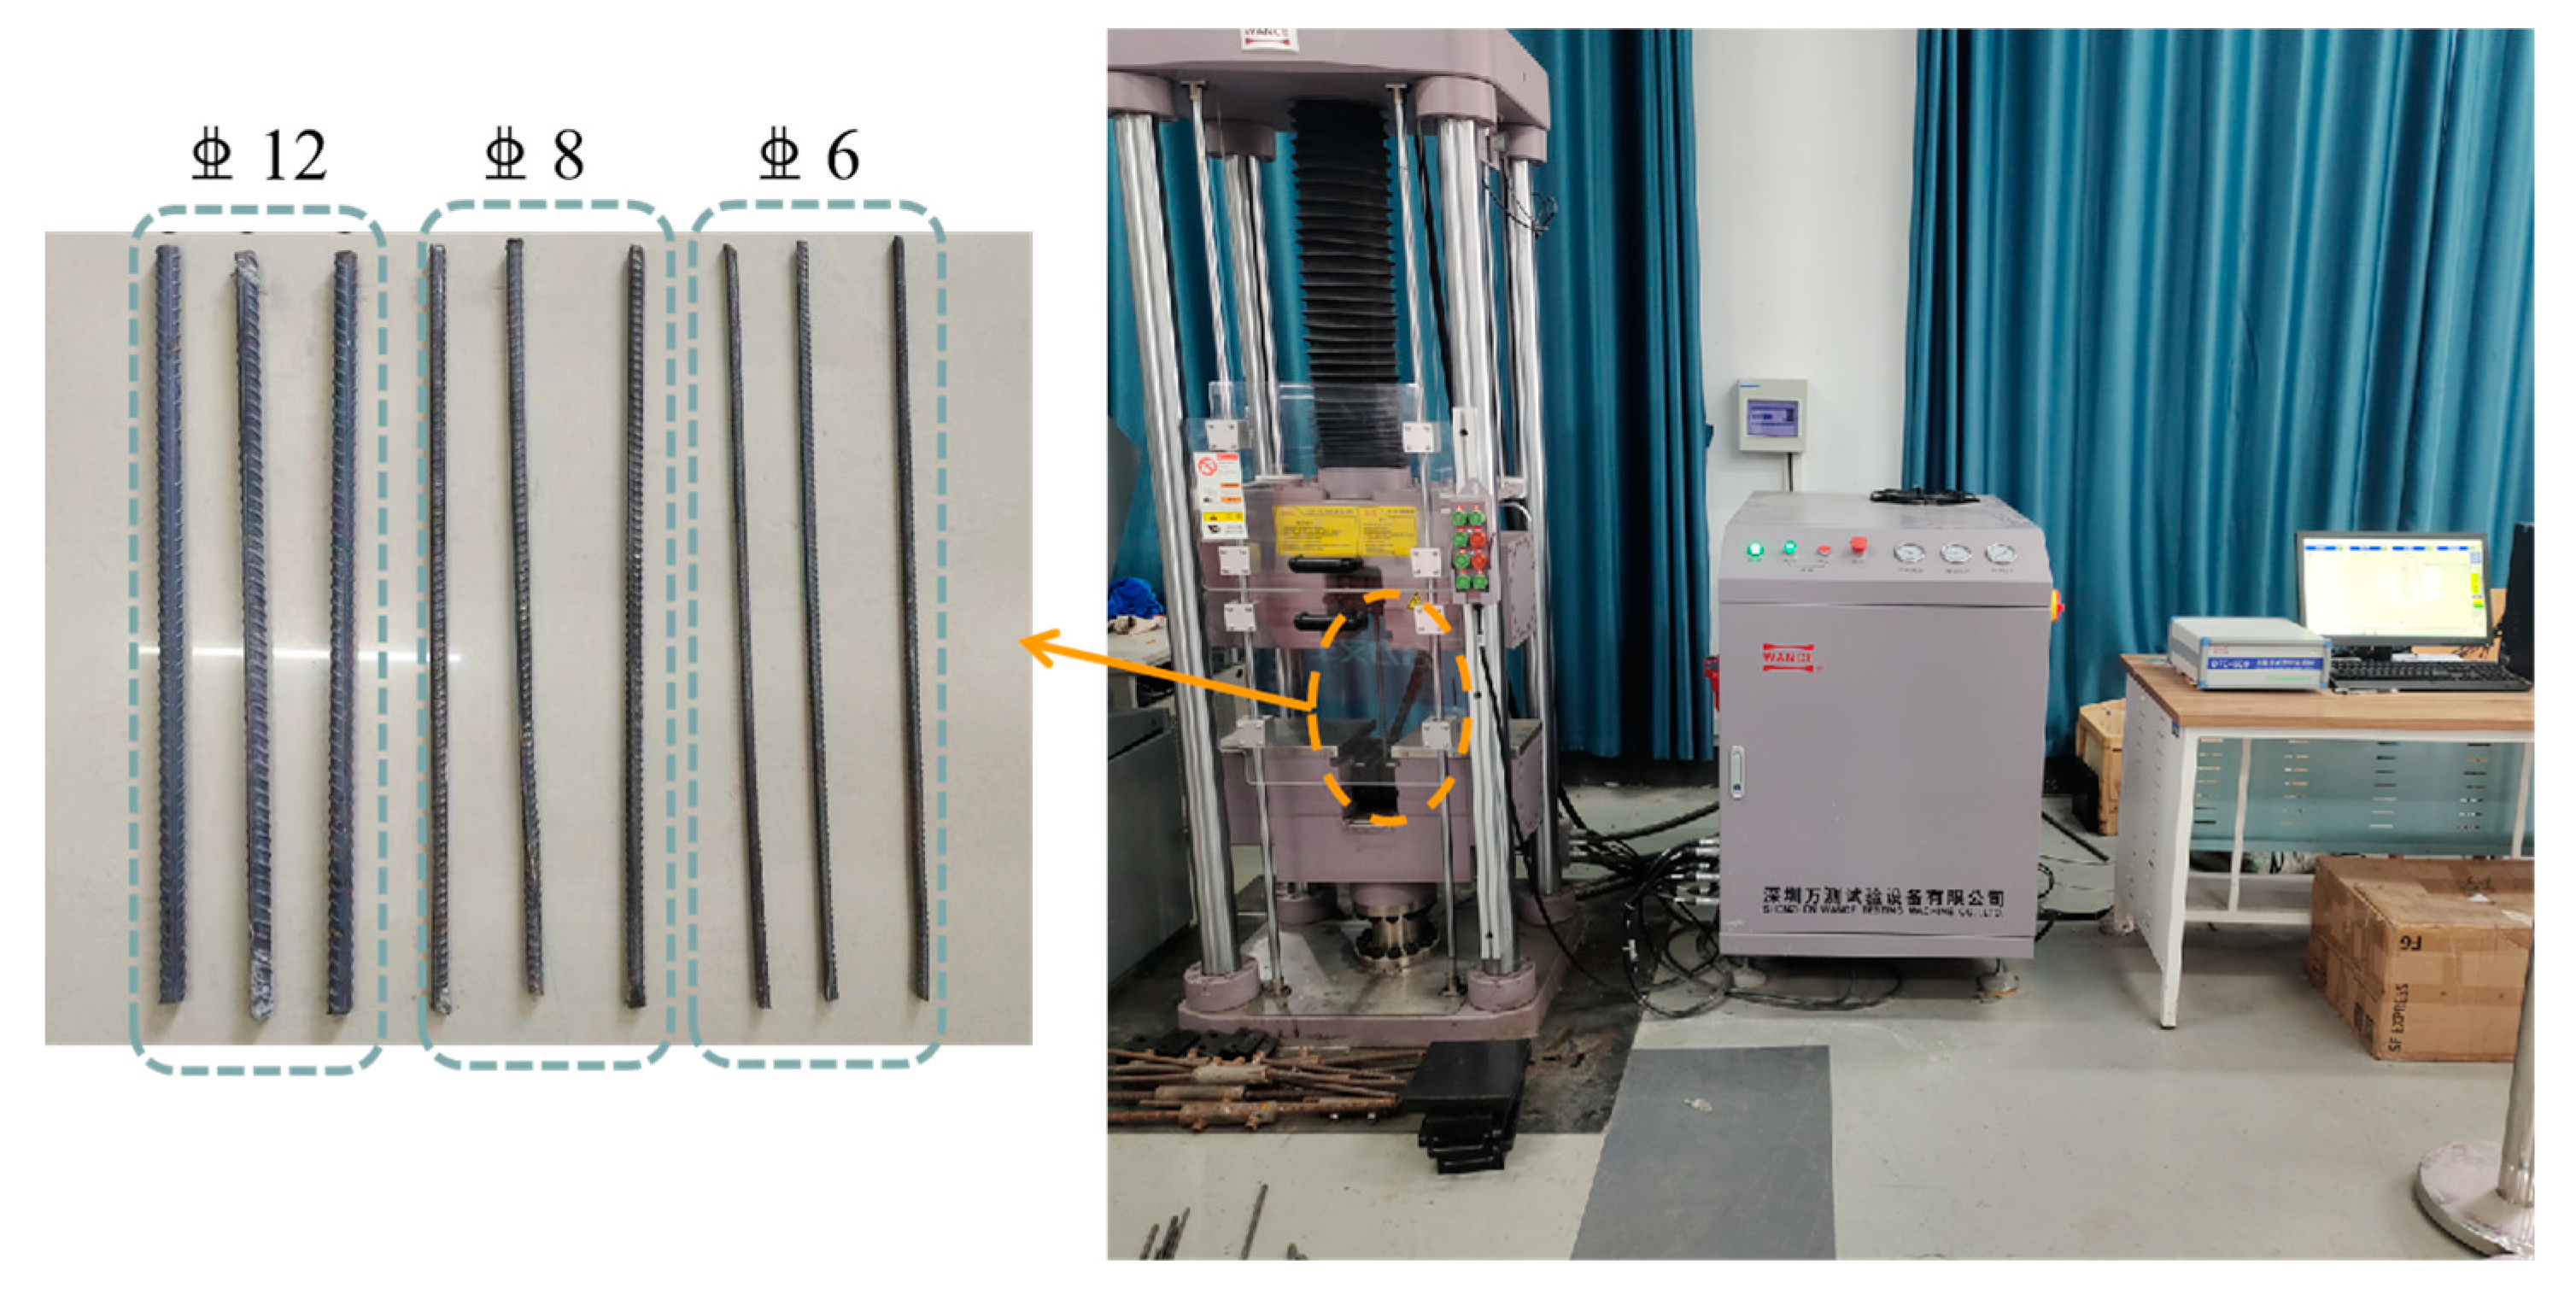
The grades of reinforcement bars used in the test formworks were all HRB400 with diameters of 12 mm, 8 mm, and 6 mm, respectively. Three groups of rebars with different diameters and all with a length of 50 mm were used, with 3 samples from each set. Figure 3 demonstrates the testing process for the yield strength and ultimate tensile strength of the steel bars. The measured mechanical properties of the reinforcement bars are shown in Table 2, and all of them met the specification requirements.
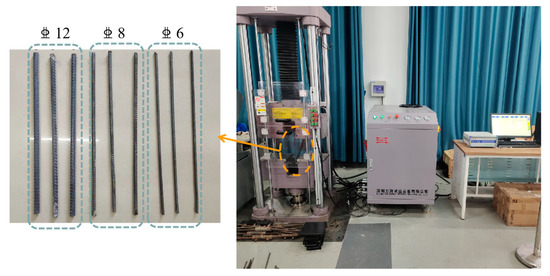
Figure 3.
Steel material test.
Table 2.
Test results of the steel bar properties.
2.2. Specimen Design
Each specimen consists of a concrete base slab, base slab distribution reinforcement, and truss reinforcement. All parameters were the same except for the material components of the concrete base plate. Three MiC formworks with different material components were designed for this test as follows:
- (1)
- The first specimen was used as a benchmark, namely, N60. Its concrete floor was made of C60 concrete.
- (2)
- The second specimen with C40 concrete floor was marked as N40.
- (3)
- The third specimen was marked as SF60. Its concrete floor was made of C60 steel fiber concrete.
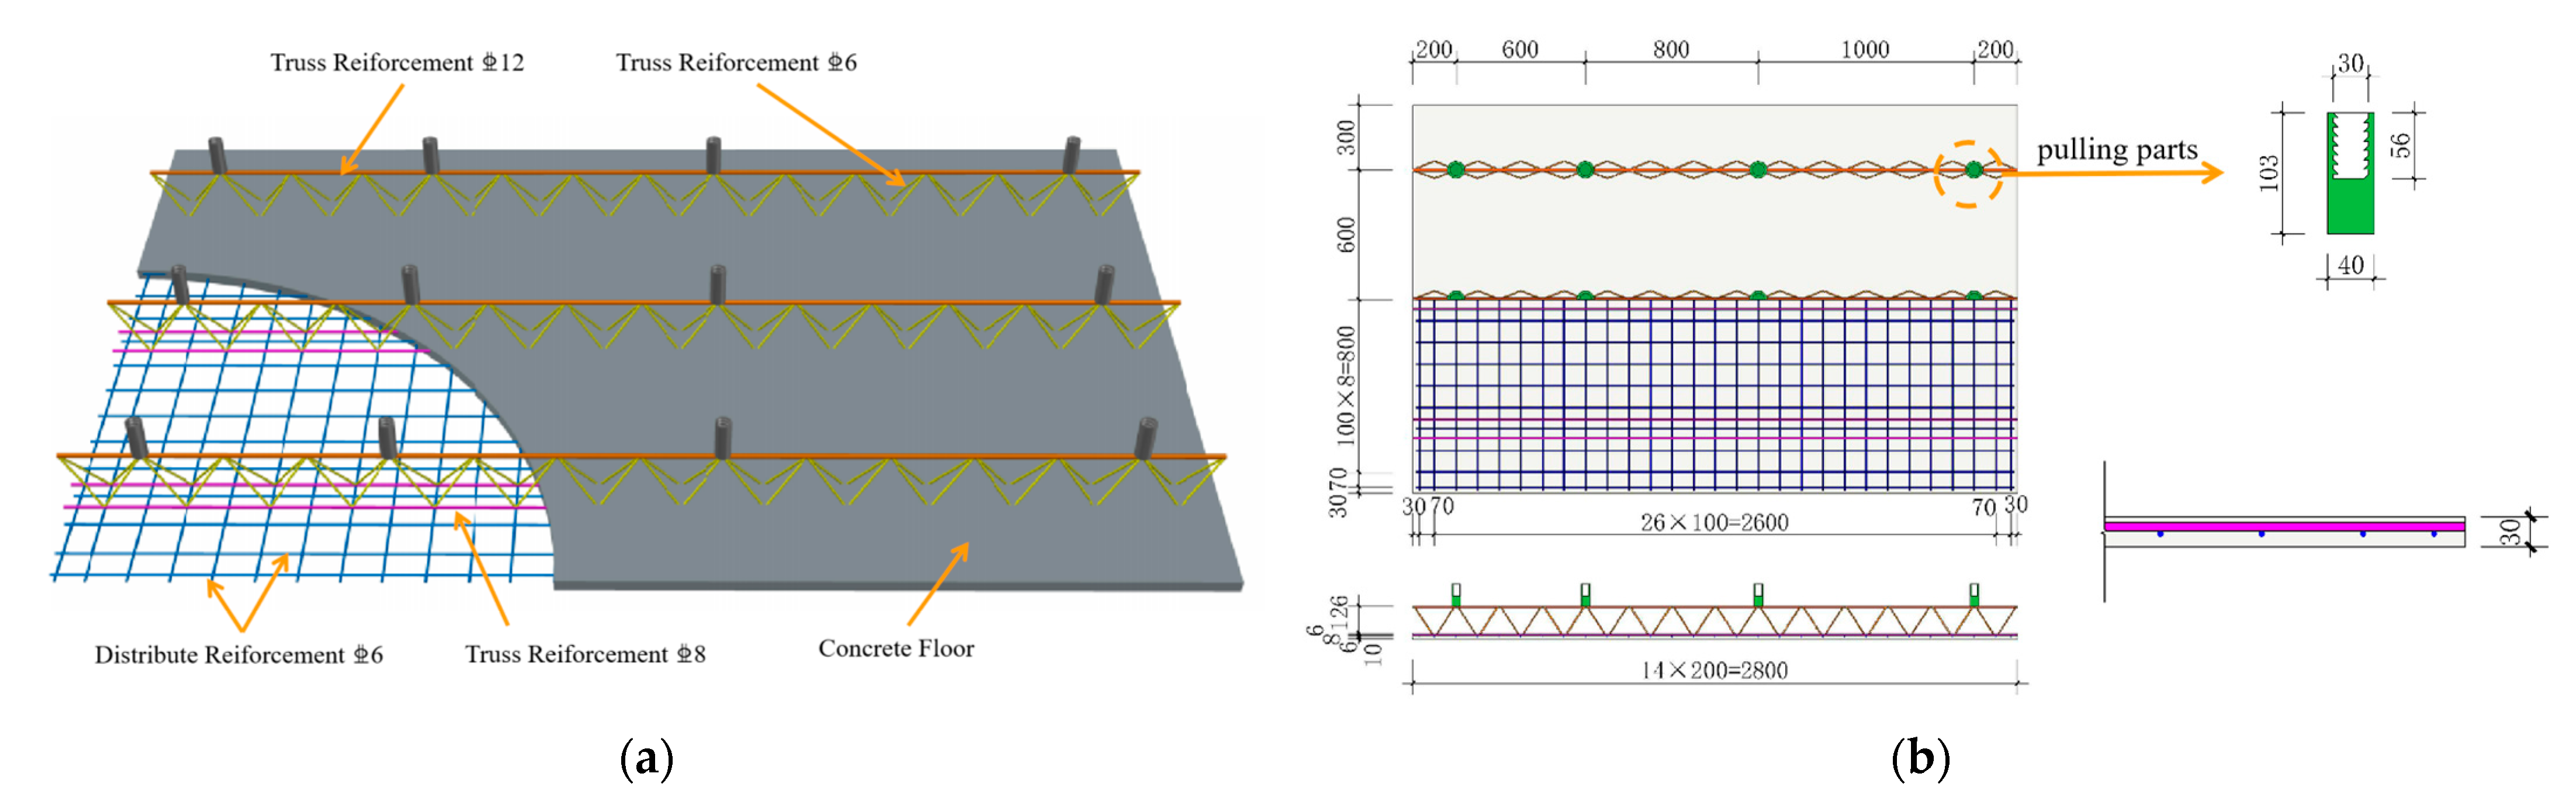
Figure 4 shows the construction of the MiC formworks. Internal threaded cylindrical pins were soldered at the truss reinforcement of the specimen as a tie member, and its row density increased with the increase in the lateral pressure on the formwork. The concrete base plate was designed as a two-way plate, and the specific parameters are shown in Table 3. The thickness of the protective layer of the base plate was 10 mm, and the diameter of the base plate distribution bar was 6 mm. The truss reinforcement was welded by the upper and lower chord bars and the web bars, the diameters of which were 12 mm, 8 mm, and 6 mm, respectively.
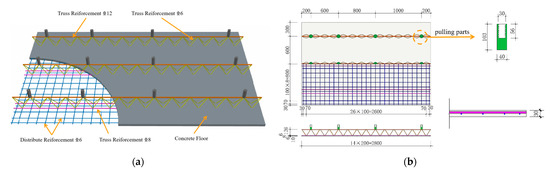
Figure 4.
Prefabricated MiC formwork diagram. (a) Three-dimensional model; (b) size and reinforcement drawing.
Table 3.
Specific parameters of the specimen.
2.3. Loading Device and Scheme
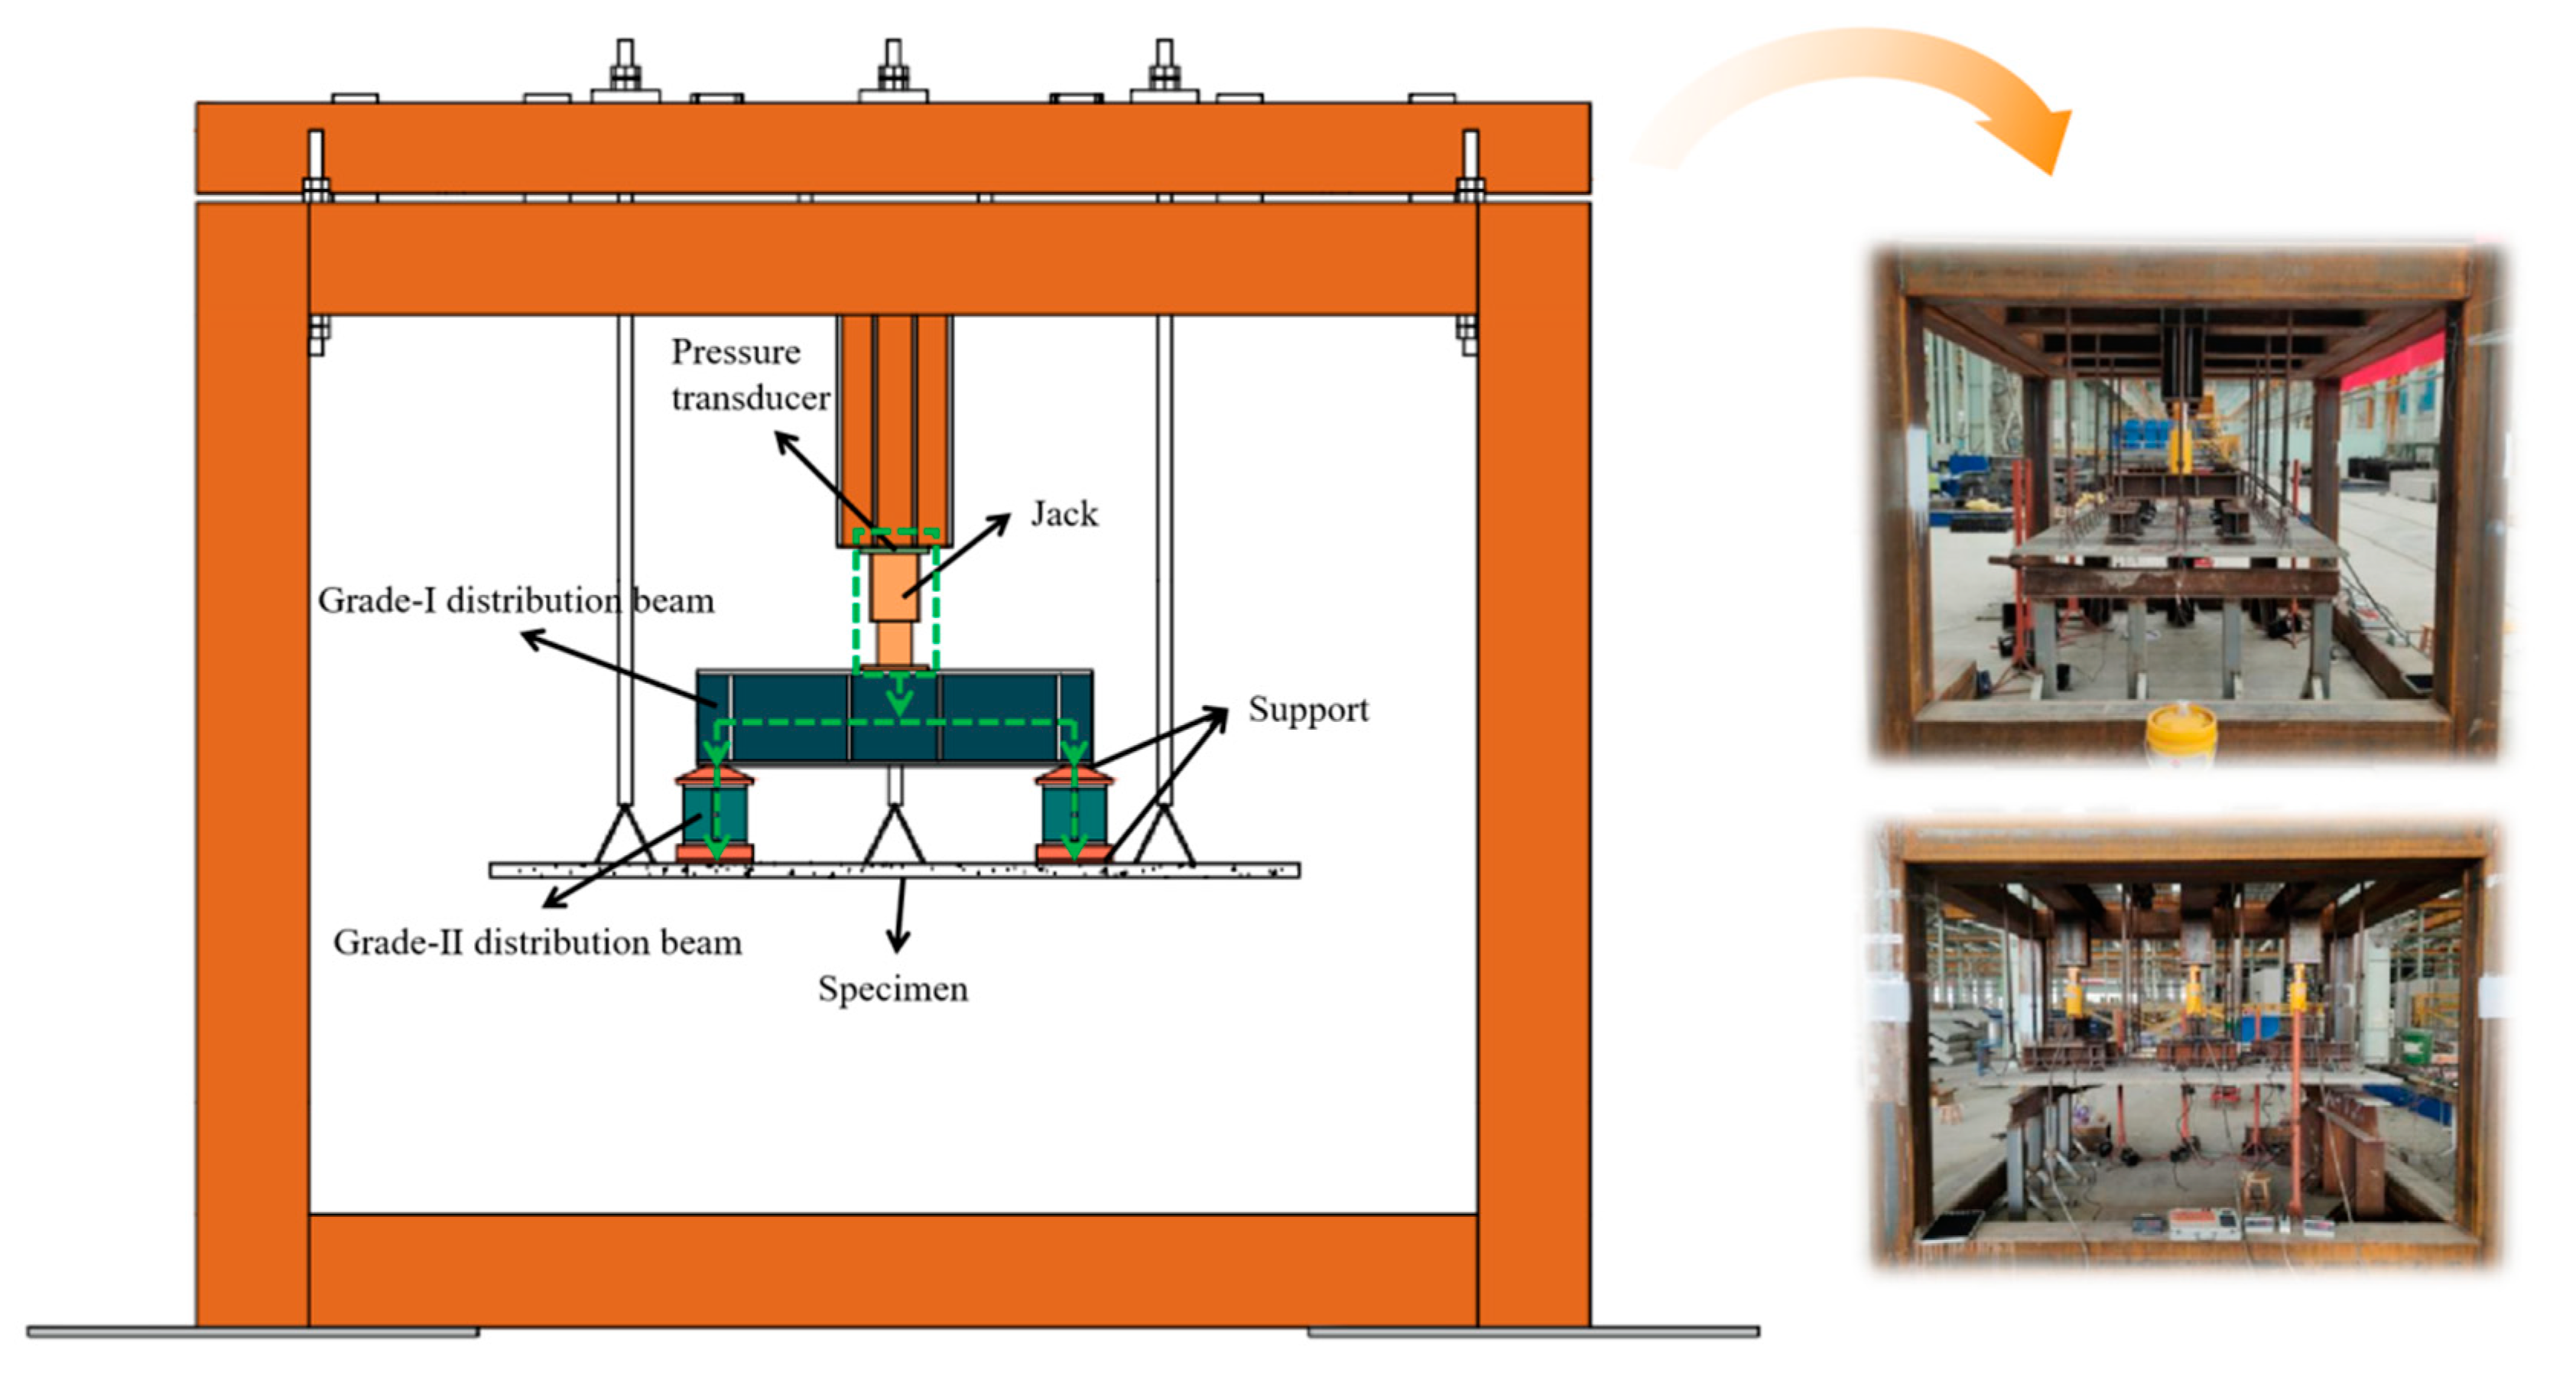
In this test, a new type of loading steel frame was designed to meet the special stressing mode of MiC formworks, consisting of the main steel frame and the top channel steel combination beam. The specimen loading device is shown in Figure 5. The specimen was fixed to the loading device using rigid spacers suspended from the threaded rod. A hydraulic jack was used to apply the load to the distribution beam. The load was finally transferred to the four supports through the two-stage distribution beam to simulate the uniform load.

Figure 5.
Loading device.
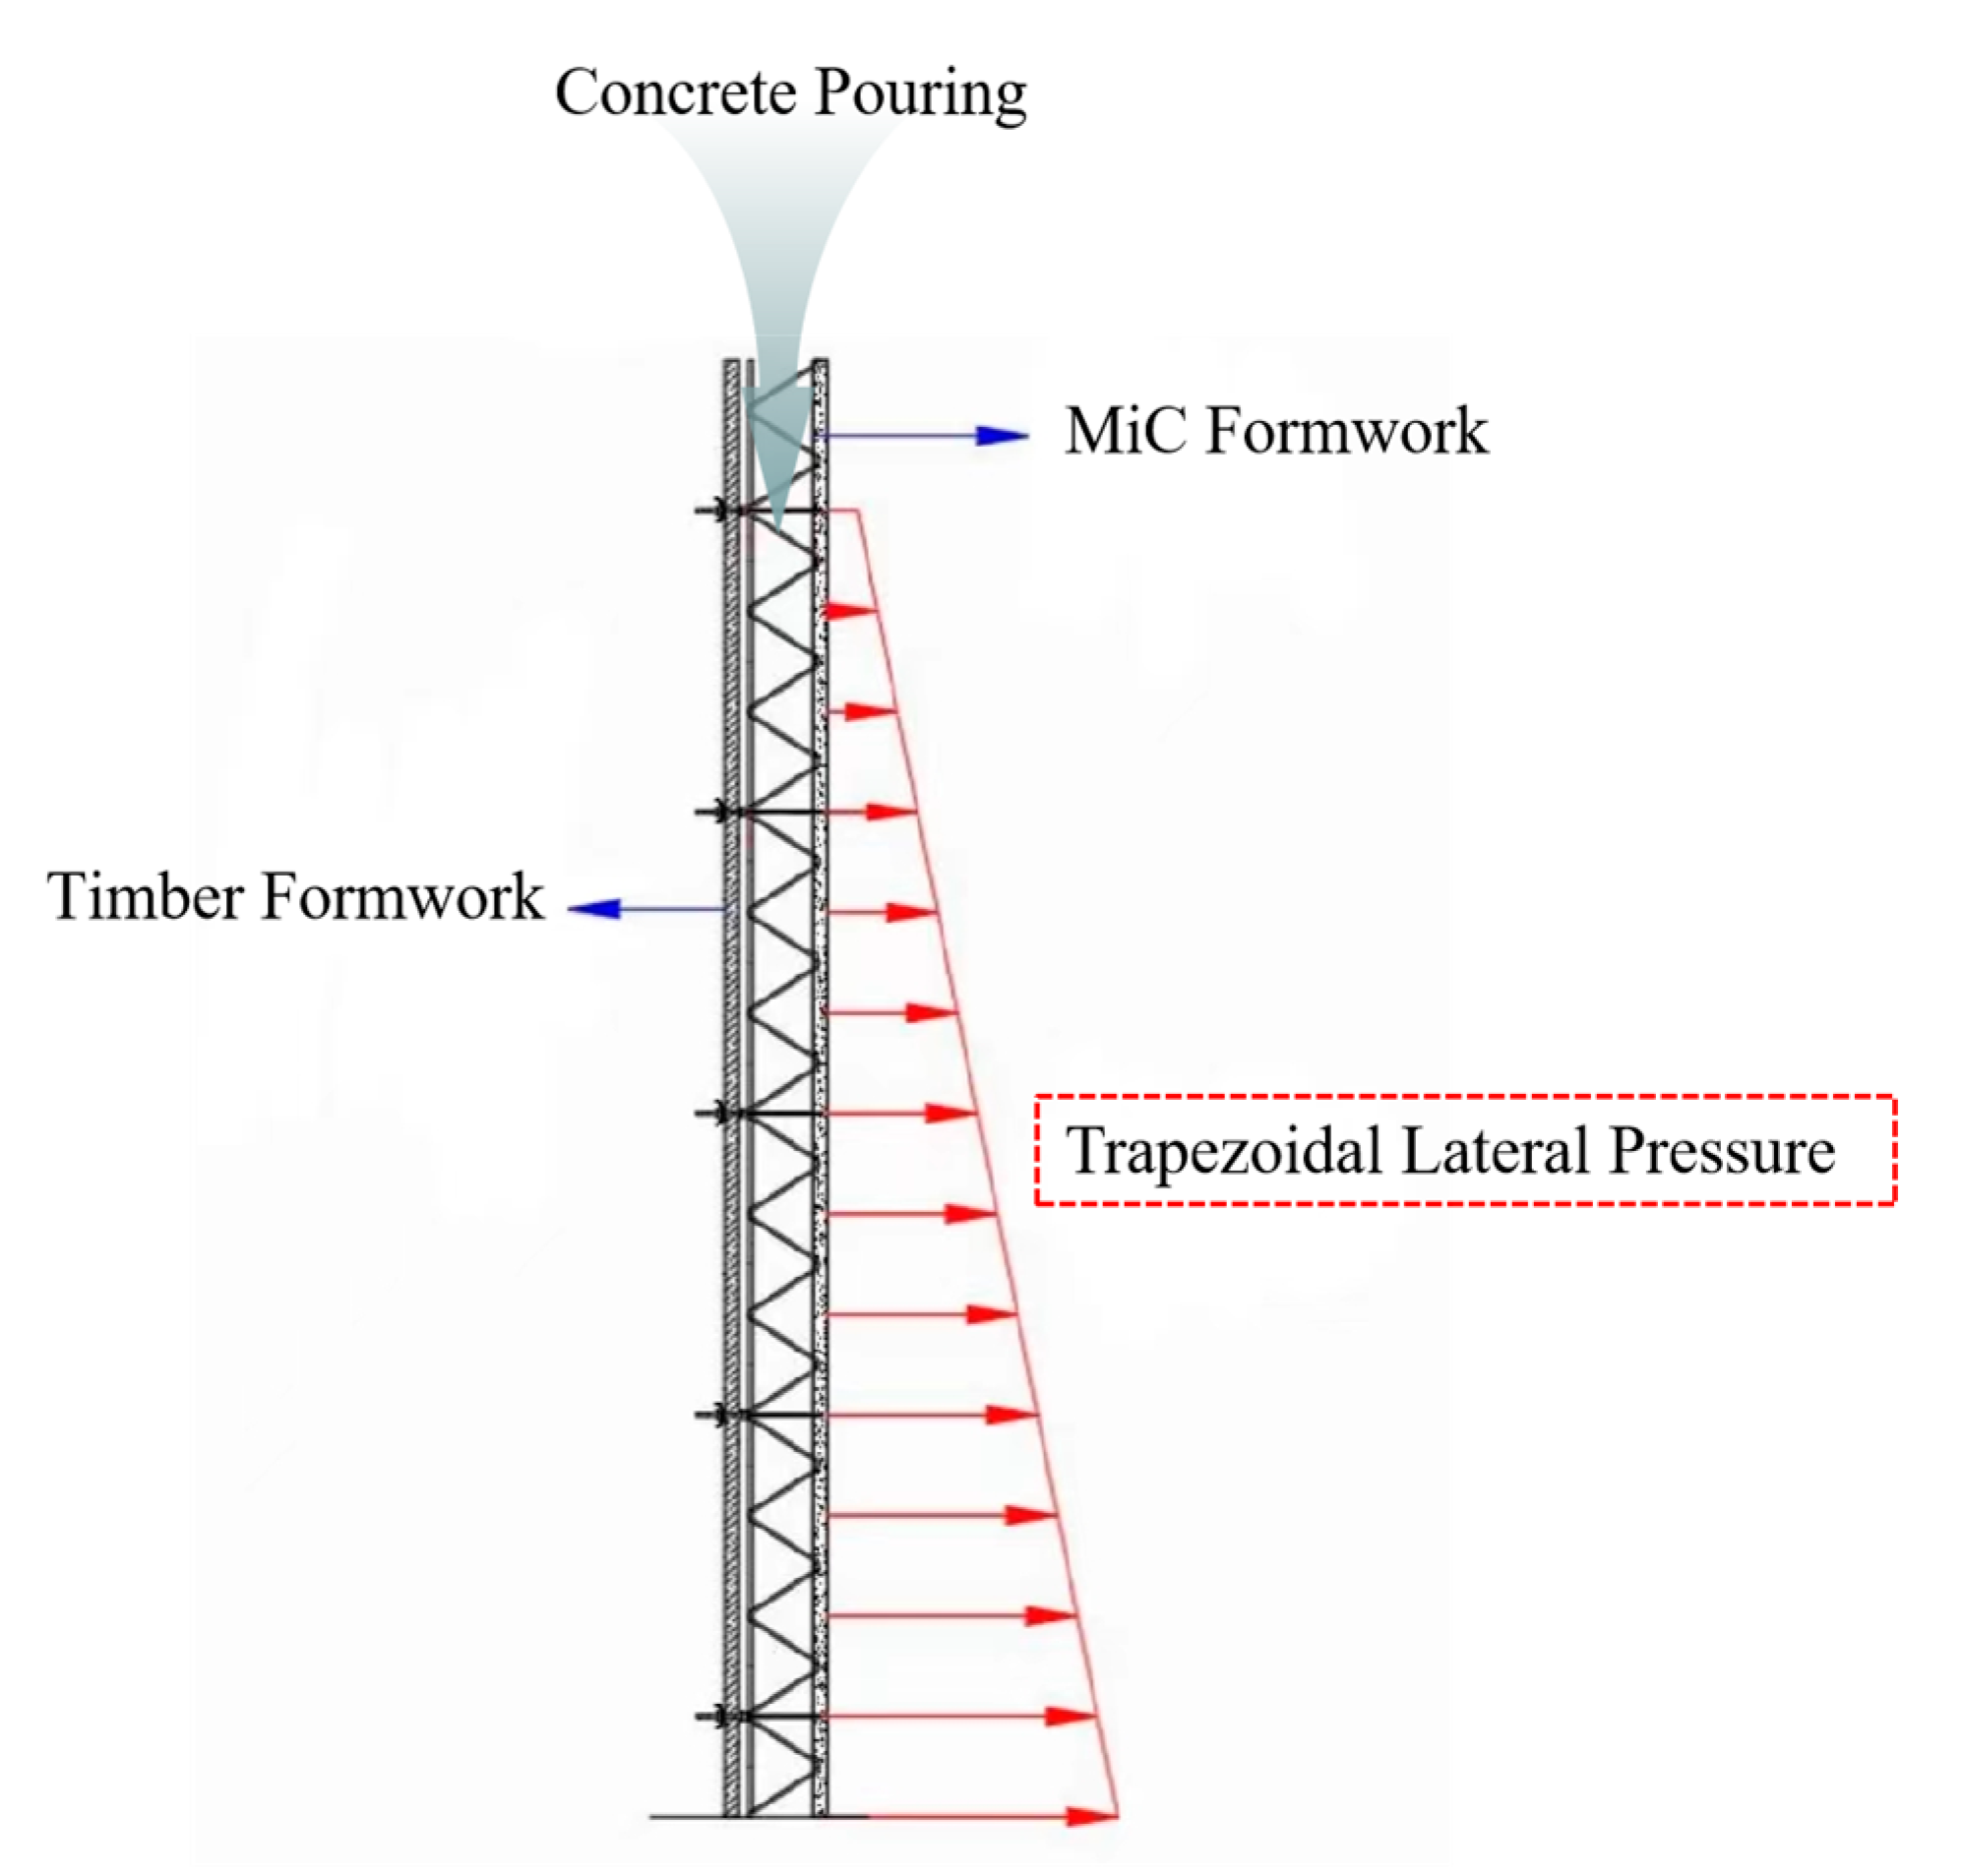
The lateral pressure generated by concrete pouring was simplified by considering only the height of the concrete and its gravity. A trapezoidal distribution of lateral pressure along the vertical direction was obtained, which gradually increased from top to bottom [27], as shown in Figure 6. To simulate the real-life stress situation of the MiC formwork, the loading scheme was designed as a graded partition loading.
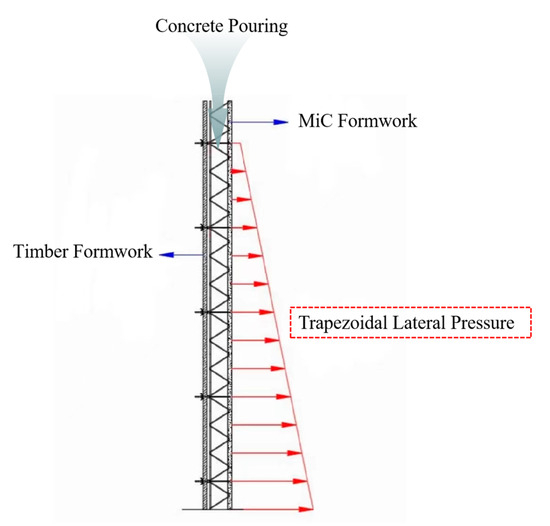
Figure 6.
Actual force diagram.
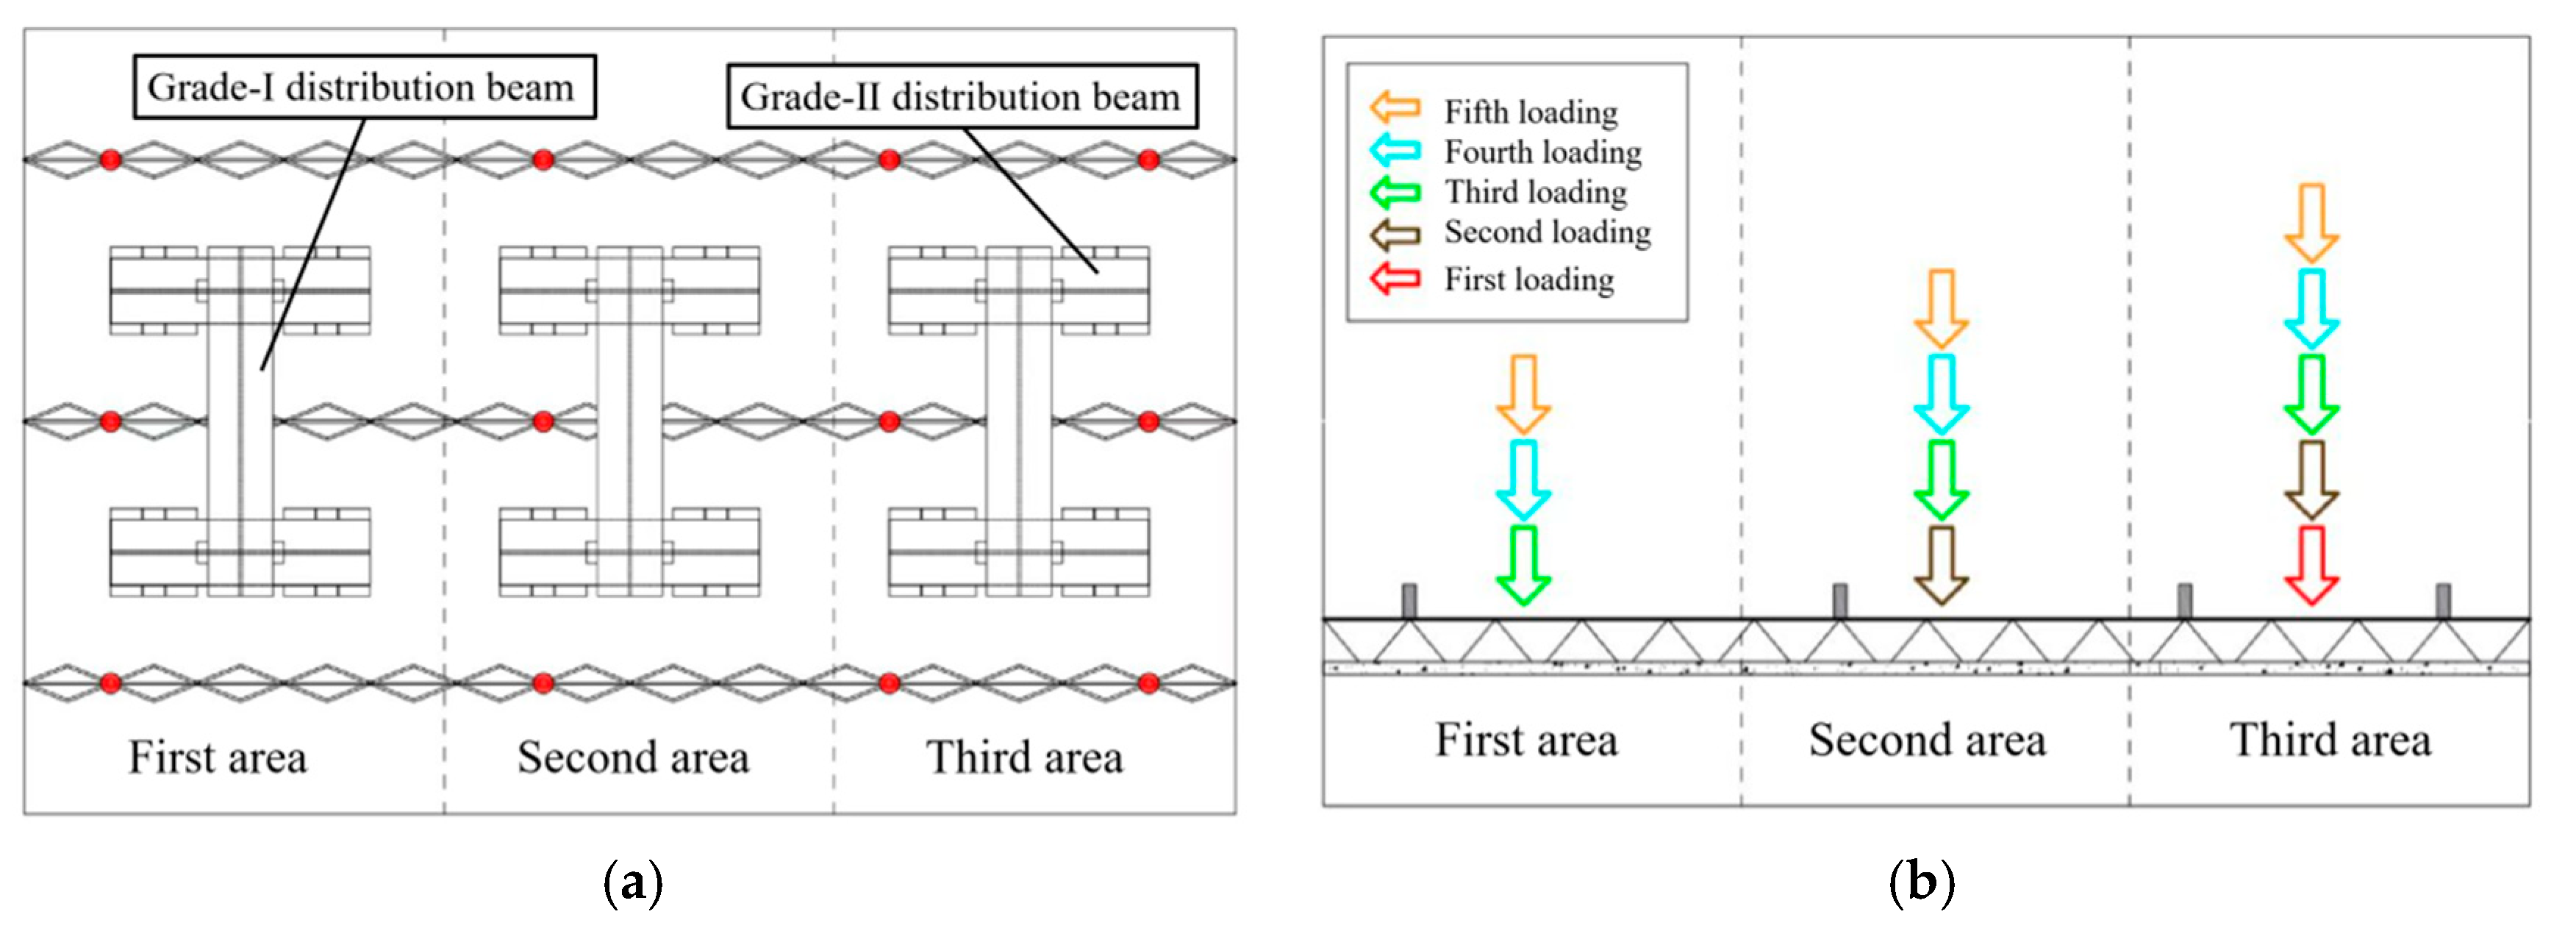
The stress surface of the specimen was divided into three regions. As shown in Figure 7, the load was first applied to the third region and then incrementally to the second and first regions. When all regions were fully loaded, the full-area loading was carried out. The designed graded load value was 10 kN, loaded by region, and the loading time was 2~3 min. Each level of loading finished after holding the load for 3~5 min. The loading ended when the specimen was damaged or had the characteristics of damage precursors.
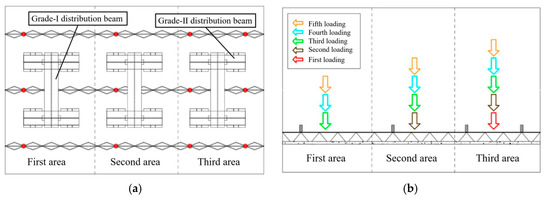
Figure 7.
A graded and partitioned loading method. (a) Partitioned loading; (b) graded loading.
2.4. Measuring Point Arrangement
The measurement contents of this test mainly included the load, span deflection of the adjacent joist tendons, concrete strain, and the crack width. The load value was mainly recorded by the synchronized output of the pressure transducer. The deflection and concrete strain were measured using a displacement meter and a strain gauge, respectively. The load, deflection, and strain were connected to the static strain tester using full bridge, half bridge, and one-quarter bridge wiring, respectively. The corresponding data on the measuring point positions were obtained through the signals transmitted to the computer. A marker pen was used to depict the location, distribution, and morphology of the cracks during the test, while a crack viewer was used to measure the crack width. The corresponding load values were also recorded at the same time.
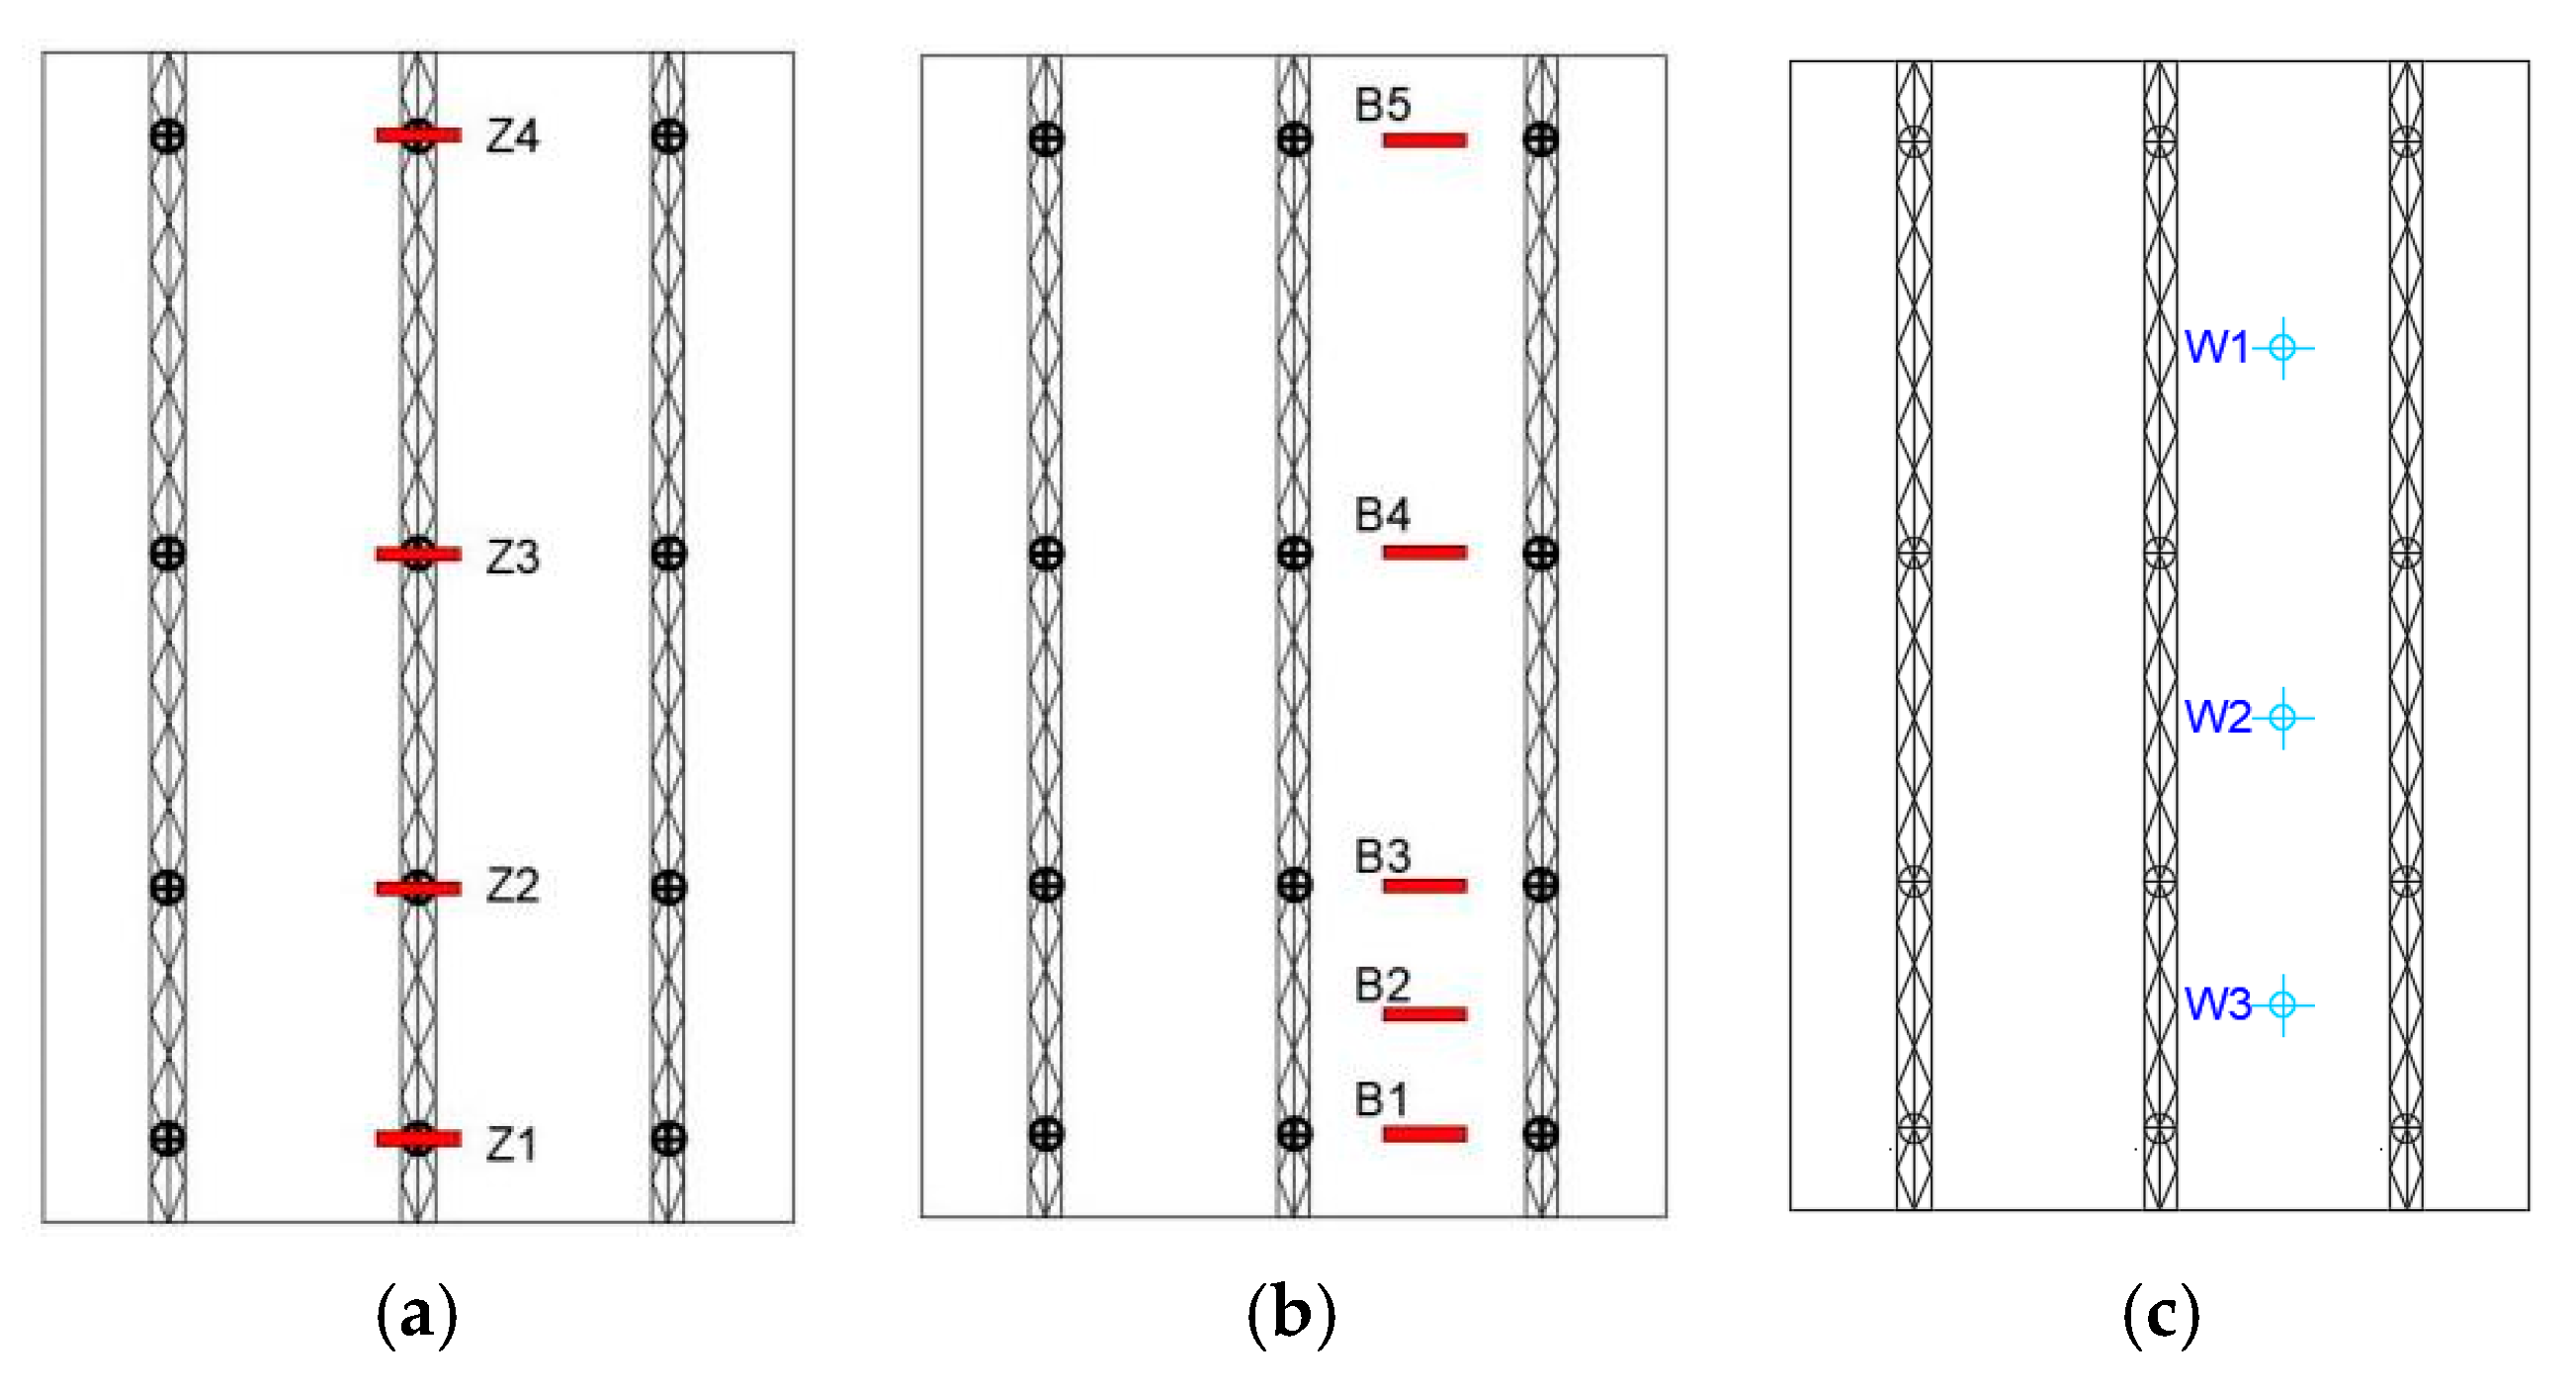
For the convenience of description, the formwork surface on the exposed side of the joist tendons is specified as the front side, and the opposite is called the back side. Figure 8 shows the location of the measurement points. The strain measurement points (Z1~Z4) were arranged below the four lifting points of the joist tendons in the span of the front side of the specimen. On the back side, the strain measurement points (B1~B5) were arranged in the middle of the adjacent joist span. The displacement measurement points (W1~W3) were arranged in the middle of the adjacent tie members.
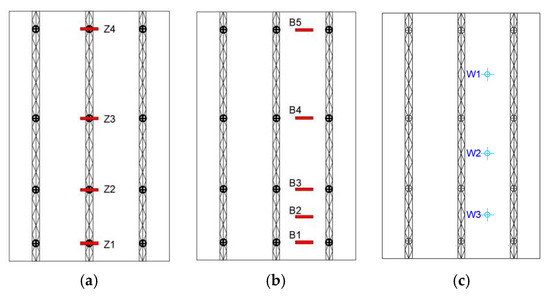
Figure 8.
Measuring point arrangement. (a) Z1~Z4; (b) B1~B5; (c) W1~W3.
3. Test Results and Analysis
3.1. Test Phenomenon
At the beginning of loading, the test phenomena for the three formworks were the same. All of them were in the elastic stage at first. With the increase in loading, cracks were gradually generated, extended, and widened, while the deflection gradually increased.
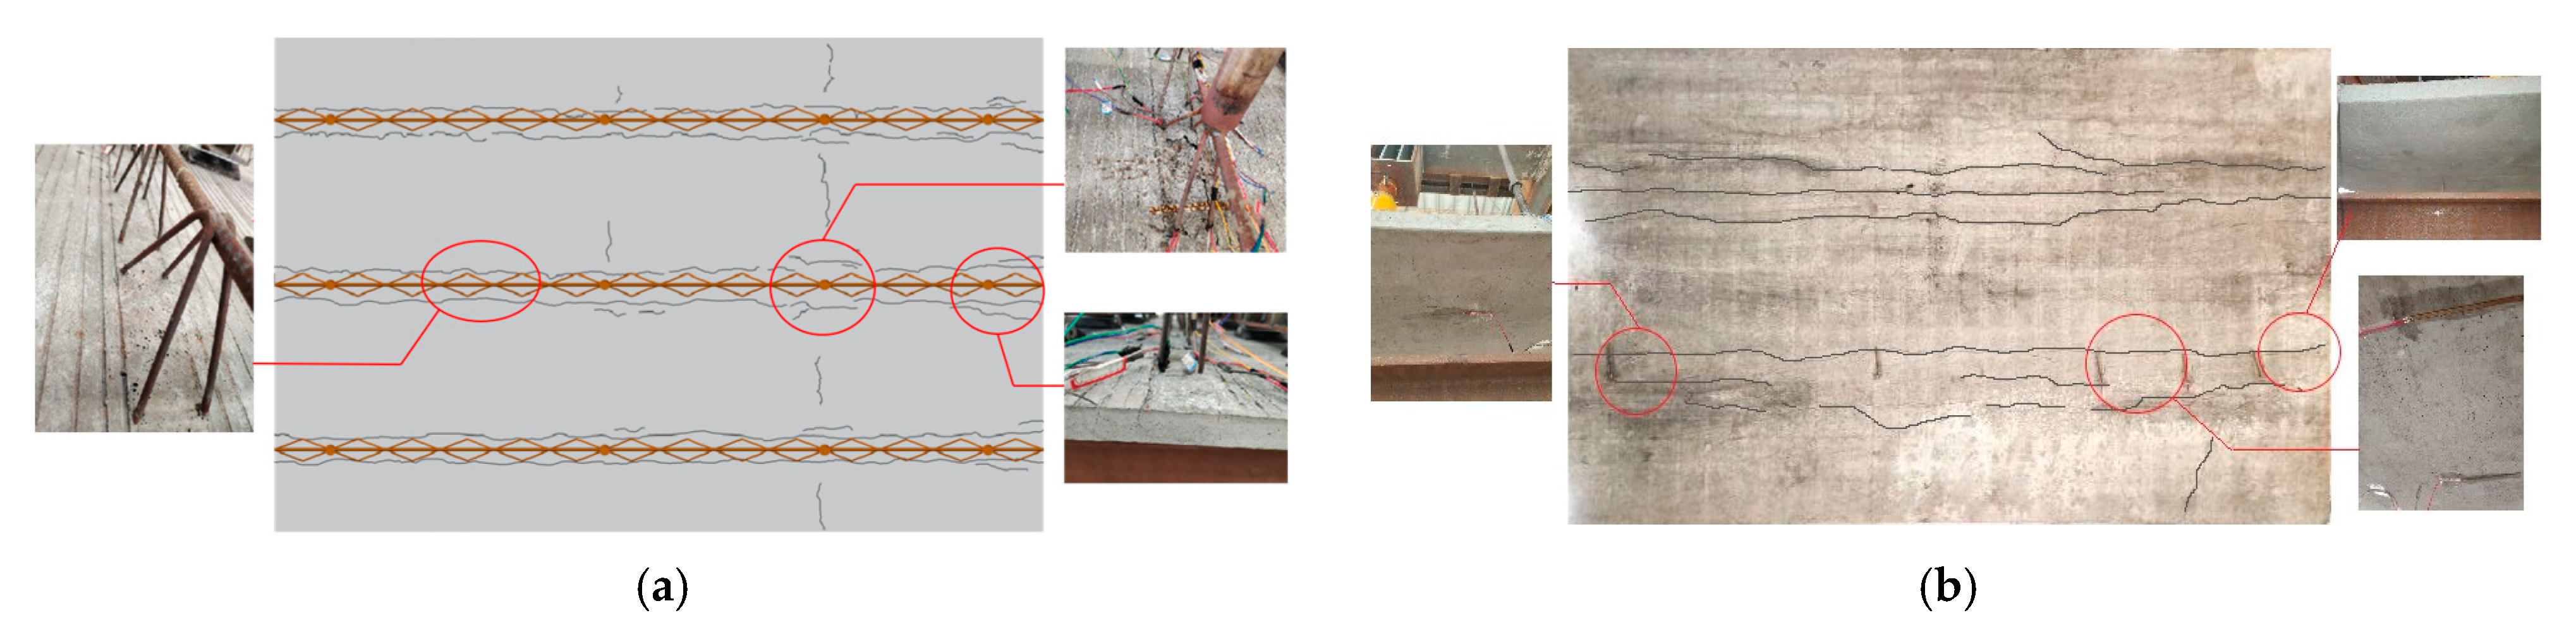
Specimen N60 was a formwork with C60 concrete. During the second stage of loading (20 kN in the third area and 10 kN in the second area), minor cracks (17.76 kN) began to develop on the front and back of the third area. The crack width gradually increased and extended as the load increased. During the third stage of loading (30 kN in the third region, 20 kN in the second region, and 10 kN in the first region), the crack in the middle of the front side extended vertically to half of the plate thickness, and two main cracks appeared on the back side. The specimen entered the plastic damage stage. During the fourth stage of loading (40 kN in the third region, 30 kN in the second region, and 20 kN in the first region), the crack width further increased and extended to the top of the slab. The formwork showed obvious deformation. In the fifth stage of loading (50 kN in the third area, 40 kN in the second area, and 30 kN in the first area), the surface concrete was crushed, and the truss bars were pulled out. Then, the loading was terminated (115.49 kN). At this time, the deformation of the formwork was observed in the shape of a “W”. The maximum crack width of the front side was 2.51 mm, and the maximum crack width of the back side was 0.76 mm. The damage pattern and crack distribution of the loaded N60 specimen are shown in Figure 9.
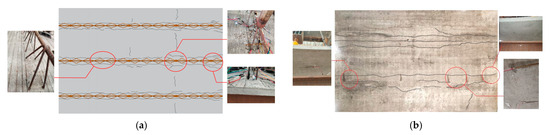
Figure 9.
Failure mode and crack distribution of N60. (a) Front cracks; (b) back cracks.
Specimen N40 was a C40 concrete formwork. During the second stage of loading, cracks (11.13 kN) started to develop at the front and back of the third area. As the load increased, the crack width gradually increased and extended. In the third stage of loading, the cracks developed vertically up to half of the slab thickness on the front side and two-thirds of the slab thickness on the back side. The specimen entered the plastic damage stage. In the process of the fourth stage of loading, the surface concrete was crushed, and the truss bars were pulled out. At the end of loading (74.45 kN), the maximum crack width at the front side was 3.2 mm, and that of the back side was 1.1 mm. The N40 specimen’s loading damage pattern and crack distribution are shown in Figure 10.
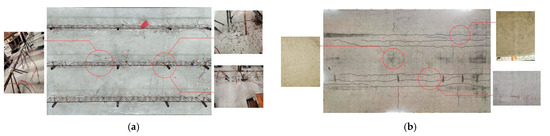
Figure 10.
Failure mode and crack distribution of N40. (a) Front cracks; (b) back cracks.
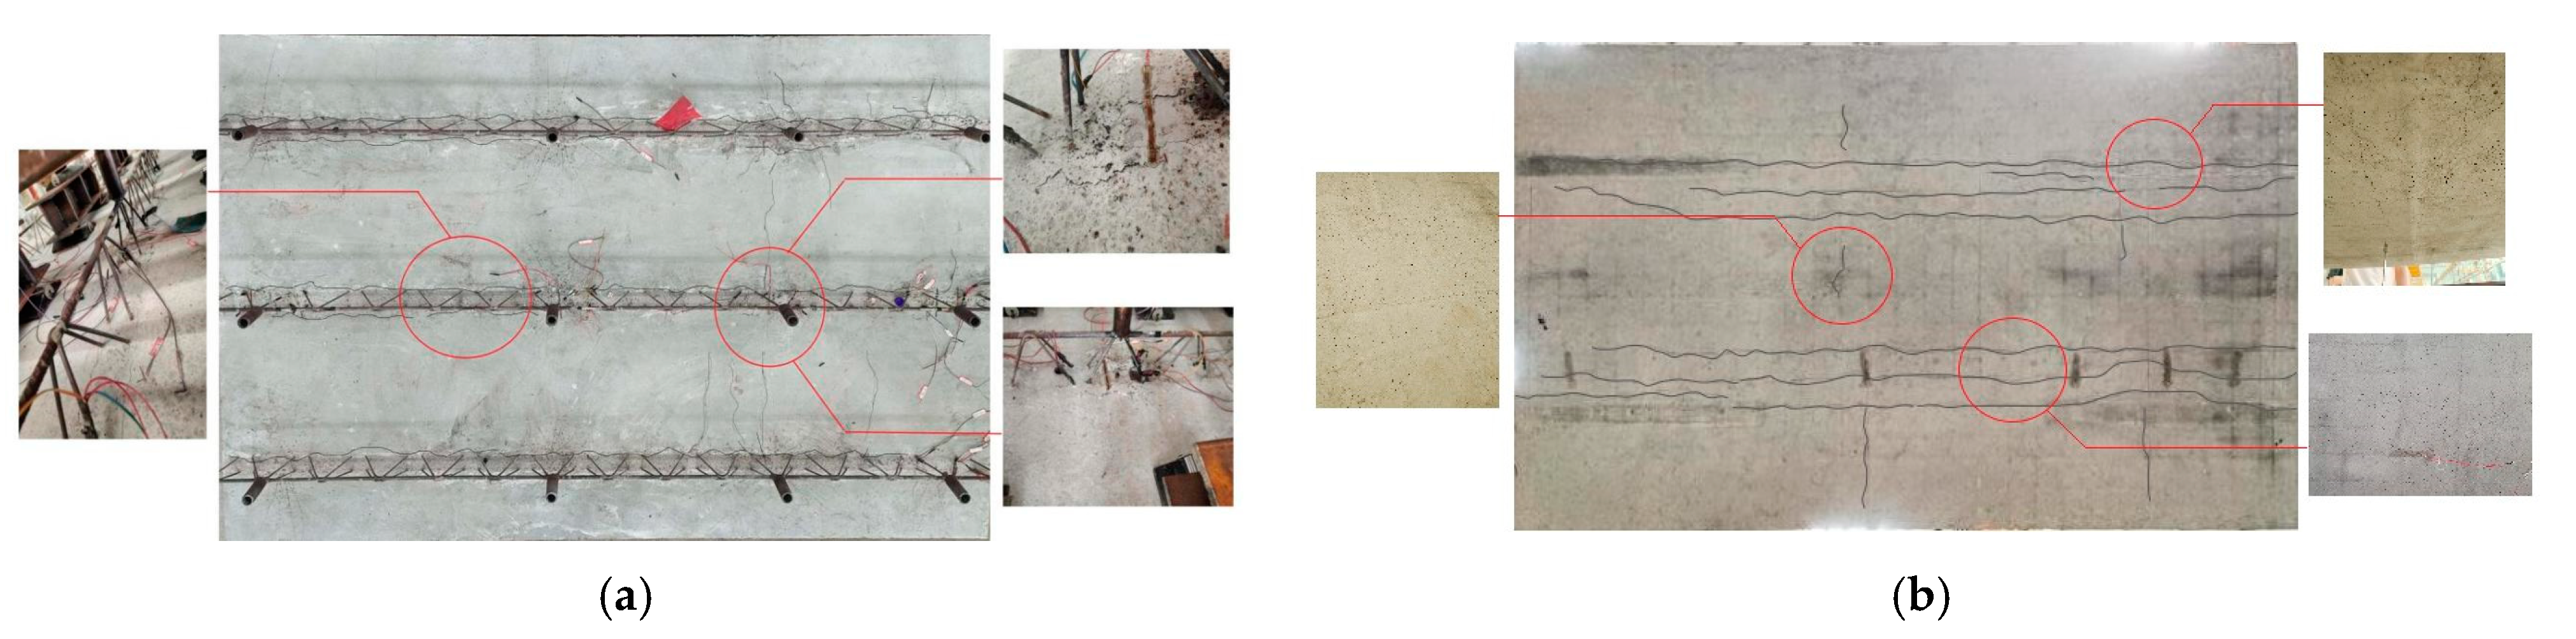
Specimen SF60 was a C60 concrete formwork with additional steel fibers. During the second stage of loading, cracks were produced and extended (26.12 kN) on both the front and back sides. In the third stage of loading, the cracks continued to extend, with the original defective cracks running through the front side. The cracks further increased in width during the fourth stage of loading. The front crack completely penetrated along the vertical direction, while the back crack penetrated longitudinally. The obvious deformation of the formwork indicated that the specimen had completely entered the plastic deformation stage. Apparent deformation of the formwork appeared during the fifth stage of loading. The loading was terminated (122.06 kN) when the deflection value and seam width reached the limit of the code-bearing capacity. It is noteworthy that the crack width at the back of SF60 was small, but the number of fine cracks was large. At this time, the maximum crack width of the front side of the formwork was measured as 1.86 mm, and the maximum crack width of the back side was 0.78 mm. The damage pattern and crack distribution of the loaded SF60 specimen are shown in Figure 11.
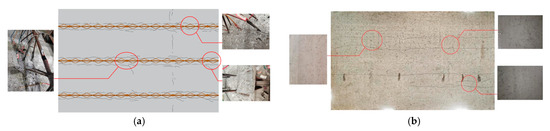
Figure 11.
Failure mode and crack distribution of SF60. (a) Front cracks; (b) back cracks.
All three formworks underwent the elastic stage, the crack development stage, and the plastic damage stage. The cracks were first produced in the third area, then gradually extended and widened to the edge of the formwork along the vertical direction with increasing loads. The cracks on the front side of the wall slab were mainly distributed under the joist tendons. The back cracks were mainly distributed in the middle of the span of the adjacent truss tendons. Among them, the surface cracks of SF60 were small in width but large in number. The damage of the three specimens was basically characterized by crushed concrete and extracted reinforcement, of which SF60 lacked specification deflection and seam width. This shows that steel fiber can improve the stiffness and crack resistance of the specimens.
3.2. Load–Strain Curve
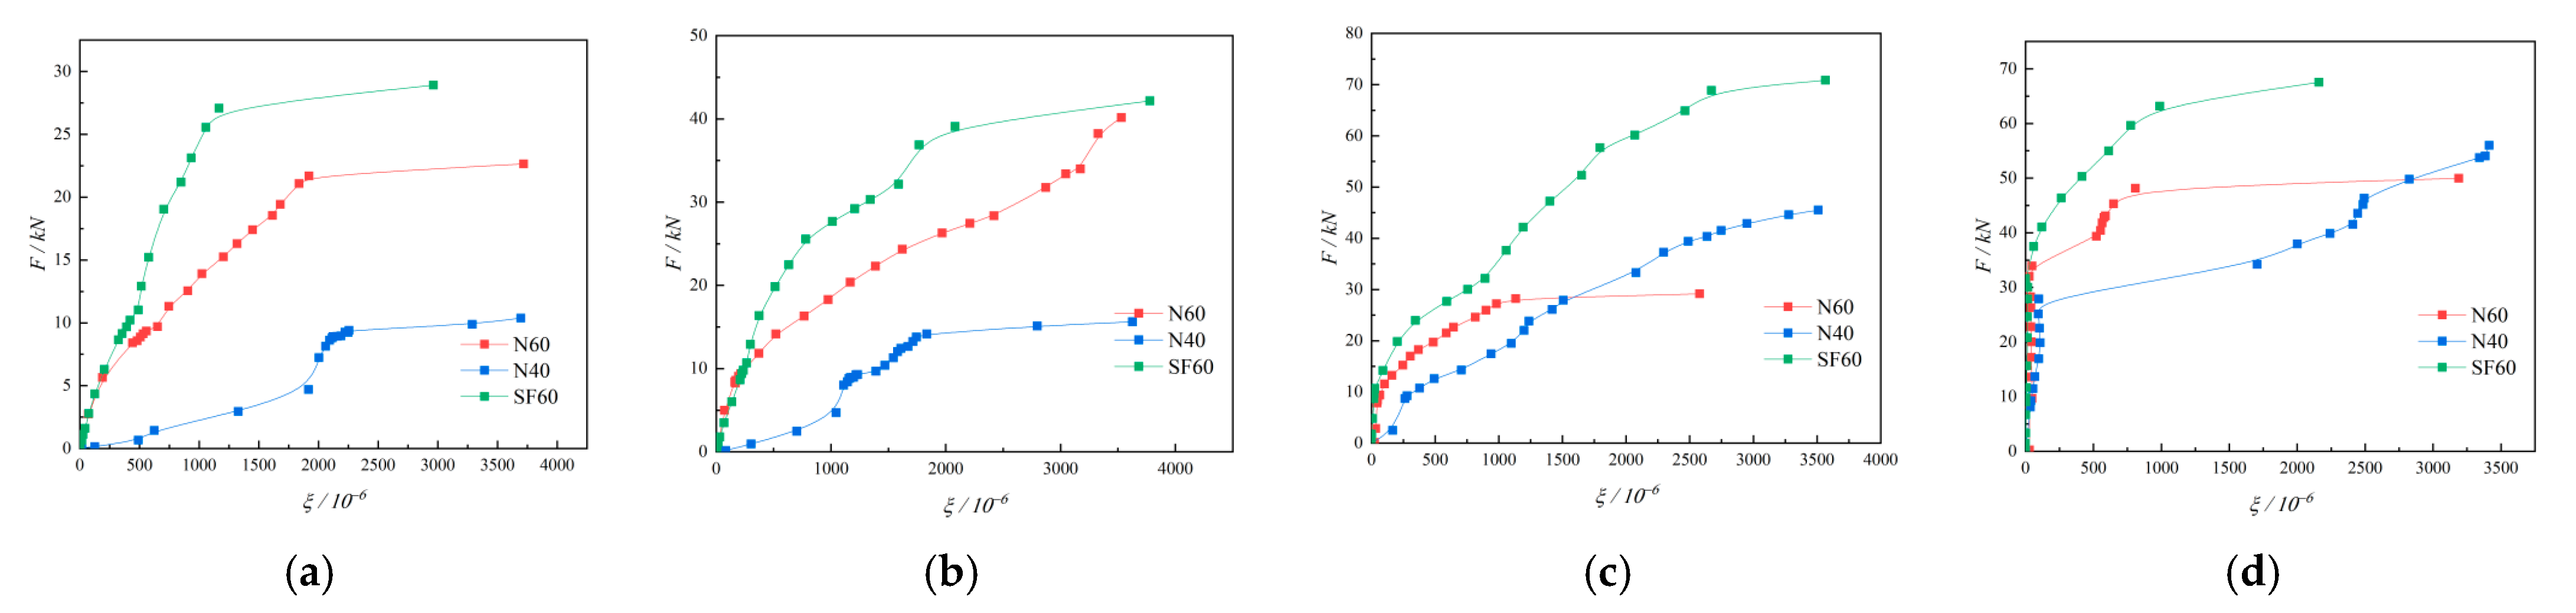
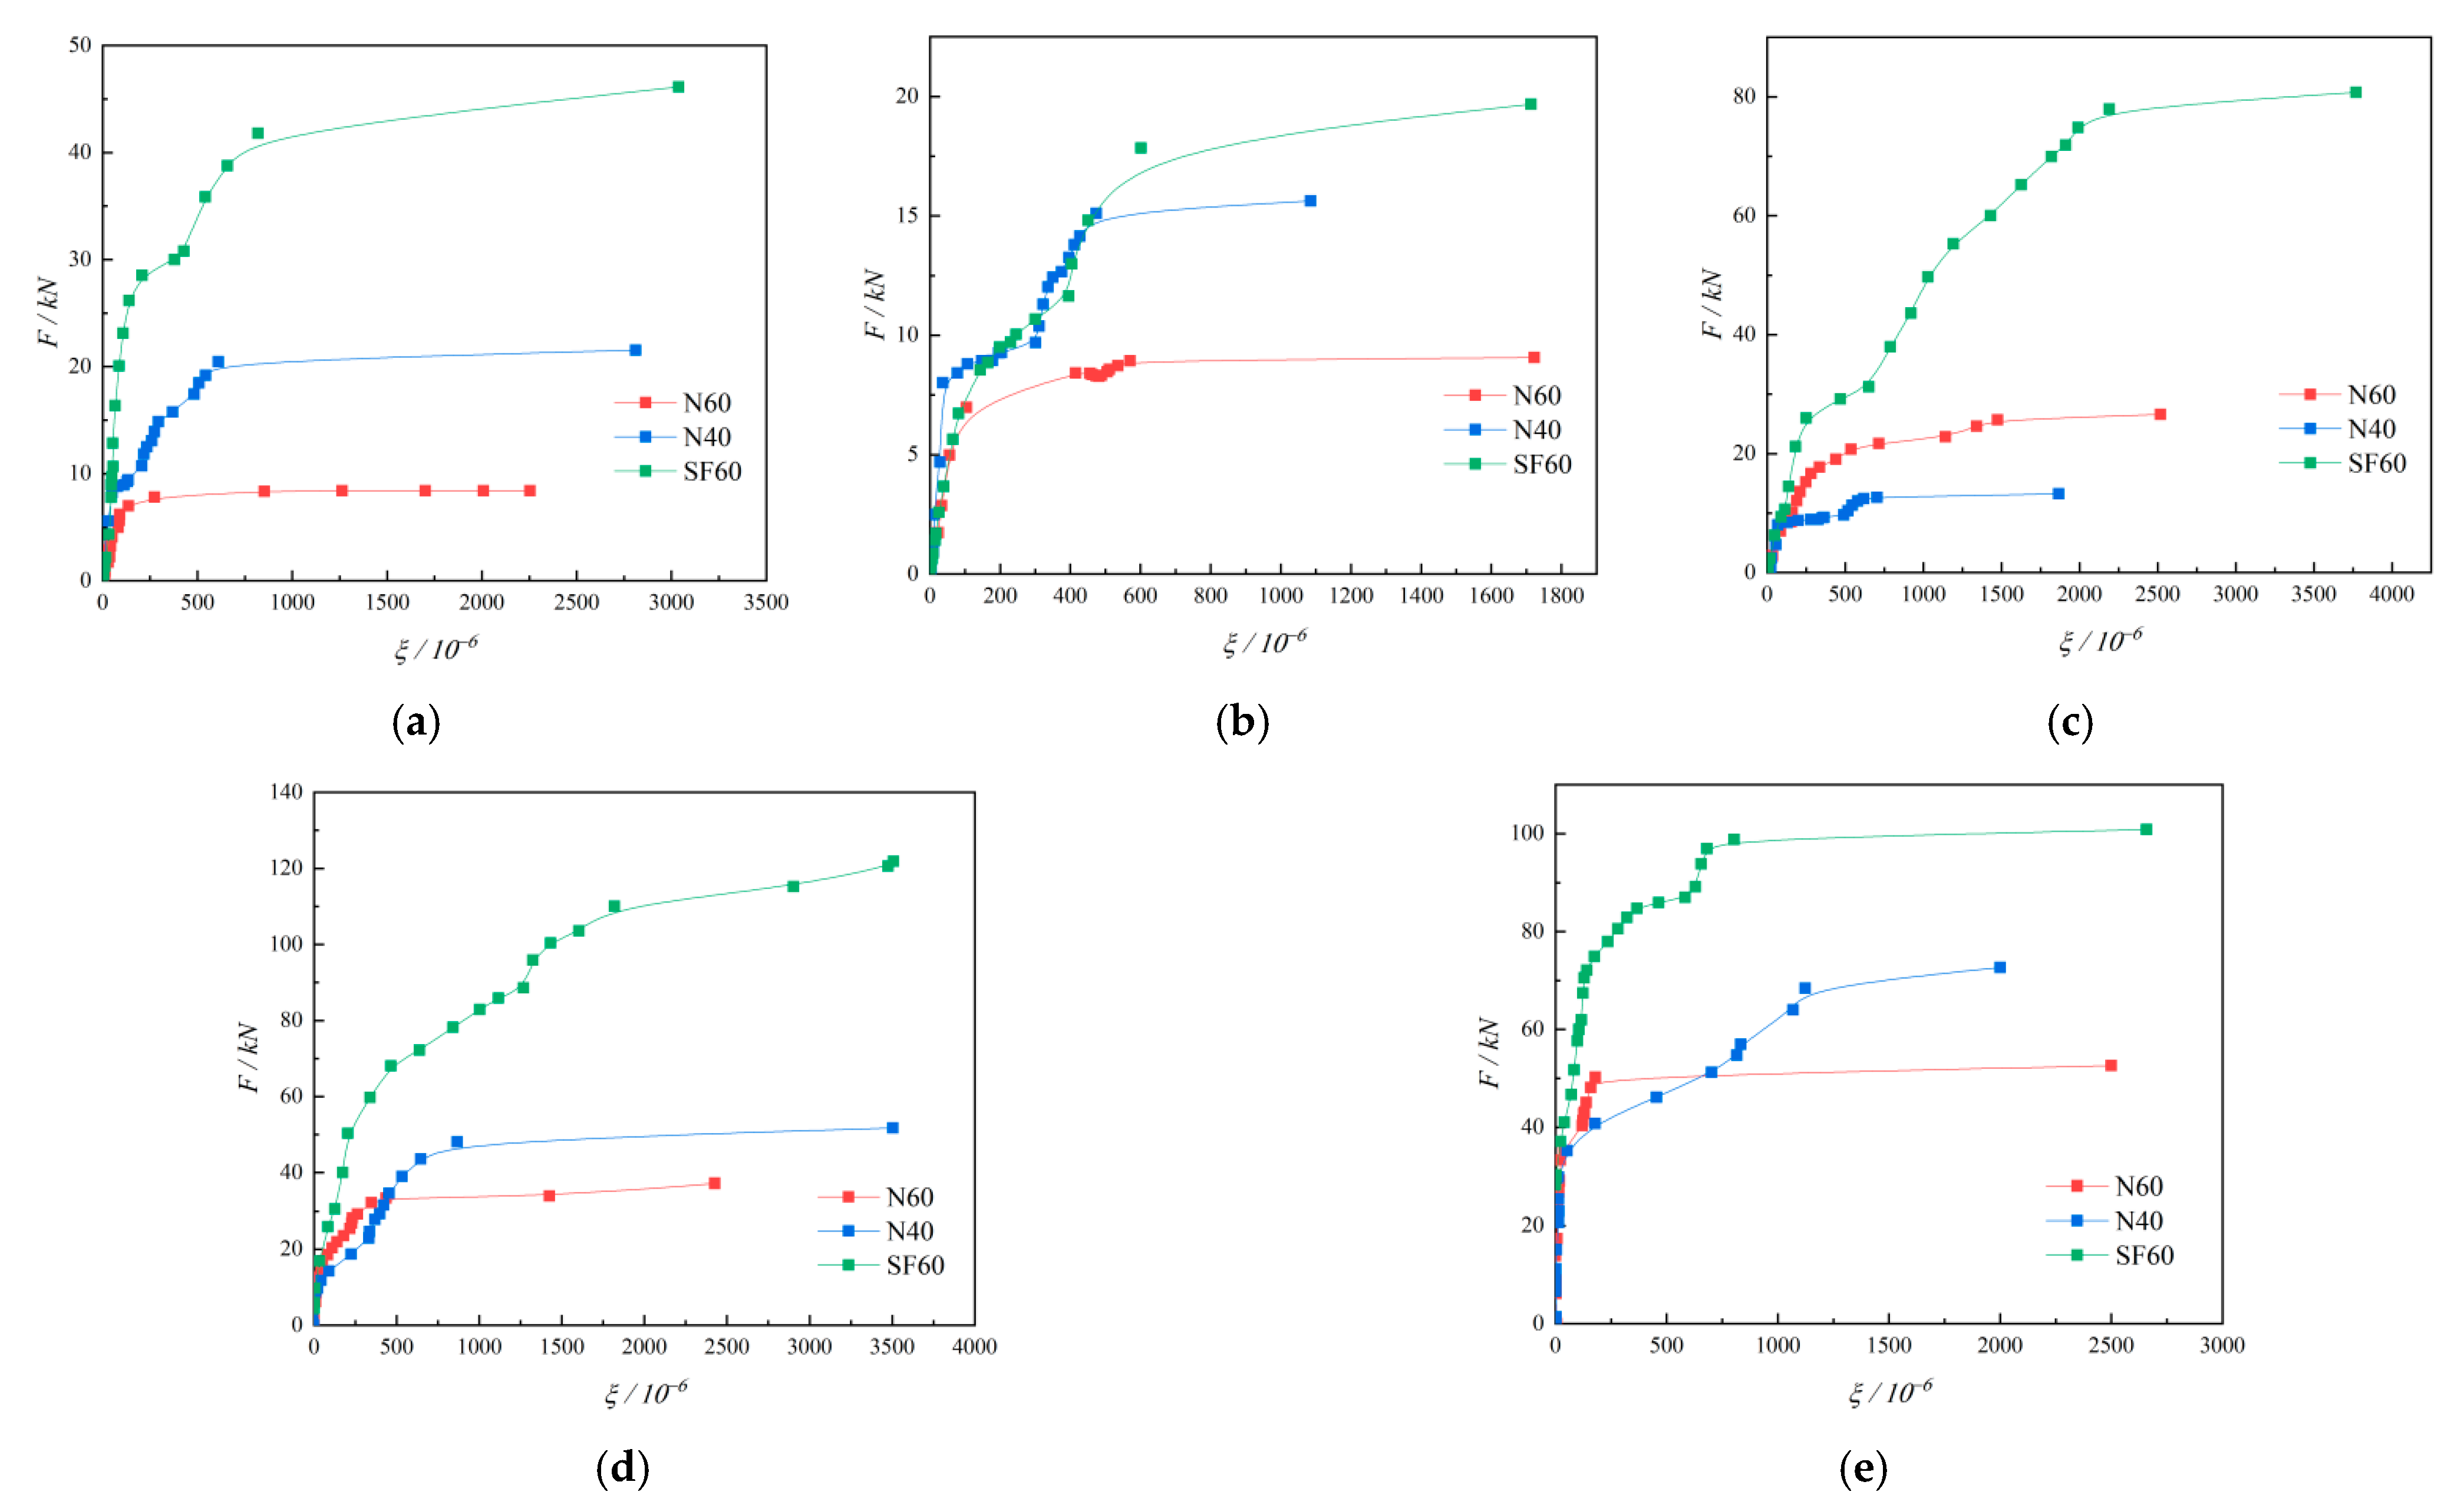
The load–strain curves of the front and back concrete measured in the test are shown in Figure 12 and Figure 13. The curves of each specimen had similar change patterns. At the beginning of loading, the concrete strain changed nearly linearly, indicating that the specimen was in the elastic stage. With the increasing load, the slope of the curve gradually decreased, and the strain growth rate increased, illustrating that the specimen entered the plastic stage. The final strain reached the peak concrete strain, which means the specimen entered the damage stage. Cracks were also formed and extended gradually.
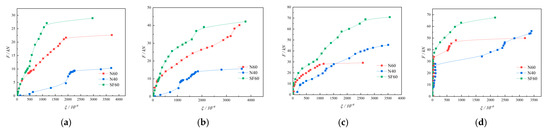
Figure 12.
Load–strain curves of concrete in the front of the specimens. (a) Z1; (b) Z2; (c) Z3; (d) Z4.
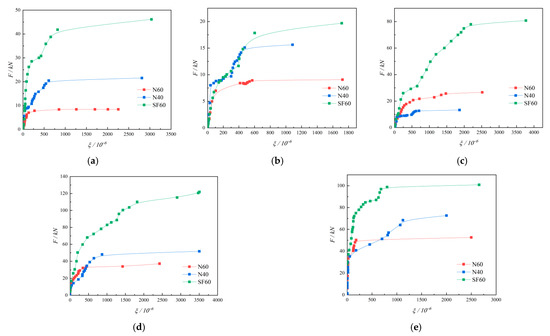
Figure 13.
Load–strain curves of concrete at the back of the specimens. (a) B1; (b) B2; (c) B3; (d) B4; (e) B5.
Comparing the load–strain curves of each specimen, it is clear that the order of concrete entering the plastic stage and damage stage of each specimen was roughly N40, N60, and SF60, indicating that the overall strength of the MiC formworks made of C40 grade concrete was lower. The peak and slope of the SF60 strain curve were higher than those of N60, indicating that the addition of steel fibers can effectively enhance the tensile capacity of the specimens. This enhances the overall strength of the specimens and delays the cracking and damage of the concrete.
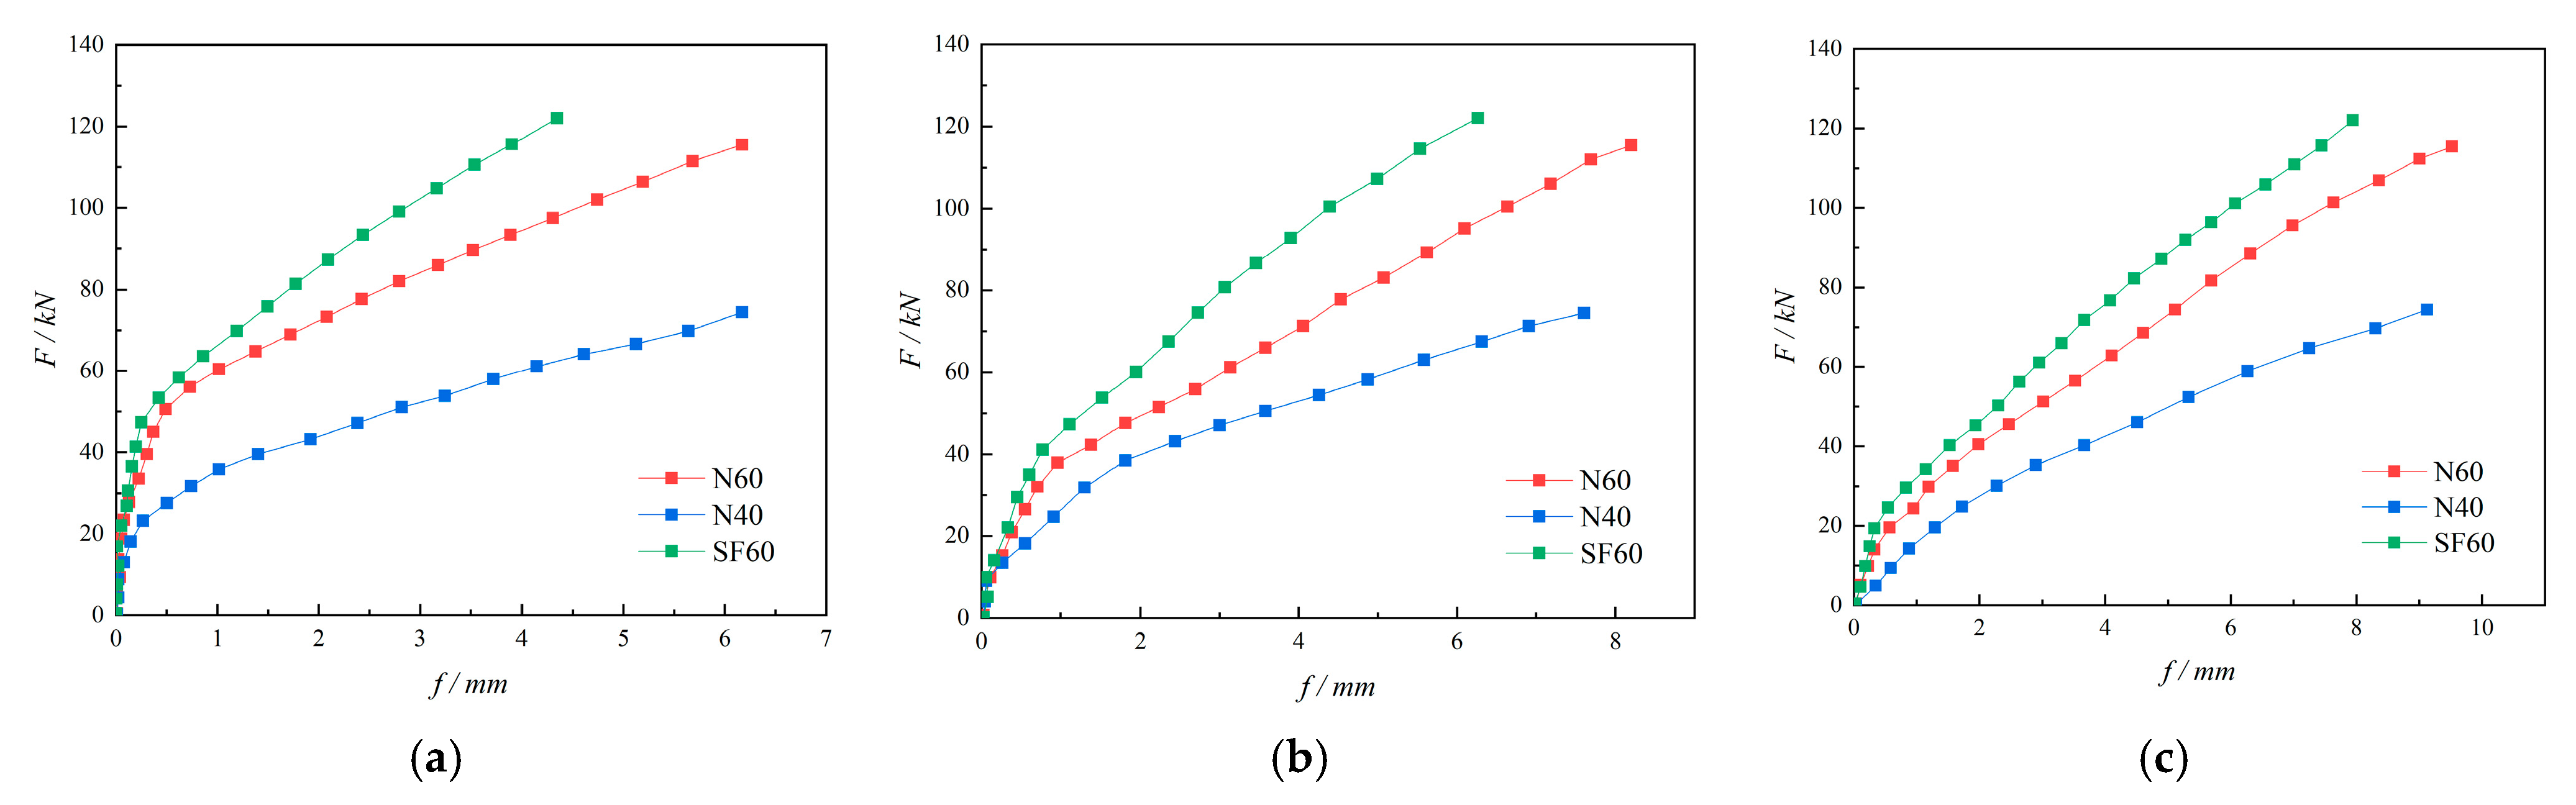
3.3. Load–Deflection Curve
Figure 14 shows the load–deflection curves of each specimen. It can be seen that the specimens underwent two stages, elastic deformation and plastic deformation. The slopes of each deflection curve were N40, N60, and SF60 in order from small to large. The slopes of N60 and FM60 were similar. This means that the stiffness of each specimen was SF60, N60, and N40 in order from weak to strong.
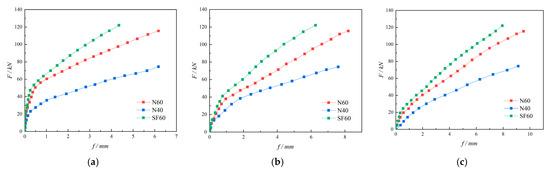
Figure 14.
Load–deflection curves of specimens. (a) W1; (b) W2; (c) W3.
The specimen breaking load and breaking deflection are shown in Table 4. The damage deflection of N40 and N60 was close; yet, the damage load of N40 was reduced by 35.53% compared with N60. This indicates that increasing the concrete strength can improve the bearing capacity of the specimens but not the resistance to deformation of the specimens. SF60 had a 16.58% reduction in the damage deflection compared with N60, and the damage load was slightly higher than that of N60, indicating that the incorporation of steel fibers can slightly improve the resistance to deformation but cannot improve the load-bearing capacity of the specimens.
Table 4.
Failure deflection and corresponding load of each specimen.
3.4. Bearing Capacity Analysis
The characteristic loads of each specimen measured by the test are shown in Table 5, with N60 as the standard specimen (Pcr = 17.76 kN, Pu = 115.49 kN). (1) The Pcr of N40 was 11.13 kN, and the Pu was 74.45 kN. These values were 37.33% and 35.54% less than N60, respectively, indicating that increasing the concrete strength can significantly improve the crack resistance and load-carrying capacity of the MiC formworks. (2) The Pcr of SF60 was 26.12 kN, and the Pu was 122.06 kN, which increased by 47.07% and 5.69%, respectively, compared with N60. This means that the addition of steel fibers can significantly improve the crack resistance of MiC formworks, but the increase in its ultimate load-carrying capacity is not great.
Table 5.
The characteristic load of each specimen.
4. Numerical Simulation
In modern research on structural engineering, finite element analyses (FEA) are essential for supplementing experimental research in providing insights into structural behavior [28]. To verify the reliability of the tests and to further explore the effects of different material components on MiC panels, three specimens were modeled and analyzed using the finite element analysis software ABAQUS 2020.
4.1. Constitutive Relationship of Materials
The concrete plastic damage model was used for both plain concrete material and steel fiber concrete material. The specific parameters are shown in Table 6. Among them, the elastic modulus values of C40 and C60 ordinary concrete were 32,500 MPa and 36,000 MPa, respectively. Their Poisson’s ratio was 0.2. The intrinsic model of steel fiber concrete referred to [29,30]. The modulus of elasticity was calculated as 36,277 MPa, and the Poisson’s ratio was 0.2. The elastic-strengthened bilinear model was used for the steel reinforcement material, with an elastic modulus of 2 × 10⁵ MPa and a Poisson’s ratio of 0.3. The specific parameters of each material are shown in Table 7.
Table 6.
Plastic damage model parameters of concrete materials.
Table 7.
Material constitutive parameters.
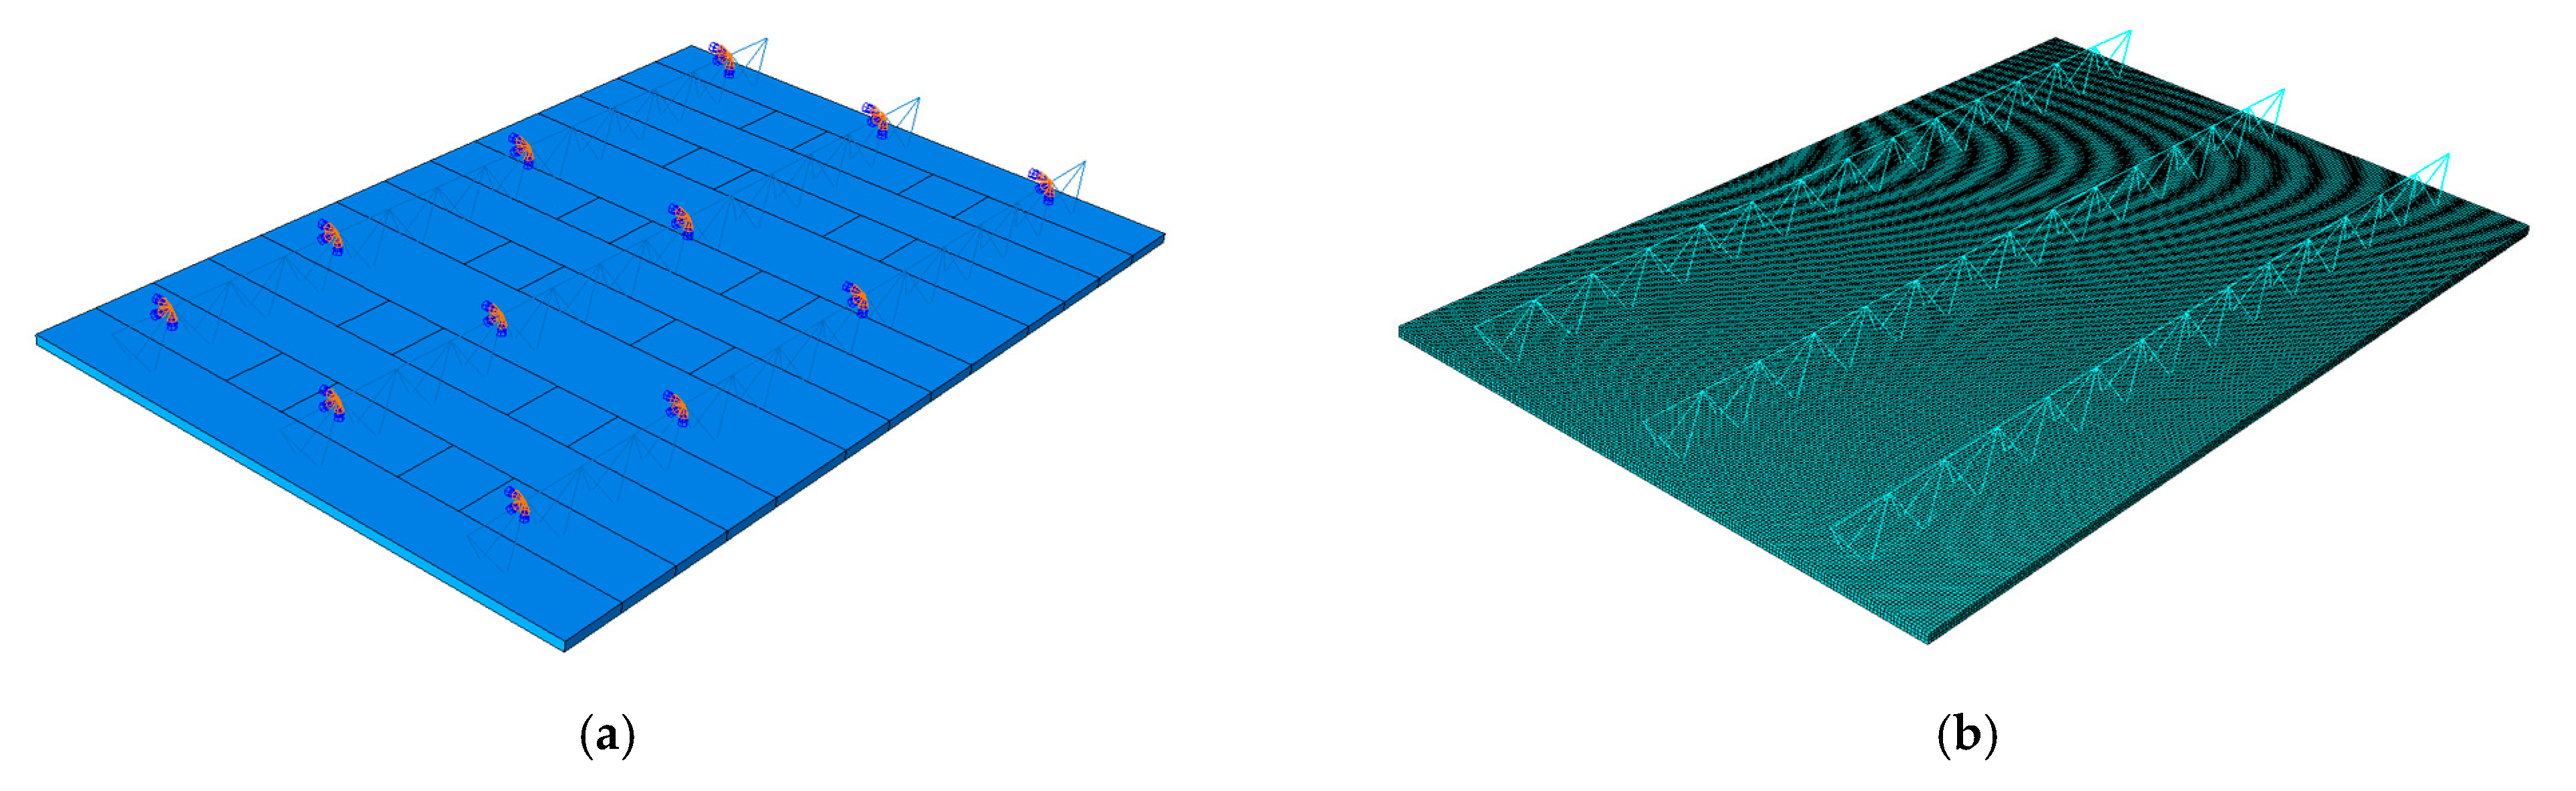
4.2. Model Establishment
The finite element software ABAQUS was used to model and analyze the above three specimens. The concrete slab of each specimen was modeled with C3D8R. The distributed reinforcement and the concrete internal truss reinforcement were all in two-node linear three-dimensional truss cell T3D2. A two-node spatial linear beam cell B31 was used for the concrete external truss reinforcement. To ensure simulation accuracy, the model was structurally meshed. The mesh sizes of the concrete base plate and steel reinforcement were 15 mm and 20 mm, respectively, causing the number of elements of the concrete base plate, distributed steel reinforcement, and truss to be 151,200, 5269, and 2772, respectively.
Without considering the effect of slip between the reinforcement and concrete, the reinforcement and concrete were “embedded” restrained. In the model, the location of the ties was set to “fully fixed”. The model used the pressure control method for the loading process and was consistent with the test loading system (graded zonal loading). The established models are shown in Figure 15.

Figure 15.
Model of each specimen. (a) Specimen model; (b) mesh subdivision.
4.3. Analysis of the Finite Element Results
4.3.1. Deflection Analysis
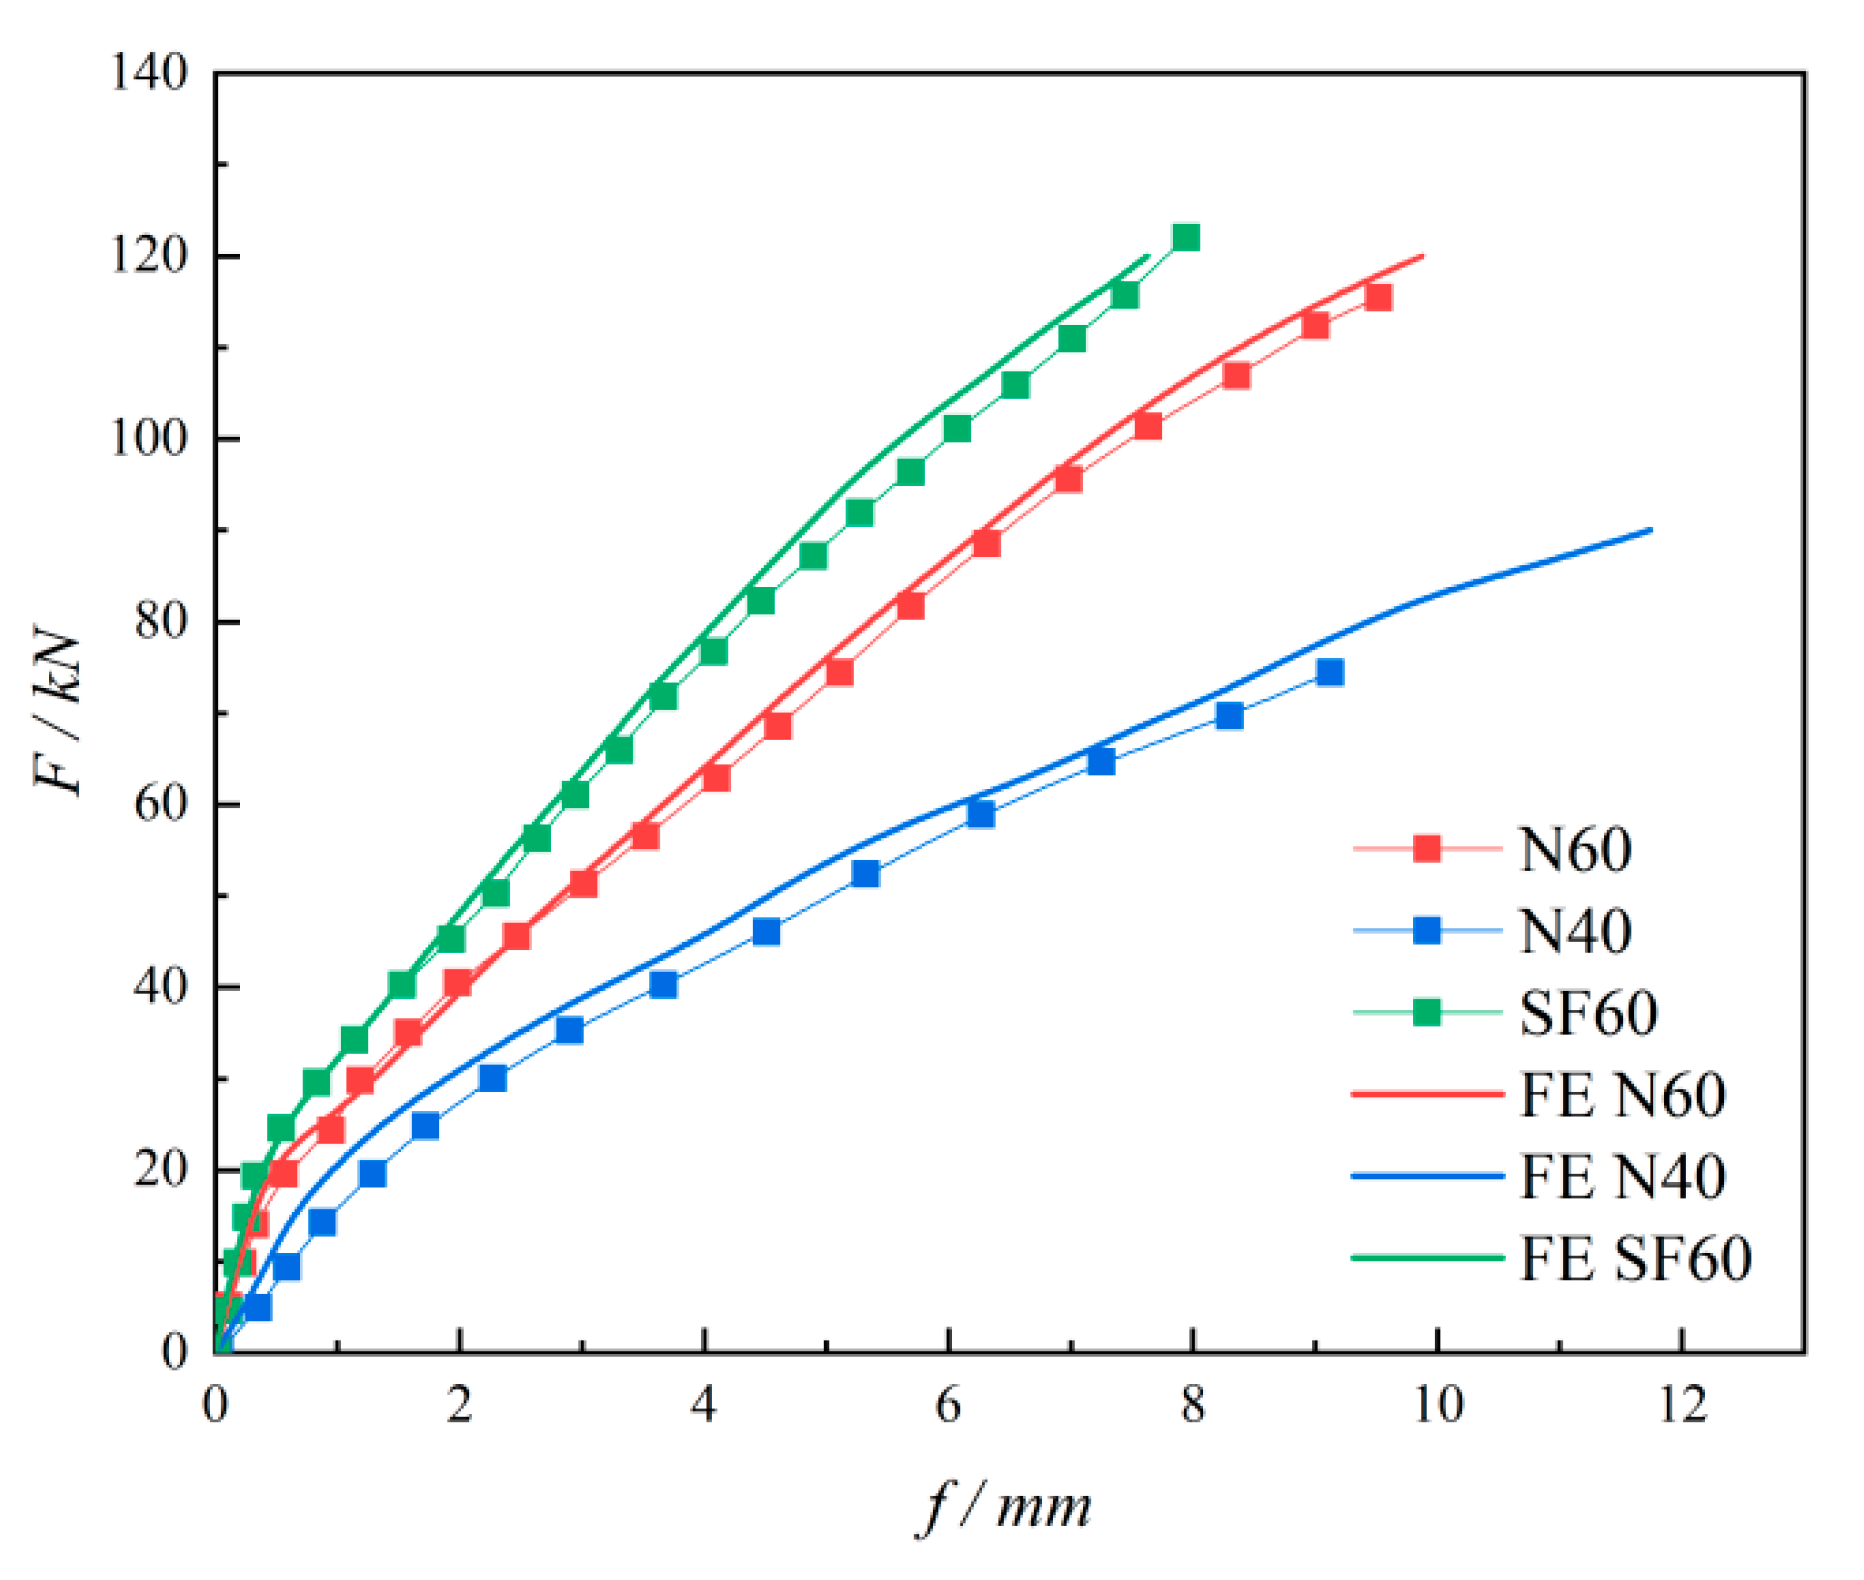
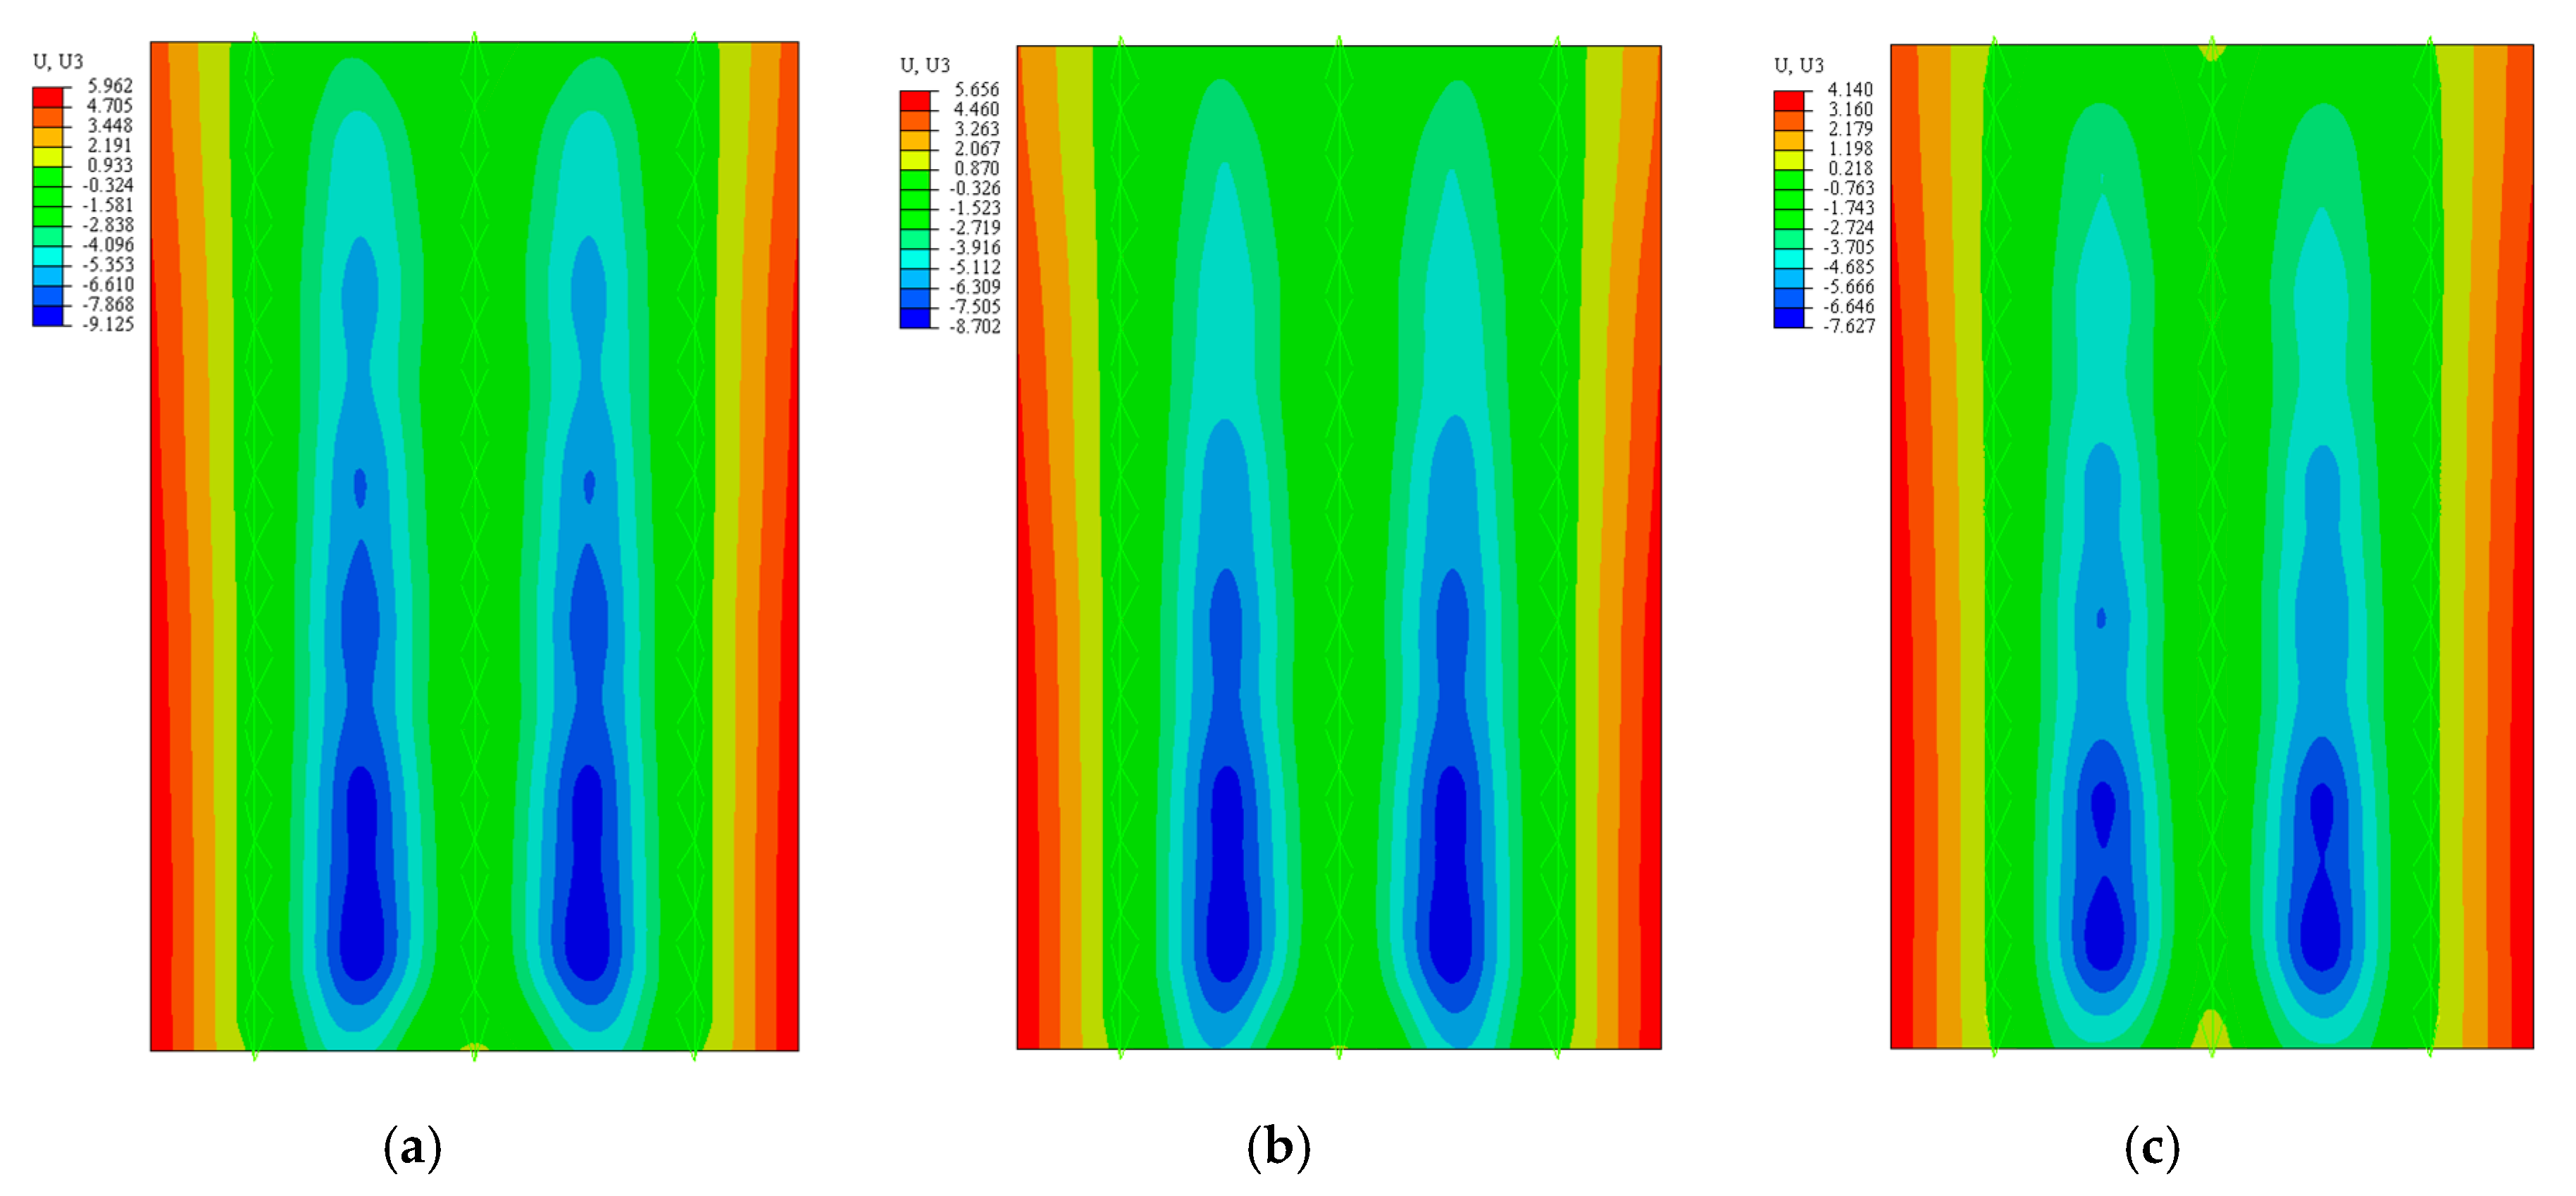
The comparative results of the load–deflection curves obtained using finite element analysis are shown in Figure 16. The finite element analysis results basically matched the test results. Combined with the displacement cloud diagram (Figure 17) and the maximum deflection values (Table 8) of each specimen under the maximum load, the following results are observed: (1) The maximum displacement in the simulation occurred in the third area of the slab surface, distributed on both sides of the middle truss reinforcement, which corresponded to the location of the W3 displacement measurement point in the test. (2) The maximum displacement values of each specimen in the simulation were N60, N40, and SF60 from the largest to the smallest, which were consistent with the test results.
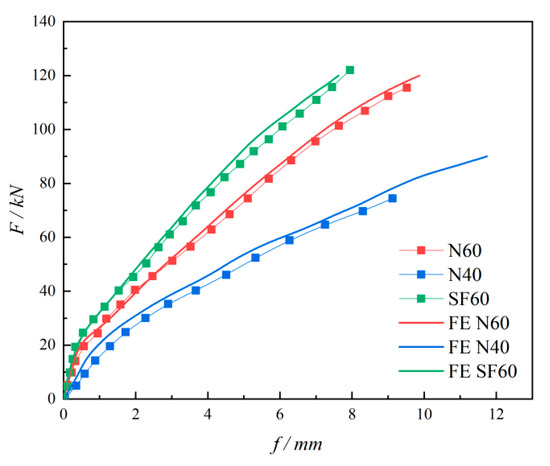
Figure 16.
Comparison of the load–deflection curves.
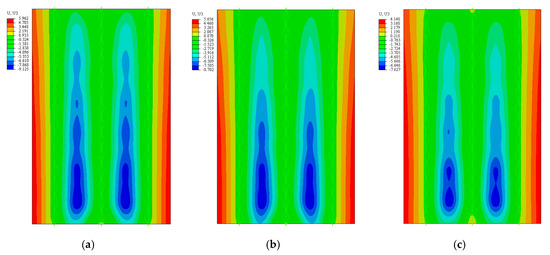
Figure 17.
Displacement cloud diagram of each specimen. (a) N60; (b) N40; (c) SF60.
Table 8.
Comparison of the test and simulation maximum deflection of each specimen.
We analyzed the reasons for the errors between the finite element simulation results and the test results: (1) There were inevitable defects in the casting of the specimen, resulting in deviations between the actual properties and the values entered in the simulation. (2) The test could not achieve the complete fixation of the tie member, while the boundary condition of the tie member was set to “complete fixation” during the simulation, resulting in the error. (3) During the test loading process, the oil return of the jack and the slight shaking of the test piece caused errors in data collection.
4.3.2. Plastic Damage of Concrete
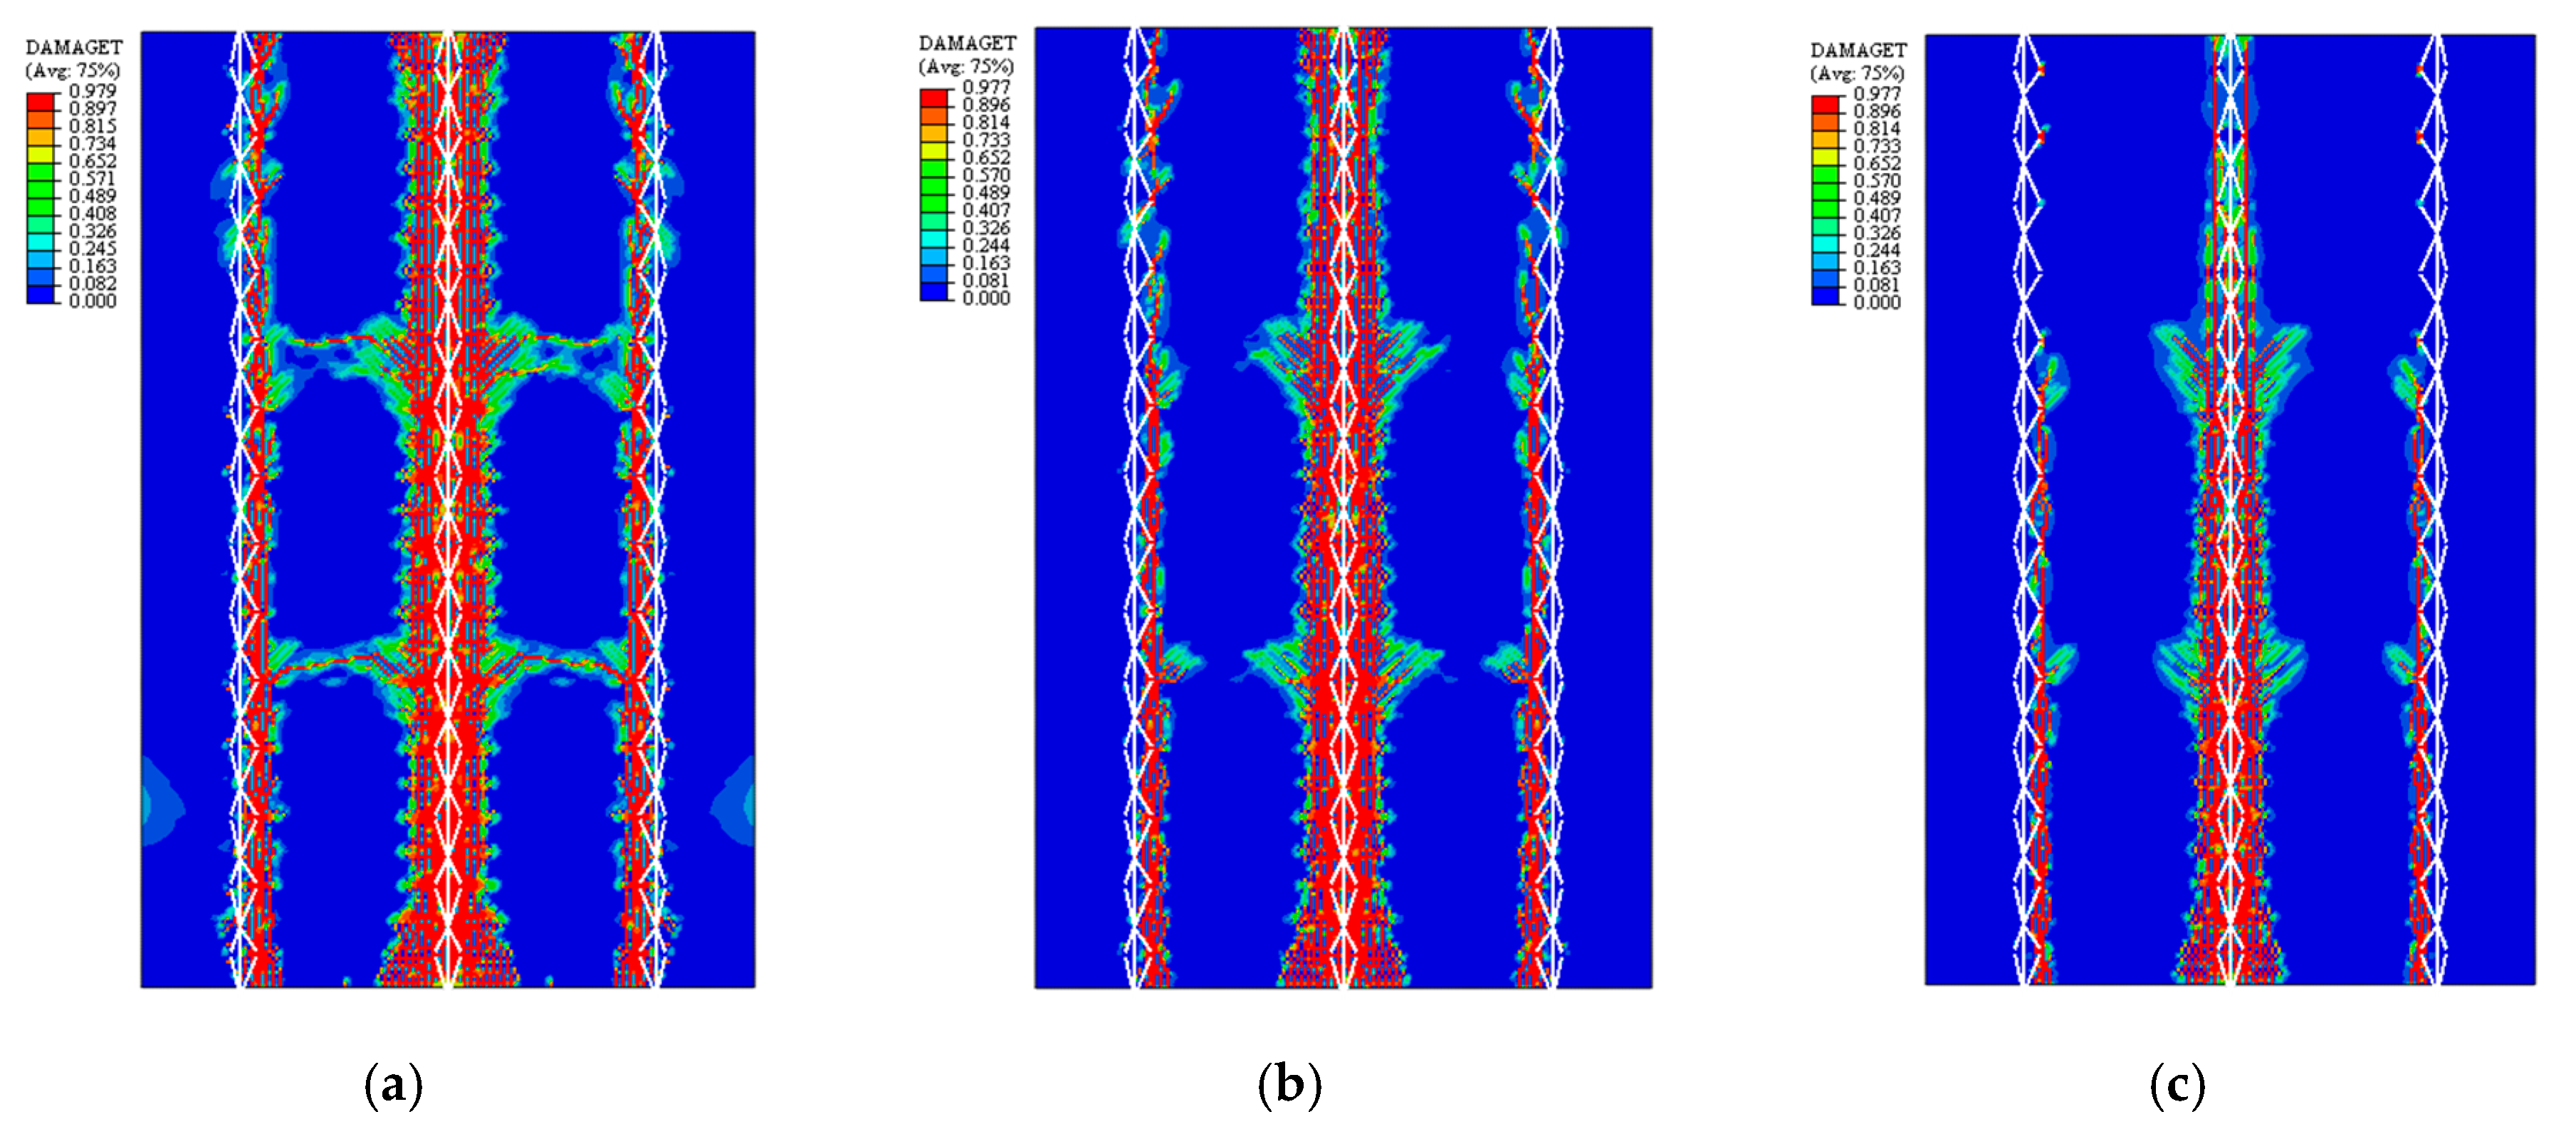
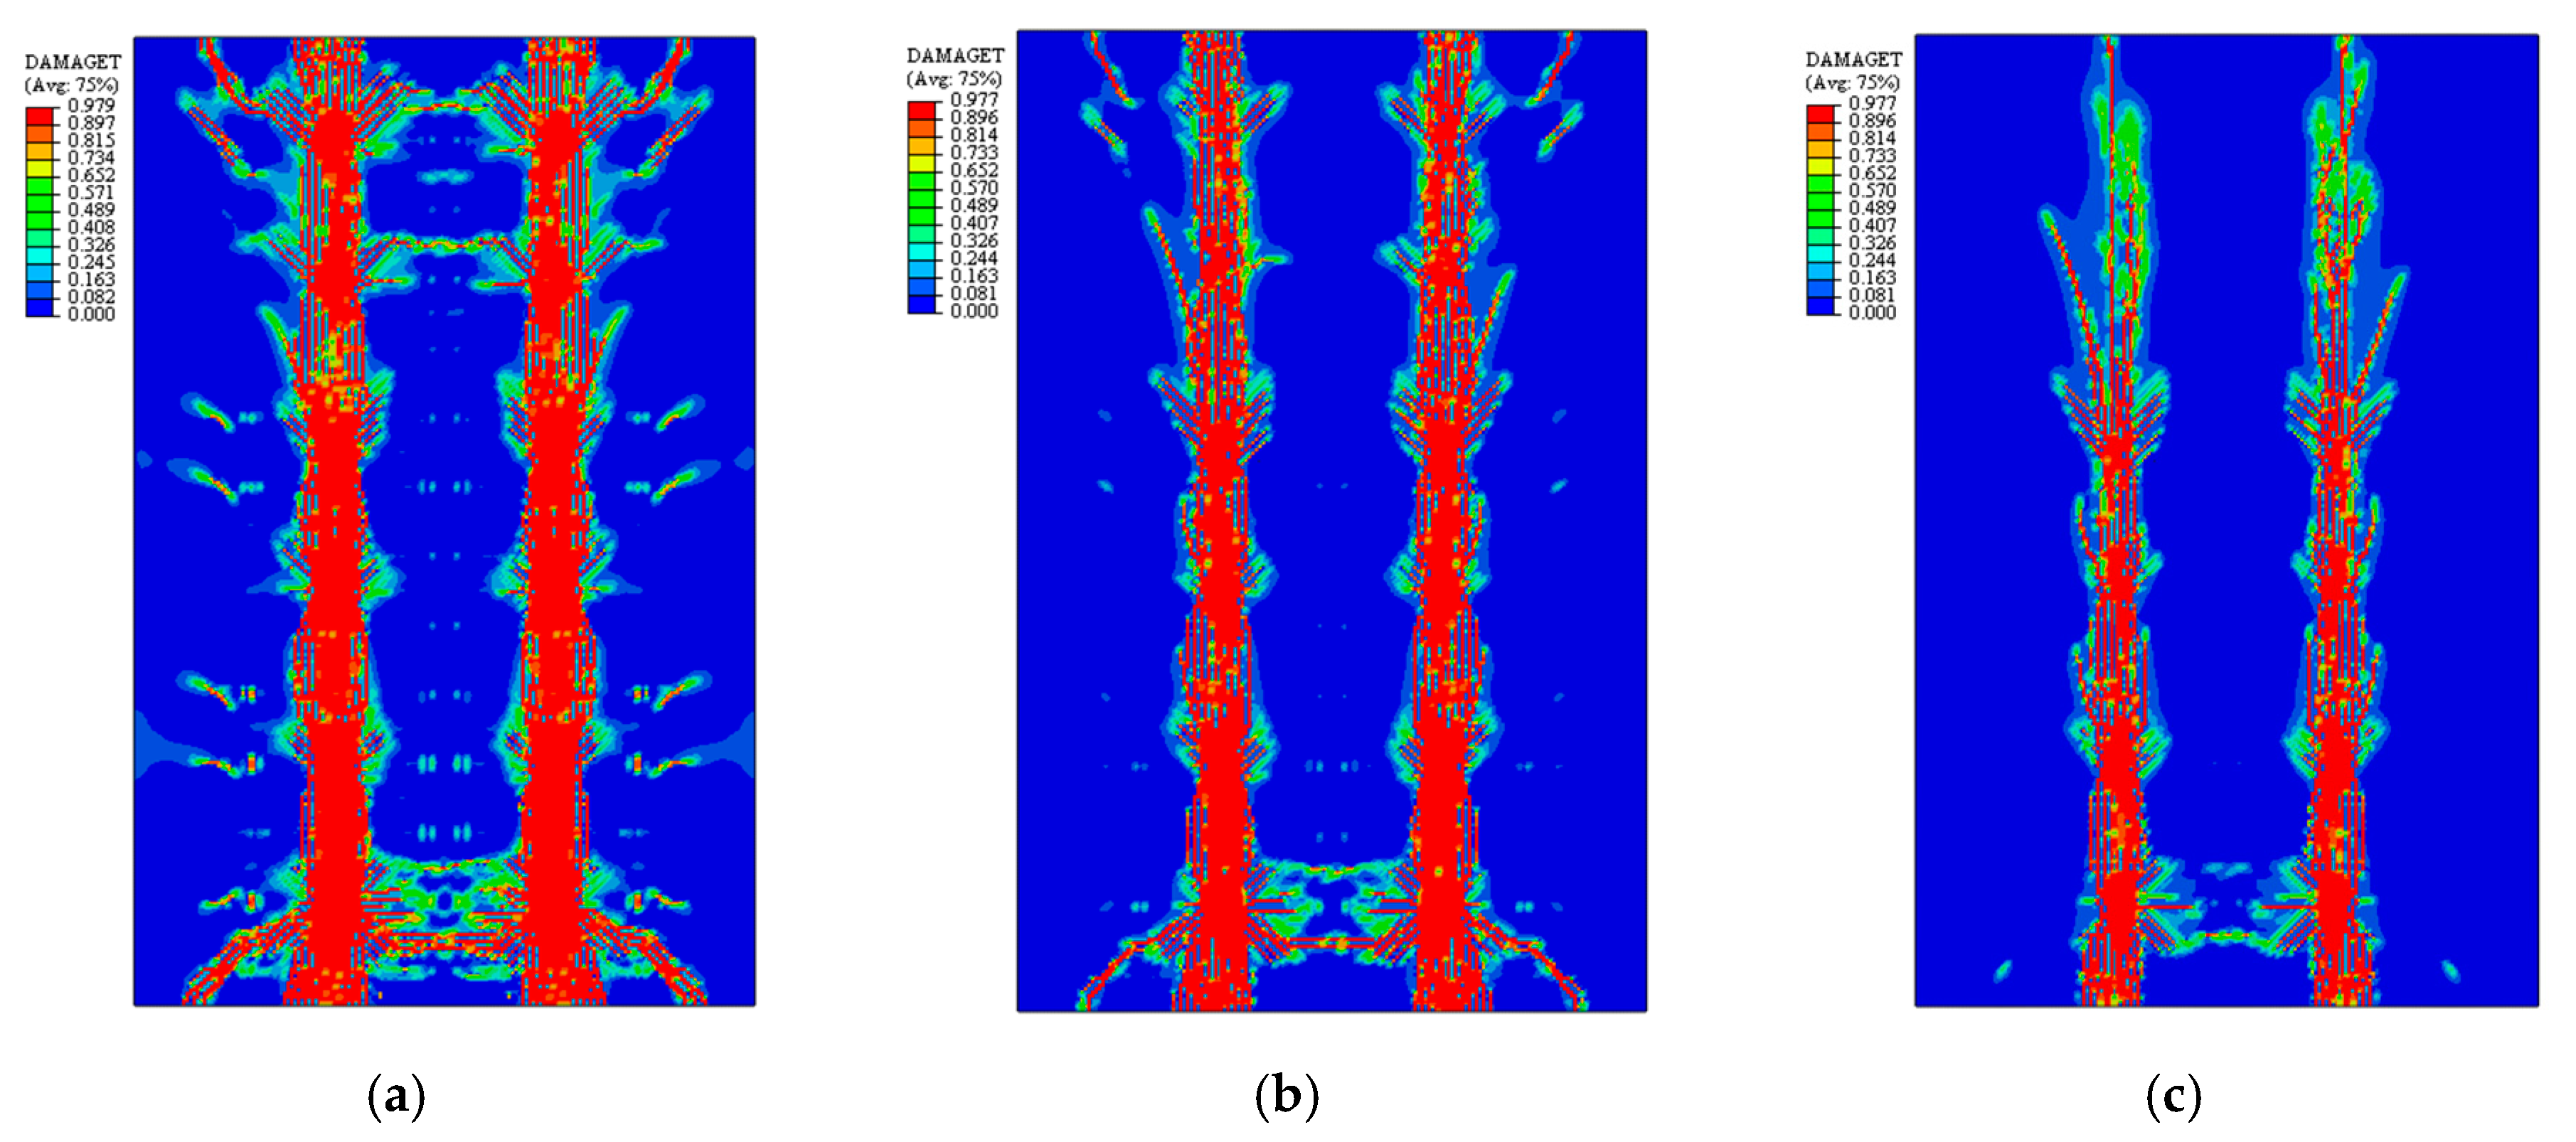
According to the damage clouds of the concrete front and back of each specimen at the peak load of the finite element analysis (Figure 18 and Figure 19), it is clear that three main cracks were produced on the concrete front, mainly distributed at the intersection of the truss tendons and the concrete. On the back side, two main cracks were produced, mainly in the middle of adjacent joist tendons. The cracks all ran along the span direction of the slab, consistent with the cracks generated by the test.
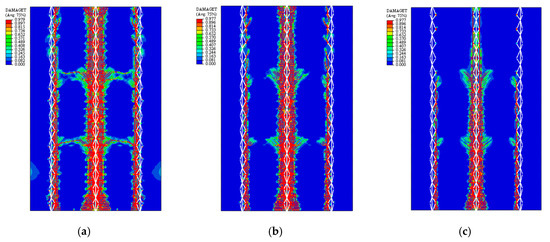
Figure 18.
Concrete front damage cloud. (a) N60; (b) N40; (c) SF60.
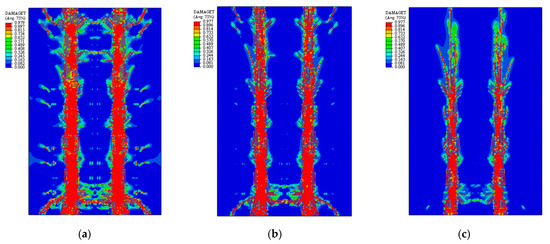
Figure 19.
Concrete front damage cloud. (a) N60; (b) N40; (c) SF60.
5. Parametric Analysis
The strength grade of concrete has a significant effect on the stiffness and strength of the members. Steel fibers, as an important admixture in concrete, have a significant enhancement effect on the tensile strength, toughness, and stiffness of steel fiber concrete. Based on the finite element analysis in the previous section, this section further investigates the effects of two factors, concrete strength grade and steel fiber volume fraction V, on the mechanical properties of MiC formworks. The design model parameters are shown in Table 9.
Table 9.
Parameters of the design model.
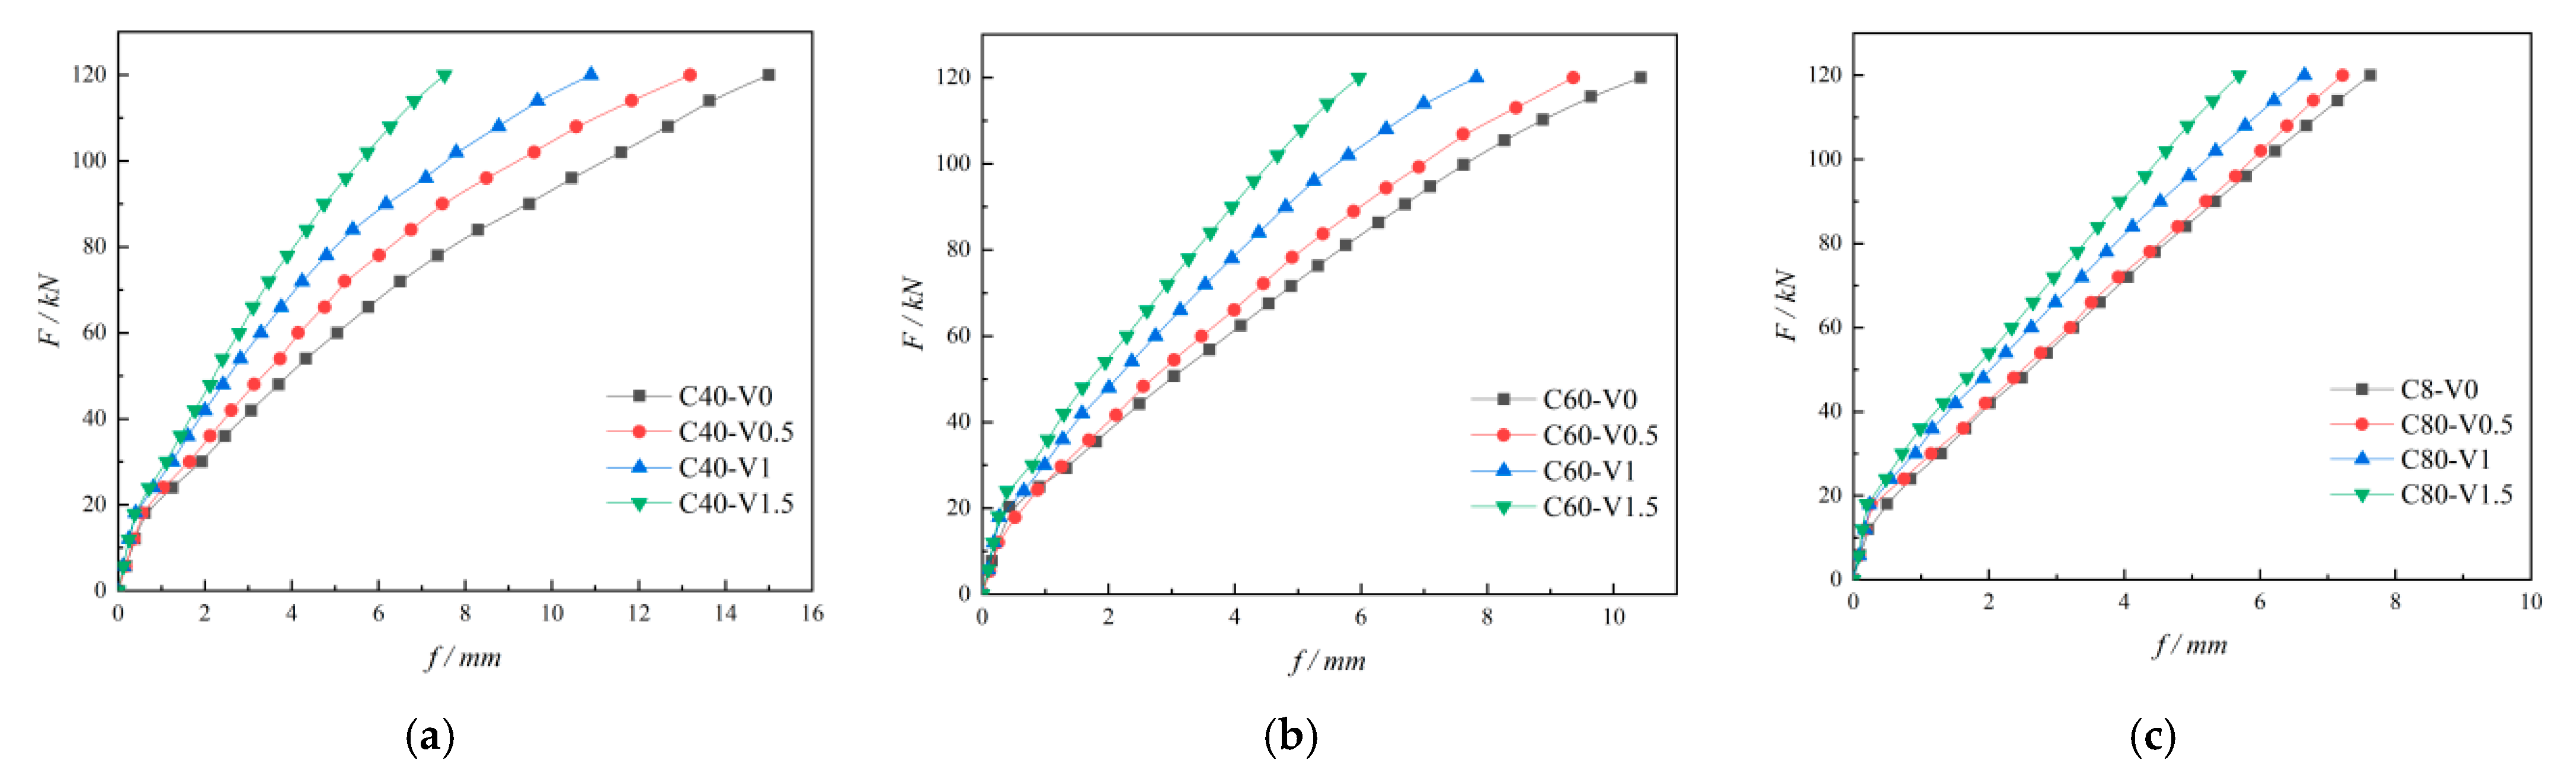
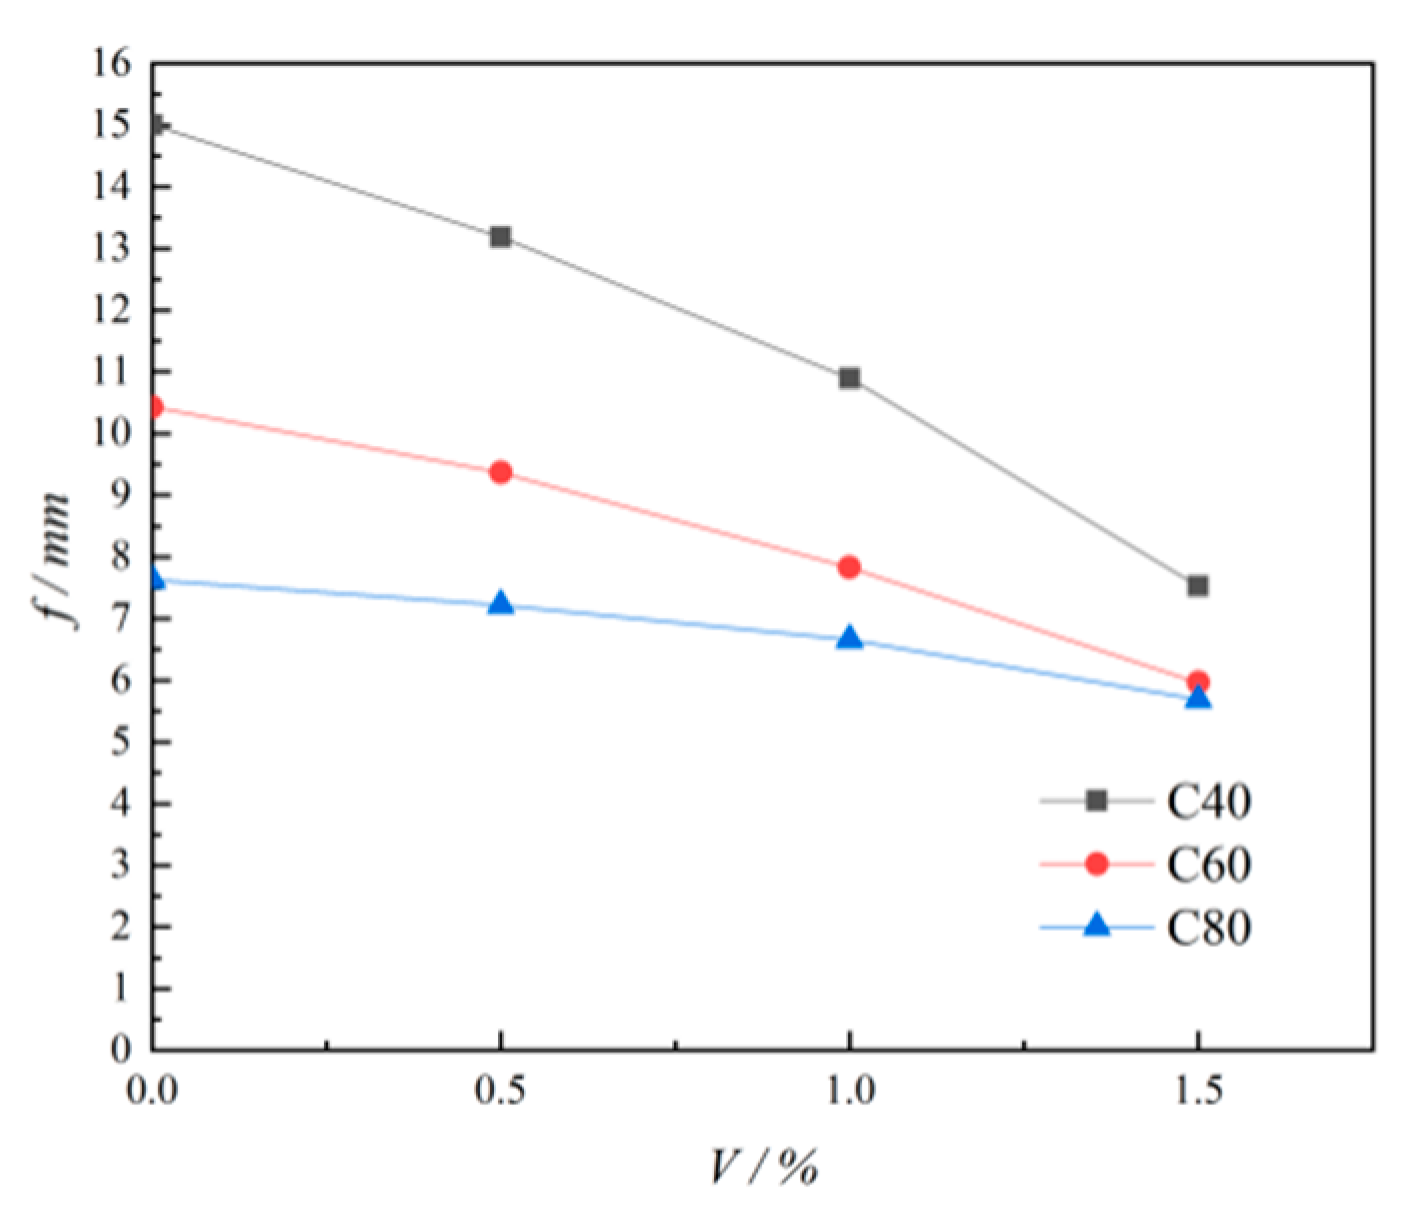
Holding the concrete strength grade constant, the stresses of the MiC formworks with different fiber volume fractions were simulated under five levels of loading, separately. The load–deflection curves are shown in Figure 20. Combined with Figure 21, the maximum deflection gradually decreased with the increase in the steel fiber volume fraction under the same strength group, and the decrease gradually increased. This indicates that the stiffness of the MiC formwork increases with the amount of steel fiber admixture when the volume fraction of steel fiber is not more than 1.5%. As the strength grade of the concrete matrix increased, the effect of increasing the volume fraction of steel fibers on the reduction in the model maximum deflection decreased. This indicates that when the strength grade of the concrete matrix is high, the shear strength of the steel fiber-reinforced concrete increases more slowly as the steel fiber content increases.
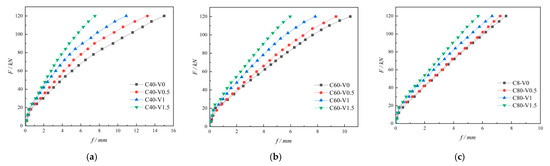
Figure 20.
Load–deflection curves of each model. (a) C40 strength group; (b) C60 strength group; (c) C80 strength group.
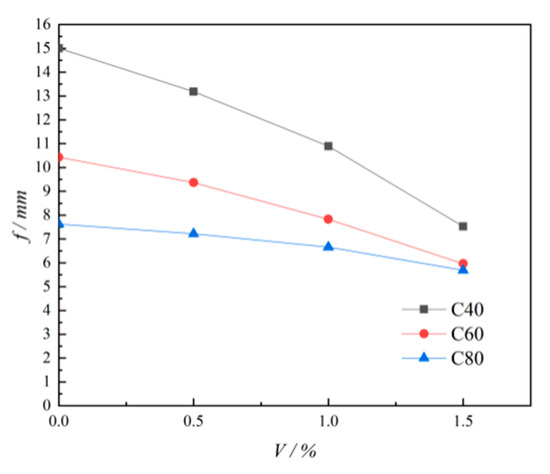
Figure 21.
Influence of the fiber content on the maximum deflection.
6. Conclusions
Static loading tests simulating the lateral pressure of the concrete placement and finite element simulations were performed on MiC formworks with three different material compositions. Parametric analysis was carried out using numerical simulation software with concrete strength class and steel fiber admixture as parameters. The following conclusions were drawn:
- (1)
- The crack development, distribution pattern, and deformation of the three specimens were similar. The cracks appeared in the stressed area first, then gradually developed and extended through the whole plate surface with the increase in the load. The front cracks were mainly concentrated under each joist bar, while the back cracks were symmetrically distributed at the centerline of adjacent joist bars. The width of cracks in each specimen was different due to different concrete strengths and steel fiber mixing.
- (2)
- The damage patterns of the three specimens were different. The specimen without steel fibers was damaged due to a lack of ultimate bearing capacity, while the specimen with steel fibers was damaged due to reaching the upper limit of code deflection. Therefore, increasing the strength of concrete can significantly increase the bearing capacity of the specimens. In contrast, the incorporation of steel fibers significantly increased the crack resistance and stiffness of the specimens but not the bearing capacity.
- (3)
- The results of the numerical analysis were close to the test results, and the stress distribution pattern was similar. The distribution pattern of the tensile and compressive damage on the surface of each specimen was approximately the same. The tensile damage was higher than the compressive damage in the damage degree. Combined with the parametric analysis, it is clear that increasing the steel fiber dosage has limited improvement on the cracking resistance of the specimens as the strength class of the concrete matrix increases.
Author Contributions
Conceptualization, Q.W. and D.C.; methodology, Q.W. and D.C.; software, D.Y.; formal analysis, D.C., Q.W. and D.Y.; writing—original draft preparation, D.Y.; writing—review and editing, Q.W. and D.C. All authors have read and agreed to the published version of the manuscript.
Funding
This work was supported by the Mechanical Properties Research of FRP Connectors in Fabricated Concrete Sandwich Insulation Wall Panels after Fire (KJ2021A0608), the Natural Science Foundation of Anhui Province (19080885ME173), the Research and Development project of China State Construction International Holdings Limited (CSCI-2020-Z-06-04), the Science and Technology Project of Anhui Province Housing and Urban–Rural Construction (2020-YF47), and the Science and Technology R&D Project of China Construction Corporation (CSCEC-2019-Z-4).
Data Availability Statement
The data presented in this study are available on request from the corresponding author. The data are not publicly available due to privacy.
Conflicts of Interest
Author Qiong Wang was employed by the company China State Construction Hailong Technology Co., Ltd., Shenzhen 518110, China. The remaining authors declare that the research was conducted in the absence of any commercial or financial relationships that could be construed as a potential conflict of interest.
References
- Murray-parkes, J.; Bai, Y.; Styles, A.; Wang, A. Handbook for the Design of Modular Structures, Modular Construction Codes Board; Monash University: Melbourne, Australian, 2017; pp. 1–216. [Google Scholar]
- Gunawardena, T.; Ngo, T.; Mendis, P.; Alfano, J. Innovative flexible structural system using prefabricated modules. J. Archit. Eng. 2016, 22, 05016003. [Google Scholar] [CrossRef]
- Sharafi, P.; Mortazavi, M.; Samali, B.; Ronagh, H. Interlocking system for enhancing the integrity of multi-storey modular buildings. Autom. Constr. 2018, 85, 263–272. [Google Scholar] [CrossRef]
- Samali, B.; Nemati, S.; Sharafi, P.; Abtahi, M.; Aliabadizadeh, Y. An experimental study on the lateral pressure in foam-filled wall panels with pneumatic formwork. Case Stud. Constr. Mater. 2018, 9, e00203. [Google Scholar] [CrossRef]
- Wang, Z.; Pan, W.; Zhang, Y. Parametric study on module wall-core system of concrete modular high-rises considering the influence of vertical inter-module connections. Eng. Struct. 2021, 241, 112436. [Google Scholar] [CrossRef]
- Yin, S.P.; Xu, S.L.; Wang, F. Investigation on the flexural behavior of concrete members reinforced with epoxy resin-impregnated textiles. Mater. Struct. 2015, 48, 153–166. [Google Scholar] [CrossRef]
- Li, S.; Yin, S.; Wang, C.; Yang, Y. Research on the bonding performance of TRC permanent formwork and cast-in-place concrete. Eng. Struct. 2021, 235, 112021. [Google Scholar] [CrossRef]
- Yang, Y.; Chen, B.; Chen, Y.; Zhou, H.; Liu, F.; Xie, X.; Chen, J.; Guo, W.; Wang, H. Performances of Concrete Columns with Modular UHPC Permanent Formworks Under Axial Load. Int. J. Concr. Struct. Mater. 2023, 17, 38. [Google Scholar] [CrossRef]
- Li, S.; Yin, S. The influence of the bonding length on the failure mechanism of the interface between the TRC permanent formwork and cast-in-place concrete. Structures 2021, 29, 1690–1698. [Google Scholar] [CrossRef]
- Zhu, B.; Nematollahi, B.; Pan, J.; Zhang, Y.; Zhou, Z.; Zhang, Y. 3D concrete printing of permanent formwork for concrete column construction. Cem. Concr. Compos. 2021, 121, 104039. [Google Scholar] [CrossRef]
- Wang, L.; Yang, Y.; Yao, L.; Ma, G. Interfacial bonding properties of 3D printed permanent formwork with the post-casted concrete. Cem. Concr. Compos. 2022, 128, 104457. [Google Scholar] [CrossRef]
- Wang, L.; Yang, Y.; Hu, Y.; Ma, G. Interfacial Properties of Three-Dimensional-Printed Permanent Formwork with Cast-in-Place Concrete. 3D Print. Addit. Manuf. 2022. [Google Scholar] [CrossRef]
- Chen, Y.; Zhang, Y.; Liu, Z.; Zhang, Y.; Liu, C.; Pang, B. 3D-printed concrete permanent formwork: Effect of postcast concrete proportion on interface bonding. Mater. Lett. 2023, 344, 134472. [Google Scholar] [CrossRef]
- Zhang, R.; Hu, P.; Zheng, X.; Cai, L.; Guo, R.; Wei, D. Shear behavior of RC slender beams without stirrups by using precast U-shaped ECC permanent formwork. Constr. Build. Mater. 2020, 260, 120430. [Google Scholar] [CrossRef]
- Li, H.; Leung, C.K.Y.; Xu, S.; Cao, Q. Potential use of strain hardening ECC in permanent formwork with small scale flexural beams. J. Wuhan Univ. Technol. -Mater. Sci. Ed. 2009, 24, 482–487. [Google Scholar] [CrossRef]
- Li, Q.H.; Huang, B.T.; Xu, S.L. Development of assembled permanent formwork using ultra high toughness cementitious composites. Adv. Struct. Eng. 2016, 19, 1142–1152. [Google Scholar] [CrossRef]
- Huang, B.T.; Li, Q.H.; Xu, S.L.; Li, C.F. Development of reinforced ultra-high toughness cementitious composite permanent formwork: Experimental study and digital image correlation analysis. Compos. Struct. 2017, 180, 892–903. [Google Scholar] [CrossRef]
- Li, S.; Yin, S. Research on the mechanical properties of assembled TRC permanent formwork composite columns. Eng. Struct. 2021, 247, 113105. [Google Scholar] [CrossRef]
- Daskiran, M.M.; Daskiran, E.G.; Gencoglu, M. Seismic performance of PVA textile cementitious composites used as permanent formwork in full-scale circular RC columns. Structures 2022, 36, 445–462. [Google Scholar] [CrossRef]
- Yin, S.; Cong, X.; Wang, C.; Wang, C. Research on flexural performance of composited RC beams with different forms of TRC permanent formwork. Structures 2021, 29, 1424–1434. [Google Scholar] [CrossRef]
- Zhang, H.; Rasmussen, K.J.; Ellingwood, B.R. Reliability assessment of steel scaffold shoring structures for concrete formwork. Eng. Struct. 2012, 36, 81–89. [Google Scholar] [CrossRef]
- Cardellicchio, L. On conservation issues of contemporary architecture: The technical design development and the ageing process of the Jubilee Church in Rome by Richard Meier. Front. Archit. Res. 2018, 7, 107–121. [Google Scholar] [CrossRef]
- Echenagucia, T.M.; Pigram, D.; Liew, A.; Van Mele, T.; Block, P. A cable-net and fabric formwork system for the construction of concrete shells: Design, fabrication and construction of a full scale prototype. Structures 2019, 18, 72–82. [Google Scholar] [CrossRef]
- Guo, X.; Qian, S.-S.; Qing, Q.; Gong, J.-H. Reinforcement by polyurethane to stiffness of air-supported fabric formwork for concrete shell construction. J. Cent. S. Univ. 2019, 26, 2569–2577. [Google Scholar] [CrossRef]
- Gong, C.; Kang, L.; Liu, L.; Lei, M.; Ding, W.; Yang, Z. A novel prediction model of packing density for single and hybrid steel fiber-aggregate mixtures. Powder Technol. 2023, 418, 118295. [Google Scholar] [CrossRef]
- Cao, Q.; Zheng, H.; Ju, H.; Lin, Z.; Zhou, C.; Jia, J. Early-Age Cracking Resistance of Multiscale Fiber-Reinforced Concrete with Steel Fiber, Sisal Fiber, and Nanofibrillated Cellulose. J. Mater. Civ. Eng. 2023, 35, 04023065. [Google Scholar] [CrossRef]
- Jiang, W.; Zheng, X.; Huang, Z. Lateral pressure of poured concrete: Arguments from ultra-deep diaphragm wall (120 m) construction. Appl. Sci. 2022, 12, 8800. [Google Scholar] [CrossRef]
- Genikomsou, A.S.; Polak, M.A. Finite element analysis of punching shear of concrete slabs using damaged plasticity model in ABAQUS. Eng. Struct. 2015, 98, 38–48. [Google Scholar] [CrossRef]
- Lihua, X.; Changning, L.; Biao, L.; Yin, C.; Biao, H. Investigation on 1D elasto-plastic constitutive model of steel fiber reinforced concrete under uniaxial cyclic compression. China Civ. Eng. J. 2018, 51, 77–87. [Google Scholar]
- Yin, C.; Le, H.; Min, Y. Calibration Method of Damage Plasticity Model for Steel-Polypropylene Hybrid Fiber Reinforced Concrete Based on ABAQUS. Eng. Mech. 2017, 34, 131–142. [Google Scholar]


Disclaimer/Publisher’s Note: The statements, opinions and data contained in all publications are solely those of the individual author(s) and contributor(s) and not of MDPI and/or the editor(s). MDPI and/or the editor(s) disclaim responsibility for any injury to people or property resulting from any ideas, methods, instructions or products referred to in the content. |
© 2023 by the authors. Licensee MDPI, Basel, Switzerland. This article is an open access article distributed under the terms and conditions of the Creative Commons Attribution (CC BY) license (https://creativecommons.org/licenses/by/4.0/).