Article

Nighttime Lights and Urban Expansion: Illuminating the Correlation between Built-Up Areas of Lagos City and Changes in Climate Parameters

by
Katabarwa Murenzi Gilbert
and
Yishao Shi
*
College of Surveying and Geo-Informatics, Tongji University, Shanghai 200092, China
*
Author to whom correspondence should be addressed.
Buildings 2023, 13(12), 2999; https://doi.org/10.3390/buildings13122999
Submission received: 18 October 2023 / Revised: 26 November 2023 / Accepted: 29 November 2023 / Published: 30 November 2023
(This article belongs to the Section Building Energy, Physics, Environment, and Systems)

Abstract

:
The rapid urbanization of Lagos City has resulted in an expansion of urban and nighttime lights, which, in turn, places a significant burden on natural resources. This burden exacerbates the adverse impacts of changes in climate parameters, underscoring the need for measures to mitigate its effects. Therefore, this study examines the relationship between economic development, population growth, urban expansion, and climate change in Lagos City over two decades. GIS and remote sensing methods were used to process nighttime light, Landsat images, changes in climate parameters, and NDVI data to measure Lagos’ sustainability level. The results show that: (1) between 2000 and 2020, nighttime light coverage grew from 175.53 km2 to 631.16 km2. Lagos’ GDP grew by 88.9%, while the population increased from 13.4 million in 2000 to 26 million in 2019. (2) The built-up areas significantly increased from 13.0% in 2000 to 33.6% in 2020, while vegetation land declined, decreasing from 63.7% in 2000 to 46.4% in 2020. (3) Furthermore, Lagos City has experienced changes in climate parameters, with a decrease in annual rainfall from 2954.81 mm in 2000 to 1348.81 mm in 2020 and an increase in the average maximum temperature from 31.56 °C in 2000 to 31.79 °C in 2020. However, the rapid growth of cities has brought about significant environmental impacts. A strong relationship exists between horizontal urban development and nighttime light, indicating that urban areas encroach on natural landscapes as Lagos grows. Then, there is a relationship between urban development and vegetation and between temperature and vegetation. A compact city planning approach, which prioritizes vertical development and efficient land use to mitigate urban sprawl and preserve green spaces, is recommended.

1. Introduction

Urban expansion refers to the physical expansion and development of cities’ infrastructure and facilities to accommodate the growing population [1]. It is a global concern, especially with the current changes in climate parameters. More than half of the world’s population currently lives in urban areas, and it is projected to increase to nearly 60% by 2030 [1] and 70% by 2050 [2]. The process of rapid urbanization exerts significant pressure on natural resources, leading to an increase in energy consumption, transportation emissions, and waste production [3,4]. This, in turn, contributes significantly to greenhouse gas emissions, aggravating the effects of climate change [5]. Approximately 75% of global energy consumption and 70% of carbon dioxide emissions come from cities [6]. Urban expansion also causes deforestation, loss of biodiversity, and heightened vulnerability to climate-related disasters [7,8]. The United Nations (UN) reports that cities are major contributors to energy consumption and greenhouse gas emissions [3,6]. In an era of rapid urbanization, this trend is expected to continue. Addressing the interlinkage between urban expansion, environmental degradation, and the current changes in climate parameters [4,9,10]. In 1987, the World Commission on Environment and Development (WCED) introduced the concept of sustainable development through the Brundtland Report. Sustainable development was defined in the report as meeting the present needs without compromising future generations’ ability to meet their own, while acknowledging that technology and social organization have limits on environmental provision. The report also addressed global population growth, which is predicted to stabilize between 7.7 billion and 14.2 billion people in the 21st century, with a shift towards urban living [11]. Recognizing and addressing the ecological consequences of urban growth is imperative to advance global efforts toward a sustainable and robust future for the planet [12].
Nigeria, the most populous country in Africa, has experienced substantial urban expansion over the last few decades. It is great to see that more and more people are choosing to live in urban areas, contributing to the growth of cities. In 1990, about 29.7% of the population lived in cities, but by 2019, it increased to 51.2%. That is a rise of around 74.5 million city dwellers from 1990 to 2019. It is predicted that by 2050, Nigeria will have about 295 million people living in cities, becoming one of Africa’s most significant urban areas [13]. Many cities worldwide, with Lagos being a prominent example, are experiencing rapid urban growth. This surge in urban population is leading to extensive expansion of built-up areas [14]. As cities like Lagos continue to grow, the demand for various urban activities rises, resulting in significant urban development. However, changes in land cover come with consequences. Specifically, the temperature increase is due to the urban heat island effect [15]. Studies have indicated that the data and information currently accessible for tracking the urban growth of cities in Nigeria are seriously lacking in quantity and accuracy. This deficiency makes it difficult to make informed decisions. For instance, cities like Lagos need timely and up-to-date data about how much they have expanded as urban areas. This lack of information challenges achieving sustainable urban development [13,16,17]. However, some experts [18,19,20,21] have pointed out that nighttime light and land use and land cover changes data play a significant role in monitoring and analyzing urban growth. These data are acquired using remote sensing techniques and are processed using Geographic Information System (GIS) tools to identify and describe changes in land cover patterns. The year, 2022, marked the 30th anniversary of the initial digital storage of nighttime lights (NTL) remote sensing data from the Defense Meteorological Satellite Program-Operational Linescan System (DMSP-OLS) and National Polar Partnership-Visible Infrared Imaging Radiometer Suite (NPP-VIRS) at the National Centers for Environmental Information (NCEI). The data were first stored in 1992 when NCEI was known as the National Geophysical Data Center (NGDC). Over these three decades, extensive research using these data has showcased its impressive capabilities in comprehending urbanization. This includes mapping how cities grow and creating models that show economic and environmental factors like Gross Domestic Product (GDP) and electricity use. Studies have been conducted to uncover the impacts of human activities and light pollution on both ecosystems and human health [19,22]. Furthermore, using freely available datasets, which offer a detailed view at a 30 m resolution, researchers have discovered that they provide more accurate information about land use patterns [18]. This allows for identifying changes in land use on the scale of most human activities related to land. It also enhances our understanding of the diversity of landscapes and improves the accuracy of modeling and simulations. The datasets have been instrumental in conducting research and facilitating practical applications that pertain to transformations of land use and land cover that have taken place in recent years [23]. Researchers in Lagos have utilized land use and land cover changes and nightlight data in separate studies [13,18,19,23,24,25]. However, previous studies have not effectively linked land use and land cover changes with nightlight data to examine the correlation among socio-economic development, urban growth, and climate change.
The main purposes of this paper are as follows: (1) assess the effectiveness and relevance of NTL remote sensing data in comprehending urbanization trends over 20 years, from 2000 to 2020. This includes examining its capability to map urban development and analyzing its relation to economic and environmental models and population growth. (2) Analyze the relationship between nighttime light data, land use and land cover change, the Normalized Difference Vegetation Index (NDVI), and changes in climate parameters in Lagos over 20 years to understand the complex dynamics shaping urbanization and its impact on Lagos’ ecosystem.
The scientific gap addressed in this study lies in the absence of comprehensive analyses correlating NTL data and nighttime pollution with urban growth, specifically in the context of climate changes discernible from the correlation of Landsat results with changes in climate parameters. The paper adopts a multi-sensorial approach to fill the identified gap, utilizing the two scientific objectives mentioned above as part of its methodology.

2. Materials and Methods
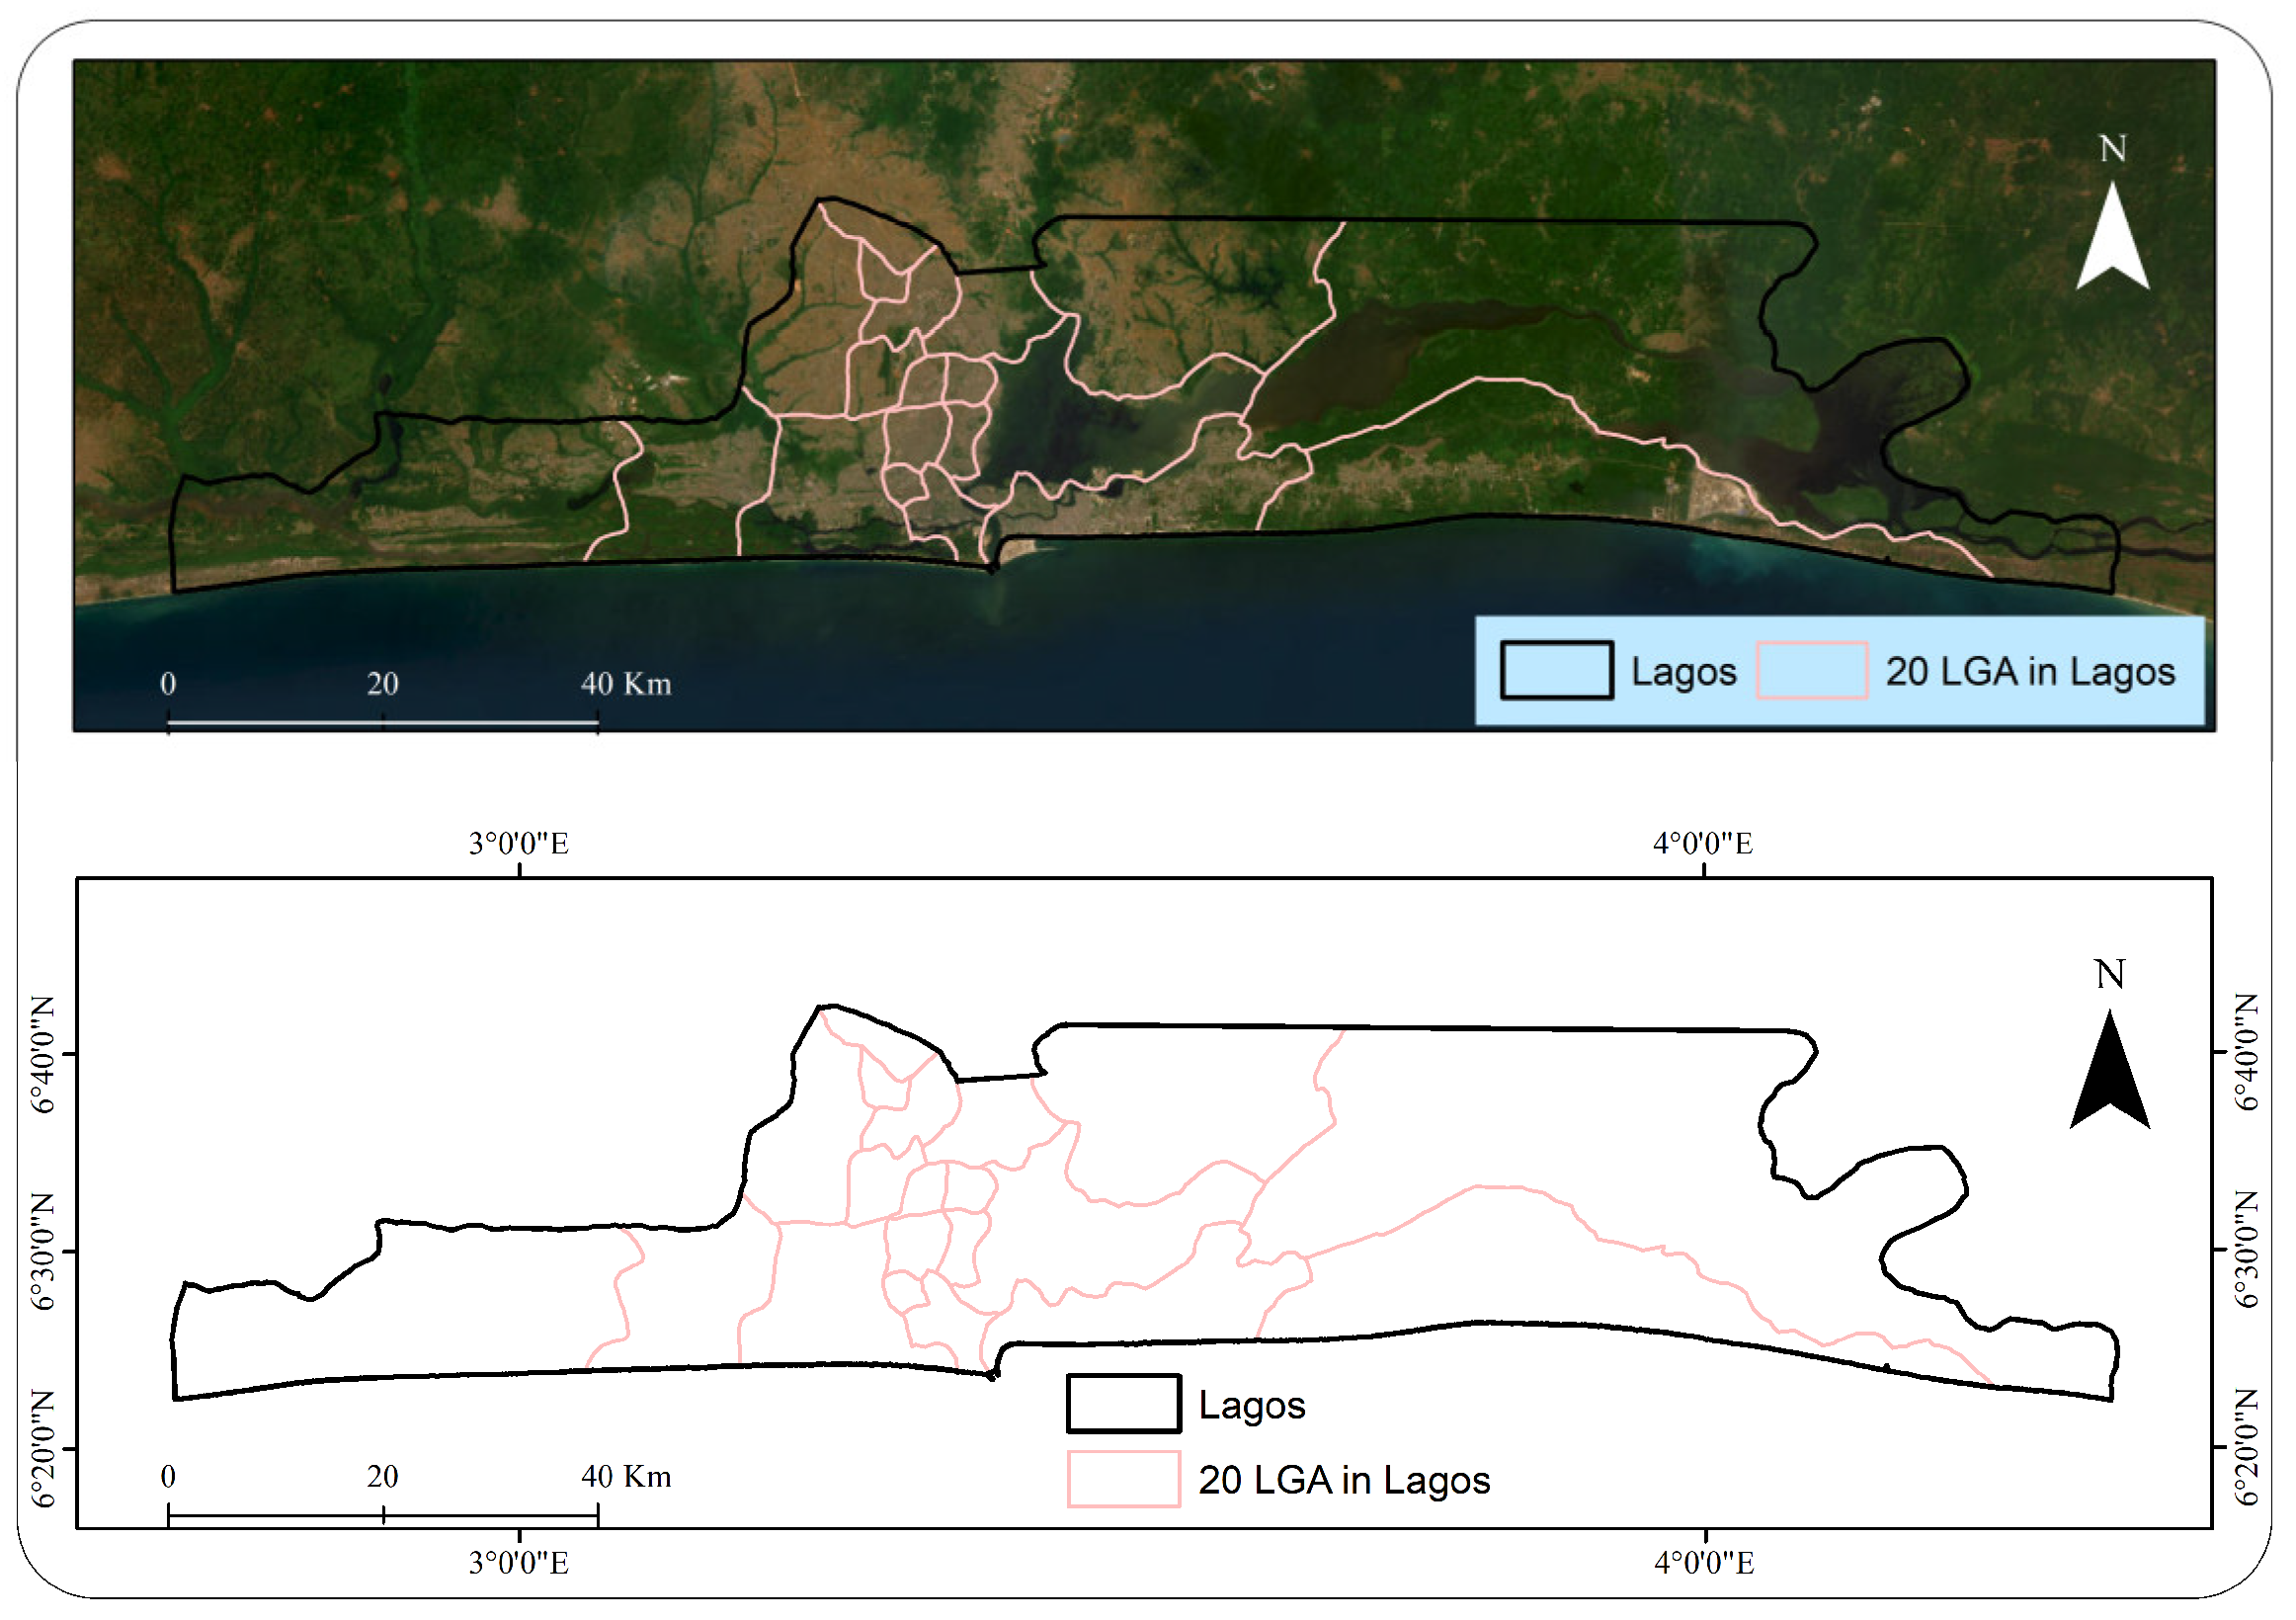
2.1. Study Area

Lagos is situated in the southwestern region of the country, between 3.00° E and 3.42° E longitude and from 6.22° N to 6.42° N latitude in the Lagos State in the sub-Saharan part of Africa [26]. It encompasses many settlement types, ranging from a bustling central metropolis to serene suburbs towns and more marginalized areas like slums and informal settlements. The state is divided into 20 distinct local government areas (16 urban and 4 rural). As of 2019, the population of Lagos State was a staggering 26 million, underscoring its status as a vibrant and crowded hub in the region [27]. The area of Lagos is calculated to be approximately 3782 square kilometers based on shapefiles sourced from DIVA-GIS (Figure 1). Informal settlements are widespread in Lagos, illustrating the intersection of poverty and urbanization. Internal and international migration is a major national issue impacting the city [28,29]. Lagos remains a top destination for economic migrants, drawing people from different parts of Nigeria and beyond. The formal economy of Lagos is primarily centered around the financial sector. Manufacturing, higher education, and newer sectors like ‘fintech’ and internet-related industries also play a significant role. Elaborating further, this state stands as the epicenter of industry, commerce, and business in Nigeria. In 2010, its contribution to the national GDP was a substantial 35.6%, amounting to approximately USD 80.61 billion [30]. However, this economic mix has led to growing tensions, particularly in northern Nigeria, highlighting complex socio-economic dynamics [31].
A combination of factors typically influences urban growth and changes in land cover in cities like Lagos. The city is currently experiencing rapid urban growth, primarily fueled by a significant increase in population. It is now ranked as the 21st largest global urban center. Notably, the city’s population is increasing ten times faster than the combined growth of New York and Los Angeles. This remarkable surge in population has rightfully earned Lagos the distinction of being a significant megacity in Africa [13]. To effectively address the challenges posed by this burgeoning growth, engagement and collaboration between stakeholders and adaptive strategies to mitigate the potential negative impacts of this expansion are needed [23]. Hence, selecting Lagos as a case study demonstrates robust exemplariness and representativeness.

2.2. Data Source

This study has employed various remotely sensed datasets from different sources, as outlined in Table 1 below.

2.2.1. Landsat Data

The Landsat datasets used in this study, specifically Landsat 7 for 2000 and Landsat 8 for 2010 and 2020, have a spatial resolution of 30 m. These selections were made based on their recognized quality and accessibility within the field. The cloud-free Landsats were downloaded from the USGS website. The paths and rows are 190/56, 191/55, and 191/56 for each respective year. Satellite images for the same months were used, thus mitigating the potential influence of seasonal variations on the study’s outcomes.

2.2.2. MODIS/Terra Vegetation Indices Data

NASA generates the MODIS/Terra Vegetation Indices 16-Day L3 Global 250 m dataset. This dataset provides information on vegetation dynamics and health on a global scale. The data have a spatial resolution of 250 m, with observations taken over 16-day intervals. This temporal resolution allows detailed monitoring of vegetation changes and conditions over time [32]. The dataset includes various vegetation indices numerical values derived from satellite observations that offer insights into aspects of vegetation, such as density, health, and productivity. This information is invaluable for applications in agriculture, forestry, ecology, and climate science, aiding in assessing environmental conditions and understanding ecosystem processes. Our study employed the NDVI for 2000, 2010, and 2020. This allowed us to gauge its correlation with various aspects of climate change within our designated study area.

2.2.3. Precipitation and Temperature Data

The WorldClim dataset provides monthly total precipitation in millimeters (mm) and temperature in degrees Celsius (°C) at a high resolution of approximately 10 min, which covers an area of roughly 340 km2. This dataset is a valuable resource for researchers and analysts working on various environmental and climate-related studies, as it offers detailed and temporally resolved information about precipitation and temperature patterns on a global scale [33]. For this study, the Tagged Image File Format (TIFF) data containing rainfall and temperature were downloaded and processed using ArcGIS 10.8.2 regarding the study area boundary. Annual and monthly changes in climate parameters (rainfall and temperature) maps were generated for 2000, 2010, and 2020 (Figure A1), facilitating the detection of temporal changes in climatic patterns within the specified region. Then, 20 samples (points) were collected from changes in climate parameters, each representing a state government. This was to relate changes in climate parameters with NDVI in 2000, 2010, and 2020. This GIS-based approach provided a spatially explicit analysis of climate variations in Lagos over the designated years.

2.2.4. Nighttime Lights (NTL) Data

NTL data provides valuable insights into human activity and urban development. The DMSP-OLS dataset covers 1992 to 2013 and offers nighttime light data at a spatial resolution of 1 km by 1 km. In contrast, the NPP-VIRS dataset spans from 2012 to 2020, offering higher spatial resolution data at 500 m by 500 m [22]. These datasets capture the artificial illumination at night, allowing for the assessment of urbanization trends, economic activity, and population distribution across regions. They are widely used in various fields, including urban planning, environmental monitoring, and socioeconomic research. They provide a powerful tool for studying human impacts on the environment and tracking changes in nighttime light patterns over time. According to published research [19,34,35,36,37], nighttime light data strongly correlate with regional economic activity and population density. In this study, we leveraged NTL data for 2000, 2010, and 2020 to determine the connection between urban expansion and development. Therefore, this was accomplished by integrating spatial data, allowing us to visually demonstrate the relationship between NTL patterns and the growth of urban areas over the specified periods.

2.2.5. Other Data

This study integrated non-spatial data, specifically population growth and referenced GDP results [30,38] with spatial information for an in-depth analysis. This allowed for a comprehensive examination of the correlation between population growth and urban expansion in terms of spatial distribution and economic impact. GDP is the total monetary value of all completed goods and services produced within a country during a specified timeframe. Figure 2 shows the population growth of the Lagos state government [27,30].
Based on the population values for each year in the period considered in Figure 2, the population has grown by 12.6 million, from 13.4 million in 2000 to 26 million in 2019. This represents a growth rate of 94.2%. The population grew rapidly between 2000 and 2010, increasing by 6.4 million or 48.1%. This was followed by a period of slower growth, but the population still grew between 2010 and 2020, increasing by 6.2 million people or 31.1%.

2.3. Data Pre-Processing

To achieve accurate and reliable land classification results in the case of Landsat 2010 imagery, it is imperative to conduct thorough preprocessing and analysis. The presence of image stripes in each spectral band requires accurate attention. Classification involves the integration of carefully chosen spectral bands to construct a temporary multiband layer. The “Fill No Data” tool within the Spatial Analyst tool was applied individually to each band using QGIS 2.16.3 software to address data gaps in each band. Subsequently, the combined spectral bands were processed to create a coherent composite image for 2010. Finally, extraction using a mask technique was applied to delineate the specific area of interest, which, in this case, pertains to Lagos in 2010. Additionally, to preprocess MODIS/Terra Vegetation Indices for 2000, 2010, and 2020 in the Lagos region, we utilized ArcGIS 10.8.2 along with its raster calculator. A scaling factor of 0.0001 was applied to adjust the values of the NDVI to fit within a range of −1 to +1, thus enhancing interpretability.

2.4. Limitations of the Study

The land use and land cover data in the table are based on Landsat images, which have a spatial resolution of 30 m. This means that small changes in land use may not be detected. Additionally, the resolution of changes in climate parameters data differs from land use and land cover change data, which should provide better results if they have the same resolution. Finally, only the GDP for 2010 and 2020 was found; therefore, the data were used to show the relationship between economic growth and nighttime light data.

3. Results

It is essential to emphasize that integrating multi-temporal RS and GIS data is paramount when monitoring the dynamics of urban growth and alterations in land cover, particularly within the broader context of changes in climate parameters and the health of vegetation cover [39,40]. These advanced technologies facilitate a holistic perspective on the temporal evolution of urban areas and their impact on the natural environment. They empower us to evaluate how climate-driven changes influence urban development and land cover transformations [26,41,42]. Furthermore, the exceptional spatial resolution inherent in remote sensing data is important in precisely identifying areas where urban expansion may encroach upon ecologically sensitive regions or exacerbate vulnerabilities linked to climate-related phenomena.

3.1. Nighttime Lights Data, Population Growth, and GDP

Between 2010 and 2020, Lagos significantly contributed to the country’s GDP, with an increase from USD 80.61 billion to USD 152.11 billion, representing a remarkable growth rate of approximately 88.9%. During this time, the urban area also expanded from 396.72 square kilometers to 631.16 square kilometers, indicating a substantial growth of about 59.1%.
According to Figure 3, it has been found that the nighttime light expansion in Lagos is related to population growth in the city [43]. A thorough examination of data trends spanning the past two decades reveals a remarkable surge in growth in Lagos. In 2000, the approximate area illuminated at night was 175.53 km2, while the population was 13.4 million. By 2010, these figures had surged to 396.72 km2 and 19.8 million, respectively. The illuminated area expanded further to 631.16 km2 in 2020, with a population of 26 million in 2019. These changes reflect a period of dynamic urban expansion and demographic shifts in Lagos, showcasing the city’s remarkable development trajectory. To be more precise, the percentage increase in illuminated areas between 2000 and 2010 was about 126%, while the population grew by approximately 47%. Between 2010 and 2020, the illuminated area grew by around 59%. Notably, while the population growth rate between 2010 and 2019 was approximately 31%, the population estimate for 2020 exceeded that, indicating potential rapid growth in the last year of the decade, as depicted in Figure 2.

3.2. Change in Land Use and Land Cover over Two Decades

In Figure 4, the supervised classification of three Landsat images reveals significant changes in vegetation, water bodies, and built-up areas of the study area over 20 years, from 2000 to 2020. Urbanization and infrastructure development led to an expansion of built-up areas in the northern and western regions, while the southern and eastern parts experienced deforestation and agricultural land conversion [13].

3.2.1. LULC Dynamics for the Study Periods of 2000, 2010, and 2020

Table 2 presents a comprehensive overview of the aerial coverage of different land use and land cover categories and their respective proportions for 2000, 2010, and 2020. The spatiotemporal analysis indicates an upward trend in built-up areas, which increased from 492.21 km2 (13.0%) in 2000 to 993.1 km2 (26.3%) in 2010, and further to 1271.94 km2 (33.6%) in 2020. On the other hand, vegetation land exhibited a declining pattern, decreasing from 2410.08 km2 (63.7%) in 2000 to 1899.4 km2 (50.2%) in 2010 and then to 1756.36 km2 (46.4%) in 2020. Analysis highlights that vegetation land retained a significant portion of the study area in 2020. Other land use and land cover classes, particularly water bodies, demonstrated varying trends throughout the study. In 2000, 2010, and 2020, water bodies occupied 879.79 square kilometers (23.3%), 889.58 km2 (23.5%), and 753.94 km2 (19.9%), respectively, indicating a relatively more minor coverage within the study region.

3.2.2. Changes and the Annual Percentage of Change

Table 3 provides a comprehensive overview of changes in land use and land cover (LU/LC) categories throughout the study period. Spatial–temporal analysis reveals significant alterations in various land use and land cover classes during the three distinct time frames: 2000–2010, 2010–2020, and 2000–2020. During these study periods, built-up areas exhibited noteworthy positive changes, encompassing 500.89 km2 (13.2%), 278.83 km2 (7.4%), and 779.72 km2 (20.6%) of the total area, respectively. These increases can be attributed to rural–urban migration, wherein individuals were drawn to the study area by enticing prospects such as job opportunities, improved infrastructure, and other incentives. Conversely, vegetation land experienced substantial negative changes amounting to −510.68 km2 (−13.5%), −143.18 km2 (−3.8%), and −653.86 km2 (−17.3%) during the same time intervals. These adverse changes can be attributed to various factors, including land degradation caused by erosion and flooding and the transformation of agricultural regions into built-up areas and highways. Furthermore, one land use and land cover category exhibited a mixed pattern of both positive and negative changes. Water bodies, for instance, saw an increase of 9.79 km2 (0.97%) but also a decrease of −135.65 km2 (−3.6%) and −125.86 km2 (−3.3%) in different study periods. These fluctuations in water bodies could be attributed to a combination of natural processes and human activities influencing their size and distribution over time.

3.3. Rainfall and Temperature Distribution over Lagos City

Below is Figure 5, which highlights significant trends in Lagos’ climate change and climate variability in rainfall and temperature for 2000, 2010, and 2020. The most notable changes include a reduction in precipitation levels and an increase in temperature, which can be attributed to urban sprawl [26]. A spatial analysis reveals an east–west disparity, where precipitation decreases from the east to the west while temperature increases along the same gradient. Additionally, areas with a higher concentration of artificial surfaces show higher temperatures and less rainfall [44]. This is proven by comparing visually Figure 4a and Figure 5. The spatial correspondence between urbanization intensity and climatic changes indicates the complex interplay between human activities and environmental dynamics in Lagos’ climatic landscape.

3.4. Correlations between Rainfall and NDVI and between Temperature and NDVI

Effective climate change monitoring and sustainable urban planning in Lagos require a comprehensive understanding of the complex interplay among rainfall, NDVI, and temperature [45,46,47]. Our analysis in Figure 6 indicates a relationship between rainfall and NDVI, confirming that vegetation cover thrives in regions with high precipitation levels. This reinforces the crucial role of rain in promoting ecological health. Additionally, we found an inverse relationship between NDVI and temperature, implying that as vegetation cover increases, surface temperatures decrease. These findings highlight the importance of comprehensive analysis when devising sustainable solutions for urban regions. Conversely, the results show that when temperatures rise, vegetation declines, which has a compounding effect on heat retention. Rainfall and vegetative cover further influence the relationship between temperature and vegetation. Urbanization exacerbates this relationship and contributes to an increase in temperature. However, vegetation is a natural regulator as it releases heat through evaporation, which helps mitigate the urban heat island effect [48]. Temperature and precipitation are critical determinants in the local climate, affecting vegetation and the broader ecosystem.

3.5. Climate Change Indicators and Their Influence on Vegetation Cover

Lagos City has experienced a notable shift in climatic conditions, as evidenced by the analyzed spatial grid rainfall and temperature data. Analysis of the recorded rainfall figures from 2001 to 2010 indicated a range of 1899.5 mm at its highest to 1579.2 mm at its lowest, while from 2011 to 2020, rainfall figures fluctuated between 1782.4 mm at its highest and 1495.9 mm at its lowest. On the contrary, the temperature data showed a pattern of change, with the initial range of 2001 to 2010 averaging between 31.8 °C at its highest and 30.9 °C at its lowest. However, from 2011 to 2020, the temperature increased, with figures varying between 32.1 °C at its highest and 31.2 °C at its lowest.
Figure 7 shows that Lagos City has experienced a concerning relationship between rising temperatures and declining rainfall over the past two decades, significantly impacting its vegetation cover. Lagos City has seen a discernible change in climate patterns over the last two decades. Specifically, annual rainfall (mm) decreased from 2954.81 mm in 2000 to 1960.93 mm in 2010 and further reduced to 1348.81 mm in 2020. Conversely, average maximum temperature (°C) demonstrated an upward trend, rising from 31.56 °C in 2000 to 31.70 °C in 2010 and ultimately reaching 31.79 °C in 2020. To quantify these changes, we observe a reduction of approximately 993.88 mm in rainfall over the first decade, followed by a decrease of about 612.12 mm in the subsequent decade. The temperature increased by 0.14 °C in the first decade and 0.09 °C in the second decade. These quantified changes underscore the pronounced impact of climate change on Lagos City’s environmental dynamics. Evidently, in Figure 7, urbanization has led to a rise in temperature due to the concentration of buildings, concrete surfaces, and industrial activities, which absorb and radiate heat. This phenomenon, known as the urban heat island effect, intensifies local temperatures. Urban areas often have reduced vegetation cover, leading to less evaporative cooling and higher temperatures. Furthermore, as built environments replace natural landscapes, there is a decrease in rainfall, as urban surfaces are less permeable, leading to reduced groundwater recharge and altered precipitation patterns [49].

4. Discussion

4.1. Urbanization Processes and Their Effects

It is essential to incorporate environmental sustainability when measuring economic growth to ensure that progress is aligned with the well-being of current and future generations [50]. Urbanization, a global phenomenon, brings about a variety of transformations that impact societies, economies, natural areas, and environments. With cities expanding to accommodate growing populations, there is a surge in infrastructure development, including the construction of roads, buildings, and utilities, leading to sprawling urban landscapes [51,52]. Unfortunately, this expansion encroaches upon natural areas and leads to deforestation, habitat loss, and the fragmentation of ecosystems. As urban areas sprawl, green spaces are also affected, which alters local climates and affects biodiversity. This reshaping of landscapes puts a strain on natural resources and leads to escalated pollution and waste generation. As a solution, some cities prioritize sustainable development, focusing on compact, transit-oriented communities to reduce environmental impact [53].
Though urbanization is a driving force behind economic growth, it also increases the demand for artificial lighting in urban areas. This constant illumination is a defining feature of expanding cities that enables 24 h commercial and industrial activities. However, while artificial light at night (ALAN) is a symbol of urban vitality, it poses a serious threat to plant life and their photosynthetic processes [54]. ALAN disrupts natural light cycles, affecting plant physiology and their ability to photosynthesize efficiently. This disruption, caused by the prevalent issue of nighttime light pollution, ultimately compromises the health, growth, and ecological balance of vegetation. This emphasizes the complex relationship between urbanization-driven economic progress and the unintended ecological consequences that arise from excessive artificial lighting at night.
As technology advances and global development continues, recent studies have highlighted the value of nighttime data as a monitoring tool for sustainability and urban growth [34,37,55,56,57,58,59]. Figure 3 shows that the increase in NTL indicates Lagos is solely for economic growth. There are several contributing factors at play. As the population grows, there is a greater need for housing, businesses, and infrastructure, resulting in more illuminated structures at night. Additionally, more people are moving to cities from rural areas, and there is a higher demand for transportation and services, leading to an increase in the number of vehicles and objects on the roads at night. This overall increase in night light is a sign of urbanization, accompanied by economic activity and job opportunities. While urbanization improves job creation, economic growth, and quality of life, it also causes environmental problems, social inequality, traffic congestion, and air and water pollution.

4.2. Does Economic Growth Lead to Urban Expansion and Observed Changes in Climate Parameters?

Economic growth often leads to urban expansion and climate change, though the relationship is complex and multifaceted [60,61,62]. As economies grow, there is typically an increase in economic activities, which, in turn, drives urbanization. This urban expansion involves the construction of buildings, infrastructure, and transportation networks [63]. This process can lead to land-use changes, deforestation, and the conversion of natural landscapes into built environments. As cities expand horizontally to accommodate growing populations and economic activities, they often sprawl into previously undeveloped areas, potentially encroaching on valuable ecosystems and exacerbating habitat loss [64,65,66]. Simultaneously, economic growth is frequently associated with increased energy consumption and higher levels of greenhouse gas emissions. Industries, transportation, and residential sectors often contribute significantly to carbon emissions, especially in rapidly growing urban areas [67,68]. Moreover, urbanization can lead to changes in consumption patterns, including increased demand for energy-intensive goods and services. This, in turn, puts additional pressure on natural resources and contributes to climate change. Table 3 reveals a complex interplay between population growth, urban growth, and climate change in Lagos.
According to Table 3, it is evident that economic growth, as indicated by the expansion of the area covered by NTL, is contributing to the spatial expansion of urban areas. This is supported by the fact that the NTL-covered area increased by an additional 455.63 km2 in just two decades, accounting for 72.1% of the total in 2020. On the built-up side, during this period, the added coverage area amounted to 779.73 km2, representing 61.3% of the total in 2020. This significant built-up expansion has affected vegetation cover, with a loss of approximately 653.72 km2, equivalent to 37.2% of the area in 2020. This reduction in vegetation cover is likely one of several factors influencing a decrease in rainfall by about 1606 mm and an increase in temperature by approximately 0.23 °C over two decades. Furthermore, these changes underscore the analytical connection between built-up expansion, its impact on vegetation cover, and the subsequent effects on rainfall and temperature.

5. Conclusions

This study highlights the relationship between development, population growth, urban expansion, and observed changes in climate parameters. The city’s exponential expansion is reflected in the increase in nighttime light, corresponding to a considerable population rise over two decades. However, this remarkable growth has had significant environmental consequences. The relationship between horizontal urban expansion and nighttime light indicates that urban areas encroach on natural landscapes as the city expands. This trend is further corroborated by the relationship between urban development and vegetation, as well as between temperature and vegetation. The area of Lagos illuminated by nightlights increased from 175.53 km2 in 2000 to 631.16 km2 in 2020, signifying the city’s rapid economic growth and population expansion. Correspondingly, the built-up land area in Lagos increased from 492.21 km2 in 2000 to 1271.94 km2 in 2020 due to the city’s economic growth, population expansion, and conversion of agricultural and forest land into urban space. However, the vegetation area in Lagos decreased from 2410.08 km2 in 2000 to 1756.36 km2 in 2020, indicating the displacement of vegetation to built-up land and the harsh effects of climate change. The average annual rainfall in Lagos also declined from 2954.81 mm in 2000 to 1348.81 mm in 2020, which can cause more erratic weather patterns and extreme weather events. Furthermore, the average annual temperature in Lagos increased from 31.56 °C in 2000 to 31.79 °C in 2020, which is linked to climate change and global warming. Excessive artificial lighting at night has become a significant challenge linked to changes in climate parameters due to its contribution to increased energy consumption and greenhouse gas emissions, primarily resulting from electricity generation. The usage of inefficient outdoor lighting sources, such as traditional streetlights, exacerbates the environmental impact, while disrupted natural light–dark cycles can adversely impact ecosystems and wildlife by influencing their behavior and contributing to biodiversity loss, further disrupting the balance of ecosystems essential for climate regulation. Nighttime pollution has also been shown to have an adverse effect on photosynthesis processes, which can significantly impact the ecosystem. In the context of Lagos, the city’s rapid economic growth and population expansion have resulted in increased urbanization and deforestation, which, in turn, have contributed to the city’s vulnerability to climate change. Therefore, compact city planning that emphasizes vertical development and efficient land use becomes increasingly important as the city expands, as it can play a crucial role in mitigating urban sprawl and preserving green areas.
This study highlights the effectiveness of remote sensing and GIS in monitoring the environment for sustainable and safe cities. Therefore, this paper proposes the use of night light data mainly to illustrate the relationship among night light, carbon emission, and urban sprawl in future research.

Author Contributions

K.M.G.: conceptualization, methodology, formal analysis, visualization, and draft writing. Y.S.: supervision, fund acquisition and draft review and editing. All authors have read and agreed to the published version of the manuscript.

Funding

This study was funded by Shenzhen Planning and Land Development Research Center. “Case Analysis of Urban Planning and Construction of Global Cities” (2021FY0001–2588).

Data Availability Statement

All the researched data links are attached to the data table.

Acknowledgments

The authors would like to express their sincere gratitude to all the referenced authors and data owners for their contribution to the research. Additionally, the authors would like to acknowledge the editor and anonymous reviewers for their valuable feedback, which significantly improved the quality of the final manuscript.

Conflicts of Interest

The authors declare no conflict of interest.

Appendix A

Figure A1. Represents the monthly rainfall and temperature distribution in Lagos city. The chart illustrates the rainfall patterns for the years 2000, 2010, and 2020, denoted by (ac), respectively. Additionally, it displays the temperature trends for the same years, represented by (df).
Buildings 13 02999 g0a1

References

  1. Amri, I.; Giyarsih, S.R. Monitoring urban physical growth in tsunami-affected areas: A case study of Banda Aceh City, Indonesia. GeoJournal 2022, 87, 1929–1944. [Google Scholar] [CrossRef]
  2. Kleyn, F.J.; Ciacciariello, M. Future demands of the poultry industry: Will we meet our commitments sustainably in developed and developing economies? World’s Poult. Sci. J. 2021, 77, 267–278. [Google Scholar] [CrossRef]
  3. UNDP. Rapid Urbanization: Opportunities and Challenges to Improve the Well-Being of Societies. Hum. Dev. Rep. 2017. Available online: https://hdr.undp.org/content/rapid-urbanisation-opportunities-and-challenges-improve-well-being-societies (accessed on 8 September 2023).
  4. Ahmed, Z.; Asghar, M.M.; Malik, M.N.; Nawaz, K. Moving towards a sustainable environment: The dynamic linkage between natural resources, human capital, urbanization, economic growth, and ecological footprint in China. Resour. Policy 2020, 67, 101677. [Google Scholar] [CrossRef]
  5. Kim, S. The effects of foreign direct investment, economic growth, industrial structure, renewable and nuclear energy, and urbanization on Korean greenhouse gas emissions. Sustainability 2020, 12, 1625. [Google Scholar] [CrossRef]
  6. UN Secretary-General Antonio Guterres. UN Chief Highlights ‘Enormous’ Benefits of Greener Cities. Bolnews. 2021. Available online: https://www.bolnews.com/latest/2021/10/un-chief-highlights-enormous-benefits-of-greener-cities/ (accessed on 15 August 2023).
  7. Maja, M.M.; Ayano, S.F. The impact of population growth on natural resources and farmers’ capacity to adapt to climate change in low-income countries. Earth Syst. Environ. 2021, 5, 271–283. [Google Scholar] [CrossRef]
  8. Komugabe-Dixson, A.F.; de Ville, N.S.; Trundle, A.; McEvoy, D. Environmental change, urbanization, and socio-ecological resilience in the Pacific: Community narratives from Port Vila, Vanuatu. Ecosyst. Serv. 2019, 39, 100973. [Google Scholar] [CrossRef]
  9. Shao, Z.; Sumari, N.S.; Portnov, A.; Ujoh, F.; Musakwa, W.; Mandela, P.J. Urban sprawl and its impact on sustainable urban development: A combination of remote sensing and social media data. Geo-Spat. Inf. Sci. 2021, 24, 241–255. [Google Scholar] [CrossRef]
  10. Yang, X. Analysis of Urban Ecological Vulnerability and prospects under the Impact of Urban Expansion. SHS Web Conf. 2023, 155, 01012. [Google Scholar] [CrossRef]
  11. Burton, I. Report on Reports: Our Common Future, Environment: Science and Policy for Sustainable Development. Environ. Sci. Policy Sustain. Dev. 1987, 29, 25–29. [Google Scholar] [CrossRef]
  12. Bermejo, R.; Bermejo, R. Sustainable Development in the Brundtland Report and Its Distortion. In Handbook for a Sustainable Economy; Springer: Berlin/Heidelberg, Germany, 2014; pp. 69–82. [Google Scholar]
  13. Faisal Koko, A.; Yue, W.; Abdullahi Abubakar, G.; Hamed, R.; Noman Alabsi, A.A. Analyzing urban growth and land cover change scenario in Lagos, Nigeria, using multi-temporal remote sensing data and GIS to mitigate flooding. Geomat. Nat. Hazards Risk 2021, 12, 631–652. [Google Scholar] [CrossRef]
  14. Asuquo Enoh, M.; Ebere Njoku, R.; Chinenye Okeke, U. Modeling and mapping the spatial-temporal changes in land use and land cover in Lagos: A dynamics for building a sustainable urban city. Adv. Space Res. 2023, 72, 694–710. [Google Scholar] [CrossRef]
  15. Simwanda, M.; Ranagalage, M.; Estoque, R.C.; Murayama, Y. Spatial analysis of surface urban heat islands in four rapidly growing African cities. Remote Sens. 2019, 11, 1645. [Google Scholar] [CrossRef]
  16. Avis, W.R.; University of Birmingham. Urban Expansion in Nigeria; K4D Helpdesk Report 692; Institute of Development Studies: Brighton, UK, 2019; Available online: https://opendocs.ids.ac.uk/opendocs/bitstream/handle/20.500.12413/14797/692_Urban_Expansion_of_Nigerian_Cities.pdf (accessed on 15 September 2023).
  17. Gandy, M. Planning, anti-planning and the infrastructure crisis facing metropolitan Lagos. Urban Stud. 2006, 43, 371–396. [Google Scholar] [CrossRef]
  18. Chen, J.; Cao, X.; Peng, S.; Ren, H. Analysis, and applications of GlobeLand30: A review. ISPRS Int. J. Geo-Inf. 2017, 6, 230. [Google Scholar] [CrossRef]
  19. Zheng, Q.; Seto, K.C.; Zhou, Y.; You, S.; Weng, Q. Nighttime light remote sensing for urban applications: Progress, challenges, and prospects. ISPRS J. Photogramm. Remote Sens. 2023, 202, 125–141. [Google Scholar] [CrossRef]
  20. Hasan, S.; Shi, W.; Zhu, X.; Abbas, S. Monitoring of land use/land cover and socioeconomic changes in south China over the last three decades using landsat and nighttime light data. Remote Sens. 2019, 11, 1658. [Google Scholar] [CrossRef]
  21. Huang, Q.; Yang, X.; Gao, B.; Yang, Y.; Zhao, Y. Application of DMSP/OLS nighttime light images: A meta-analysis and a systematic literature review. Remote Sens. 2014, 6, 6844–6866. [Google Scholar] [CrossRef]
  22. Shi, Y.; Zhou, L.; Guo, X.; Li, J. The multidimensional measurement method of urban sprawl and its empirical analysis in Shanghai metropolitan area. Sustainability 2023, 15, 1020. [Google Scholar] [CrossRef]
  23. Onilude, O.O.; Vaz, E. Urban sprawl and growth prediction for Lagos using GlobeLand30 data and cellular automata model. Sci 2021, 3, 23. [Google Scholar] [CrossRef]
  24. Onilude, O.O.; Vaz, E. Data analysis of land use change and urban and rural impacts in Lagos state, Nigeria. Data 2020, 5, 72. [Google Scholar] [CrossRef]
  25. Molla, A.; Di, L.; Guo, L.; Zhang, C.; Chen, F. Spatio-temporal responses of precipitation to urbanization with Google Earth Engine: A case study for Lagos, Nigeria. Urban Sci. 2022, 6, 40. [Google Scholar] [CrossRef]
  26. Dissanayake, D.; Morimoto, T.; Murayama, Y.; Ranagalage, M.; Handayani, H.H. Impact of urban surface characteristics and socio-economic variables on the spatial variation of land surface temperature in Lagos City, Nigeria. Sustainability 2018, 11, 25. [Google Scholar] [CrossRef]
  27. Banke-Thomas, A.; Avoka, C.K.-O.; Gwacham-Anisiobi, U.; Omololu, O.; Balogun, M.; Wright, K.; Fasesin, T.T.; Olusi, A.; Afolabi, B.B.; Ameh, C. Travel of pregnant women in emergency situations to hospital and maternal mortality in Lagos, Nigeria: A retrospective cohort study. BMJ Glob. Health 2022, 7, e008604. [Google Scholar] [CrossRef] [PubMed]
  28. Badmos, O.S.; Callo-Concha, D.; Agbola, B.; Rienow, A.; Badmos, B.; Greve, K.; Jürgens, C. Determinants of residential location choices by slum dwellers in Lagos megacity. Cities 2020, 98, 102589. [Google Scholar] [CrossRef]
  29. Gilbert, K.M.; Shi, Y. Slums evolution and sustainable urban growth: A comparative study of Makoko and Badia-east areas in Lagos City. Sustainability 2023, 15, 14353. [Google Scholar] [CrossRef]
  30. Elias, P.; Omojola, A. Case study: The challenges of climate change for Lagos, Nigeria. Curr. Opin. Environ. Sustain. 2015, 13, 74–78. [Google Scholar] [CrossRef]
  31. Uduku, O.; Lawanson, T.; Ogodo, O. Lagos: City Scoping Study. Manchester, UK: African Cities Research Consortium, The University of Manchester. 2021. Available online: www.african-cities.org/ (accessed on 21 September 2023).
  32. Dineshkumar, C.; Nitheshnirmal, S.; Bhardwaj, A.; Priyadarshini, K.N. Phenological monitoring of paddy crop using time series modis data. Multidiscip. Digit. Publ. Inst. Proc. 2019, 24, 19. [Google Scholar]
  33. Zhang, F.; Wang, C.; Zhang, C.; Wan, J. Comparing the Performance of CMCC-BioClimInd and WorldClim Datasets in Predicting Global Invasive Plant Distributions. Biology 2023, 12, 652. [Google Scholar] [CrossRef] [PubMed]
  34. Levin, N.; Kyba, C.C.; Zhang, Q.; de Miguel, A.S.; Román, M.O.; Li, X.; Portnov, B.A.; Molthan, A.L.; Jechow, A.; Miller, S.D.; et al. Remote sensing of night lights: A review and an outlook for the future. Remote Sens. Environ. 2020, 237, 111443. [Google Scholar] [CrossRef]
  35. Xin, A. Correlation between surface temperature and population density in Xiong’an New Area based on nightlight remote sensing and Landsat8 data. Highlights Sci. Eng. Technol. 2023, 59, 29–36. [Google Scholar] [CrossRef]
  36. Duque, J.C.; Lozano-Gracia, N.; Patino, J.E.; Restrepo, P.; Velasquez, W.A. Spatiotemporal dynamics of urban growth in Latin American cities: An analysis using nighttime light imagery. Landsc. Urban Plan. 2019, 191, 103640. [Google Scholar] [CrossRef]
  37. Ortakavak, Z.; Çabuk, S.N.; Cetin, M.; Kurkcuoglu, M.A.S.; Cabuk, A. Determination of the nighttime light imagery for urban city population using DMSP-OLS methods in Istanbul. Environ. Monit. Assess. 2020, 192, 790. [Google Scholar] [CrossRef] [PubMed]
  38. Ministry of Economic Planning and Budgeting, Lagos state. Lagos State Macro-Economic Indicators January. 2022. Available online: https://www.lagosmepb.org/wp-content/uploads/MACRO-INDICATOR-FLYER-JUNE-2022.pdf (accessed on 15 October 2023).
  39. Wei, X.; Liu, Y.; Qi, L.; Chen, J.; Wang, G.; Zhang, L.; Liu, R. Monitoring Forest dynamics in Africa during 2000–2020 using a remotely sensed fractional tree cover dataset. Int. J. Digit. Earth 2023, 16, 2212–2232. [Google Scholar] [CrossRef]
  40. Wei, X.; Zhang, W.; Zhang, Z.; Huang, H.; Meng, L. Urban land use land cover classification based on GF-6 satellite imagery and multi-feature optimization. Geocarto. Int. 2023, 38, 2236579. [Google Scholar] [CrossRef]
  41. Pawar, U.; Hire, P.; Gunathilake, M.B.; Rathnayake, U. Spatiotemporal rainfall variability and trends over the Mahi basin, India. Climate 2023, 11, 163. [Google Scholar] [CrossRef]
  42. Li, S.; Cao, X.; Zhao, C.; Jie, N.; Liu, L.; Chen, X.; Cui, X. Developing a pixel-scale corrected nighttime light dataset (PCNL, 1992–2021) combining DMSP-OLS and NPP-VIIRS. Remote Sens. 2023, 15, 3925. [Google Scholar] [CrossRef]
  43. Sono, D.; Wei, Y.; Chen, Z.; Jin, Y. Spatiotemporal evolution of West Africa’s urban landscape characteristics applying harmonized DMSP-OLS and NPP-VIIRS nighttime light (NTL) data. Chin. Geogr. Sci. 2022, 32, 933–945. [Google Scholar] [CrossRef]
  44. Bartesaghi-Koc, C.; Osmond, P.; Peters, A. Quantifying the seasonal cooling capacity of ‘green infrastructure types’ (GITs): An approach to assess and mitigate surface urban heat island in Sydney, Australia. Landsc. Urban Plan. 2020, 203, 103893. [Google Scholar] [CrossRef]
  45. Catorci, A.; Lulli, R.; Malatesta, L.; Tavoloni, M.; Tardella, F.M. How the interplay between management and interannual climatic variability influences the NDVI variation in a sub-Mediterranean pastoral system: Insight into sustainable grassland use under climate change. Agric. Ecosyst. Environ. 2021, 314, 107372. [Google Scholar] [CrossRef]
  46. Li, X.; Yang, L. Accelerated restoration of vegetation in Wuwei in the arid region of Northwestern China since 2000 driven by the Interaction between climate and human beings. Remote Sens. 2023, 15, 2675. [Google Scholar] [CrossRef]
  47. Ouyang, W.; Wan, X.; Xu, Y.; Wang, X.; Lin, C. Vertical difference of climate change impacts on vegetation at temporal-spatial scales in the upper stream of the Mekong River Basin. Sci. Total Environ. 2020, 701, 134782. [Google Scholar] [CrossRef] [PubMed]
  48. Irfeey, A.M.M.; Chau, H.-W.; Sumaiya, M.M.F.; Wai, C.Y.; Muttil, N.; Jamei, E. Sustainable mitigation strategies for urban heat island effects in urban areas. Sustainability 2023, 15, 10767. [Google Scholar] [CrossRef]
  49. Croce, S.; Vettorato, D. Urban surface uses for climate resilient and sustainable cities: A catalogue of solutions. Sustain. Cities Soc. 2021, 75, 103313. [Google Scholar] [CrossRef]
  50. Khan, S.A.R.; Zhang, Y.; Kumar, A.; Zavadskas, E.; Streimikiene, D. Measuring the impact of renewable energy, public health expenditure, logistics, and environmental performance on sustainable economic growth. Sustain. Dev. 2020, 28, 833–843. [Google Scholar] [CrossRef]
  51. Narayani, A.R.; Nagalakshmi, R. Understanding urban sprawl trends in peri urban regions across global cities-survey of case studies. Cities Health 2023, 7, 492–504. [Google Scholar] [CrossRef]
  52. Cengiz, S.; Görmüş, S.; Oğuz, D. Analysis of the urban growth pattern through spatial metrics; Ankara City. Land Use Policy. 2022, 112, 105812. [Google Scholar] [CrossRef]
  53. Aoki, T. The possibility of reorganising transit-oriented development: A case study of low-density occurrence around railway station spheres in the Keihanshin conurbation, Japan. Int. Rev. Spat. Plan. Sustain. Dev. 2022, 10, 55–78. [Google Scholar]
  54. Wei, Y.; Li, Z.; Zhang, J.; Hu, D. Influence of night-time light pollution on the photosynthesis and physiological characteristics of the urban plants Euonymus japonicus and Rosa hybrida. Ecol. Process. 2023, 12, 38. [Google Scholar] [CrossRef]
  55. Ariken, M.; Zhang, F.; Liu, K.; Fang, C.; Kung, H.-T. Coupling coordination analysis of urbanization and eco-environment in Yanqi Basin based on multi-source remote sensing data. Ecol. Indic. 2020, 114, 106331. [Google Scholar] [CrossRef]
  56. Zhao, M.; Zhou, Y.; Li, X.; Cheng, W.; Zhou, C.; Ma, T.; Li, M.; Huang, K. Mapping urban dynamics (1992–2018) in Southeast Asia using consistent nighttime light data from DMSP and VIIRS. Remote Sens. Environ. 2020, 248, 111980. [Google Scholar] [CrossRef]
  57. Liu, L.; Li, Z.; Fu, X.; Liu, X.; Li, Z.; Zheng, W. Impact of power on uneven development: Evaluating built-up area changes in Chengdu based on NPP-VIIRS images (2015–2019). Land 2022, 11, 489. [Google Scholar] [CrossRef]
  58. Qiang, Y.; Huang, Q.; Xu, J. Observing community resilience from space: Using nighttime lights to model economic disturbance and recovery pattern in natural disaster. Sustain. Cities Soc. 2020, 57, 102115. [Google Scholar] [CrossRef]
  59. Gao, K.; Yuan, Y. Is the sky of smart city bluer? Evidence from satellite monitoring data. J. Environ. Manag. 2022, 317, 115483. [Google Scholar] [CrossRef] [PubMed]
  60. Szpilko, D. Foresight as a tool for the planning and implementation of visions for smart city development. Energies 2020, 13, 1782. [Google Scholar] [CrossRef]
  61. Zhang, D.; Xu, J.; Zhang, Y.; Wang, J.; He, S.; Zhou, X. Study on sustainable urbanization literature based on Web of Science, Scopus, and China national knowledge infrastructure: A scient metric analysis in CiteSpace. J. Clean. Prod. 2020, 264, 121537. [Google Scholar] [CrossRef]
  62. Liu, X.; Pei, F.; Wen, Y.; Li, X.; Wang, S.; Wu, C.; Cai, Y.; Wu, J.; Chen, J.; Feng, K.; et al. Global urban expansion offsets climate-driven increases in terrestrial net primary productivity. Nat. Commun. 2019, 10, 5558. [Google Scholar] [CrossRef] [PubMed]
  63. Sarkodie, S.A.; Owusu, P.A.; Leirvik, T. Global effect of urban sprawl, industrialization, trade and economic development on carbon dioxide emissions. Environ. Res. Lett. 2020, 15, 034049. [Google Scholar] [CrossRef]
  64. Kuusaana, E.D.; Kosoe, E.A.; Niminga-Beka, R.Y.; Ahmed, A. Spatial justice and inner-city development in secondary cities of Ghana: Implications for new urban agenda in the Global South. Urban Forum 2021, 32, 373–391. [Google Scholar] [CrossRef]
  65. Mirza, I.A.; Javed, R.R.; Mayo, S.M.; Ain, N. A Evaluating spatio-temporal decline to agriculture through satellite imagery from 2010–2022. Int. J. Agric. Sustain. Dev. 2022, 4, 136–150. [Google Scholar]
  66. Toku, A.; Osumanu, I.K.; Owusu-Sekyere, E.; Amoah, S.T. Conflicting urban land uses at the fringes: Issues and experiences of peri-urban farmers in an urbanizing city in Ghana. SN Soc. Sci. 2021, 1, 189. [Google Scholar] [CrossRef]
  67. Zhang, S.; Li, Z.; Ning, X.; Li, L. Gauging the impacts of urbanization on CO2 emissions from the construction industry: Evidence from China. J. Environ. Manag. 2021, 288, 112440. [Google Scholar] [CrossRef] [PubMed]
  68. Phuc Nguyen, C.; Schinckus, C.; Dinh Su, T. Economic integration, and CO2 emissions: Evidence from emerging economies. Clim. Dev. 2020, 12, 369–384. [Google Scholar] [CrossRef]
Figure 1. Study area location map Lagos city. The (upper panel) highlights the current situation using base maps and shapefiles. The dark blue areas represent water bodies, the gray-colored areas signify built-up settlements, and the green areas denote regions currently covered by vegetation. The “20 LGA in Lagos” in the (lower panel) stands for sixteen urban and four rural distinct local government areas.
Buildings 13 02999 g001
Figure 2. Population growth of Lagos city.
Buildings 13 02999 g002
Figure 3. (a) Depicts the expansion of nighttime light coverage spanning two decades, while (b) illustrates the comparison between the expansion of nighttime light coverage and population growth in the year 2000 (represented by the first dot), 2010 (represented by the second dot), and 2020 (represented by the third dot).
Buildings 13 02999 g003
Figure 4. (a) LULC maps for (top to bottom) 2000, 2010, and 2020, using three classes: built-up, vegetation, and water bodies. (b) Changes in each LULC class expressed in square kilometers.
Buildings 13 02999 g004
Figure 5. Annual rainfall and temperature trends for 2000, 2010, and 2020. (ac) Depict the annual rainfall for each respective year, while figures (df) showcase the annual temperature trends for the same years.
Buildings 13 02999 g005
Figure 6. Highlights the correlations between rainfall and NDVI, as well as between temperature and NDVI. The data are presented in six graphs, depicting the relationship between NDVI and temperature for 2000 (a), 2010 (b), and 2020 (c), and between NDVI and monthly rainfall for 2000 (d), 2010 (e), and 2020 (f).
Buildings 13 02999 g006
Figure 7. Illustrates changes in precipitation, temperature, and vegetation index over two decades. Specifically, (a) average precipitation changes over this period, (b) average temperature changes, (c) comparison between changes in temperature and rainfall for 2000, 2010, and 2020; the red line shows the change in annual temperature and the blue line shows the change in annual rainfall; and (d) changes in the Normalized Difference Vegetation Index (NDVI) for (top to bottom) 2000, 2010, and 2020.
Buildings 13 02999 g007
Table 1. Remotely sensed datasets and their sources.
Data OwnerData TypeResolutionYearsLink
NASALandsat images30 m2000, 2010, and 2020https://earthexplorer.usgs.gov/ (accessed on 3 March 2023)
NASAMODIS/Terra Vegetation Indices 16-Day L3 Global 250 m2000, 2010, and 2020https://ladsweb.modaps.eosdis.nasa.gov/ (accessed on 9 March 2023)
WorldClimMonthly total precipitation (mm) and temperature (°C)10 min (~340 km2)2000, 2010, and 2020https://worldclim.org/data/monthlywth.html (accessed on 22 March 2023)
National Environmental Information CenterNighttime lights data-2000, 2010, and 2020https://ngdc.noaa.gov/ (accessed on 7 April 2023)
DIVA-GISSpatial data: boundary shapefiles--https://www.diva-gis.org/gdata (accessed on 1 March 2023)
Table 2. Changes and the annual percentage of change.
Class NameChange in Square Kilometers (km2)Change in Percentage (%)
2000–20102010–2020 2000–20202000–20102010–20202000–2020
Built-up500.89278.83779.7213.27.420.6
Vegetation−510.68−143.18−653.86−13.5−3.8−17.3
Water bodies9.79−135.65−125.860.3−3.6−3.3
Table 3. Comparison between economic growth, LULC, and climate changes.
YearsNightlights (km2)Built-Up (km2)Vegetation (km2)Rainfall (mm)Temperature (°C)
2000175.53492.212410.082954.8131.56
2010396.72993.11899.41960.9331.70
2020631.161271.941756.361348.8131.79
Disclaimer/Publisher’s Note: The statements, opinions and data contained in all publications are solely those of the individual author(s) and contributor(s) and not of MDPI and/or the editor(s). MDPI and/or the editor(s) disclaim responsibility for any injury to people or property resulting from any ideas, methods, instructions or products referred to in the content.

