Abstract
The seismic performance of prefabricated reinforced concrete shear walls is a key point in the safety of the whole assembly structure under earthquake actions. In this study, six specimens of reinforced concrete shear walls were assembled with a cast-in-place vertical joint with a straight, L, or convex shape. The specimens were tested using a low cyclic loading test under an axial compression ratio of 0.2 or 0.3. The stress process, failure pattern, and hysteretic curve of each specimen were measured. Combined with a numerical analysis using the finite element method, the variations in the bearing capacity, stiffness degradation, ductility, and energy dissipation capacity of the tested specimens were analyzed. Results showed that all specimens failed in a shear pattern without an obvious failure phenomenon along the vertical joint. The hysteresis curves exhibited an obvious pinch phenomenon and good deformation ability. The seismic behavior decreased in sequence for the shear walls assembled with a cast-in-place vertical joint with a straight, L, or convex shape, while a higher axial compression ratio improved the bearing capacity of the shear walls. The shear wall with an L-shaped vertical joint had similar seismic behavior to that with a straight vertical joint, but the shear wall with a convex vertical joint exhibited a decrease of 8.5% and 10.9% in bearing capacity, 18.2% and 1.2% in ductility, and 13.1% and 20.6% in energy dissipation, respectively, under an axial compression ratio of 0.2 and 0.3. The bearing mechanisms of shear walls with different vertical joints are explained with the numerical analysis of the stress vector maps of concrete and the stress cloud maps of reinforcements at different stress levels.
1. Introduction
As an important part of building industrialization, prefabricated reinforced concrete structures face challenges in terms of widespread application in the new urbanization context [1,2,3]. It is estimated that prefabricated structures will account for 40% of new constructions by 2030 [4]. With the advantage of high-degree industrialization, prefabricated shear walls will be common in high-rise buildings. However, contrary to cast-in-place shear walls, the prefabricated shear wall is always weakened by the post-cast joints, which cannot effectively transfer the deformation of structures [5,6]. This highlights that the reliability of post-cast joints is very important to ensure the integrity and bearing performance of structures.
Normally, the vertical joint of the assembled shear wall is prefabricated as either straight, L-shaped, T-shaped, or cruciform. Depending on the force transferring mechanism, the joints can be divided into several categories: a reinforcement joint with soft cables, fluted grouting, anchor rebars, bolts, welded rebars, or prestressed strands; an occlusion joint, such as a two-way hollow slab shear wall joint; or a concrete joint with surface connection, including a superimposed slab, a hollow panel, or a mortise-tenon joint [7,8,9]. An experimental study on a shear wall with a vertical joint using a flexible cable connection showed that the shear capacity of the vertical joint was mainly composed of the interface shear friction from the tension of the flexible cables and the dowel resistance of the flexible cables themselves. However, it was difficult to ensure that the steel reinforcement was accurately inserted into the anchor ring to fix the soft cable, resulting in the removal of the soft cable if the shear wall was damaged. Comparatively, a prefabricated wall panel with superimposed slabs was superior in industrialization due to the lack of exposed steel reinforcement [10]. For the T-shaped and L-shaped precast superposed shear walls, using a quasi-static cyclic loading test, the failure mode changed from flexural failure to compressive-shear failure when the axial compression ratio increased from 0.20 to 0.40, leading to a decrease in ductility and deformation capacity [11,12]. However, the superimposed slab shear wall requires a complicated production process, as more than 50% of the amount of concrete is needed on site, and the dispersed concrete joint surfaces cause defects in the integrity of the structure [13]. A study on the seismic performance of prefabricated shear walls with a fluted grouting and anchor joint indicated that the outermost longitudinal rebars of the edge member yielded earlier, with the cracks distributed throughout the whole wall, and that the bearing capacity increased by 22.3% compared to the cast-in-place shear wall. Because the rebars in the prefabricated shear wall on the left and right sides were not connected with the steel cages in the grooves, the bonding of new and old concretes was reliable with the grooves. This ensured the better integrity of the prefabricated shear wall than the superimposed-slab shear wall. The damage of the prefabricated shear wall was caused by the broken rebars at the outermost edge of the concealed columns, while less damage occurred on the prefabricated shear wall, and the rebars in the cast-in-place joint could not be fully used [14]. Studies on the seismic performance of a precast two-way hollow slab shear wall showed that the failure mode was similar to that of the cast-in-place shear wall, and the relative deformation on both sides of the vertical joint could be decreased by increasing the axial compression ratio and decreasing the shear to span ratio. The hysteretic energy dissipation of a two-way hollow slab shear wall was approximately seven times that of a cast-in-place shear wall. The difficulties focus on the penetrating horizontal distribution rebars into the joint holes and the quality control of the caste-in-place concrete in the horizontal holes [15,16,17]. In this aspect, a prefabricated shear wall with mortise-tenon joints was proposed, and the results showed that the yield and the peak loads gradually increased with an increase in the axial compression ratio. The deformation ability could be improved because the concrete spalling off at the vertical joint reduced the root crushing of the prefabricated shear walls [18]. Meanwhile, prefabricated shear walls with bolt connections for a vertical joint failed due to a screw fracture and nut slip, exhibiting better energy dissipation performance [19].
Based on the above analyses, the vertical joint between the precast units of the shear wall plays an important role in the seismic performance of the prefabricated shear wall structure. However, the requirement of a large amount of cast-in-place concrete has not been overcome for the connection of precast units, while the joint steel bars are not able to ensure reliable linkage and anchorage. Moreover, it should be considered that no unified method for joints has been specified to ensure structural reliability on the basis of convenient and effective connection. Therefore, further research on the effectiveness of different types of joints is still necessary for prefabricated concrete structures. In this study, six specimens of prefabricated shear walls assembled with a cast-in-place concrete vertical joint with a straight, L, or convex shape were designed and studied using low cyclic loading tests and finite element analysis. The seismic behavior of the prefabricated shear walls was comprehensively evaluated in terms of concrete and reinforcement stress, failure mode, hysteresis curves, ductility, energy dissipation, stiffness degeneration, and bearing capacity. Because the bond of the straight interface between cast-in-place concrete and precast concrete is reliable without slip [6], shear walls with a straight cast-in-place vertical joint were used as a reference in the analysis. This allows us to deeply understand the seismic mechanisms of the prefabricated shear walls with cast-in-place vertical joints.
2. Experimental Work and Numerical Modeling
2.1. Preparation of Specimens
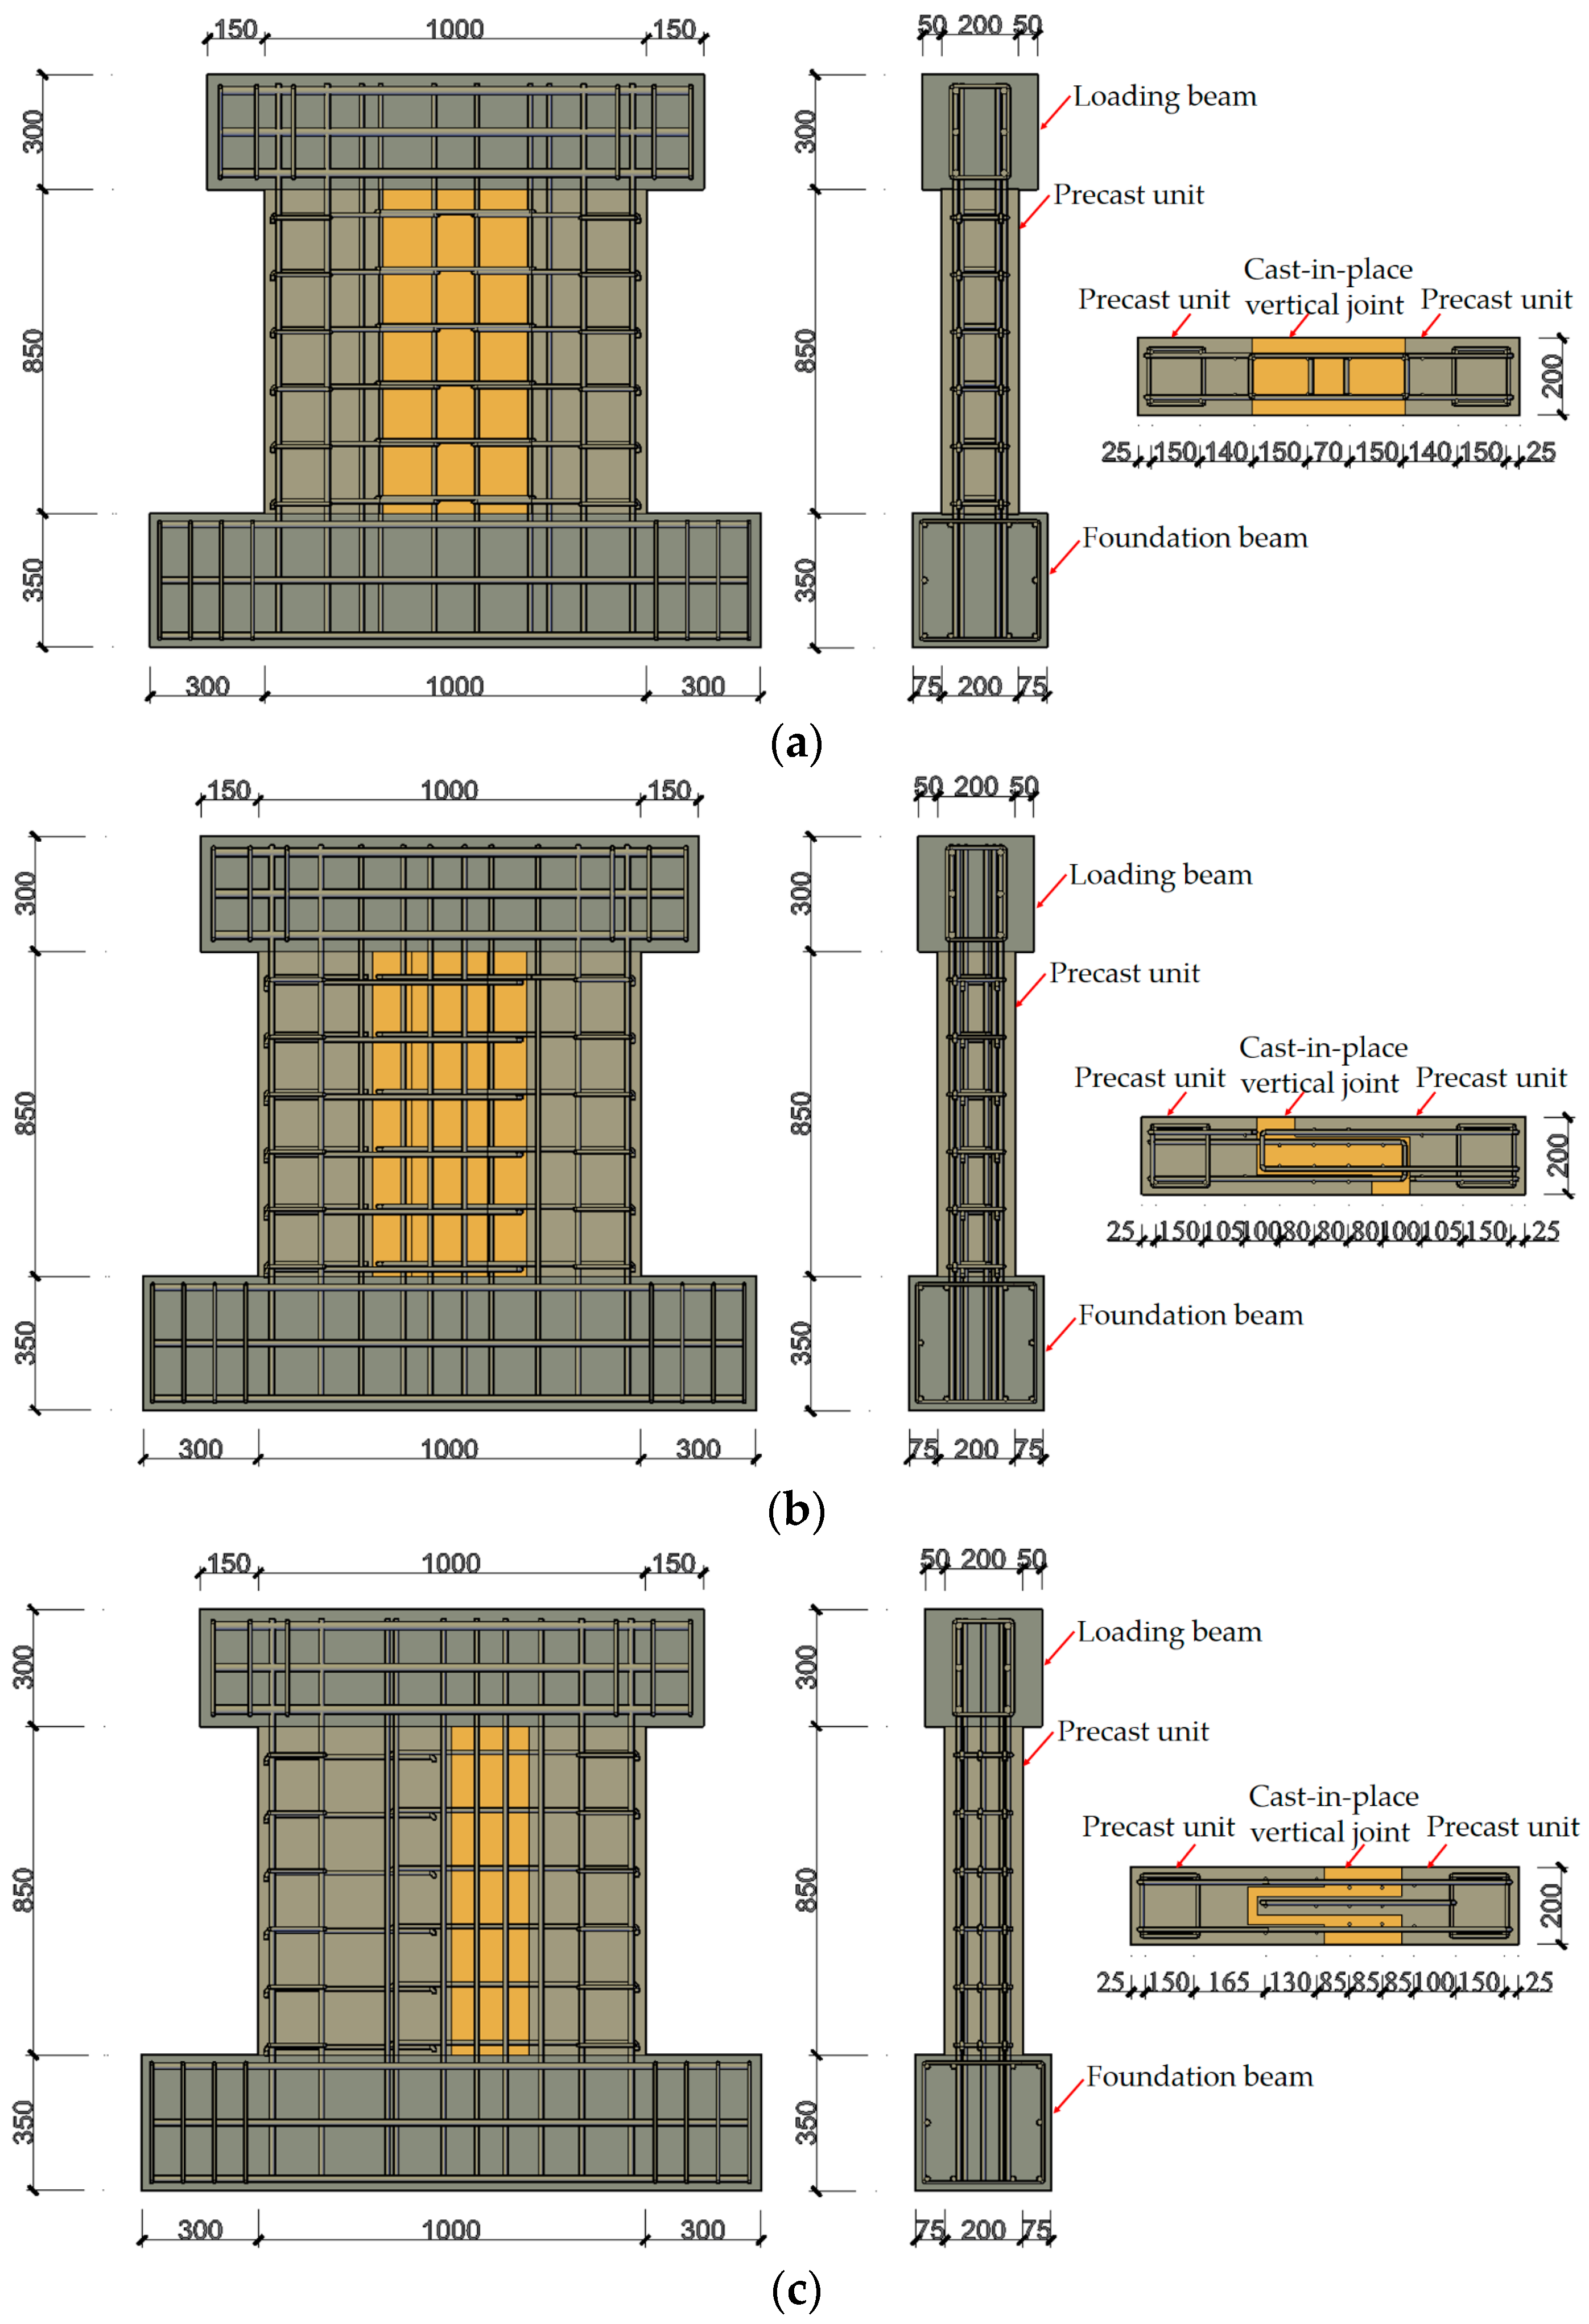
Six prefabricated shear walls were designed. The prefabricated shear walls were assembled with two precast units of shear wall with a cast-in-place concrete vertical joint and linked using the loading and foundation beams for low cyclic loading tests. As exhibited in Figure 1, the vertical joint had a straight, L, or convex shape.
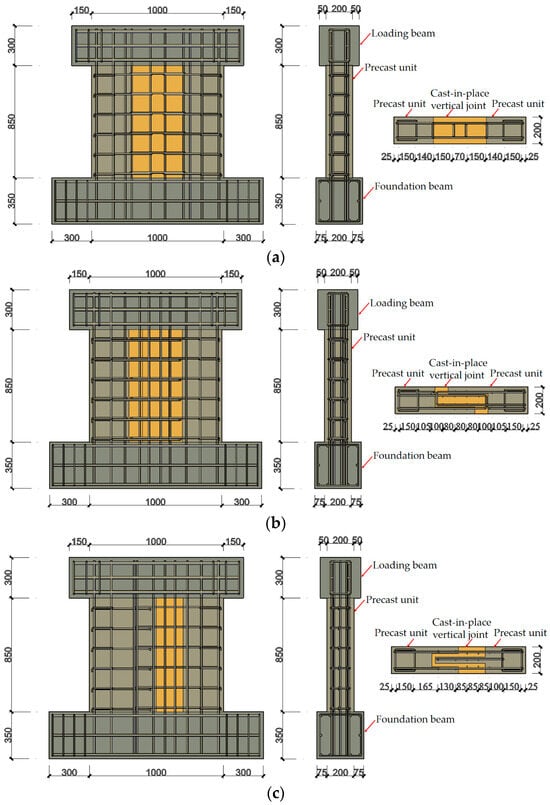
Figure 1.
Shear walls with a cast-in-place vertical joint in form of (a) straight; (b) L shape; (c) convex.
The prefabricated shear walls were 1000 mm high with a cross-section that was 1000 mm wide and 200 mm thick. The loading beam for the application of lateral loads was 1300 mm long with a cross-section that was 300 mm wide and 300 mm high. The foundation beam used for the foundation fixed to the test base was 1600 mm long with a cross-section that was 350 mm wide and 350 mm high. The lateral cyclic load was applied at the mid-height of the loading beam. This kept the shear to span ratio at 1.0 for the shear walls.
Table 1 shows the main design parameters of the six specimens of prefabricated shear walls. According to the material test results, the average cubic compressive strength of concrete was 38.1 MPa for the beams and the vertical joints, and the average cubic compressive strength of concrete was 34.1 MPa for the precast units of the shear walls. The hot-rolled ribbed HRB400E steel bars were used for the reinforcements, with a diameter of 10 mm, 8 mm, or 6 mm. Tensile tests were carried out to measure the mechanical properties of the steel bars. As summarized in Table 2, their mechanical properties met the requirements specified in China code GB 50010 [20]. The horizontal steel bars were arranged at a spacing of 150 mm.

Table 1.
Main design parameters of the shear walls.
Table 2.
Mechanical properties of steel bars.
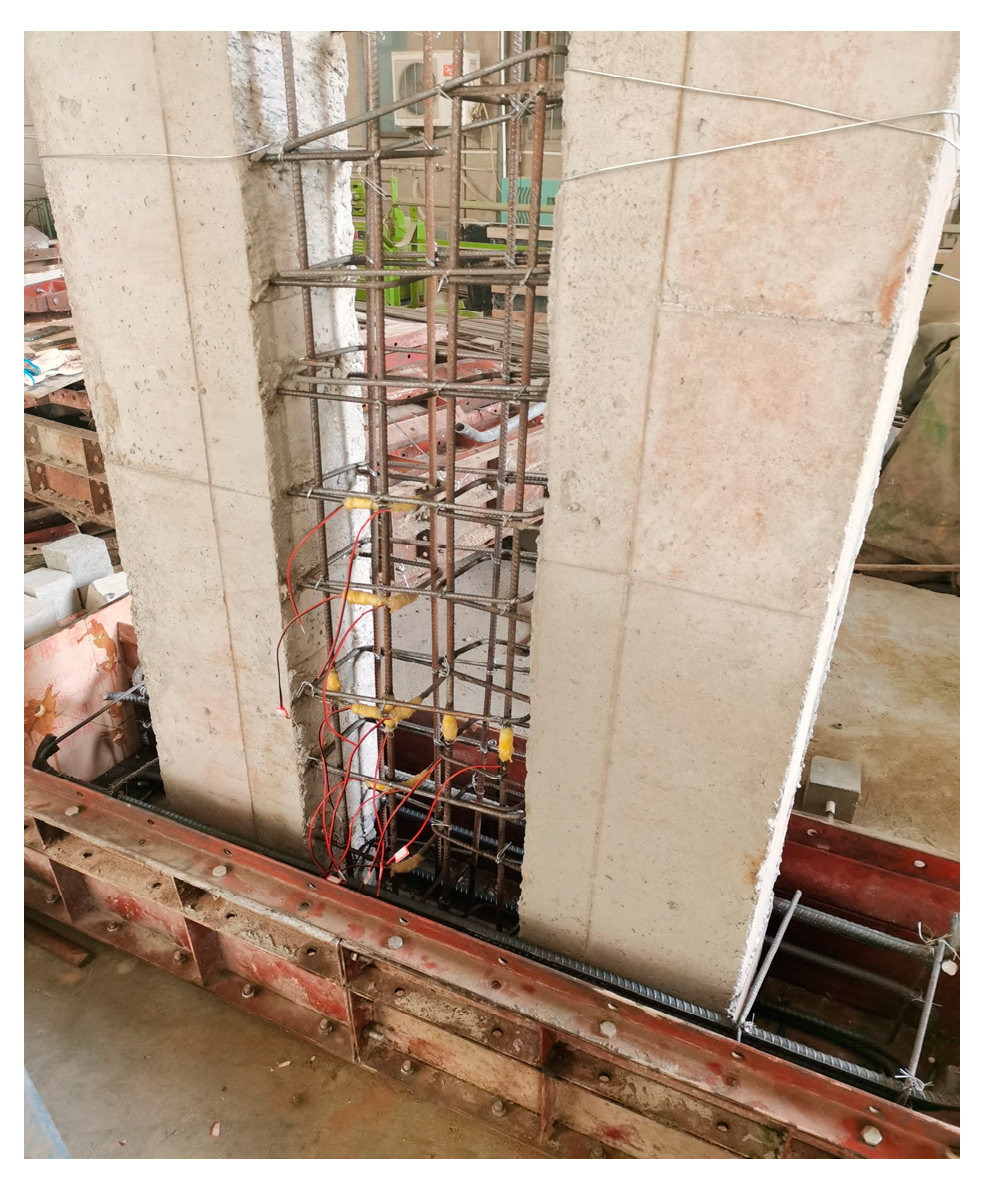
According to the assembled process, the precast units were first embedded into the foundation beam, and the reinforcements of the loading and foundation beams and the vertical joint were tied before the formwork was set up. The steel reinforcement layout of a straight vertical joint is shown in Figure 2. After this, the concrete was poured to form the foundation beam and the vertical joint. When the concrete reached the preset strength, the loading beam was cast.

Figure 2.
Steel reinforcement layout of a straight vertical joint.
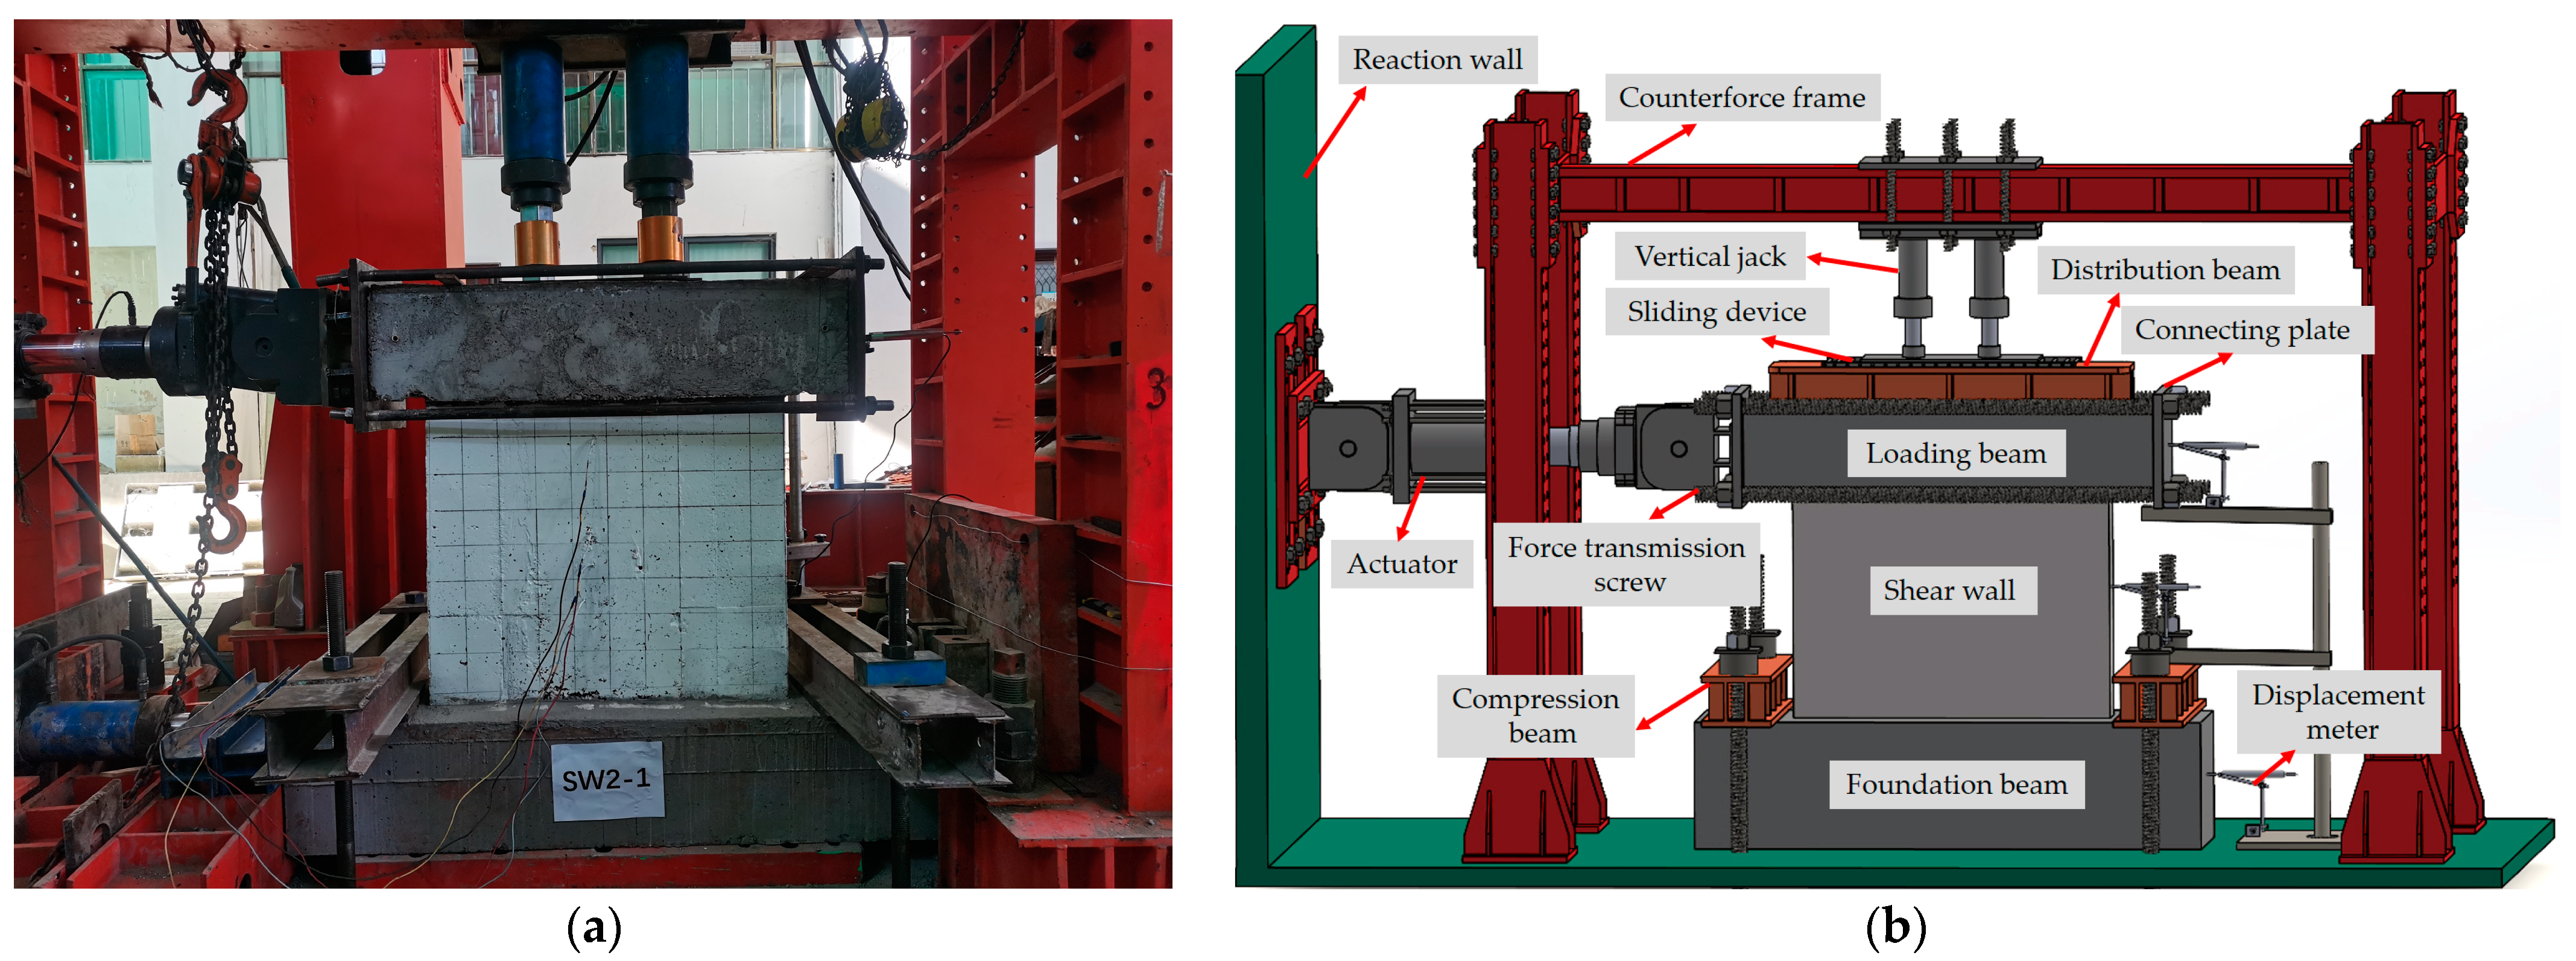
2.2. Test Method
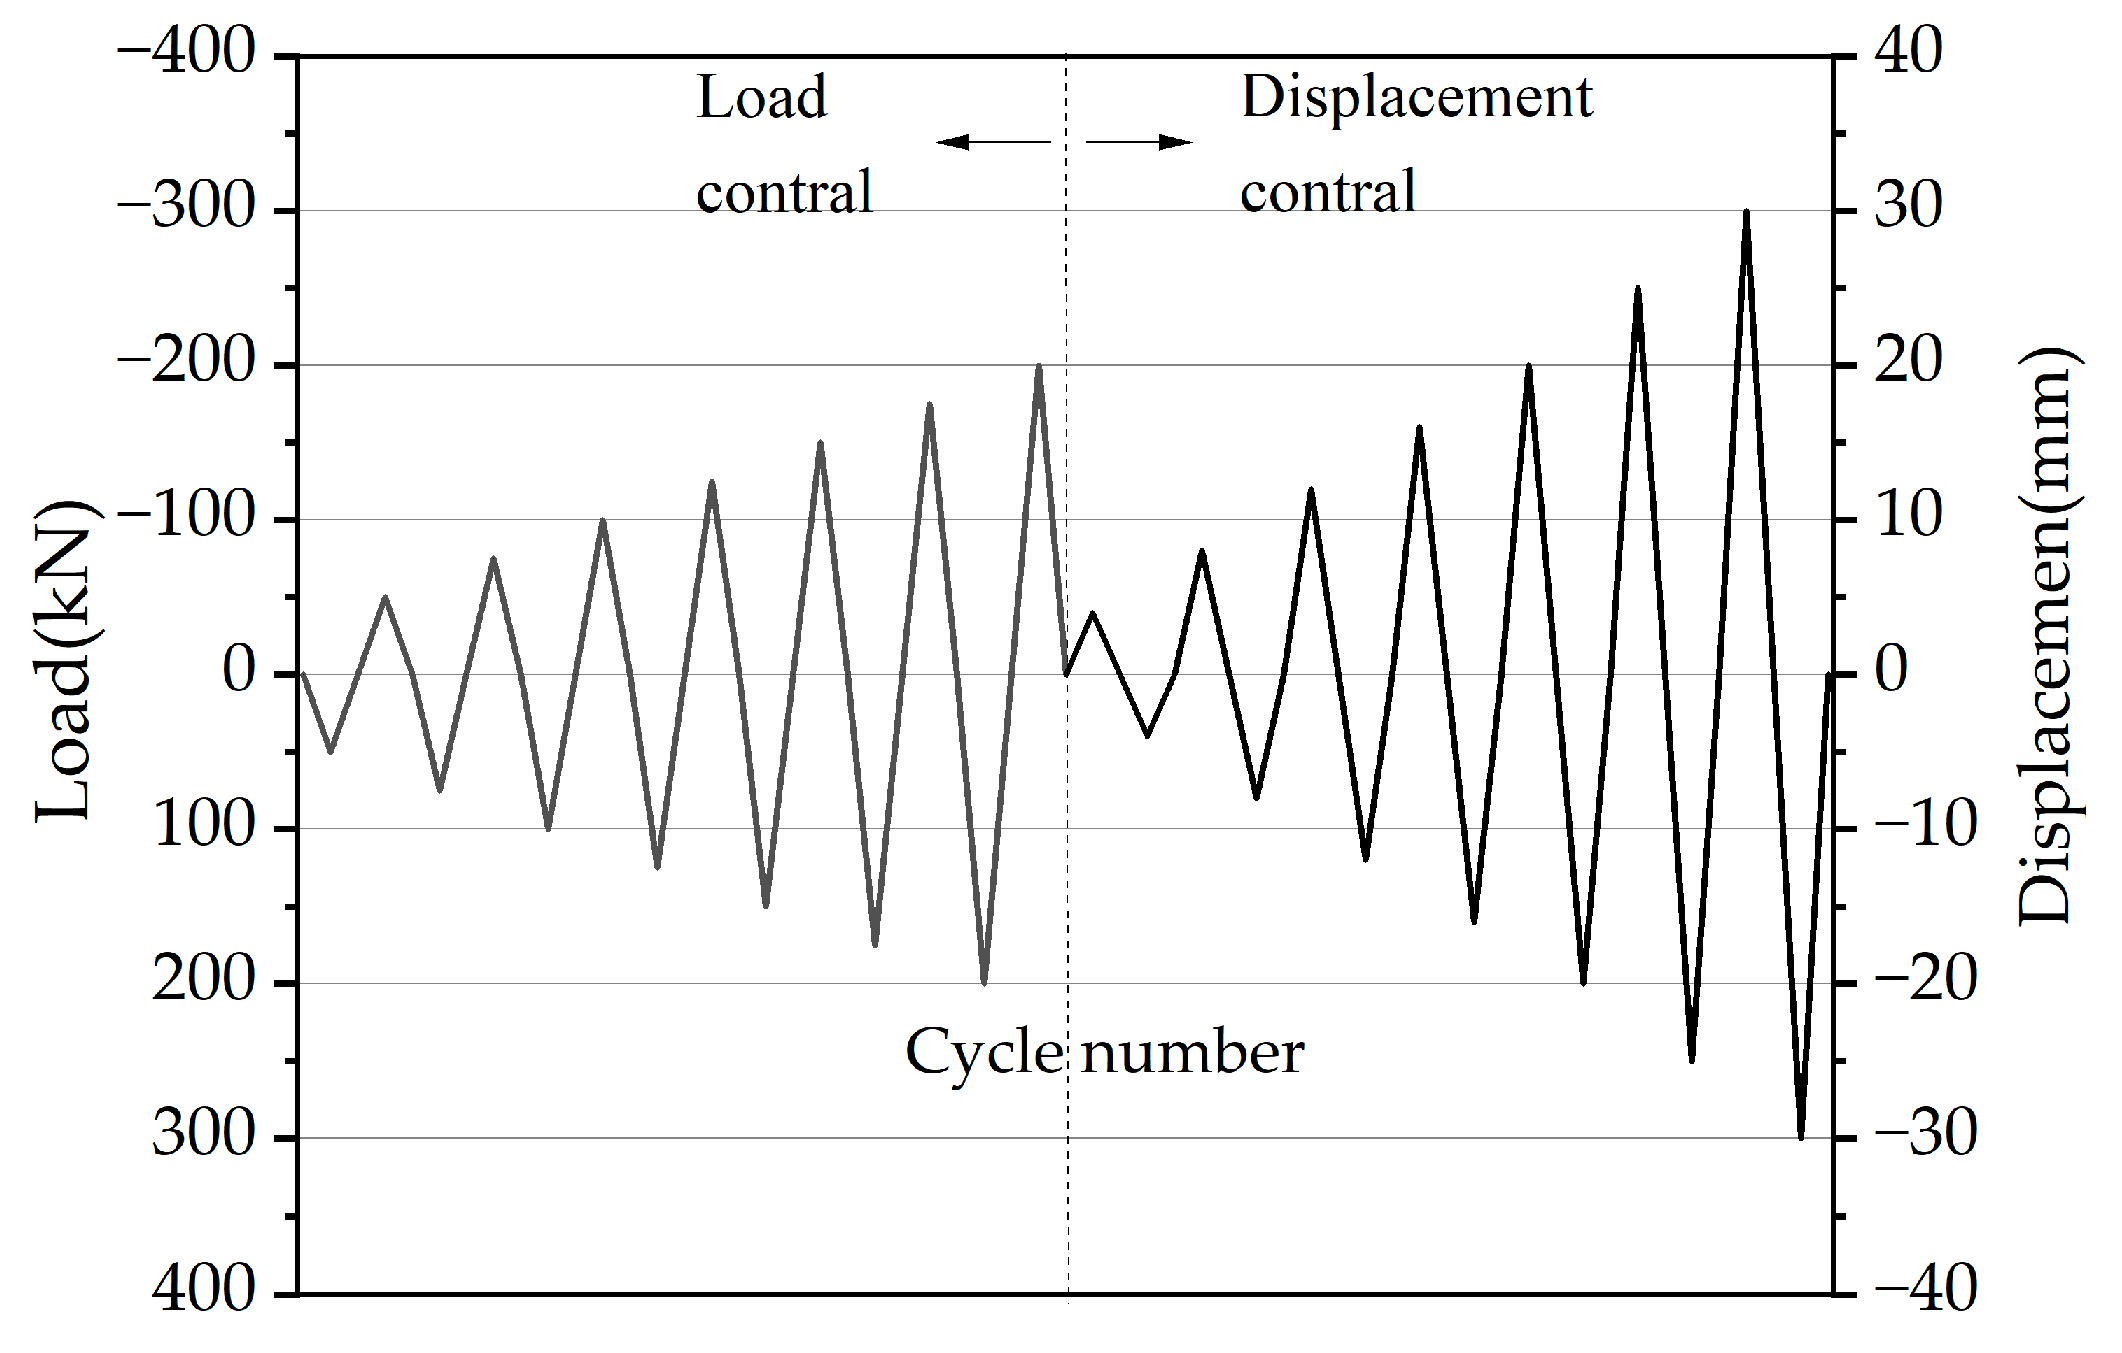
Figure 3 shows the setup of the shear wall using the low cyclic loading test method. Under a constant vertical load for axial compression, a horizontal low cyclic load was applied through an MTS electro-hydraulic servo actuator, which was automatically controlled using a force–displacement hybrid control method, as described in Figure 4. The force control was adopted before the cracks appeared on the shear wall. The force was set at an initial value of 50 kN with an increment of 25 kN and kept one cycle at each loading level. When the specimen entered the elastic–plastic stage, the displacement control was applied. The displacement was the multiples of the cracking displacement, and two cycles were kept at each displacement level. The test was terminated after the load decreased to 85% of the peak load or failure. Besides measuring the load and displacement, the strains of the reinforcements were measured by surface-bonded strain gauges.
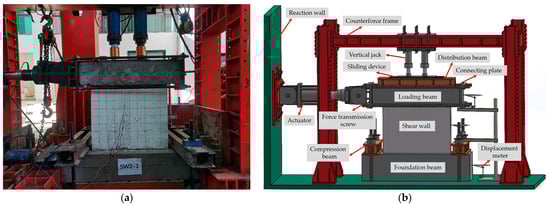
Figure 3.
Test setup: (a) photo view; (b) schematic graph.
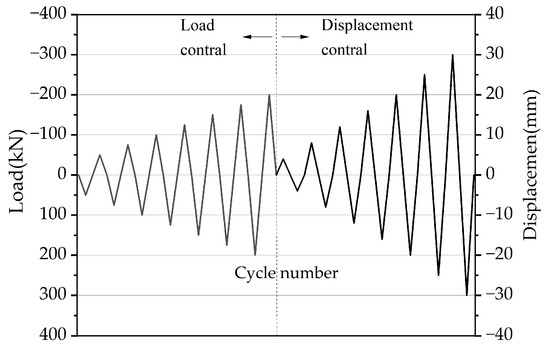
Figure 4.
Loading regime of the low cyclic loading test.
2.3. Numerical Model
2.3.1. Material Compositions
A finite element model was built to simulate the prefabricated shear wall, which was composed of the precast units, the cast-in-place concrete vertical joint, the loading beam, the foundation beam, and the steel bars. The stress–strain relationship of concrete was obtained from China code GB50010 [20], and the mechanical properties were simulated by the Abaqus CDP Model (concrete damage plasticity model), in which the Poisson’s ratio, dilation angle Ψ, eccentricity e, fb0/fc0, K, and viscosity parameters took the default values 0.2, 30, 0.1, 1.16, 0.667, and 0.005, respectively [21,22]. Combined with the energy equivalence principle [23], the tensile and compressive damage factors were calculated to describe the initial elastic degradation and the cumulative damage of concrete, with values truncated at 0.95 and above [24]. The mechanical properties of the steel bars were simulated using an improved Clough model.
2.3.2. Mesh Division and Interaction
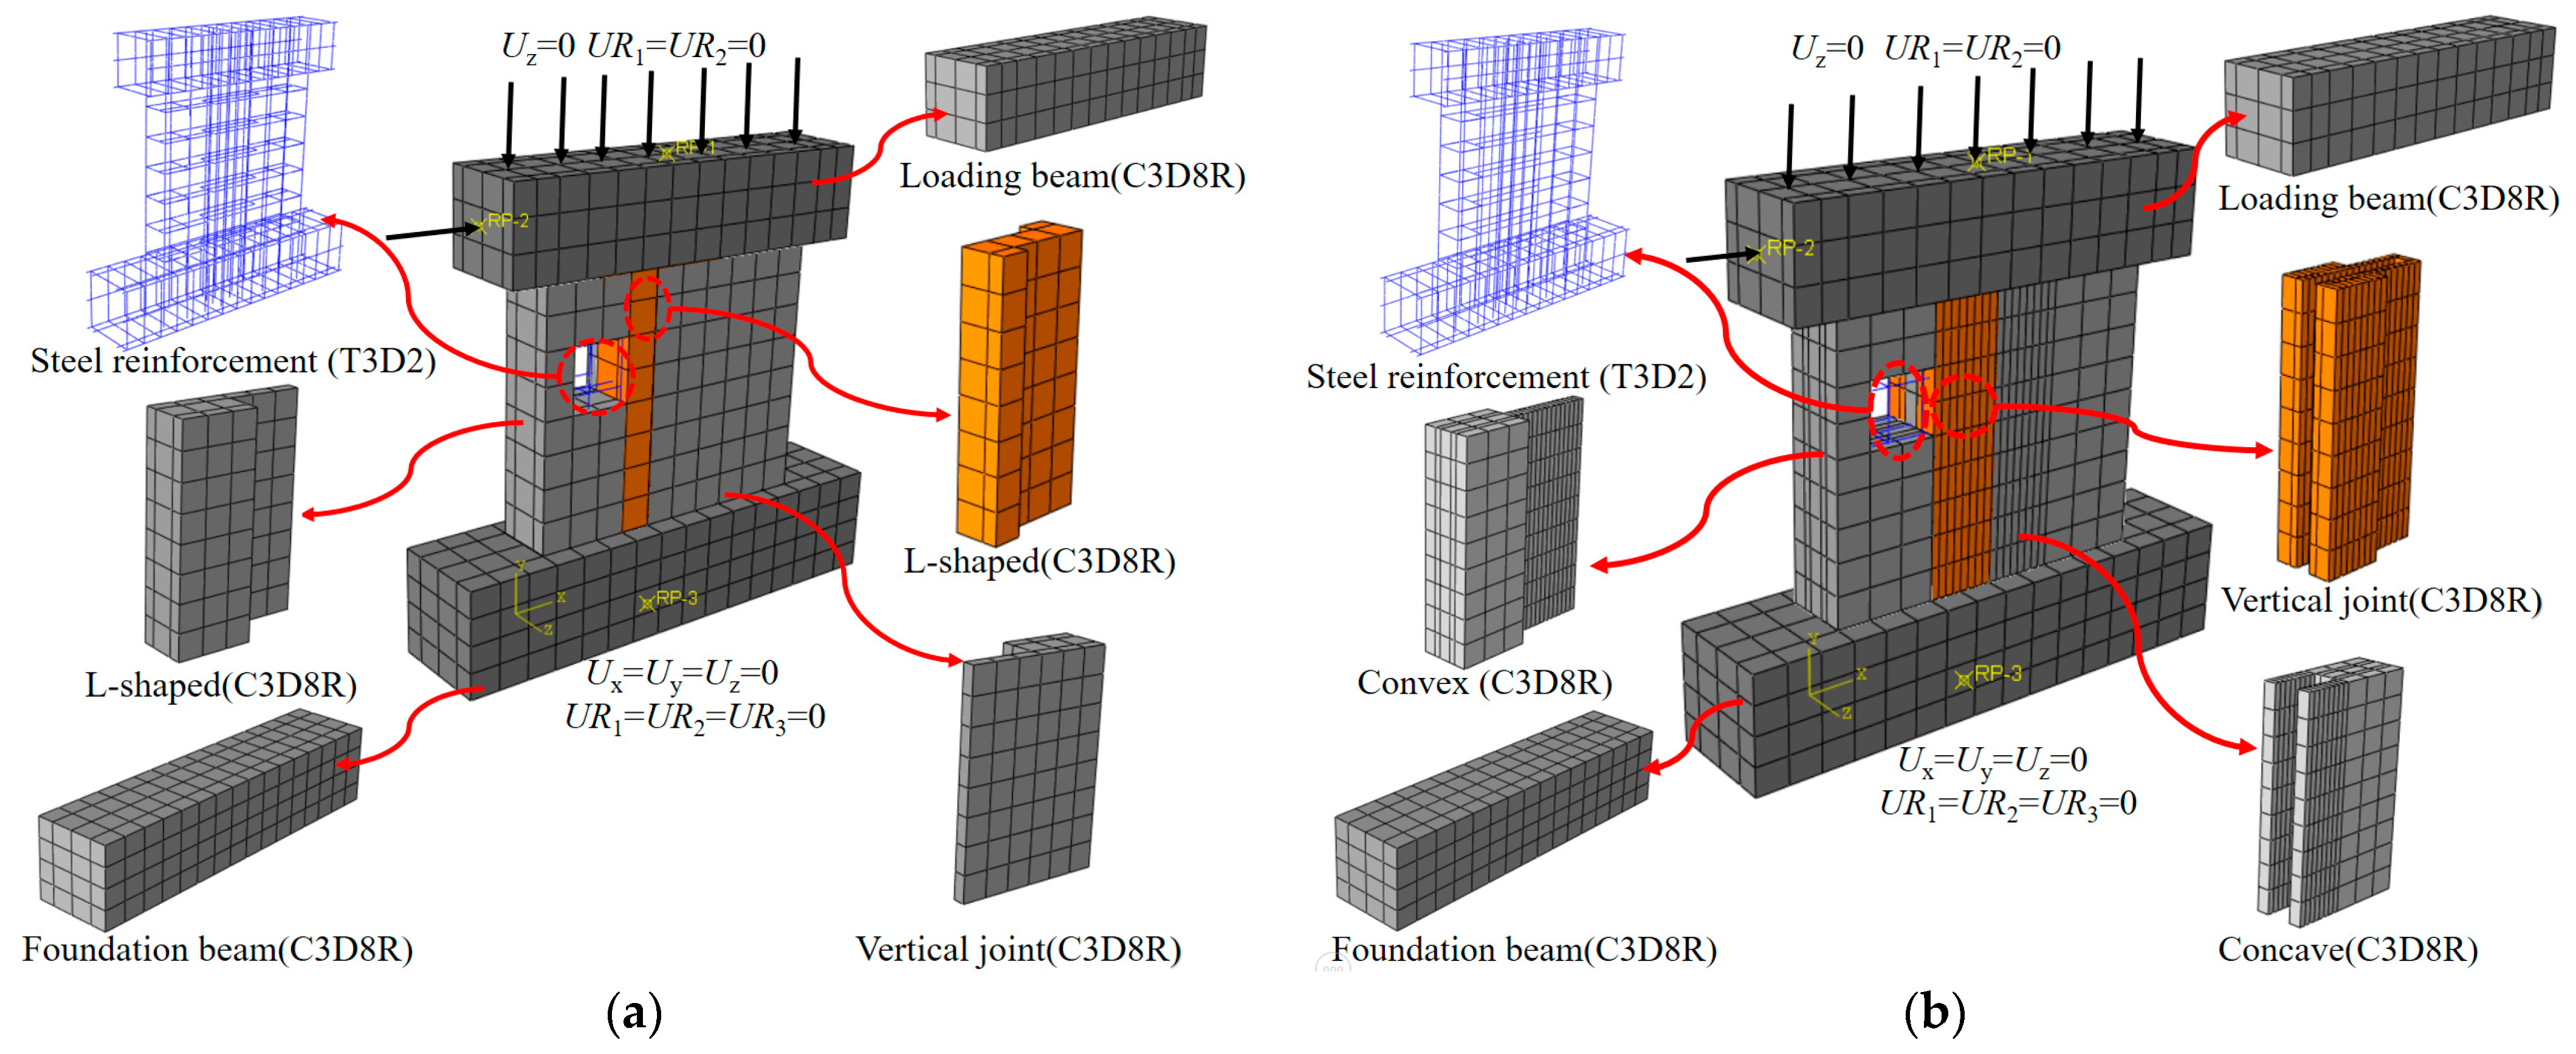
In the finite element model, 8-node solid elements (C3D8R) were used for concrete, and 3D truss elements (T3D2) were used for steel bars. Because the loading beam and the foundation beam were not the object of this study, they were simulated as idealized infinite rigid beams. Figure 5 exhibits the finite element models of the prefabricated shear walls with an L-shaped or a convex cast-in-place concrete vertical joint.
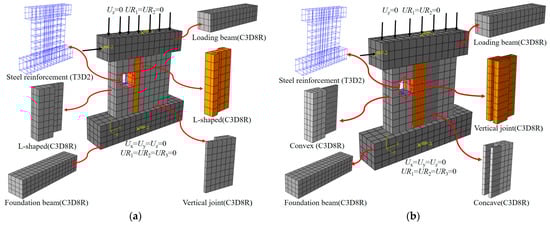
Figure 5.
Finite element model of the prefabricated shear walls with a cast-in-place concrete vertical joint of (a) L shape; (b) convex shape.
The size of the finite elements has significant effects on the model accuracy and the computational time and convergence. To divide the mesh into an appropriate size, subdivision was performed on the precast units and the vertical joint to ensure the alignment of nodes at contact interfaces. This required six sets of contact surfaces for the L-shaped cast-in-place vertical joint, and ten sets of contact surfaces for the convex cast-in-place vertical joint. The surface-based cohesion model was used to define the contact surface properties. The interfaces were defined as “hard contact” in the normal direction, indicating that cracking was allowed on the concrete interfaces. The tangential behavior of the interface was defined as a penalty function with a friction coefficient of 1.4 [25]. The steel bars were embedded in the concrete to produce coordinated deformation without bond slip. To ensure the integrity of the shear wall with the loading and foundation beams, the contacts between them were simulated using a binding constraint (Tie).
Finally, considering that the element size should be greater than 2–3 times the maximum aggregate size [26], the mesh size for concrete was 100 mm, and that for steel bars was 50 mm. To prevent stress concentration at the loading point, a coupling point RP1 was set at the top surface center of the beam to exert the vertical load, and a coupling point RP2 was set at the side surface center of the loading beam to exert the horizontal load. The bottom surface of the foundation beam was entirely fixed.
3. Results Analysis and Discussion
3.1. Failure Pattern
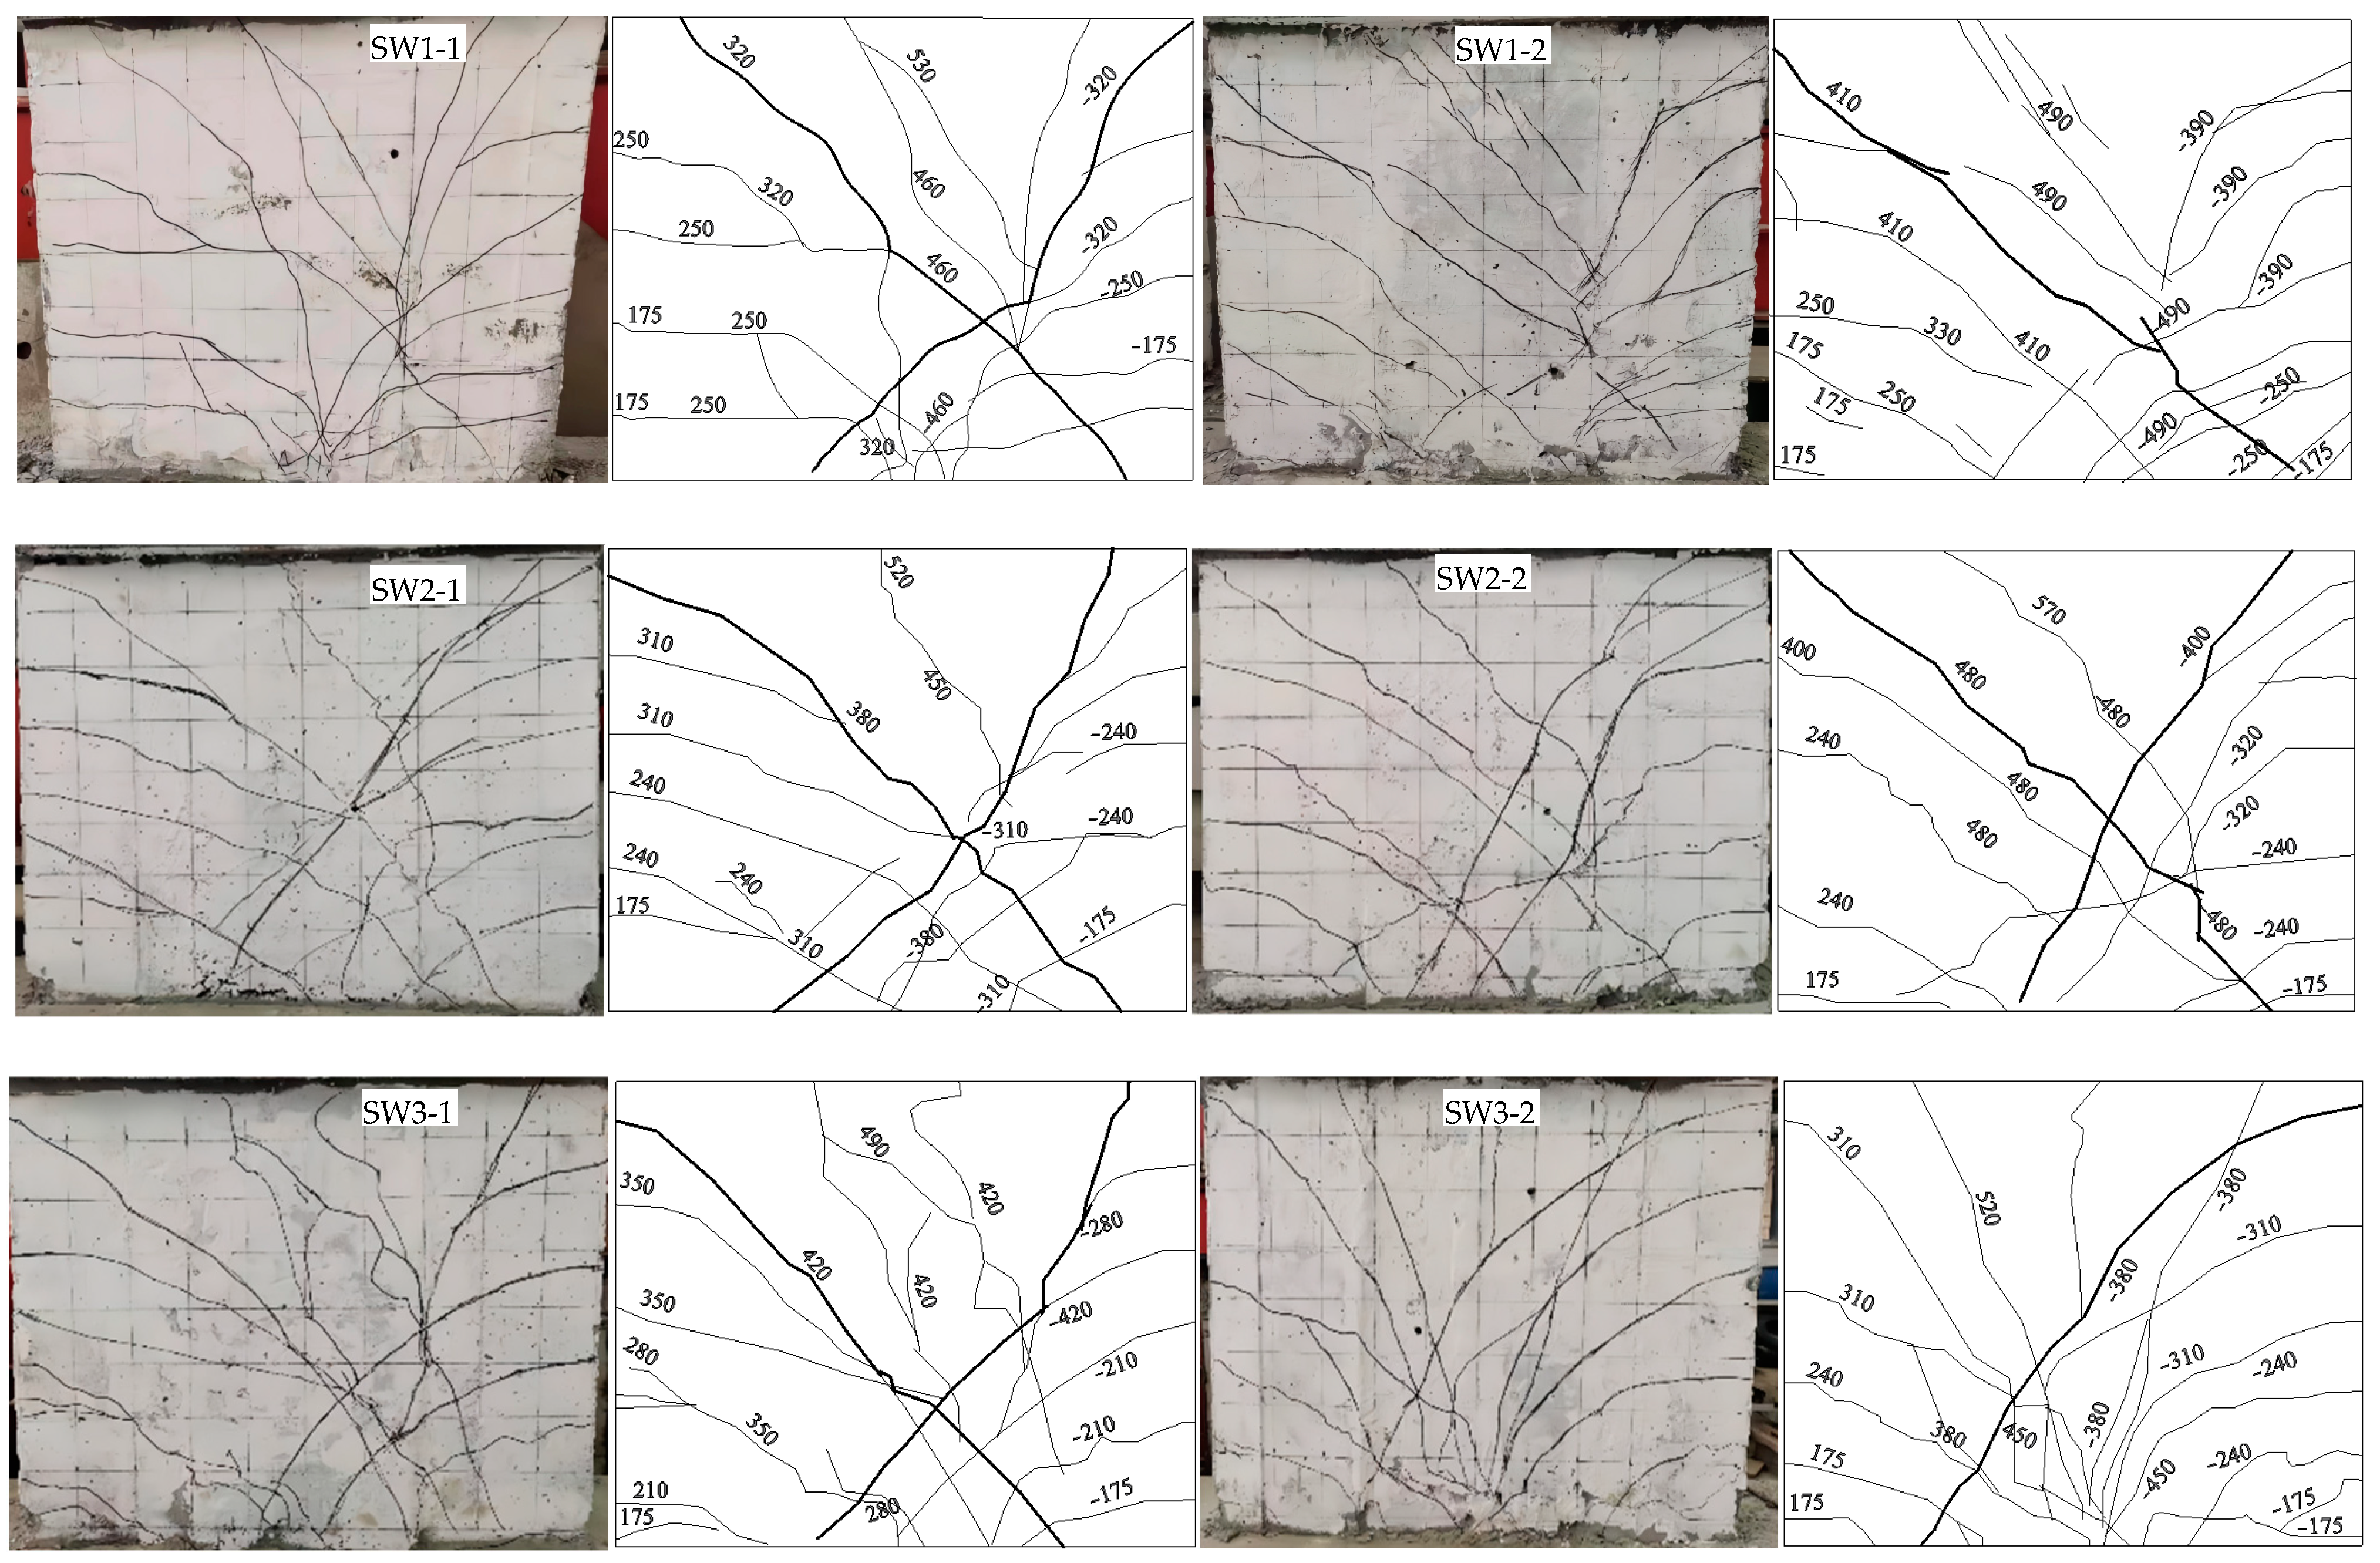
Figure 6 exhibits the crack distribution of tested specimens. When the load reached 158 kN, 178 kN, 155 kN, 155 kN, 153 kN, and 155 kN in the region of 50−200 mm above the foundation beam, some thin and short horizontal cracks appeared at the right and left edges of the SW1-1, SW1-2, SW2-1, SW2-2, SW3-1, and SW3-2 specimens, respectively. With the increase in loading level, the height of the compressive concrete zone continually increased and was positively correlated with the axial compression ratio. When the displacement angle of the specimen approached 1/111, some horizontal cracks appeared along the height of the specimen, and the original horizontal cracks began to obliquely extend at an inclined angle of approximately 45° after passing through the concealed column of the shear wall. When the displacement angle was close to 1/83, the concrete at the base of the concealed columns began to fail, with slight crushing. Less new horizontal cracks were generated, while the original oblique cracks continuously extended and gradually gathered to form cross oblique cracks in the web of the shear wall.
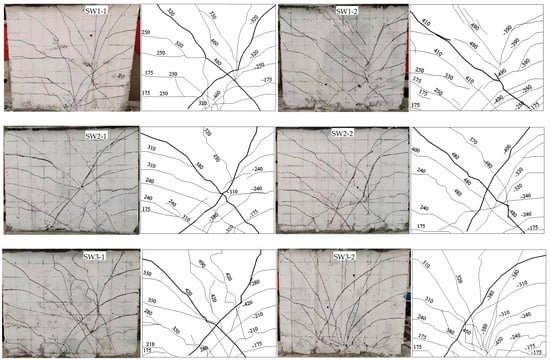
Figure 6.
Crack distribution on the tested specimens.
When the displacement angle was close to 1/66, each specimen reached the peak load. Accompanied by the crushing of concrete at the root of the shear wall, the sound of the steel bars’ fracture at the edge could be heard, while the cracks at the bottom of the shear wall extended. With the continuous expansion of the original cross oblique crack, a main cross oblique crack formed with a width of approximately 1–2 mm in the web of the shear wall. When the displacement angle of the SW3-1 specimen was close to 1/50, and those of other specimens were close to 1/40, the bearing capacity of each specimen decreased to less than 85% of the peak load. As many more cracks appeared around the vertical joints, the specimens failed in a shear pattern.
During the complete loading process, the damage of concrete became heavier with the gradual extension of the horizontal cracks, and the height of the concrete compression area slightly increased with the increase in the axial compression ratio. No obvious damage appeared along the interface of the L-shaped and convex vertical joints. This indicates that the cast-in-place concrete vertical joints enabled the precast units to work together.
3.2. Hysteretic Behavior
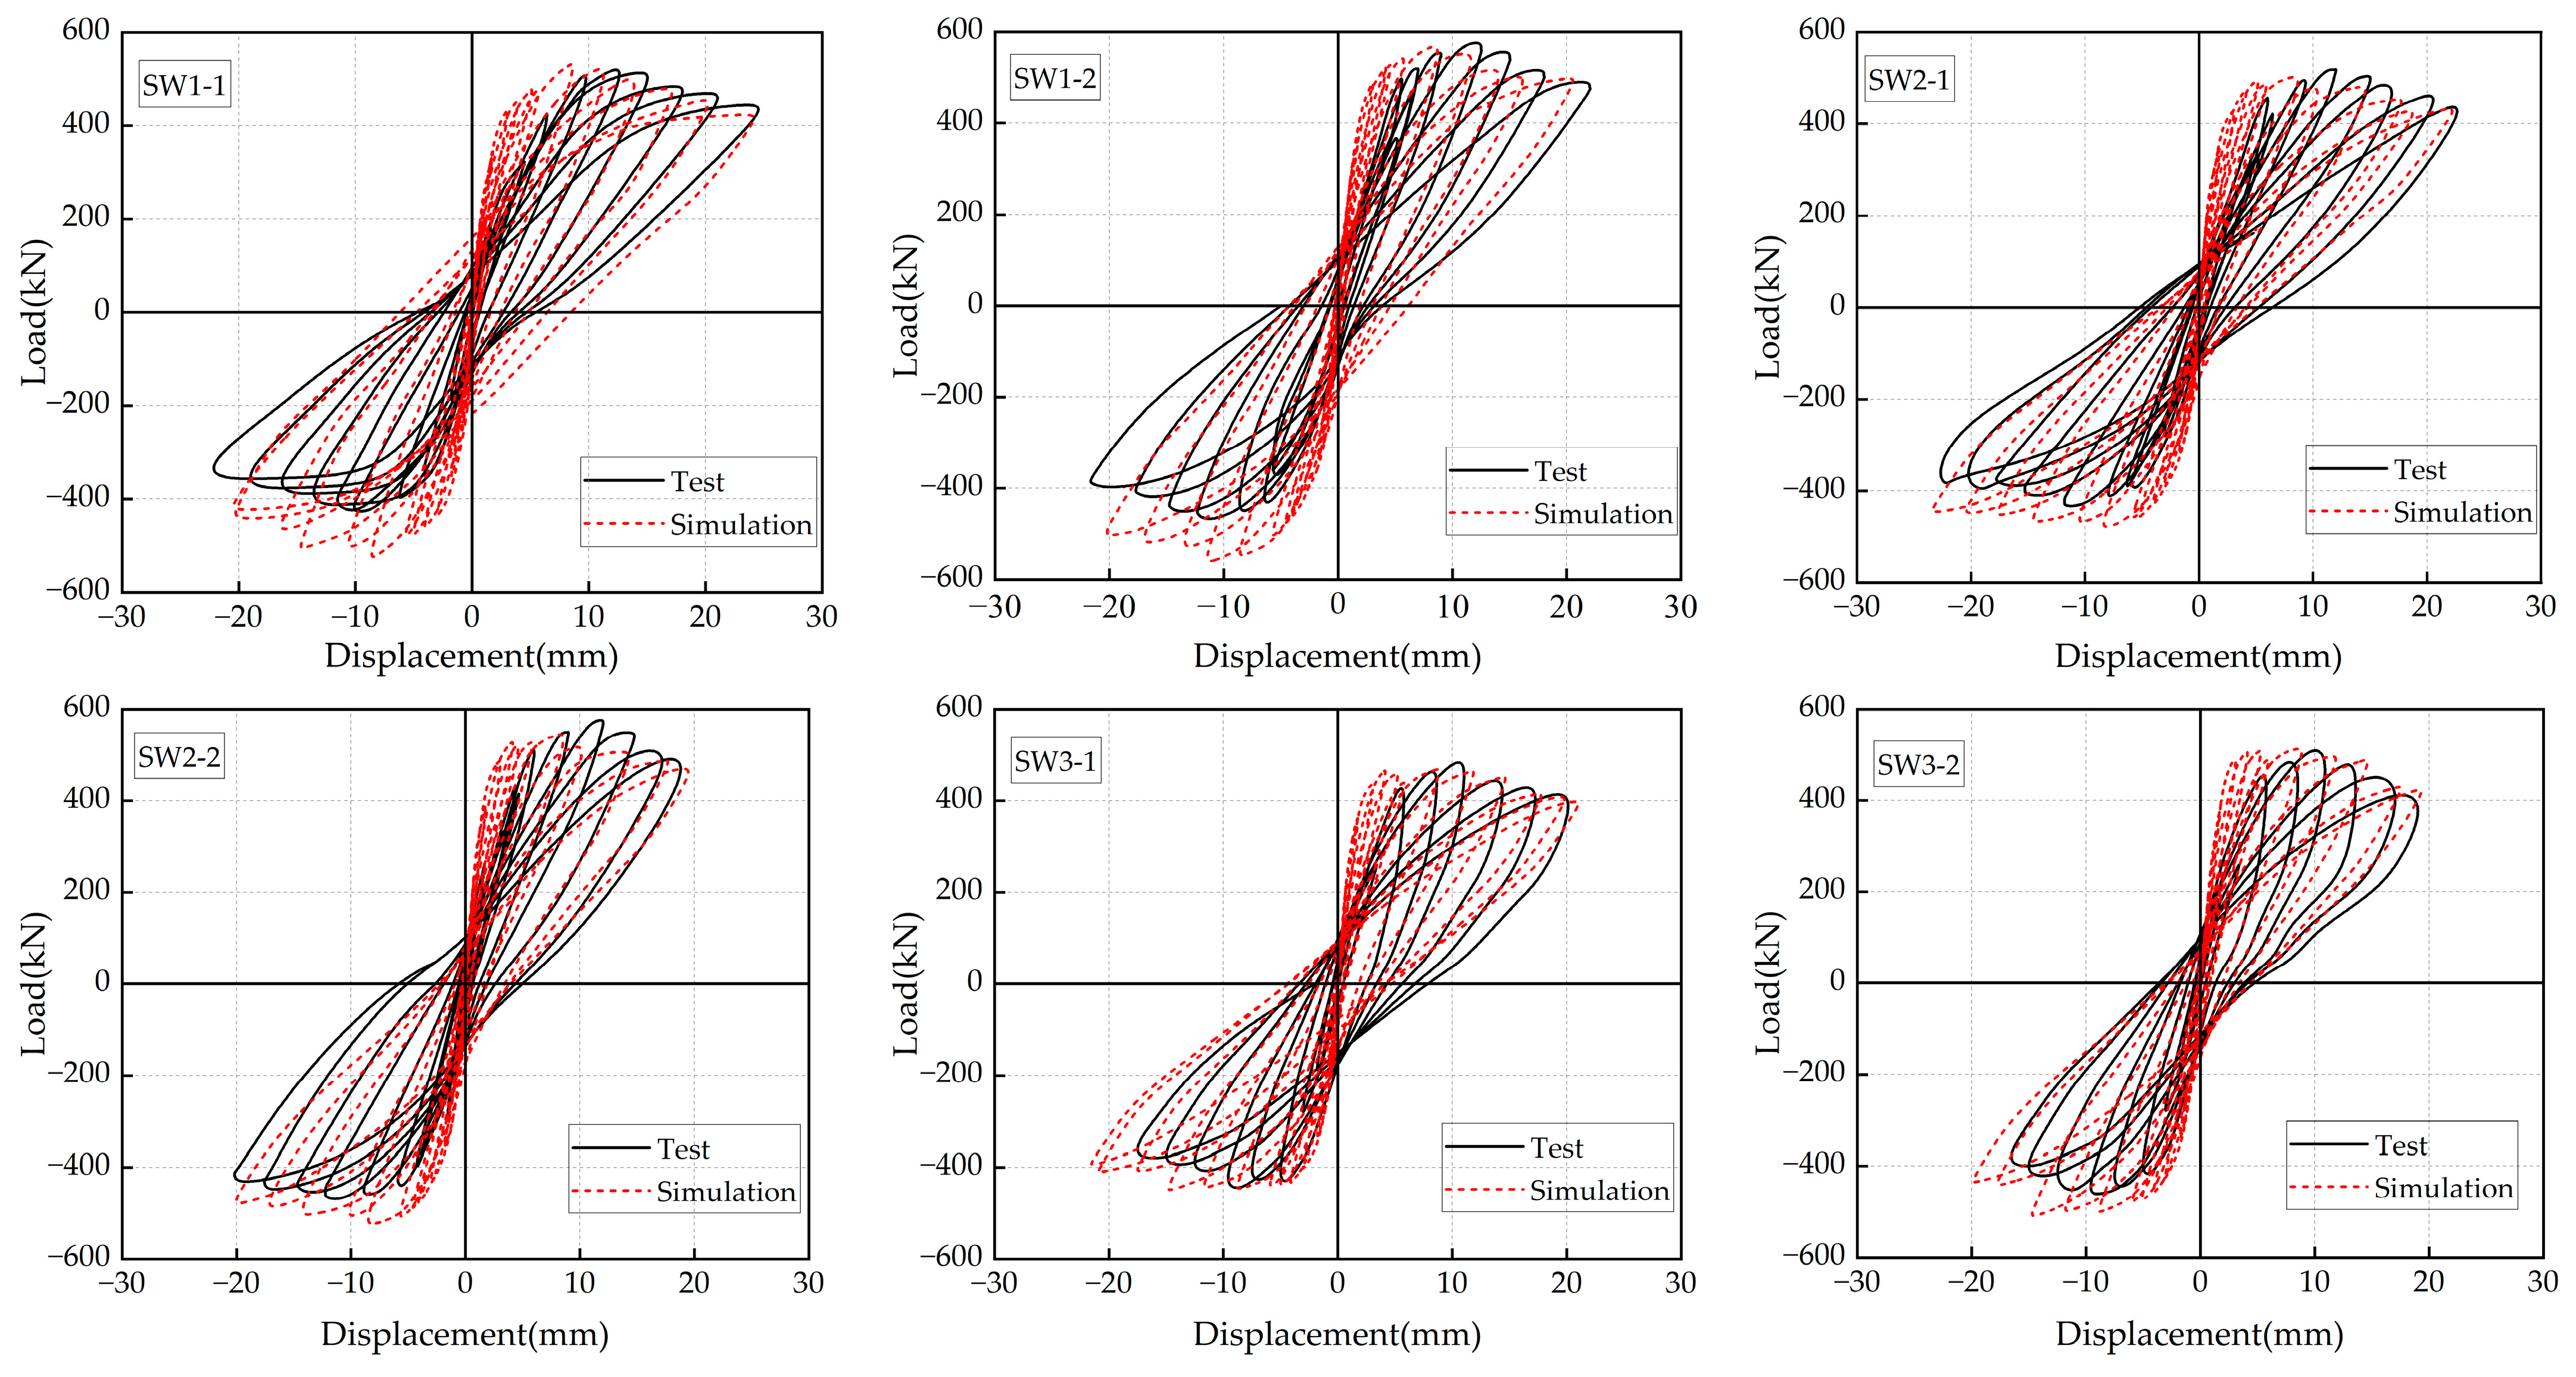
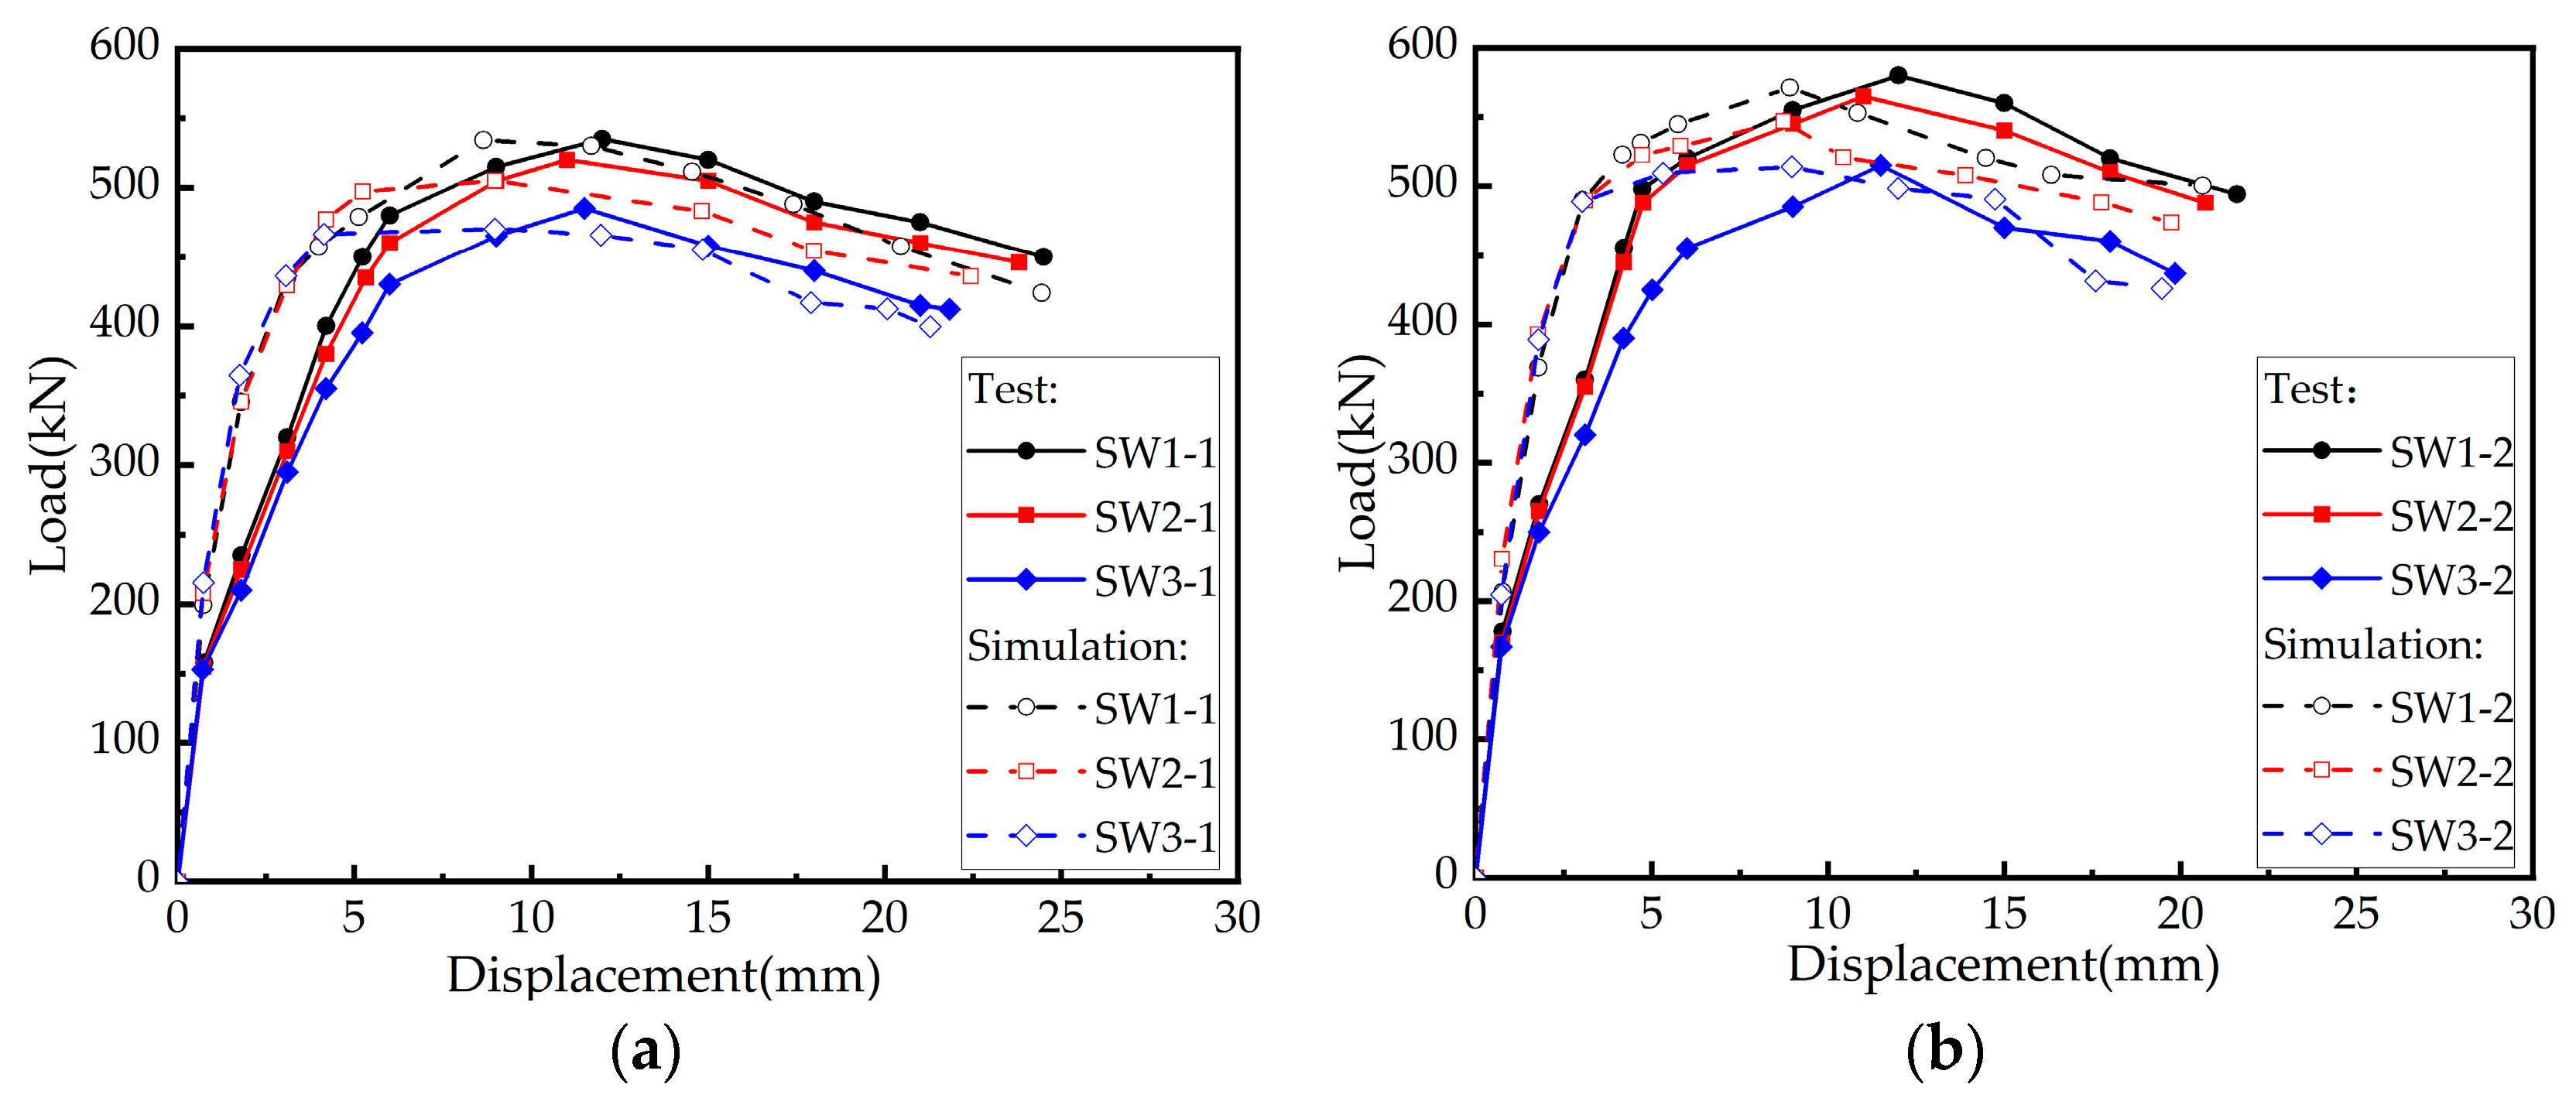
Figure 7 shows the tested load–displacement hysteretic curves compared with the numerical results. This yielded a good simulation of the hysteretic behavior using finite element analysis. The hysteretic curves were linear in the early stage of loading, with slightly sharper and thinner hysteresis loops, while the residual deformation was zero due to the large stiffness. The hysteretic curves exhibited a full bow shape with an enveloped area of the hysteretic loop, which increased with the load. This indicated an increase in energy dissipation capacity. Because the idealization of the numerical analysis did not fully account for the discreteness of concrete, the hysteretic curve pinching effect was not obvious in the numerical simulation. This resulted in greater initial stiffness at the initial loading stage than that of the test.
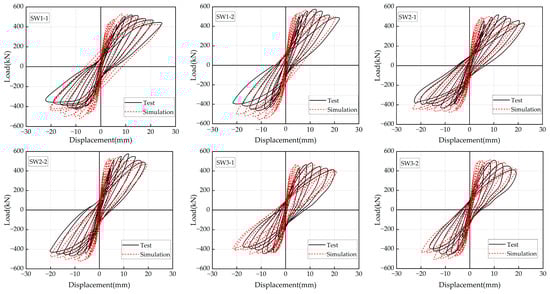
Figure 7.
Tested and numerical load–displacement hysteretic curves of the specimens.
As the applied displacement increased, the longitudinal steel bars of the concealed columns gradually yielded. The bearing capacity continuously increased, with a pronounced hysteretic phenomenon with significant nonlinear characteristics in the hysteretic loop. The enveloped area of the loop consistently expanded to show a notable yielding energy dissipation capability. As the crack width increased and part of the concrete was crushed, the root of the shear wall experienced tensile displacement caused by misalignment, resulting in an uplift. This led to a vertical axial force exceeding the predetermined threshold. The tested peak load was larger than the simulated value. Due to the slip between the steel bars and concrete, residual deformation progressively accumulated. This also led to a significant stiffness degradation. After the peak load, the descending curve was smooth with increased displacement, exhibiting commendable load-holding and plastic deformation capabilities. With the same axial compression ratio, the SW2 specimens had a fuller hysteretic curve than the SW3 specimens, which was similar to that of the SW1 specimens. This indicated that a larger weak area of the shear walls with cast-in-place vertical joints decreased the deformation ability and bearing capacity.
3.3. Enveloping Curve
The positive enveloping curves of the specimens are shown in Figure 8. The curves can be divided into elastic, elastic–plastic, and failure stages. When the lateral load was less than 160 kN, the load–displacement curves showed the same initial stiffness for the shear walls with different vertical joints. This was attributed to the concrete in compression without cracking. Meanwhile, the initial stiffness was slightly influenced by the axial compression ratio. With the extension of cracks caused by the bending moment of the lateral load, the stiffness degraded to allow the loading performance to enter the elastic–plastic stage. In this stage, the slope of the curves increased with the increase in the axial compression ratio, indicating that an increased axial force offset the effect of concrete cracks to effectively improve the stiffness of the shear wall. After the peak load, the bearing capacity remained good to present a smooth, descending curve without a sudden change. This is because the shear wall essentially worked with a small area of damaged concrete at the root and an incompletely broken steel bar at the edge, while the steel bars in the cast-in-place vertical joint ensured the integrity of the shear wall.
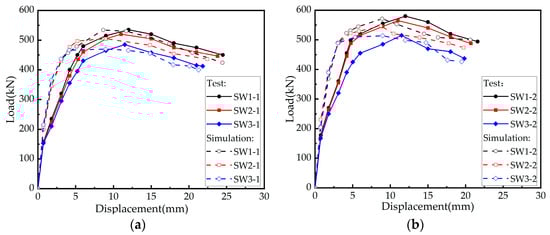
Figure 8.
Positive enveloping curves of the specimens with an axial compression ratio of (a) 0.2; (b) 0.3.
It can be seen from Figure 8 that the shear walls with an L-shaped vertical joint had a lower bearing capacity than those with a straight vertical joint, while the shear walls with a convex vertical joint had an obviously decreased bearing capacity. Similar positive skeleton curves could be obtained from the tests and simulations for tested specimens with the same axial compression ratio. However, higher stiffness at the ascending portion of the skeleton curves was observed from the simulation, because the finite element could not consider the test errors, as well as the slip of the steel bars in concrete.
Table 3 shows the comparison between the test and the simulation results at key points in the enveloping curves. Except for the higher ratios of the tested to simulated results of cracked displacement, the ratios of test to simulation were close to 1.0, which confirmed the reasonability of the numerical model used to evaluate the prefabricated shear walls. With the above explanation, the lower simulated cracked displacement could be attributed to the higher simulated stiffness before the specimens reached the peak load.
Table 3.
Comparison between the test and simulation results of the bearing capacity.
3.4. Stress Maps of Concrete and Steel Bars
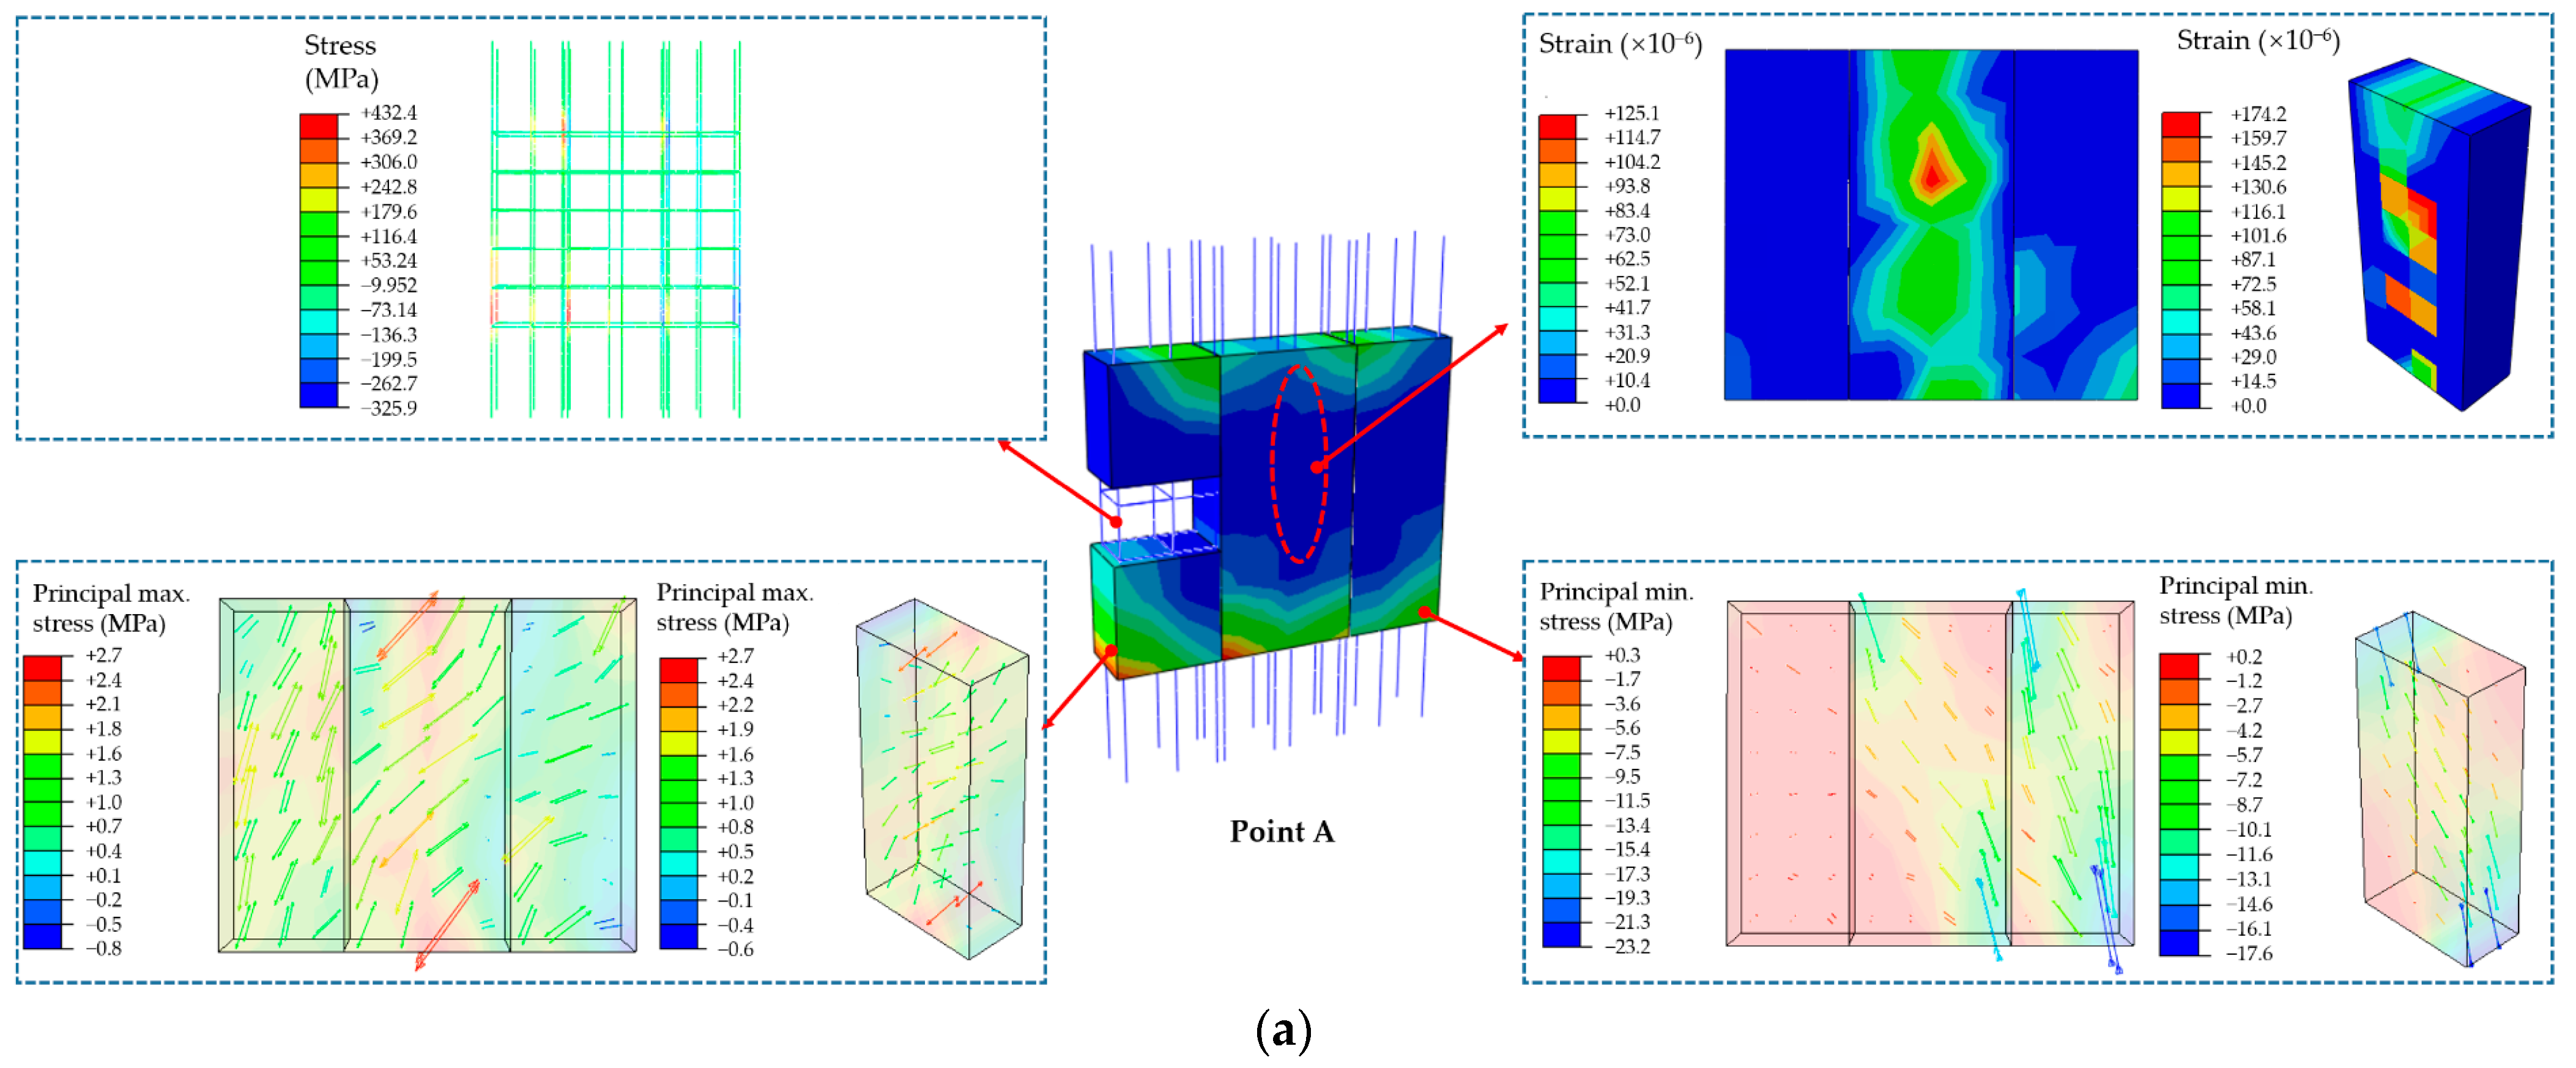
To understand the behavior of the shear walls at different stress states, the change laws of stress and strain of each specimen under an axial compression ratio of 0.2 were analyzed at three typical characteristic points in the yielding of steel bars (A), peak load (B), and ultimate displacement (C).
From Figure 9, the concrete stress of the shear wall reached a high level when the steel bars began to yield (point A), and several initial cracks appeared on both sides of the concealed columns in the range of 300 mm from the root. At this time, the specimen had not yet reached the yield state; the failure stress zone appeared at the root of the shear wall, with a slight difference at the vertical joints. The plastic strain was concentrated in the center of the shear wall, with the small deformation of the shear wall. Therefore, the axial compression was dominant in the failure of the shear wall.
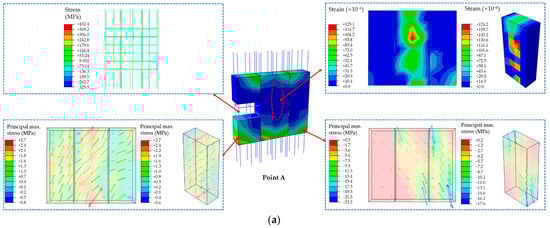

Figure 9.
Stress and strain of the specimens when steel bars began to yield: (a) SW1-1; (b) SW2-1; (c) SW3-1.
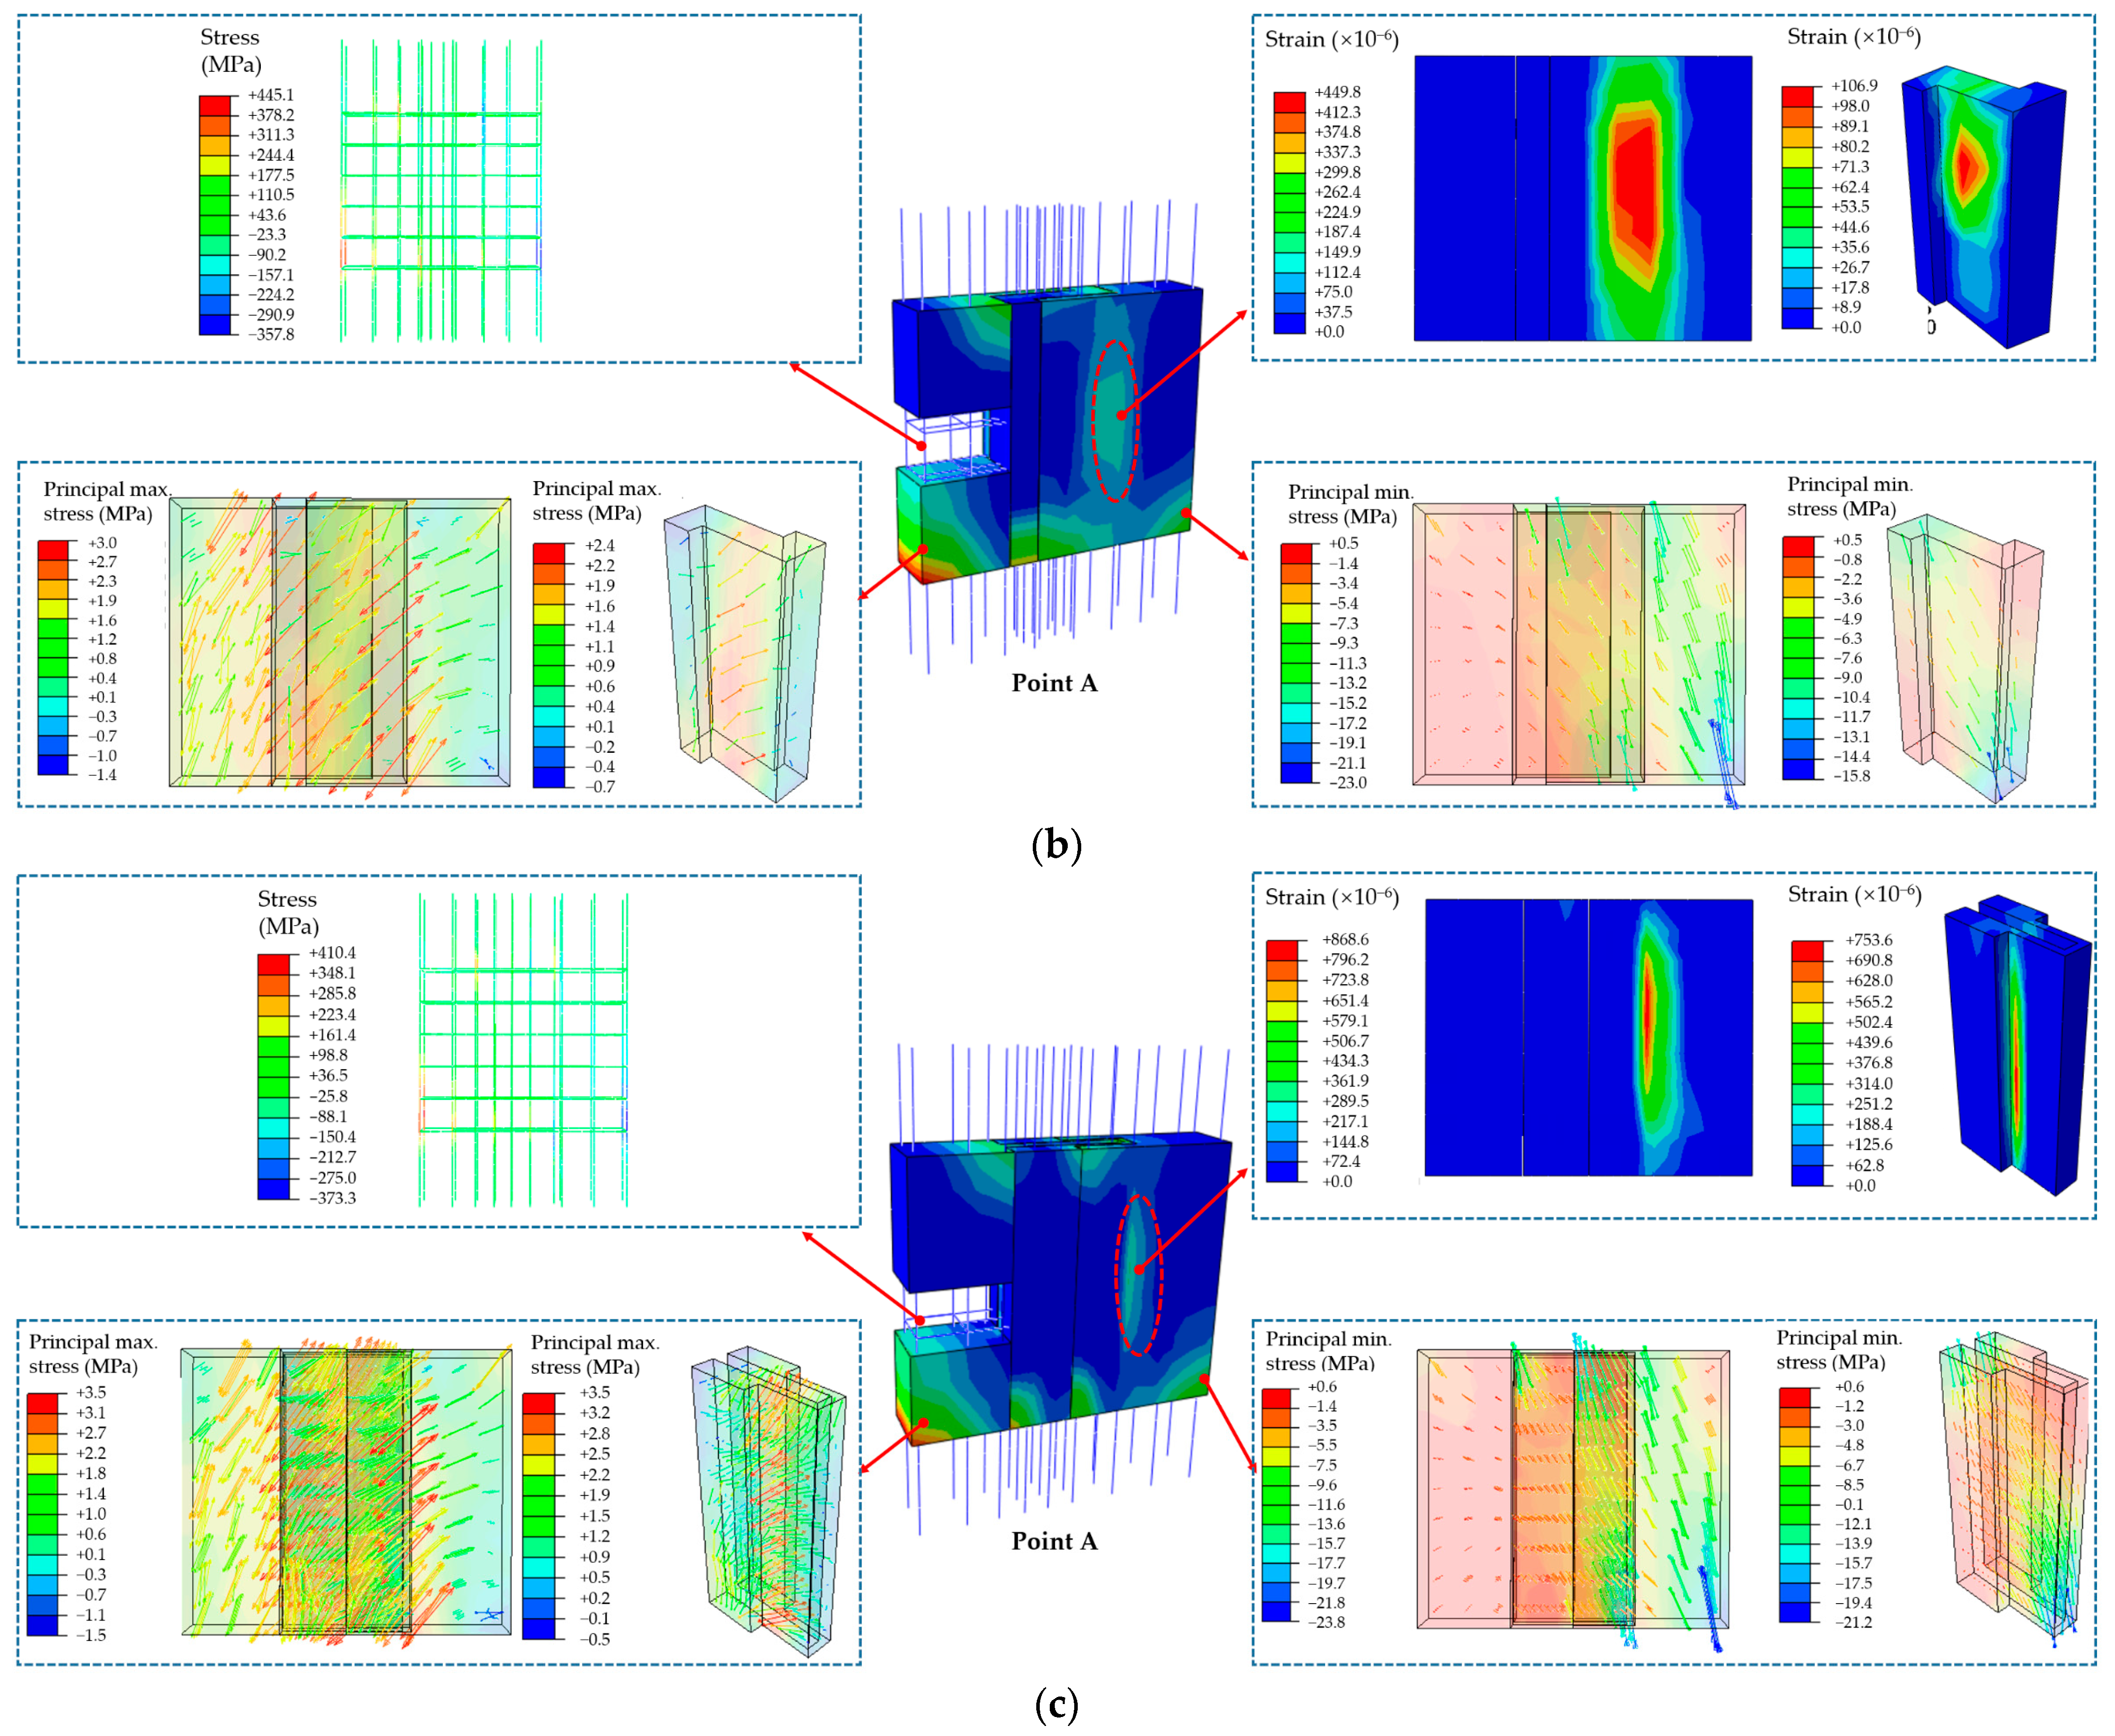
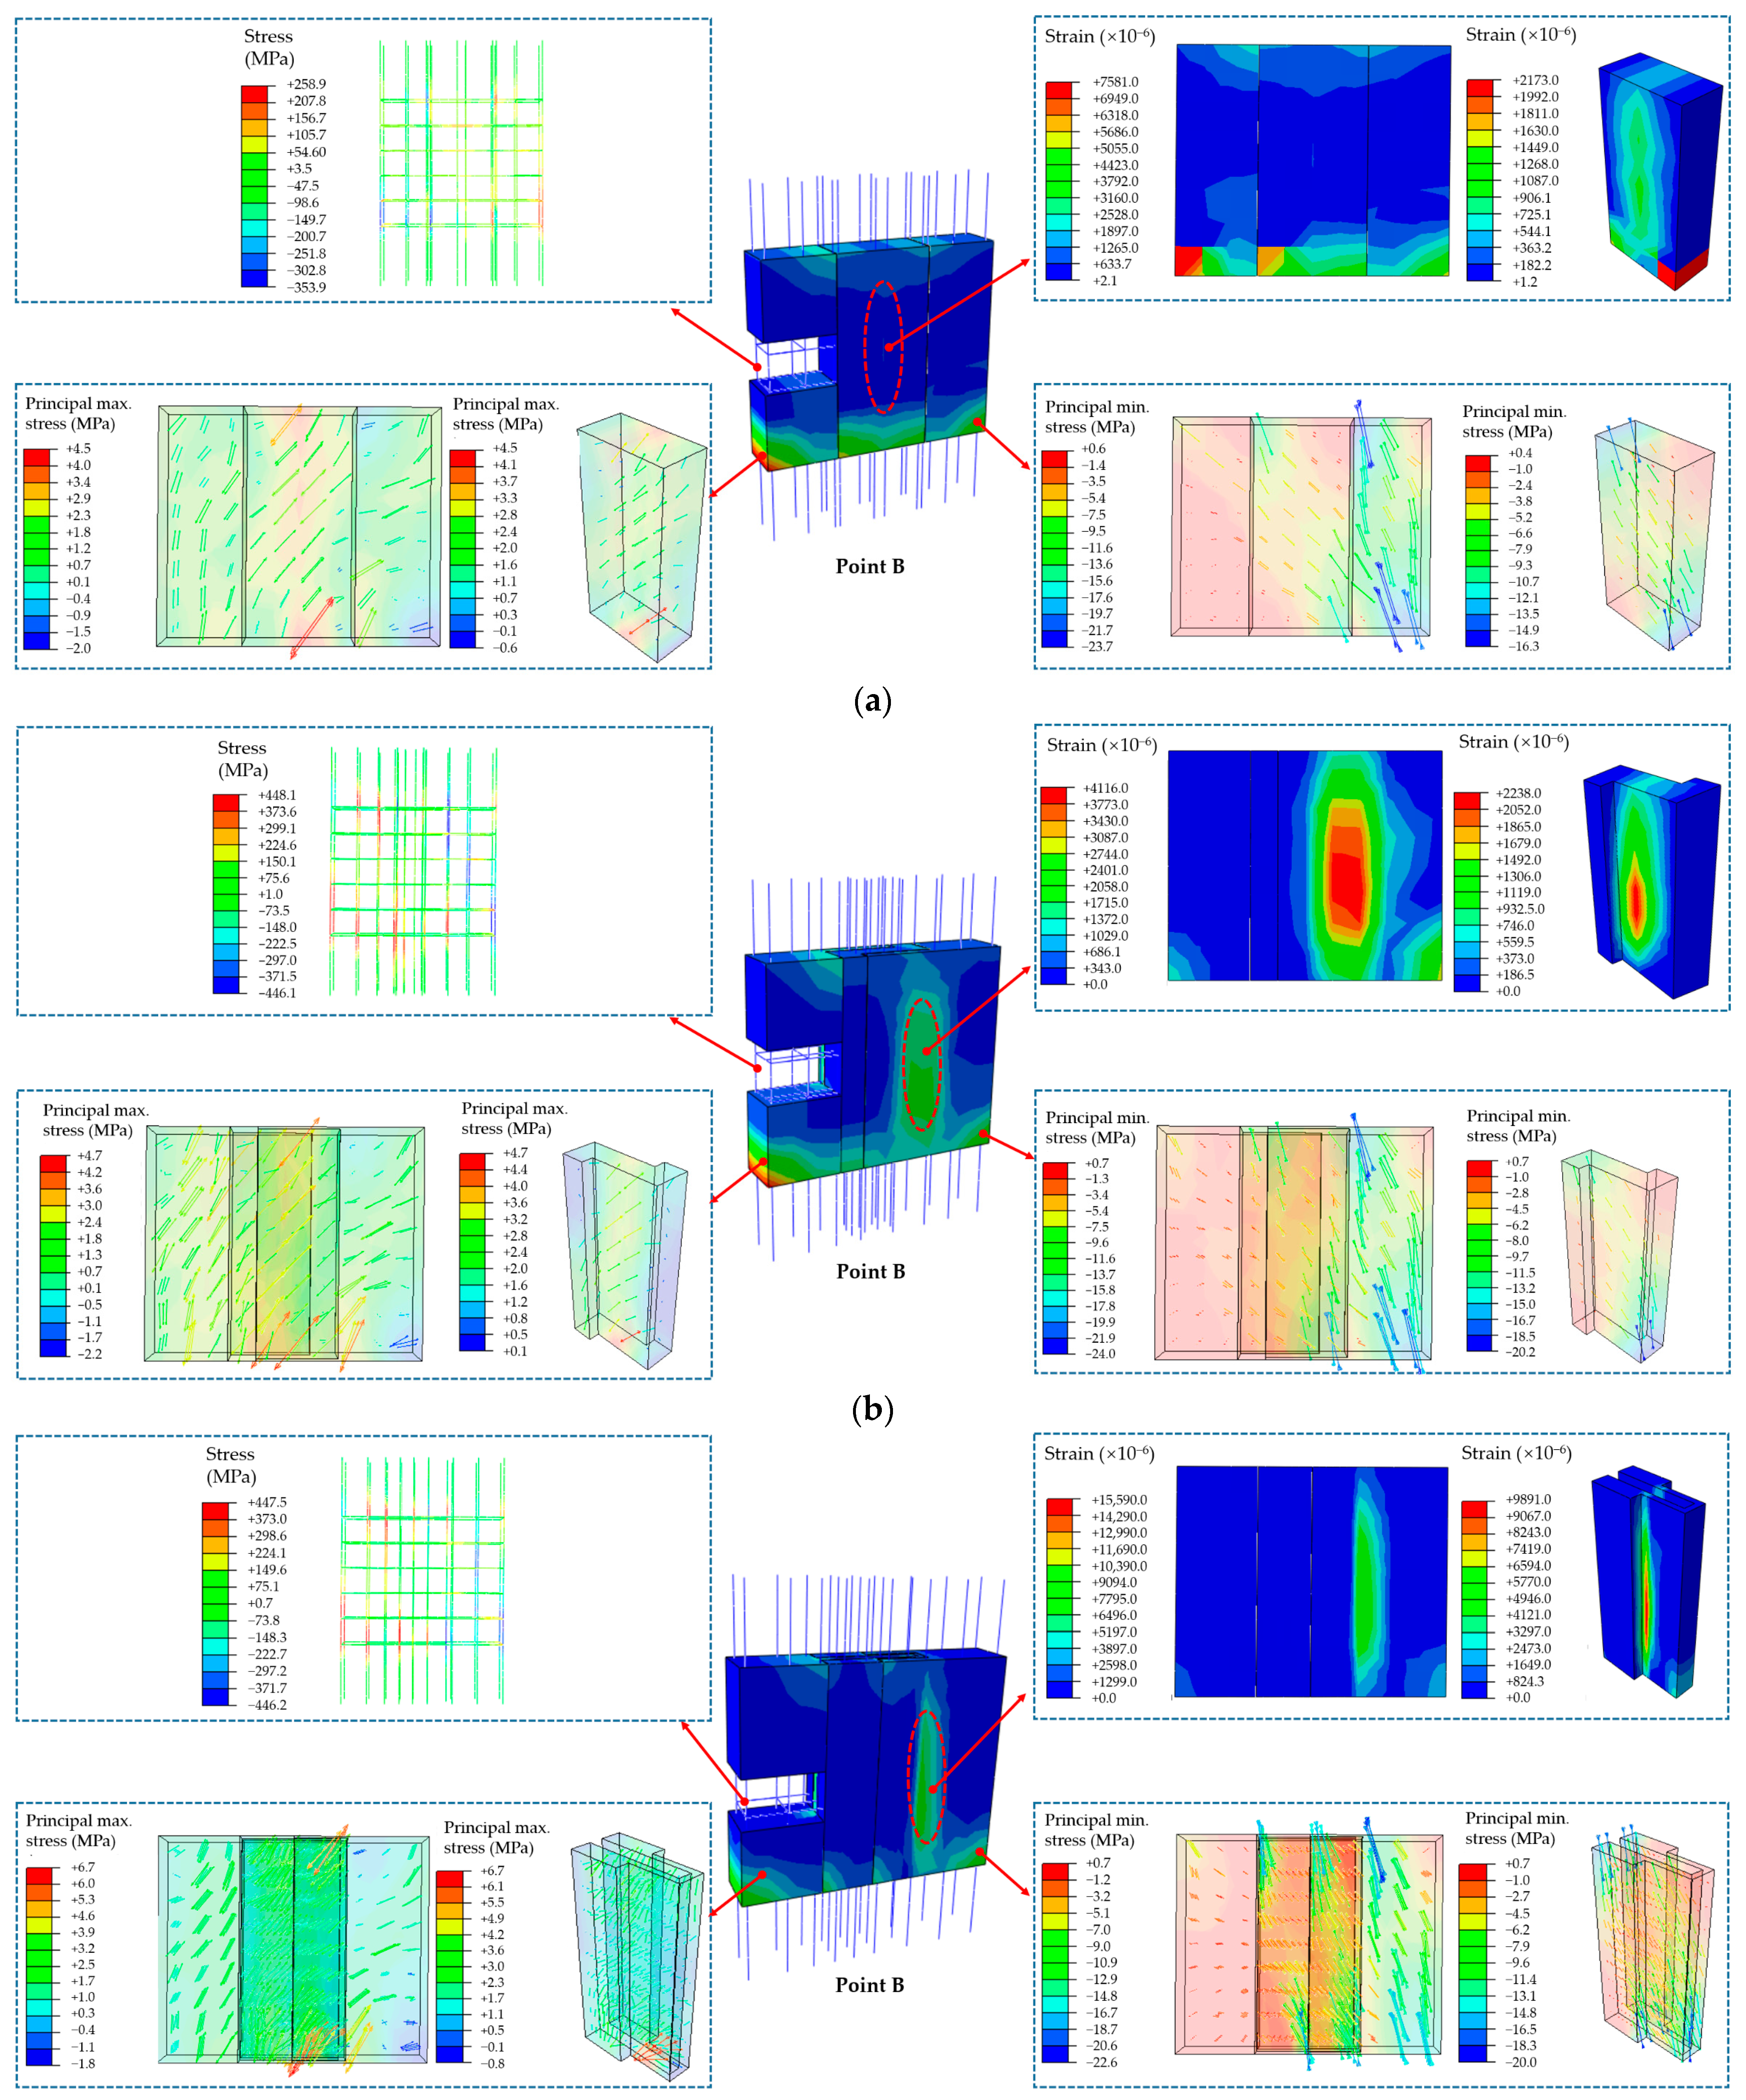
As shown in Figure 10 for the stress of the shear walls at peak load, the yield area of the vertical steel bars became larger at the edges of the prefabricated shear walls, and the steel bars from the edge to the vertical joint transitioned from tension to compression. The stress of the shear walls with a straight vertical joint was distributed symmetrically and evenly, whereas those with an L-shaped or a convex vertical joint became weaker at the vertical joints, resulting in stress concentration in the steel bars. The principal tensile and compressive stresses were concentrated in the vertical joint. The stresses in the concealed columns at the edges of the shear wall were distributed with an angle over 45° to the shear wall surface. This resulted in the corresponding enlargement of the regions of principal stresses and plastic deformation of the shear wall, and the continuous generation of new horizontal cracks. The original cracks developed obliquely and spread throughout the wall surface. The concrete stress on both sides of the vertical joint was the same, indicating a reliable connection between the precast units and the cast-in-place concrete vertical joint. This maintained the good overall performance of the shear wall.
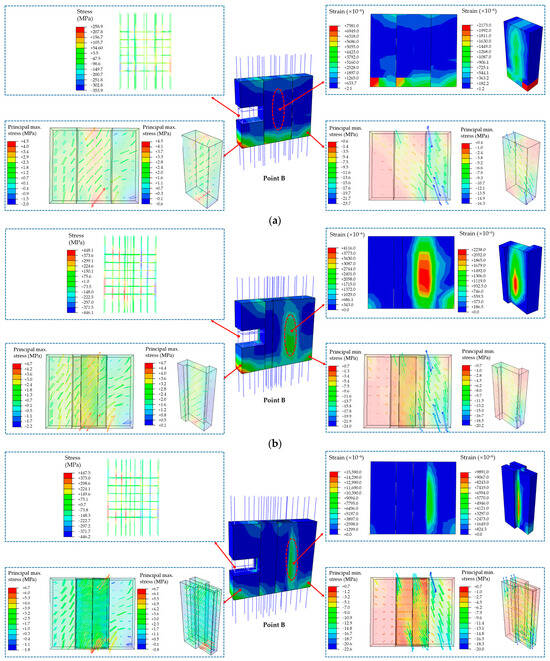
Figure 10.
Stress and strain of the specimens at peak load: (a) SW1-1; (b) SW2-1; (c) SW3-1.
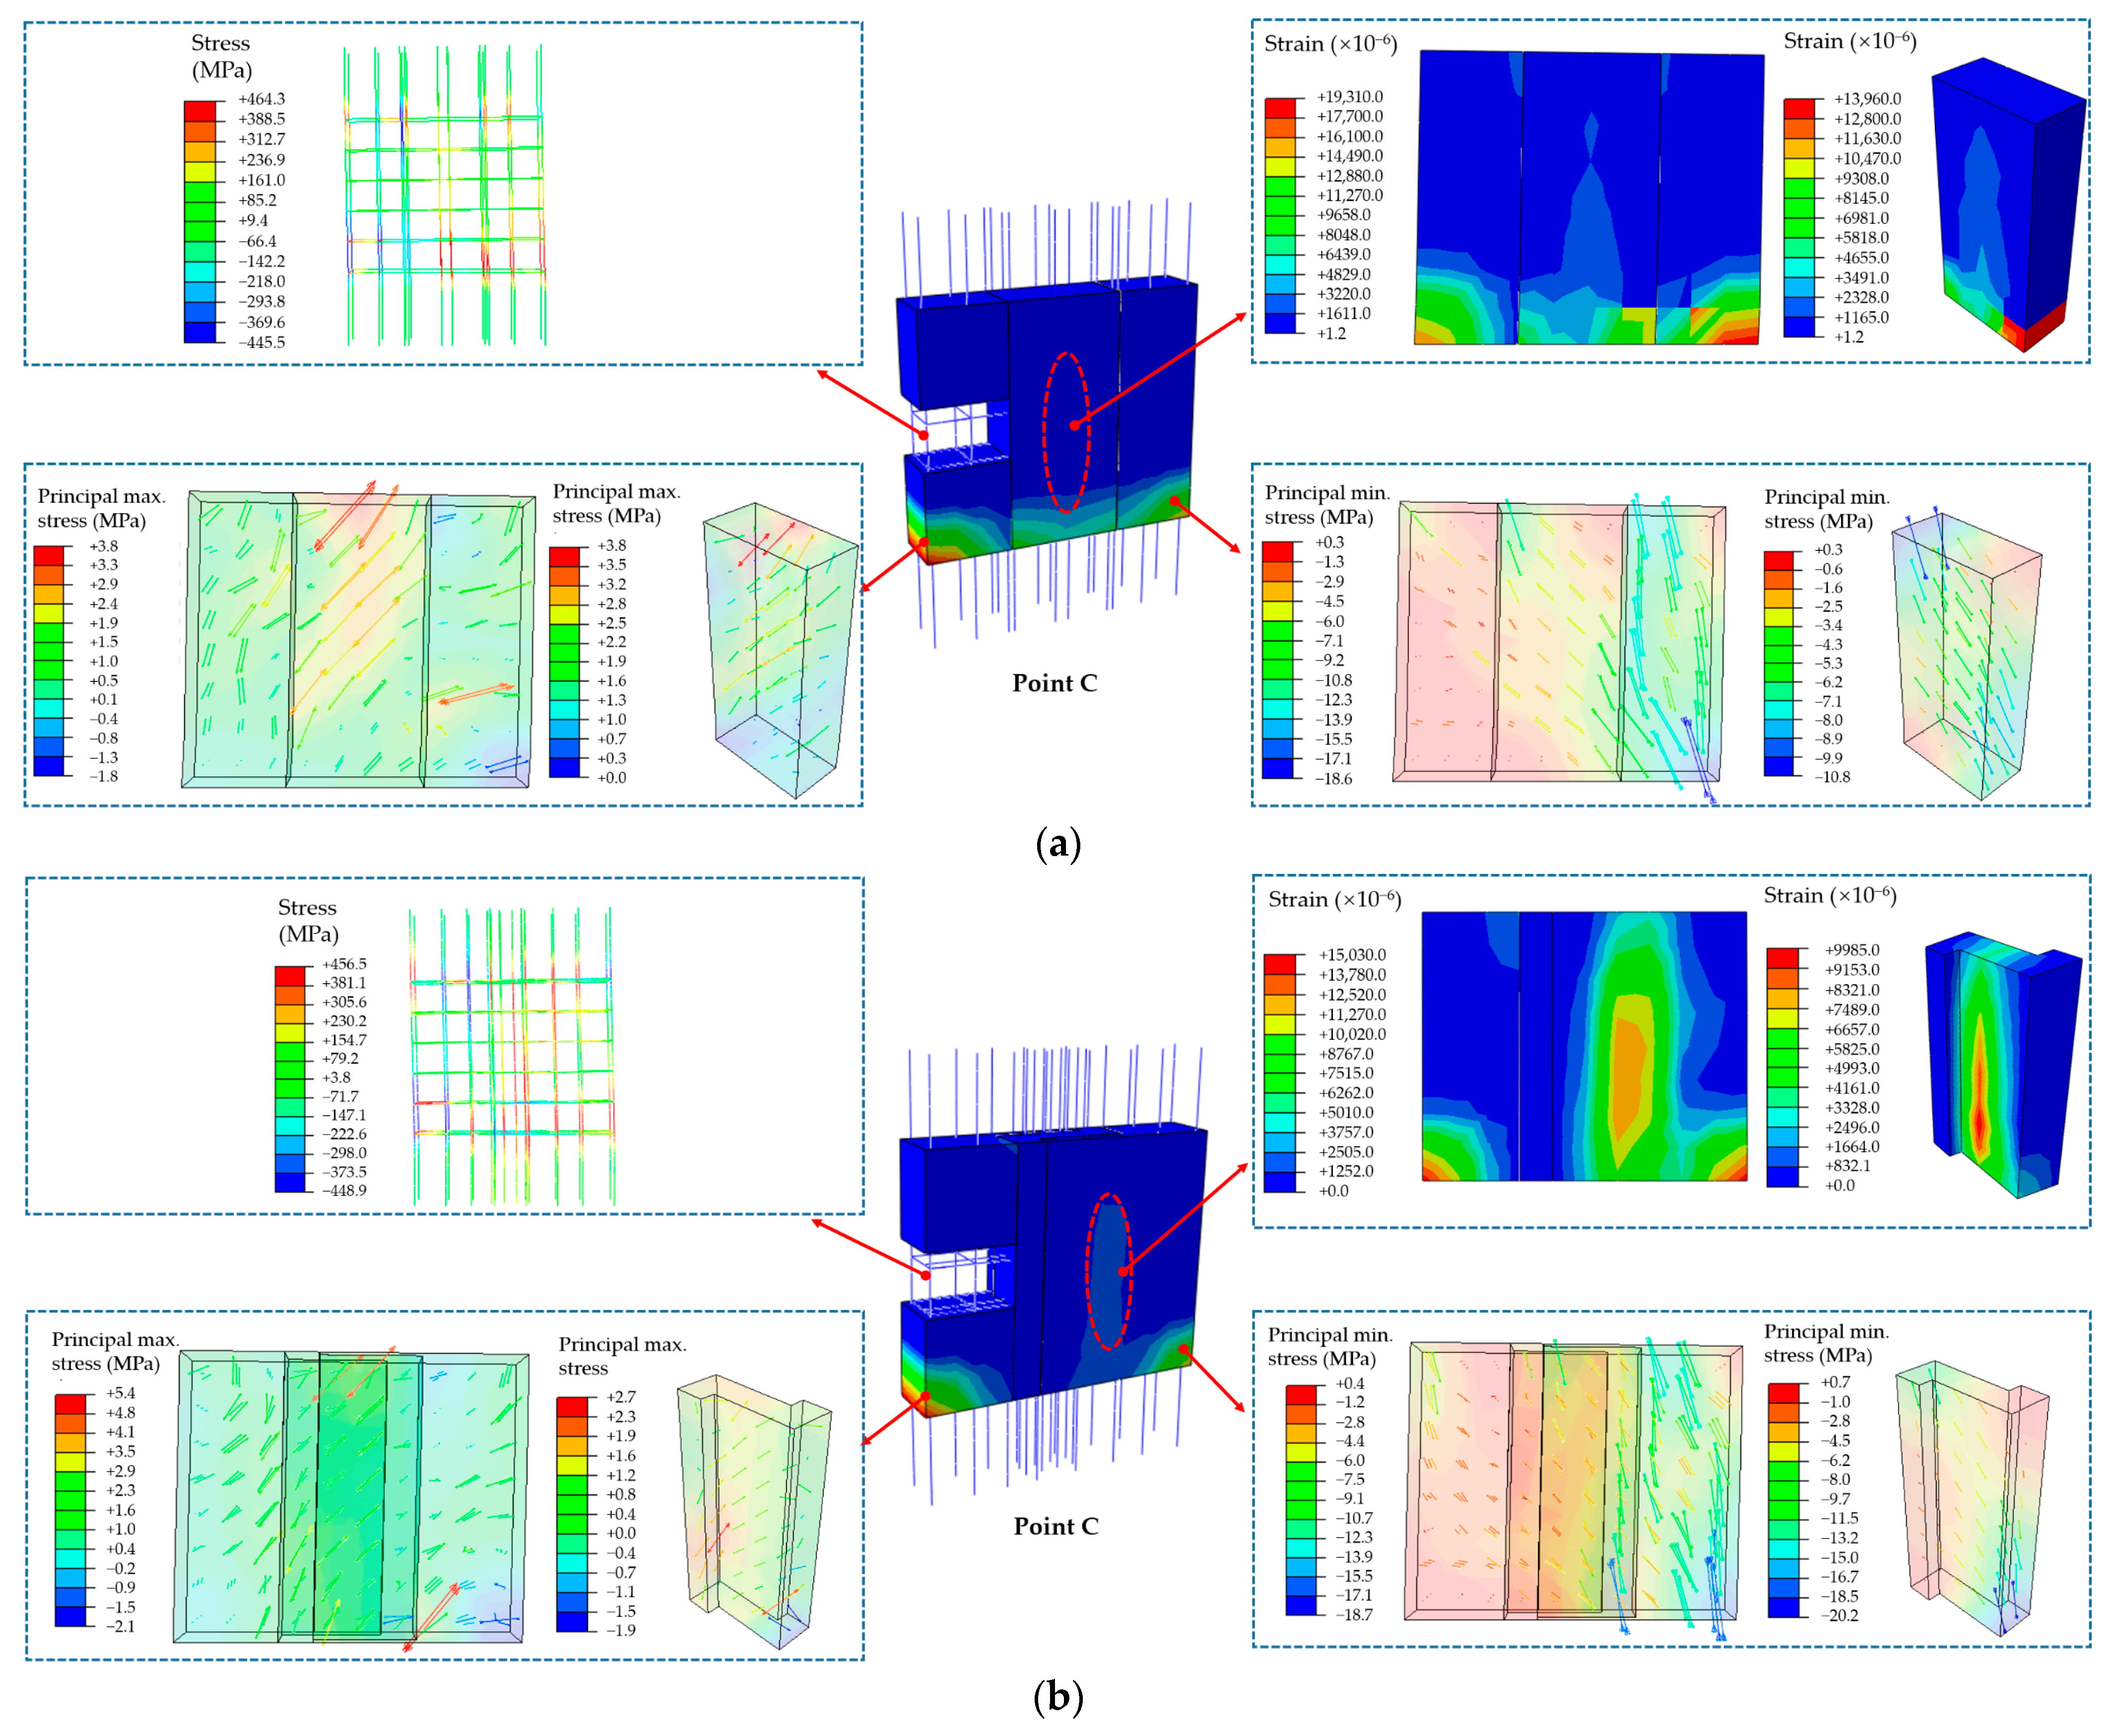
As shown in Figure 11 for the stress variation of the shear walls at ultimate displacement, the principal tensile and compressive stresses remained at a high level on the shear walls. The failure zone with maximum stress appeared along the diagonal of the shear wall to create a main diagonal crack. The tensile stress at the root of the shear wall expanded towards the compression zone, and the cracks gradually penetrated through the vertical joint. The concrete stress was consistent on both sides of the vertical joint, and the plastic deformation of the shear wall remained in the region of 1/3 height. At this time, the stress of the horizontal steel bars was close to the yield strength, while the stress on the connected surfaces of the vertical joint could be effectively transferred with the steel bars.
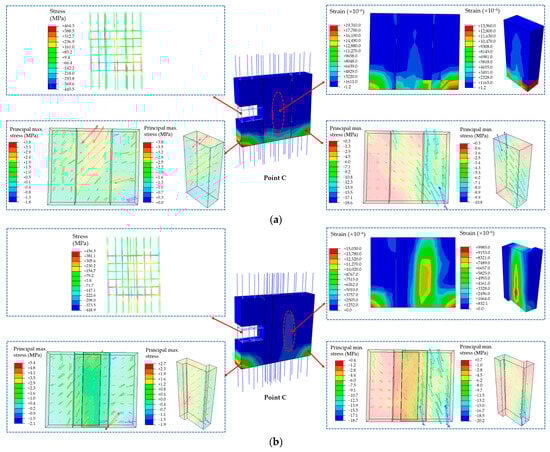
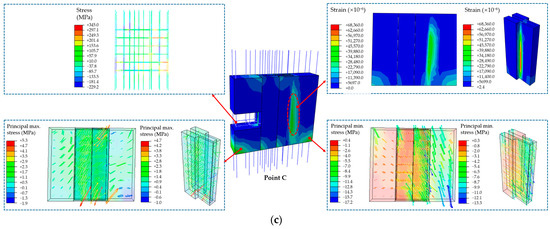
Figure 11.
Stress and strain of the specimens at ultimate displacement: (a) SW1-1; (b) SW2-1; (c) SW3-1.
3.5. Bearing Capacity and Ductility
Good seismic deformation capacity is the first defense to avoid brittle failure. As summarized in Table 4 for the characteristic value of bearing capacity, each eigenvalue was taken as the average of the cyclic loads. The yield displacement Δy, ultimate displacement Δu, ultimate displacement angle (θu = Δu/H), and ductility coefficient (μ = Δu/Δy) were important indices to evaluate the deformation ability of the shear wall. The yield point was calculated using the energy method [27], which was defined as the characteristic point when the peak load decreased to 85% of the ultimate load.
Table 4.
Bearing characteristic values of the specimens.
It can be observed that with the same axial compression ratio, the bearing capacity of the shear wall with an L-shaped vertical joint was relatively close to that of the shear wall with a straight vertical joint. Because the concrete strength applied for the cast-in-place joint was higher than that for the precast units of the shear walls, the bearing capacity had a decrease of 3.16%, 12.22%, and 8.49% at the respective stages for the specimen SW3-1, while it presented a decrease of 7.30%, 14.66%, and 11.20% for the specimen SW3-2.
With an increase in the axial compression ratio from 0.2 to 0.3, the shear walls with a straight, an L-shaped, or a convex vertical joint exhibited an increase of 8.41%, 8.65%, and 6.19% in the ultimate bearing capacity, and a decrease of 4.70%, 4.26%, and 5.14% in ductility, respectively. This indicates that an increase in the bearing capacity was accompanied by a decrease in ductility if the axial compression ratio increased. Notably, the ultimate story displacement angles of the tested specimens ranged from 1/50 to 1/40, which were significantly over the limit of 1/120 for the elastic–plastic story displacement angle of shear walls under rare earthquakes [27]. With an increase in the axial compression ratio, the yield and peak loads of the shear wall gradually increased, while the displacement ductility coefficient decreased. However, when the axial compression ratio was 0.30, the displacement ductility coefficient was 3.77, which indicated good deformability, which was also confirmed by the research conducted by Chu et al. [16,17].
Compared to the key parameters of the test and simulation, the simulated yield displacement was smaller than the test results. This is because the simulation was idealized and did not consider the slip between the steel bars and the concrete. However, the simulated results were almost the same as the test, with errors less than 10% for the ultimate displacement angles and ductility coefficients. This indicates that the simulation reflected the mechanical properties well for the prefabricated shear walls.
3.6. Energy Dissipation Ability
From Table 5, the energy dissipation ability of each specimen gradually increased with the cyclic load, accompanied by the damage of the concrete and the gradual yield of the steel bars. Comparatively, with the same axial compression ratio, the specimens SW2-1 and SW3-1 exhibited a decrease of 4.43% and 4.84%, respectively, in energy dissipation ability compared to the specimen SW1-1, while the specimens SW2-2 and SW3-2 exhibited a decrease of 18.09% and 20.16%, respectively, compared to the specimen SW1-2.
Table 5.
Energy dissipation ability and measured stiffness values of the specimens.
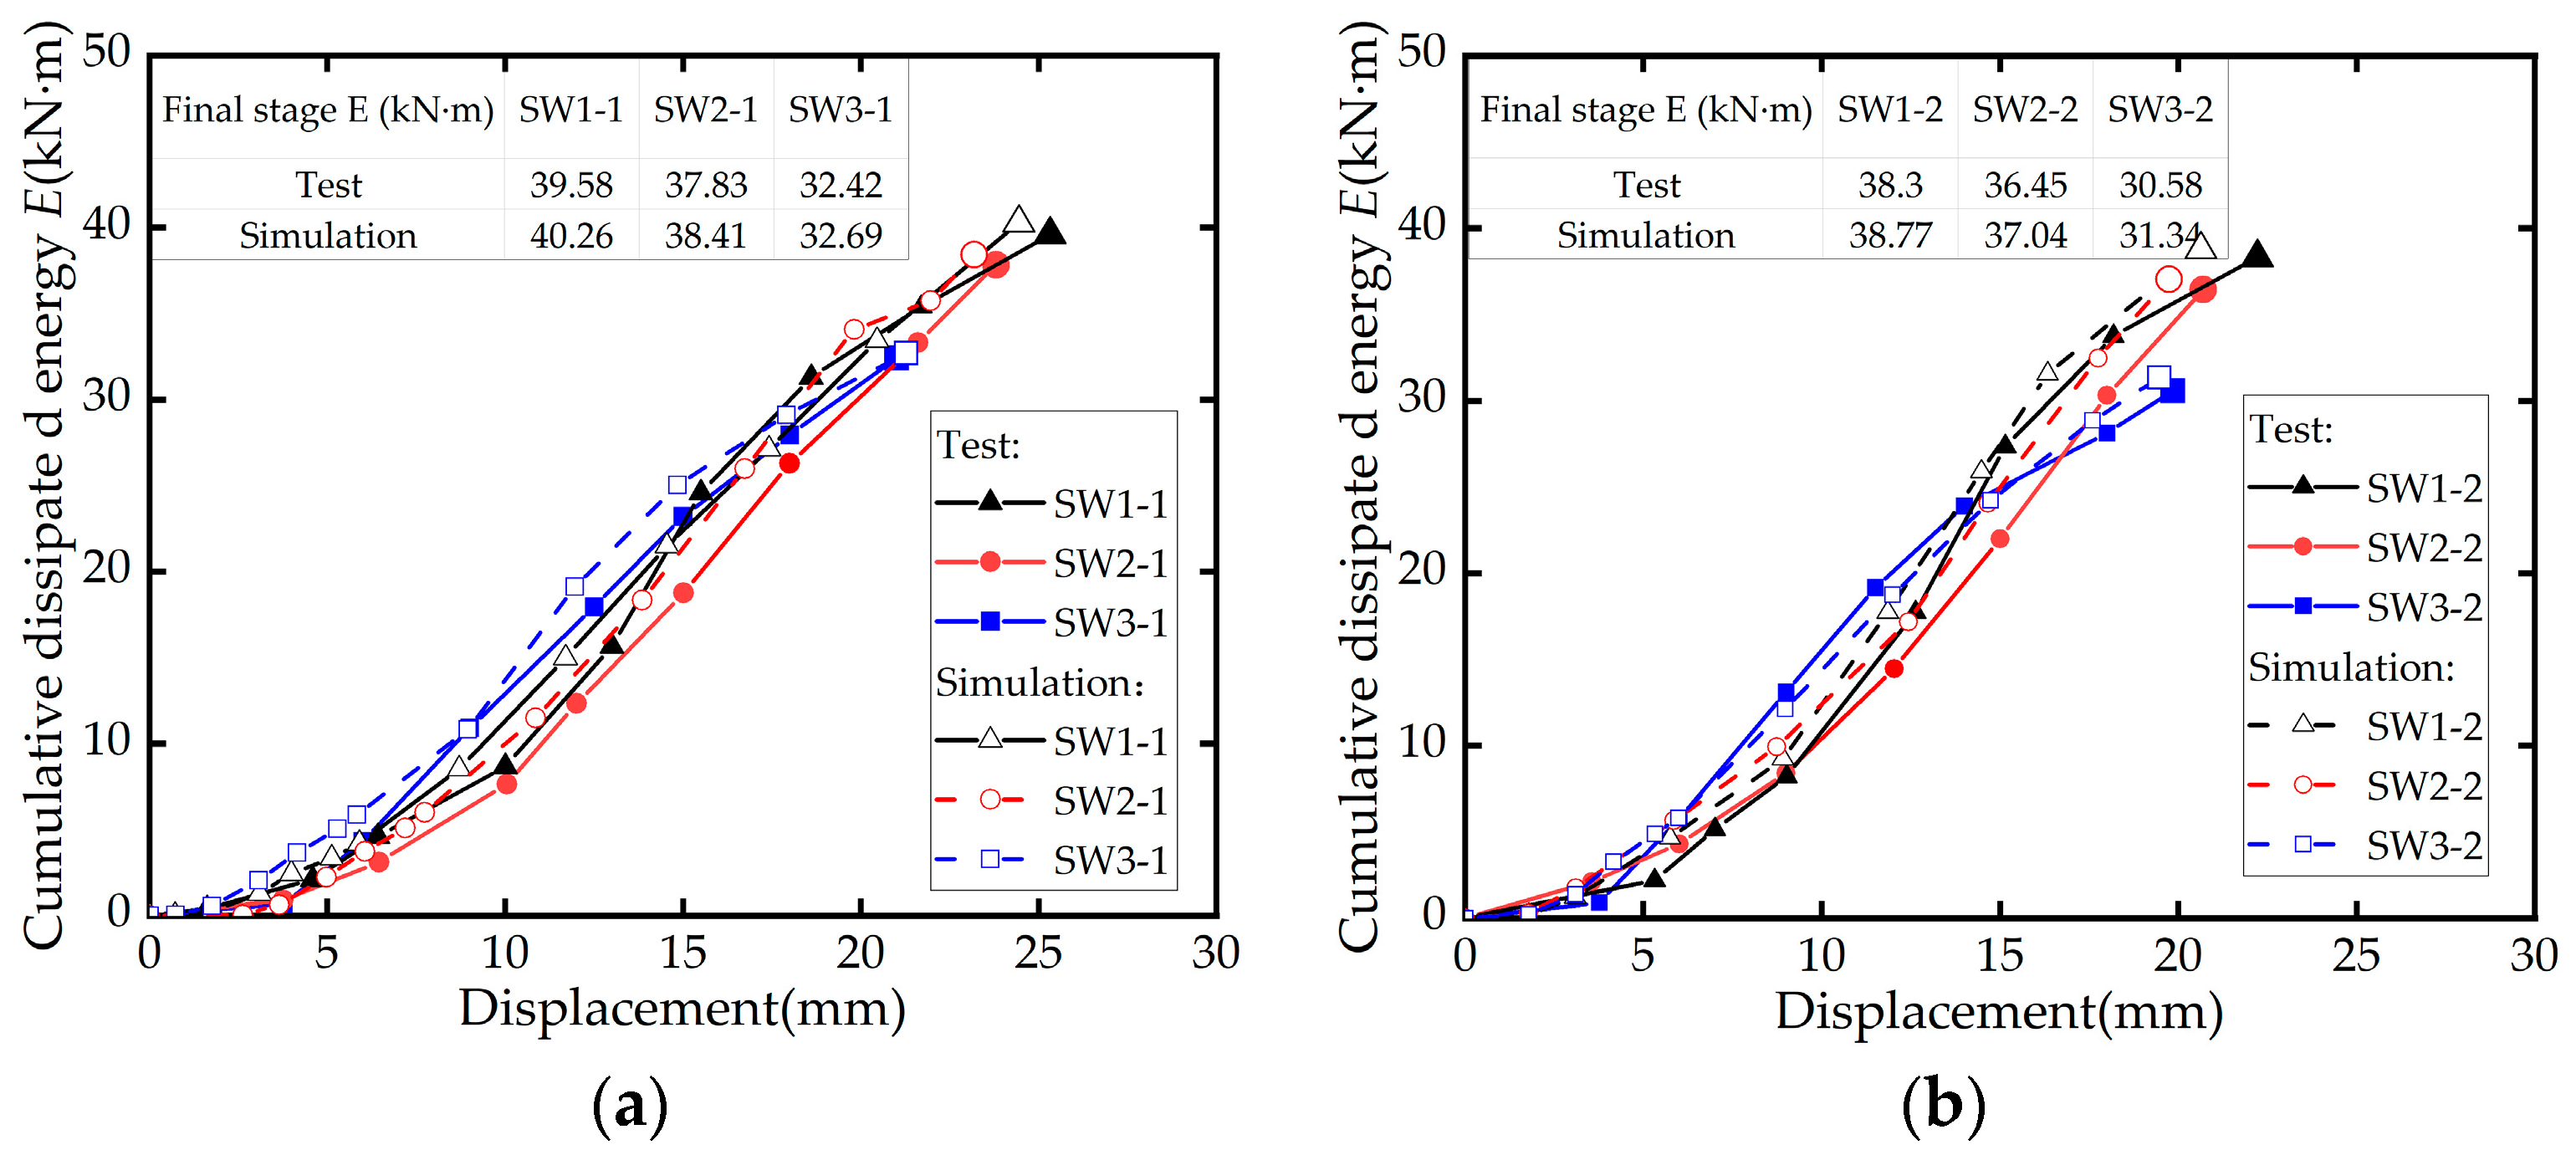
When the axial compression ratio reached 0.3, the shear walls with a straight, an L-shaped, or a convex vertical joint achieved a higher bearing capacity, but exhibited a decrease of 3.24%, 3.65%, and 5.69% in the energy dissipation ability, respectively. Furthermore, the specimens experienced rapid stiffness degradation after the peak load. This indicates that the axial compression ratio significantly influenced the energy dissipation capacity of the specimens. Figure 12 shows the comparisons of the test and simulated results of the cumulative dissipated energy (E) for all specimens. The energy dissipation was lower before yielding and increased after yielding. Under different axial compression ratios, the simulation displayed greater energy dissipation than the test, but the simulated total cumulative dissipated energy was only 2% over the test value. This indicates that the simulation could better reflect the energy dissipation capacity of the tested specimens.
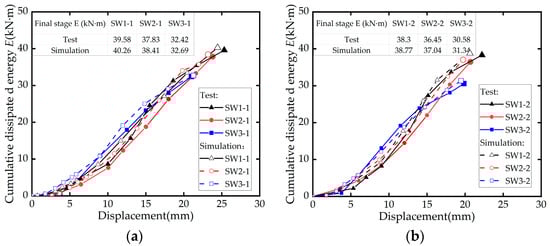
Figure 12.
Energy dissipation of the specimens with an axial compression ratio of (a) 0.2; (b) 0.3.
3.7. Stiffness Degeneration
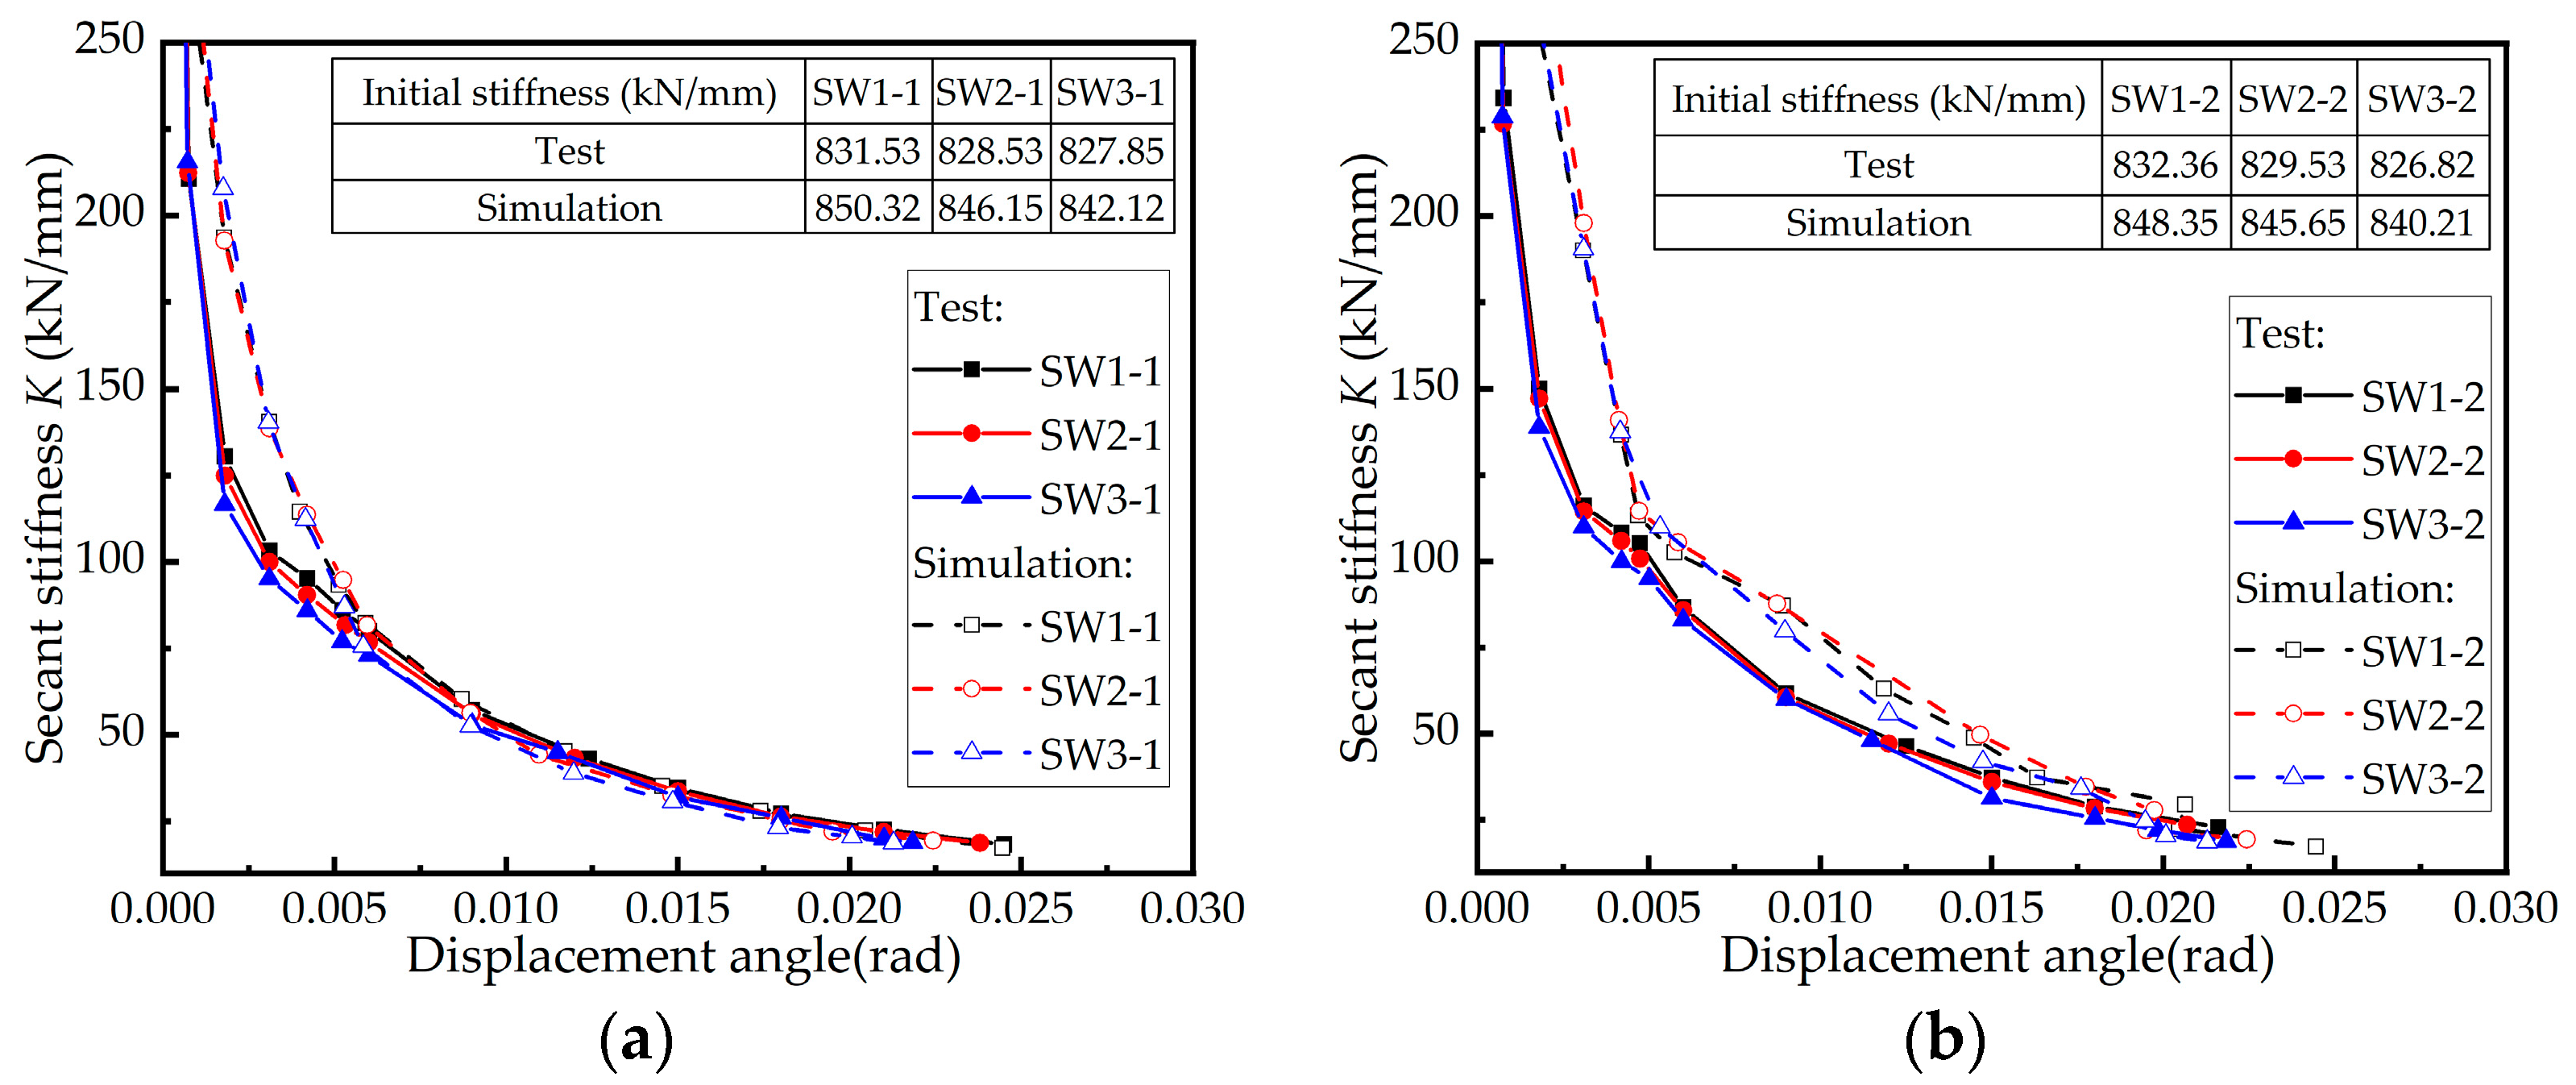
The calculated stiffness values for the specimens are summarized in Table 5, where δy0 = Ky/K0. Figure 13 shows the whole process of stiffness (K) degradation with the increase in displacement angle (θ) for each specimen. It was discernible that the tested specimens presented a similar stiffness degradation with a minimal variation in the initial stiffness. With the appearance and extension of cracks, the stiffness degradation became fast, with a sharp drop in the stiffness degradation curves. When other parameters were the same, the stiffness degradation was lower on the specimens with a higher axial compression ratio. This once again indicated that the stiffness degradation of the shear walls was slowed down, as the axial compression increased the compressive area of concrete and limited the extension of cracks.
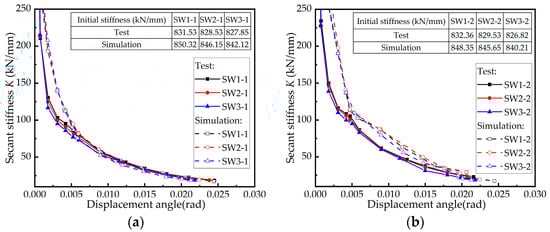
Figure 13.
Stiffness degradation curves of the specimens with an axial compression ratio of (a) 0.2; (b) 0.3.
Compared with the shear walls with a straight cast-in-place vertical joint, the shear walls with a convex cast-in-place vertical joint had a decrease of 12.1% and 19.4% in the yield stiffness with the 0.2 and 0.3 axial compression ratio, respectively. This shows that a larger weak area of the convex vertical joint reduced the integrity of the shear wall. Therefore, the stiffness degradation increased in sequence for the shear walls with a straight, an L-shaped, or a convex cast-in-place concrete vertical joint. With the increase in load, the cracks increased on the surface of the shear wall, and the stiffness degradation was caused by the accumulation of damage. Meanwhile, the continuous stiffness degradation after the yield of the shear walls indicated a good connection between the cast-in-place vertical joint and the precast units. This led to the disappearance of the catastrophe point on the stiffness degradation curve. The simulated stiffness degradation was greater than the tested one for the specimens before yielding, while the simulated stiffness after yielding was basically equal to the tested one, with an error within 5%. This shows that the simulation could successfully describe the stiffness degradation of the specimens.
4. Conclusions
- (1)
- The failure was in a shear pattern for the prefabricated shear walls with a straight, an L-shaped, or a convex cast-in-place concrete vertical joint. The cracks mainly distributed around the cast-in-place concrete vertical joint, which reduced the crushed area at the root of the prefabricated shear walls. The cast-in-place concrete bonded to the precast units well to ensure the ability to effectively transfer the shear stress.
- (2)
- Compared with the prefabricated shear wall with a straight vertical joint, the prefabricated shear walls with an L-shaped or a convex vertical joint exhibited a slight decrease in bearing capacity, ductility, and energy dissipation capacity. However, all the prefabricated shear walls met the cyclic performance requirements. The prefabricated shear walls under a higher axial compression ratio exhibited an increase in the bearing capacity and a decrease in ductility.
- (3)
- The stresses on both sides of the vertical joint were basically consistent, which ensured an even stress distribution across the prefabricated shear walls. The stress patterns aligned with the trend of crack extension, which resulted in a small difference in bearing capacity, stiffness degradation, ductility, and energy dissipation capacity. This demonstrates good agreement between the test and the numerical analysis. The finite element models built in this study can be used for the future parametric analysis of the cyclic performance of prefabricated shear walls.
Author Contributions
Methodology, Y.Y. and S.Z.; validation and supervision, B.S. and S.Z.; investigation, J.Y., L.D. and Z.G.; data curation, J.Y., L.D., L.Z. and Z.G.; writing—original draft preparation, Z.G., J.Y. and L.D.; writing—review and editing, L.Z. and Y.Y.; funding acquisition, S.Z. and J.Y. All authors have read and agreed to the published version of the manuscript.
Funding
This research was funded by the State Key Research and Development Plan, China (grant number 2017YFC0703904) and the Doctoral Innovation Fund of NCWU, China (grant number HSZ2022-196).
Data Availability Statement
Data are available from the first author and can be shared with anyone upon reasonable request. The data are not publicly available due to privacy.
Conflicts of Interest
Author Baoshan Sun was employed by the company Henan Fifth Construction Group, Zhengzhou 450007, China. The remaining authors declare that the research was conducted in the absence of any commercial or financial relationships that could be construed as a potential conflict of interest.
References
- GB/T 51231-2016; Technical Standard for Assembled Buildings with Concrete Structure. China Building Industry Press: Beijing, China, 2016.
- JGJ/T398-2017; Standard for Design of Assembled Housing. China Building Industry Press: Beijing, China, 2017.
- JGJ 1-2014; Technical Specification for Precast Concrete Structures. China Building Industry Press: Beijing, China, 2014.
- Liu, S.; Li, Z.; Teng, Y.; Dai, L. A dynamic simulation study on the sustainability of prefabricated buildings. Sustain. Cities. Soc. 2022, 77, 103551. [Google Scholar] [CrossRef]
- Yang, Y.; Ding, X.; Liu, Y.; Deng, L.; Lv, F.; Zhao, S. Lateral pressure test of vertical joint concrete and formwork optimization design for monolithic precast concrete structures. Buildings 2022, 12, 261. [Google Scholar] [CrossRef]
- Li, C.; Yang, Y.; Su, J.; Meng, H.; Pan, L.; Zhao, S. Experimental research on interfacial bonding strength between vertical cast-in-place joint and precast concrete walls. Crystals 2021, 11, 494. [Google Scholar] [CrossRef]
- Singhal, S.; Chourasia, A.; Chellappa, S.; Parashar, J. Precast reinforced concrete shear walls: State of the art review. Struct. Concr. 2019, 20, 886–898. [Google Scholar] [CrossRef]
- Shen, S.D.; Pan, P.; Miao, Q.S.; Li, W.F.; Gong, R.H. Test and analysis of reinforced concrete (RC) precast shear wall assembled using steel shear key (SSK). Earthq. Eng. Struct. Dyn. 2019, 48, 1595–1612. [Google Scholar] [CrossRef]
- Sritharan, S.; Aaleti, S.; Henry, R.S.; Liu, K.Y.; Tsai, K.C. Precast concrete wall with end columns (PreWEC) for earthquake resistant design. Earthq. Eng. Struct. Dyn. 2015, 44, 2075–2092. [Google Scholar] [CrossRef]
- Du, H.; Jiang, J.; Han, M.; Sun, W. Experimental research on seismic behavior of assembled l-shaped perforated wall connected by soft cable. J. Build. Struct. 2019, 40, 119–127. [Google Scholar]
- Gu, Q.; Zhao, D.; Tan, Y.; Gao, H.; Deng, Q.; Wang, X. Experimental study on L-shaped precast concrete superposed shear walls under quasi-static cyclic loading with different axial compressive load ratios. Eng. Struct. 2022, 254, 113857. [Google Scholar] [CrossRef]
- Gu, Q.; Zhao, D.; Li, J.; Peng, B.; Deng, Q.; Tian, S. Seismic performance of T-shaped precast concrete superposed shear walls with cast-in-place boundary columns and special boundary elements. J. Build. Eng. 2022, 45, 103503. [Google Scholar] [CrossRef]
- Wang, X.; Dong, G.; Deng, Q.; Tan, Y.; Wen, S.; Gu, Q. Seismic performance and deformation mechanism of precast single-face superposed shear wall. J. Build. Eng. 2023, 80, 108026. [Google Scholar] [CrossRef]
- Zhang, Z.; Wang, C.; Li, S.; Liu, X.; Wang, D.; Cao, X.; Zhang, Y. Seismic performance of prefabricated concrete shear wall with fluted grouting and anchor joint. J. Build. Struct. 2020, 41, 276–285. [Google Scholar]
- Chu, M.; Liu, J.; Hou, J.; Ren, B.; Liu, M.; Qiu, G.; Wang, G. Experimental study on flexural performance of precast concrete shear walls built with precast two-way hollow slabs with vertical joints. J. Build. Struct. 2017, 38, 84–92. [Google Scholar]
- Chu, M.; Liu, J.; Hou, J.; Ren, B. Experimental study on shear behaviors and bearing capacity of shear walls built with precast concrete two-way hollow slabs with vertical joints. Eng. Mech. 2020, 37, 183–194. [Google Scholar]
- Chu, M.; Xiong, C.; Liu, J.; Sun, Z. Experimental study on shear behavior of two-way hollow core precast panel shear wall with vertical connection. Struct. Design. Tall. Spec. Build. 2020, 30, e1814. [Google Scholar] [CrossRef]
- Liu, J.; Wang, B.; Chu, M.; Zhang, P.; Wang, B. Influence of the axial load ratio on the mechanical behaviour of pre-fabricated concrete shear walls with Mortise-Tenon joints. Structures 2023, 53, 83–97. [Google Scholar] [CrossRef]
- Zhao, B.; Wu, D.; Zhu, H. New modular precast composite shear wall structural system and experimental study on its seismic performance. Eng. Struct. 2022, 264, 114381. [Google Scholar]
- GB 50010-2010; Code for Design of Concrete Structures. China Building Industry Press: Beijing, China, 2010.
- Dassault Systems SIMULIA Corp. Abaqus Theory Manual, Version 6.12; Dassault Systems SIMULIA Corp.: Providence, RI, USA, 2012. [Google Scholar]
- Ali, O.; Abbas, A.; Khalil, E.; Bigaud, D. A new robust equation for shear strength of GFRP-RC deep beams using hybrid experimental and synthetic data based-FE quasi-static analysis procedure. Eng. Struct. 2023, 293, 116652. [Google Scholar] [CrossRef]
- Wang, X.; Ma, S.; Wu, W.; Fang, J.; Chen, Z. Tensile damage development and constitutive relationship establishment of recycled coarse aggregate concrete based on a double-interface numerical model. Constr. Build. Mater. 2023, 392, 131908. [Google Scholar] [CrossRef]
- Bai, Y.; Yang, H.; Jia, J.; Mei, S. Finite element analysis on large-rupture-strain (LRS) FRP confined concrete based on modified concrete damaged plasticity model. J. Eng. Mech. 2023, 40, 129–143. [Google Scholar]
- American Concrete Institute. ACI Committee 318. Building Code Requirements for Structural Concrete (ACI 318-11) and Commentary; American Concrete Institute: Farmington Hills, MI, USA, 2011. [Google Scholar]
- Coronado, C.; Lopez, M. Sensitivity analysis of reinforced concrete beams strengthened with FRP laminates. Cem. Concr. Compos. 2006, 28, 102–114. [Google Scholar] [CrossRef]
- GB 50011-2010; Code for Seismic Design of Buildings. China Building Industry Press: Beijing, China, 2010.

Disclaimer/Publisher’s Note: The statements, opinions and data contained in all publications are solely those of the individual author(s) and contributor(s) and not of MDPI and/or the editor(s). MDPI and/or the editor(s) disclaim responsibility for any injury to people or property resulting from any ideas, methods, instructions or products referred to in the content. |
© 2023 by the authors. Licensee MDPI, Basel, Switzerland. This article is an open access article distributed under the terms and conditions of the Creative Commons Attribution (CC BY) license (https://creativecommons.org/licenses/by/4.0/).