Article

Wooden Beams Modal Damage Identification Parameters Based on Strain

1
School of Civil Engineering, Qingdao University of Technology, Qingdao 266000, China
2
School of Architecture and Engineering, Liaocheng University, Liaocheng 252000, China
3
School of Civil Engineering, Xi’an University of Architecture and Technology, Xi’an 710055, China
*
Author to whom correspondence should be addressed.
Buildings 2023, 13(12), 3035; https://doi.org/10.3390/buildings13123035
Submission received: 2 October 2023 / Revised: 18 November 2023 / Accepted: 21 November 2023 / Published: 6 December 2023
(This article belongs to the Special Issue Protection and Retrofit Methods of Historic Buildings)

Abstract

:
This study completely investigates the damage detection problem based on strain modal characteristics using simply supported wooden beams as the research object. First, modal analysis was performed, and finite element models of both damaged and undamaged timber beams were created using ABAQUS. Second, a number of strain modal characteristics (strain modal, strain modal difference, and strain modal curvature difference) were used to identify the damage to the wooden beam construction. Lastly, the modal parameters of the wooden beam under various damage scenarios were ascertained using damage identification experiments, and the test results were contrasted with those obtained from a numerical simulation. The findings showed that, while each of the three damage identification indices has a distinct identification effect, they can all locate the damage to wooden beams. Strain mode curvature difference > strain mode difference > strain mode is the order of them. The results of this study can be used as a reference to identify damage to timber beams in the future.

1. Introduction

A large portion of China’s historical and cultural legacy consists of the timber structures of ancient buildings [1,2]. However, due to factors like the external climate and the material itself, wood components will unavoidably experience varying degrees of deterioration throughout the course of their extended service [3,4,5]. This will affect the safe use of the wooden building and lower its overall safety, applicability, and durability. The preservation of historic buildings’ wooden structures depends on carrying out damage identification research on their wooden components.
Researchers have been studying damage identification more and more in recent years [6,7,8]. Damage identification is an essential part of keeping historic buildings’ timber structures healthy. Among several damage assessment methods, vibration-based methods are preferred as damage detection tools instead of static measurement methods [9,10] because of their flexible evaluation techniques, information accessibility, and cost [11]. It is being used more and more.
The underlying idea is that physical parameters are altered due to damage to the structure, and these changes, in turn, affect the modal aspects of the structure, including its natural frequencies and vibration mode. Therefore, the changes in these modal characteristics can be utilized as an important indicator to determine the presence of structural damage [12].
Among the different damage detection indicators employed in structural modal parameter testing, the natural frequencies are the most straightforward to measure and have the best accuracy [13,14]. However, natural frequencies are an international variable that does not allow for the accurate localization of structural damage [15]. The value of its variation is significantly smaller when the building is subjected to slight damage. It is difficult to determine the precise site of structural damage since it fluctuates based on environmental parameters, such as temperature and humidity [16]. Other related metrics, such as curvature modes, strain modes, and strain mode curvature differences, can be created based on the differentiation of the forms. The mode shapes carry more spatial and damage location information than the natural frequencies. Pandey et al. [17] were the first to propose the use of the central difference of displacement modes to produce curvature modes, which could subsequently be used to diagnose damage to buildings. He et al. [18] demonstrated how the curvature mode difference index, when combined with finite element simulation and testing, can be used to determine the location and degree of structural damage in cantilever beams. Xiang et al. [19] proposed an information entropy based on curvature modal utility as a damage identification indicator; tests and numerical simulations on supported beams are utilized to verify the validity of the index.
By simulating and analyzing reinforced concrete beams, Dawari and Vemawala [20] provided a damage identification approach based on modal curvature and modal flexibility differences; the findings showed that the recommended method successfully locates honeycomb damage in beams. When strain proportional to curvature was combined with measured strain data for modal analysis, as performed by Yao et al. [21], the damage diagnosis that resulted was more precise than when using the curvature modes approach. The results showed the exceptional robustness and accuracy of the presented method for localizing cable-stayed bridge girders. Xu et al. [22] used the distributed strain modal method to identify the damage of large-span, cable-stayed bridges and established the damage identification index of the residual trend of the distributed strain modal using statistical trend analysis and confidence probability. Wang et al. [23] employed work modal analysis and strain modal studies to pinpoint the damage on a four-span bridge model. Cui et al. [24] used an eigensystem approach in combination with the strain modal damage detection method to investigate the damage of cantilever girders under natural excitation. The experiments showed that the approach could more accurately identify the damaged section of the rafters.
Li et al. [25,26] and Chan et al. [27] employed measured stresses for their fatigue investigation and life prediction of natural suspension bridges. Zhang et al. [28] employed the strain mode curvature difference and the first-order strain mode vibration pattern as damage identification indices to find structural damage in track slabs, such as cracks and dehollowing. The outcomes proved how successful the chosen damage identification indices were. Li et al. [29] promoted the use of strain modal difference as a tool for identifying and detecting damage to cantilever beam structures, and they presented experimental evidence supporting the method’s effectiveness in detecting structural damage. Zhang et al. [30] were able to locate the damage to the structure by building a finite element model of a three-span continuous bridge and using the variation in strain mode differential vibration patterns at the damage site. To sum up, the strain modes and the indices that are derived from them have the following advantages: they are more sensitive to local structural changes and have a more accurate influence on the location of the structural damage. Compared to displacement vibration mode and curvature mode, the strain modes have two advantages: (1) they are also derived from differentiation, which amplifies the displacement of the damaged portion of the structure, increasing its identification effect and sensitivity to changes in structural damage; and (2) they are more effective than the other modal parameters at differentiating between the damage of smaller and complex structures.
As science and technology have developed, deep learning (DL) and artificial intelligence (AI) algorithms have been used extensively in recent years to evaluate and predict the onset and spread of structural damage, which has a large potential for application in engineering challenges [31,32,33,34,35,36]. The systematic summary by Avci et al. [37] of the application of deep-learning and machine-learning techniques as well as traditional methods in vibration-based structural damage detection shows that these techniques have produced notable improvements in structural damage detection and have the potential to increase detection efficiency and accuracy. A novel damage detection technique was presented by Nguyen et al. [38]. To precisely determine the position and degree of damage to beam structures as well as the overall stiffness change in the structure, they employed Bayesian deep learning and balancing composite motion optimization.
The cross-section of thin beams with heights significantly less than spans in genuine engineering constructions is assumed to be free of strain both before and after deformation and perpendicular to the central axis. The theory that explains the deformation and force characteristics of such beams is called classical beam theory, or Eulerian–Bernoulli beam theory [39]. A number of recent studies have been conducted in light of the sophisticated theories previously discussed, elucidating the impact of damage on the vibration properties of beams and bars [40,41,42,43]. We find that the theory more accurately characterizes and predicts the dynamic behavior of structures when damage effects are taken into account. These results are critical to the development of new preventative strategies as well as a deeper comprehension of the diversity of structural vibration characteristics. This research focuses on the problem of damage detection of Eulerian–Bernoulli beams whose spans are significantly larger than their heights, building on the earlier work.
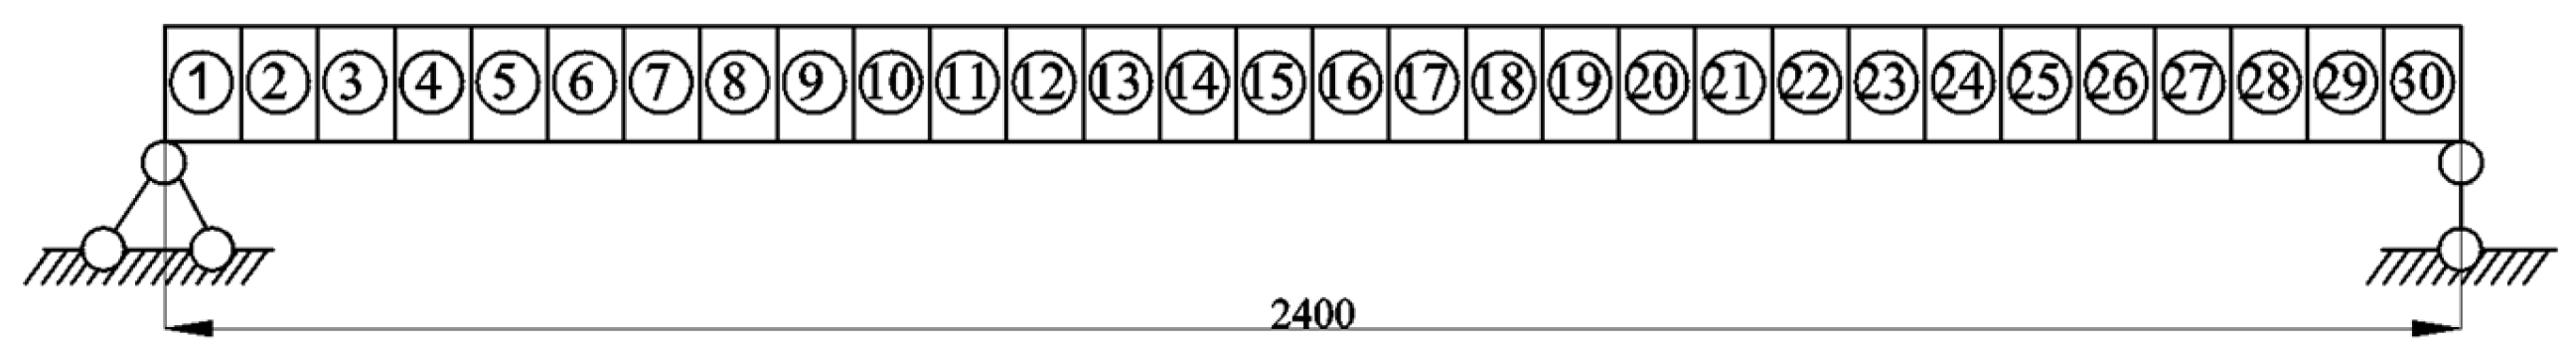
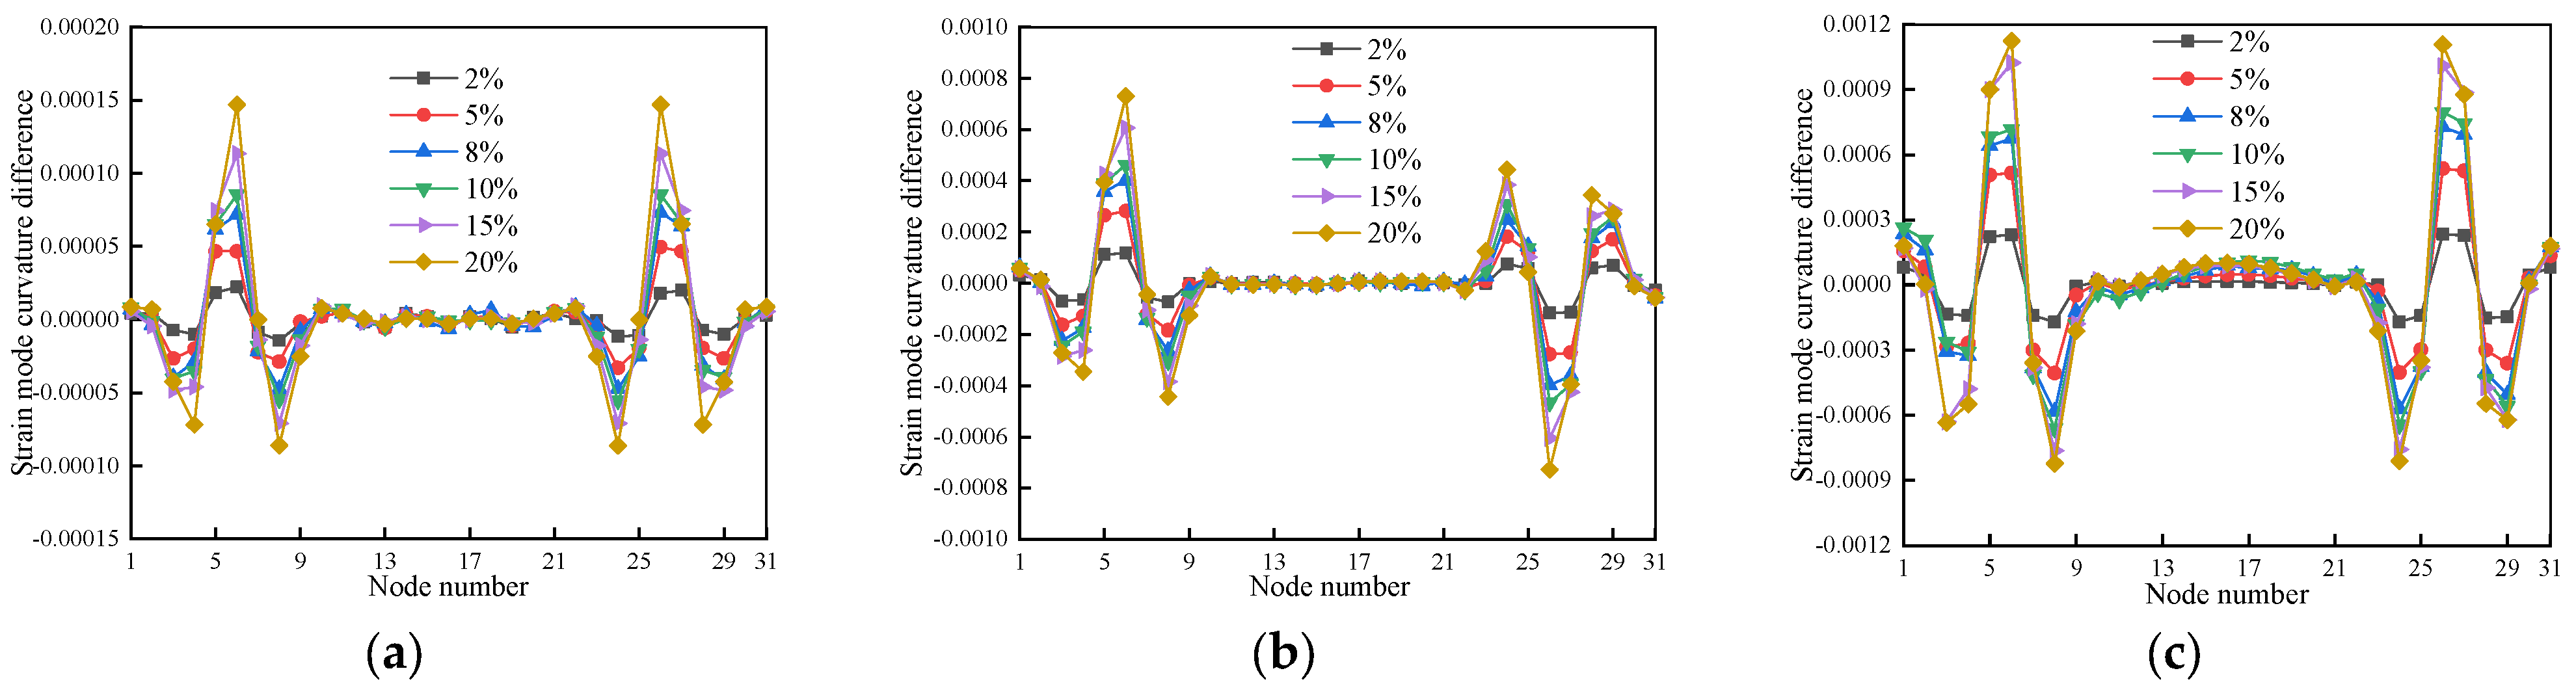
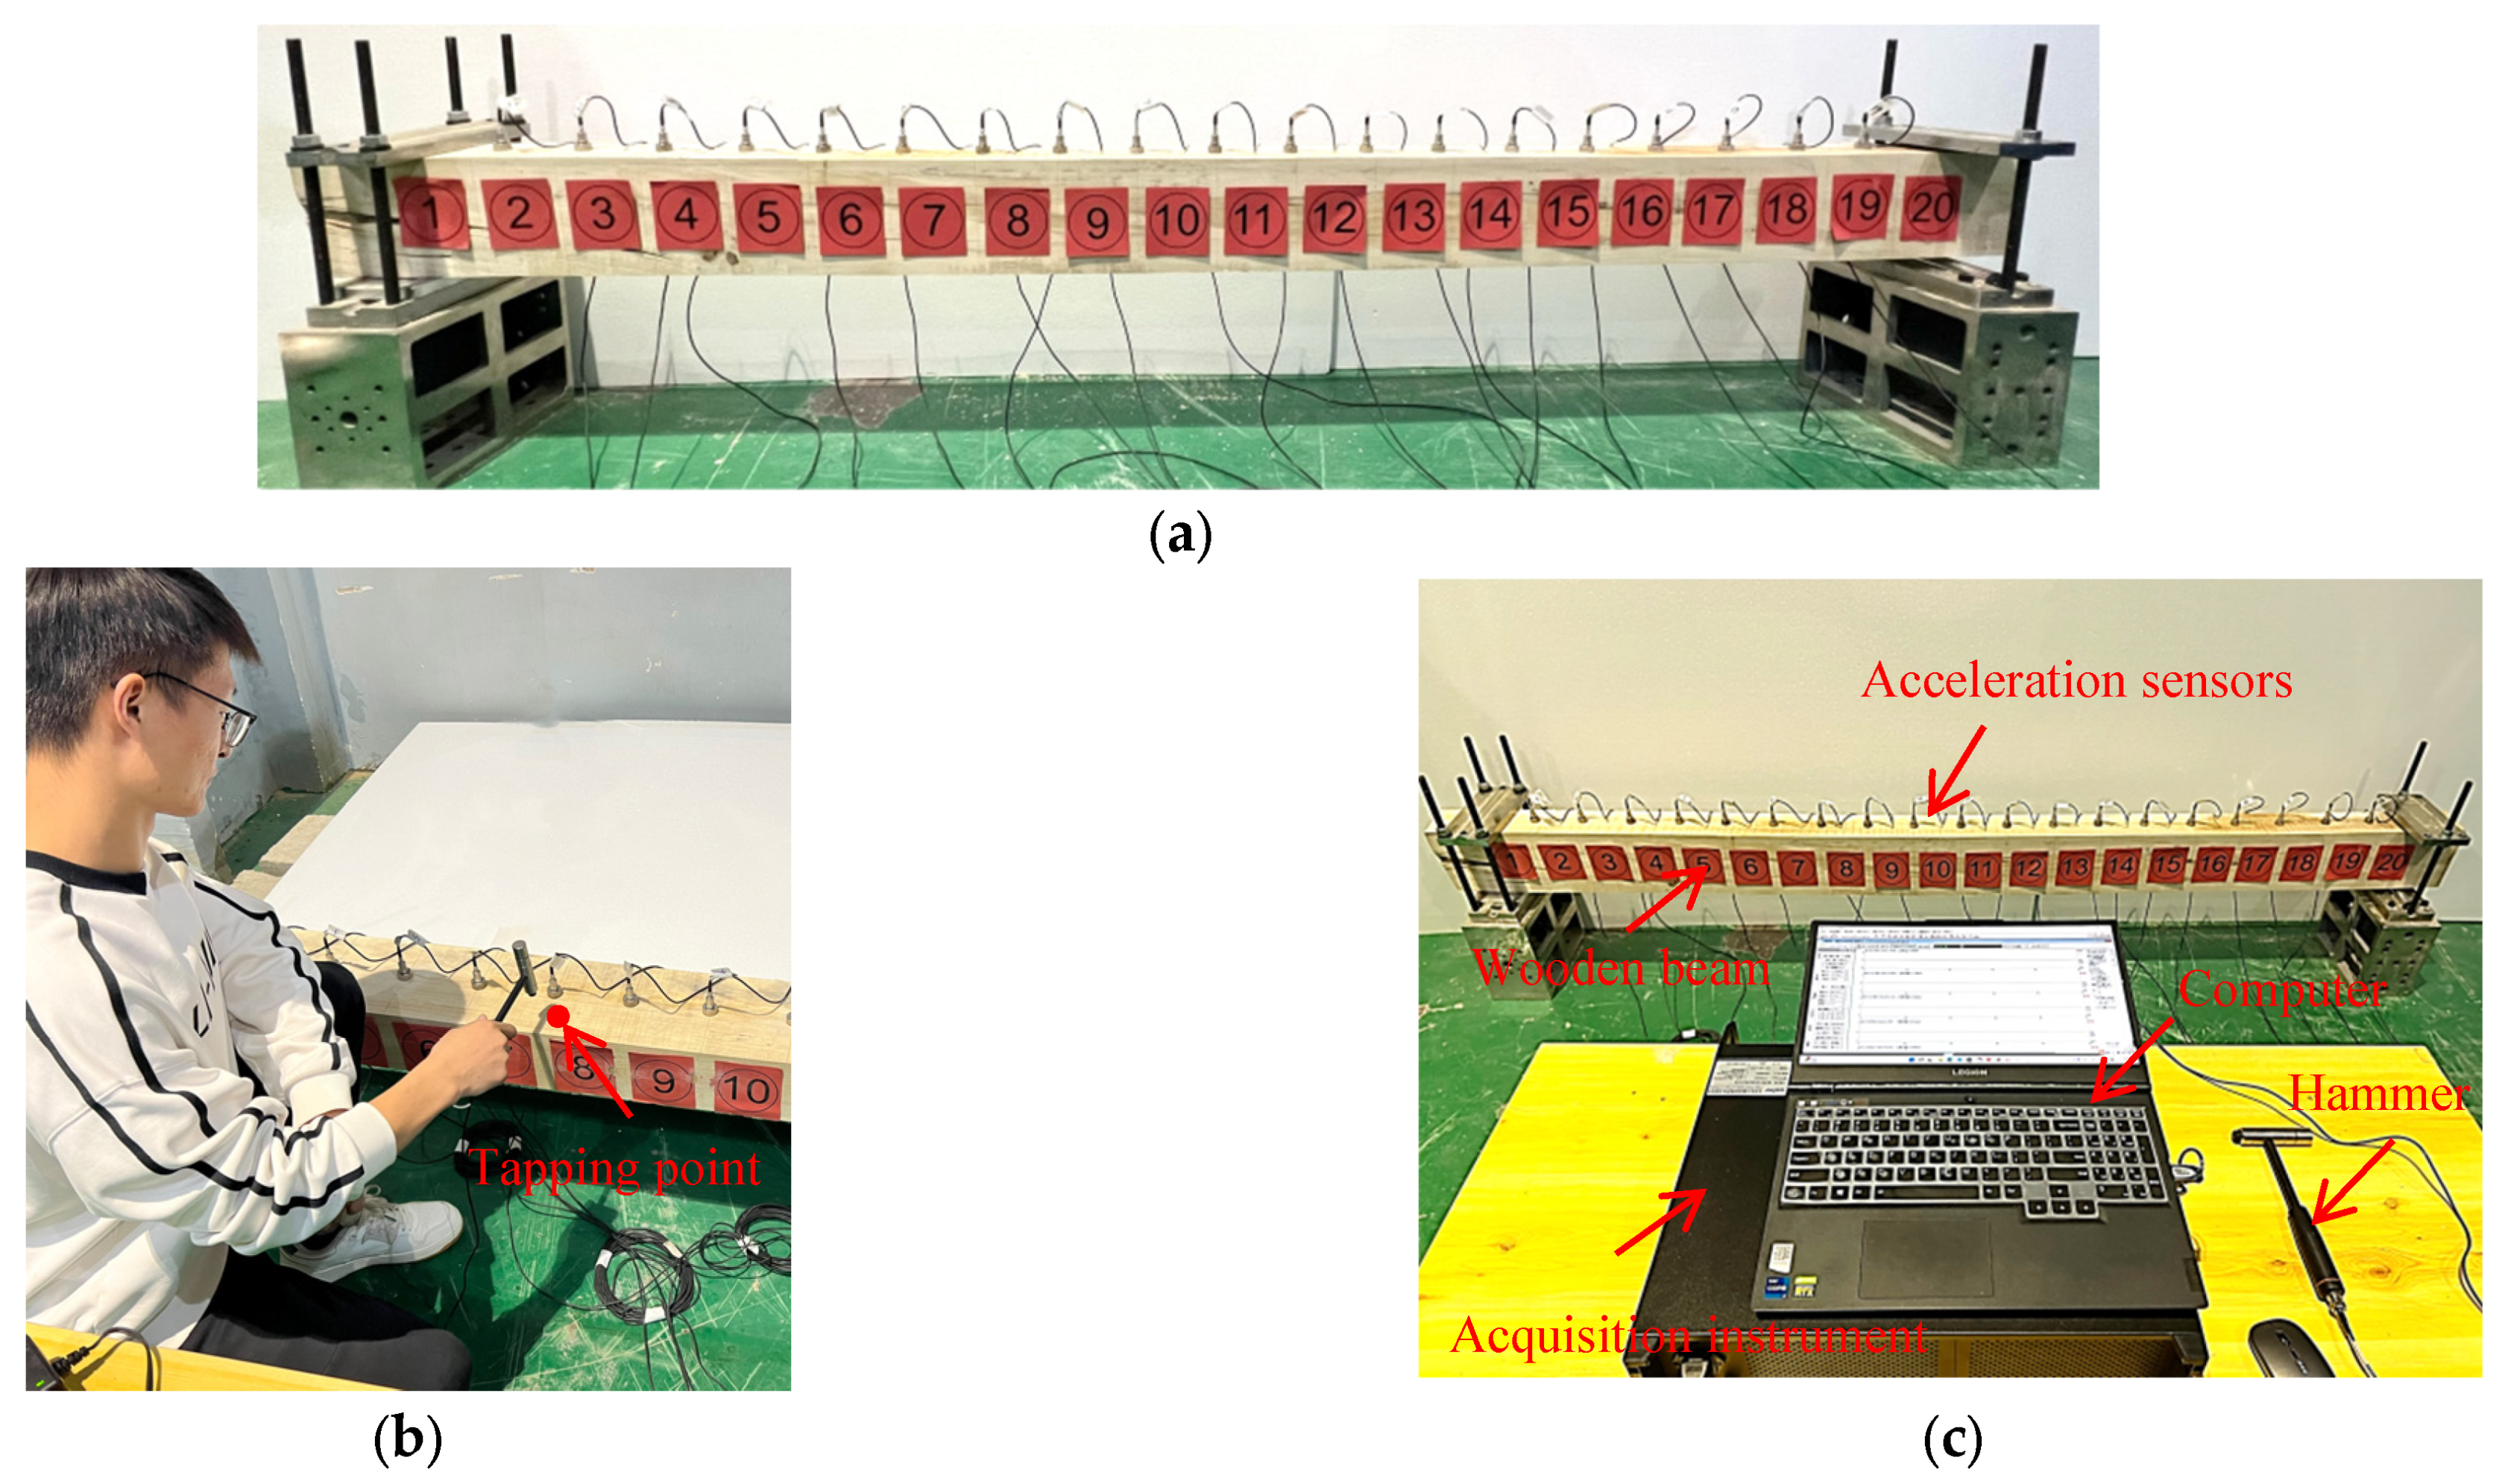
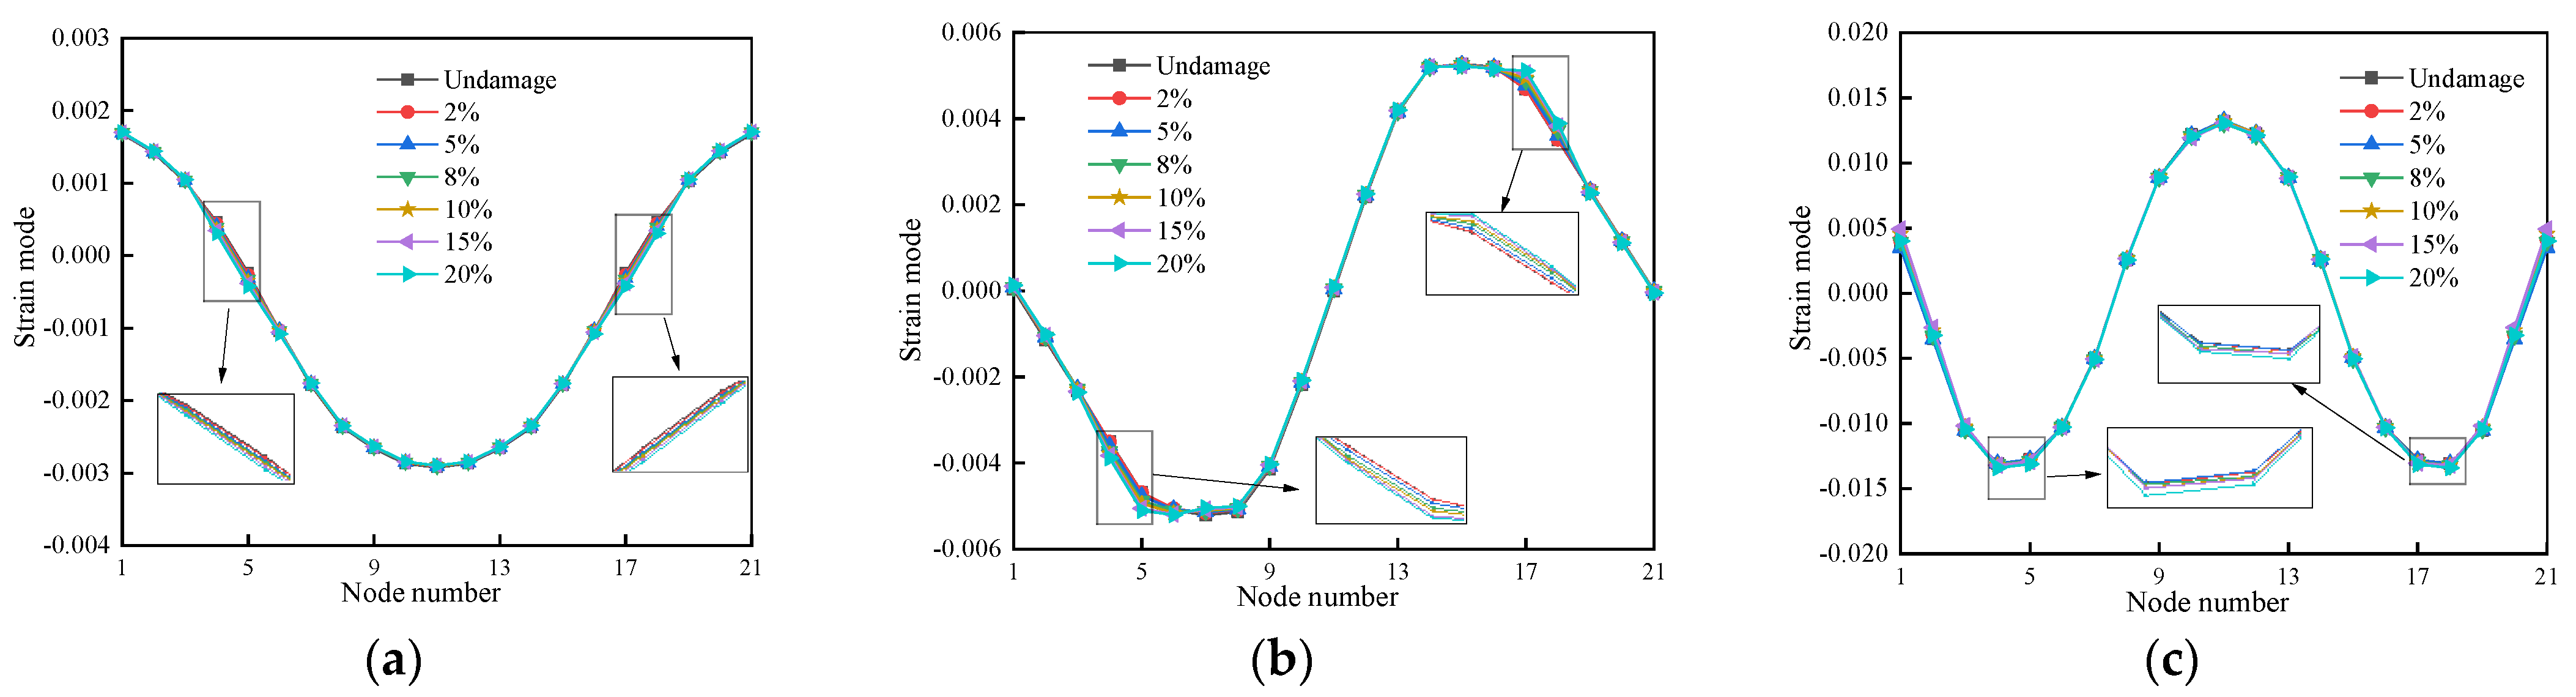
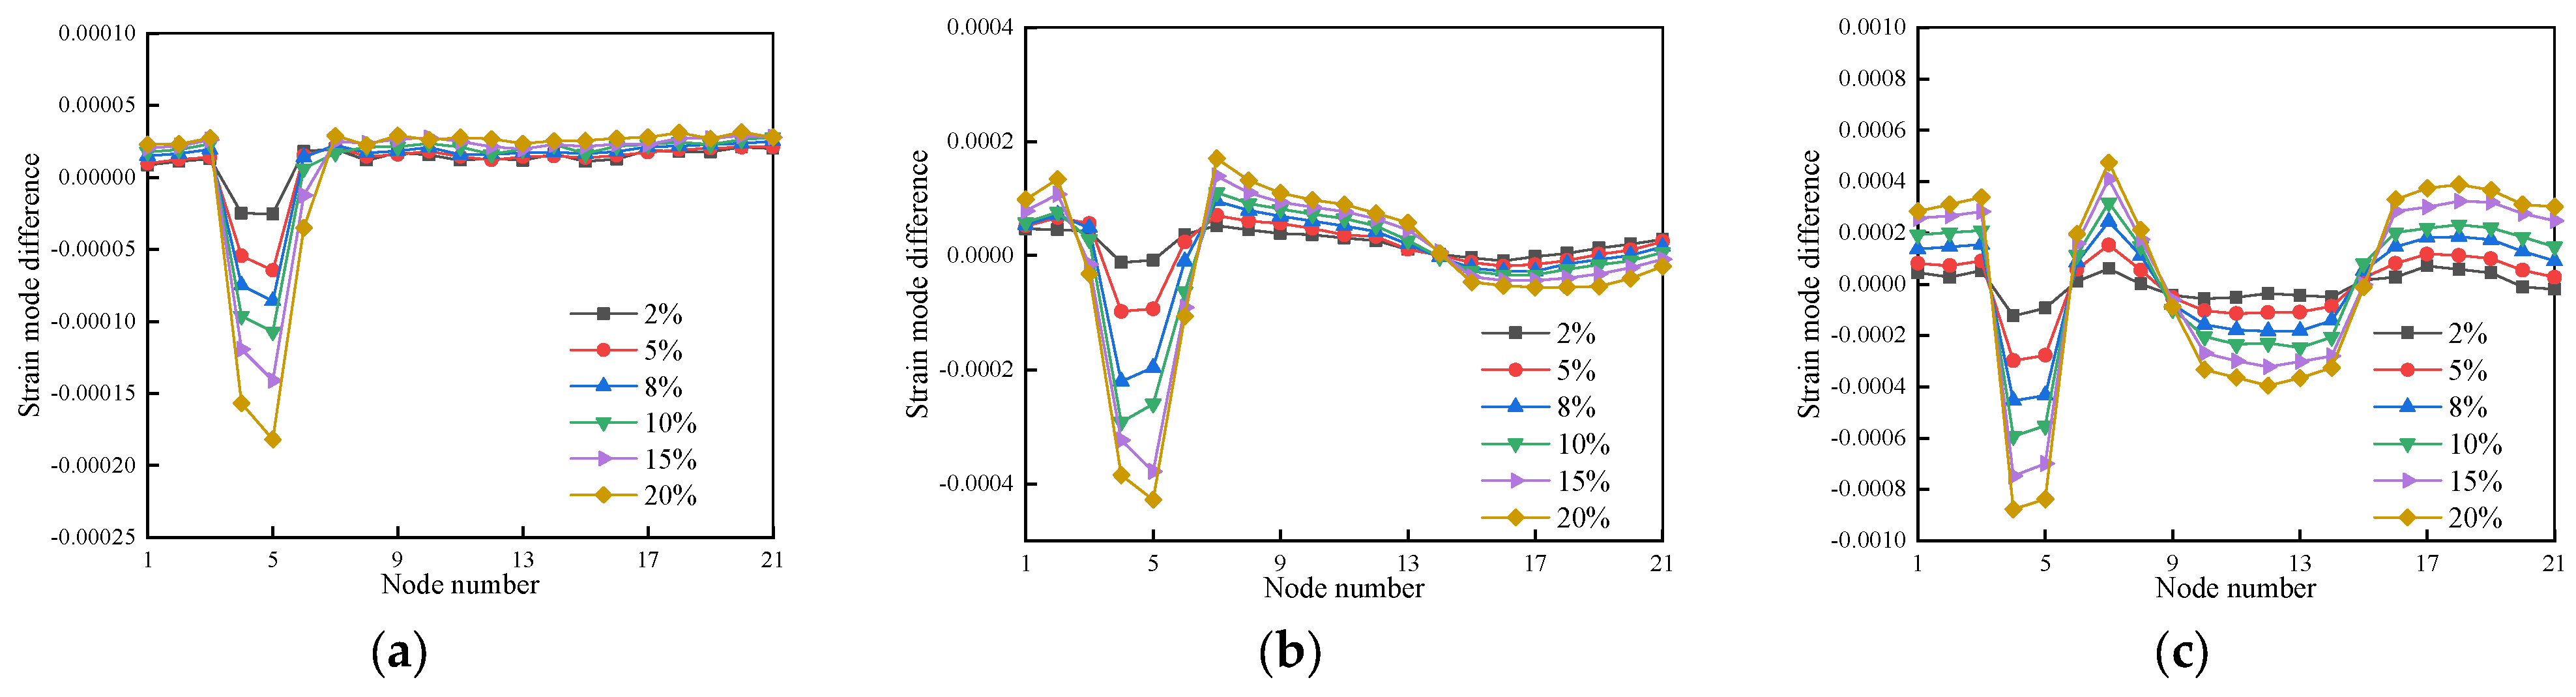
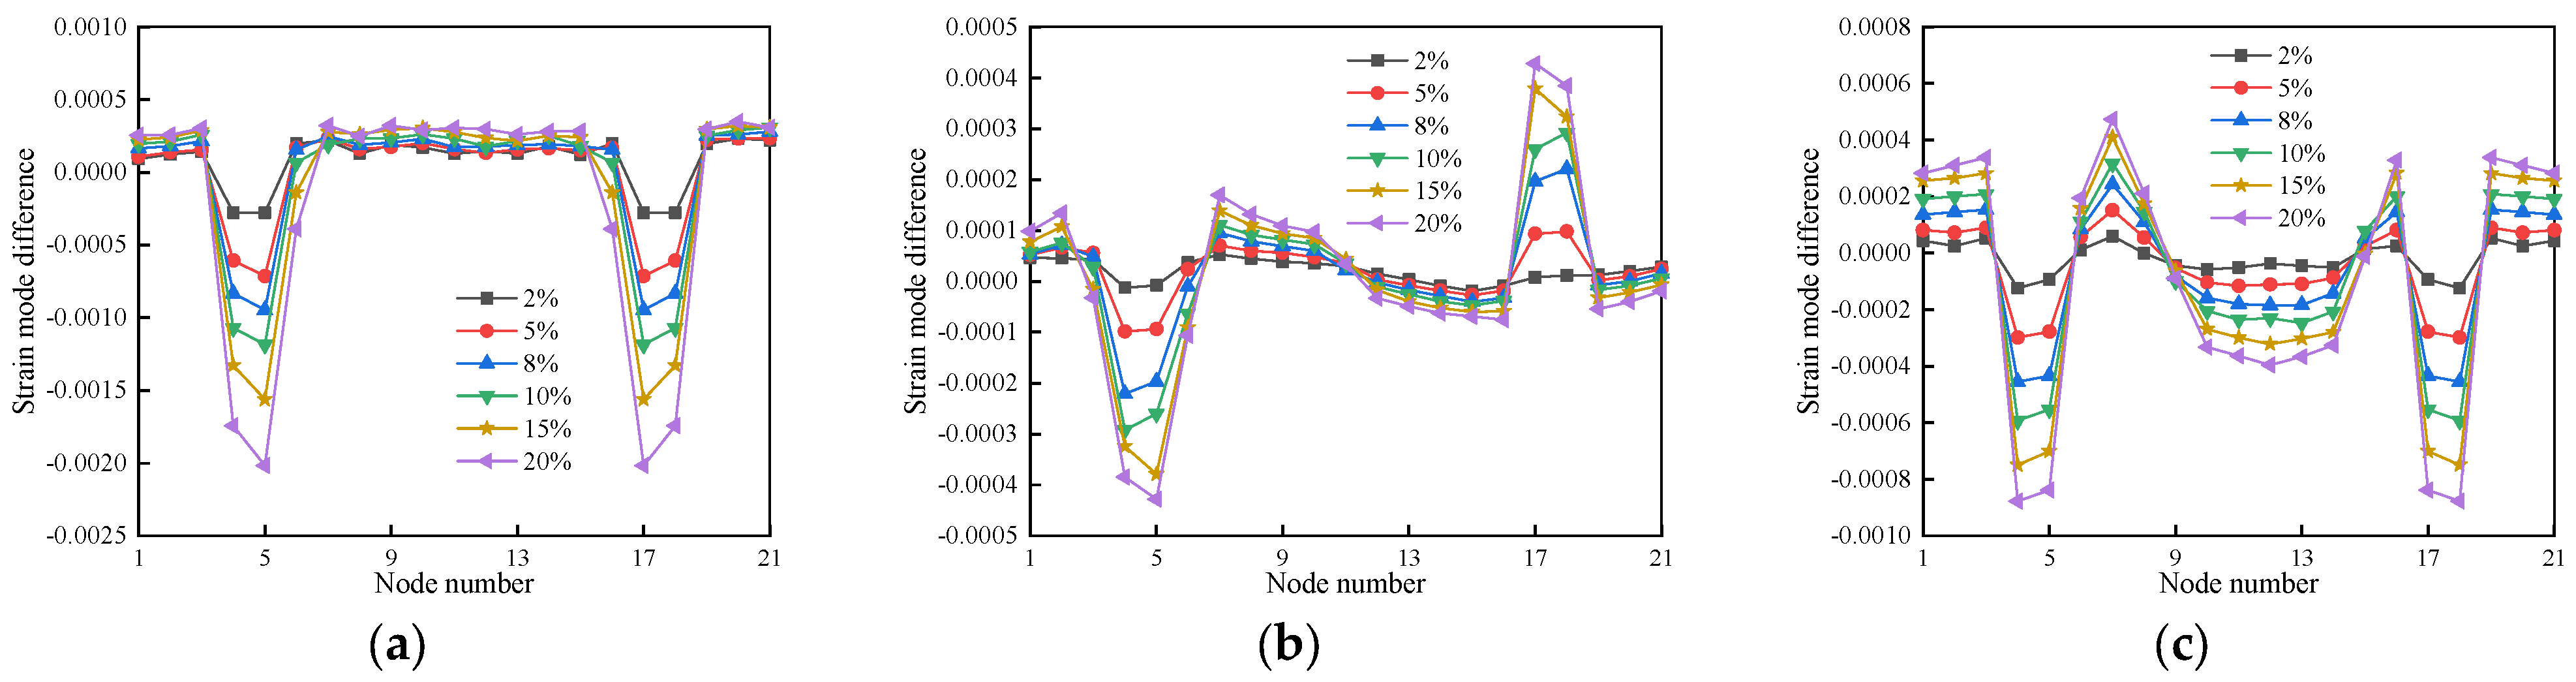
In light of this, this article proposes a method for identifying damage in simply supported wooden timbers by utilizing the curvature difference between strain modes. In contrast to alternative modal parameters, the strain modal curvature difference index exhibits a substantial precipitous change at the damaged location while displaying virtually no abrupt change at the undamaged location. This characteristic contributes to the enhanced accuracy of damage identification. Specifically, numerical simulation and damage identification tests are used to obtain the modal parameters of the beam under various damage conditions; then, the damage identification indexes based on strain mode, strain mode difference, and strain mode curvature difference are applied to the test data and the numerical simulation data, respectively, to determine the damage localization. In order to ascertain the damage localization identification indices that are most sensitive to the local damage of wooden beams, the results of damage localization identification using experimental data and numerical simulation data are contrasted.

2. Theory of Damage Identification

2.1. The Strain Mode Vibration Pattern’s Derivation

This paper develops the strain modal formulation of the Euler–Bernoulli beam based on the Euler–Bernoulli beam theory [44]. Assuming that the supported beams vibrate undamped, the influence of shear deformation is disregarded, and only the transverse displacements of the beams are taken into account.
The structural displacement vibration response equation for a multi-degree-of-freedom vibration system can be expressed as follows, using the theory of mode superposition [45,46]:
x = r = 1 N q r φ r ;   q r = φ r T F e j w t k r ω 2 m r + j ω c r
where x is a displacement response; q r serves as the modal coordinate; φ r is the displacement mode shape of the rth order; ω represents the inherent frequency; m r is the modal mass; k r is the modal stiffness; c r is the modal damping; F e j w t is the force reaction; and j is imaginary.
The elastic mechanics principle [47] states that the expression for the strain response is as follows, based on the conversion relationship between strain and displacement. Strain and displacement modes both satisfy the modal superposition because they are two different ways to describe the same energy balance. From Equations (1) and (2), we are aware that, in three-dimensional space, the formula is expressed as:
ε x ε y ε z = r = 1 N q r x φ r u y φ r v z φ r w = r = 1 N q r ψ r ε x ψ r ε y ψ r ε z
where ε x , ε y , and ε z , correspondingly, signify the three-way primary strain.
The rth order strain modes in the x, y, and z directions, respectively, are defined as x φ r u = ψ r ε x , y φ r v = ψ r ε y , and z φ r w = ψ r ε z .
The strain and displacement modes have the same modal coordinates. Given ψ r ε that denotes the strain mode’s vibration matrix and ε that represents the total nodal strain vector of the structural unit, the strain mode is
ε = r = 1 m q r ψ r ε = ψ r ε φ r T F e j w t k r ω 2 m r + j ω c r

2.2. Mutual Correspondence of Strain Modes with Displacement and Curvature Modes

Every order displacement mode needs a corresponding strain mode, since the displacement mode is differentiable once to yield the strain mode. In addition, the curvature and strain modes are in the same energy balance mode in the center plane and show orthogonal superposition features. The theory of elasticity states that there is a corresponding curvature mode for each order of the displacement modes, and that the curvature modes during beam deformation may be produced using the quadratic derivation of the displacement modes [48].
According to the mechanics of materials, the bending vibration curve function of a straight beam has the following characteristics at any cross-section x:
q x = 1 ρ x = M x E I x
where the curvature is 1 ρ x , E I x represents the beam’s flexural stiffness, and the beam’s bending moment is expressed as M x .
The deformation equation for straight beam bending can be loosely expressed as follows:
1 ρ x = d 2 u d x 2
where u is the transverse vibration displacement at the section x of the beam.
Express Equations (4) and (5) in difference terms as
u n + 1 2 u n + u n 1 Δ 2 = M x E I x
where u n 1 , u n , and u n + 1 are three successive, equally spaced measurement sites on the beam, representing the lateral displacements, respectively, and Δ is the distance between the calculation nodes.
The curvature modes of the structure can be computed from Equation (6) if the displacement modes of its uniformly spaced nodes are known. Applying the formula for the central difference:
φ r m = φ r m 1 2 φ r m + φ r m + 1 Δ 2
where φ r m is the vibration pattern for the rth order displacement mode, m is the calculation point, and Δ is the distance between the calculation nodes.
The positive strain in the x-direction at a measurement station is given, if h(x) is the length of the beam that connects that measurement site to the neutral layer, as
ε = h x ρ x = h x q x = h x u n + 1 2 u n + u n 1 Δ 2 = h x r = 1 N φ r x q r e j w t
where e j w t is the vibration mode of the structure.
This is observed from the agreement between the strain modes obtained from Equation (8) and the curvature modes that the curvature modes and the strain modes differ by just one constant term only. Therefore, by determining the curvature modes of the structure, the corresponding strain modes are likewise determined.

2.3. Modal Differences by Strain

If a wood beam’s strain modulus is ψ r 0 ε before damage and is ψ r d ε after damage, the strain modulus differential damage index is stated as follows:
Δ ψ r m ε = ψ r d ε ψ r 0 ε

2.4. The Difference in Strain Mode Curvature

The rate at which the strain mode slope varies with location is represented mathematically by the strain mode curvature. The expression for the strain mode curvature is as follows, and this rate can be calculated with the strain mode vibration using the center difference method:
ψ r m ε = ψ r m 1 ε 2 ψ r m ε + ψ r m + 1 ε Δ 2
where m is the calculation point, Δ is the distance between the calculation nodes, and ψ r m ε is the vibration pattern of the rth order strain mode.
Using Equation (10), the curvature difference between the strain mode forms can be calculated using the following formula:
Δ ψ r m ε = ψ r d ε ψ r 0 ε
where ψ r 0 ε represents the wood beam’s strain modal curvature before damage, and ψ r d ε represents the curvature of the beam following damage.

3. Simulations with Numbers

3.1. Simply Supported Wooden Beam Modeling

As an example, think about the wooden beam that is simply supported. It measures 2400 mm in length, 120 mm in width, and 180 mm in height. Along its length, it can be divided into 30 units, as Figure 1 illustrates. Figure 2 illustrates how this study uses the C3D8R unit in the ABAQUS finite element program to create the three-dimensional solid model of simply supported wooden beams. The wood used in the model is poplar, and the material properties were determined by consulting the papers of other researchers in the group [16], as indicated in Table 1. To obtain the modal parameters of the damaged wooden beams accurately, the mesh is divided into three sections: 80 mm cells along the beam length (X) direction with a total of 30 cells; 20 mm cells along the beam width (Z) direction with a total of 6 cells; and 9 mm cells along the beam height (Y) direction with a total of 20 cells. Additionally, mesh sensitivity analysis is carried out on the model to bring the simulation results closer to the actual values.

3.2. Damage Condition

By decreasing the cross-section dimensions of the cells at the bottom of the beams throughout their length, finite element software is used to simulate the damage at different locations and depths of the timber beams, assuming that a drop in cross-section height produces structural damage. The ratio of the wooden beam height h e to the rectangular slot depth h , or S = h e / h , is the damage degree. The particular damage case is shown in Table 2. The wooden beam’s finite element model under various damage scenarios is displayed in Figure 3.

3.3. Analysis of Modes

3.3.1. Modal Frequency

The Lanczos method eigenvalue solver was used to perform modal analysis on wooden beam models under different operating conditions, and the first three natural frequencies of the wooden beam under different operating conditions were obtained, as shown in Table 3.
However, when this paper simulates the damage of wooden beams by changing the local cross-sectional area, the natural frequencies of the structure sometimes increase. This is because, as Table 3 illustrates, the overall change in frequency before and after the damage of wooden beams is small, indicating that the frequency change is not sensitive to the damage of wooden beams. Therefore, there are numerous limitations when it comes to utilizing frequency variation to determine whether the structure has been harmed.

3.3.2. Displacement Mode Shapes

This part focuses on the first three modes of wooden beams for a thorough analysis to better the identification of the damage, since the damage impacts all orders of modes. To extract the displacement vibration data values of the nodes at the axial position in the wood beam model under different operating conditions, a total of 30 units and 31 nodes were used with each unit separated 80 mm apart. Based on the coordinate link between the nodes and the wooden beam model, the first three modes of the single positional damage and the double position damage displacement mode forms are transformed into two-dimensional diagrams, as illustrated, correspondingly, in Figure 4, Figure 5 and Figure 6.
As illustrated in Figure 4, Figure 5 and Figure 6, there is relatively little variation between the displacement vibration curves of the wooden beam’s first three orders under either one or two damage circumstances. It is challenging to determine the damage to the wooden beam using displacement vibration curves because there is no abrupt shift at the damage location.

3.4. Identification of Damage Using Strain Modal Parameters

3.4.1. Modal Damage Identification Metrics Based on Strain

Via Equation (8), the link of mutual conversion between strain, curvature, and displacement modes can be found. The numerical simulation data are then processed using Origin software to create the associated strain mode vibration patterns, which are shown in Figure 7, Figure 8 and Figure 9. The abrupt shift in the strain mode vibration patterns is then used to identify the damage localization for the wooden beams.
The first and third modes of the vibration of the wooden beams under cases 7–12 have small mutations at the damage location; the pre-damage position is on the node of the second-order vibration mode; therefore, there is not an apparent mutation. As shown in Figure 7 and Figure 8, for single damage, the strain modes for the first three modes of the wooden beams under cases 1–6 all have a slight mutation at the damage location, unit 5, and while it can be recognized that there is a damage in the structure, the recognition effect is not satisfactory, and the mutation is easily ignored.
The strain modes of the first three beam modes under working cases 13–18, as observed in Figure 9, have mutations at the damage location of units 5 and 26. However, the tiny and easily ignorable mutations created at the damaged unit suggest that the ability of the strain mode damage index to locate the beams is limited. In conclusion, the damage location experiences brief, easily missed alterations in the strain modal index.

3.4.2. Strain Modal Difference Damage Recognition Indicator-Based

To demonstrate the viability and validity of the strain modal difference for damage identification, Equation (9) was used to determine the first three modes of the wood beams’ modal differences under each operating condition in Table 1, as shown in Figure 10, Figure 11 and Figure 12.
As can be observed in Figure 10 and Figure 11, the strain mode difference for the first three modes appears to have mutated at the damage location of either unit 5 or unit 15 in the case of single damage and at the damage location of units 5 and 26 in the case of double damage. Under changing operating conditions, the mutation values of the differential strain modal indices rise in proportion to the degree of damage. Minor alterations also take place at the nearby nodes of the injured units concurrently. Since the article’s wooden beam model is based on solid elements, alterations to the local cross-sectional area may have an impact on the damage surrounding units. As a result, wood beam damage can be identified by integrating the first three modes of strain modal difference.
In conclusion, the strain modal difference index performs better in terms of recognition ability and accuracy than the strain modal damage identification effect, and it can correctly identify single and double damage locations in wood beams.

3.4.3. Strain Modal Curvature Difference Damage Recognition Indicator-Based

To demonstrate the viability and validity of the strain modal curvature difference for damage identification, Equations (10) and (11) were used to determine the first three modes of strain modal curvature difference of the wood beams under each operating condition in Table 1, as shown in Figure 13, Figure 14 and Figure 15.
For a single damage, Figure 13 and Figure 14 show that the strain mode curvature difference for the first three modes of the beams has mutated at the damage location of either unit 5 or unit 15; for a double damage, Figure 15 shows that the first three modes of the beams’ strain mode curvature difference have mutated at the damage locations of both units 5 and 26. Furthermore, the strain modal difference index mutation values grow in tandem with the degree of damage. This suggests that single- and double-damage areas in timber beams can be efficiently located and identified using the strain modal curvature difference index. Because the first three orders of the strain modal curvature difference of the uninjured position are almost entirely superimposed and have a value of zero, the strain modal curvature difference index is more accurate than the strain modal difference in identifying single- and double-damage positions of the beam.

4. Experimental Validation

4.1. Experimental Program Design

Eighteen wooden beams of the same material were selected for the damage identification test, and their sizes matched those of the simulation stage in order to confirm the viability of the approach. The wooden beams were evenly divided into 20 pieces, each measuring 120 mm inside the clear span, resulting in 20 units and 21 nodes. The dimensions of the wood beam cross-section were altered in this test to mimic damage. Specifically, along the length of the beam, hand cuts were made to longitudinal horizontal rectangular slots at different depths and locations. Single damage and two damages are the two categories into which the damage situations are divided. Table 4 and Figure 16 provide specific examples of the damage circumstances. The ratio of the wooden beam height h e to the rectangular slot depth h , or S = h e / h , is the damage degree. Using Unit 10’s wooden beam damage as an example, the detailed illustration of the wooden beam damage is found in Figure 17.
Nineteen acceleration sensors are arranged along the upper surface of the central axis of the beam, as shown in Figure 18a. As observed in Figure 18b, this test makes use of a single point of excitation, several places of beam pickup vibration for signal acquisition, and a force hammer to hit the surface of the 7 # acceleration sensor measuring point on the wooden beam three times. The Hui series of multifunctional data acquisition analyzer (model INV306N2) and DASP (V11) signal analysis software is used to gather and analyze the data; Figure 18c shows the results of the field test. Table 5 displays the primary equipment details used in the experiment. The China Orient Institute of Noise & Vibration invented the force hammer, sensor, and acquisition equipment.

4.2. Analysis of Test Results

Each wooden beam had two tests with the identical test parameters in order to lessen the impact of random factors on the testing process. The average value of these measurements served as the specimen’s self-oscillation frequency. Beijing Oriental Institute of Vibration and Noise Technology’s modal analysis software was used to process and analyze the data in order to extract the first three orders of frequency and displacement vibration patterns of the wooden beams. Table 6 shows the comparison of these results with the inherent frequencies of the timber beams simulated numerically.
Table 6 presents the error of the first-order natural frequencies between the finite element model and the first-order natural frequencies of the test timber beams. The errors of the second-order and third-order natural frequencies are 2.49% and 7.76, respectively, and all fall within the acceptable range. The reasons are broken down as follows: first, it is challenging to simulate the test simply supported beams’ boundary conditions to an ideal state; second, errors occur during the testing and signal processing phases of the process; and third, because the wood is relatively discrete, the timber properties parameters measured during the test are regarded as the average value of the same batch of wooden beams. The finite element model and the test results may be confirmed because of the above study, which increases the wooden beam finite element model’s reasonableness and accuracy.

4.3. Identification of Damage Using Strain Modal Parameters

4.3.1. Modal Damage Identification Metrics Based on Strain

To demonstrate the viability and validity of the strain modal difference for damage identification, Equation (8) was used to determine the first three modes of strain modal of the wood beams under each operating condition in Table 4, as shown in Figure 19, Figure 20 and Figure 21.
Comparing the strain modes of wood beams under different damage situations to those of intact wood beams, Figure 19, Figure 20 and Figure 21 show that there have been varied degrees of abrupt changes; nevertheless, the size of these changes is tiny, and the abrupt changes are readily overlooked. This implies that the identification effect is not up to par and that the strain modal indexes are not sensitive enough to wood beam deterioration.

4.3.2. Strain Modal Difference Damage Recognition Indicator-Based

To demonstrate the viability and validity of the strain modal difference for damage identification, Equation (9) was used to determine the first three modes of strain modal difference of the wood beams under each operating condition in Table 4, as shown in Figure 22, Figure 23 and Figure 24.
The strain mode difference results for the first three modes have significant abrupt changes at the damage location, regardless of whether there is single or double damage, and the severity of the abrupt changes increases as the damage degree increases, as shown in Figure 22, Figure 23 and Figure 24. The damage to wood beams can be calculated by combining the first three orders of strain modal difference, since the damaged unit exhibits a minor mutation at the neighboring nodes. When locating the damage to the timber beam, the strain modal difference index is more accurate than the strain modal index.

4.3.3. Strain Modal Curvature Difference Damage Recognition Indicator-Based

To verify the viability and validity of the strain modal curvature difference for damage identification, the first three modes of the wood beams’ modal curvature difference under each operating condition in Table 4 were calculated using Equations (10) and (11), as shown in Figure 25, Figure 26 and Figure 27.
The strain mode curvature difference for the first three modes, as shown in Figure 25, Figure 26 and Figure 27, shows pronounced abrupt changes at both single and double damage locations, and the value increases as the damage degree increases. This suggests that the strain mode curvature difference is extremely sensitive to damage and can locate the wooden beam’s damage location with high accuracy.
The strain mode curvature difference index is more stable and has fewer interference terms than the strain mode difference index. It also has a higher accuracy of damage identification because the first three modes of the strain mode curvature difference values at the location of the undamaged unit are almost completely superimposed, and the value is zero.

5. Conclusions

The damage localization identification of the wooden beam is carried out using the damage identification indexes based on the strain modal parameters (strain modal, strain modal difference, and strain modal curvature difference), respectively, based on the data obtained from the wooden beam test and the numerical simulation data. A comparative analysis of the identification effects of the three kinds of damage identification indexes is carried out to obtain the following:
  • We find that the relative error between the measured and simulated intrinsic frequencies is less than 8% by comparing the modal analysis results of the test and numerical simulation of wooden beams under various working conditions. This confirms that the simulated wooden beam model can more accurately reflect the modal parameters of the actual wooden beams and provides a basis for the structural damage analysis that follows.
  • The results of the numerical simulation agree with the findings of the three damage identification indexes on the damage localization identification of the test data. The preliminary evidence for the viability and validity of the damage identification indexes based on the strain mode, strain mode difference, and strain mode curvature difference on the damage localization identification of the timber beams is provided by the identification effect of the three damage identification indexes, which is strain mode curvature difference > strain mode difference > strain mode.
  • By slotting on wooden beams, this specimen simulates damage that differs from the real condition, such as fractures, decay, insect infestation, etc. More study is required to adjust the findings of the current studies to reflect the real circumstances.

Author Contributions

The manuscript was written with the contributions of all authors. Y.C. and Z.M.: Conceptualization, investigation, methodology, data curation, formal analysis, writing—original draft, writing—review and editing, and visualization. F.G. and L.Z.: Investigation, methodology, data curation, and writing—review and editing. X.R., H.J. and R.H.: Formal analysis, visualization, and review. All authors have read and agreed to the published version of the manuscript.

Funding

This research was funded by the National Natural Science Foundation of China, grant number 52068063, and the Shandong Province Graduate Natural Science Foundation, grant number ZR2020ME240.The APC was funded by the Shandong Province Graduate Natural Science Foundation.

Data Availability Statement

The data presented in this study are available on request from the corresponding author. The data are not publicly available due to we want to ensure data security and compliance with regulations, while protecting the privacy and rights of study participants and associates.

Conflicts of Interest

The authors declare that they have no known competing financial interest or personal relationships that could have appeared to influence the work reported in this paper.

References

  1. Wang, J.; Du, X.; Qi, X. Strain prediction for historical timber buildings with a hybrid prophet-XGBoost model. Mech. Syst. Signal. Process. 2022, 179, 109316. [Google Scholar] [CrossRef]
  2. Li, D.; Wang, J.; Shi, K. Research on the investigation and value evaluation of historic building resources in Xi’an city. Buildings 2023, 13, 2244. [Google Scholar] [CrossRef]
  3. Yuan, X.; Chen, Y.P.; Guo, W.J. Features and prevention of common damages in ancient timber structures. Chin. J. Wood Sci. Technol. 2021, 35, 54–59. [Google Scholar] [CrossRef]
  4. Wu, C.W.; Xue, J.Y.; Zhou, S.Q.; Zhang, F.L. Seismic performance evaluation for a traditional chinese timber-frame structure. Int. J. Archit. Herit. 2020, 15, 1842–1856. [Google Scholar] [CrossRef]
  5. Qin, S.J.; Yang, N.; Cao, B.Z.; Dong, J.S. Damage analysis and protection of timber structure of tongdao hall in the imperial palace. J. Civ. Environ. Eng. 2022, 44, 119–128. [Google Scholar] [CrossRef]
  6. Wang, X.; Meng, Z.B.; Zhang, X.C. Study on the damage diagnosis of ancient wood structure in tianshui under traffic excitation. Adv. Civ. Eng. 2022, 1, 1040926. [Google Scholar] [CrossRef]
  7. Zielińska, M.; Rucka, M. Assessment of wooden beams from historical buildings using ultrasonic transmission tomography. Int. J. Archit. Herit. 2023, 17, 249–261. [Google Scholar] [CrossRef]
  8. Hacıefendioğlu, K.; Ayas, S.; Başağa, H.B.; Toğan, V.; Mostofi, F.; Can, A. Wood construction damage detection and localization using deep convolutional neural network with transfer learning. Eur. J. Wood. Prod. 2022, 80, 791–804. [Google Scholar] [CrossRef]
  9. Kai-Uwe, D.; Dirk, S. Adaptive modeling of reliability properties for control and supervision purposes. Int. J. Appl. Math. Comput. Sci. 2011, 21, 479–486. [Google Scholar] [CrossRef]
  10. Xiong, H.B.; Long, Y.W.; Chen, L.; Ding, Y.W. Review on research and application of nondestructive testing technology for timber structures. Struct. Eng. 2023, 39, 191–201. [Google Scholar] [CrossRef]
  11. Hou, R.R.; Xia, Y. Review on the new development of vibration-based damage identification for civil engineering structures: 2010–2019. J. Sound Vib. 2021, 491, 115741. [Google Scholar] [CrossRef]
  12. Li, H.N.; Gao, D.W.; Yi, Y.H. Advances in structural health monitoring systems in civil engineering. Adv. Mech. 2008, 38, 151–166. [Google Scholar] [CrossRef]
  13. Chinka, S.S.B.; Putti, S.R.; Adavi, B.K. Modal testing and evaluation of cracks on cantilever beam using mode shape curvatures and natural frequencies. Structures 2021, 32, 1386–1397. [Google Scholar] [CrossRef]
  14. Zhou, H.P.; Bo, H.E.; Chen, X.Q. Detection of structural damage through changes in frequency. J. Nat. Sci. Wuhan Univ. 2005, 10, 1069–1073. [Google Scholar] [CrossRef]
  15. Huynh, D.; He, J.; Tran, D. Damage location vector: A non-destructive structural damage detection technique. Comput. Struct. 2005, 83, 2353–2367. [Google Scholar] [CrossRef]
  16. Meng, Z.B.; Ren, X.C.; Chai, S.Q.; Wang, X.; Zhao, T.F.; Gao, F.F.; Wang, S.; Liu, Y. Wood beam damage identification based on the curvature mode and wavelet transform. Adv. Civ. Eng. 2023, 1, 2238021. [Google Scholar] [CrossRef]
  17. Pandey, A.K.; Biswas, M.; Samman, M.M. Damage detection from changes in curvature mode shapes. J. Sound Vib. 1991, 145, 321–332. [Google Scholar] [CrossRef]
  18. He, M.H.; Yang, T.; Du, Y. Nondestructive identification of composite beams damage based on the curvature mode difference. Compos. Struct. 2017, 176, 178–186. [Google Scholar] [CrossRef]
  19. Xiang, C.S.; Li, L.Y.; Zhou, Y.; Yuan, Z. Damage identification method of beam structure based on modal curvature utility information entropy. Adv. Civ. Eng. 2020, 2020, 8892686. [Google Scholar] [CrossRef]
  20. Dawari, V.B.; Vesmawala, G.R. Modal curvature and modal flexibility methods for honeycomb damage identification in reinforced concrete beams. Procedia Eng. 2013, 51, 119–124. [Google Scholar] [CrossRef]
  21. Yao, G.C.; Chang, K.C.; Lee, G.C. Damage diagnosis of steel frames using vibrational signature analysis. J. Eng. Mech. 1992, 118, 1949–1961. [Google Scholar] [CrossRef]
  22. Xu, Z.D.; Zeng, X.; Li, S. Damage detection strategy using strain-mode residual trends for long-span bridges. J. Comput. Civil. Eng. 2015, 29, 04014064. [Google Scholar] [CrossRef]
  23. Wang, T.; Celik, O.; Catbas, F.N. Damage detection of a bridge model based on operational dynamic strain measurements. Adv. Struct. Eng. 2016, 19, 1379–1389. [Google Scholar] [CrossRef]
  24. Cui, H.Y.; Xu, X.; Peng, W.Q.; Zhou, Z.H.; Hong, M. A damage detection method based on strain modes for structures under ambient excitation. Measurement 2018, 125, 438–446. [Google Scholar] [CrossRef]
  25. Li, Z.X.; Chan, T.H.T.; Zhang, R. Statistical analysis of online strain response and its application in fatigue assessment of a long-span steel bridge. Eng. Struct. 2003, 25, 1731–1741. [Google Scholar] [CrossRef]
  26. Li, Z.X.; Chan, T.H.T.; Ko, J.M. Fatigue analysis and life prediction of bridges with structural health monitoring data—Part I: Methodology and strategy. Int. J. Fatigue 2001, 23, 45–53. [Google Scholar] [CrossRef]
  27. Chan, T.H.T.; Li, Z.X.; Ko, J.M. Fatigue analysis and life prediction of bridges with structural health monitoring data—Part II: Application. Int. J. Fatigue 2001, 23, 55–64. [Google Scholar] [CrossRef]
  28. Zhang, X.D.; Liang, Q.H. A study on crack and motor-void identification of ballastless track slab using strain modal. J. Vib. Shock. 2020, 39, 179–184. [Google Scholar] [CrossRef]
  29. Li, L.J.; Han, J.; Li, D. Crack detection for the cantilever beam based on the difference of the strain mode. Sci. Tech. Eng. 2018, 18, 81–86. [Google Scholar] [CrossRef]
  30. Zhang, H.; Shi, F.Q. Research on damage identification method of continuous beams based on strain mode difference and application. J. Zhejiang Univ. Tech. 2019, 47, 280–285. [Google Scholar]
  31. Chen, J.; Yu, S.; Wei, W.; Ma, Y. Matrix-based method for solving decision domains of neighbourhood multigranulation decision-theoretic rough sets. CAAI Trans. Intell. Technol. 2022, 7, 313–327. [Google Scholar] [CrossRef]
  32. Hu, X.; Kuang, Q.; Cai, Q.; Xue, Y.; Zhou, W.; Li, Y. A coherent pattern mining algorithm based on all contiguous column bicluster. J. Artif. Intell. Technol. 2022, 2, 80–92. [Google Scholar] [CrossRef]
  33. Du, H.; Du, S.; Li, W. Probabilistic time series forecasting with deep non-linear state space models. CAAI Trans. Intell. Technol. 2023, 8, 3–13. [Google Scholar] [CrossRef]
  34. Zhang, Z.; Luca, G.D.; Archambault, B.; Mchavez, J.; Rice, A.B. Traffic dataset and dynamic routing algorithm in traffic simulation. J. Artif. Intell. Technol. 2022, 2, 111–122. [Google Scholar] [CrossRef]
  35. Zhao, H.; Ma, L. Several rough set models in quotient space. CAAI Trans. Intell. Technol. 2022, 7, 69–80. [Google Scholar] [CrossRef]
  36. Jia, Z.; Wang, W.; Zhang, J.; Li, H. Contact high-temperature strain automatic calibration and precision compensation research. J. Artif. Intell. Technol. 2022, 2, 69–76. [Google Scholar] [CrossRef]
  37. Avci, O.; Abdeljaber, O.; Kiranyaz, S.; Hussein, M.; Inman, D.J. A review of vibration-based damage detection in civil structures: From traditional methods to machine learning and deep learning applications. Mech. Syst. Signal. Process. 2021, 147, 107077. [Google Scholar] [CrossRef]
  38. Nguyen, T.Q. Damage detection in beam structures using bayesian deep learning and balancing composite motion optimization. Structures 2022, 39, 98–114. [Google Scholar] [CrossRef]
  39. Gupta, A.; Talha, M. Recent development in modeling and analysis of functionally graded materials and structures. Prog. Aerosp. Sci. 2015, 79, 1–14. [Google Scholar] [CrossRef]
  40. Kiani, K. Nonlocal-integro-surface energy-vibro analysis of twist in coaxially composite wire-like nanostructures with internal and interfacial defects via a meshless technique. Eng. Anal. Bound. Elem. 2022, 135, 217–232. [Google Scholar] [CrossRef]
  41. Kiani, K.; Żur, K.K. Vibrations of double-nanorod-systems with defects using nonlocal-integral-surface energy-based formulations. Compos. Struct. 2020, 256, 113028. [Google Scholar] [CrossRef]
  42. Yuan, Y.; Xu, K.; Kiani, K. Torsional vibration of nonprismatically nonhomogeneous nanowires with multiple defects: Surface energy-nonlocal-integro-based formulations. Appl. Math. Model. 2020, 82, 17–44. [Google Scholar] [CrossRef]
  43. Kiani, K.; Żur, K.K. Dynamic behavior of magnetically affected rod-like nanostructures with multiple defects via nonlocal-integral/differential-based models. Nanomaterials 2020, 10, 2306. [Google Scholar] [CrossRef]
  44. Simsek, M.; Kocatürk, T. Free and forced vibration of a functionally graded beam subjected to a concentrated moving harmonic load. Compos. Struct. 2009, 90, 465–473. [Google Scholar] [CrossRef]
  45. Han, H.F.; Zhou, S.P.; Hao, Z.F.; Zhang, L.Z. Study on identification of pipe damage based on strain modal difference. J. Vib. Measurem. Diagn. 2013, 33 (Suppl. S1), 210–213 + 232. [Google Scholar] [CrossRef]
  46. Cui, H.Y.; Peng, W.Q.; Xu, X.; Hong, M. A damage identification method for a thin plate structure based on PVDF sensors and strain mode. Proc. Inst. Mech. Eng. J. Mech. Eng. Sci. 2019, 233, 4881–4895. [Google Scholar] [CrossRef]
  47. Yam, L.Y.; Leung, T.P.; Li, D.B.; Xue, K.Z. Theoretical and experimental study of modal strain analysis. J. Sound Vib. 1996, 191, 251–260. [Google Scholar] [CrossRef]
  48. Wu, J.Q.; Li, H.Y.; Ye, F.; Ma, K. Damage identification of bridge structure based on frequency domain decomposition and strain mode. J. Vibroeng. 2019, 21, 2096–2105. [Google Scholar] [CrossRef]
Figure 1. Schematic representation of a simply supported beam (unit: mm).
Buildings 13 03035 g001
Figure 2. Wood beam finite element model.
Buildings 13 03035 g002
Figure 3. Finite element model for damage at different positions of wooden beams: (a) Damage to the support area; (b) Mid-span area damage; (c) Two damage locations.
Buildings 13 03035 g003
Figure 4. The displacement mode shapes for the first three modes of cases 1–6: (a) First-order displacement mode shapes; (b) Second-order displacement mode shapes; (c) Third-order displacement mode shapes.
Buildings 13 03035 g004
Figure 5. The displacement mode shapes for the first three modes of cases 7–12: (a) First-order displacement mode shapes; (b) Second-order displacement mode shapes; (c) Third-order displacement mode shapes.
Buildings 13 03035 g005
Figure 6. The displacement mode shapes for the first three modes of cases 13–18: (a) First-order displacement mode shapes; (b) Second-order displacement mode shapes; (c) Third-order displacement mode shapes.
Buildings 13 03035 g006
Figure 7. The strain mode for the first three modes of cases 1–6: (a) First-order strain mode; (b) Second-order strain mode; (c) Third-order strain mode.
Buildings 13 03035 g007
Figure 8. The strain mode for the first three modes of cases 7–12: (a) First-order strain mode; (b) Second-order strain mode; (c) Third-order strain mode.
Buildings 13 03035 g008
Figure 9. The strain mode for the first three modes of cases 13–18: (a) First-order strain mode; (b) Second-order strain mode; (c) Third-order strain mode.
Buildings 13 03035 g009
Figure 10. The strain mode difference for the first three modes of cases 1–6: (a) First-order strain mode difference; (b) Second-order strain mode difference; (c) Third-order strain mode difference.
Buildings 13 03035 g010
Figure 11. The strain mode difference for the first three modes of cases 7–12: (a) First-order strain mode difference; (b) Second-order strain mode difference; (c) Third-order strain mode difference.
Buildings 13 03035 g011
Figure 12. The strain mode difference for the first three modes of cases 13–18: (a) First-order strain mode difference; (b) Second-order strain mode difference; (c) Third-order strain mode difference.
Buildings 13 03035 g012
Figure 13. The strain mode curvature difference for the first three modes of cases 1–6: (a) First-order strain mode curvature difference; (b) Second-order strain mode curvature difference; (c) Third-order strain mode curvature difference.
Buildings 13 03035 g013
Figure 14. The strain mode curvature difference for the first three modes of cases 7–12: (a) First-order strain mode curvature difference; (b) Second-order strain mode curvature difference; (c) Third-order strain mode curvature difference.
Buildings 13 03035 g014
Figure 15. The strain mode curvature difference for the first three modes of cases 13–18: (a) First-order strain mode curvature difference; (b) Second-order strain mode curvature difference; (c) Third-order strain mode curvature difference.
Buildings 13 03035 g015
Figure 16. Diagram of different damage cases of wooden beams: (a) Cases 1–6; (b) Cases 7–12; (c) Cases 13–18.
Buildings 13 03035 g016aBuildings 13 03035 g016b
Figure 17. Detailed drawing of damage to Unit 10 of wooden beam (unit: mm): (a) Elevation view; (b) Section view.
Buildings 13 03035 g017aBuildings 13 03035 g017b
Figure 18. Wooden beam damage identification test site: (a) Acceleration sensor arrangement; (b) Hammering process; (c) Signal acquisition process.
Buildings 13 03035 g018
Figure 19. The strain mode for the first three modes of cases 1–6: (a) First-order strain mode; (b) Second-order strain mode; (c) Third-order strain mode.
Buildings 13 03035 g019
Figure 20. The strain mode for the first three modes of cases 7–12: (a) First-order strain mode; (b) Second-order strain mode; (c) Third-order strain mode.
Buildings 13 03035 g020
Figure 21. The strain mode for the first three modes of cases 13–18: (a) First-order strain mode; (b) Second-order strain mode; (c) Third-order strain mode.
Buildings 13 03035 g021
Figure 22. The strain mode difference for the first three modes of cases 1–6: (a) First-order strain mode difference; (b) Second-order strain mode difference; (c) Third-order strain mode difference.
Buildings 13 03035 g022
Figure 23. The strain mode difference for the first three modes of cases 7–12: (a) First-order strain mode difference; (b) Second-order strain mode difference; (c) Third-order strain mode difference.
Buildings 13 03035 g023
Figure 24. The strain mode difference for the first three modes of cases 13–18: (a) First-order strain mode difference; (b) Second-order strain mode difference; (c) Third-order strain mode difference.
Buildings 13 03035 g024
Figure 25. The strain mode curvature difference for the first three modes of cases 1–6: (a) First-order strain mode curvature difference; (b) Second-order strain mode curvature difference; (c) Third-order strain mode curvature difference.
Buildings 13 03035 g025
Figure 26. The strain mode curvature difference for the first three modes of cases 7–12: (a) First-order strain mode curvature difference; (b) Second-order strain mode curvature difference; (c) Third-order strain mode curvature difference.
Buildings 13 03035 g026
Figure 27. The strain mode curvature difference for the first three modes of cases 13–18: (a) First-order strain mode curvature difference; (b) Second-order strain mode curvature difference; (c) Third-order strain mode curvature difference.
Buildings 13 03035 g027
Table 1. Material parameters of wood beams.
Elastic Modulus [MPa]Poisson’s RatioModulus of Shear [MPa]Densities [kg/m3]
ELERETμLRμLTμRTGLRGLTGRT508
9752.172058.57452.900.4900.4100.353585.13731.41175.54
Table 2. Simply supported wooden beam damage conditions simulation.
Status NumberInjury TypesDamage UnitDamage Depth [mm]Damage Degree
Case 0----
Case 1single damage53.62%
Case 2595%
Case 3514.48%
Case 451810%
Case 552715%
Case 653620%
Case 7153.62%
Case 81595%
Case 91514.48%
Case 10151810%
Case 11152715%
Case 12153620%
Case 13two damages5, 263.62%
Case 145, 2695%
Case 155, 2614.48%
Case 165, 261810%
Case 175, 262715%
Case 185, 263620%
Table 3. Simulated simply supported wooden beams for each working condition natural frequencies.
Working Condition1st Order2nd Order3rd Order
Frequency [Hz]The Absolute Difference in ValueFrequency [Hz]The Absolute Difference in ValueFrequency [Hz]The Absolute Difference in Value
057.79-206.34-401.82-
157.790.00206.310.03401.710.11
257.780.01206.270.07401.650.17
357.780.01206.220.12401.550.27
457.770.02206.200.14401.510.31
557.770.02206.150.19401.430.39
657.760.03206.120.22401.600.22
757.770.02206.340.00401.730.09
857.750.04206.340.00401.650.17
957.720.07206.340.00401.550.27
1057.710.08206.340.00401.510.31
1157.680.11206.330.01401.440.38
1257.660.13206.320.02401.410.41
1357.780.01206.280.06401.640.18
1457.770.02206.180.16401.340.48
1557.760.03206.060.28400.900.92
1657.750.04205.980.36400.601.22
1757.740.05205.960.38401.050.77
1857.740.05205.900.44400.990.83
Table 4. Test wood beam damage case setting.
Status NumberInjury TypesDamage UnitDamage Depth [mm]Damage Degree
Case 0----
Case 1single damage43.62%
Case 2495%
Case 3414.48%
Case 441810%
Case 542715%
Case 643620%
Case 7103.62%
Case 81095%
Case 91014.48%
Case 10101810%
Case 11102715%
Case 12103620%
Case 13two damages4, 173.62%
Case 144, 1795%
Case 154, 1714.48%
Case 164, 171810%
Case 174, 172715%
Case 184, 173620%
Table 5. Major equipment information.
Device NameModel of the DeviceManufacturerCityCountry of Origin
Acceleration sensorsINV9822China Orient Institute of Noise & VibrationBeijingChina
IEPE HammerINV9312
Acquisition instrumentINV3065N2
Table 6. The first three natural frequencies of experimental and simulated wooden beams.
Mode NumberCalculated with the Finite Element Method (Hz)Obtained from Experimentally Observed Data (Hz)Error (%)
157.7959.893.51
2206.34201.322.49
3401.82372.97.76
Disclaimer/Publisher’s Note: The statements, opinions and data contained in all publications are solely those of the individual author(s) and contributor(s) and not of MDPI and/or the editor(s). MDPI and/or the editor(s) disclaim responsibility for any injury to people or property resulting from any ideas, methods, instructions or products referred to in the content.

