Abstract
Under the background of China’s progress towards the goals of “carbon peak” and “carbon neutrality”, prefabricated buildings have developed rapidly due to their advantages of energy conservation and environmental protection, low construction cost, and high efficiency. While much attention has been paid to prefabricated buildings, less has been studied about the risk factors that cause engineering changes. In this paper, the factors that induce the risk of design change were identified from six aspects: personnel management, resource management, organization management, information and communication, collaboration mechanism, and technical level. The improved DEMATEL-ISM model was established in a fuzzy environment, the relationship between the influencing factors was quantitatively analyzed, the hierarchy between the factors was intuitively reflected, and the driving force and dependence of each factor were clearly displayed; it was concluded that poor organizational ability, errors and omissions in design, time lag between design and construction, immature component splitting and deepening design technology, and low standardization of production components in component factories are the key factors that induce the risk of design change. Finally, management implications for the relationship between various factors were proposed. This article provides references and help for the construction industry to effectively manage the risks caused by design changes.
1. Introduction
The construction industry consumes a lot of resources in the process of development, which has impacted the environment, attracting widespread attention from countries around the world [1]. In order to promote global sustainable development, the Chinese government has proposed the “dual carbon” goal. According to the “Research Report on China’s Building Energy Consumption and Carbon Emissions (2022)” released by the Energy Conservation Committee of China Building Energy Conservation Association, the construction industry in China aimed for its total carbon emissions in 2020 to be 5.08 billion tons, accounting for 50.9% of the national carbon emissions [2]. Therefore, the development of energy conservation and emission reduction in the construction industry is crucial to China’s impact on achieving sustainable “dual carbon” goals. In recent years, the prefabricated construction industry has paid more and more attention to “carbon peak and carbon neutrality” in the construction field. With the passage of time, the construction mode of prefabricated buildings has gradually changed from extensive production and inefficient management to green, prefabricated, informatized, and intelligent [3], and the state has paid great attention to prefabricated buildings and vigorously promoted prefabricated buildings in line with the trend of the times.
Prefabricated construction has the characteristics of a large number of participants and a high degree of vertical integration, covering all stages of construction in prefabricated parts design, production, construction, and assembly [4,5]. At present, the supply chain of prefabricated buildings in China is not connected, which separates the design from manufacturing, transportation, construction, and operation and maintenance management [6], and each participant only pays attention to the work within the scope of their own contract [7], and the coordination mechanism between various stakeholders is not perfect, resulting in low collaboration efficiency between enterprises [8], which leads to the risk of engineering change. Design change risk is one of the most common engineering change risks, which is a risk event in the process of project implementation, when stakeholders are dissatisfied with the design scheme, and finally the design unit issues design change or design supplementary instructions [9]. When a project has a design change, part of the project has already been completed, and the occurrence of design changes will disrupt the normal work steps, resulting in delays in the project schedule, increasing the project cost [10], increasing the complexity of the project, and the design change is also the main reason for construction project costs exceeding the budget [10]. The data heterogeneity of each participant in the prefabricated building supply chain is significant, the information integration and interaction are difficult, and the information communication is not smooth [11]. In addition, various stakeholders have different target preferences when making decisions [5], and the uncertainty of the system is large, which increases the difficulty of design change risk control.
Therefore, this paper aimed to discuss the key obstacles that induce the risk of prefabricated building design change by constructing an analysis framework that identifies the risk factors of prefabricated building design change, aiming to mitigate the impact of prefabricated building design change risk and further promote the development of the prefabricated building industry.
2. Literature Review
2.1. Design Change Risk
In terms of risk management and control of construction projects, most existing studies analyze the causes of engineering changes from the perspective of engineering construction stakeholders and evaluate the risks arising from engineering changes [12,13,14,15]. Changes in engineering and construction projects are caused by a variety of factors, the most influential of which is design change [16,17]. However, there is currently little research on design changes. To reduce engineering changes in a construction project, it is critical to identify and analyze the factors that lead to design changes. Fei et al. [18] used a matrix-based approach to analyze change propagation between components and help identify design conflicts caused by design changes [18]; Khanh [19] evaluated residential design changes in Vietnam from four perspectives, environment, client, consultant, and contractor, and compared them with other construction project types to understand the general factors of design changes in the construction industry [19]; Bassa et al. [20] investigated the causes and impacts of design changes in building construction projects from the perspective of six stakeholders, including owners, engineers, and contractors [20]; Hetal and Tushar [21] analyzed the factors affecting the design changes and time delays of bridge construction in India, showing that factors such as the unavailability of building materials are the main reasons for the design changes in construction projects [21]. Yap et al. [22] used the partial least squares structural equation model to verify the impact of potential risk factors affecting design changes in the construction industry, and the results showed that “project team capability”, “quality and workmanship”, and “site constraints and safety considerations” are the three key factors affecting design change [22]; Du et al. [23] elaborated on the factors affecting design change in prefabricated building projects, the events that generated design changes, and the risk consequences of design changes through questionnaires and interviews [23].
2.2. Interpretive Structural Modeling—Decision-Making Trial and Evaluation Laboratory—Matrix Impacts Cross-Reference Multiplication Applied to a Classification Interpretive Structure
These results provide a basic framework for analyzing the occurrence of design changes in architectural projects. However, in the process of research, the factors that induce design changes are regarded as independent, and there is no grasp of the correlation, hierarchy, and importance of the inducing factors. The Decision-Making Trial and Evaluation Laboratory (DEMATEL), proposed in 1971 by Gabus and Fontela, researchers at the Battelle Laboratory in the United States, is a methodology that uses graph theory and matrix tools to identify relationships between factors in complex systems and determine the importance of each factor [24]. Since the occurrence of design change risk is a combination of factors, it is important to determine the key factors that induce design change risk and explore the correlation between factors to mitigate the risk of prefabricated building design change. On the one hand, the DEMATEL method is in line with the research purpose of this paper, on the other hand, compared with other factor analysis methods, DEMATEL analyzes the causal relationship of influencing factors from both direct and indirect influences, which makes the identification of key influencing factors more reliable [25]. With the passage of time, the application of DEMATEL is becoming more and more extensive, being used in fields such as smartphones, mining, the aluminum industry, and other fields [26,27,28]. Since the DEMATEL model can identify key factors, and the Interpretive Structural Modeling (ISM) model can clearly identify the hierarchical structure of influencing factors, some scholars have proposed to combine the DEMATEL and ISM methods to analyze influencing factors [29,30,31]. Since the DEMATEL and ISM methods cannot identify the drivers and dependencies of influencing factors, the Matrix Impacts Cross-reference Multiplication Applied to a Classification (MICMAC) can be used to clearly dissect the attribute characteristics of each factor [32], and the risk factors have been analyzed by combining the DEMATEL, ISM, and MICMAC methods [33,34,35]. Table 1 summarizes the research angles of design changes and the improvement perspectives of DEMATEL.

Table 1.
Summarizes the research perspective of design changes and the improvement perspective of DEMATEL.
2.3. Summary of the Literature
Through a further literature review, it is found that most scholars analyze the risk causes of engineering change from the perspective of engineering construction risk control, but the focus of engineering change is design change, and few existing studies have approached this from the perspective of design change in prefabricated buildings. Design change analysis is a complex process involving different objects and hierarchies. Analyzing influencing factors with the help of decision theory can provide managers with scientific quantitative results to show them whether influencing factors are critical. The Decision Testing and Evaluation Laboratory (DEMATEL) method has received extensive attention from many scholars as a common method for factor analysis, but there are some weaknesses and there is still room for improvement: (1) the data input to DEMATEL is scored by multiple experts, and the ambiguity and uncertainty of the influencing factors by the experts in the scoring process cannot be well reflected; (2) the thresholds of direct impact indicators are mainly determined by expert experience or from the relevant literature, which increases the subjectivity of decision-making; (3) the hierarchical relationship between the influencing factors cannot be directly seen, and the important factors cannot be reflected; (4) the driving forces and dependences of influencing factors are difficult to show intuitively. Therefore, on the basis of a literature review, industry survey, and expert consultation, this paper identifies 23 factors that induce design change risk in prefabricated buildings, and establishes a framework for prefabricated buildings to induce design change risks. The innovative introduction of IT2TrFN improves the DEMATEL, ISM, and MICMAC methods, avoids uncertainty and ambiguity in the scoring process, and reduces the distortion of evaluation information. The sum of the mean and standard deviation is used to determine the influence threshold of the correlation matrix, which improves the objectivity of decision-making. Through the DEMATEL-ISM model, the key factors that induce the risk of design change are identified, the hierarchical structure between the influencing factors is revealed, and the driving forces and dependences of the influencing factors are intuitively displayed. According to the research results, corresponding policy suggestions are put forward to coordinate the relationship between influencing factors and control the risk of design change. It provides a theoretical reference for strengthening the management of prefabricated building design and promoting the sustainable development of prefabricated building projects.
3. Identification of Factors That Induce Design Change Risks in Prefabricated Buildings
Based on a literature [13,14,15,16,17,18,19,20,21,22,23,24,25,26,27,28,29,30,31] search, this paper preliminarily identifies the influencing factors of prefabricated buildings that induce design change risks. Secondly, this paper uses a questionnaire survey to collect empirical data. Initially, the questions asked from the literature were reviewed by two experts, one from academia and the other from the construction industry, and the questionnaire was revised based on their feedback. The questionnaire was implemented through an online survey system. The approach targeted experts through snowball sampling, which means that some respondents help by sending a link to the questionnaire they receive to other potential respondents, such as their colleagues or friends. A total of 10 responses were collected. Three of the responses may have been invalid, one respondent had much less experience and one respondent took much less time compared to their peers in the original sample group. In accordance with the principle of caution, replies that may have been invalid were not considered. All experts had more than eight years of work or research experience related to prefabricated buildings. Among the 10 respondents, 5 experts had sufficient time and energy to fill in the questionnaire, including 1 senior engineer with 13 years of work experience from a real estate company; 1 architectural designer with 17 years of work experience from an architectural design company; 1 senior engineer with 10 years of work experience from a construction company; 1 cost engineer with 12 years of work experience; and 1 senior engineer with 7 years of work experience in scientific research institutions. The factors that induce the risk of design change are summarized into six indicators: personnel management (A), resource management (B), organizational management (C), information and communication (D), collaboration mechanism (E), and technical level (F), as shown in Table 2.
Table 2.
Factors that induce design change risk in prefabricated buildings.
3.1. Personnel Management
Personnel management includes three aspects: changes in the owner’s needs (A1), contractors’ lack of attention to the plan (A2), and labor skills are inadequate (A3).
For real estate projects with prefabricated buildings, design changes may be triggered by sales or potential customers who request improvements in the planning design and detailing of engineering products [16]. The prefabricated building adopts the EPC mode in the project, and the contractor plays an important role in the promotion of the project. If some contractors do not pay attention to the plan and delay the project, it will inevitably delay the overall plan’s target and eventually lead to changes in the plan [41]. In the construction process, prefabricated buildings rely on mechanized production, the quality requirements for workers are gradually increased [16], some traditional construction workers find it difficult to meet the requirements, the number of professional construction teams and industrial workers is insufficient, and it is difficult to continuously adjust the amount of labor according to the project progress demand and efficiently promote the progress of the project.
3.2. Resource Management
Resource management includes frequent equipment failures (B1), insufficient modern equipment (B2), and increased project costs (B3).
The prefabricated building manufacturing system is an equipment-intensive industry with a high degree of informatization, complex production system structure, and harsh equipment operation and maintenance conditions. In this process, the equipment is outdated, the process technology is lacking, and equipment failure occurs during the operation of the manufacturing system, which lead to brittle collapse or the production line being forced to shut down, thereby affecting the established scheme [16]. At the same time, when outdated products and processes restricted by policies and regulations are used in the design documents of construction projects, the equipment is insufficient and cannot achieve the set goals, and must be adjusted by means of corresponding design changes [16]. In order to ensure the smooth progress of the project, reduce equipment failures, and increase investment in modern equipment, it is necessary to increase the cost of the project and prevent the capital chain from breaking and forcing the design to change [42].
3.3. Organization Management
Organizational management includes poor organizational competence (C1), lack of construction manuals and procedures (C2), and conflicting management concepts between organizations (C3).
The prefabricated building industry needs professional talent to communicate with building owners and the construction team during operation; if the talent lacks good organizational skills, the cohesion of the construction team is affected and will thereby affect the operation of the entire project and impact the overall design plan. At the same time, in the prefabricated building, if the construction party lacks a construction manual and proper procedures, the construction unit cannot carry out the construction according to the design, and the original construction plan will be changed, resulting in design changes [16]. There are many participants and stakeholders in prefabricated buildings, and there will inevitably be conflicts of ideas between various participating organizations; all parties want to maximize their interests, and the design plan will inevitably change [20].
3.4. Information and Experience
Information and experience include a low level of information sharing among project participants (D1), lack of design experience (D2), inexperience of component factories or contractors (D3), and lack of communication between project parties (D4).
There are many participants in prefabricated building construction, the supply chain is lengthy, there are many uncertainties in the life cycle of a project, and the lack of communication between the project participants [1], or the lack or deviation of information transmission in the communication process [39], will affect the realization of the project goals and change the established design scheme. At the same time, due to the high requirements of the prefabricated building industry for the professional quality of designers, some personnel do not have a sufficient understanding of prefabricated buildings and cannot comprehensively consider the needs of component factories and construction sites [1], and some unreasonable designs result in material waste and construction delays. If the component factory or contractor is inexperienced, the results do not meet the requirements of the specification, thereby delaying the construction period and resulting in changes to the established design [16].
3.5. Collaboration Mechanisms
Collaboration mechanisms include a lack of coordination between professional consultants (E1), the non-involvement of construction and production units in the design (E2), the non-involvement of the design team in component production and construction (E3), the failure of contractors to adequately manage and coordinate the project site (E4), the failure of contractors to mobilize quickly enough (E5), and delays due to unresolved engineering issues (E6).
During the implementation of the project, insufficient coordination between the various professional consultants results in discrepancies in the design project, requiring the designer to issue instructions to solve the design problem, and such design changes may lead to design and construction delays [14]. Prefabricated buildings use the welded joining method, where some or all of the components are prefabricated in the factory and then transported to the construction site for lapping and pouring. If the construction unit lacks an understanding of the design situation, it is easy to deviate from the original design plan and produce design changes during the construction process [14]. If the design unit is involved in the production of components, and the components separated through the detailed design are customized products, the detailed design unit needs to re-design the components, rebar samples, and change the design scheme [14].
During the construction of prefabricated buildings, the general contractor needs to mobilize the subcontractors promptly to avoid delays in the construction period and changes to the established design [14]. At the same time, if the construction period is tight, there are many construction teams, and the construction requirements are high, the construction general contractor needs to coordinate and manage the entire project and the construction site promptly, and avoid causing personnel nests and delaying the construction period [14]. Failure by engineers to resolve issues arising during the implementation of the building within a reasonable timeframe can lead to delays in construction and changes to the design [14].
3.6. Technology
The technical level includes errors and omissions in the design (F1), the time lag between design and construction (F2), the immature technology of component splitting and detailing design (F3), and the low standardization of components produced by component factories (F4).
When some parts of the design plan are not taken into account or omitted and the specified design depth and quality requirements are not met, serious changes need to be made to the design [43]. The planned schedule is coordinated by the general contractor and various construction instructions are issued; if the general contractor does not coordinate in time, the construction schedule lags behind the design plan, and the design plan is thereby changed [44]. In prefabricated buildings, the purpose of component splitting is to reduce costs and facilitate construction, transportation, and hoisting, and if the early construction split design scheme is unreasonable, the design scheme needs to be changed again [43]. At the same time, at this stage, the standardization and generalization of prefabricated building components in China are low, and the components produced by some component factories cannot meet the specified standards; therefore, they cannot be used according to the requirements of the plan standards, which will lead to changes to the original plan [43].
4. Methodology
In the previous sections of this paper, a detailed literature review was conducted to identify the influencing factors that induce design change risk. However, the importance of each factor has not been clearly identified so far. A quantitative analysis is necessary in order to provide solutions and better understand the key influencing factors. Based on the above needs, the fuzzy DEMATEL method is used to study the key influencing factors that induce the risk of design change. The conceptual framework of the study is shown in Figure 1.
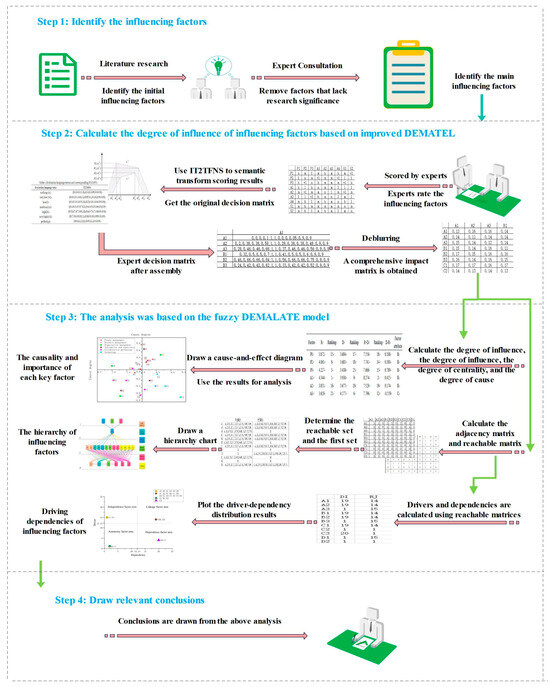
Figure 1.
The framework structure of the study.
4.1. Improved Decision-Making Testing and Evaluation Laboratories
Although DEMATEL is widely used in the identification of factors [26,36], its data source is expert scoring, so it is highly dependent on expert judgment, and often these judgments may be ambiguous. IT2TrFN is more practical in processing fuzzy information, and its main degree of membership and secondary degree of affiliation show the characteristics of internal and interindividual uncertainty well [42]. In addition, scholars have applied the IT2TrFN model to hydrogen energy storage [44] and blockchain technology [42] to study the complex phenomenon of influencing factors. Therefore, this study extends the original DEMATEL to convert the language terms of various experts into IT2TrFN using the fuzzy DEMATEL method, and realizes the analysis of risk factors through the operation of IT2TrFN. The main steps of the fuzzy DEMATEL method used in this study are as follows:
Step 1: IT2TrFN evaluation language set construction. In this paper, the evaluation scores of experts are collected through IT2TrFN, so as to avoid the uncertainty and ambiguity in the process of expert scoring to a greater extent.
Definition 1.
([44]). Type-2 fuzzy sets can be expressed in two ways:
where is the type-2 membership function of , .
Definition 2.
([44]). For a type-2 fuzzy set , if all , the type-2 fuzzy set is said to be an interval type-2 fuzzy set, i.e.,
where .
Definition 3.
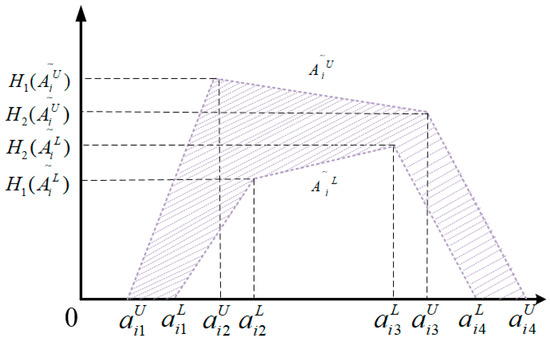
([43]). If the upper and lower bounds membership function of the interval II fuzzy number is a trapezoidal fuzzy number, it is said to be an interval trapezoidal type-2 fuzzy number, as shown in Figure 2:
where is the degree of membership of the upper reminder membership function element , and is the degree of membership of element in the lower trapezoidal membership function. The correspondence between IT2TrFN and language terms is shown in Table 3.
Figure 2.
Schematic diagram of interval type-2 trapezoidal fuzzy numbers.
Table 3.
Evaluation language terms and corresponding to IT2TrFN.
Assuming that there are two interval trapezoidal type-2 fuzzy sets and , according to the relevant research results, the specific definition reflecting the mutual operation between the interval trapezoidal type-2 fuzzy sets is as follows [43]:
Addition:
Subtraction:
Multiplication:
Division: The division criterion between the trapezoidal type-2 fuzzy set and the constant k is defined as
Expected Value Calculation
Step 2: Determine the direct impact matrix.
The research indicator system was determined, named , and the pairwise comparison matrix was obtained through expert scoring. According to Table 2, the semantic values will be converted to IT2TrFN to obtain a direct impact matrix , where is the number of experts.
Among them, the semantic value is the evaluation language directly given by experts.
where IT2TrFN represents the degree of influence of standard with respect to standard in the form shown in Equation Definition 3.
The ordered weighted average operator (OWA) assembles the original decision matrix of all experts to obtain the assembled expert decision matrix A.
Among them, the triangular fuzzy number indicates the degree of influence of factor on factor , which is given by the first expert after comprehensive consideration, and is the weight of the expert.
Step 3: Defuzzing directly affects matrix .
Step 4: Calculate the combined impact matrix.
Step 5: Calculate the influencing degree and influenced degree.
The means the influencing degree, reflecting the comprehensive influence degree of the factor on other factors in the index system, and means the influenced degree, reflecting the degree to which the factor is affected by others.
Among them, represents the centrality of factor , revealing the importance of the factor in the evaluation index system, which is the principle of judging whether it is a core element. The greater the centrality, the more important the element. is the causal degree, which reflects the role of the factor in the overall system. When the degree of cause is greater than 0, when it is a positive value, the factor belongs to the cause factor; when the degree of cause is less than 0, if it is negative, the factor is the effect factor.
4.2. DEMATEL-Based Explanatory Structure Model Method
The ISM method stratifies and simplifies the logical relationships between factors to form a hierarchical directed graph. With a directed diagram, one can clearly understand the hierarchy between elements. The specific steps of the ISM method are as follows:
Step 1: Determine threshold via calculation.
By setting reasonably, relationships with little impact can be eliminated, the system structure can be simplified, and the division of the structural hierarchy can be explained later. Threshold is calculated from the sum of the means and standard deviations of all elements of the combined impact relationship matrix .
Step 2: Determine the adjacency matrix.
The purpose of determining the adjacency matrix is to highlight the main influencing relationships of factors in complex systems. Based on the threshold , the adjacency matrix can be calculated.
where means that factor can affect factor , and means that factor cannot affect factor .
Step 3: Calculate the reachability matrix.
The reachability matrix K reflects the direct and indirect relationships of each factor. The reachable matrix K can be calculated by using the adjacency matrix .
where represents the identity matrix.
Step 4: Determine the reachable and antecedent sets.
Calculate the reachability set and antecedent set for each factor.
Verify that is met for each factor . If met, the factor is level 1; then, remove the corresponding rows and columns from the reachability matrix, and repeat this process until all factors are assigned to build a multi-level hierarchical hierarchy model.
Step 5: Build a hierarchical network model.
The relationship between factors is determined via the accessibility matrix. The hierarchical network model in this article can be obtained after examining the impact relationship and removing the indirect impact relationship. So far, key obstacles have been identified.
Step 6: Analyze drivers and dependencies.
The driving force and dependence of each factor are calculated via Formulas (26) and (27) from the reachability matrix; then, according to the driving force and dependency, each factor is divided into four types of element: autonomy, dependence, correlation, and independence. Among them, the driving force and dependence of autonomous elements are relatively low, the driving force of dependent elements is low and the dependence is high, the driving force and dependence of related elements are relatively high, and the driving force of independent elements is higher and the dependence is low.
5. Discussion
5.1. Causal Relationship and Importance Analysis of Risk-Inducing Factors Affecting Prefabricated Building Design Change
(1) Data acquisition and determination of direct impact matrix.
First, five experts engaged in prefabricated building research from different organizations were invited to fill in the questionnaire, including two construction owners, two construction enterprises, and one scientific research institution. Based on the risk factors identified in this paper that induce design changes, each expert judged them using seven linguistic variables. Due to the limited space of the paper, the judgment of expert 1 is given here as shown in Table 4. The remaining expert scores are provided in Appendix A.
Table 4.
Expert 1’s judgment of factors.
(2) Since each expert is engaged in different industry backgrounds and has different degrees of awareness of the influencing factors, but each expert is in the same position, in order to eliminate the individual differences in expert scoring, expert opinions are equally important, that is, . Firstly, the expert scores were converted into interval trapezoidal type 2 fuzzy numbers in Table 3, and the fuzzy DEMATEL model was used for analysis, and the specific calculation method was based on Equations (1)–(9). Secondly, to quantify the linguistic variables the direct influence matrix was deblurred using Equations (10)–(13), as detailed in Appendix B Table A5, and the normalized comprehensive influence matrix was obtained using Equations (14)–(17), as detailed in Appendix B Table A6. Then, based on the comprehensive influence matrix, the intensity of each constraint factor could be obtained using Equations (18)–(21), and the centrality and causality degree could be determined, and the calculation results are shown in Table 5. Figure 3 shows the scatter plot of the central factor for each inducing factor, which more intuitively reflects the importance of each element in the evaluation index system.
Table 5.
Strength of each constraint factor.
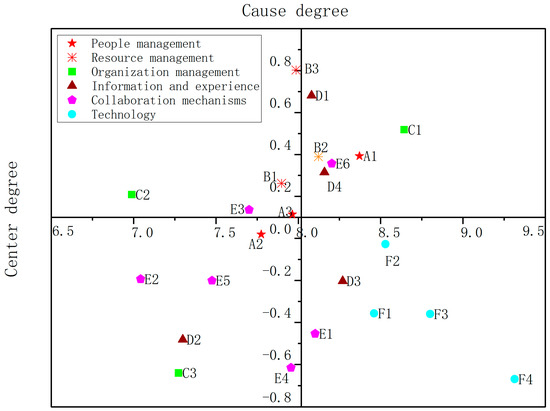
Figure 3.
Cause-and-effect diagram of factors that induce the risk of prefabricated building design change.
As shown in Table 5, the technical level has the largest centrality among the factors that induce design change risk, followed by people management, resource management, information and experience, collaboration mechanisms, and organizational management. In order to show the relationship between each element more intuitively, a coordinate system is established with the point (8.0180, 0) as the coordinate origin; see Figure 3. The factors in the first quadrant include A1, B2, C1, D1, D4, and E6; these factors are high in centrality and causality, are all causal factors, and show the most important factor that directly leads to the risk of inducing design changes. Therefore, the factors in the first quadrant are key factors, which need to be paid attention to and dealt with and improved in a timely manner. At the same time, the fact that A1 changes according to the owner’s needs as a key factor requires attention, which is consistent with the conclusion proposed by [14]; however, as A3, B1, B3, C2, and E3 are in the second quadrant, it can be seen that the centrality and causality of these factors are relatively low compared with those in the first quadrant, but they still have a strong impact on other factors; although these factors are not the key factors that induce the risk of design change, they still need to be paid attention to. The factors in the third quadrant include A2, C3, D2, E2, E4, and E5; the causality and centrality of these factors are low and they are consequential factors, which means that they are largely influenced by other factors and cannot be considered key factors. The factors in the fourth quadrant include D3, E1, F1, F2, F3, and F4, which are less causative and consequently are result factors, which means that they are less affected by other factors but they have a high degree of centrality. The centralities of F1, F2, F3, and F4 rank in the top five of all factors, and the centralities of E1 and D3 also rank higher among all factors, as shown in Table 5. They have a strong influence on other factors, and are still key factors that need attention. Therefore, factors F4, F3, C1, F2, and F1 can be considered the top five key factors that induce design change risk in prefabricated building design. At the same time, errors and omissions in F1 design are key factors that need attention, which is consistent with the conclusions proposed by [20].
5.2. Hierarchy Analysis
Firstly, the threshold is calculated to be 0.1976 based on the sum of the mean and standard deviation of all elements of the comprehensive impact relationship matrix; secondly, the adjacency matrix is determined according to Formula (22); see Appendix C; then, the reachability matrix is calculated according to Formula (23); see Appendix D; finally, the reachability set and the leading set are determined to construct a hierarchical mechanism model, and the results are shown in Figure 4.
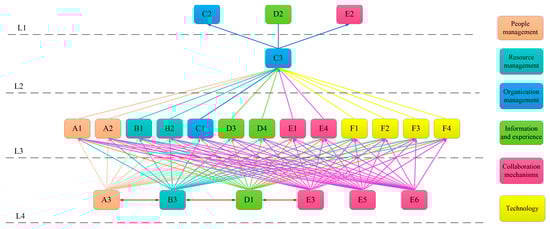
Figure 4.
Hierarchical model of factors inducing design change risk in prefabricated buildings.
For the factors that induce design change risk in prefabricated buildings, the higher the hierarchy level, the more attention that should be given to it. Based on the hierarchical relationship of ISM, 23 barrier factors can be divided into four layers: direct factors (L1), shallow factors (L2), deep factors (L3), and basic factors (L4).
The first layer includes C2, D2 and E2, which are the most direct factors influencing the risk of design changes in prefabricated buildings. The second layer includes C3, and the third layer includes A2, B1, B2, C1, D3, D4, E1, E4, F1, F2, F3, and F4, which are indirect impact layers. The fourth layer includes A3, B3, D1, E3, E5, and E6, which are the most basic and important factors that induce the risk of design change. It can be seen that the factors that induce the risk of design change in prefabricated buildings are interactive, and the impact of their interaction should be considered when implementing preventive measures. In particular, A3, B3, D1, and E3 in the fourth layer should be paid special attention, and targeted measures should be taken to mitigate the impact of these factors.
5.3. Driver–Dependency Analysis
Based on Formulas (26) and (27), the drivers and dependencies of the key influencing factors were calculated. According to the size of the key influencing factor drivers and dependencies, a Cartesian coordinate system is established with the driving force as the horizontal axis, the dependence as the vertical axis, and the mean value as the central axis; it can be divided into four regions—linkage, dependence, autonomy, and independence—corresponding to the four quadrants on the coordinate axis, as shown in Figure 5.

Figure 5.
Driver–dependency distribution of risk-inducing factors of prefabricated building design change.
Driver–dependency analysis: (1) A1, A2, B1, B2, C1, D3, D4, E1, E4, F1, F2, F3, and F4, in the linkage factor area, have a strong driving and dependence; any change in these will affect other factors, making these factors extremely unstable. (2) A3, B3, D1, E3, E5, and E6 are located in the dependent factor area. They are highly motivated, weakly dependent, and susceptible to other factors, and are often the most fundamental factors that induce design change risk in prefabricated buildings, as shown in Figure 4. These factors are at the bottom of the ISM model, and if one wants to drive the development of other factors, these factors should be developed first. (3) C2, D2, and E2 are in the autonomous factor area. They have less dependence and driving force and are the first factors that should be controlled among the risk factors of design change induced by prefabricated buildings. As shown in Figure 4, these factors are at the top of the ISM model. (4) E4, D2, and E5 are in the independent factor region. They are highly dependent but under-motivated. They are susceptible to other factors and have difficulty influencing other factors; therefore, to promote the development of these factors, it is first necessary to develop other factors.
5.4. Management Implications
Based on the above empirical analysis, the top five factors of importance are F4, F3, C1, F2, and F1, which should be taken into account. Previous studies have made it clear that the technical level is the main reason inducing design changes [43], and this paper makes it clearer that the low standardization of production and construction of component factories and the obsolescence of technology rank first among the risks of inducing design changes in prefabricated buildings. This is related to the characteristics of China’s prefabricated building components, at present, the components of China’s prefabricated buildings are based on versatility, if the components produced by the component factory do not meet the specified standards they cannot be part of the coordinated production, and the plan has been changed. In this regard, the construction party chooses to determine the construction enterprise, coordinates the production party of the structural parts according to its specific construction plan, and re-corrects the parameters and scales of the structural parts to avoid various deviations. At the same time, errors and omissions in the design (F1) are a key influencing factor that can also have an impact on the construction project [45]. This may have to do with the competence of the designer, who is not very competent, and the lack of communication and coordination can lead to a lack of information, which can lead to rework [46]. In this regard, design and construction enterprises should raise the threshold of the technology market, strictly formulate qualification standards, strictly control the access standards of technical personnel, improve technical requirements, and reduce errors caused by technical problems.
Among the key factors influencing the risk of design change, there are also studies that fail to conclude that F3, F2, and C1 are the key influencing factors. Reasonable component splitting technology can reduce costs and facilitate transportation and construction, which requires the designer and the construction party to have mature component splitting technology, and the professional ability of designers and construction personnel to improve. In the case of untimely coordination of the general contractor, there will be a time lag in design and construction. This requires designers to go to the construction site to understand the actual situation of the construction, and make a reasonable design plan after fully understanding the recent construction situation. Good organizational ability is an indispensable ability of prefabricated building participants; if the organizational ability is extremely poor, if necessary, a separate design change management department can be established to manage the design change time [47].
6. Conclusions
Prefabricated buildings have broad application prospects in the era of the green economy and are in line with the concept of sustainable development. However, due to the low degree of project standardization, the participation of many stakeholders, and the high complexity of project management, the identification and control of design change risks in prefabricated buildings lack effective decision-making support. Based on this, this paper identifies the influencing factors of prefabricated buildings that induce design change risks, and proposes corresponding control measures. The main conclusions of this paper are as follows:
- (1)
- This paper proposes an analytical framework combining the DEMATEL-ISM model in a fuzzy environment; firstly, through communication with experts in the field of prefabricated buildings, and through qualitative research combined with relevant literature, 23 factors that induce the risk of design change in prefabricated buildings were identified and a risk index system was constructed from six perspectives: personnel management, resource management, organizational management, information and experience, collaboration mechanism, and technical level. Secondly, experts in related fields were invited to score the relationship between influencing factors, and the DEMATEL-ISM model in a fuzzy environment was established using the real scoring results, so as to clarify the internal relationship between the influencing factors and obtain the driving force and dependence of the corresponding factors. Finally, according to the quantitative analysis results, corresponding management strategies were proposed for different influencing factors. This combination of qualitative and quantitative research methods has certain reference significance for solving the decision-making problem of complex engineering projects. From the perspective of engineering project application, the hybrid solution proposed in this paper provides an effective method of support for the risk control decision-making of prefabricated projects, provides targeted risk prevention and control methods based on specific risk factor characteristics, effectively reduces the impact of engineering project risks on project performance, and provides support for solving complex management decisions in engineering projects.
- (2)
- The analysis results show that the main factors that induce the risk of design change in prefabricated buildings are poor organizational skills (C1), belonging to organizational management; errors and omissions in the design (F1); the time lag between design and construction (F2); the technology of the technical level component splitting and detailing design is not mature (F3); and the component factory has low standardization of product construction and outdated technology (F4). In the short term, the main factors that deserve more attention are that there are no construction manuals and procedures (C2), a lack of design experience (D2), and construction units and production units were not involved in the design (E2), while in the long term they are that labor skills are inadequate (A3), project costs increase (B3), the degree of information sharing among project participants is not high (D1), the design team is not aware of the underlying factors involved in component production and construction (E3), the general contractor failed to mobilize quickly enough (E5), and delays due to pending issues from engineers (E6).
In general, the factors that induce design change risk in prefabricated buildings are systematic and inter-related, and previous studies have also illustrated this [34]. The research results of this paper can provide decision-making reference and inspiration for stakeholders such as contractors, government departments, and owners of prefabricated buildings, help them understand the main factors that induce the risk of design change, and clarify the relationship between the factors. Follow-up research can further measure or evaluate the risk control effect on the basis of analyzing the relationship between the factors inducing the change in prefabricated building design and proposing risk control measures, so as to provide help for the smooth development and operation of prefabricated buildings.
Author Contributions
R.S. conceptualization, investigation, and writing—original draft; Y.W. writing—review and editing; X.G. and L.Z., data curation and project administration; R.G. writing—review and editing. All authors have read and agreed to the published version of the manuscript.
Funding
The authors gratefully acknowledge the Scientific Planning of Culture and Arts and Tourism Research Project of Hebei Province (HB23-YB117), the Key Program of Philosophy and Social Science Planning of Handan (Grant no. 2023063, 2023078).
Data Availability Statement
The sample data is derived from research interviews conducted by our research team, and due to confidentiality reasons, the data cannot be disclosed.
Conflicts of Interest
The authors declare that they have no known competing financial interests or personal relationships that could have appeared to influence the work reported in this paper.
Appendix A
Table A1.
Expert 2’s judgment of factors.
Table A1.
Expert 2’s judgment of factors.
| A1 | A2 | A3 | B1 | B2 | B3 | C1 | C2 | C3 | D1 | D2 | D3 | D4 | E1 | E2 | E3 | E4 | E5 | E6 | F1 | F2 | F3 | F4 | |
|---|---|---|---|---|---|---|---|---|---|---|---|---|---|---|---|---|---|---|---|---|---|---|---|
| A1 | n | h | n | n | n | vl | vl | vl | n | l | p | p | m | m | h | h | h | vl | m | h | h | h | h |
| A2 | vl | n | n | n | n | l | l | l | l | l | m | l | m | m | l | m | m | m | m | l | m | m | l |
| A3 | l | l | n | l | l | vl | m | l | m | l | l | vl | l | l | m | l | m | l | l | m | l | m | l |
| B1 | m | l | m | n | m | m | l | m | m | m | m | l | m | m | l | l | m | m | l | m | l | m | m |
| B2 | m | m | h | m | n | m | l | l | m | m | l | m | m | m | l | m | m | m | m | l | m | m | m |
| B3 | l | vl | m | l | vl | n | l | vl | m | m | l | m | l | m | l | l | l | m | l | h | h | h | h |
| C1 | h | h | m | m | m | m | n | m | h | m | l | m | m | m | l | m | m | m | h | m | h | m | m |
| C2 | m | l | m | m | m | l | m | n | m | m | l | m | m | m | l | m | m | m | m | l | m | m | m |
| C3 | m | l | m | m | m | m | m | m | n | m | l | m | m | m | l | m | m | m | m | m | m | m | m |
| D1 | l | m | m | m | m | m | m | m | m | n | l | m | m | m | m | m | m | m | l | m | m | m | m |
| D2 | m | l | m | m | m | l | vl | l | l | l | n | l | vl | l | vl | l | l | l | vl | vl | l | l | l |
| D3 | l | l | m | m | l | l | m | l | l | l | l | n | m | l | l | m | l | m | l | m | l | m | m |
| D4 | l | l | h | vh | h | vh | m | h | vh | m | h | m | n | h | h | h | h | h | vh | h | vh | h | m |
| E1 | m | h | l | m | m | h | l | l | m | l | h | l | m | n | l | m | l | h | m | l | h | l | m |
| E2 | m | l | h | m | m | l | m | l | m | m | l | m | m | l | n | m | l | m | m | h | m | l | m |
| E3 | m | l | m | l | m | m | l | m | m | l | m | m | m | l | m | n | m | m | l | m | l | m | m |
| E4 | m | l | m | l | l | m | l | vl | m | l | m | m | l | m | vl | l | n | vl | m | vl | m | vl | m |
| E5 | h | l | vl | m | l | vl | h | l | vl | m | vl | m | vl | l | vl | m | vl | n | vl | l | vl | l | vl |
| E6 | m | vl | m | l | m | l | l | m | l | m | m | l | m | l | m | l | m | l | n | l | m | l | m |
| F1 | m | l | vl | m | m | l | vl | m | m | vl | m | l | m | l | m | vl | l | m | vl | n | m | l | l |
| F2 | l | m | l | vl | l | m | l | m | l | m | l | m | m | vl | m | l | m | l | m | l | n | l | l |
| F3 | m | l | m | l | m | l | m | l | l | l | m | l | m | vl | m | l | m | l | l | m | l | n | l |
| F4 | m | l | m | l | m | l | l | l | m | l | m | l | m | l | m | l | l | m | l | m | l | l | n |
Table A2.
Expert 3’s judgment of factors.
Table A2.
Expert 3’s judgment of factors.
| A1 | A2 | A3 | B1 | B2 | B3 | C1 | C2 | C3 | D1 | D2 | D3 | D4 | E1 | E2 | E3 | E4 | E5 | E6 | F1 | F2 | F3 | F4 | |
|---|---|---|---|---|---|---|---|---|---|---|---|---|---|---|---|---|---|---|---|---|---|---|---|
| A1 | n | m | h | l | h | vh | h | l | l | l | m | p | m | vh | vl | n | l | n | vl | m | n | m | p |
| A2 | l | n | h | m | vh | h | m | vl | m | vl | h | p | h | m | n | n | l | vl | vh | vl | vl | vh | p |
| A3 | vl | vh | n | h | vh | m | h | l | vl | vl | vh | h | m | l | n | n | vl | vl | vl | l | vl | m | vh |
| B1 | vl | l | h | n | vh | m | l | vl | l | l | h | h | m | l | n | n | vl | vl | l | m | l | m | vh |
| B2 | vh | h | m | h | n | l | m | vl | m | l | vh | h | h | m | vl | vl | vl | vl | l | m | l | h | p |
| B3 | vl | l | m | l | h | n | l | h | h | h | l | h | m | h | m | vh | m | l | vh | m | h | h | m |
| C1 | vl | m | l | vh | m | vh | n | l | h | l | h | l | h | l | h | l | h | vl | m | l | p | l | h |
| C2 | h | l | m | h | h | l | m | n | h | m | vh | m | p | m | vh | vl | n | n | l | m | p | m | vl |
| C3 | l | vl | h | l | l | h | vl | l | n | n | h | n | m | vl | l | vl | vh | l | vh | l | vl | n | h |
| D1 | vl | m | n | l | h | m | vh | m | vh | n | h | m | l | vh | l | h | l | l | h | l | h | m | vh |
| D2 | l | h | vl | h | l | m | vh | vl | vh | l | n | vh | m | h | l | h | m | h | p | m | n | vl | m |
| D3 | l | h | m | l | h | m | vh | l | vh | vl | m | n | vl | vh | vl | p | vl | l | m | vl | h | l | h |
| D4 | vl | vl | vl | vl | vl | m | m | vl | m | m | p | p | n | m | m | m | m | m | m | p | p | p | p |
| E1 | n | m | m | m | m | m | m | m | m | m | p | p | m | n | m | vh | m | m | m | p | m | p | p |
| E2 | m | l | m | l | m | m | l | m | m | l | n | m | m | m | n | m | m | m | m | p | m | m | p |
| E3 | m | m | l | m | m | l | m | m | m | l | m | m | m | m | m | n | m | m | m | p | m | m | p |
| E4 | l | m | l | vl | m | l | m | m | l | m | vl | m | n | h | n | m | n | l | m | p | m | p | p |
| E5 | l | vl | h | l | vl | m | vl | m | vl | l | vl | m | n | h | m | l | vh | n | m | p | m | m | p |
| E6 | m | l | l | m | l | m | m | l | m | l | m | p | l | n | vh | m | h | l | n | p | m | p | p |
| F1 | m | l | vl | m | m | vl | m | l | m | l | m | p | vl | m | n | vl | vh | vl | m | n | m | p | p |
| F2 | l | m | l | m | l | m | l | m | m | vl | m | p | m | p | p | n | m | m | m | p | n | p | p |
| F3 | m | l | m | l | l | l | m | l | m | vl | m | p | m | p | p | m | n | m | m | p | m | n | p |
| F4 | m | l | l | l | m | l | m | l | m | l | m | m | l | n | m | m | m | n | m | p | m | p | 0 |
Table A3.
Expert 4’s judgment of factors.
Table A3.
Expert 4’s judgment of factors.
| A1 | A2 | A3 | B1 | B2 | B3 | C1 | C2 | C3 | D1 | D2 | D3 | D4 | E1 | E2 | E3 | E4 | E5 | E6 | F1 | F2 | F3 | F4 | |
|---|---|---|---|---|---|---|---|---|---|---|---|---|---|---|---|---|---|---|---|---|---|---|---|
| A1 | n | vh | h | h | m | h | h | h | l | h | h | h | m | m | h | vh | h | m | m | vh | h | h | h |
| A2 | h | n | h | h | m | m | vh | vh | m | h | h | m | h | h | h | m | h | h | m | m | m | h | h |
| A3 | h | h | n | m | m | h | h | vh | vh | h | h | m | m | vh | vh | vh | vh | vh | h | h | h | h | h |
| B1 | h | h | h | n | m | vh | h | h | h | vh | h | m | m | h | m | h | vh | h | h | h | h | m | m |
| B2 | h | h | h | h | n | h | h | m | m | m | m | vh | vh | vh | h | m | h | h | h | m | vh | m | m |
| B3 | h | m | m | m | vh | n | vh | vh | l | h | h | m | m | vh | h | m | m | vh | h | h | h | h | h |
| C1 | p | vh | h | vh | h | vh | n | h | h | vh | m | h | h | m | m | l | h | h | m | h | l | m | vh |
| C2 | p | h | vh | h | m | h | m | n | h | h | l | m | h | h | m | m | h | m | m | m | h | h | m |
| C3 | m | m | m | m | h | m | h | m | n | h | m | m | m | m | h | vh | m | m | m | vh | h | m | m |
| D1 | h | m | m | h | h | m | m | h | m | n | h | h | m | h | m | m | h | h | h | m | h | h | vh |
| D2 | h | h | m | h | h | m | h | h | h | m | n | h | h | h | h | h | h | m | m | m | h | m | m |
| D3 | n | h | n | m | vl | l | h | h | m | vh | h | n | h | m | m | m | m | h | vl | vh | vl | m | h |
| D4 | n | h | m | l | vh | l | p | m | m | m | n | m | n | p | h | vh | p | p | n | m | m | m | p |
| E1 | l | n | vh | m | h | l | p | m | m | m | m | n | m | n | h | h | p | p | m | n | m | m | p |
| E2 | vl | m | n | vl | vh | vl | p | m | n | h | n | m | vl | p | n | h | h | p | m | m | n | m | p |
| E3 | m | p | p | vl | m | m | p | m | n | h | m | l | vh | p | p | n | p | p | p | p | p | p | p |
| E4 | m | p | p | m | n | m | p | p | l | n | vh | m | h | p | p | p | n | p | p | p | p | p | p |
| E5 | l | n | m | m | m | n | p | p | p | p | p | p | p | p | h | h | p | n | p | p | p | p | p |
| E6 | p | m | l | m | m | l | m | l | m | vl | m | vl | l | p | p | p | p | vl | n | vl | m | p | p |
| F1 | p | m | m | vl | m | l | m | l | m | m | l | m | l | p | h | h | p | n | m | n | m | p | p |
| F2 | p | m | l | m | l | m | m | vl | vl | m | l | m | l | p | h | h | p | m | n | m | n | p | p |
| F3 | p | l | l | l | m | l | m | vl | m | l | m | m | vl | p | h | h | p | m | m | n | m | n | p |
| F4 | p | l | m | l | m | l | m | l | l | m | l | m | vl | p | h | h | p | p | p | p | p | p | 0 |
Table A4.
Expert 5’s judgment of factors.
Table A4.
Expert 5’s judgment of factors.
| A1 | A2 | A3 | B1 | B2 | B3 | C1 | C2 | C3 | D1 | D2 | D3 | D4 | E1 | E2 | E3 | E4 | E5 | E6 | F1 | F2 | F3 | F4 | |
|---|---|---|---|---|---|---|---|---|---|---|---|---|---|---|---|---|---|---|---|---|---|---|---|
| A1 | n | p | h | l | l | h | h | h | h | m | h | vh | h | h | vl | m | h | h | p | vh | h | vh | m |
| A2 | m | n | m | m | m | m | m | m | m | m | m | m | m | m | m | m | m | m | m | m | m | m | m |
| A3 | m | m | n | m | m | m | m | m | m | m | m | h | m | h | l | h | l | h | m | l | m | h | l |
| B1 | m | m | h | n | l | h | m | h | l | h | m | h | l | h | l | m | l | h | l | m | h | m | h |
| B2 | h | m | m | m | n | h | m | l | m | h | m | l | h | m | m | l | h | m | l | m | h | l | m |
| B3 | h | m | h | l | h | n | m | h | l | m | h | l | m | h | l | m | h | l | m | h | l | h | l |
| C1 | m | m | m | m | m | m | n | m | m | m | m | m | m | m | m | m | m | m | m | m | m | m | m |
| C2 | n | n | n | n | n | n | n | n | n | n | n | n | n | n | n | n | n | n | n | n | n | n | n |
| C3 | n | n | n | n | n | n | n | n | n | n | n | n | n | n | n | n | n | n | n | n | n | n | n |
| D1 | m | m | m | m | m | m | m | m | m | n | m | m | m | m | m | m | m | m | m | m | m | m | m |
| D2 | n | n | n | n | n | n | n | n | n | n | n | n | n | n | n | n | n | n | n | n | n | n | n |
| D3 | m | m | m | m | m | m | m | m | m | m | m | n | m | m | m | m | m | m | m | m | m | m | m |
| D4 | m | m | m | m | m | h | h | l | l | h | m | m | n | l | l | m | m | m | l | l | h | l | l |
| E1 | l | m | l | l | m | m | l | l | m | vl | m | l | l | n | m | l | l | m | l | m | m | m | l |
| E2 | l | l | m | l | m | l | m | l | m | l | l | l | m | m | n | m | l | l | m | m | l | l | l |
| E3 | l | l | m | m | l | vl | vh | vl | p | l | l | m | m | m | l | n | l | l | m | l | l | m | m |
| E4 | l | l | l | m | m | vl | m | m | p | l | m | l | m | l | m | l | n | m | l | m | m | l | l |
| E5 | m | l | m | m | m | m | n | m | p | m | m | l | m | l | m | m | l | n | m | l | m | m | m |
| E6 | l | p | m | p | l | m | m | n | p | h | vl | vh | vh | h | n | n | p | p | n | p | h | h | p |
| F1 | p | p | m | vh | l | m | m | l | m | p | n | p | vh | l | n | n | p | m | p | n | h | p | vh |
| F2 | p | h | h | vh | l | vl | m | l | m | p | h | p | p | l | n | n | p | m | p | p | n | p | p |
| F3 | vh | p | vh | vh | l | m | l | m | m | p | vl | p | p | p | vl | n | p | l | p | p | p | n | p |
| F4 | p | p | h | vh | m | l | m | l | m | p | vl | p | p | vl | vl | p | p | h | p | p | p | p | n |
Appendix B
Table A5.
Direct impact matrix defuzzing.
Table A5.
Direct impact matrix defuzzing.
| A1 | A2 | A3 | B1 | B2 | B3 | C1 | C2 | C3 | D1 | D2 | D3 | D4 | E1 | E2 | E3 | E4 | E5 | E6 | F1 | F2 | F3 | F4 | |
|---|---|---|---|---|---|---|---|---|---|---|---|---|---|---|---|---|---|---|---|---|---|---|---|
| A1 | 0.02 | 0.69 | 0.51 | 0.33 | 0.43 | 0.57 | 0.57 | 0.45 | 0.28 | 0.37 | 0.59 | 0.71 | 0.45 | 0.51 | 0.38 | 0.43 | 0.49 | 0.26 | 0.41 | 0.75 | 0.59 | 0.68 | 0.66 |
| A2 | 0.37 | 0.02 | 0.47 | 0.41 | 0.47 | 0.49 | 0.45 | 0.41 | 0.41 | 0.37 | 0.53 | 0.47 | 0.49 | 0.45 | 0.39 | 0.35 | 0.45 | 0.45 | 0.52 | 0.37 | 0.41 | 0.60 | 0.54 |
| A3 | 0.45 | 0.49 | 0.02 | 0.50 | 0.52 | 0.45 | 0.57 | 0.41 | 0.53 | 0.41 | 0.52 | 0.45 | 0.45 | 0.48 | 0.43 | 0.51 | 0.41 | 0.45 | 0.34 | 0.45 | 0.41 | 0.57 | 0.48 |
| B1 | 0.49 | 0.41 | 0.64 | 0.02 | 0.52 | 0.60 | 0.41 | 0.45 | 0.41 | 0.56 | 0.60 | 0.49 | 0.37 | 0.49 | 0.24 | 0.39 | 0.41 | 0.45 | 0.37 | 0.45 | 0.49 | 0.49 | 0.60 |
| B2 | 0.64 | 0.49 | 0.58 | 0.58 | 0.02 | 0.49 | 0.49 | 0.26 | 0.49 | 0.45 | 0.48 | 0.52 | 0.64 | 0.52 | 0.34 | 0.41 | 0.45 | 0.41 | 0.41 | 0.41 | 0.56 | 0.53 | 0.62 |
| B3 | 0.41 | 0.34 | 0.52 | 0.35 | 0.57 | 0.02 | 0.44 | 0.57 | 0.41 | 0.60 | 0.56 | 0.49 | 0.49 | 0.64 | 0.49 | 0.52 | 0.45 | 0.41 | 0.49 | 0.68 | 0.53 | 0.68 | 0.57 |
| C1 | 0.55 | 0.64 | 0.48 | 0.67 | 0.57 | 0.64 | 0.02 | 0.53 | 0.57 | 0.52 | 0.53 | 0.45 | 0.57 | 0.45 | 0.53 | 0.37 | 0.57 | 0.49 | 0.53 | 0.45 | 0.62 | 0.45 | 0.56 |
| C2 | 0.53 | 0.39 | 0.46 | 0.47 | 0.43 | 0.35 | 0.39 | 0.02 | 0.47 | 0.47 | 0.35 | 0.43 | 0.53 | 0.47 | 0.39 | 0.32 | 0.38 | 0.30 | 0.35 | 0.32 | 0.57 | 0.39 | 0.32 |
| C3 | 0.35 | 0.32 | 0.41 | 0.33 | 0.43 | 0.43 | 0.32 | 0.35 | 0.02 | 0.38 | 0.39 | 0.26 | 0.39 | 0.32 | 0.39 | 0.39 | 0.47 | 0.35 | 0.51 | 0.43 | 0.36 | 0.30 | 0.47 |
| D1 | 0.37 | 0.49 | 0.38 | 0.49 | 0.60 | 0.49 | 0.56 | 0.49 | 0.56 | 0.02 | 0.57 | 0.49 | 0.45 | 0.64 | 0.45 | 0.49 | 0.49 | 0.49 | 0.53 | 0.45 | 0.60 | 0.53 | 0.60 |
| D2 | 0.39 | 0.47 | 0.28 | 0.47 | 0.39 | 0.39 | 0.43 | 0.32 | 0.47 | 0.35 | 0.02 | 0.51 | 0.36 | 0.47 | 0.32 | 0.47 | 0.39 | 0.43 | 0.41 | 0.36 | 0.30 | 0.28 | 0.35 |
| D3 | 0.35 | 0.53 | 0.38 | 0.44 | 0.45 | 0.41 | 0.68 | 0.45 | 0.56 | 0.37 | 0.53 | 0.02 | 0.45 | 0.52 | 0.34 | 0.62 | 0.37 | 0.49 | 0.41 | 0.49 | 0.45 | 0.41 | 0.57 |
| D4 | 0.24 | 0.37 | 0.43 | 0.44 | 0.49 | 0.52 | 0.58 | 0.37 | 0.48 | 0.49 | 0.49 | 0.54 | 0.02 | 0.54 | 0.45 | 0.56 | 0.55 | 0.58 | 0.39 | 0.51 | 0.66 | 0.54 | 0.56 |
| E1 | 0.28 | 0.36 | 0.48 | 0.43 | 0.49 | 0.41 | 0.46 | 0.37 | 0.45 | 0.34 | 0.55 | 0.37 | 0.41 | 0.02 | 0.45 | 0.49 | 0.43 | 0.58 | 0.41 | 0.41 | 0.49 | 0.50 | 0.60 |
| E2 | 0.34 | 0.33 | 0.41 | 0.30 | 0.49 | 0.26 | 0.47 | 0.34 | 0.35 | 0.41 | 0.15 | 0.41 | 0.34 | 0.47 | 0.02 | 0.49 | 0.37 | 0.50 | 0.41 | 0.55 | 0.28 | 0.37 | 0.60 |
| E3 | 0.41 | 0.43 | 0.55 | 0.34 | 0.41 | 0.30 | 0.54 | 0.34 | 0.45 | 0.34 | 0.37 | 0.41 | 0.52 | 0.47 | 0.47 | 0.02 | 0.47 | 0.50 | 0.47 | 0.56 | 0.43 | 0.54 | 0.64 |
| E4 | 0.37 | 0.46 | 0.49 | 0.34 | 0.32 | 0.30 | 0.47 | 0.43 | 0.46 | 0.24 | 0.41 | 0.37 | 0.35 | 0.51 | 0.34 | 0.43 | 0.02 | 0.43 | 0.47 | 0.53 | 0.51 | 0.49 | 0.60 |
| E5 | 0.41 | 0.17 | 0.43 | 0.43 | 0.30 | 0.25 | 0.38 | 0.47 | 0.49 | 0.47 | 0.36 | 0.47 | 0.37 | 0.47 | 0.38 | 0.41 | 0.50 | 0.02 | 0.43 | 0.52 | 0.47 | 0.50 | 0.56 |
| E6 | 0.58 | 0.51 | 0.39 | 0.55 | 0.37 | 0.41 | 0.45 | 0.32 | 0.54 | 0.37 | 0.41 | 0.54 | 0.44 | 0.45 | 0.56 | 0.45 | 0.71 | 0.43 | 0.02 | 0.56 | 0.49 | 0.64 | 0.73 |
| F1 | 0.68 | 0.50 | 0.31 | 0.48 | 0.45 | 0.30 | 0.41 | 0.33 | 0.45 | 0.47 | 0.35 | 0.60 | 0.41 | 0.50 | 0.34 | 0.25 | 0.67 | 0.32 | 0.51 | 0.02 | 0.49 | 0.73 | 0.71 |
| F2 | 0.56 | 0.53 | 0.39 | 0.49 | 0.29 | 0.41 | 0.37 | 0.37 | 0.37 | 0.47 | 0.45 | 0.64 | 0.54 | 0.52 | 0.53 | 0.30 | 0.64 | 0.45 | 0.45 | 0.64 | 0.02 | 0.69 | 0.73 |
| F3 | 0.66 | 0.43 | 0.53 | 0.44 | 0.37 | 0.37 | 0.45 | 0.30 | 0.41 | 0.43 | 0.37 | 0.64 | 0.47 | 0.69 | 0.51 | 0.39 | 0.54 | 0.41 | 0.50 | 0.58 | 0.54 | 0.02 | 0.69 |
| F4 | 0.64 | 0.46 | 0.48 | 0.44 | 0.49 | 0.29 | 0.45 | 0.29 | 0.45 | 0.50 | 0.34 | 0.50 | 0.47 | 0.34 | 0.45 | 0.54 | 0.64 | 0.53 | 0.60 | 0.73 | 0.64 | 0.73 | 0.01 |
Table A6.
Comprehensive Influence Relationship Matrix.
Table A6.
Comprehensive Influence Relationship Matrix.
| A1 | A2 | A3 | B1 | B2 | B3 | C1 | C2 | C3 | D1 | D2 | D3 | D4 | E1 | E2 | E3 | E4 | E5 | E6 | F1 | F2 | F3 | F4 | |
|---|---|---|---|---|---|---|---|---|---|---|---|---|---|---|---|---|---|---|---|---|---|---|---|
| A1 | 0.16 | 0.20 | 0.19 | 0.17 | 0.18 | 0.18 | 0.20 | 0.16 | 0.17 | 0.17 | 0.19 | 0.22 | 0.18 | 0.20 | 0.17 | 0.18 | 0.20 | 0.17 | 0.18 | 0.23 | 0.21 | 0.23 | 0.24 |
| A2 | 0.16 | 0.13 | 0.17 | 0.16 | 0.17 | 0.16 | 0.17 | 0.15 | 0.17 | 0.15 | 0.17 | 0.18 | 0.17 | 0.18 | 0.15 | 0.16 | 0.18 | 0.17 | 0.17 | 0.18 | 0.18 | 0.20 | 0.21 |
| A3 | 0.18 | 0.17 | 0.14 | 0.17 | 0.18 | 0.16 | 0.19 | 0.15 | 0.18 | 0.16 | 0.18 | 0.18 | 0.17 | 0.19 | 0.16 | 0.17 | 0.18 | 0.17 | 0.16 | 0.19 | 0.18 | 0.20 | 0.21 |
| B1 | 0.18 | 0.17 | 0.19 | 0.14 | 0.18 | 0.17 | 0.18 | 0.16 | 0.17 | 0.17 | 0.18 | 0.19 | 0.17 | 0.19 | 0.15 | 0.17 | 0.18 | 0.17 | 0.17 | 0.19 | 0.19 | 0.20 | 0.22 |
| B2 | 0.20 | 0.18 | 0.19 | 0.19 | 0.15 | 0.17 | 0.19 | 0.15 | 0.18 | 0.17 | 0.18 | 0.20 | 0.19 | 0.20 | 0.16 | 0.17 | 0.19 | 0.17 | 0.18 | 0.20 | 0.20 | 0.21 | 0.23 |
| B3 | 0.19 | 0.17 | 0.19 | 0.17 | 0.19 | 0.14 | 0.19 | 0.17 | 0.18 | 0.19 | 0.19 | 0.20 | 0.19 | 0.21 | 0.18 | 0.18 | 0.20 | 0.18 | 0.19 | 0.22 | 0.20 | 0.23 | 0.23 |
| C1 | 0.20 | 0.20 | 0.19 | 0.20 | 0.20 | 0.19 | 0.16 | 0.18 | 0.20 | 0.19 | 0.20 | 0.20 | 0.20 | 0.21 | 0.18 | 0.18 | 0.21 | 0.19 | 0.20 | 0.21 | 0.22 | 0.22 | 0.24 |
| C2 | 0.17 | 0.15 | 0.16 | 0.16 | 0.15 | 0.14 | 0.16 | 0.11 | 0.16 | 0.15 | 0.15 | 0.17 | 0.16 | 0.17 | 0.14 | 0.14 | 0.16 | 0.14 | 0.15 | 0.16 | 0.18 | 0.17 | 0.18 |
| C3 | 0.14 | 0.14 | 0.15 | 0.14 | 0.14 | 0.14 | 0.14 | 0.13 | 0.12 | 0.14 | 0.14 | 0.14 | 0.14 | 0.15 | 0.14 | 0.14 | 0.16 | 0.14 | 0.15 | 0.16 | 0.15 | 0.16 | 0.18 |
| D1 | 0.18 | 0.19 | 0.18 | 0.18 | 0.19 | 0.17 | 0.20 | 0.17 | 0.19 | 0.14 | 0.19 | 0.20 | 0.18 | 0.21 | 0.17 | 0.18 | 0.20 | 0.18 | 0.19 | 0.20 | 0.21 | 0.22 | 0.24 |
| D2 | 0.15 | 0.15 | 0.14 | 0.15 | 0.15 | 0.14 | 0.15 | 0.13 | 0.15 | 0.14 | 0.12 | 0.16 | 0.14 | 0.16 | 0.13 | 0.15 | 0.16 | 0.15 | 0.15 | 0.16 | 0.15 | 0.16 | 0.18 |
| D3 | 0.17 | 0.18 | 0.17 | 0.17 | 0.17 | 0.16 | 0.19 | 0.15 | 0.18 | 0.16 | 0.18 | 0.15 | 0.17 | 0.19 | 0.15 | 0.18 | 0.18 | 0.17 | 0.17 | 0.19 | 0.19 | 0.19 | 0.22 |
| D4 | 0.17 | 0.17 | 0.18 | 0.18 | 0.18 | 0.17 | 0.19 | 0.15 | 0.18 | 0.17 | 0.18 | 0.20 | 0.15 | 0.20 | 0.17 | 0.18 | 0.20 | 0.19 | 0.18 | 0.20 | 0.21 | 0.21 | 0.23 |
| E1 | 0.16 | 0.16 | 0.17 | 0.16 | 0.17 | 0.15 | 0.17 | 0.14 | 0.17 | 0.15 | 0.17 | 0.17 | 0.16 | 0.14 | 0.16 | 0.16 | 0.18 | 0.17 | 0.16 | 0.18 | 0.18 | 0.19 | 0.21 |
| E2 | 0.15 | 0.14 | 0.15 | 0.14 | 0.15 | 0.13 | 0.16 | 0.13 | 0.15 | 0.14 | 0.13 | 0.16 | 0.14 | 0.16 | 0.11 | 0.15 | 0.16 | 0.15 | 0.15 | 0.17 | 0.15 | 0.17 | 0.19 |
| E3 | 0.17 | 0.17 | 0.18 | 0.16 | 0.16 | 0.15 | 0.18 | 0.14 | 0.17 | 0.15 | 0.16 | 0.18 | 0.17 | 0.18 | 0.16 | 0.13 | 0.18 | 0.17 | 0.17 | 0.19 | 0.18 | 0.20 | 0.22 |
| E4 | 0.16 | 0.16 | 0.16 | 0.15 | 0.15 | 0.14 | 0.17 | 0.14 | 0.16 | 0.14 | 0.16 | 0.16 | 0.15 | 0.18 | 0.14 | 0.15 | 0.14 | 0.16 | 0.16 | 0.18 | 0.18 | 0.18 | 0.21 |
| E5 | 0.16 | 0.14 | 0.16 | 0.15 | 0.15 | 0.13 | 0.16 | 0.14 | 0.16 | 0.15 | 0.15 | 0.17 | 0.15 | 0.17 | 0.14 | 0.15 | 0.17 | 0.12 | 0.16 | 0.18 | 0.17 | 0.18 | 0.20 |
| E6 | 0.19 | 0.18 | 0.18 | 0.18 | 0.17 | 0.17 | 0.19 | 0.15 | 0.19 | 0.17 | 0.18 | 0.20 | 0.18 | 0.19 | 0.18 | 0.18 | 0.21 | 0.18 | 0.15 | 0.21 | 0.20 | 0.22 | 0.24 |
| F1 | 0.19 | 0.18 | 0.16 | 0.17 | 0.17 | 0.15 | 0.18 | 0.15 | 0.17 | 0.17 | 0.17 | 0.20 | 0.17 | 0.19 | 0.15 | 0.15 | 0.20 | 0.16 | 0.18 | 0.16 | 0.19 | 0.22 | 0.23 |
| F2 | 0.19 | 0.18 | 0.18 | 0.18 | 0.17 | 0.16 | 0.18 | 0.15 | 0.18 | 0.17 | 0.18 | 0.21 | 0.19 | 0.20 | 0.17 | 0.16 | 0.21 | 0.18 | 0.18 | 0.21 | 0.16 | 0.22 | 0.24 |
| F3 | 0.20 | 0.18 | 0.18 | 0.17 | 0.17 | 0.16 | 0.18 | 0.15 | 0.18 | 0.17 | 0.17 | 0.20 | 0.18 | 0.21 | 0.17 | 0.17 | 0.20 | 0.17 | 0.18 | 0.21 | 0.20 | 0.17 | 0.24 |
| F4 | 0.20 | 0.18 | 0.18 | 0.18 | 0.18 | 0.16 | 0.19 | 0.15 | 0.18 | 0.18 | 0.17 | 0.20 | 0.18 | 0.19 | 0.17 | 0.18 | 0.21 | 0.18 | 0.19 | 0.22 | 0.21 | 0.23 | 0.19 |
Appendix C
Table A7.
Adjacency matrix.
Table A7.
Adjacency matrix.
| A1 | A2 | A3 | B1 | B2 | B3 | C1 | C2 | C3 | D1 | D2 | D3 | D4 | E1 | E2 | E3 | E4 | E5 | E6 | F1 | F2 | F3 | F4 | |
|---|---|---|---|---|---|---|---|---|---|---|---|---|---|---|---|---|---|---|---|---|---|---|---|
| A1 | 0 | 1 | 0 | 0 | 0 | 0 | 1 | 0 | 0 | 0 | 0 | 1 | 0 | 1 | 0 | 0 | 1 | 0 | 0 | 1 | 1 | 1 | 1 |
| A2 | 0 | 0 | 0 | 0 | 0 | 0 | 0 | 0 | 0 | 0 | 0 | 0 | 0 | 0 | 0 | 0 | 0 | 0 | 0 | 0 | 0 | 1 | 1 |
| A3 | 0 | 0 | 0 | 0 | 0 | 0 | 0 | 0 | 0 | 0 | 0 | 0 | 0 | 0 | 0 | 0 | 0 | 0 | 0 | 0 | 0 | 1 | 1 |
| B1 | 0 | 0 | 0 | 0 | 0 | 0 | 0 | 0 | 0 | 0 | 0 | 0 | 0 | 0 | 0 | 0 | 0 | 0 | 0 | 0 | 0 | 1 | 1 |
| B2 | 0 | 0 | 0 | 0 | 0 | 0 | 0 | 0 | 0 | 0 | 0 | 1 | 0 | 1 | 0 | 0 | 0 | 0 | 0 | 0 | 1 | 1 | 1 |
| B3 | 0 | 0 | 0 | 0 | 0 | 0 | 0 | 0 | 0 | 0 | 0 | 1 | 0 | 1 | 0 | 0 | 1 | 0 | 0 | 1 | 1 | 1 | 1 |
| C1 | 1 | 1 | 0 | 1 | 1 | 0 | 0 | 0 | 1 | 0 | 0 | 1 | 1 | 1 | 0 | 0 | 1 | 0 | 0 | 1 | 1 | 1 | 1 |
| C2 | 0 | 0 | 0 | 0 | 0 | 0 | 0 | 0 | 0 | 0 | 0 | 0 | 0 | 0 | 0 | 0 | 0 | 0 | 0 | 0 | 0 | 0 | 0 |
| C3 | 0 | 0 | 0 | 0 | 0 | 0 | 0 | 0 | 0 | 0 | 0 | 0 | 0 | 0 | 0 | 0 | 0 | 0 | 0 | 0 | 0 | 0 | 0 |
| D1 | 0 | 0 | 0 | 0 | 0 | 0 | 1 | 0 | 0 | 0 | 0 | 1 | 0 | 1 | 0 | 0 | 1 | 0 | 0 | 1 | 1 | 1 | 1 |
| D2 | 0 | 0 | 0 | 0 | 0 | 0 | 0 | 0 | 0 | 0 | 0 | 0 | 0 | 0 | 0 | 0 | 0 | 0 | 0 | 0 | 0 | 0 | 0 |
| D3 | 0 | 0 | 0 | 0 | 0 | 0 | 0 | 0 | 0 | 0 | 0 | 0 | 0 | 0 | 0 | 0 | 0 | 0 | 0 | 0 | 0 | 0 | 1 |
| D4 | 0 | 0 | 0 | 0 | 0 | 0 | 0 | 0 | 0 | 0 | 0 | 1 | 0 | 1 | 0 | 0 | 1 | 0 | 0 | 1 | 1 | 1 | 1 |
| E1 | 0 | 0 | 0 | 0 | 0 | 0 | 0 | 0 | 0 | 0 | 0 | 0 | 0 | 0 | 0 | 0 | 0 | 0 | 0 | 0 | 0 | 0 | 1 |
| E2 | 0 | 0 | 0 | 0 | 0 | 0 | 0 | 0 | 0 | 0 | 0 | 0 | 0 | 0 | 0 | 0 | 0 | 0 | 0 | 0 | 0 | 0 | 0 |
| E3 | 0 | 0 | 0 | 0 | 0 | 0 | 0 | 0 | 0 | 0 | 0 | 0 | 0 | 0 | 0 | 0 | 0 | 0 | 0 | 0 | 0 | 1 | 1 |
| E4 | 0 | 0 | 0 | 0 | 0 | 0 | 0 | 0 | 0 | 0 | 0 | 0 | 0 | 0 | 0 | 0 | 0 | 0 | 0 | 0 | 0 | 0 | 1 |
| E5 | 0 | 0 | 0 | 0 | 0 | 0 | 0 | 0 | 0 | 0 | 0 | 0 | 0 | 0 | 0 | 0 | 0 | 0 | 0 | 0 | 0 | 0 | 1 |
| E6 | 0 | 0 | 0 | 0 | 0 | 0 | 0 | 0 | 0 | 0 | 0 | 1 | 0 | 0 | 0 | 0 | 1 | 0 | 0 | 1 | 0 | 1 | 1 |
| F1 | 0 | 0 | 0 | 0 | 0 | 0 | 0 | 0 | 0 | 0 | 0 | 0 | 0 | 0 | 0 | 0 | 1 | 0 | 0 | 0 | 0 | 1 | 1 |
| F2 | 0 | 0 | 0 | 0 | 0 | 0 | 0 | 0 | 0 | 0 | 0 | 1 | 0 | 1 | 0 | 0 | 1 | 0 | 0 | 1 | 0 | 1 | 1 |
| F3 | 0 | 0 | 0 | 0 | 0 | 0 | 0 | 0 | 0 | 0 | 0 | 1 | 0 | 1 | 0 | 0 | 1 | 0 | 0 | 1 | 1 | 0 | 1 |
| F4 | 1 | 0 | 0 | 0 | 0 | 0 | 0 | 0 | 0 | 0 | 0 | 1 | 0 | 0 | 0 | 0 | 1 | 0 | 0 | 1 | 1 | 1 | 0 |
Appendix D
Table A8.
Reachability matrix.
Table A8.
Reachability matrix.
| A1 | A2 | A3 | B1 | B2 | B3 | C1 | C2 | C3 | D1 | D2 | D3 | D4 | E1 | E2 | E3 | E4 | E5 | E6 | F1 | F2 | F3 | F4 | |
|---|---|---|---|---|---|---|---|---|---|---|---|---|---|---|---|---|---|---|---|---|---|---|---|
| A1 | 1 | 1 | 0 | 1 | 1 | 0 | 1 | 0 | 1 | 0 | 0 | 1 | 1 | 1 | 0 | 0 | 1 | 0 | 0 | 1 | 1 | 1 | 1 |
| A2 | 1 | 1 | 0 | 1 | 1 | 0 | 1 | 0 | 1 | 0 | 0 | 1 | 1 | 1 | 0 | 0 | 1 | 0 | 0 | 1 | 1 | 1 | 1 |
| A3 | 1 | 1 | 1 | 1 | 1 | 0 | 1 | 0 | 1 | 0 | 0 | 1 | 1 | 1 | 0 | 0 | 1 | 0 | 0 | 1 | 1 | 1 | 1 |
| B1 | 1 | 1 | 0 | 1 | 1 | 0 | 1 | 0 | 1 | 0 | 0 | 1 | 1 | 1 | 0 | 0 | 1 | 0 | 0 | 1 | 1 | 1 | 1 |
| B2 | 1 | 1 | 0 | 1 | 1 | 0 | 1 | 0 | 1 | 0 | 0 | 1 | 1 | 1 | 0 | 0 | 1 | 0 | 0 | 1 | 1 | 1 | 1 |
| B3 | 1 | 1 | 0 | 1 | 1 | 1 | 1 | 0 | 1 | 0 | 0 | 1 | 1 | 1 | 0 | 0 | 1 | 0 | 0 | 1 | 1 | 1 | 1 |
| C1 | 1 | 1 | 0 | 1 | 1 | 0 | 1 | 0 | 1 | 0 | 0 | 1 | 1 | 1 | 0 | 0 | 1 | 0 | 0 | 1 | 1 | 1 | 1 |
| C2 | 0 | 0 | 0 | 0 | 0 | 0 | 0 | 1 | 0 | 0 | 0 | 0 | 0 | 0 | 0 | 0 | 0 | 0 | 0 | 0 | 0 | 0 | 0 |
| C3 | 0 | 0 | 0 | 0 | 0 | 0 | 0 | 1 | 1 | 0 | 1 | 0 | 0 | 0 | 1 | 0 | 0 | 0 | 0 | 0 | 0 | 0 | 0 |
| D1 | 1 | 1 | 0 | 1 | 1 | 0 | 1 | 0 | 1 | 1 | 0 | 1 | 1 | 1 | 0 | 0 | 1 | 0 | 0 | 1 | 1 | 1 | 1 |
| D2 | 0 | 0 | 0 | 0 | 0 | 0 | 0 | 0 | 0 | 0 | 1 | 0 | 0 | 0 | 0 | 0 | 0 | 0 | 0 | 0 | 0 | 0 | 0 |
| D3 | 1 | 1 | 0 | 1 | 1 | 0 | 1 | 0 | 1 | 0 | 0 | 1 | 1 | 1 | 0 | 0 | 1 | 0 | 0 | 1 | 1 | 1 | 1 |
| D4 | 1 | 1 | 0 | 1 | 1 | 0 | 1 | 0 | 1 | 0 | 0 | 1 | 1 | 1 | 0 | 0 | 1 | 0 | 0 | 1 | 1 | 1 | 1 |
| E1 | 1 | 1 | 0 | 1 | 1 | 0 | 1 | 0 | 1 | 0 | 0 | 1 | 1 | 1 | 0 | 0 | 1 | 0 | 0 | 1 | 1 | 1 | 1 |
| E2 | 0 | 0 | 0 | 0 | 0 | 0 | 0 | 0 | 0 | 0 | 0 | 0 | 0 | 0 | 1 | 0 | 0 | 0 | 0 | 0 | 0 | 0 | 0 |
| E3 | 1 | 1 | 0 | 1 | 1 | 0 | 1 | 0 | 1 | 0 | 0 | 1 | 1 | 1 | 0 | 1 | 1 | 0 | 0 | 1 | 1 | 1 | 1 |
| E4 | 1 | 1 | 0 | 1 | 1 | 0 | 1 | 0 | 1 | 0 | 0 | 1 | 1 | 1 | 0 | 0 | 1 | 0 | 0 | 1 | 1 | 1 | 1 |
| E5 | 1 | 1 | 0 | 1 | 1 | 0 | 1 | 0 | 1 | 0 | 0 | 1 | 1 | 1 | 0 | 0 | 1 | 1 | 0 | 1 | 1 | 1 | 1 |
| E6 | 1 | 1 | 0 | 1 | 1 | 0 | 1 | 0 | 1 | 0 | 0 | 1 | 1 | 1 | 0 | 0 | 1 | 0 | 1 | 1 | 1 | 1 | 1 |
| F1 | 1 | 1 | 0 | 1 | 1 | 0 | 1 | 0 | 1 | 0 | 0 | 1 | 1 | 1 | 0 | 0 | 1 | 0 | 0 | 1 | 1 | 1 | 1 |
| F2 | 1 | 1 | 0 | 1 | 1 | 0 | 1 | 0 | 1 | 0 | 0 | 1 | 1 | 1 | 0 | 0 | 1 | 0 | 0 | 1 | 1 | 1 | 1 |
| F3 | 1 | 1 | 0 | 1 | 1 | 0 | 1 | 0 | 1 | 0 | 0 | 1 | 1 | 1 | 0 | 0 | 1 | 0 | 0 | 1 | 1 | 1 | 1 |
| F4 | 1 | 1 | 0 | 1 | 1 | 0 | 1 | 0 | 1 | 0 | 0 | 1 | 1 | 1 | 0 | 0 | 1 | 0 | 0 | 1 | 1 | 1 | 1 |
References
- Guo, K.; Yuan, Y.B. Geographic Distribution and Influencinsg Factor Analysis of Green Residential Buildings in China. Sustainability 2021, 13, 12060. [Google Scholar] [CrossRef]
- China Association of Building Energy Efficiency. 2020. Available online: https://www.cabee.org (accessed on 3 November 2023).
- Zhao, L.; Pan, S.Z.; Li, H.B. Research on evaluation index of construction waste management activities under sustainable development. J. Hebei Inst. Archit. Eng. 2022, 40, 155–161. (In Chinese) [Google Scholar]
- Dong, C.Y. Application and advice of whole-process engineering consulting in the field of prefabricated buildings. Sichuan Cem. 2020, 12, 187–188. (In Chinese) [Google Scholar]
- Huang, G.L.; Zhang, C. SNA-based green supply chain risk of prefabricated buildings. J. Civ. Eng. Manag. 2020, 37, 41–49. (In Chinese) [Google Scholar]
- Luo, L.Z.; Shen, Q.P.; Xu, G.Y.; Liu, Y.L.; Wang, Y.J. Stakeholder-Associated Supply Chain Risks and Their Interactions in a Prefabricated Building Project in Hong Kong. J. Manag. Eng. 2019, 35, 05018015. [Google Scholar] [CrossRef]
- Gong, P.S.; Zhang, J.W.; Xiong, F.; Zhang, Y. Determination of the whole process cost of prefabricated building based on component splitting scheme. Constr. Econ. 2020, 41, 76–83. (In Chinese) [Google Scholar]
- An, H.; Kuang, Y.-X.; Yang, W.-J.; Song, L. Analysis of Integration Motivation of Prefabricated Building Supply Chain Based on SEM. J. Civ. Eng. Manag. 2020, 37, 50–56. [Google Scholar]
- Fang, J. Construction Project Engineering Change Control Research. Ph.D. Thesis, Chongqing University, Chongqing, China, 2005. (In Chinese). [Google Scholar]
- Ma, Z.L.; Ma, J.K. Eliminate quantitative incentives for architectural design changes. J. Tongji Univ. (Nat. Sci. Ed.) 2016, 44, 1280–1285. (In Chinese) [Google Scholar]
- Yao, J. Research on the development status of prefabricated buildings, their constraints and countermeasures. Anhui Archit. 2020, 30, 185–187. (In Chinese) [Google Scholar]
- Eisa, H.; Garstenauer, A.; Blackburn, T. Causes of Engineering Change Propagation: An Analysis During Product Lifecycle. Eng. Manag. J. 2018, 30, 3–13. [Google Scholar] [CrossRef]
- Eltaief, A.; Ben Makhlouf, A.; Ben Amor, S.; Remy, S.; Louhichi, B.; Eynard, B. Engineering Change Risk Assessment: Quantitative and qualitative change characterization. Comput. Ind. 2022, 140, 103656. [Google Scholar] [CrossRef]
- Alshdiefat, A.; Aziz, Z. Causes of Change Orders in the Jordanian Construction Industry. J. Build. Constr. Plan. Res. 2018, 6, 234–250. [Google Scholar] [CrossRef]
- Muhsen, H.K.; Rezouki, S.E. The Causes Influencing the Occurrence of Variation Orders in the Construction of Buildings. J. Eng. 2022, 28, 34–53. [Google Scholar] [CrossRef]
- Yana, A.A.G.; Rusdhi, H.A.; AgungWibowo, M. Analysis of Factors Affecting Design Changes in Construction Project with Partial Least Square (PLS). Procedia Eng. 2015, 125, 40–45. [Google Scholar] [CrossRef]
- Burati, J.J.L.; Farrington, J.J.; Ledbetter, W.B. Causes of Quality Deviations in Design and Construction. J. Constr. Eng. Manag. 1992, 118, 34–49. [Google Scholar] [CrossRef]
- Fei, G.; Gao, J.; Owodunni, O.; Tang, X. A method for engineering design change analysis using system modelling and knowledge management techniques. Int. J. Comput. Integr. Manuf. 2011, 24, 535–551. [Google Scholar] [CrossRef]
- Khanh, H.D. Factors causing design changes in Vietnamese residential construction projects: An evaluation and comparison. J. Sci. Technol. Civ. Eng. (STCE) NUCE 2020, 14, 151–166. [Google Scholar] [CrossRef]
- Bassa, M.; Reta, A.; Alyew, A.; Tora, M. Causes and Effects of Design Change in Building Construction Projects in Three Selected Southern Ethiopia Zones. Int. J. Eng. Res. Technol. (IJERT) 2019, 8, 757–761. [Google Scholar]
- Hetal, P.; Tushar, M. Study of Time Delays in Bridge Construction with Specific Context to Delay in Design Approval & Design Changes. Int. J. Eng. Res. Technol. (IJERT) 2018, 7, 432–442. [Google Scholar]
- Yap, J.B.H.; Abdul-Rahman, H.; Wang, C.; Skitmore, M. Exploring the underlying factors inducing design changes during building production. Prod. Plan. Control. 2018, 29, 586–601. [Google Scholar] [CrossRef]
- Du, J.; Jing, H.; Castro-Lacouture, D.; Sugumaran, V. Multi-agent simulation for managing design changes in prefabricated construction projects. Eng. Constr. Archit. Manag. 2019, 27, 270–295. [Google Scholar] [CrossRef]
- Kasoğlu, A.B.; Gölcük, L. Development of an interval type-2 fuzzy sets based hierarchical MADM model by combining DEMATEL and TOPSIS. Expert Syst. Appl. 2017, 70, 37–51. [Google Scholar] [CrossRef]
- Pan, M.; Linner, T.; Pan, W.; Cheng, H.; Bock, T. Influencing factors of the future utilisation of construction robots for buildings: A Hong Kong perspective. J. Build. Eng. 2020, 30, 101220. [Google Scholar] [CrossRef]
- Bali, S.; Bali, V.; Gaur, D.; Rani, S.; Kumar, R.; Chadha, P.; Sharma, Y.; Prakash, C.; Shahare, P.; Khera, G.S.; et al. A framework to assess the smartphone buying behaviour using DEMATEL method in the Indian context. Ain Shams Eng. J. 2023, 102129. [Google Scholar] [CrossRef]
- Banda, W. A proposed DEMATEL based framework for appraising challenges in the artisanal and small-scale mining sector. Resour. Policy 2023, 80, 103172. [Google Scholar] [CrossRef]
- Kashyap, A.; Kumar, C.; Kumar, V.; Shukla, O.J. A DEMATEL model for identifying the impediments to the implementation of circularity in the aluminum industry. Decis. Anal. J. 2022, 5, 100134. [Google Scholar] [CrossRef]
- He, Y.M.; Kang, J.; Pei, Y.L.; Ran, B.; Song, Y.T. Research on influencing factors of fuel consumption on superhighway based on DEMATEL-ISM model. Energy Policy 2021, 158, 112545. [Google Scholar] [CrossRef]
- Manoharan, S.; Pulimi, V.S.K.; Kabir, G.; Ali, S.M. Contextual relationships among drivers and barriers to circular economy: An integrated ISM and DEMATEL approach. Sustain. Oper. Comput. 2022, 3, 43–53. [Google Scholar] [CrossRef]
- Trivedi, A.; Jakhar, S.K.; Sinha, D. Analyzing barriers to inland waterways as a sustainable transportation mode in India: A dematel-ISM based approach. J. Clean. Prod. 2021, 295, 126301. [Google Scholar] [CrossRef]
- Li, H.; Jin, M.; Zhong, X. Research on quantitative analysis method for causal factors of construction accidents based on STAMP model. J. Saf. Sci. Technol. 2020, 16, 169–175. [Google Scholar]
- Vishwakarma, A.; Dangayach, G.S.; Meena, M.L.; Gupta, S. Analysing barriers of sustainable supply chain in apparel & textile sector: A hybrid ISM-MICMAC and DEMATEL approach. Clean. Logist. Supply Chain. 2022, 5, 100073. [Google Scholar]
- Shanker, S.; Barve, A. Analysing sustainable concerns in diamond supply chain: A fuzzy ISM-MICMAC and DEMATEL approach. Int. J. Sustain. Eng. 2021, 14, 1269–1285. [Google Scholar] [CrossRef]
- Priya, S.S.; Jain, V.; Priya, M.S.; Dixit, S.K.; Joshi, G. Modelling the factors in the adoption of artificial intelligence in Indian management institutes. Foresight 2023, 25, 20–40. [Google Scholar] [CrossRef]
- Aziz, R.F. Ranking of delay factors in construction projects after egyptian revolution. Alex. Eng. J. 2013, 52, 387–406. [Google Scholar] [CrossRef]
- Aslam, M.; Baffoe-Twum, E.; Saleem, F. Design Changes in Construction Projects— Causes and Impact on the Cost. Civ. Eng. J. 2019, 5, 1647–1655. [Google Scholar] [CrossRef]
- Alnuaimi, A.S.; Taha, R.A.; Al Mohsin, M.; Al-Harthi, A.S. Causes, Effects, Benefits, and Remedies of Change Orders on Public Construction Projects in Oman. J. Constr. Eng. Manag. 2010, 136, 615–622. [Google Scholar] [CrossRef]
- Afelete, E.; Jung, W. Causes of Design Change Depending on Power Project-Types in Ghana. Energies 2021, 14, 6871. [Google Scholar] [CrossRef]
- Halwatura, R.U.; Ranasinghe, N.P.N.P. Causes of Variation Orders in Road Construction Projects in Sri Lanka. ISRN Constr. Eng. 2013, 2013, 381670. [Google Scholar] [CrossRef]
- Shieh, J.-I.; Wu, H.-H.; Huang, K.-K. A DEMATEL method in identifying key success factors of hospital service quality. Knowledge-Based Syst. 2010, 23, 277–282. [Google Scholar] [CrossRef]
- Chen, P.; Cai, B.; Wu, M.; Zhao, Y. Obstacle analysis of application of blockchain technology in power data trading based on improved DEMATEL–ISM method under fuzzy environment. Energy Rep. 2022, 8, 4589–4607. [Google Scholar] [CrossRef]
- Zhang, Z.M.; Zhang, S.H. A novel approach to multi attribute group decision making based on trapezoidal interval type-2 fuzzy soft sets. Appl. Math Model. 2013, 37, 4948–4971. [Google Scholar] [CrossRef]
- Mendel, J.M.; John, R.I.; Liu, F. Interval type-2 fuzzy logic systems made simple. IEEE Trans. Fuzzy Syst. 2006, 14, 808–821. [Google Scholar] [CrossRef]
- Niazi, G.A.; Painting, N. Significant Factors Causing Cost Overruns in the Construction Industry in Afghanistan. Procedia Eng. 2017, 182, 510–517. [Google Scholar] [CrossRef]
- Zhong, S.; Elhegazy, H.; Elzarka, H. Key factors affecting the decision-making process for buildings projects in Egypt. Ain Shams Eng. J. 2022, 13, 101597. [Google Scholar] [CrossRef]
- Meng, X.; Chan, A.H.; Lui, L.K.; Fang, Y. Effects of individual and organizational factors on safety consciousness and safety citizenship behavior of construction workers: A comparative study between Hong Kong and Mainland China. Saf. Sci. 2021, 135, 105116. [Google Scholar] [CrossRef]
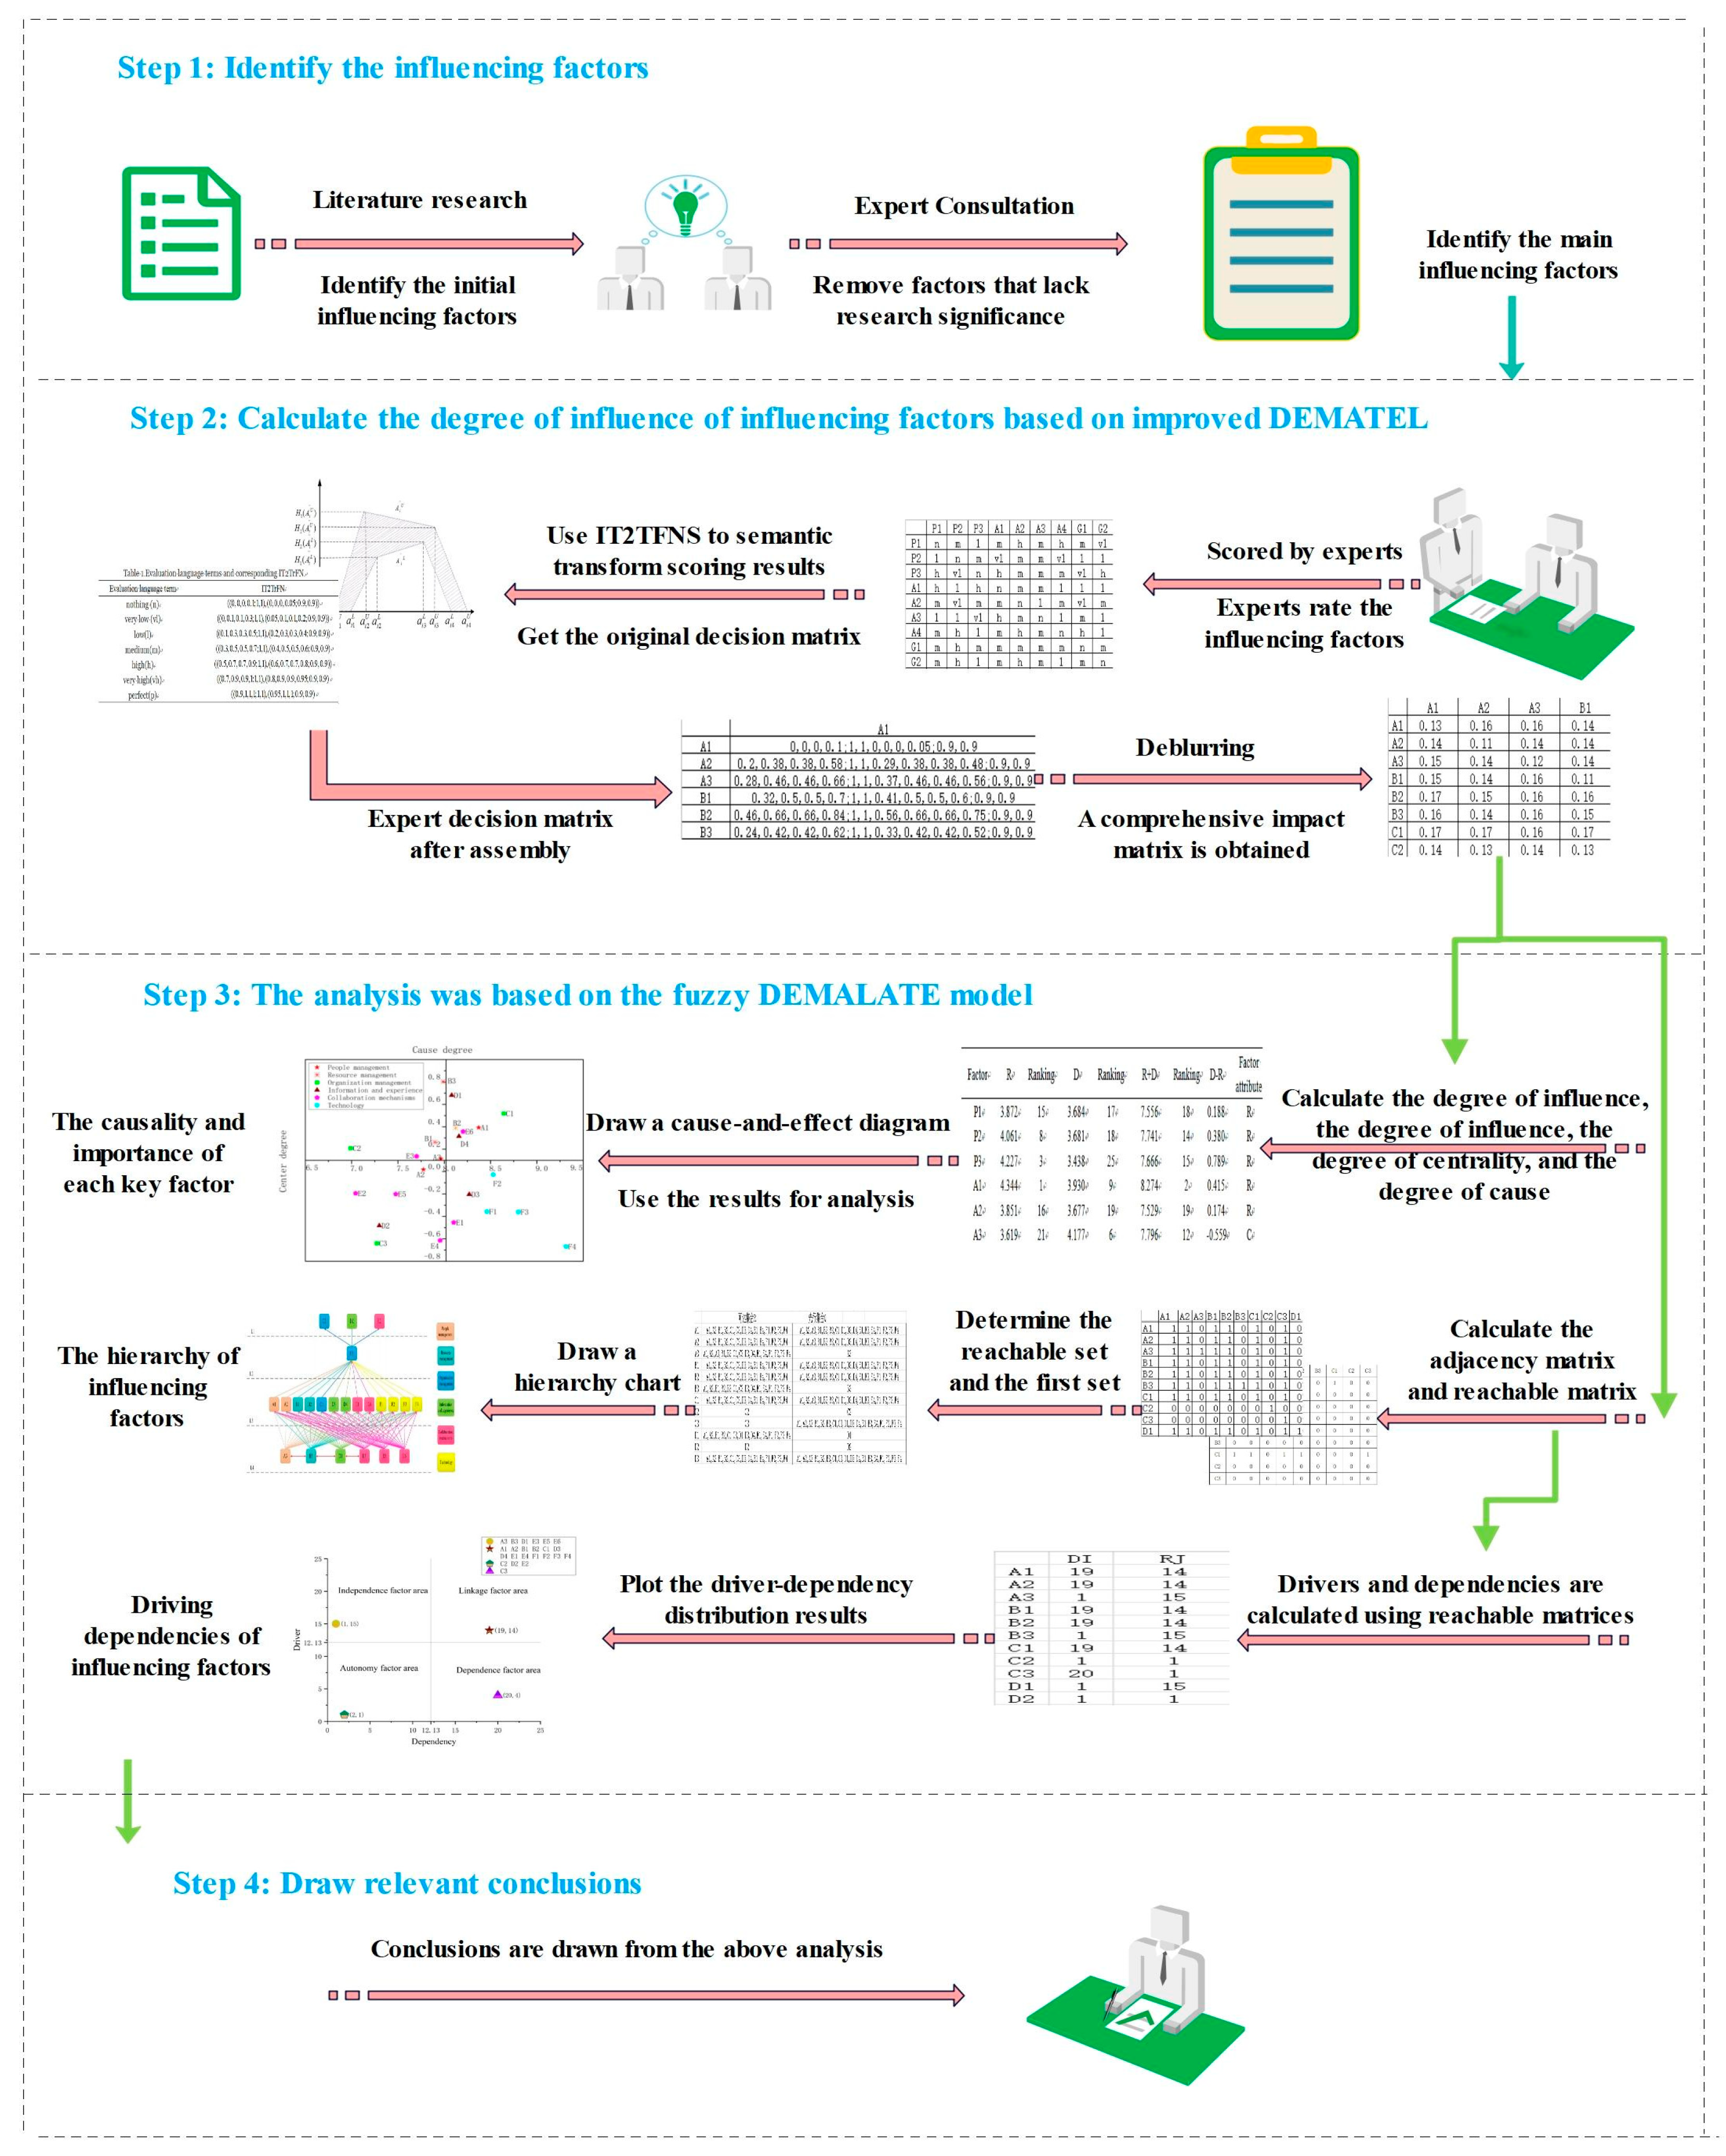
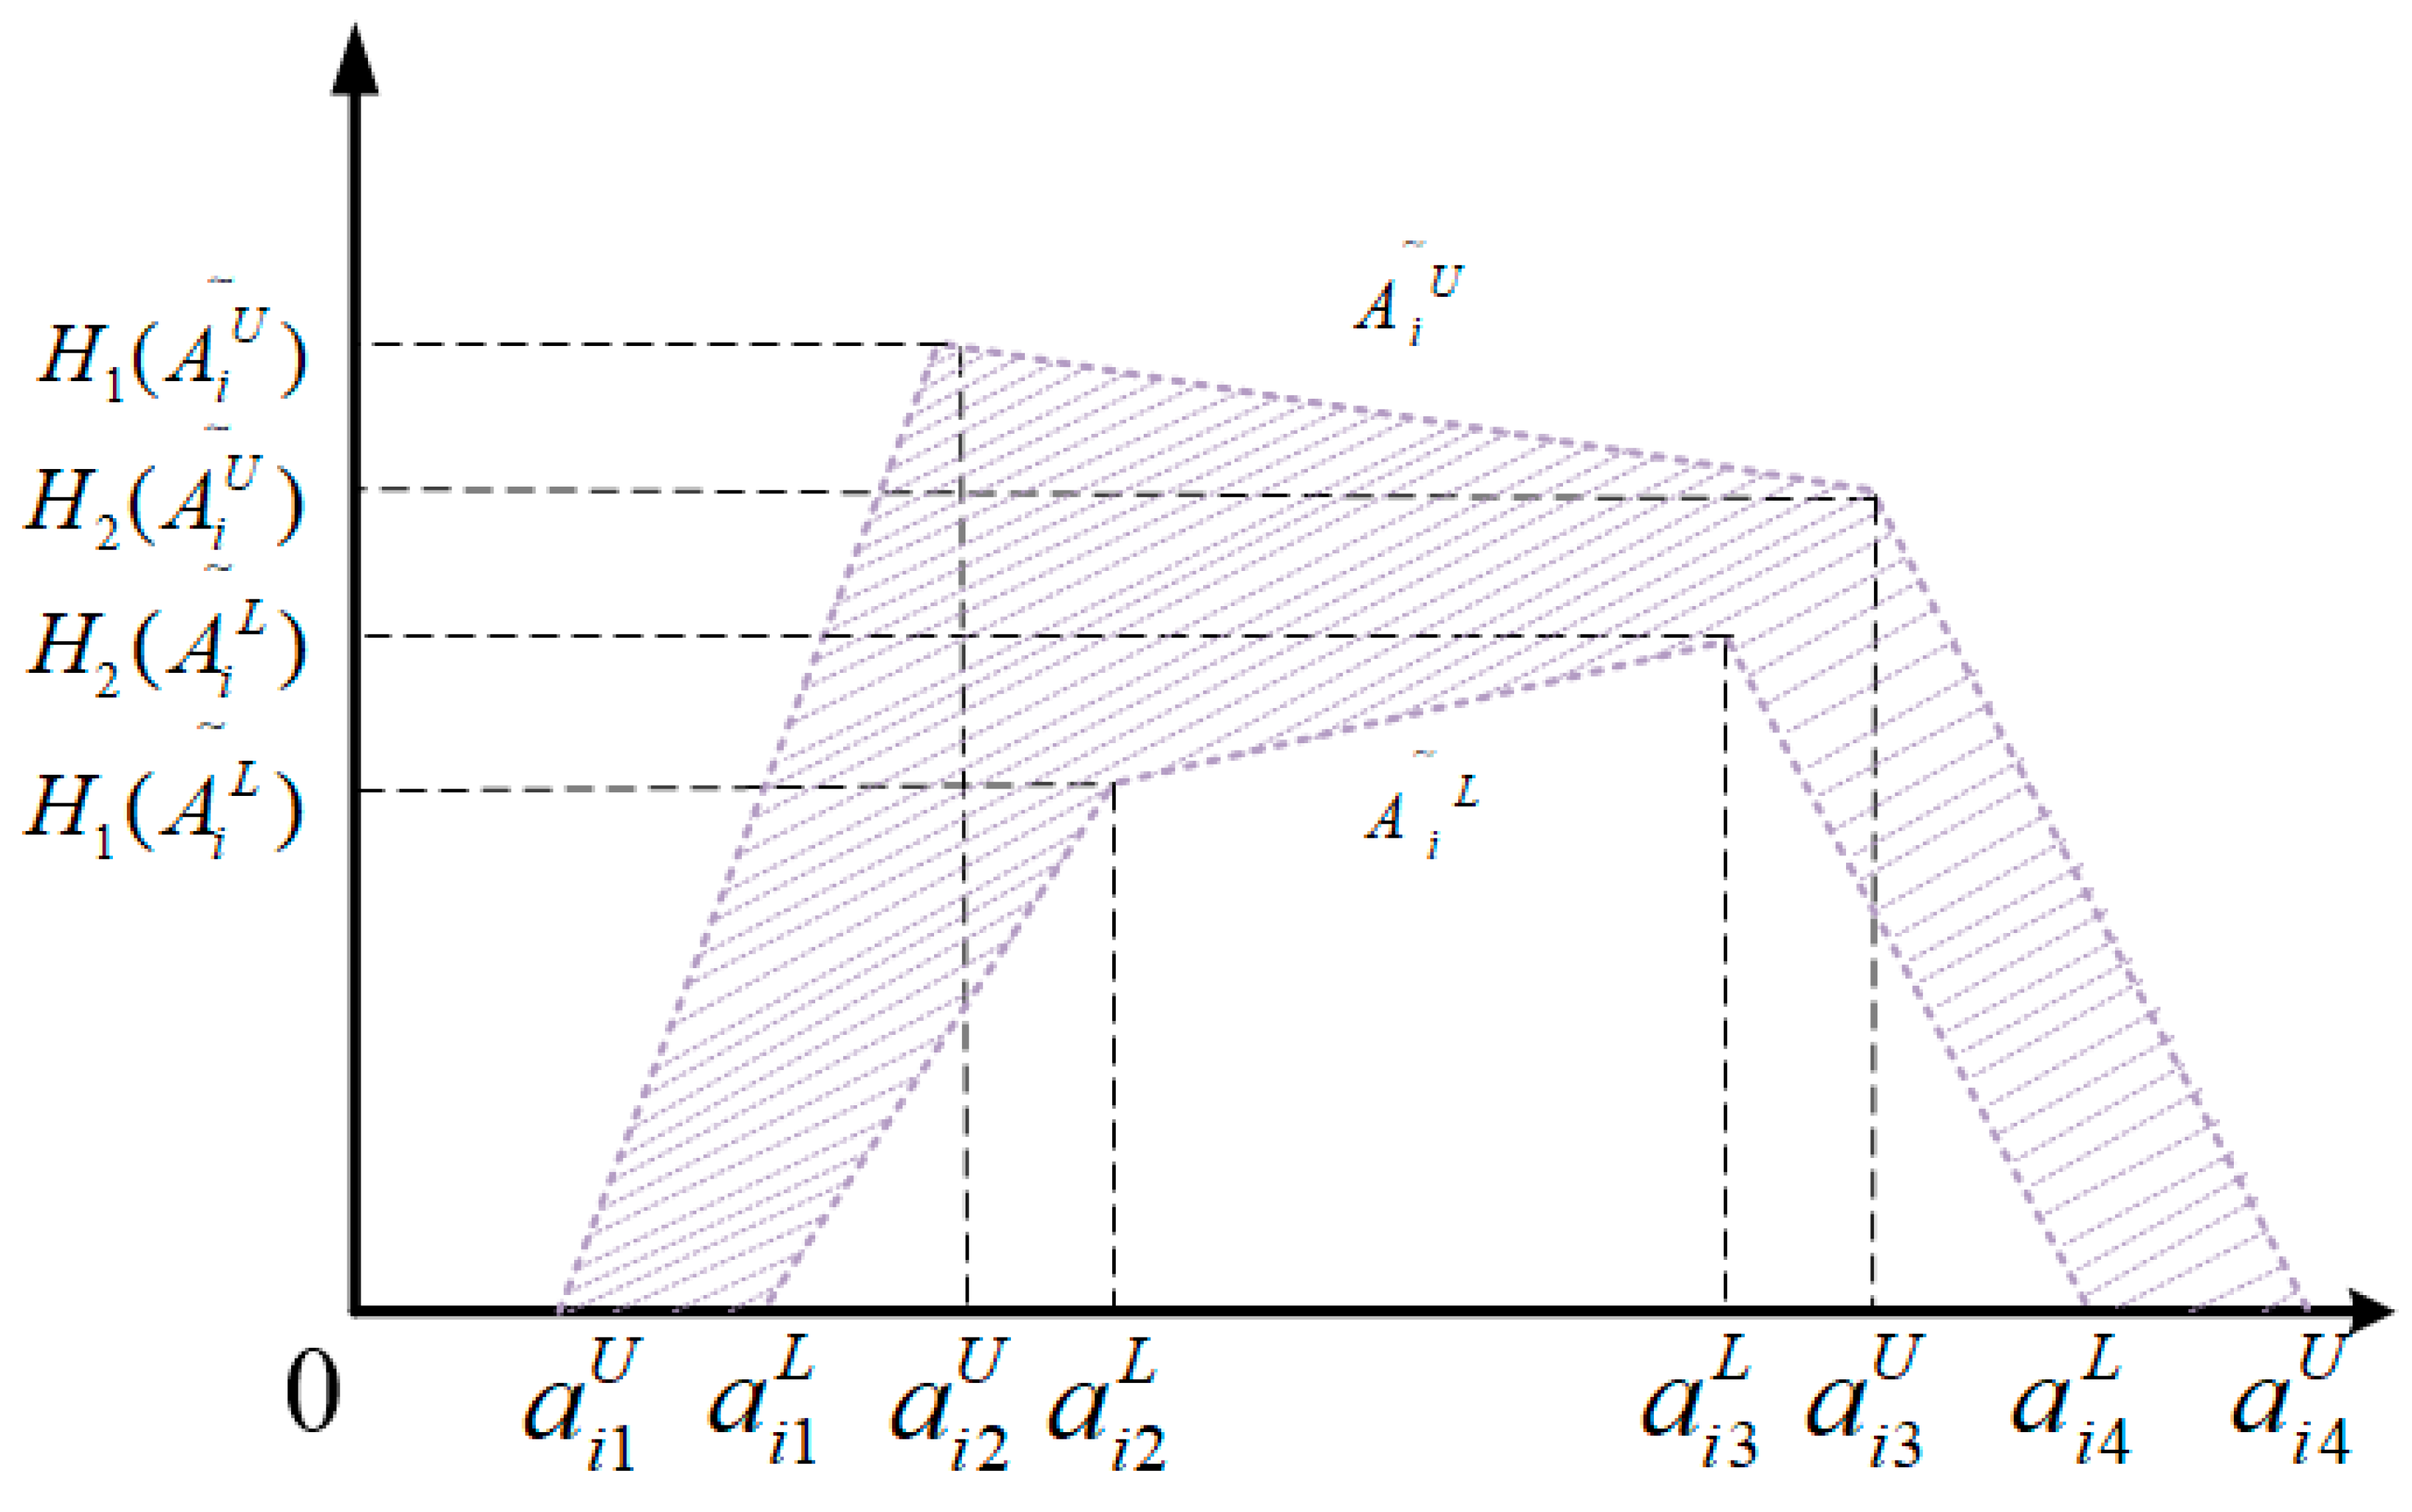
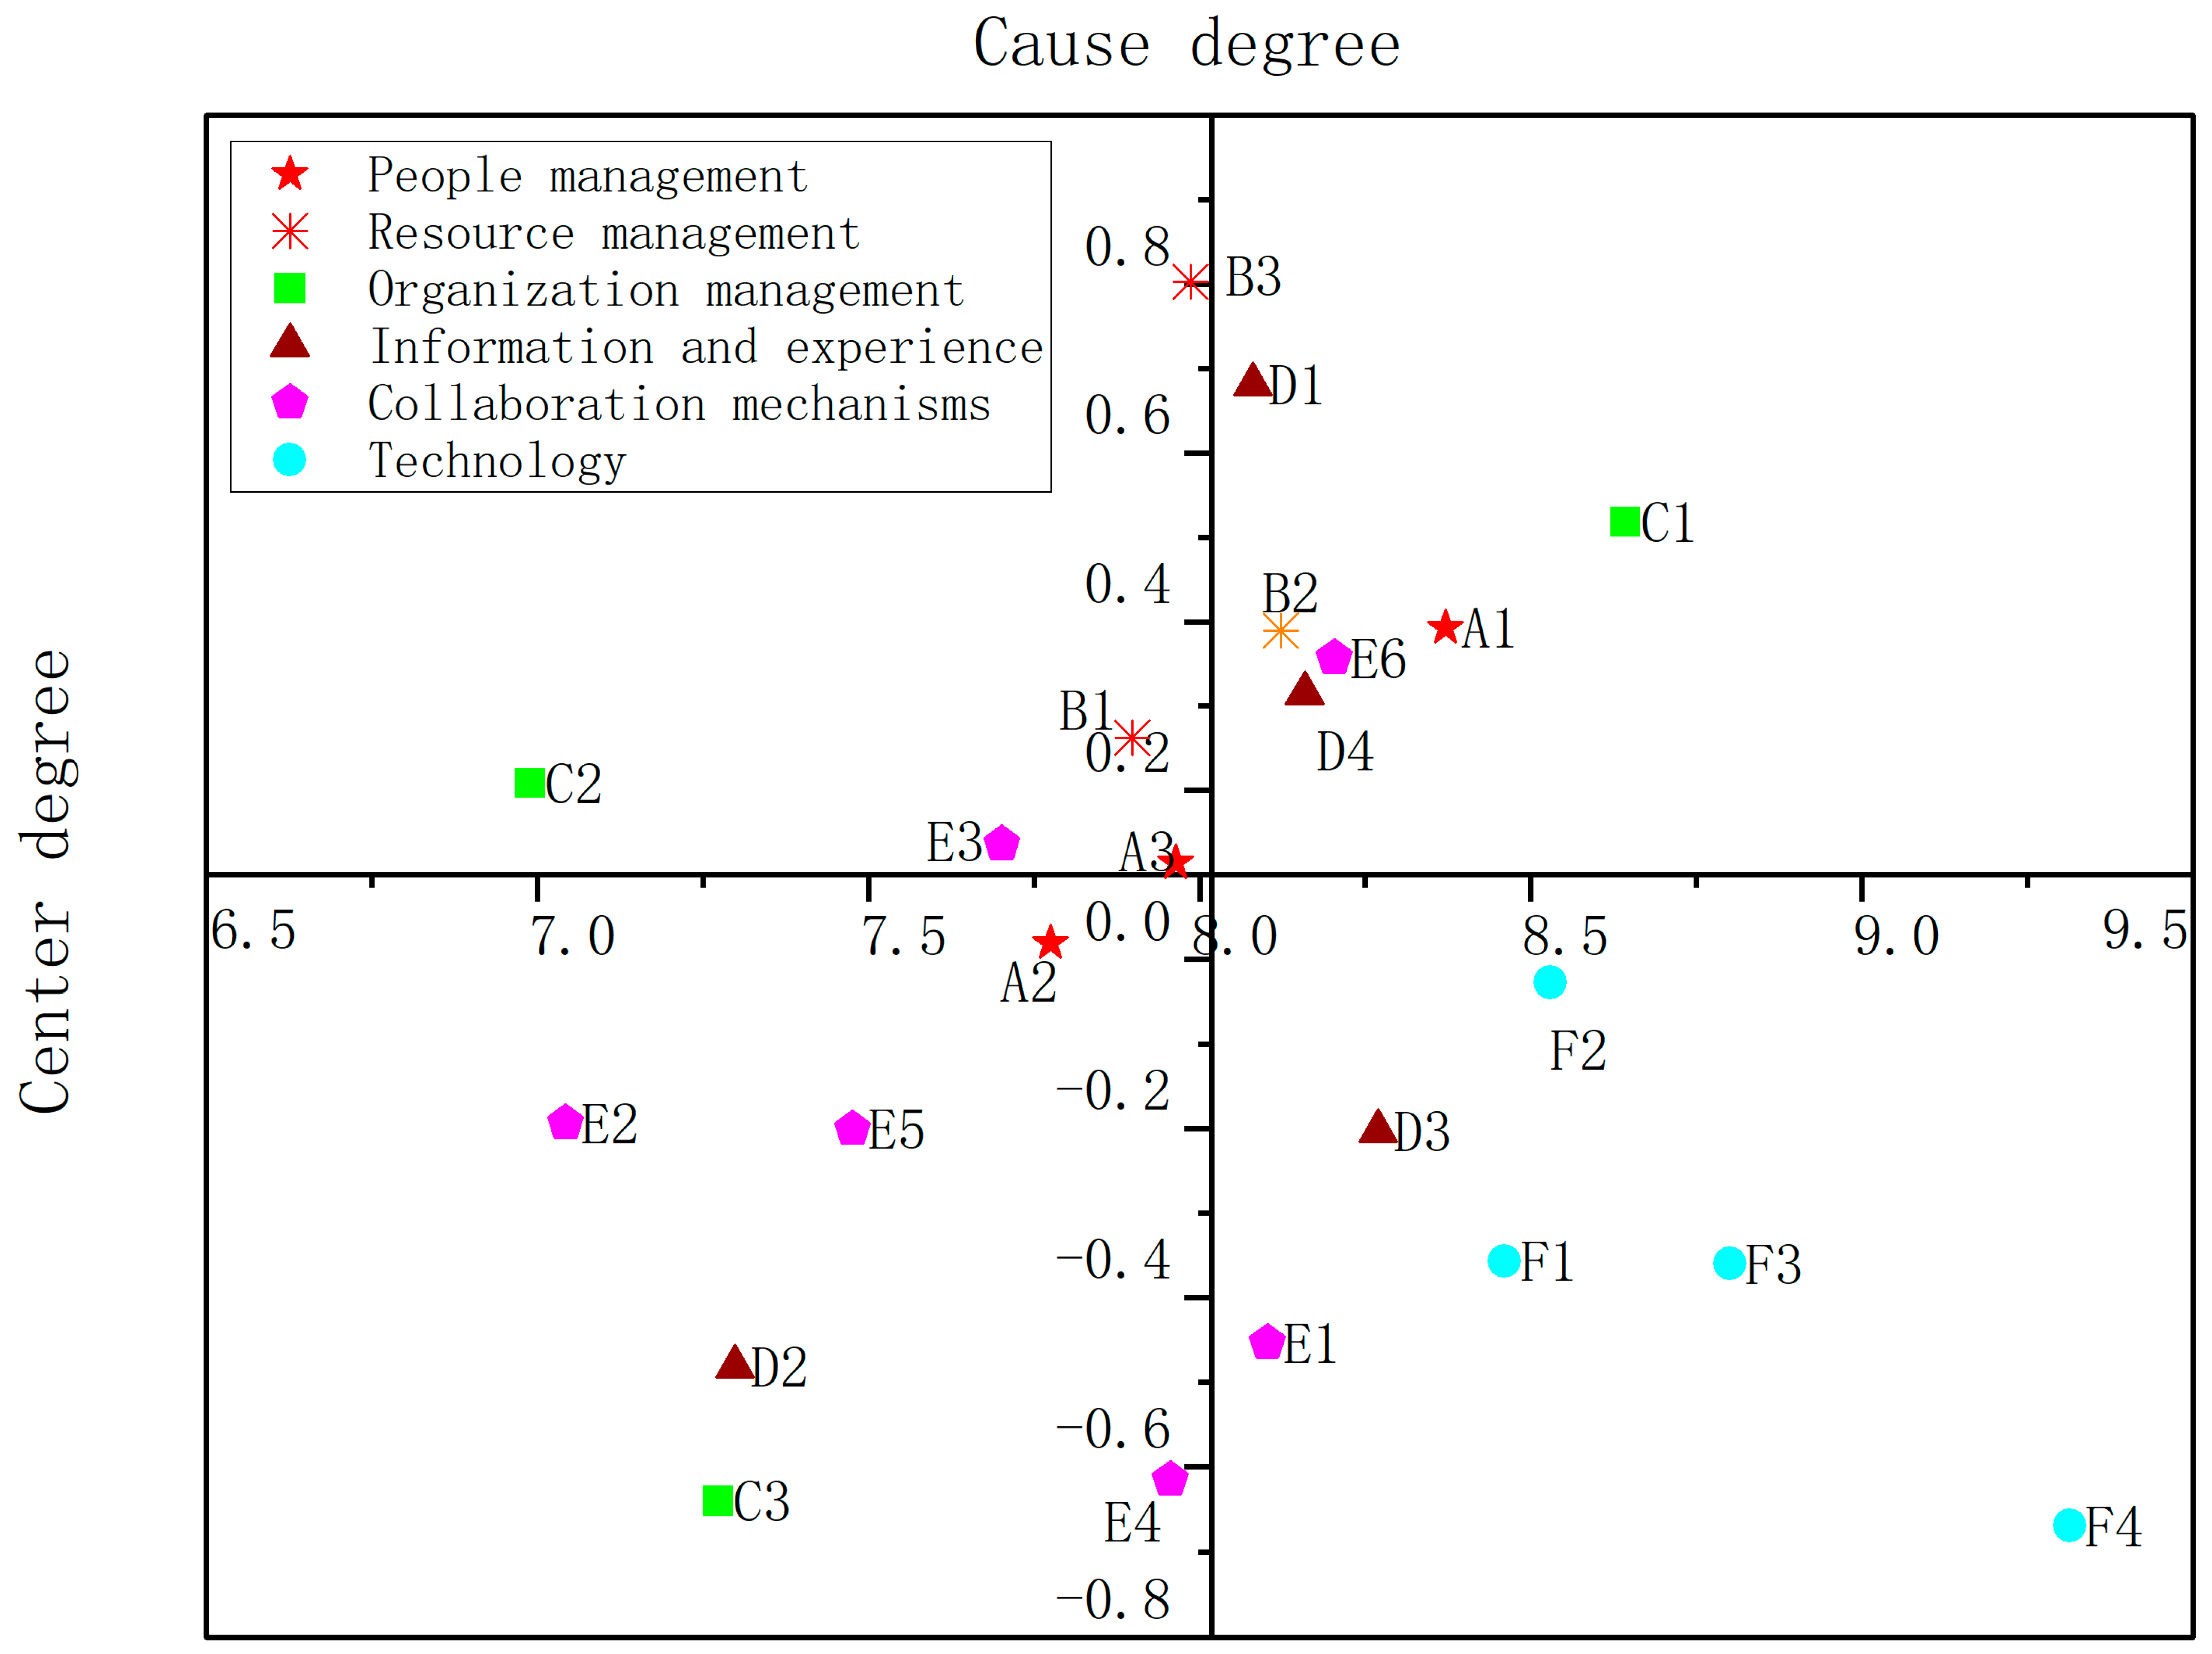
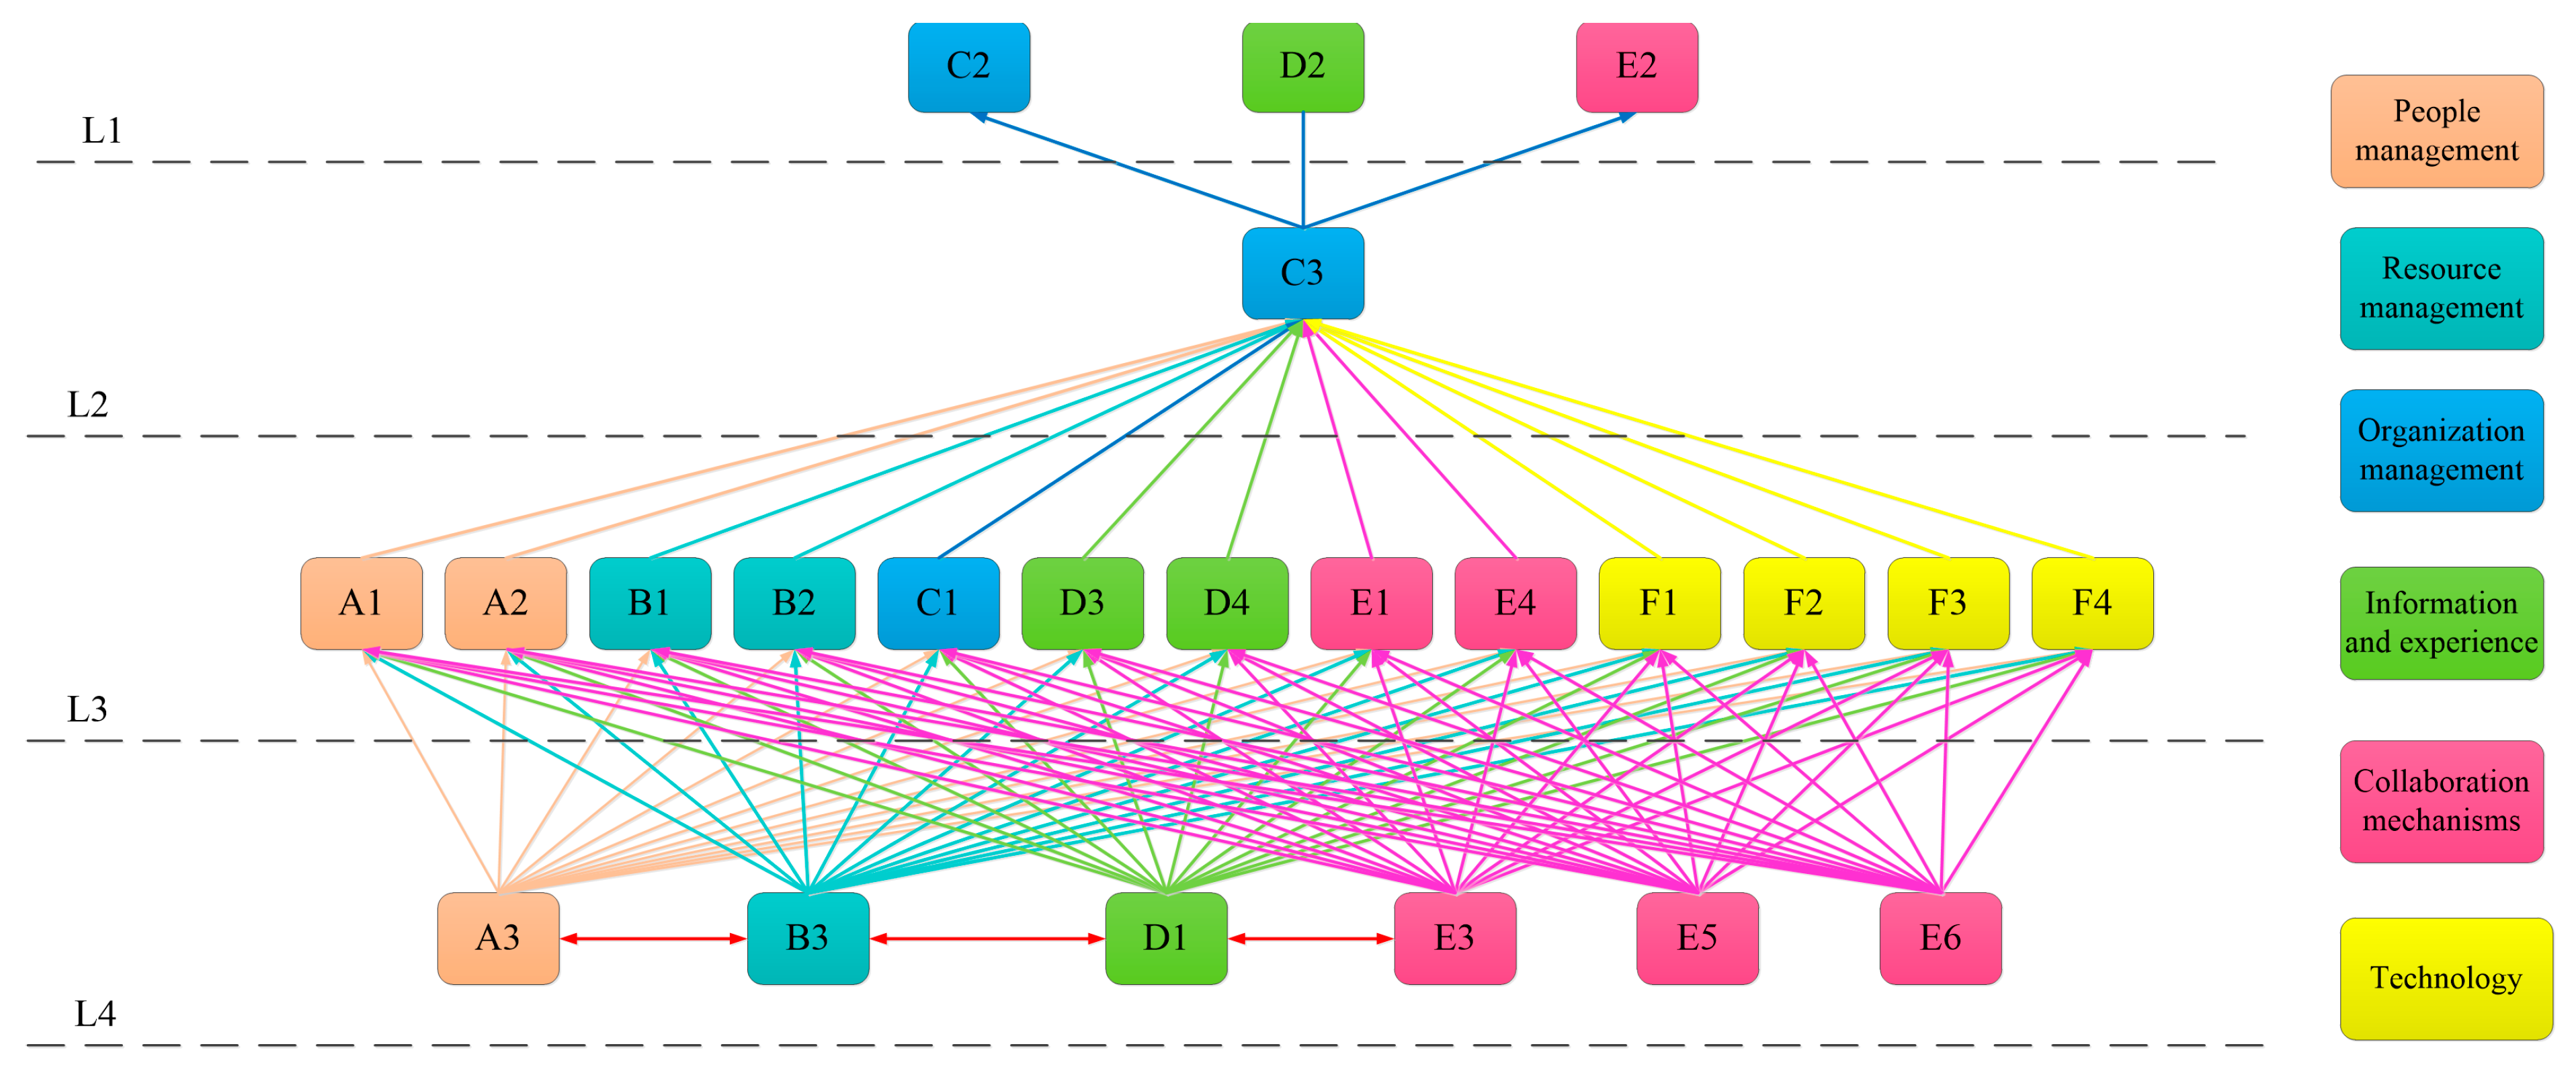
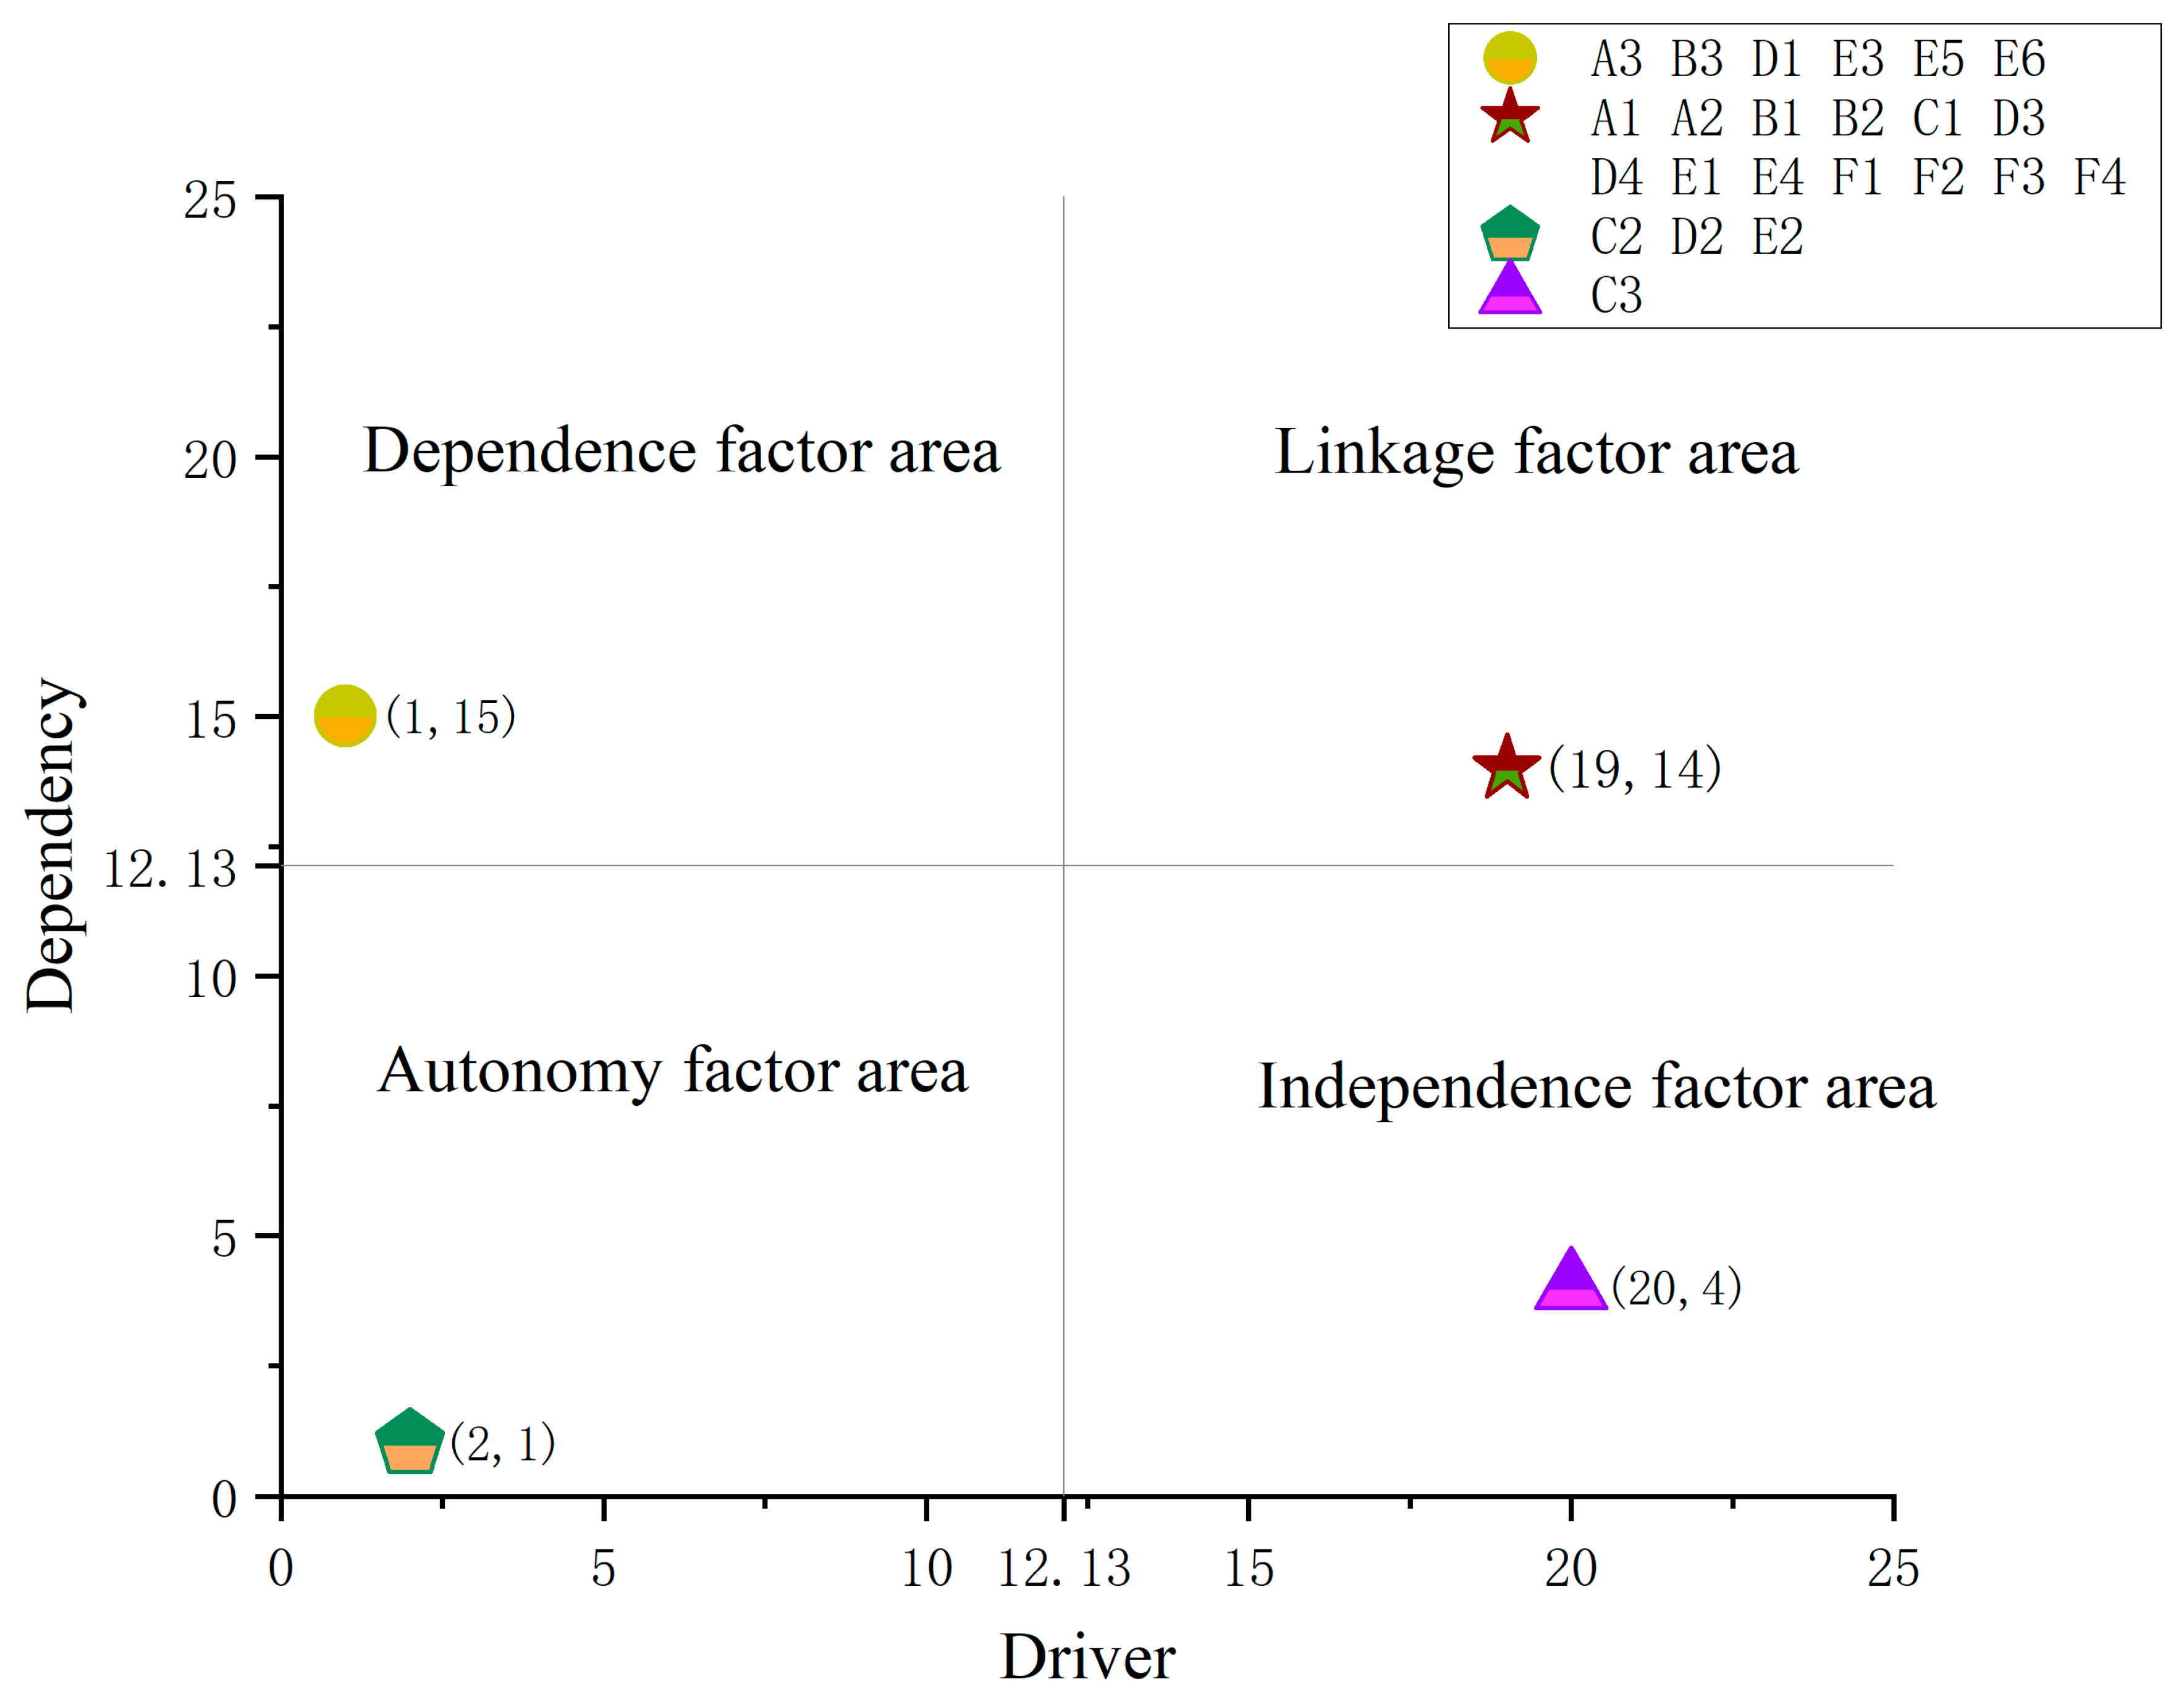
Disclaimer/Publisher’s Note: The statements, opinions and data contained in all publications are solely those of the individual author(s) and contributor(s) and not of MDPI and/or the editor(s). MDPI and/or the editor(s) disclaim responsibility for any injury to people or property resulting from any ideas, methods, instructions or products referred to in the content. |
© 2023 by the authors. Licensee MDPI, Basel, Switzerland. This article is an open access article distributed under the terms and conditions of the Creative Commons Attribution (CC BY) license (https://creativecommons.org/licenses/by/4.0/).