Article

The Influence of Composition Ratio on the Thermal Performance Parameters of Eutectic Phase Change Materials: Experimental Research and Theoretical Prediction

1
China Railway 20th Bureau Group Co., Ltd., Xi’an 710016, China
2
College of Civil Engineering, Xi’an University of Architecture and Technology, Xi’an 710055, China
3
China Construction Standards Design and Research Institute Co., Ltd., Beijing 100048, China
*
Author to whom correspondence should be addressed.
Buildings 2023, 13(12), 3043; https://doi.org/10.3390/buildings13123043
Submission received: 10 October 2023 / Revised: 24 November 2023 / Accepted: 5 December 2023 / Published: 7 December 2023

Abstract

:
Eutectic phase change material (EPCM), compared with single phase change material (PCM), is widely studied by many scholars due to its flexibility in practical engineering applications by the characteristic of changing phase change temperatures. However, there is still a lack of theoretical prediction research on the thermal performance parameters of EPCM. The existing theories about EPCM are unable to accurately predict its thermal performance parameters, which increases the difficulty of selecting the composition ratio of EPCM and affects its practical application. Based on a background of the accurate prediction of EPCM thermal parameters, 12 binary EPCMs, and 7 ternary EPCMs are prepared by mixing capric acid, n-octanoic acid and tetradecane with different proportions, respectively. By using the cooling curves and DSC test, the variation patterns in thermal performance parameters of EPCMs are studied. After comparing various thermodynamic models, the Schrader model was selected and combined with experimental results to compare and calculate the experimental and theoretical values of thermal performance parameters. The results show that the binary PCM reaches the minimum eutectic point of 1.42 °C at a mass ratio of 0.33:0.67 for capric acid to n-octanoic acid, while the ternary PCM reaches the minimum eutectic point of 0.34 °C at a mass ratio of 0.231:0.469:0.3 for capric acid, n-octanoic acid, and n-tetradecane. The latent heat of a EPCM is between the lowest and highest values of the latent heat of the constituent components, and its value increases with the enhancement of the overall thermal storage density of the material. The modified Schrader equations can effectively predict the phase change temperatures and latent heats of EPCMs at different composition ratios. The equation has a fitting accuracy of over 0.986 and a bias error of less than 6%, demonstrating excellent accuracy and providing a reliable theoretical basis for the proportion design and thermal parameter prediction of EPCM in actual engineering applications.

1. Introduction

In recent years, due to the excessive use of fossil fuels, the energy crisis and greenhouse effect have become global issues [1]. In response to this problem, scientists have proposed many solutions, among which latent heat thermal storage (LHTES) technology based on the use of phase change material (PCM) is the most effective one [2]. The principle of LHTES is to store excess heat energy when the temperature rises, and release the stored heat energy when the temperature drops, through the heat storage and release characteristics of PCM. Thus, during the temperature change process, the entire system can maintain the predetermined target temperature with lower energy consumption. At present, this technology, which has high engineering application value, is widely applied in industrial heat recovery, light emitting diode, building, and low-temperature cold storage [3,4,5,6,7]. Conducting in-depth research and application on PCM and latent heat storage technology can effectively solve the problem of energy imbalance between space and time, improve the efficiency in thermal energy utilization during the production process, and reduce energy consumption across various industries. Thus, the severe energy crisis and environmental issues facing humanity today can be effectively alleviated.
PCMs used in LHTES can be divided into three types according to the application directions: low temperature, medium temperature, and high temperature [8]. Among them, low-temperature PCM has a significant application demand in cold storage air conditioning, cold chain transportation, and low-temperature preservation, and the existing development depth is the shallowest, with the widest research prospects [9,10]. In addition, low-temperature PCM can also be divided into solid-liquid PCM, liquid-gas PCM, and solid-solid PCM according to the type of phase change [11]. Among them, liquid-gas PCM and solid-solid PCM have the disadvantages of excessive volume change and low latent heat during phase change, which are not conducive to practical application. Therefore, solid-liquid PCM is the most commonly used material type among them. Moreover, the commonly used solid-liquid PCM can be divided into three types based on their chemical composition: organic PCM, inorganic PCM, and eutectic PCM (EPCM) [12]. Inorganic phase change materials have advantages such as low cost and good thermal conductivity, but their phase change temperature is usually high and not suitable for low-temperature latent heat storage technology [13,14]. Organic PCM not only offers the advantages of high phase change latent heat, low corrosiveness, and high chemical stability, but also has a wider range of selectable phase change temperatures [15]. However, the phase change temperature of a single organic PCM is still immutable, making it difficult to flexibly adapt to the needs of actual latent heat storage technology. Therefore, preparing EPCM from various organic PCMs through melt blending can flexibly change the phase change temperature of the material while inheriting the advantages of organic PCM, in order to better integrate with practical engineering applications [16].
Due to the promising application prospects and the flexible ability for adjusting phase change point, low-temperature EPCMs have been widely studied by scholars. Philip [17] prepared a high thermal conductivity eutectic phase change cold storage material using lauryl alcohol and hexadecyl alcohol. When the mass ratio of lauryl alcohol to hexadecyl alcohol is 80:20, the binary PCM exhibits a phase change temperature of 20.01 °C and a phase change latent heat of 191.63 J/g. Zhou [18] produced a low-temperature EPCM by using a binary eutectic mixture of octanoic acid and myristic acid (OA-MA) as the base liquid and expanded graphite EG as the structure. With the mass ratio of OA-MA to EG being 93:7, the phase change temperature of OA-MA/EG is 6.8 °C, the latent heat is 136.3 J/g. Ke [19] obtained a series of multicomponent fatty acid eutectic compounds using five fatty acids such as capric acid (CA), lauric acid (LA), cinnamic acid (MA), palmitic acid (PA), and stearic acid (SA) through theoretical calculations using the Schrader equation. The mass ratio of eutectic fatty acids was analyzed and verified through eutectic phase diagrams and differential scanning calorimetry (DSC). The research results indicate that the phase change temperature and hot melting of the prepared fatty acid eutectic gradually decrease with the increase of component fraction in the mixture.
Although many scholars have achieved significant results in studying the performance of EPCM. However, in order to meet the increasingly complex requirements in practical applications, the number of components in EPCM is also increasing. This makes it extremely difficult to implement the original exhaustive method, which uses the DSC method to measure the thermal parameters of EPCM within the full range to determine the required composition ratio. However, existing thermodynamic theories cannot accurately and quickly predict the performance parameters of EPCM under multi-component conditions. This issue increases the difficulty of selecting the mix proportion in EPCM in engineering and also hinders its practical application. In this context, this article prepared low-temperature multicomponent EPCM using three organic PCMs: capric acid, n-octanoic acid, and n-tetradecane as raw materials. The thermal performance of EPCM was studied through methods such as cooling curve and DSC, and based on this data, an appropriate thermal performance parameter prediction model was proposed to provide theoretical support for the selection of EPCM mix proportions and performance prediction in practical engineering.

2. Materials and Methods

2.1. Raw Materials

In this research, capric acid (AR, 99% purity), n-octanoic acid (AR, 99% purity), and n-tetradecane (AR, 98% purity) are all produced by McLean Biochemical Technology Co., Ltd., Shanghai, China, and the thermal and chemical properties of these three raw materials are given in Table 1.

2.2. Preparation of EPCMs

2.2.1. Mix Proportions of EPCMs

According to existing research [20], the preparation of multi-component EPCM should be carried out sequentially from low to high number of components. Therefore, binary PCM was initially prepared by mixing capric acid and n-octanoic acid, and then a certain amount of binary PCM was melted and blended with n-tetradecane to prepare ternary EPCM. To cover the lowest eutectic point of the material as much as possible, the mass fraction of capric acid, n-octanoic acid, n-tetradecane, and binary PCM varies from 20% to 80% when preparing EPCM [21]. Based on this, the composition ratios of binary PCM and ternary PCM were designed and listed in Table 2 and Table 3.

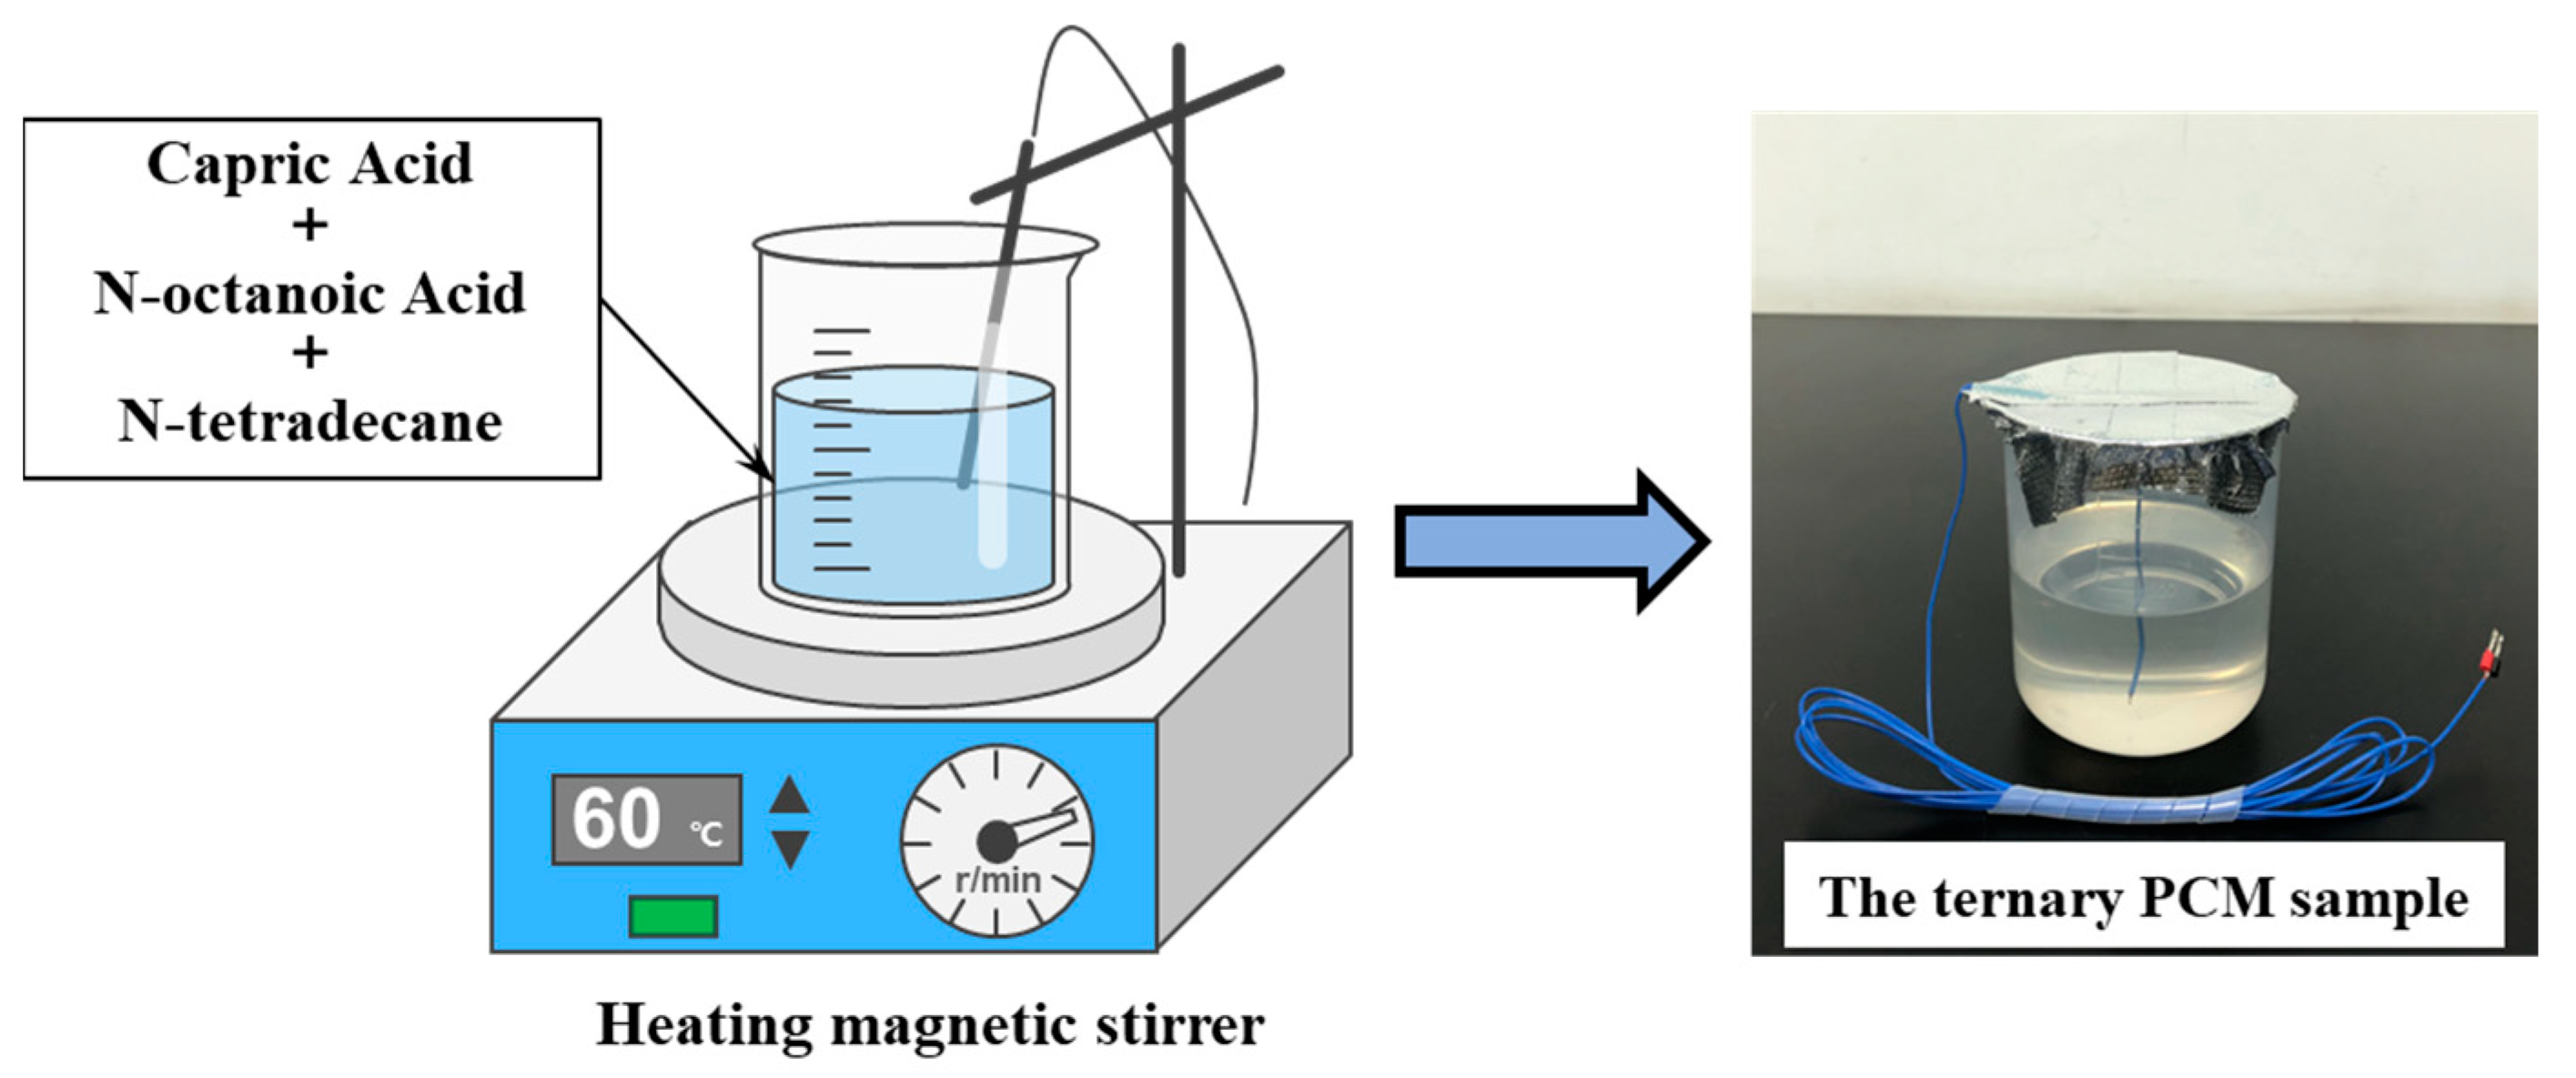
2.2.2. Preparation Methods of EPCMs

According to the data in Table 2, a specific quantity of capric acid and n-octanoic acid is measured and transferred into separate beakers. Then, the DF-101T constant temperature heating magnetic stirrer manufactured by Shanghai Lichen Bangxi Instrument Technology Co., Ltd. (Shanghai, China) is used to heat these two beakers to 60 °C. Subsequently, the heated capric acid is transferred into n-octanoic acid using a glass rod. Finally, the mixture is heated in a water bath at 60 °C and stir for 1 h to complete the preparation of binary PCM. After the above steps are completed, the quantitative binary PCM is heated according to the mixing ratio shown in Table 3 to 40 °C and transferred to n-tetradecane using a glass rod. Next, the mixture was continuously heated and stirred at 40 °C for 1 h to obtain a stable ternary PCM temperature measurement sample (as shown in Figure 1). During the preparation of all EPCM, the rotor speed of the magnetic stirrer was set to 1300 rpm [22].

2.3. Experimental Methods

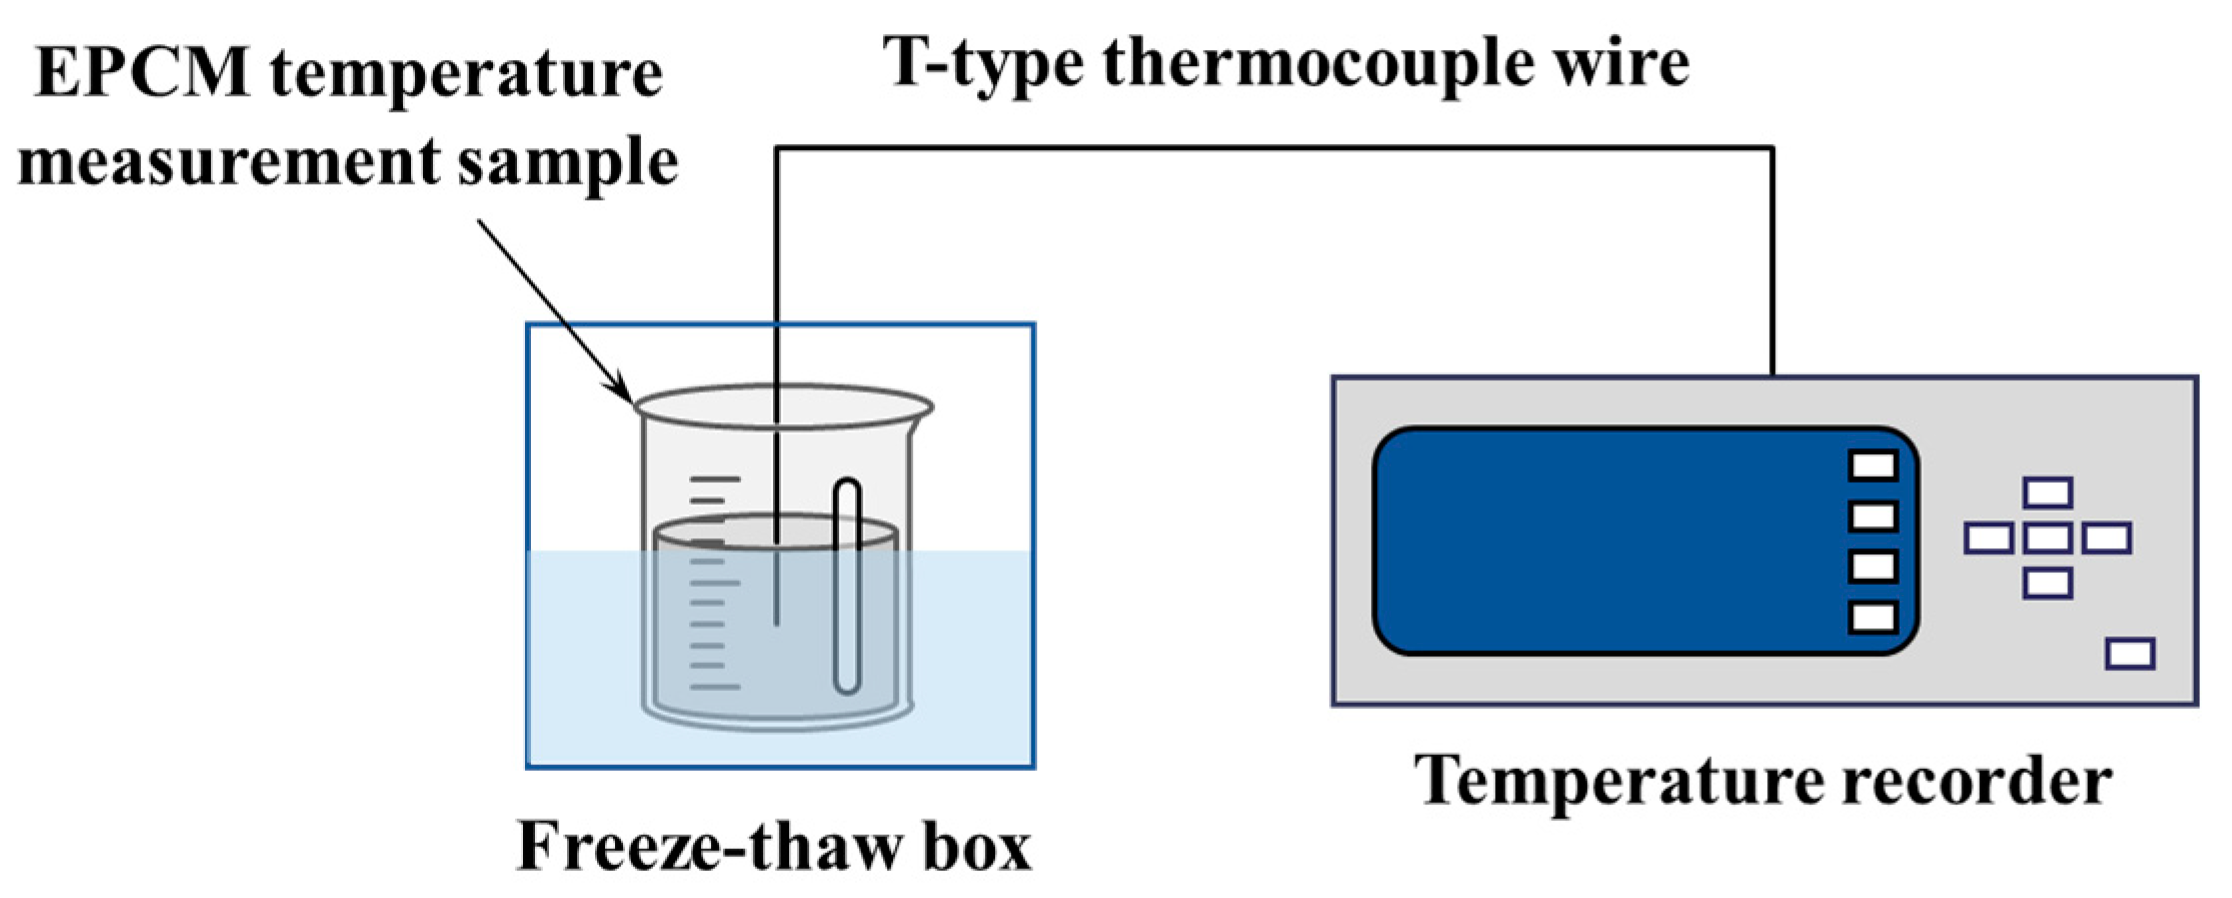
2.3.1. Cooling Curve Test
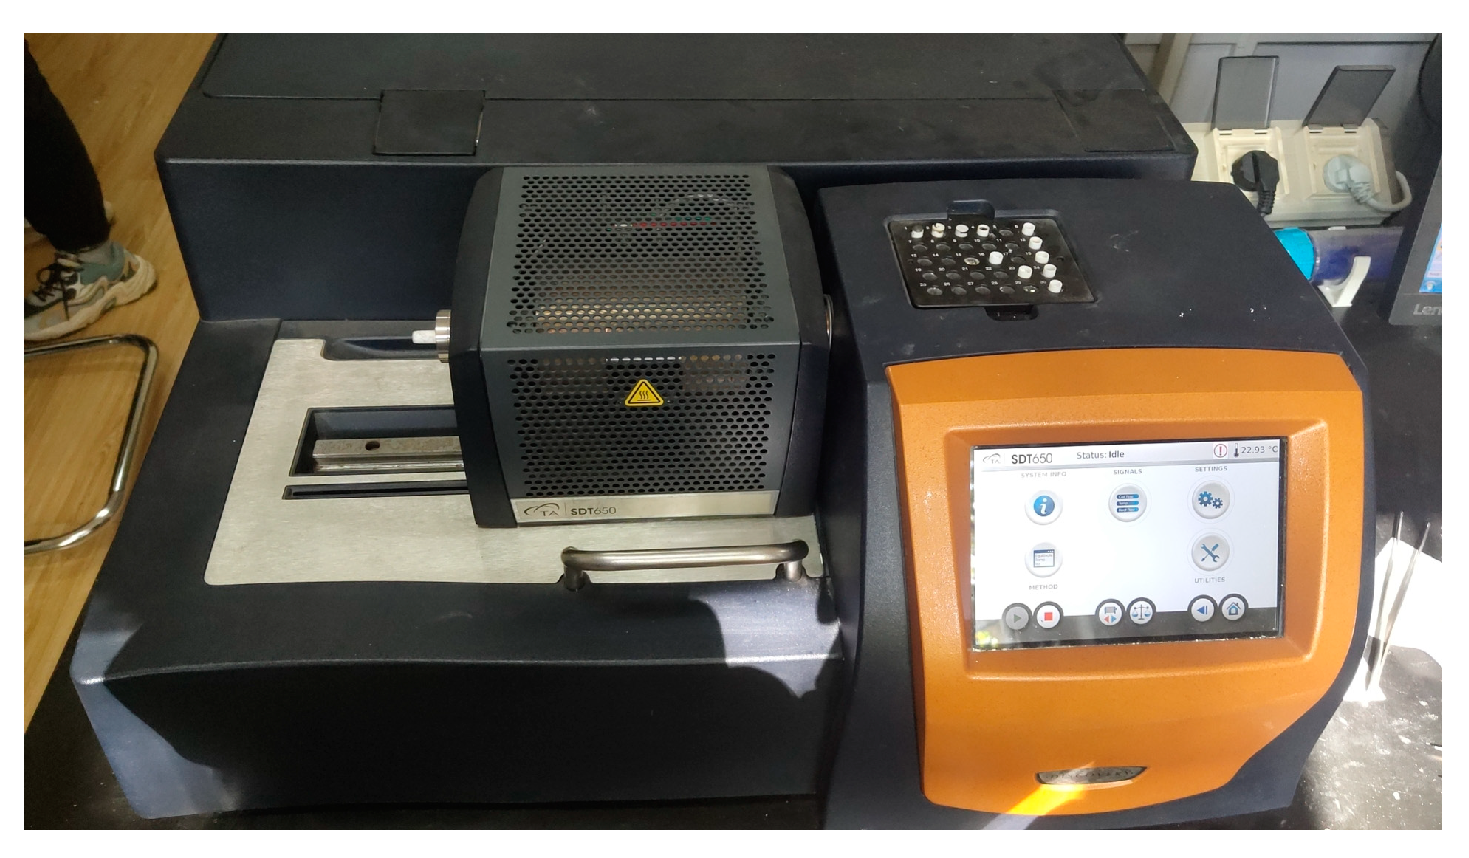
The cooling curve test is a method used to measure temperature changes during material cooling at a constant low temperature, which can easily and quickly compare the phase change temperature differences of EPCM under different composition ratios. This method can determine the composition ratio of the eutectic mixture at the lowest eutectic point in less time and at lower cost by reducing the frequency of DSC testing. Before the start of testing, for each EPCM groups, 200 g of sample is taken and placed in a plastic beaker. A T-shaped thermocouple wire is inserted into the center of the material to measure the temperature value, and the insulated aluminum foil tape is then used to secure the thermocouple wires and seal the beaker. All T-type thermocouple wires are calibrated in a 40 °C water bath according to the method described in reference [23]. Before installing thermocouples, one should collect a set of calibration data and complete secondary calibration after the experiment is completed to confirm consistency. After the prepared temperature test sample is heated in a water bath to 40 °C, it is then transferred to a TDR-28 rapid freeze-thaw box (manufactured by Gangyuan Testing Instrument Factory in Tianjin, China) for cooling. During the cooling period, a SH-X multi-channel temperature recorder was used to record the temperature fluctuations of all of the samples (as shown in Figure 2). The data collection interval is 15 s, and the phase change temperature value of the samples are taken as the average difference between five consecutive data points, ensuring that it does not exceed 0.1 °C [24].

2.3.2. DSC Analysis

Differential scanning calorimetry (DSC) is a testing technique used to measure the amount of heat absorbed or released by a substance during its phase change process. In this article, the TA SDT 650 thermal analyzer (as shown in Figure 3), manufactured by TA Instruments, New Castle, DE, USA, is used for DSC analysis of EPCMs to obtain accurate thermal performance parameters, including melting point, crystallization point, and melting enthalpy, for each sample. Before the test begins, the DSC instrument is calibrated according to the method described in reference [25]. A total of 3 mg of indium is placed in an aluminum dish and sealed tightly. A stamped empty disk is added as a reference group. Two sets of samples are heated from 40 °C to 200 °C at a heating rate of 10 °C/min, and then cooled down to 100 °C at a cooling rate of 10 °C/min. During this period, the nitrogen volume flow rate is set to 50 mL/min. After repeating this process twice, the thermal parameter deviation and thermal parameter repeatability of the DSC instrument are calibrated based on the two scanning results of the reference material. At the beginning of the test, each sample is placed in a pure aluminum sealed dish and the container is filled with argon gas. Subsequently, the sample is gradually heated from an initial temperature of −30 °C to 30 °C at a heating rate of 5 °C/min. Finally, the sample is cooled to −30 °C at the same rate of temperature change and terminate the test. The DSC results are processed using the method described in reference [26] to obtain the accurate phase transition temperature and enthalpy of EPCM, and the accuracy of the results meets the requirements [27].

2.3.3. FTIR Analysis

The chemical composition of a EPCM sample is analyzed by using the BRUKER TENSOR 27 Fourier transform infrared spectrometer, manufactured by Bruker Corporation, Billerica, MA, USA, to evaluate the chemical stability. Before starting the test, the samples should be thoroughly dried in an oven at 100 °C ± 5 °C for 24 h. Additionally, the scanning frequency and resolution of the spectrometer should be set to 64 and 4 cm−1, respectively.

2.3.4. Thermodynamic Model

Generally speaking, the thermodynamic model of a multicomponent eutectic mixture can be described by the Gibbs solid-liquid equilibrium equation proposed in references [28,29], as shown in Equation (1):
ln x i γ i = Δ H i R T i ( T i T 1 ) + Δ c p , i R ( ln T i T + T i T 1 )
where x i , γ i , Δ H i , T i , and Δ c p , i represent the molar fraction, activity coefficient, melting enthalpy, melting point, and solid-liquid specific heat difference of each of the component i in the eutectic mixture, respectively; R is the general gas constant; and T is the overall melting point of the eutectic mixture.
For the basic solid-liquid equilibrium equations mentioned above, many scholars have made different parameter modifications and studies based on different perspectives to obtain more suitable thermodynamic models. The main models studied are as follows:
(1)
Wilson Model
The Wilson model calculates the activity coefficients in the Gibbs equation using local concentrations represented by volume fractions to correct the results [30]. The activity coefficient equation obtained is as follows:
ln γ i = 1 ln ( j = 1 c Λ i j x j ) k = 1 c Λ k i x k k = 1 c Λ k j x j
where Λ is the Wilson equation parameter, which is used to revise the model result. The calculation method of Λ is given by Equations (3)–(7):
Λ i j = V j V i exp ( λ i j λ i i R T )
Λ j i = V i V j exp ( λ j i λ j j R T )
λ i i = 2 Z ( Δ H i R T )
λ j j = 2 Z ( Δ H j R T )
λ j i = λ i j = λ j j
where V i and V j are the liquid phase molar volumes of the components i and j , respectively, (L/mol); λ is the intermolecular interaction energy (J/mol); and Z is the coordination number of the central molecule, usually considered to be 10. From the above equation, it can be seen that the Wilson model has a relatively accurate estimation of γ i and is suitable for completely miscible eutectic systems. However, due to the fact that the parameters Λ need to be accurately estimated in a stable liquid phase, the Wilson model will not be able to perform calculations in partial eutectic systems.
(2)
NRTL Model
The NRTL model introduces multiple non-random parameters on the basis of the Wilson model to further simulate the actual mixed eutectic process [31,32]. The calculation equation is as follows:
ln γ i = j = 1 c τ j i G j i x j k = 1 c G k i x k + j = 1 c G i j x j G k i x k ( τ i j i = 1 c τ i j G i j x i k = 1 c G k j x k )
τ j i = g j i g j j R T
G j i = exp ( α j i τ j i )
where the g is similar to the parameter Λ in the Wilson equation and is used to characterize the Gibbs energy of interactions between different molecules; and α is a parameter used to describe the non-randomness of eutectic mixtures, generally taken as a = 0.3 in the absence of experimental data; By introducing non-random parameters, the calculation accuracy of the NRTL model is higher than that of the Wilson model. Moreover, the NRTL model can be used in situations where the mixture is partially miscible, with a wider applicability. However, in practical calculations, determining the value of α requires a large amount of experimental data to support it. Therefore, in the absence of experimental data, the high accuracy of the NRTL model only remains theoretical, which makes the practical application of the NRTL model quite difficult.
(3)
UNIQUAC Model
The UNIQUAC model divides the factors that affect the activity coefficient into binding and residual factors based on the different molecular structures in eutectic mixtures, and also divides the activity coefficient into combination activity coefficient and residual activity coefficient [33]. The calculation equation is as follows:
ln γ i = ln γ i C + ln γ i R
ln γ i C = ln φ i x i + Z 2 q i ln θ i φ i + l i φ i x i j = 1 c ( x j l j )
ln γ i R = q i ( 1 ln ( j = 1 c θ j τ j i ) j = 1 c θ j τ i j k = 1 c θ k τ k j )
l i = Z 2 ( r i q i ) ( r i 1 )
τ i j = exp ( u i j u j j R T )
φ i = x i r i j = 1 c x j r j
θ i = x i q i j = 1 c x j q j
where ln γ i C is the combined activity coefficient of the component i , determined by the size and shape of the molecule; ln γ i R is the residual activity coefficient of component i , determined by the intermolecular energy interaction; r and q are the volume and surface area parameters of the molecule, which can be calculated from the van der Waals volume and surface area of the molecule, respectively; Z is the lattice coordination number, generally taken as 10; and u is the interaction energy between molecules, and its value is determined by regression of experimental data. The UNIQUAC model divides the activity coefficient into a combination part and a residual part, further considering the effects of molecular shape, size, and interaction on the activity coefficient of eutectic mixtures. It is more complex and has higher computational accuracy than the Wilson model and NRTL model, and can be widely used in almost all multicomponent eutectic systems. But it is obvious that the model introduces too many parameters that need to be calculated or determined by experimental data, making the actual calculation process too cumbersome and difficult to use.
(4)
Ideal Schrader Model
For ideal solids and liquids, the specific heat difference of the solid and liquid phase has little effect on thermodynamic equilibrium, so the ideal Schrader model suggests that Δ c p , i = 0. In addition, the activity coefficient γ i of the Equation (1) are also ignored to reduce computational complexity [34,35,36], and the final model is described in Equation (18):
ln x i = Δ H i R T i ( T i T 1 )
The ideal Schrader model simplifies many parameters in the Gibbs equation and can directly establish the mathematical relationship between the basic characteristic parameters of eutectic mixtures, such as molar fraction, melting enthalpy, and melting point, greatly improving the simplicity of calculation. It is a highly suitable model for calculating and predicting the thermal parameters of eutectic mixtures in practical engineering. Based on the second law of thermodynamics and phase equilibrium theory, the Schrader equation for binary PCM can be described as follows:
T m = 1 T A R ln x A Δ H A 1 T m = 1 T B R ln x B Δ H B 1
where T m is the phase change temperature of the eutectic mixture, (K); T A and T B represent the melting points of component A and component B, respectively, (K); R represents the general gas constant, which is 8.314 J/mol·K; x A and x B are the molar fractions of component A and component B in the eutectic mixture, respectively, and x A + x B = 1 ; Δ H A and Δ H B represent the melting latent heats of component A and component B, respectively, (J/mol). The principle of Equation (19) is that there is no chemical reaction between the components of an ideal eutectic mixture, only physical binding occurs. The higher the proportion of a certain component, the closer the final melting point of the eutectic mixture will be to that component.
Therefore, there is a linear relationship between the phase change temperature and composition ratio of eutectic mixtures, and there exists the lowest eutectic point of the mixture at a specific composition ratio. Based on the above conclusion and Schrader equation, a phase diagram of an ideal binary eutectic PCM can be drawn, as shown in Figure 4. In Figure 4, the physical meanings of TA and TB are consistent with Equation (19), TE represents the lowest eutectic point of the mixture (K), and XE is the composition ratio when obtaining the lowest eutectic point. Since there is only physical eutectic between the components of the eutectic mixture, EPCM exhibits different mixing states under different composition ratios. The temperature of the curve is the melting point of the eutectic mixture, which varies with the proportion of the mixture composition. The curve divides the phase diagram into multiple regions, namely a liquid phase, solid phase + liquid phase, and solid phase. When the mixture is in the liquid phase, its components can be completely mixed, whereas when there is a solid phase, it is partially blended or completely immiscible. The critical point for complete immiscibility and blending is the lowest eutectic point TE, at which each component of the mixture achieves the best eutectic effect, thus also possessing the best solid-liquid phase change performance and chemical stability. Therefore, accurately estimating the co-melting points of eutectic mixtures can provide important theoretical support for the preparation and application of EPCM in practical engineering [37,38].
Similar to the prediction method of melting point, the calculation theory of melting enthalpy for binary organic eutectic mixtures can also be obtained through the Schrader model, as shown in Equation (20):
H m = T m i = 1 n x i H i T i + x i ( c p , l i c p , s i ) ln T m T i
where H m is the melting latent heat of the eutectic mixture, (J/mol); c p , l i and c p , s i represent the liquid specific heat capacity and solid specific heat capacity of each of the i components in the mixture, respectively, (J/kg·K).
By observing Equations (19) and (20), it can be seen that the melting point and latent heat studied by the Schrader equation correspond to the two components of the binary eutectic mixture. To solve the calculation of multi-component eutectic PCM (such as quaternary PCM and pentagonal PCM) using this method, the phase diagram of pseudo binary eutectic can be drawn using equations. For example, when using the Schrader equation to calculate the melting point of a ternary EPCM, the melting point of the binary PCM after mixing two components can be first calculated, and then the binary PCM at a specific composition ratio can be used as a component to calculate the melting point of the ternary PCM together with the third component. The calculation method for multicomponent eutectic compounds with a composition greater than three is similar.
Additionally, in existing studies, the DSC method is often used to experimentally determine the melting point and latent heat value of EPCM. However, when the composition ratio is refined and the number of components in the mixture increases (such as ternary and quaternary), conducting a complete DSC analysis requires a significant amount of time and capital costs. Thus, it is necessary to combine the Schrader model to predict the thermal parameters of eutectic mixtures under different composition ratios, in order to reduce the workload of DSC experiments. However, some studies have shown that due to the simplification of some parameters, the ideal Schrader equation can only accurately predict the eutectic point of EPCM, making it difficult to accurately estimate the thermal performance parameters of the mixture. Therefore, using a small amount of DSC test results to modify the ideal Schrader model to ensure the accuracy of its thermal parameter calculation results meets the requirements is an important prerequisite for using the Schrader model for prediction. In this paper, based on the thermal parameter test results of eutectic mixing under different composition ratios, the calculation equation of the ideal Schrader model is improved to improve computational accuracy, which has important theoretical significance for the engineering application and design preparation of such EPCM.

3. Results and Discussion

On the basis of completing the experimental method design, in this section, the cooling curve testing, DSC testing, thermodynamic model analysis, and FTIR testing results of the binary PCM and ternary PCM prepared will be studied and analyzed in order to thoroughly explore the thermal parameter changes, eutectic effect, and compatibility with thermodynamic models under different composition ratios of EPCM.

3.1. Thermal Properties of Binary PCM

3.1.1. Cooling Curve Test
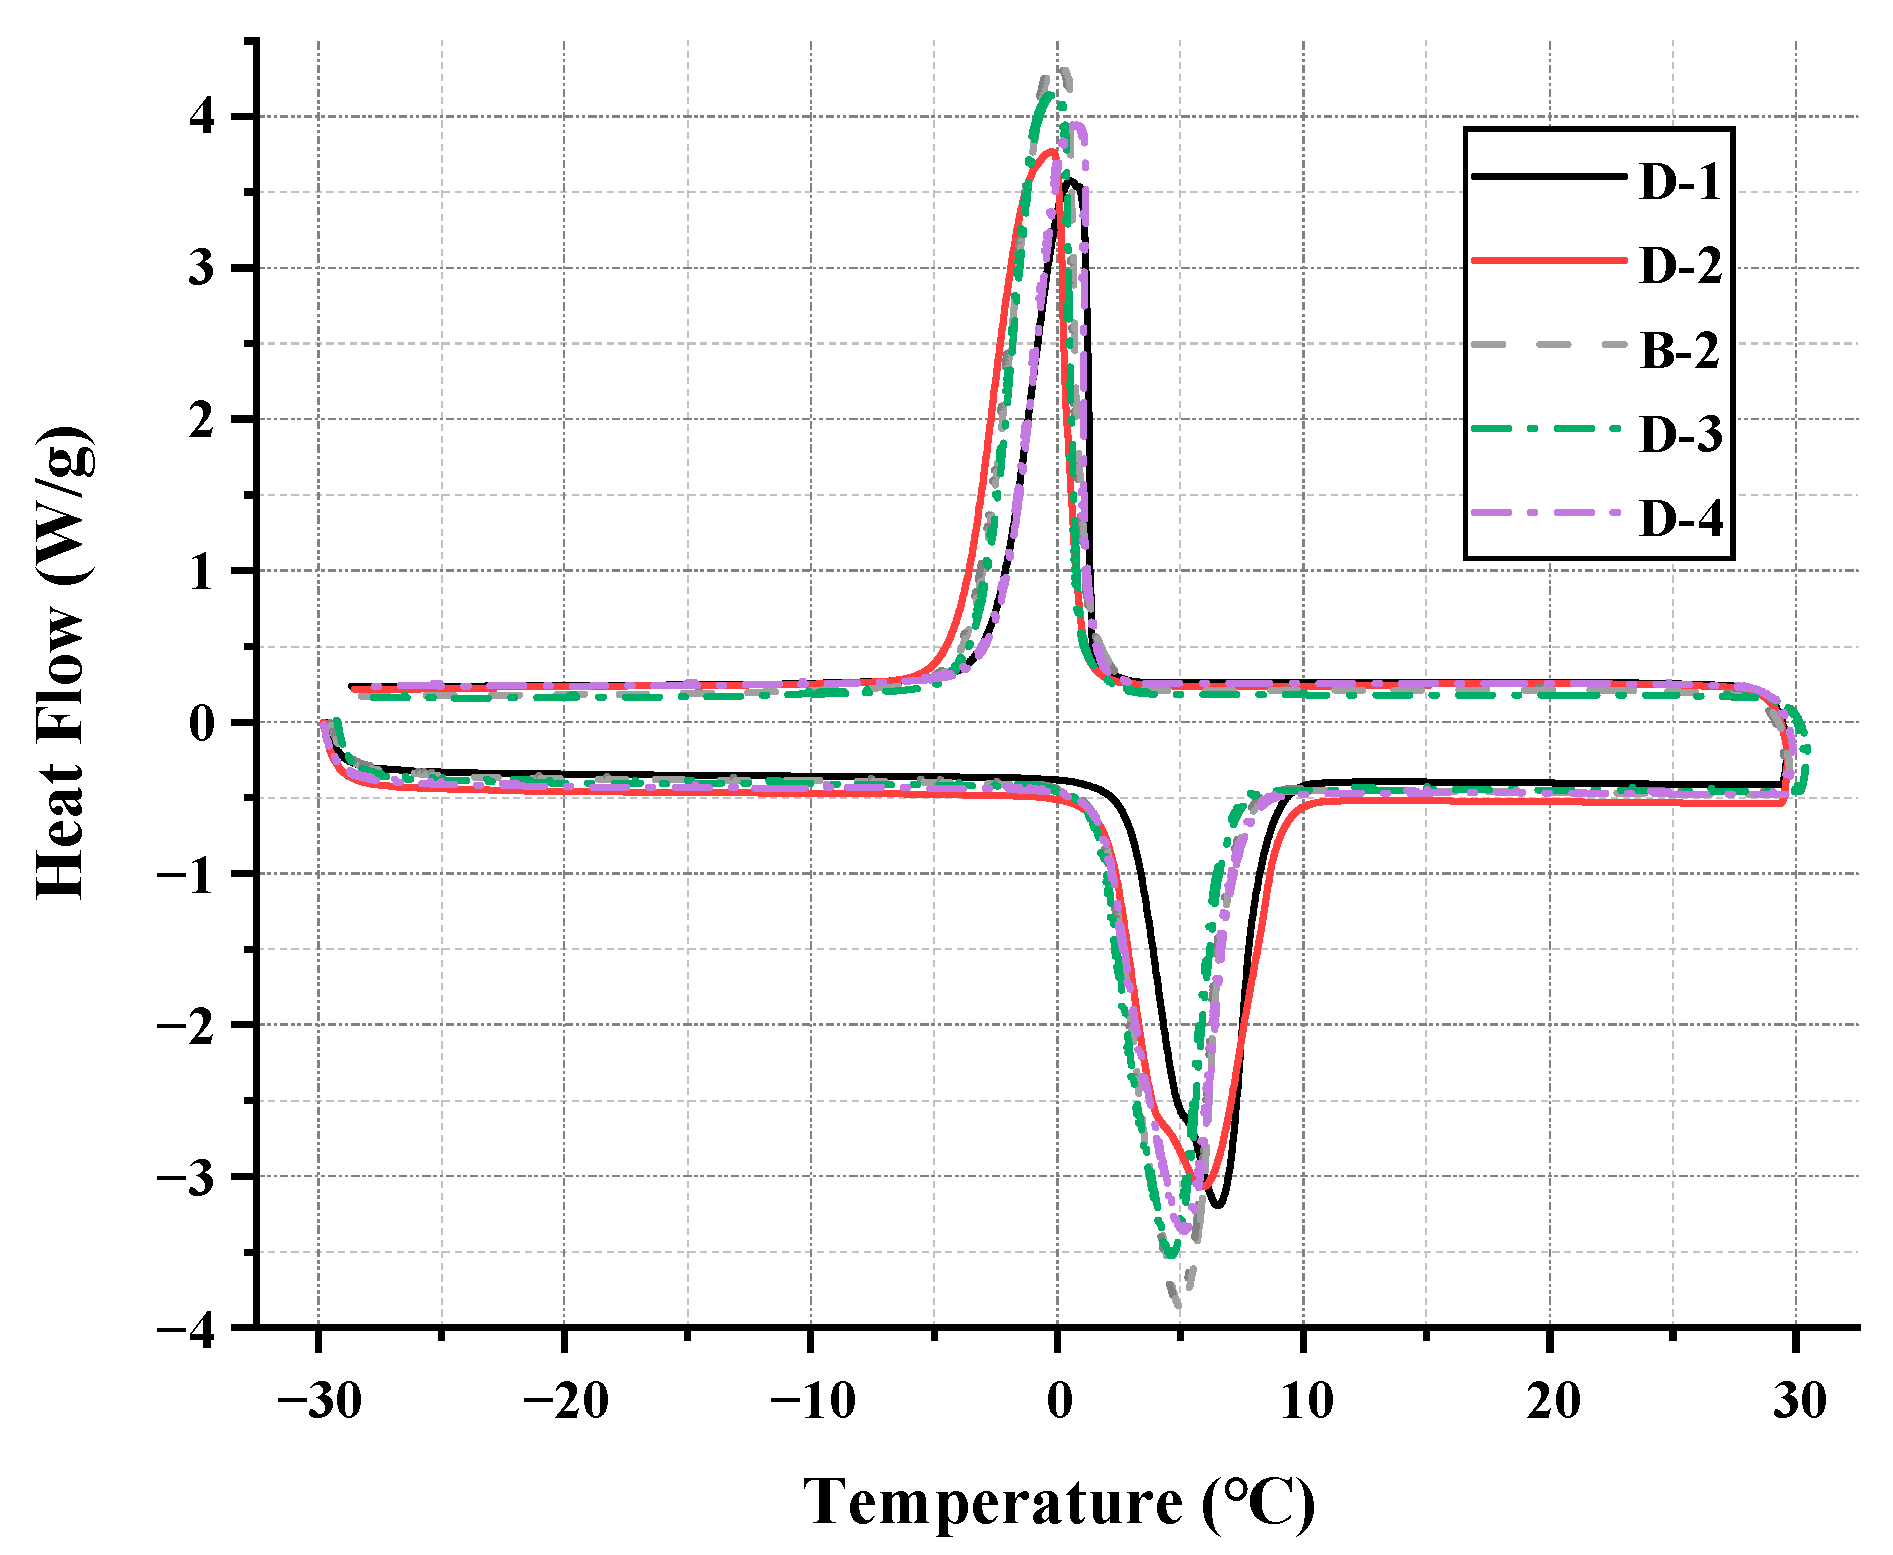
The cooling curve test results of a binary PCM with different composition ratios are shown in Figure 5 and Table 4. It can be observed that as the concentration of capric acid increases, the temperature of the plateau section in the cooling curve initially decreases and then increases, and the time needed for the samples to cool completely first increases and then decreases. For the cooling curve of EPCM, a lower platform temperature represents a lower melting point, while a longer cooling time indicates a stronger temperature control ability of EPCM. It is not difficult to find that the B-2 group samples have both the lowest melting point and the longest cooling time. In the B-2 group samples, the mass ratio of capric acid to n-octanoic acid is 3:7, indicating that EPCM has the lowest melting point at this composition ratio.

3.1.2. DSC Analysis

The cooling curve method can quickly compare and locate the mix proportions of samples with the lowest eutectic point in eutectic mixtures. However, in order to further refine and accurately determine, DSC is also needed to assist in analysis. According to the test results of the cooling curve, the mix ratio for DSC testing of binary PCM is given in Table 5.
The results of the DSC test for binary PCM are shown in Figure 6. The peak with a negative heat flow value in the DSC curve represents the melting peak of the PCM, while the peak with a positive heat flow value indicates the crystallization peak. The melting point or crystallization point of a material can be obtained based on the intersection point of the tangent line of the peak and the baseline, while calculating the integral area between the peak and the baseline can obtain the melting enthalpy and solidification enthalpy of the material. The specific thermal performance parameters of the calculated samples are shown in Table 6. The test results show that within the range of 24~36% capric acid content, the melting point of the binary PCM shows a trend of first decreasing and then increasing, while the latent heat of phase change demonstrates a trend of first increasing and then decreasing. From this, it can be determined that when the mass ratio of capric acid to n-octanoic acid is 0.33:0.37, this type of binary PCM obtains the lowest eutectic point. At this point, EPCM has a minimum eutectic point of 1.42 °C and a minimum undercooling of 0.531, further indicating that the D-3 sample has the best eutectic effect.

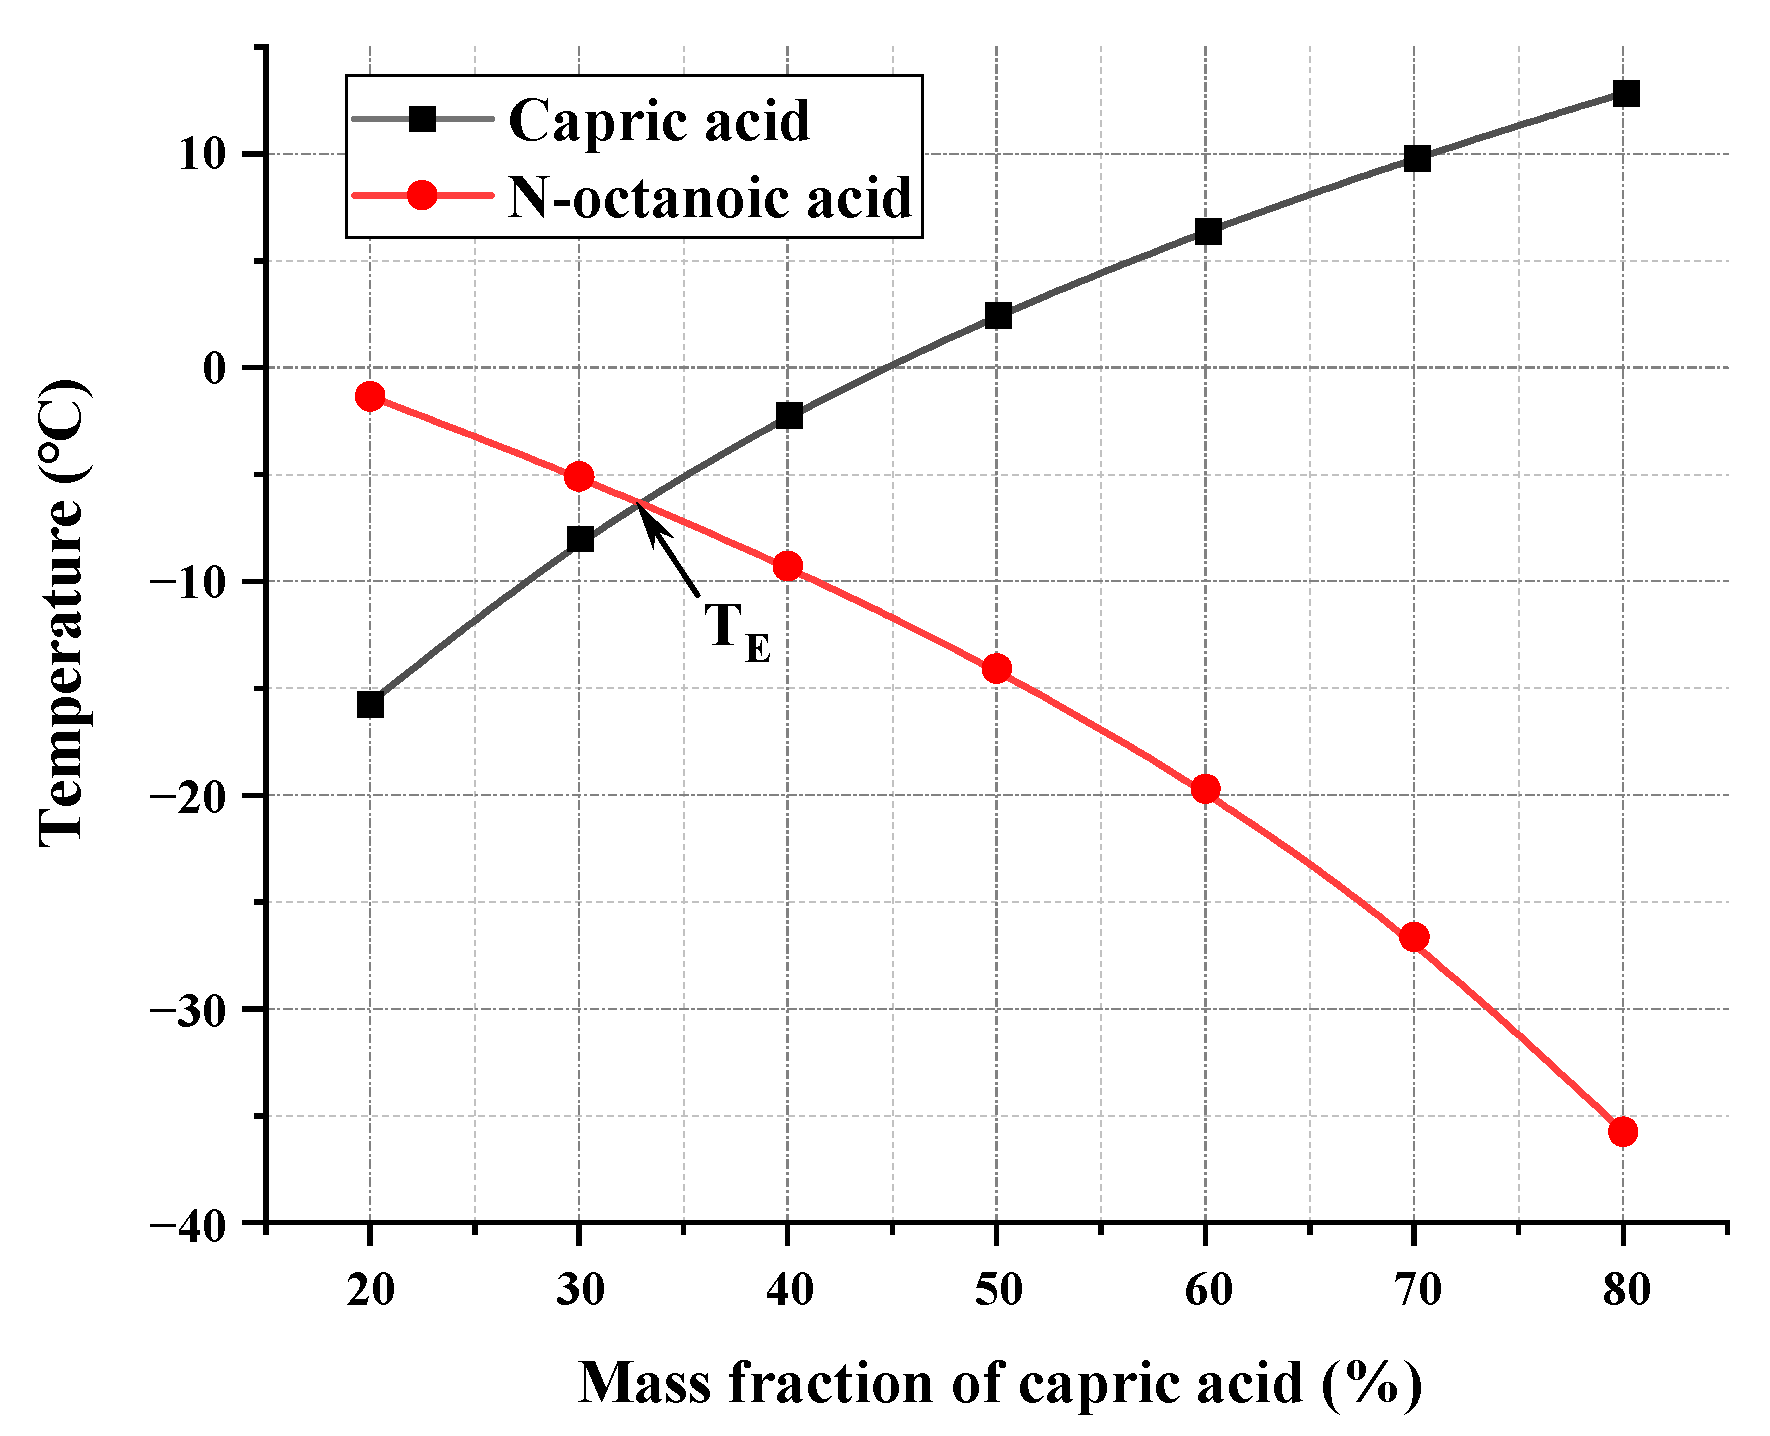
3.1.3. Thermodynamic Model Analysis

After obtaining the melting point and phase change latent heat of a binary PCM through cooling curve testing and DSC testing, the theoretical analysis and verification of the thermal performance of binary PCM were conducted based on the theory described in Section 2.3.4. The eutectic phase diagram of binary PCM calculated theoretically is shown in Figure 7. The point where the melting point curves of these two materials intersect is the predicted lowest eutectic point TE of the binary PCM [41]. The mass ratio of capric acid to n-octanoic acid with the lowest eutectic point predicted by theory is 33.54:66.46, which is very close to the composition ratio obtained from actual experiments, indicating the feasibility of using the Schrader equation for theoretical prediction. But it is also evident that the melting point of EPCM, calculated using the Schrader equation, is significantly different from the experimental values. Therefore, it is necessary to modify the Schrader equation in order to obtain more accurate geothermal performance parameters through theoretical calculations.
For the Schrader equation for calculating the melting point of multivariate EPCM, directly modifying the calculation method of mole fraction x i can lead to extremely complex calculations and unsatisfactory results. Therefore, this article chooses a function law based on experimental values and uncorrected theoretical values, and uses an exponential equation to directly fit and correct the mixture melting point T m calculated by the Schrader formula, in order to achieve a more accurate approximation of experimental values and reduce computational difficulty. The corrected equation is shown in the Equation (21).
T m = 1 T A R ln x A Δ H A 1 T m = 1 T B R ln x B Δ H B 1 T c = a T m + b T m + c
where T c is the predicted value of the corrected phase change temperature, (K); T m is the predicted value of the uncorrected phase change temperature, (K); a , b and c are the parameters used to modify the equation; and the physical meanings of the other parameters are consistent with those in Equation (20). According to the measured phase change temperature Tt obtained, the predicted value Tm of the uncorrected phase change temperature can be fitted to obtain the corrected parameters. The parameter fitting diagram and fitting formula are shown in Figure 8 and Equation (22), respectively. The results show that the correlation coefficient R2 between Tt and Tm of binary PCM after data fitting is 0.99, indicating that the fitting accuracy meets the requirements.
T c = 1.1121 T m + 0.4187 T m + 3.2796
According to Equation (22), the corrected predicted phase change temperature Tc can be calculated, and the phase diagram comparison of Tc and Tt for binary PCM can be drawn (as shown in Figure 9). Additionally, to further verify the accuracy of the corrected predicted phase change temperature, a deviation coefficient b x is introduced to characterize the deviation between the experimental value and the predicted value [42]. The calculation formula is shown in Equation (23):
b x = T c T t 2 ( T c + T t )
where b x represents the deviation coefficient between the experimental value of phase change temperature and the predicted value of modified phase change temperature, used to describe the degree of deviation between the two; T c is the predicted value of the corrected phase change temperature for binary PCM, (°C); and T t is the phase change temperature test value for binary PCM, (°C). The calculation results of the deviation coefficient are listed in Table 7. From Figure 6 and Table 7, it can be seen that the T c and T t values of binary PCM are very close under the same mass fraction of capric acid, and the deviation coefficients of both are less than 0.06, indicating that the accuracy of the correction formula is acceptable.

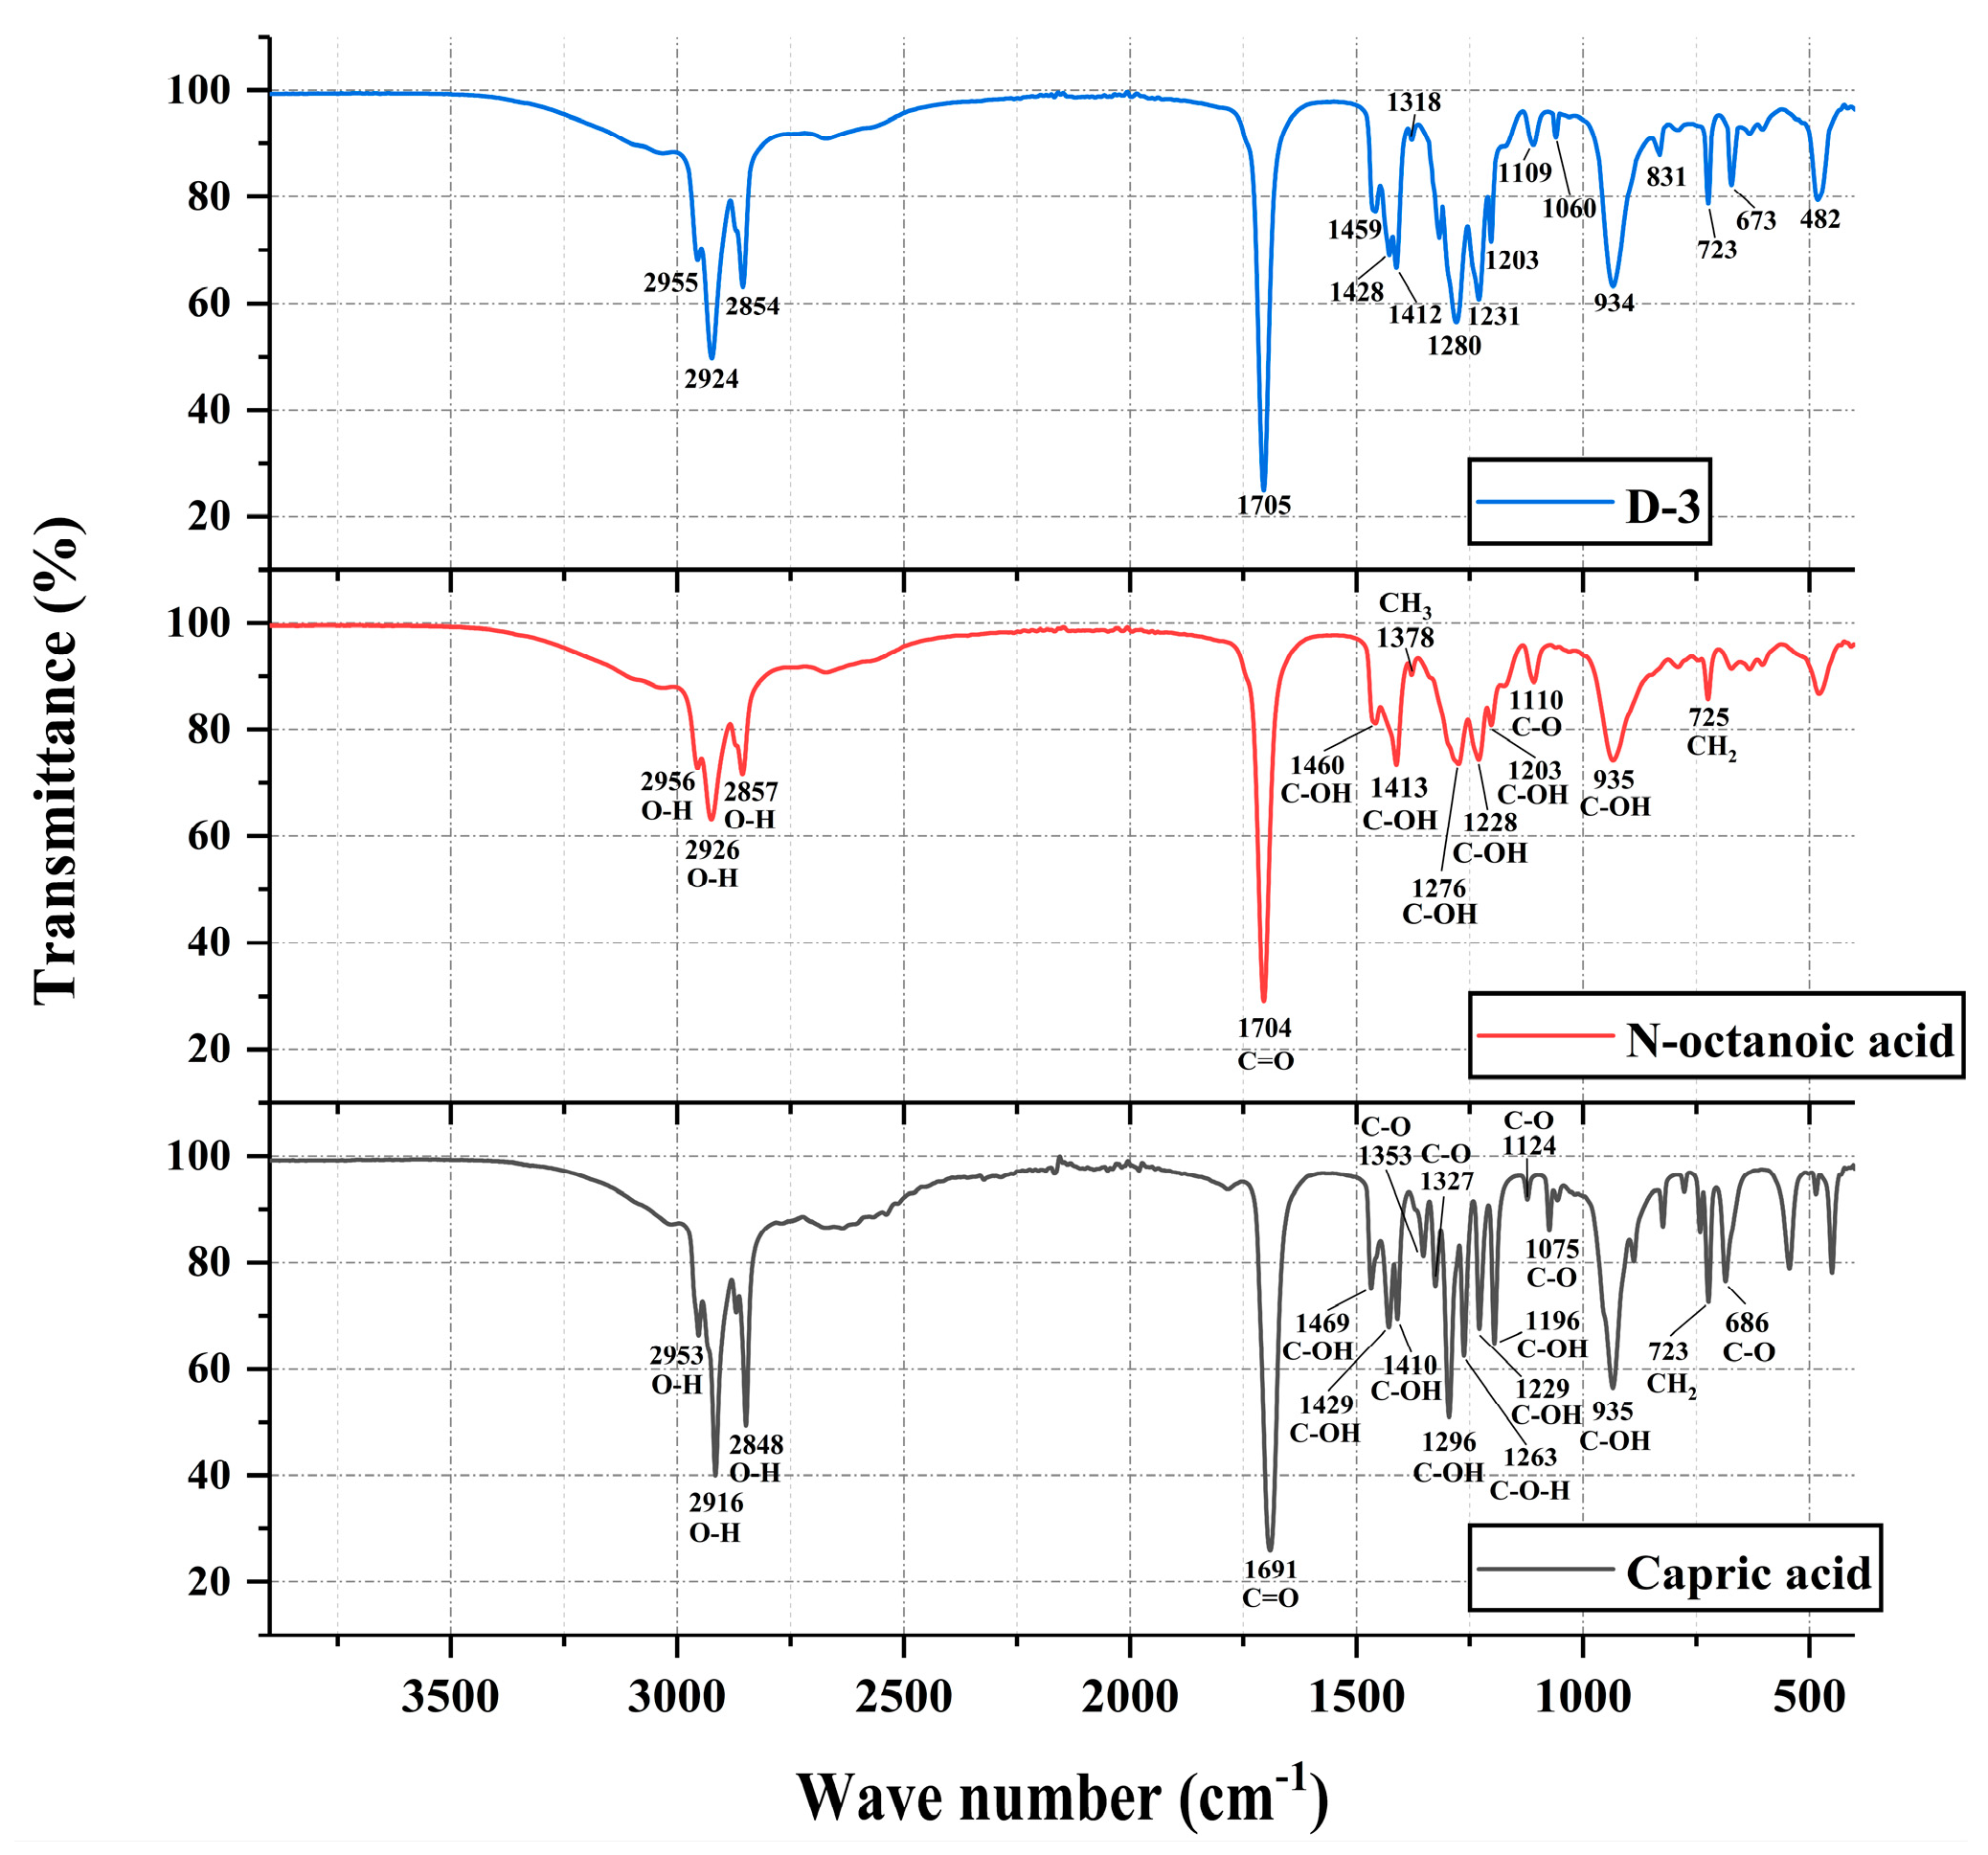
3.1.4. FTIR Analysis

Figure 10 shows the FTIR spectrum test results of capric acid, n-octanoic acid, and D-3 binary PCM. As shown in Figure 10, the peaks at 2955–2854 cm−1, 1705 cm−1, 1459–1412 cm−1, 1280–1203 cm−1, 934 cm−1, and 723 cm−1 of the D-3 sample with a mass fraction of 33% capric acid are attributed to the O-H tensile vibration peak, C=O tensile vibration peak, C-O-H in-plane bending vibration peak, C-O out-of-plane bending vibration peak, and -CH2 in-plane rocking vibration peak, respectively. These vibration peaks are all come from the superposition of some vibration peaks in capric acid and n-octanoic acid contained in the D-3 sample.
In addition, apart from the superimposed vibration peaks, the D-3 sample also exhibited distinct vibration peak patterns for capric acid and n-octanoic acid. For example, the peak at 1379 cm−1 in the sample originates from the variable angle vibration peak of -CH3 in n-octanoic acid, while the peak at 1318 cm−1 is attributed to the tensile vibration of C-O in capric acid. It is evident that the infrared vibration peaks observed in the D-3 sample do not originate from the superposition of vibration peaks in capric acid and n-octanoic acid, nor from the retention of unique vibration peaks in the two components. So, it can be concluded that in the D-3 sample prepared by the melt blending method, there is no chemical reaction between the components; only physical binding. Good physical co-melting effect is also an important guarantee for binary PCM to inherit the excellent thermal and chemical stability properties of its components [43].

3.2. Thermal Properties of Ternary PCM

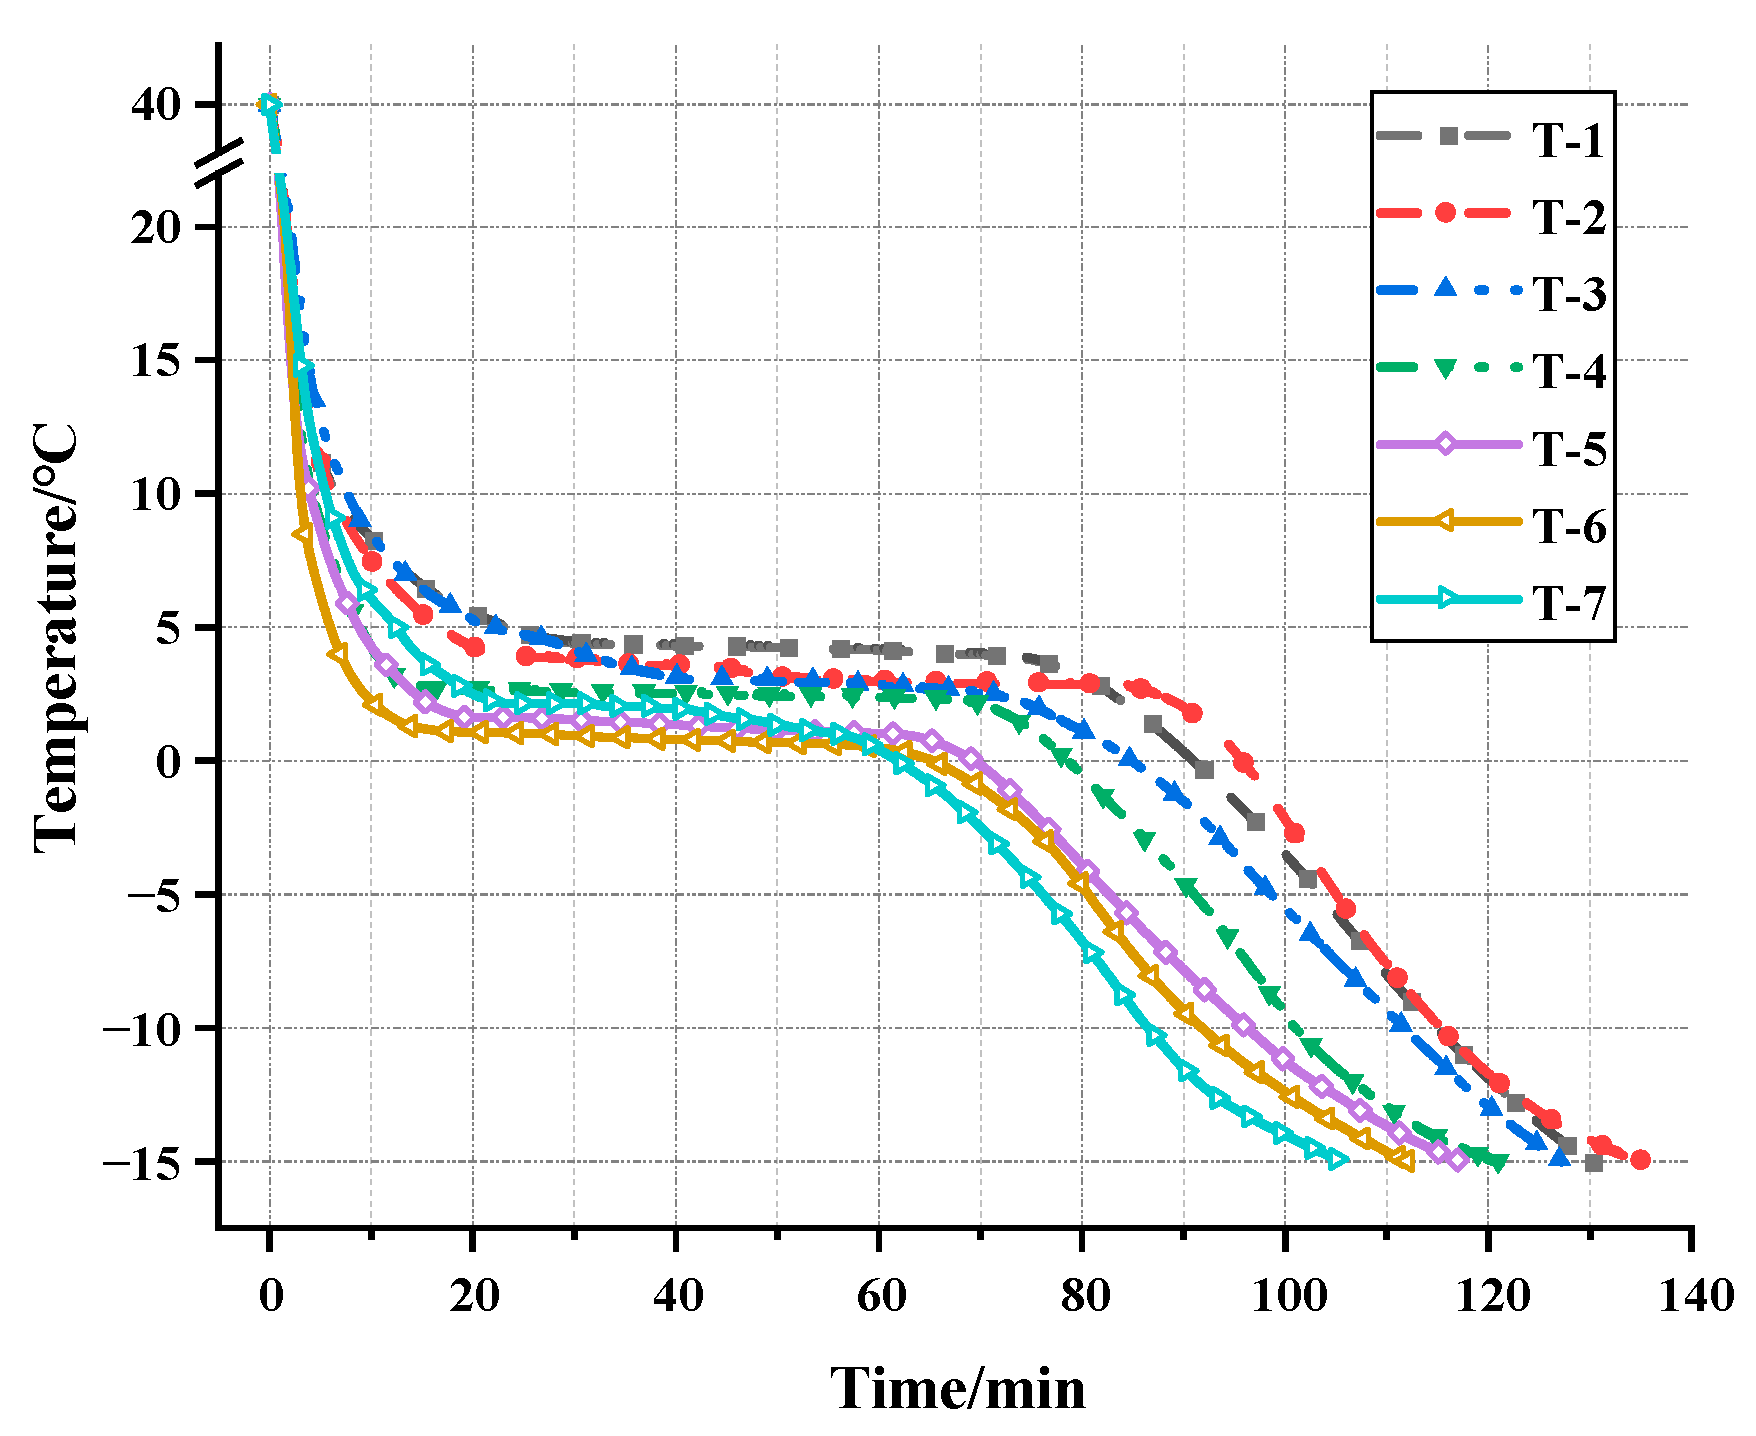
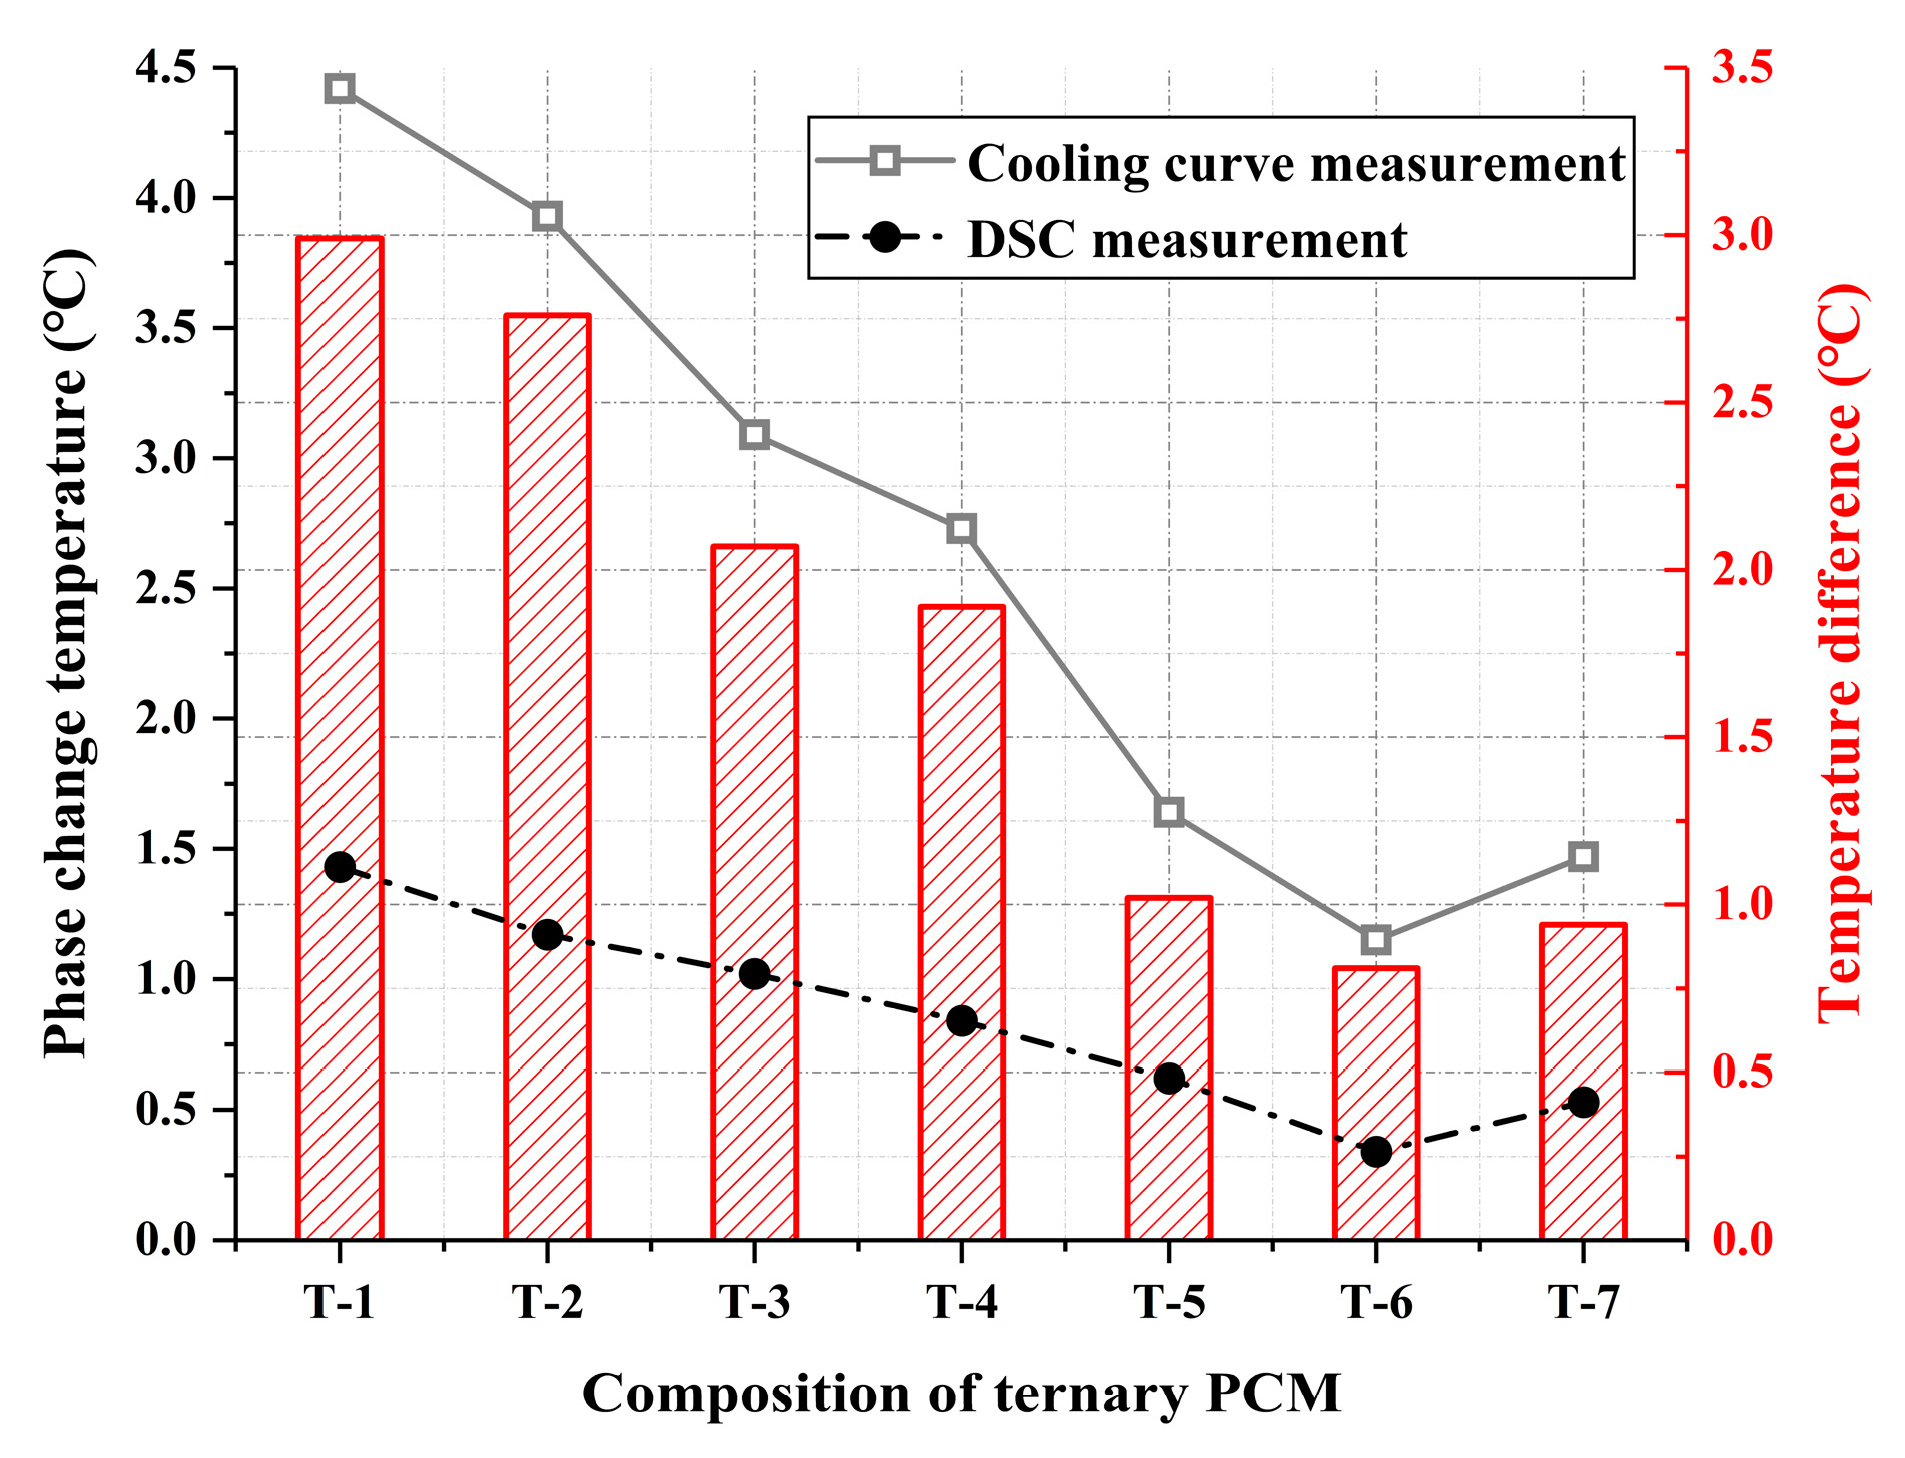
3.2.1. Cooling Curve Test
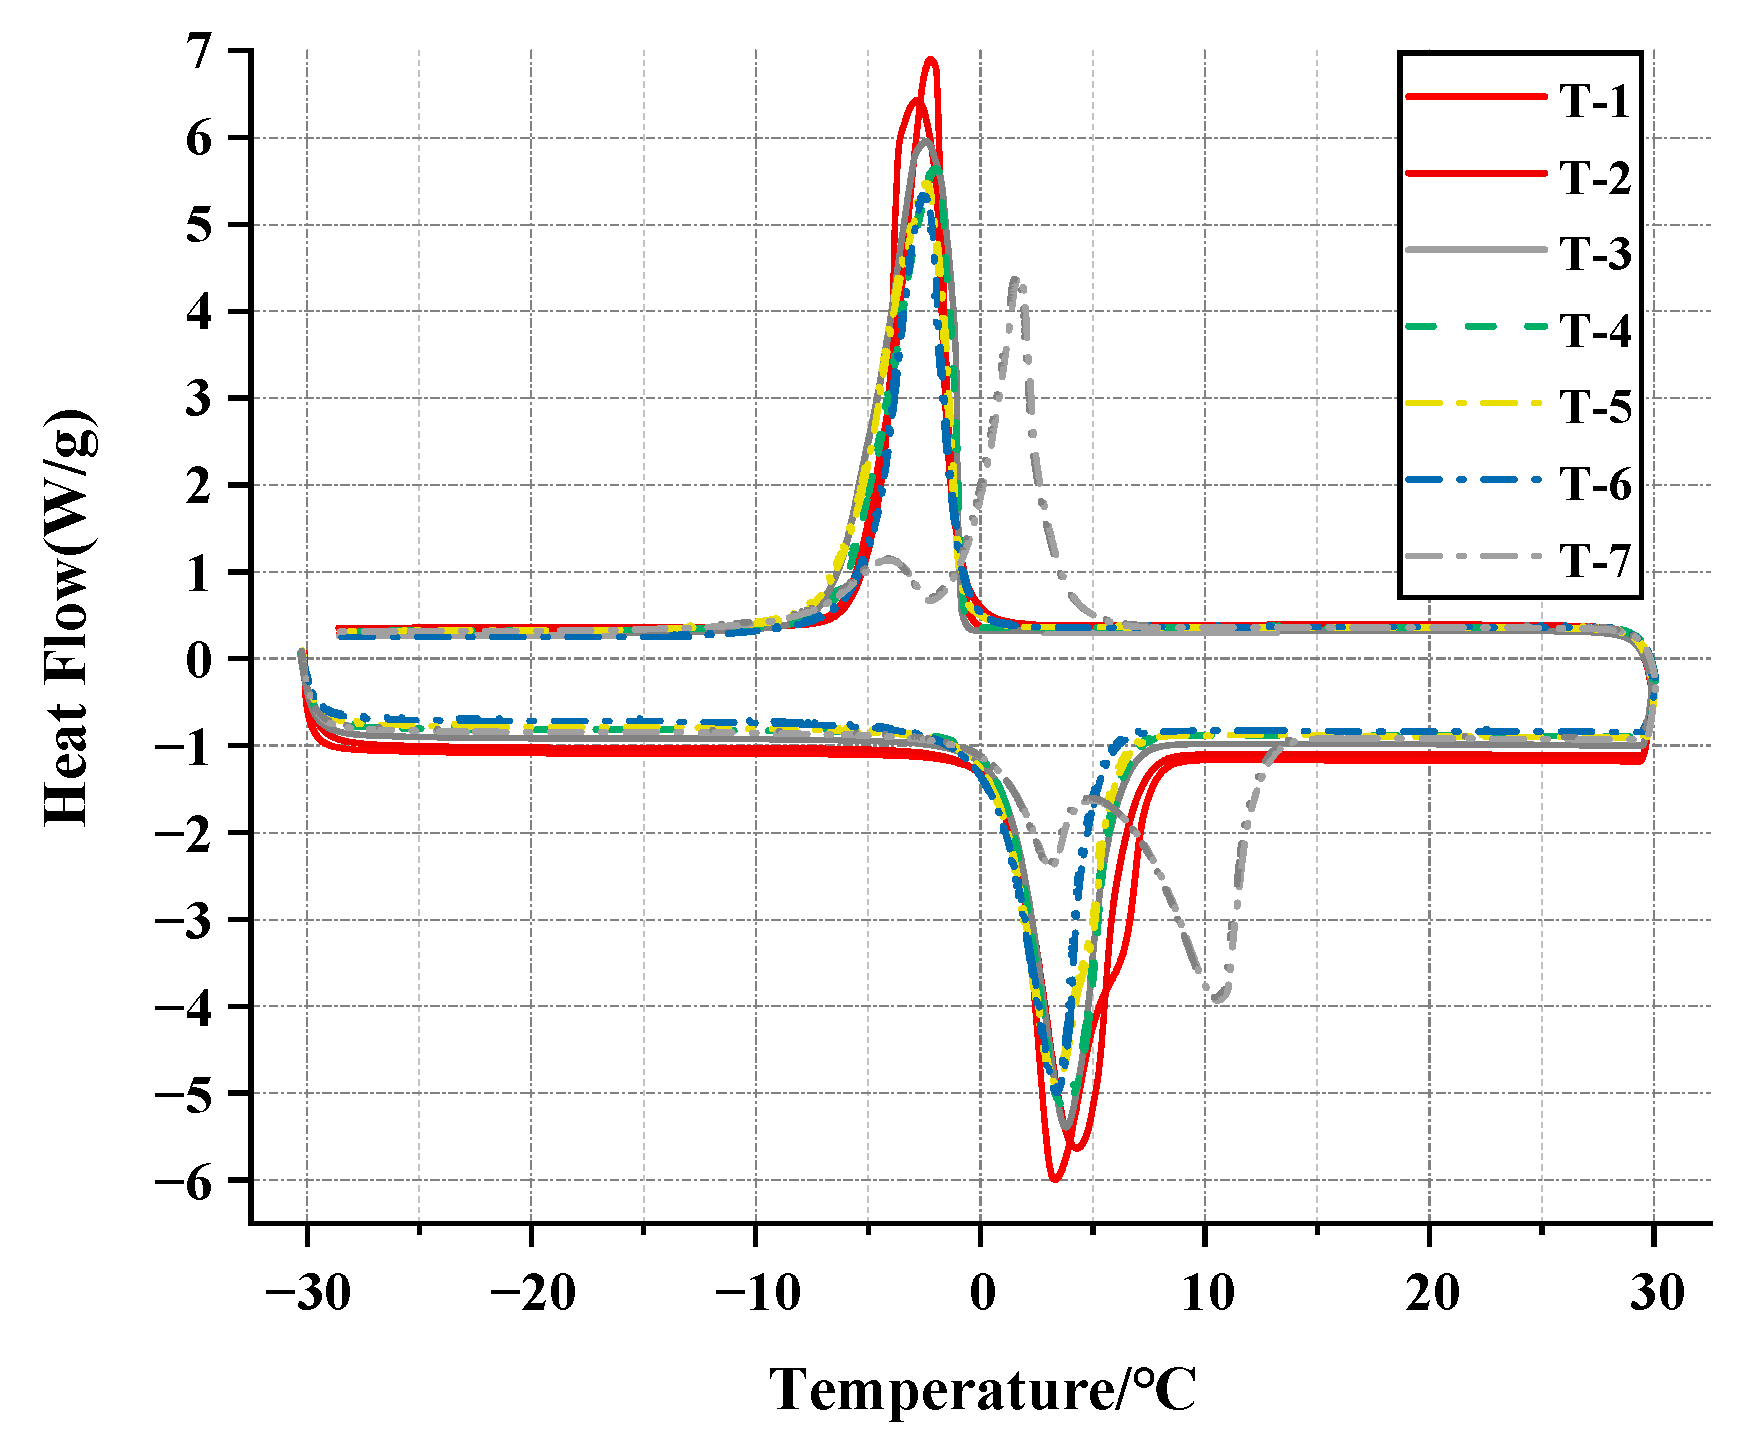
The cooling curve test results of ternary PCM under different composition ratios are shown in Figure 11. Figure 11 shows that as the mass fraction of D-3 binary PCM and n-tetradecane changes, the platform temperature of all ternary PCM fluctuates between 1.15 °C and 4.42 °C, and the cooling time varies between 105 and 135 min. It can be seen that the range of change in phase change temperature is generally lower than that of binary PCM, and the cooling time is also generally higher than that of binary PCM. This indicates that the melting and mixing of binary PCM and n-tetradecane further strengthens the eutectic effect between components, weakens the force between crystals, and further reduces the temperature required for system melting. Meanwhile, according to the data in Table 8, the latent heat of n-tetradecane is higher than that of the D-3 binary PCM. Therefore, based on the results, the addition of n-tetradecane undoubtedly increases the overall phase change latent heat of the ternary PCM, which proves that the time required for the ternary PCM to cool to −15 °C is significantly reduced compared to the binary PCM, and increases as the increase of n-tetradecane proportion. This result also proves, from another perspective, that the addition of high latent heat components can effectively enhance the overall phase change latent heat of eutectic mixtures during multi-component melt blending. Looking at the overall cooling curve results, when the mass ratio of the D-3 sample to n-tetradecane is 7:3, the ternary PCM exhibits the lowest phase change temperature, indicating that it is the closest composition ratio to achieving the lowest melting point for the ternary PCM.

3.2.2. DSC Analysis

The DSC test results of the ternary PCM are shown in Figure 12, and the specific thermal parameters are given in Table 9. Firstly, it is worth noting that the DSC results of the T-7 sample show two peaks on the melting curve and crystallization curve, respectively. The weaker peaks are attributed to the solid-solid phase change process of the material, while the stronger peaks represent the result of the solid-liquid phase change process [44]. As an EPCM with a good co-melting effect, the internal components should reach a state of simultaneous melting and crystallization. Therefore, the sample should only show separate melting and crystallization peaks during DSC analysis. When the eutectic effect between components in EPCM is poor, it will lead to a certain degree of phase separation, dividing the original phase transformation process into two parts, making it difficult to fully release latent heat. Therefore, when mixing multiple EPCM components, the range of changes in composition ratio should be strictly controlled.
It also can be seen that the melting point of ternary PCM first decreases and then increases with the increase of D-3 sample proportion, and reaches the lowest co melting point of 0.34 °C when the mass ratio of binary PCM to n-tetradecane is 7:3. The composition ratio is consistent with the conclusion obtained from the cooling curve. At this melting point, the mass ratio of capric acid to n-octanoic acid to n-tetradecane in the ternary PCM is 0.231:0.469:0.3. In addition, the melting latent heat of ternary PCM monotonically decreases with the addition of the proportion of binary PCM. Specifically, as the mass fraction of binary PCM changes from 20% to 80%, the melting latent heat of ternary PCM decreases from 197.8 J/g to 153.3 J/g. It is evident that the proportion of high and low latent heat components has a completely positive correlation with the final latent heat of the eutectic mixture.
It is also worth noting that the phase change temperature of the ternary PCM measured by DSC is slightly different from that measured by the cooling curve test, and the comparison is shown in Figure 13. The phase change temperature measured by the cooling curve is generally higher than that measured by DSC, with a maximum temperature difference of 2.99 °C. The difference is due to the different principles of the two testing methods. The cooling curve test estimates the phase change temperature of the material through the platform temperature during the cooling process, while DSC testing can accurately measure thermal parameters such as material melting point, crystallization point, and melting enthalpy. However, to determine the lowest eutectic point of EPCM, conducting an overall DSC analysis is undoubtedly expensive and slow. Although the cooling curve method cannot obtain accurate thermal parameters of EPCM, it can quickly compare the phase change temperature of EPCM with different composition ratios, thus obtaining a rough minimum eutectic ratio more quickly and conveniently. And the T-2 group with the highest cooling time required in the step cooling curve, did not exhibit the highest latent heat value in DSC testing, which may be related to the efficiency of latent heat utilization and eutectic effect of each component in EPCM. The temperature control performance of EPCM cannot be determined solely based on the magnitude of latent heat, but also needs to be comprehensively evaluated in conjunction with other experimental results. Therefore, in the collection of the lowest eutectic point of EPCM and the evaluation of its temperature control performance, the cooling curve method should be combined with the DSC method to achieve more scientific testing results, higher testing efficiency, and lower testing costs.

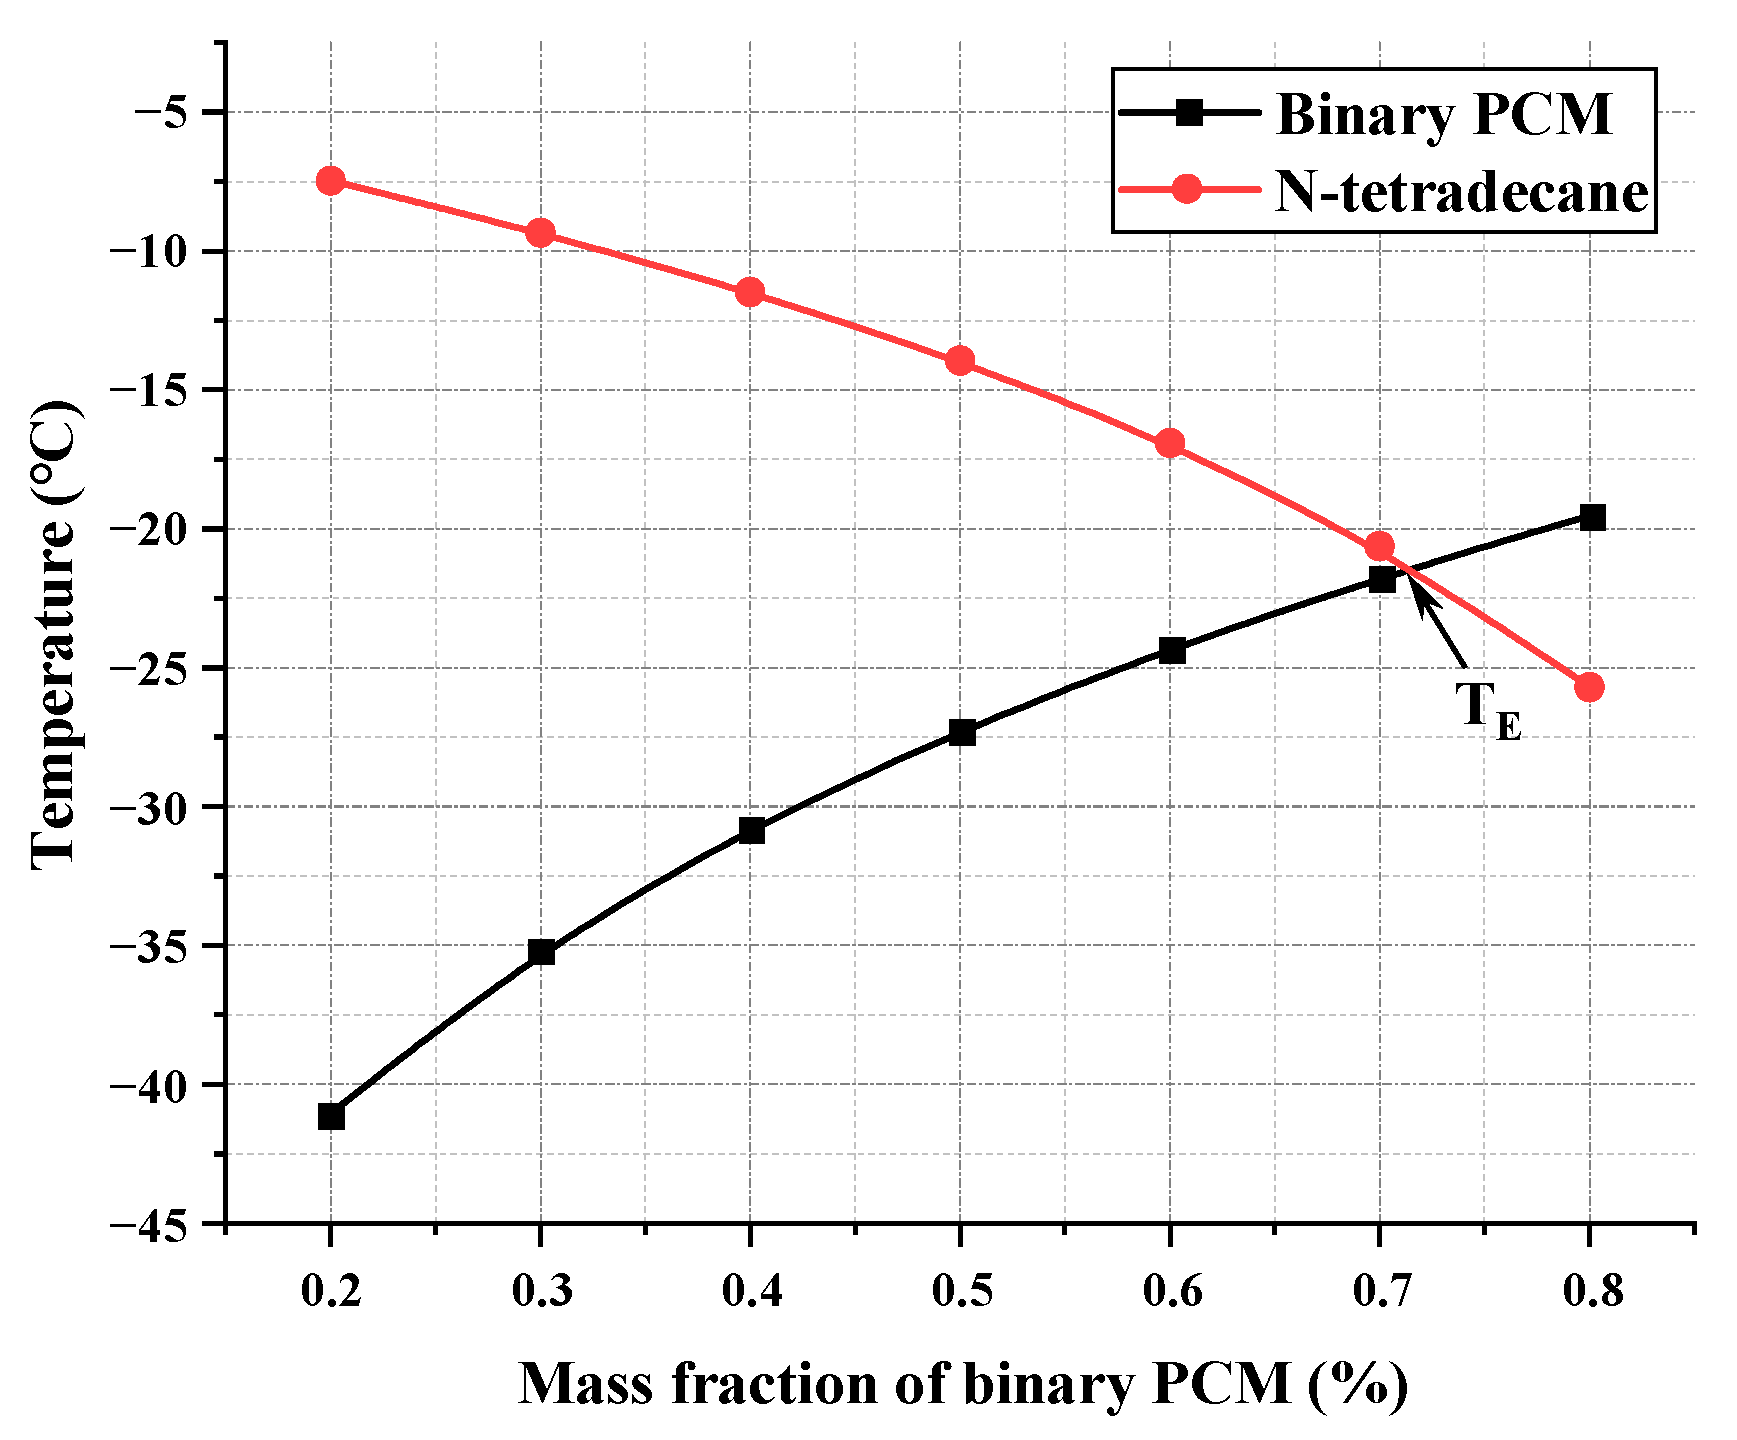
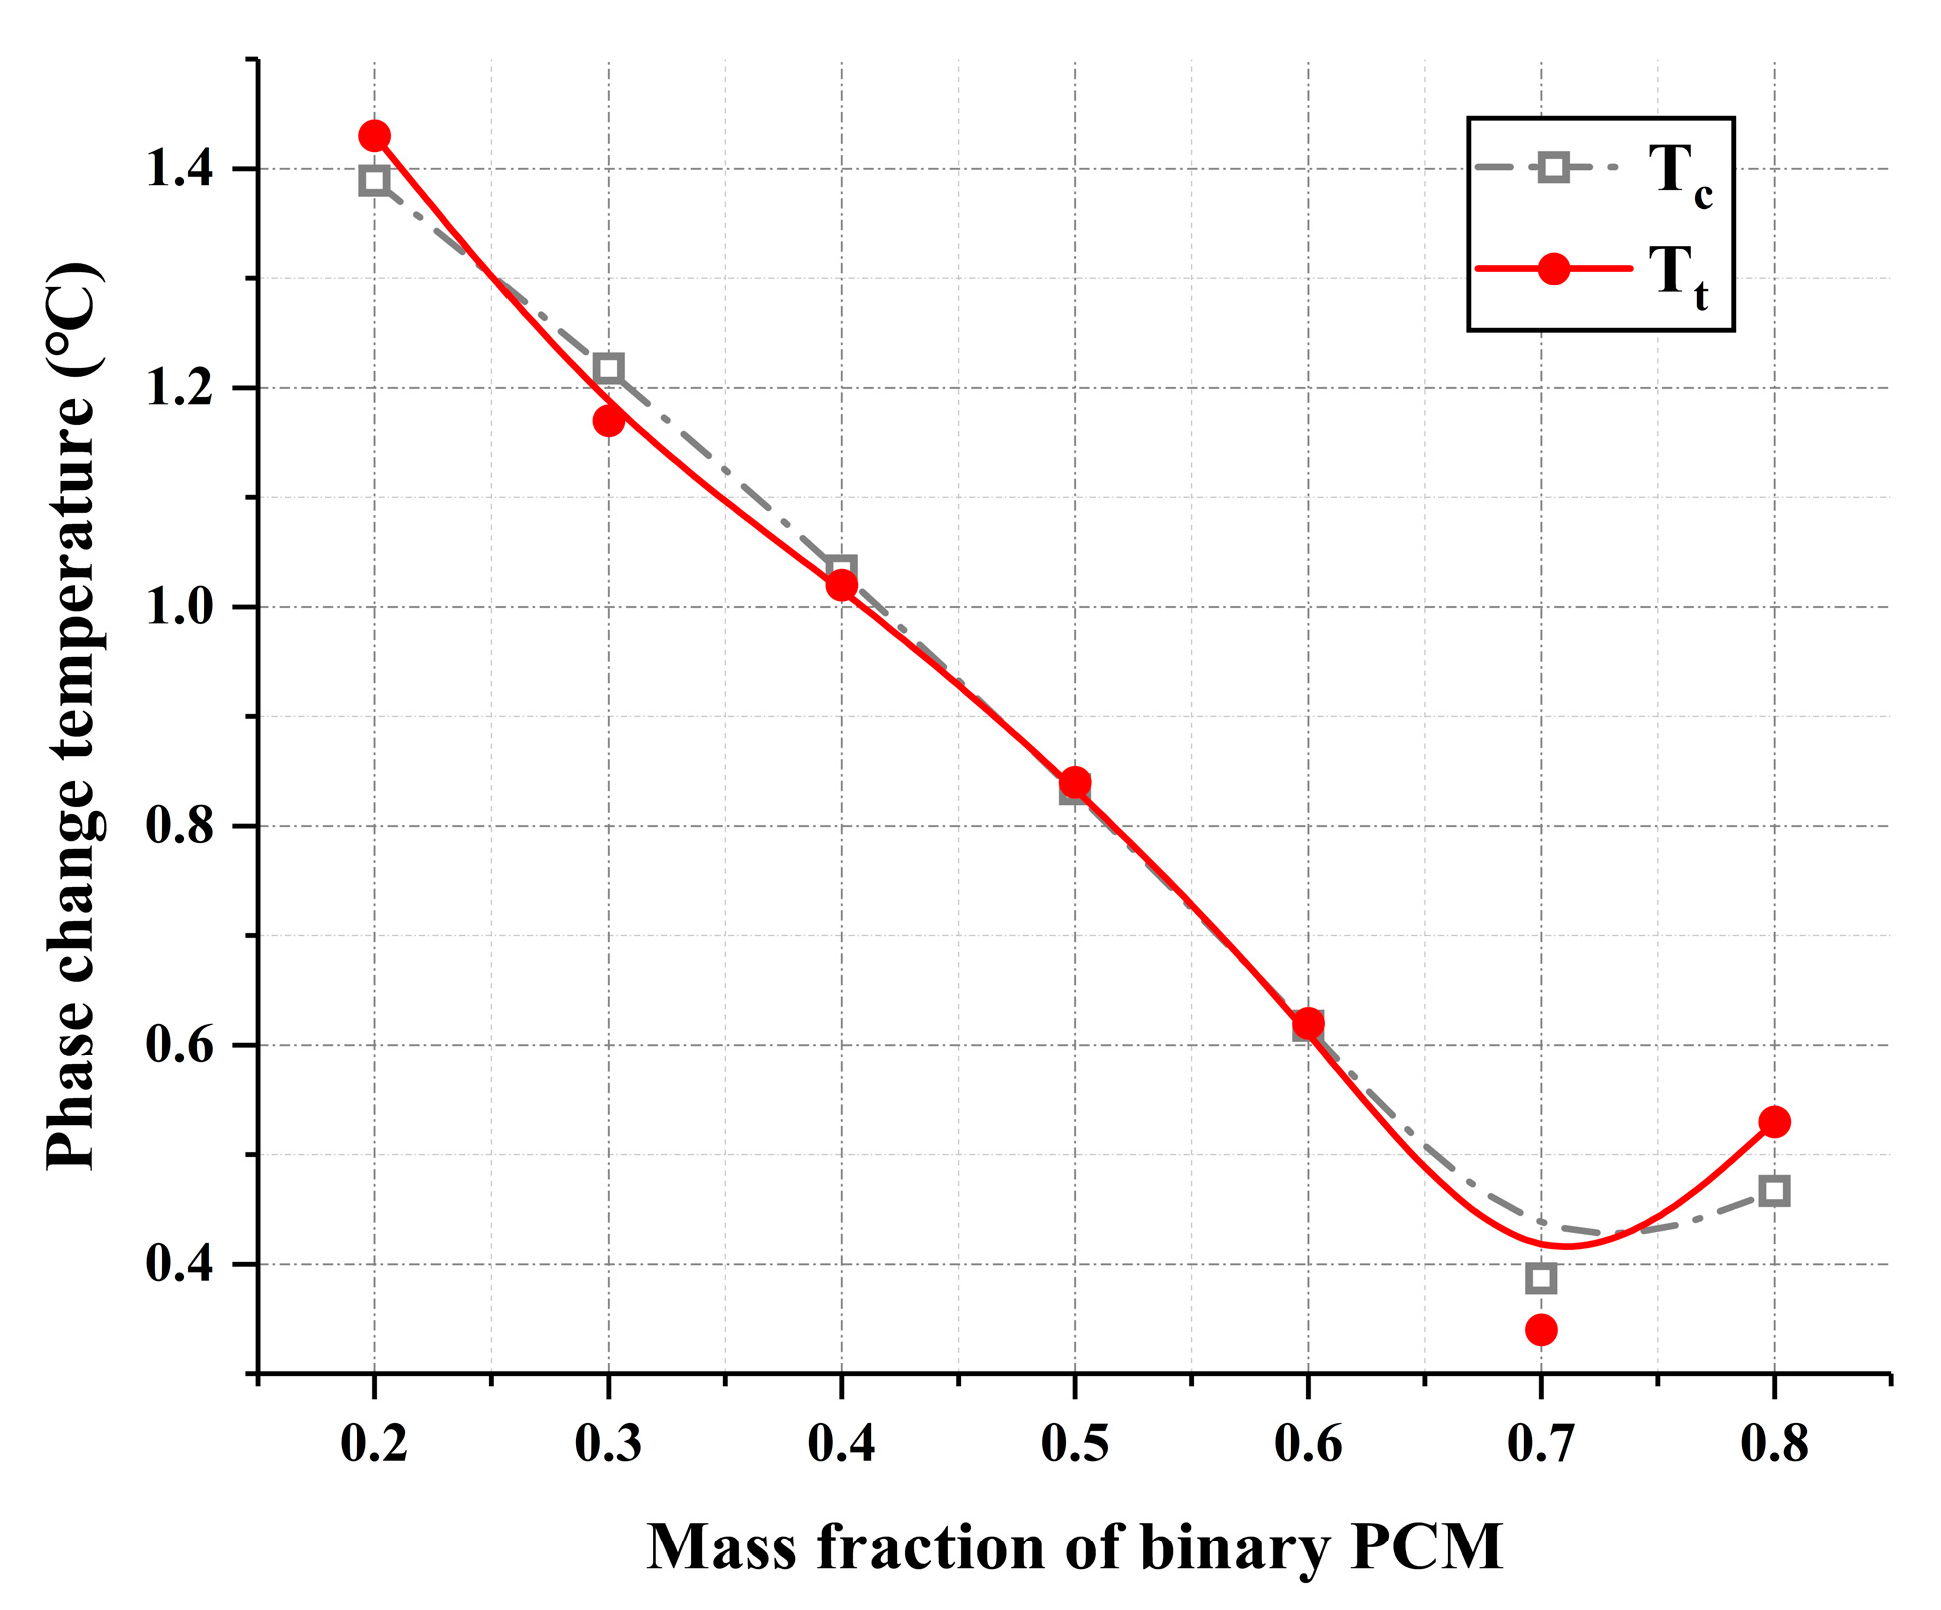
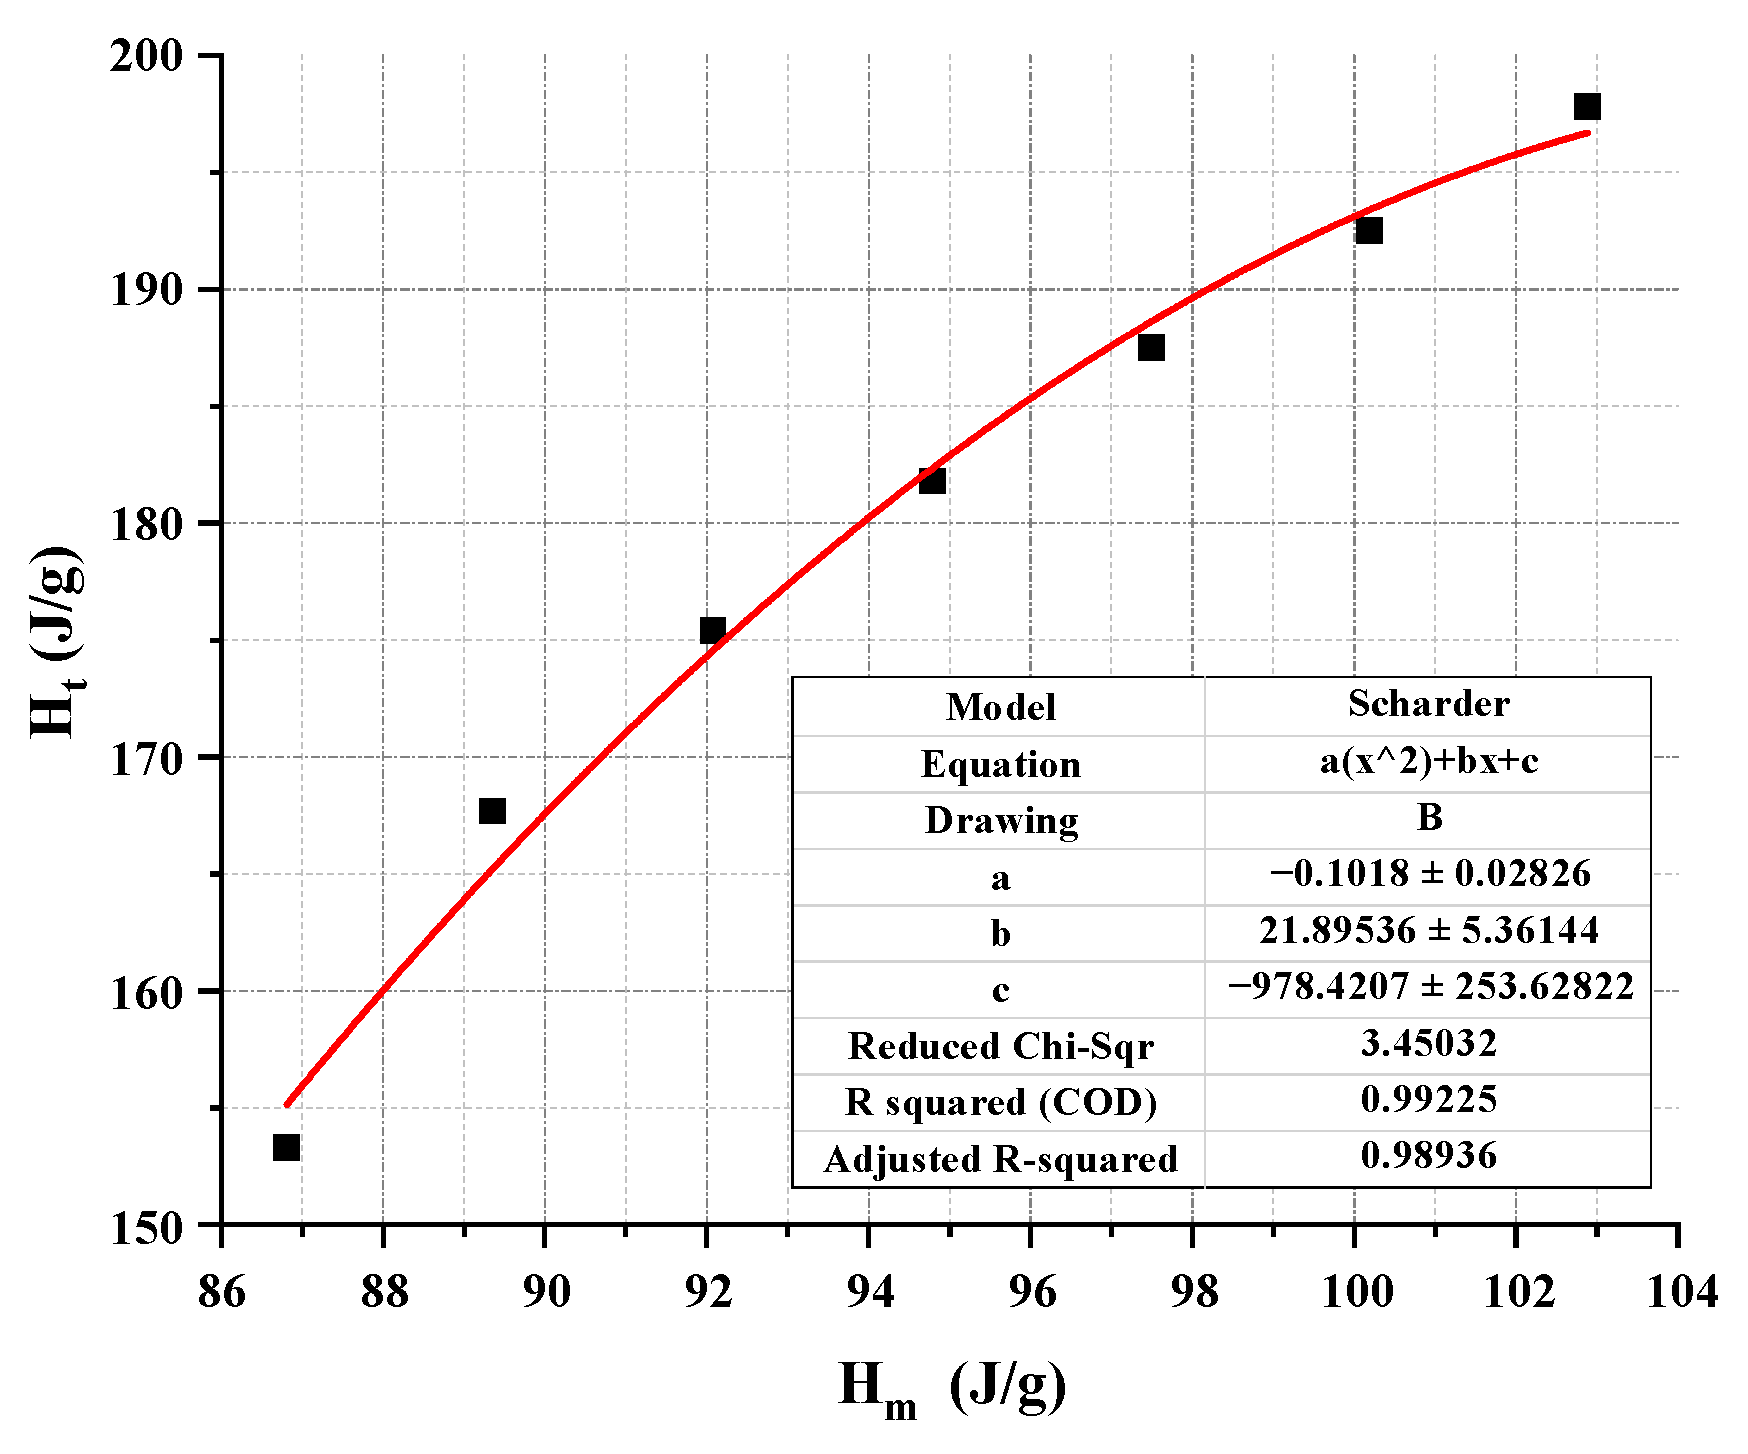
3.2.3. Thermodynamic Model Analysis

The conclusion in the previous text has proven that correcting the phase change temperature Tm calculated by the Schrader equation can obtain a predicted phase change temperature value that is very close to the experimental value. Therefore, in this section, the DSC data of the ternary PCM is further used to fit the modified Schrader equation to obtain a theoretical model suitable for calculating the thermal performance parameters of the ternary PCM. Similar to the derivation of binary PCM, the pseudo binary eutectic phase diagram between D-3 binary PCM and n-tetradecane is first drawn, as shown in Figure 14. According to the figure, when the mass ratio of binary PCM to n-tetradecane is 0.714:0.286, the ternary PCM reaches its lowest eutectic point. This ratio is very close to the result of 0.7:0.3 measured by DSC, indicating that the prediction of the lowest eutectic point by the Schrader formula is still applicable to multicomponent eutectic mixtures, such as ternary PCM.
According to Equation (19), the predicted phase change temperature of the uncorrected ternary PCM is calculated and fitted with the measured temperature obtained through DSC, obtaining the corrected parameters for the predicted phase change temperature of the ternary PCM. The fitting results are shown in Figure 15, and the correlation coefficient R2 of the fitting can reach 0.986, indicating that the fitting accuracy meets the requirements. The final calculation formula for phase change temperature is listed in Equation (24).
T m = 1 T A R ln x A Δ H A 1 T m = 1 T B R ln x B Δ H B 1 T c = 0.9605 T m + 0.149 T m + 1.1797
The corrected predicted phase change temperature values are compared with the actual phase transition temperature values measured by DSC, and the results are shown in Figure 16. Moreover, the deviation coefficient bx continued to be used to characterize the degree of deviation between and within the ternary PCM, as shown in Table 10. It is evident that all of the deviation coefficients bx are all less than 0.035, and the error of the predicted values falls within an acceptable range, proving the accuracy and reliability of the theory for calculating the melting point of ternary PCM.
The experimental results in Section 3.2.2 show that the variation pattern of the latent heat value of the ternary PCM is not consistent with the melting point. More specifically, the latent heat value of ternary PCM does not reach the lowest value at a specific composition ratio such as the melting point, but rather exhibits a corresponding positive correlation with changes in the mass fraction of high latent heat components. Therefore, for the theoretical prediction of the melting latent heat of ternary PCM, a parabolic equation rather than an exponential model is used to make more appropriate modifications to the Schrader formula. The designed latent heat value prediction formula is shown in the Equation (25).
H m = T m i = 1 n x i H i T i + x i ( c p , l i c p , s i ) ln T m T i H c = a H m 2 + b H m + c
where H c is the predicted value of the corrected phase change latent heat, (J/g); H m is the predicted value of the uncorrected phase change latent heat, (J/g); a , b and c are the parameters used to modify the equation; and the physical meanings of the other parameters are consistent with those in Equation (20).
The fitting curve between the predicted and experimental values of the phase change latent heat of the ternary PCM is shown in Figure 17. The fitting results show a correlation coefficient R2 of 0.989, which strongly proves the accuracy and reliability of the phase change latent heat prediction function. The revised phase change latent heat prediction model is shown in Equation (26)
H m = T m i = 1 n x i H i T i + x i ( c p , l i c p , s i ) ln T m T i H c = 0.1018 H m 2 + 21.8954 H m + 978.4207
The comparison between the corrected predicted values and experimental values of the phase change latent heat of the ternary PCM is shown in Figure 17 and the calculation results of deviation coefficients are shown in Table 11. Figure 17 and Table 11 demonstrate that the predicted values of phase change latent heat are very close to the experimental values, with a maximum difference of no more than 3 J/g and a deviation coefficient of bx less than 0.004. This indicates that the model error is very small, and the method of accurately predicting the overall phase change latent heat value of eutectic mixtures based on the characteristic values of component latent heat is feasible.
The prediction model for the phase change temperature and latent heat of ternary PCM has been fully derived and proven to be accurate. In addition, it can be clearly concluded that the influence of composition ratio on different thermal performance parameters of EPCM is different. When conducting theoretical derivation, different thermodynamic models should be constructed based on the thermal performance test values of the material.

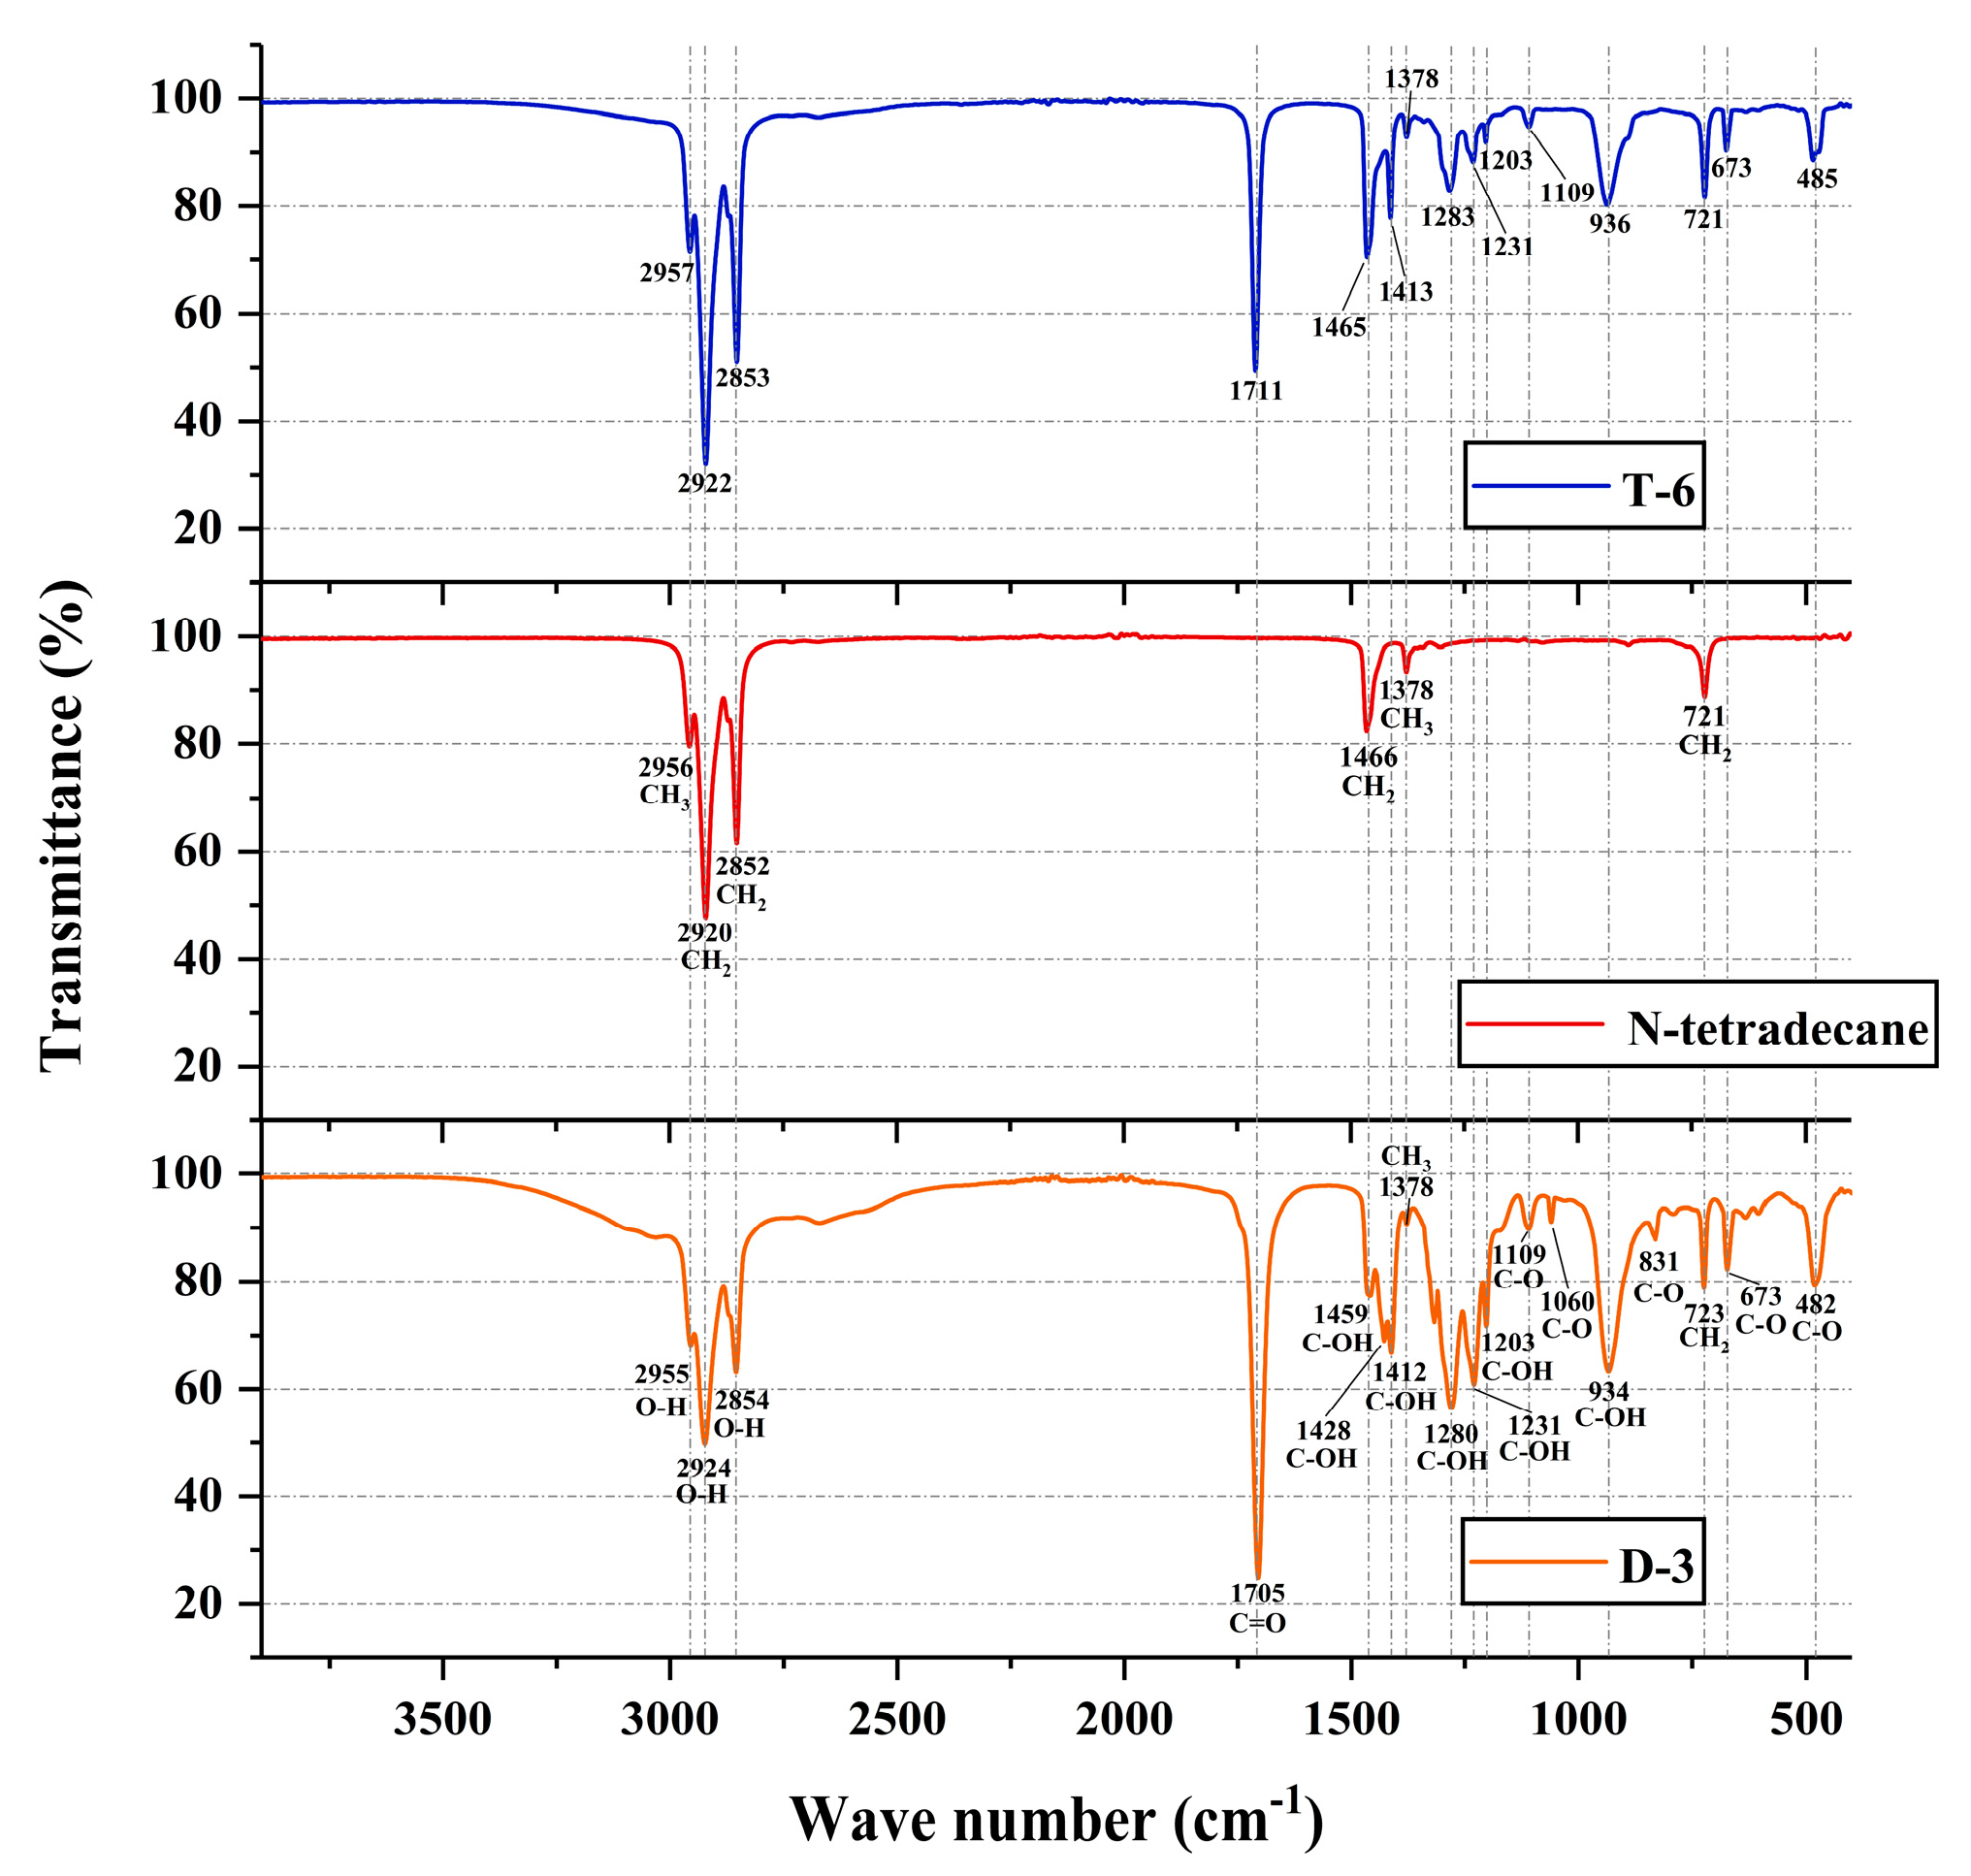
3.2.4. FTIR Analysis

Figure 18 shows the FTIR spectrum test results of the T-6 ternary PCM and its components. Similar to the test results in Section 3.1.4, the vibration peaks in the T-6 sample can also be sourced from the D-3 binary PCM and n-tetradecane. In detail, the vibration peaks appearing at wave numbers 2957–2853 cm−1, 1465 cm−1, 1378 cm−1, and 721 cm−1 in the T-6 sample are attributed to the superposition of the vibration peaks of the D-3 binary PCM and n-tetradecane, while the other vibration peaks in the sample are independently inherited from the D-3 binary PCM. These results clearly indicate that only physical changes occur during the mixing process of ternary PCM. Tetradecane has a good co melting effect with two fatty acids, and there is no mutual interference in the chemical properties of these three components.

4. Conclusions

In this research, capric acid, n-octanoic acid, and n-tetradecane are mixed to prepare binary or ternary EPCM. The thermal and chemical stability properties of EPCM are experimentally tested and discussed. The calculation and prediction of corresponding thermal parameters are also completed through a modified thermodynamic model. The main conclusions are as follows:
(1)
The experimental results of the cooling curve and DSC show that the binary PCM reaches the minimum eutectic point of 1.42 °C at a mass ratio of 0.33:0.67 for capric acid to n-octanoic acid, while the ternary PCM reaches the minimum eutectic point of 0.34 °C at a mass ratio of 0.231:0.469:0.3 for capric acid, n-octanoic acid, and n-tetradecane. It can be seen that the melting point of EPCM prepared by mixing organic PCM, is lower than any of its components, and it can reach its lowest value un-der specific composition ratios. The phase change temperatures of the new binary and ternary PCM obtained in this study are both close to 0 °C, which are suitable for cooling work in practical engineering such as cold storage air conditioning and cold chain transportation. In addition, the latent heat of EPCM is between the lowest and highest values of the latent heat of the constituent components, and its value increases with the overall heat storage density of the material. At the composition ratio of reaching the lowest eutectic point, binary PCM and ternary PCM have melting latent heats of 126.1 J/g and 167.7 J/g, respectively. Therefore, when designing the mix proportion of EPCM, the final latent heat of the material can be changed by adjusting the composition proportion according to actual needs.
(2)
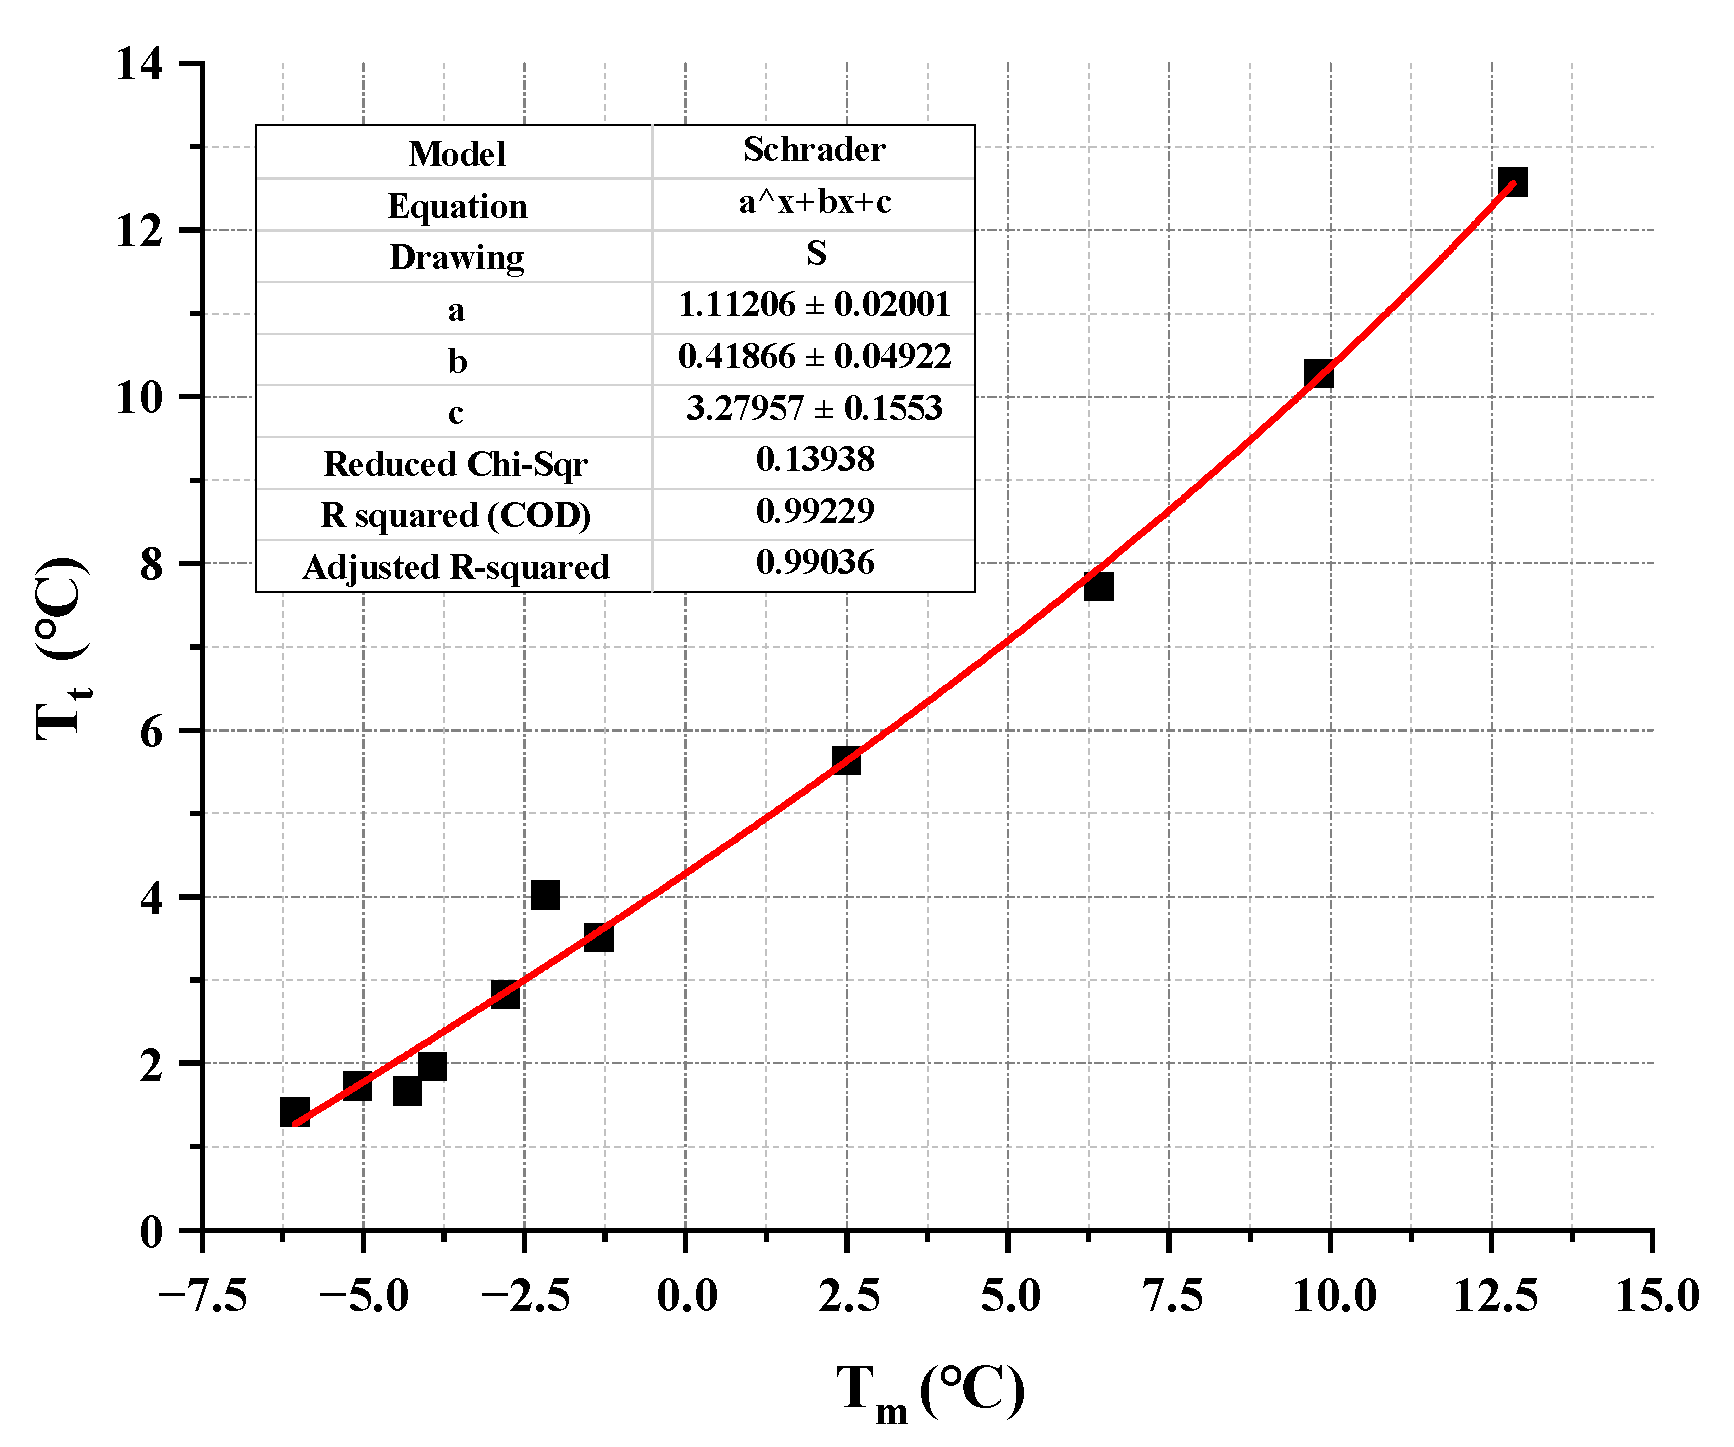
The initial Schrader equation can accurately predict the composition ratio of the lowest eutectic point in EPCM, but the thermodynamic parameters calculated through it are far from the experimental values. Considering the simplicity and accuracy of the thermodynamic model, this study corrected the initial Schrader equation by quadratic fitting the thermodynamic parameters obtained from the initial Schrader equation. The results show that the modified thermodynamic model has a high fitting accuracy, with correlation coefficients R2 above 0.986, and the errors between the predicted and experimental values are also below 0.06. These conclusions indicate that the thermodynamic model composed of the modified Schrader equation can provide reliable theoretical support for the prediction of thermal parameters and composition ratio screening of organic eutectic phase change materials in practical engineering.
(3)
The chemical stability and eutectic effect of EPCM are tested and characterized by FTIR. The results indicate that capric acid, n-octanoic acid, and n-tetradecane can effectively co melt with each other. In the generation process of binary PCM and ternary PCM, there is only physical binding and no chemical reaction. Therefore, the chemical properties between each component are almost unaffected, and the thermal performance of the prepared EPCM is also enhanced. The above conclusion strongly proves that the method of preparing EPCM by melt blending organic PCM has good reliability and scientificity.

Author Contributions

B.L.: Conceptualization, Methodology, Investigation, Formal analysis, Writing—original draft. S.W.: Project administration, Funding acquisition, Supervision. W.J.: Investigation, Data curation, Writing—review & editing. J.X.: Resources, Data curation, Software. Z.L.: Data curation, Software, Validation. H.Y.: Resources, Investigation. Y.S.: Methodology. All authors have read and agreed to the published version of the manuscript.

Funding

This work is financially supported by Key Research and Development Program of Shaanxi Province (No. 2022SF-375), The Research Project of China Railway 20th Bureau Group Co. Ltd. (No. YF2200LJ12B), China Postdoctoral Science Foundation (No. 2022M723683), Shaanxi Key Laboratory of Safety and Durability of Concrete Structures Open Fund project (No. SZ02307), National Key R&D Program of China (No. 2022YFC3801602).

Data Availability Statement

The data presented in this study are available on request from the corresponding author. The data are not publicly available due to patent rights.

Conflicts of Interest

Authors Bo Liu, Wurong Jia, Jiangsheng Xie were employed by the company China Railway 20th Bureau Group Co., Ltd. Author Yanwen Sun was employed by the company China Construction Standards Design and Research Institute Co., Ltd. The authors declare that this study received funding from China Railway 20th Bureau Group Co., Ltd. The funder was not involved in the study design, collection, analysis, interpretation of data, the writing of this article or the decision to submit it for publication. All authors declare that the research was conducted in the absence of any commercial or financial relationships that could be construed as a potential conflict of interest.

References

  1. Eanest, J.B.; Valan, A.A. Characterization and stability analysis of eutectic fatty acid as a low cost cold energy storage phase change material. J. Energy Storage 2020, 31, 101708. [Google Scholar]
  2. Veerakumar, C.; Sreekumar, A. Preparation, thermophysical studies, and corrosion analysis of a stable capric acid/cetyl alcohol binary eutectic phase change material for cold thermal energy storage. Energy Technol. 2018, 6, 397–405. [Google Scholar] [CrossRef]
  3. Zhao, Y.; Zhang, X.; Xu, X.; Zhang, S. Development of composite phase change cold storage material and its application in vaccine cold storage equipment. J. Energy Storage 2020, 30, 101455. [Google Scholar] [CrossRef]
  4. Sana, B.S.; Hamida, M.B.B. Alternate PCM with air cavities in LED heat sink for transient thermal management. Int. J. Numer. Methods Heat Fluid Flow 2019, 29, 4377–4393. [Google Scholar]
  5. Hamida, M.B.B.; Hajlaoui, K.; Almeshaal, M.A. A 3D numerical analysis using phase change material for cooling circular light emitting diode. Case Stud. Therm. Eng. 2023, 43, 102792. [Google Scholar] [CrossRef]
  6. Izadi, M.; Sheremet, M.; Hajjar, A.; Galal, A.M.; Mahariq, I.; Jarad, F.; Hamida, M.B.B. Numerical investigation of magne-to-thermal-convection impact on phase change phenomenon of Nano-PCM within a hexagonal shaped thermal energy storage. Appl. Therm. Eng. 2023, 223, 119984. [Google Scholar] [CrossRef]
  7. Izadi, M.; Fagehi, H.; Imanzadeh, A.; Altnji, S.; Ben Hamida, M.B.; Sheremet, M.A. Influence of finned charges on melting process performance in a thermal energy storage. Therm. Sci. Eng. Prog. 2023, 37, 101547. [Google Scholar] [CrossRef]
  8. Du, K.; Calautit, J.; Wang, Z.H.; Wu, Y.; Liu, H. A review of the applications of phase change materials in cooling, heating and power generation in different temperature ranges. Appl. Energy 2018, 220, 242–273. [Google Scholar] [CrossRef]
  9. Chandrasekaran, P.; Cheralathan, M.; Kumaresan, V.; Velraj, R. Enhanced heat transfer characteristics of water based copper oxide nanofluid PCM (phase change material) in a spherical capsule during solidification for energy efficient cool thermal storage system. Energy 2014, 72, 636–642. [Google Scholar] [CrossRef]
  10. Oró, E.; Miró, L.; Farid, M.M.; Martin, V.; Cabeza, L.F. Energy management and CO2 mitigation using phase change materials (PCM) for thermal energy storage (TES) in cold storage and transport. Int. J. Refrig. 2014, 42, 26–35. [Google Scholar] [CrossRef]
  11. Sha, Y.S.; Hua, W.S.; Cao, H.F.; Zhang, X. Properties and encapsulation forms of phase change material and various types of cold storage box for cold chain logistics: A review. J. Energy Storage 2022, 55, 105426. [Google Scholar] [CrossRef]
  12. Su, W.G.; Darkwa, J.; Kokogiannakis, G. Review of solid-liquid phase change materials and their encapsulation technologies. Renew. Sustain. Energy Rev. 2015, 48, 373–391. [Google Scholar] [CrossRef]
  13. Lin, Y.X.; Alva, G.; Fang, G.Y. Review on thermal performances and applications of thermal energy storage systems with inorganic phase change materials. Energy 2018, 165, 685–708. [Google Scholar] [CrossRef]
  14. Shamseldin, A.M.; Fahad, A.A.; Nasiru, I.I.; Zahir, M.H.; Al-Ahmed, A.; Saidur, R.; Sahin, A.Z. A review on current status and challenges of inorganic phase change materials for thermal energy storage systems. Renew. Sustain. Energy Rev. 2017, 70, 1072–1089. [Google Scholar]
  15. Xue, F.; Qi, X.D.; Huang, T.; Tang, C.Y.; Zhang, N.; Wang, Y. Preparation and application of three-dimensional filler network towards organic phase change materials with high performance and multi-functions. Chem. Eng. J. 2021, 419, 129620. [Google Scholar] [CrossRef]
  16. Nassima, R. A Comprehensive Review of Composite Phase Change Materials (cPCMs) for Thermal Management Applications, Including Manufacturing Processes, Performance, and Applications. Energies 2022, 15, 8271. [Google Scholar]
  17. Philip, N.; Dheep, G.R.; Sreekumar, A. Cold thermal energy storage with lauryl alcohol and cetyl alcohol eutectic mixture: Thermophysical studies and experimental investigation. J. Energy Storage 2020, 27, 101060. [Google Scholar] [CrossRef]
  18. Zhou, S.X.; Zhang, X.L.; Liu, S.; Li, Y.Y.; Xu, X.F. Performance study on expand graphite/organic composite phase change material for cold thermal energy storage. Energy Procedia 2019, 158, 5305–5310. [Google Scholar]
  19. Ke, H.Z. Phase diagrams, eutectic mass ratios and thermal energy storage properties of multiple fatty acid eutectics as novel solid-liquid phase change materials for storage and retrieval of thermal energy. Appl. Therm. Eng. 2017, 113, 1319–1331. [Google Scholar] [CrossRef]
  20. Kalidasan, B.; Pandey, A.K.; Saidur, R.; Mishra, Y.K. Experimental evaluation of binary and ternary eutectic phase change material for sustainable thermal energy storage. J. Energy Storage 2023, 68, 107707. [Google Scholar]
  21. Zuo, P.X.; Liu, Z.; Zhang, H.; Dai, D.; Fu, Z.; Corker, J.; Fan, M. Formulation and phase change mechanism of Capric acid/Octadecanol binary composite phase change materials. Energy 2023, 270, 126943. [Google Scholar] [CrossRef]
  22. Liu, L.; Niu, J.L.; Wu, J.Y. Development of highly stable paraffin wax/water phase change material nano-emulsions as potential coolants for thermal management. Sol. Energy Mater. Sol. Cells 2023, 252, 112184. [Google Scholar] [CrossRef]
  23. Teather, K.; Siddiqui, K. Non-invasive measurement of the temperature field of a phase change material (PCM) using thermal imaging. Exp. Therm. Fluid. Sci. 2023, 148, 110991. [Google Scholar] [CrossRef]
  24. ASTM D87-2009; Standard Test Method for Melting Point of Petroleum Wax (Cooling Curve). Annual Book of ASTM Standards: Philadelphia, PA, USA, 2009.
  25. Fatahi, H.; Claverie, J.P.; Poncet, S. Characterization by differential scanning calorimetry of thermal storage properties of organic PCMs with operating temperature of 150 °C. J. Chem. Thermodyn. 2023, 186, 107136. [Google Scholar] [CrossRef]
  26. Li, L.; Yu, H.; Wang, X.; Zheng, S. Thermal analysis of melting and freezing processes of phase change materials (PCMs) based on dynamic DSC test. Energy Build. 2016, 130, 388–396. [Google Scholar] [CrossRef]
  27. GB/T 28724-2012; Determination of Melting Temperature for Chemicals (Pharmaceuticals)—Differential Scanning Calorimetry. China Petroleum and Chemical Industry Federation: Beijing, China, 2012.
  28. Chelouche, S.; Trache, D.; Pinho, S.P.; Khimeche, K. Experimental and modeling studies of binary organic eutectic systems to be used as stabilizers for nitrate esters-based energetic materials. Fluid Phase Equilibria 2019, 498, 104–115. [Google Scholar] [CrossRef]
  29. Su, A.; Li, S.F. Measurement and correlation of solid–liquid phase equilibria for binary and ternary systems consisting of N-vinylpyrrolidone, 2-pyrrolidone and water. Chin. J. Chem. Eng. 2018, 24, 806–811. [Google Scholar] [CrossRef]
  30. Costa, M.C.; Boros, L.A.D.; Batista, M.L.S.; Coutinho, J.; Krähenbühl, M.; Meirelles, A.J. Phase diagrams of mixtures of ethyl palmitate with fatty acid ethyl esters. Fuel 2012, 91, 177–181. [Google Scholar] [CrossRef]
  31. Shen, T.; Peng, H.; Ling, X. Experimental Measurements and Thermodynamic Modeling of Melting Temperature of the Binary Systems n-C11H24-n-C14H30, n-C12H26-n-C13H28, n-C12H26-n-C14H30, and n-C13H28-n-C15H32 for Cryogenic Thermal Energy Storage. Ind. Eng. Chem. Res. 2019, 58, 15026–15035. [Google Scholar] [CrossRef]
  32. Sánchez, F.G.; Schwartzentruber, J.; Ammar, M.N.; Renon, H. Modeling of Multiphase Liquid Equilibria for Multicomponent Mixtures. Fluid Phase Equilibria 1996, 121, 207–225. [Google Scholar] [CrossRef]
  33. Wei, D.; Han, S.; Shen, X. Solid–liquid phase equilibria of (n-octadecane with myristic, and palmitic acid) binary mixtures used as phase change materials (PCMs). J. Chem. Thermodyn. 2016, 101, 7–11. [Google Scholar] [CrossRef]
  34. Lv, S.L.; Zhu, N.; Feng, G.H. Eutectic mixtures of capric acid and lauric acid applied in building wallboards for heat energy storage. Energy Build. 2006, 38, 708–711. [Google Scholar]
  35. Zhang, Y.P.; Su, Y.H.; Ge, X.S. Prediction of the melting temperature and the fusion heat of (quasi-) eutectic PCM. J. China Univ. Sci. Technol. 1995, 25, 474–478. [Google Scholar]
  36. Yuan, Y.P.; Tao, W.Q.; Cao, X.L.; Li, B. Theoretic prediction of melting temperature and latent heat for a fatty acid eutectic mixture. J. Chem. Eng. Data 2011, 56, 2889–2891. [Google Scholar]
  37. Zhao, P.; Yue, Q.; He, H.; Gao, B.; Wang, Y.; Li, Q. Study on phase diagram of fatty acids mixtures to determine eutectic temperatures and the corresponding mixing proportions. Appl. Energy 2014, 115, 483–490. [Google Scholar] [CrossRef]
  38. Singh, M.B.; Kumar, V.S.; Chaudhary, M.; Singh, P. A mini review on synthesis, properties and applications of deep eutectic solvents. J. Indian Chem. Soc. 2021, 98, 100210. [Google Scholar] [CrossRef]
  39. Karaman, S.; Karaipekli, A.; Sarı, A.; Bicer, A. Polyethylene glycol (PEG)/diatomite composite as a novel form-stable phase change material for thermal energy storage. Sol. Energy Mater. Sol. Cells 2011, 95, 1647–1653. [Google Scholar] [CrossRef]
  40. Huang, X.; Cui, Y.D.; Yin, G.Q.; Zhang, B.N.; Feng, G.Z. Kinetic study on solid-liquid transitions of fatty acids ternary mixtures phase change materials. New Chem. Mater. 2015, 43, 149–151. [Google Scholar]
  41. Nazir, H.; Batool, M.; Ali, M.; Kannan, A.M. Fatty acids based eutectic phase change system for thermal energy storage applications. Appl. Therm. Eng. 2018, 142, 466–475. [Google Scholar] [CrossRef]
  42. Shen, T.; Li, S.; Peng, H.; Ling, X. Experimental study and thermodynamic modeling of solid-liquid equilibrium of binary systems: Dodecane-tetradedcane and tridecane-pentadecane for cryogenic thermal energy storage. Fluid Phase Equilibria 2019, 493, 109–119. [Google Scholar] [CrossRef]
  43. Wang, Y.B.; Li, J.W.; Miao, M.W.J.; Su, Y.; He, X.; Strnadel, B. Preparation and characterizations of hydroxyapatite microcapsule phase change materials for potential building materials. Constr. Build. Mater. 2021, 297, 123576. [Google Scholar] [CrossRef]
  44. Cheng, W.L.; Zhang, R.M.; Xie, K.; Liu, N.; Wang, J. Heat conduction enhanced shape-stabilized paraffin/HDPE composite PCMs by graphite addition: Preparation and thermal properties. Sol. Energy Mater. Sol. Cells 2010, 94, 1636–1642. [Google Scholar] [CrossRef]
Figure 1. Preparation process of ternary PCM temperature measurement samples.
Buildings 13 03043 g001
Figure 2. Cooling curve test schematic diagram.
Buildings 13 03043 g002
Figure 3. The DSC thermal analyzer.
Buildings 13 03043 g003
Figure 4. The phase diagram of an ideal binary PCM.
Buildings 13 03043 g004
Figure 5. The cooling curve test results of binary PCM [39].
Buildings 13 03043 g005
Figure 6. The DSC curves of binary PCM [40].
Buildings 13 03043 g006
Figure 7. The eutectic phase diagram of binary PCM.
Buildings 13 03043 g007
Figure 8. The parameter fitting diagram for melting point of binary PCM.
Buildings 13 03043 g008
Figure 9. The comparison of Tc and Tt for binary PCM.
Buildings 13 03043 g009
Figure 10. The FTIR spectra of capric acid, n-octanoic acid, and D-3 binary PCM.
Buildings 13 03043 g010
Figure 11. The cooling curve test results of ternary PCM.
Buildings 13 03043 g011
Figure 12. The DSC test results of ternary PCM.
Buildings 13 03043 g012
Figure 13. Comparison of phase change temperatures measured by different testing methods.
Buildings 13 03043 g013
Figure 14. The eutectic phase diagram of ternary PCM.
Buildings 13 03043 g014
Figure 15. The parameter fitting diagram for melting point of ternary PCM.
Buildings 13 03043 g015
Figure 16. The comparison of Tc and Tt for ternary PCM.
Buildings 13 03043 g016
Figure 17. The parameter fitting diagram for latent heat of ternary PCM.
Buildings 13 03043 g017
Figure 18. The FTIR spectra of D-3 binary PCM, n-tetradecane, and T-6 ternary PCM.
Buildings 13 03043 g018
Table 1. The thermal and chemical properties of raw PCMs.
Density
(g/mL)
Molecular
Weight
Melting
Point (°C)
Latent
Heat (J·g−1)
Flash
Point (°C)
Water
Solubility (g/L)
Capric acid0.8858172.2631.5172.8121.80.15
N-octanoic acid0.91144.2116.5149.91300.68
N-tetradecane0.763198.396219.61010
Table 2. The composition ratios of binary PCM.
B-1B-2B-3B-4B-5B-6B-7
Capric acid (wt%)20304050607080
N-octanoic Acid (wt%)80706050403020
Table 3. The composition ratios of ternary PCM.
T-1T-2T-3T-4T-5T-6T-7
Binary PCM (wt%)20304050607080
N-tetradecane (wt%)80706050403020
Table 4. The platform section temperature and cooling time of binary PCM.
B-1B-2B-3B-4B-5B-6B-7
Platform temperature (°C)3.511.854.025.637.7210.2812.58
Cooling time (min)85978482777169
Table 5. The composition ratio of DSC test samples for binary PCM.
D-1D-2B-2D-3D-4
Capric acid (wt%)24%27%30%33%36%
N-octanoic acid (wt%)76%73%70%67%64%
Table 6. The thermal parameters of the binary PCM.
SampleMelting Point (°C)Crystallizing Point (°C)Supercooling (°C)Melting Enthalpy (J/g)
D-12.831.4581.372116.8
D-21.961.1210.839119.6
B-21.731.0930.637128.2
D-31.420.8890.531126.1
D-41.671.0520.618122.9
Table 7. The deviation coefficients between Tc and Tt values of binary PCM.
Capric Acid (wt%)Tc (°C)Tt (°C)bx
203.5543.510.003099
242.8292.830.000052
272.2871.960.038474
301.7451.730.002095
331.3051.420.021103
362.0211.670.047592
403.2373.980.053971
505.625.630.000446
607.9917.720.008615
7010.2810.280.000011
8012.50612.580.001472
Table 8. The platform section temperature and cooling time of ternary PCM.
T-1T-2T-3T-4T-5T-6T-7
Platform temperature (°C)4.423.933.092.731.641.152.06
Cooling time (min)130135127121117112105
Table 9. The thermal parameters of ternary PCM.
SampleMelting Point
/°C
Crystallizing Point
/°C
Supercooling
/°C
Melting Enthalpy
/J·g−1
T-11.43−1.232.66197.8
T-21.17−1.122.29192.5
T-31.02−1.042.06187.5
T-40.84−1.011.85181.8
T-50.62−0.921.54175.4
T-60.34−0.981.32167.7
T-70.532.92.37153.3
Table 10. The deviation coefficients between Tc and Tt values of ternary PCM.
Binary PCM (wt%)Tc (°C)Tt (°C)bx
201.3891.430.007299
301.2181.170.009963
401.0331.020.003168
500.8330.840.001979
600.6170.620.001045
700.3870.340.032241
800.4670.530.031679
Table 11. The deviation coefficients between Hc and Ht values of ternary PCM.
Binary PCM (wt%)Hc (J/g)Ht (J/g)bx
20196.7197.80.001388
30193.42192.50.001187
40188.64187.50.001514
50182.36181.80.000771
60174.57175.40.001189
70165.24167.70.003692
80155.15153.30.002995
Disclaimer/Publisher’s Note: The statements, opinions and data contained in all publications are solely those of the individual author(s) and contributor(s) and not of MDPI and/or the editor(s). MDPI and/or the editor(s) disclaim responsibility for any injury to people or property resulting from any ideas, methods, instructions or products referred to in the content.

