Article

Mechanical Properties and Sulfate Freeze–Thaw Resistance of Calcium Carbonate Whisker-Reinforced Iron Ore Tailings Concrete

1
School of Intelligent Science and Engineering, Xi’an Peihua University, Xi’an 710125, China
2
The Engineering Design Academy of Chang’an University Co., Ltd., Xi’an 710064, China
3
Shaanxi Construction Engineering Holding Group, Joint Research Centre for Innovation in Future City Construction and Management, Xi’an 710116, China
*
Author to whom correspondence should be addressed.
Buildings 2024, 14(4), 1004; https://doi.org/10.3390/buildings14041004
Submission received: 17 February 2024 / Revised: 31 March 2024 / Accepted: 2 April 2024 / Published: 4 April 2024

Abstract

:
Iron ore tailings from iron ore mines pose environmental challenges. However, their reuse could provide significant environmental benefits. This study focused on producing clean concrete using iron ore tailings as crushed stone aggregate (IOTA) and calcium carbonate whiskers (CWs) as reinforcement. Five mixture groups were prepared: normal concrete (NAC) with natural crushed stone aggregate (NA), iron ore tailings concrete (TAC) with IOTA, and CW (10%, 20%, and 30%)-reinforced TAC (TAC-CW). Mechanical properties like the compressive strength (fcu) and splitting tensile strength (fst), as well as sulfate freeze–thaw (F-T) cycle resistance, were thoroughly investigated. Additionally, pore structure and microstructure were characterized using nuclear magnetic resonance (NMR) and scanning electron microscopy (SEM) techniques. The results showed that IOTA’s complete replacement of NA decreased concrete mechanical properties and frost resistance, but incorporating CWs effectively compensated for these losses. Specifically, the fcu and fst of TAC-CW20 with 20% CWs increased by 23.26% and 49.6% compared to TAC and were higher than those of NAC. With increasing F-T cycles, concrete internal pore structure significantly deteriorated, and corrosive products increased significantly, which was further confirmed by SEM. TAC-CW20 significantly optimized pore structure. Overall, the successful application of iron ore tailings as eco-friendly materials enhanced concrete performance and reduced the environmental impact of construction activities.

1. Introduction

The rapid expansion of manufacturing industries, including electronics, automotive, and civil engineering industries, has resulted in an increasing demand for raw metal materials such as iron, aluminum, and copper. Consequently, mining activities have surged, resulting in a substantial accumulation of metal tailings, unavoidable byproducts of ore flotation. Statistics indicate that China’s metal tailings have exceeded 23.1 billion tons [1], with the stockpile volume growing annually [2,3]. This accumulation consumes vast land and raises significant environmental concerns [4]. Therefore, the large-scale resource utilization of metal tailings is urgent [5].
According to reports, iron ore tailings have the most enormous stockpile volume among various metal tailings, significantly impacting the ecological environment [6,7,8]. Previous research suggests that iron ore tailings could substitute natural aggregate in producing building products due to their comparable composition and relatively stable microstructure and quality [9], and some studies have proposed the utilization of iron ore tailings as aggregates in cleaner concrete production. For example, Zhang et al. [10] demonstrated that substituting 20–40% of iron ore tailings sand in concrete resulted in a notably higher compressive strength (fcu) compared to conventional concrete, albeit a decrease beyond the 40% substitution ratios. Similarly, Liu et al. [11] found that the optimal substitution ratio for iron ore tailings sand in shotcrete was 20%, as complete substitution led to decreased fcu. Xu et al. [12] and Li et al. [13] improved the performance of recycled aggregate concrete by incorporating 30% iron ore tailings sand, resulting in superior mechanical properties. However, exceeding a 50% substitution ratio deteriorated the mechanical properties of recycled aggregate concrete. Zhao et al. [14] observed reduced workability and fcu when preparing ultra-high-performance concrete (UHPC) with 100% iron ore tailings sand substitution. Ma et al. [15] prepared full iron tailings concrete (FITC) beams using iron tailings powder, iron tailings gravel, and sand and investigated the flexural behavior and found that the current design code in China effectively determines the load-carrying capacity of FITC beams. However, modifications are necessary for the deflection calculation formula. Zhao et al. [16] reported that deterioration in fcu was observed with the increase in the iron ore tailings replacement ratio. However, the incorporation of macrosynthetic fiber (MSF) compensated for the reduction in fcu caused by iron ore tailings. Ling et al. [17] studied the damage of iron ore tailings concrete under various conditions using uniaxial compression tests and discrete element modeling and found that the maximum stress during cyclic loading significantly influenced the number of fractures and that increasing the iron ore tailings aggregate content enhanced the concrete’s compressive stress, while reducing the particle size of these tailings helped prevent fracture formation. Furthermore, iron ore tailings have found applications in various building materials, including cement mortar [2], autoclaved aerated concrete [18], and ceramic tiles [19], showcasing their potential to reduce solid waste accumulation and natural aggregate extraction for material conservation and carbon reduction goals. Nonetheless, higher substitution ratios of iron ore tailings aggregates in concrete production may compromise other properties of the resultant concrete [20,21].
Calcium carbonate whiskers (CWs) offer a renewable and environmentally friendly solution for enhancing concrete performance [22,23]. Compared to alternative fibers and whiskers, CWs offer a cost-efficient manufacturing approach and uncomplicated production processes. Additionally, CWs have the potential to replace expensive commercial fibers, including carbon fiber (CF), polypropylene (PP) fiber, and polyvinyl alcohol (PVA) fiber [24]. Research conducted by Cao et al. [25,26] revealed that incorporating just 10% of calcium carbonate whiskers into cement-based composites effectively inhibited the formation of microcracks at a microscopic level, leading to improvements in the microstructure and overall physical properties of the composites. Similarly, Saulat et al. [27] found that adding calcium carbonate whiskers primarily bolstered compressive, flexural, splitting tensile, and impact strengths; toughness; and compactness in cement-based materials. Furthermore, Guo et al. [28] analyzed the impact of calcium carbonate whiskers on concrete properties alongside basalt fibers and mesh polypropylene fibers, highlighting their role in optimizing concrete porosity and enhancing its strength, toughness, and impact resistance.
In summary, adding CWs to concrete positively impacts its overall performance. However, existing studies primarily focus on the mechanical properties, overlooking aspects of durability and microscopic porosity. To address this gap and fully exploit the potential of incorporating iron ore tailings in concrete, this paper used iron ore tailings crushed stone aggregate (IOTA) to replace natural crushed stone aggregate (NA) completely and CWs as reinforcing materials. It systematically researched the fcu, splitting tensile strength (fst), and sulfate freeze–thaw (F-T) resistance of calcium carbonate whisker-reinforced iron ore tailings concrete. Additionally, pore characteristic and microstructure analyses were conducted using nuclear magnetic resonance (NMR) and scanning electron microscopy (SEM) techniques.

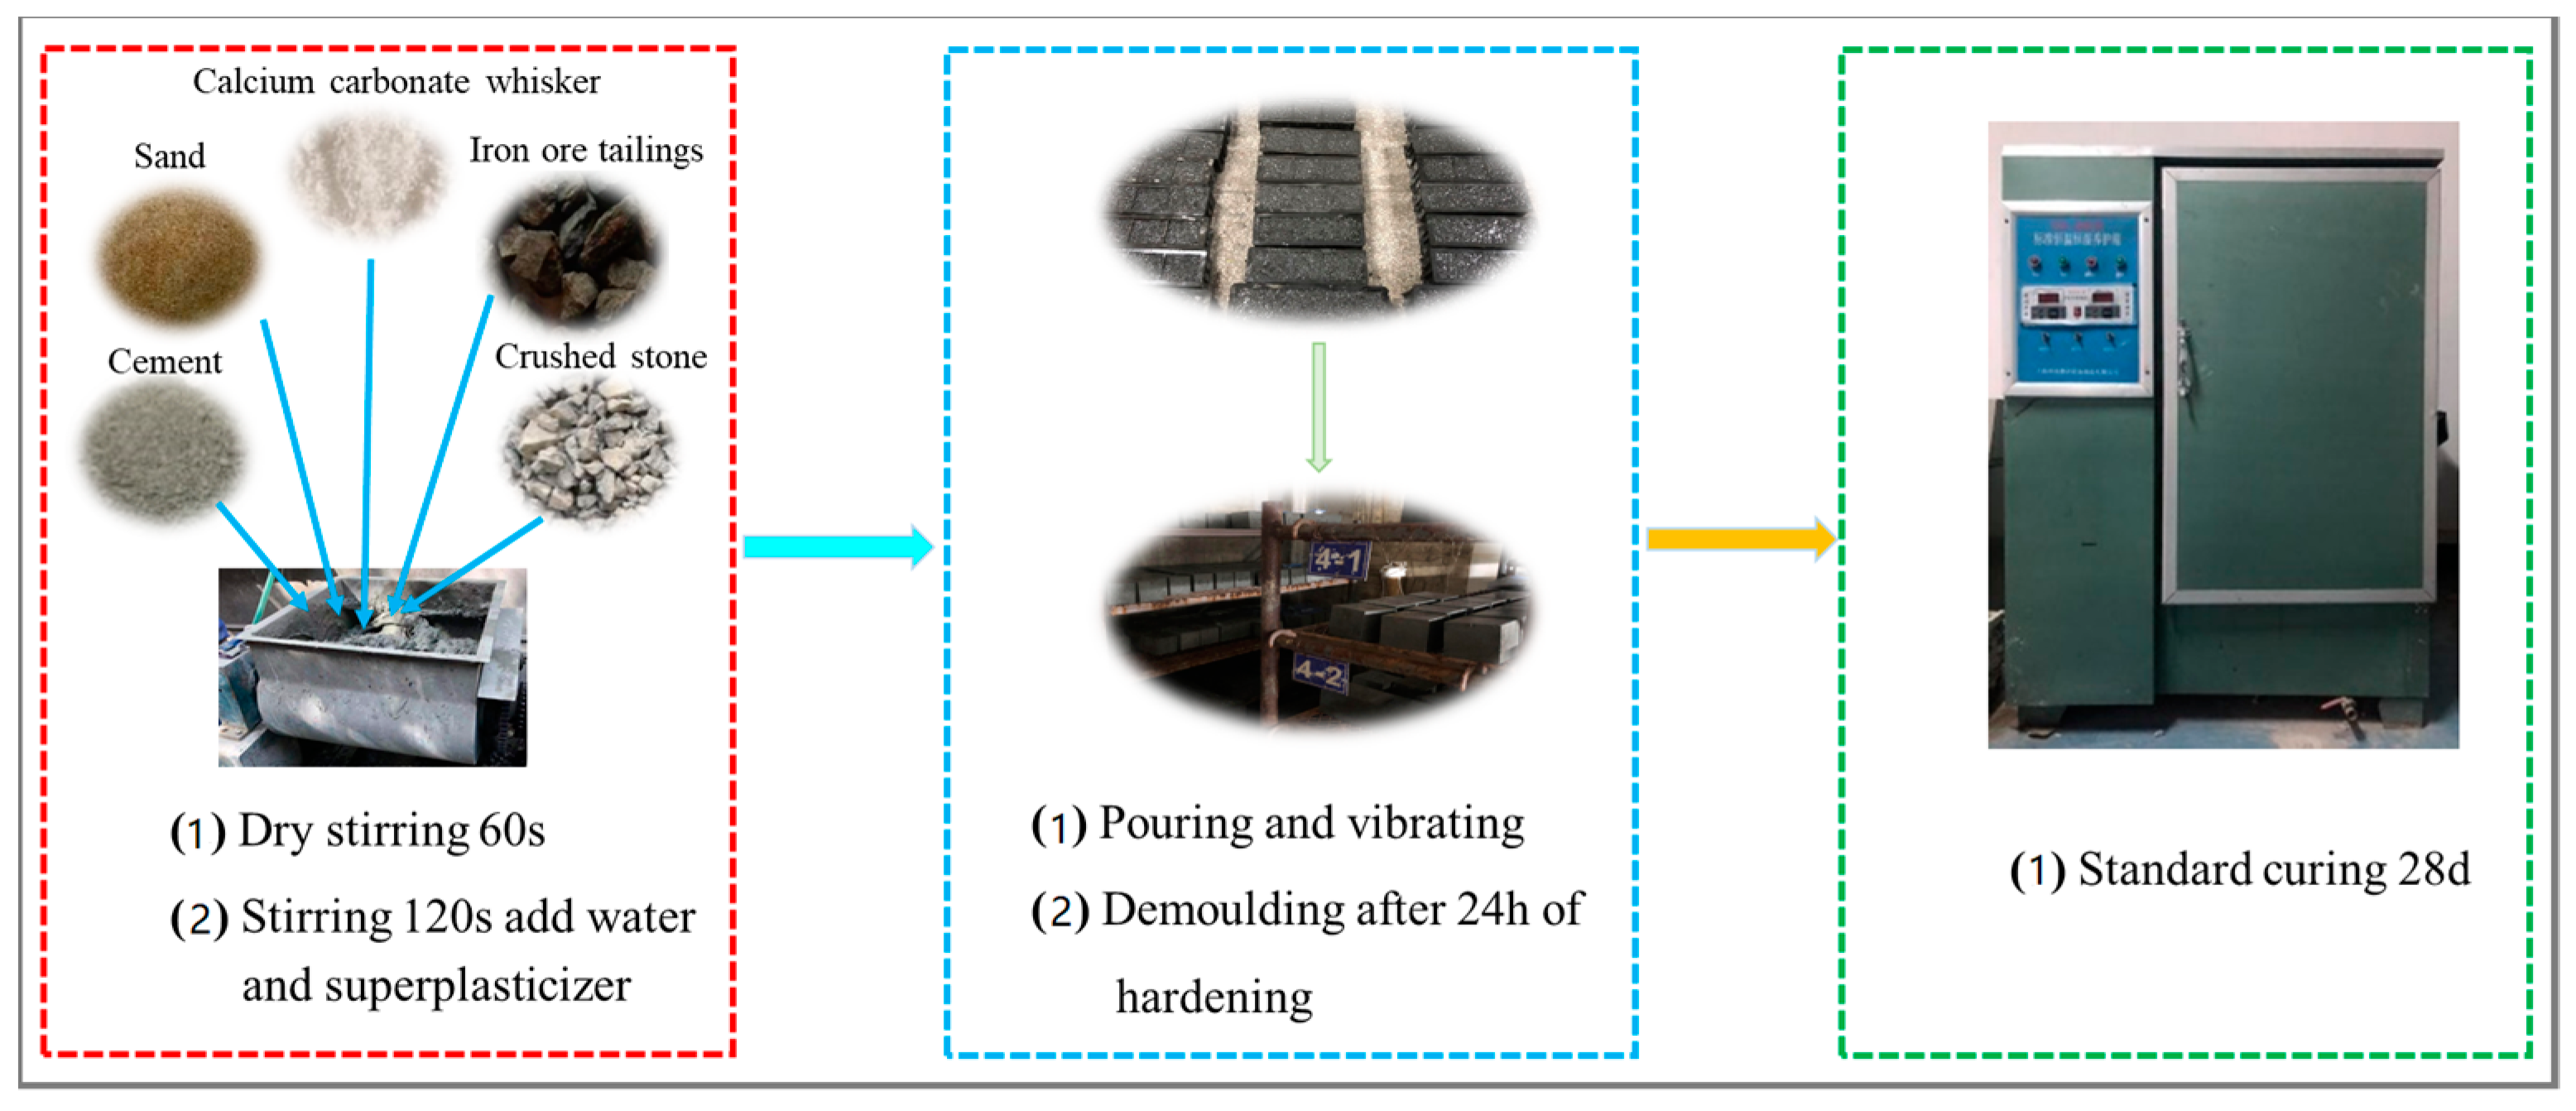
2. Experimental Details

2.1. Raw Materials

2.1.1. Cement and Natural Aggregates

The cement PO 42.5R was used as a cementitious material to prepare concrete. Natural aggregates for concrete mixing in this study, including NA and river sand (RS), were collected from the Ruishi Sand and Gravel Plant in Xi’an, Shaanxi Province, China. The maximum particle size of the crushed stone was chosen to be 31.5 mm, and the apparent density, water absorption, bulk density, mud content, and crushing index of the crushed stone were 2769.5 kg/m3, 0.63%, 1543.5 kg/m3, 2.6%, and 10.3%, respectively. The fineness modulus of the river sand was 2.71; thus, it constituted medium sand according to Chinese National Standard GB/T 14684-2011. The apparent density, water absorption, bulk density, and mud content of the river sand were 2689 kg/m3, 1.05%, 1679 kg/m3, and 2.3%, respectively.

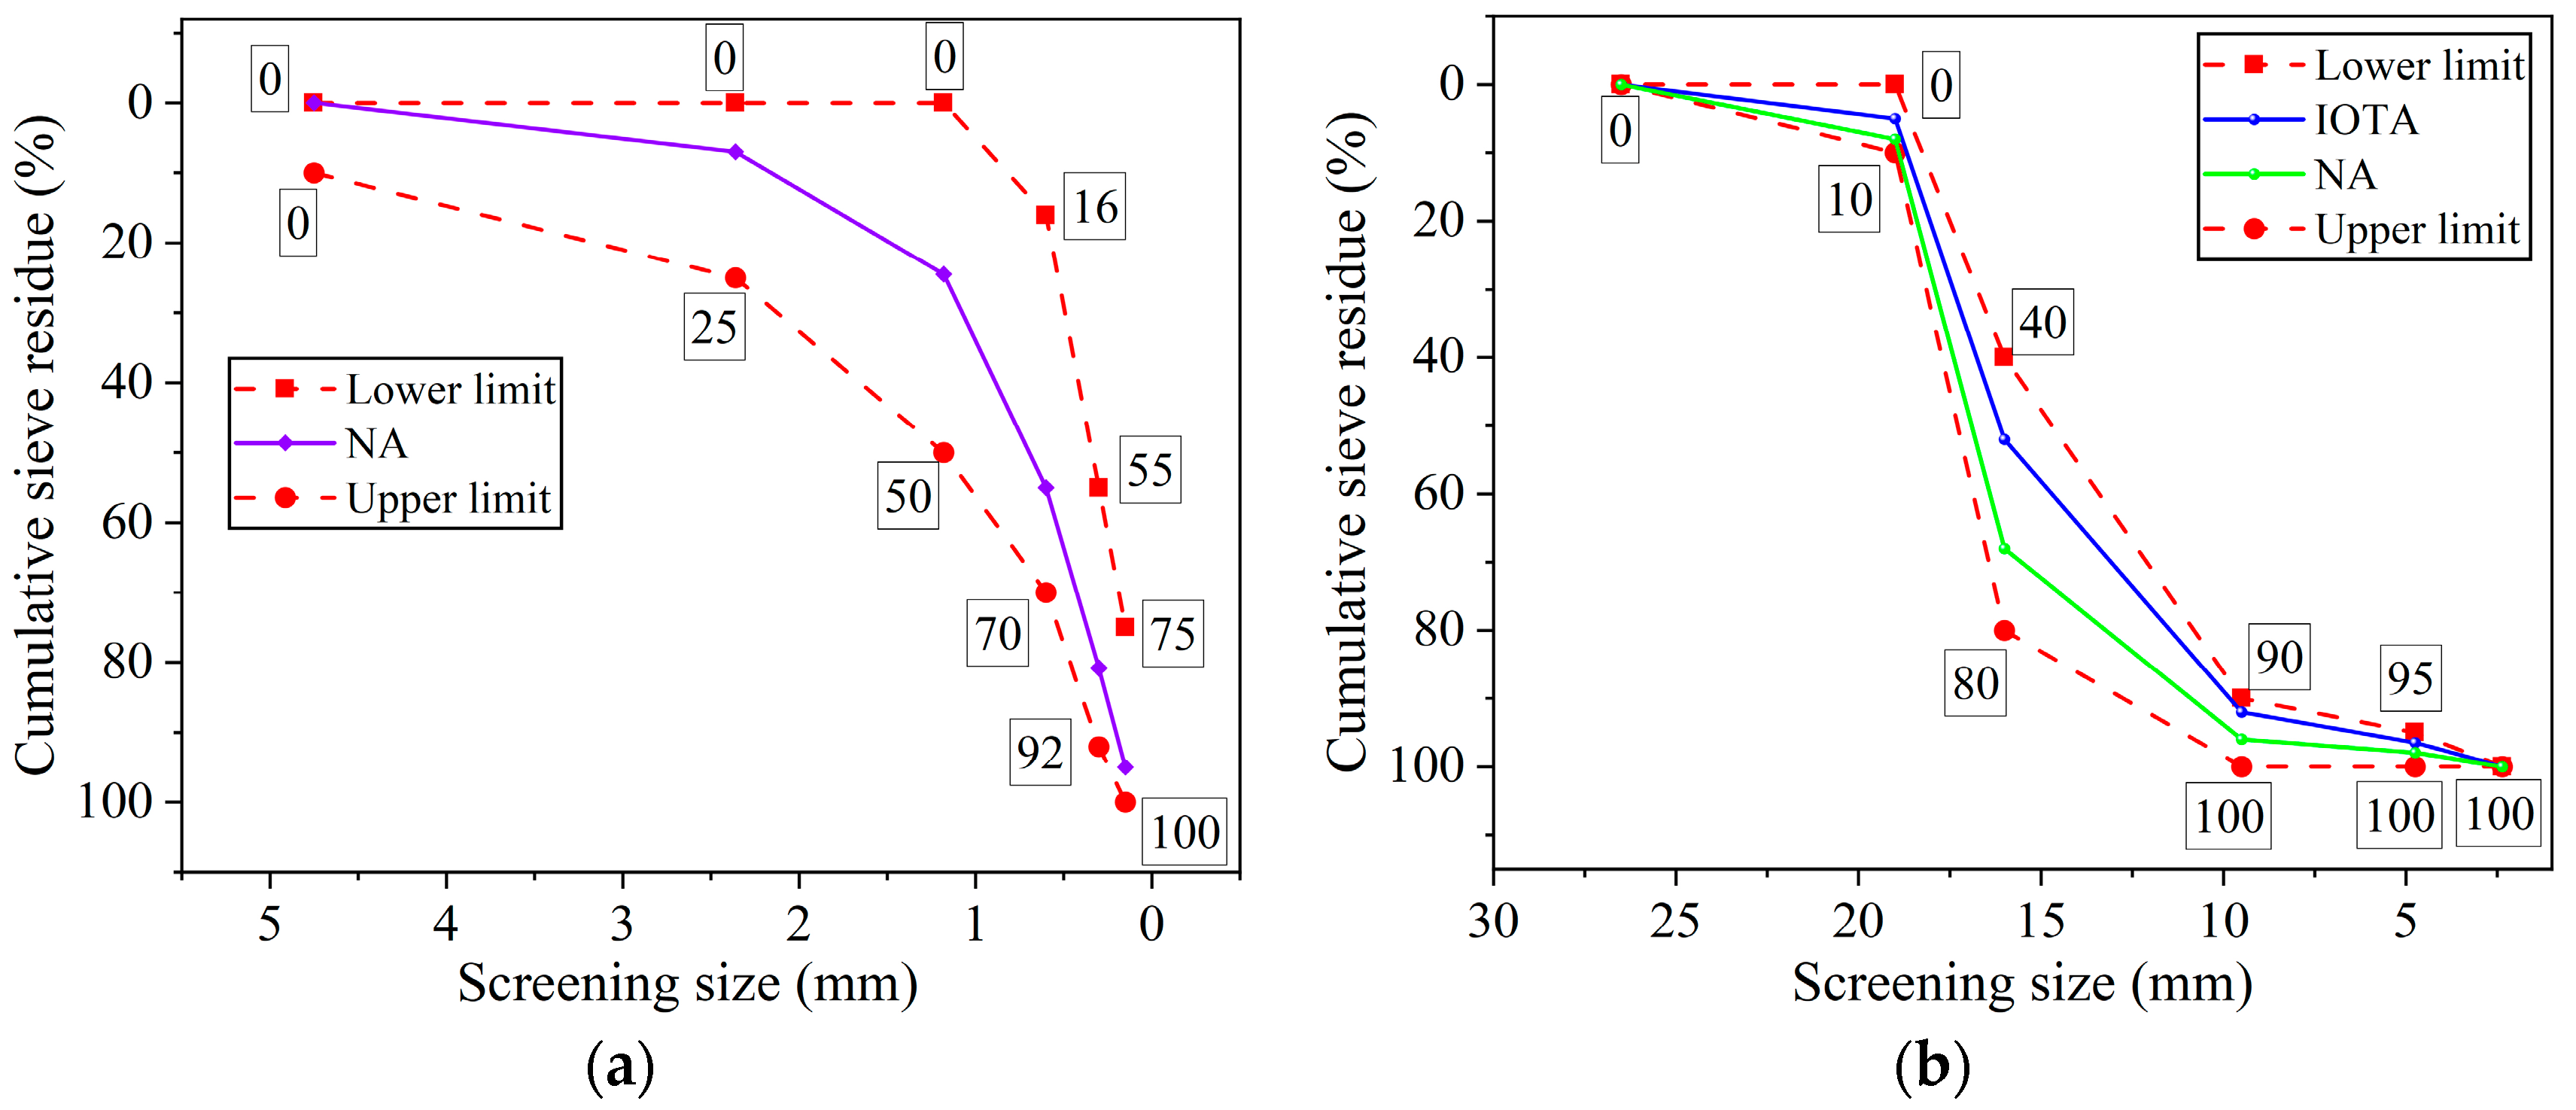
2.1.2. Iron Ore Tailings Aggregate

The IOTA from an iron ore tailings reservoir in Shangluo was collected as coarse aggregate to produce concrete. The apparent density, water absorption, bulk density, mud content, and crushing index of the crushed stone were 2610 kg/m3, 1.66%, 1352.5 kg/m3, 3.1%, and 12.4%, respectively. The chemical compositions of the coarse aggregates, including NA and IOTA, are listed in Table 1. Figure 1 presents the phase composition of IOTA. It is worth noting that the crystalline composition of the IOTA is still dominated by quartz compared to others and that its surface is relatively angular. The grading curves of the aggregate are shown in Figure 2.

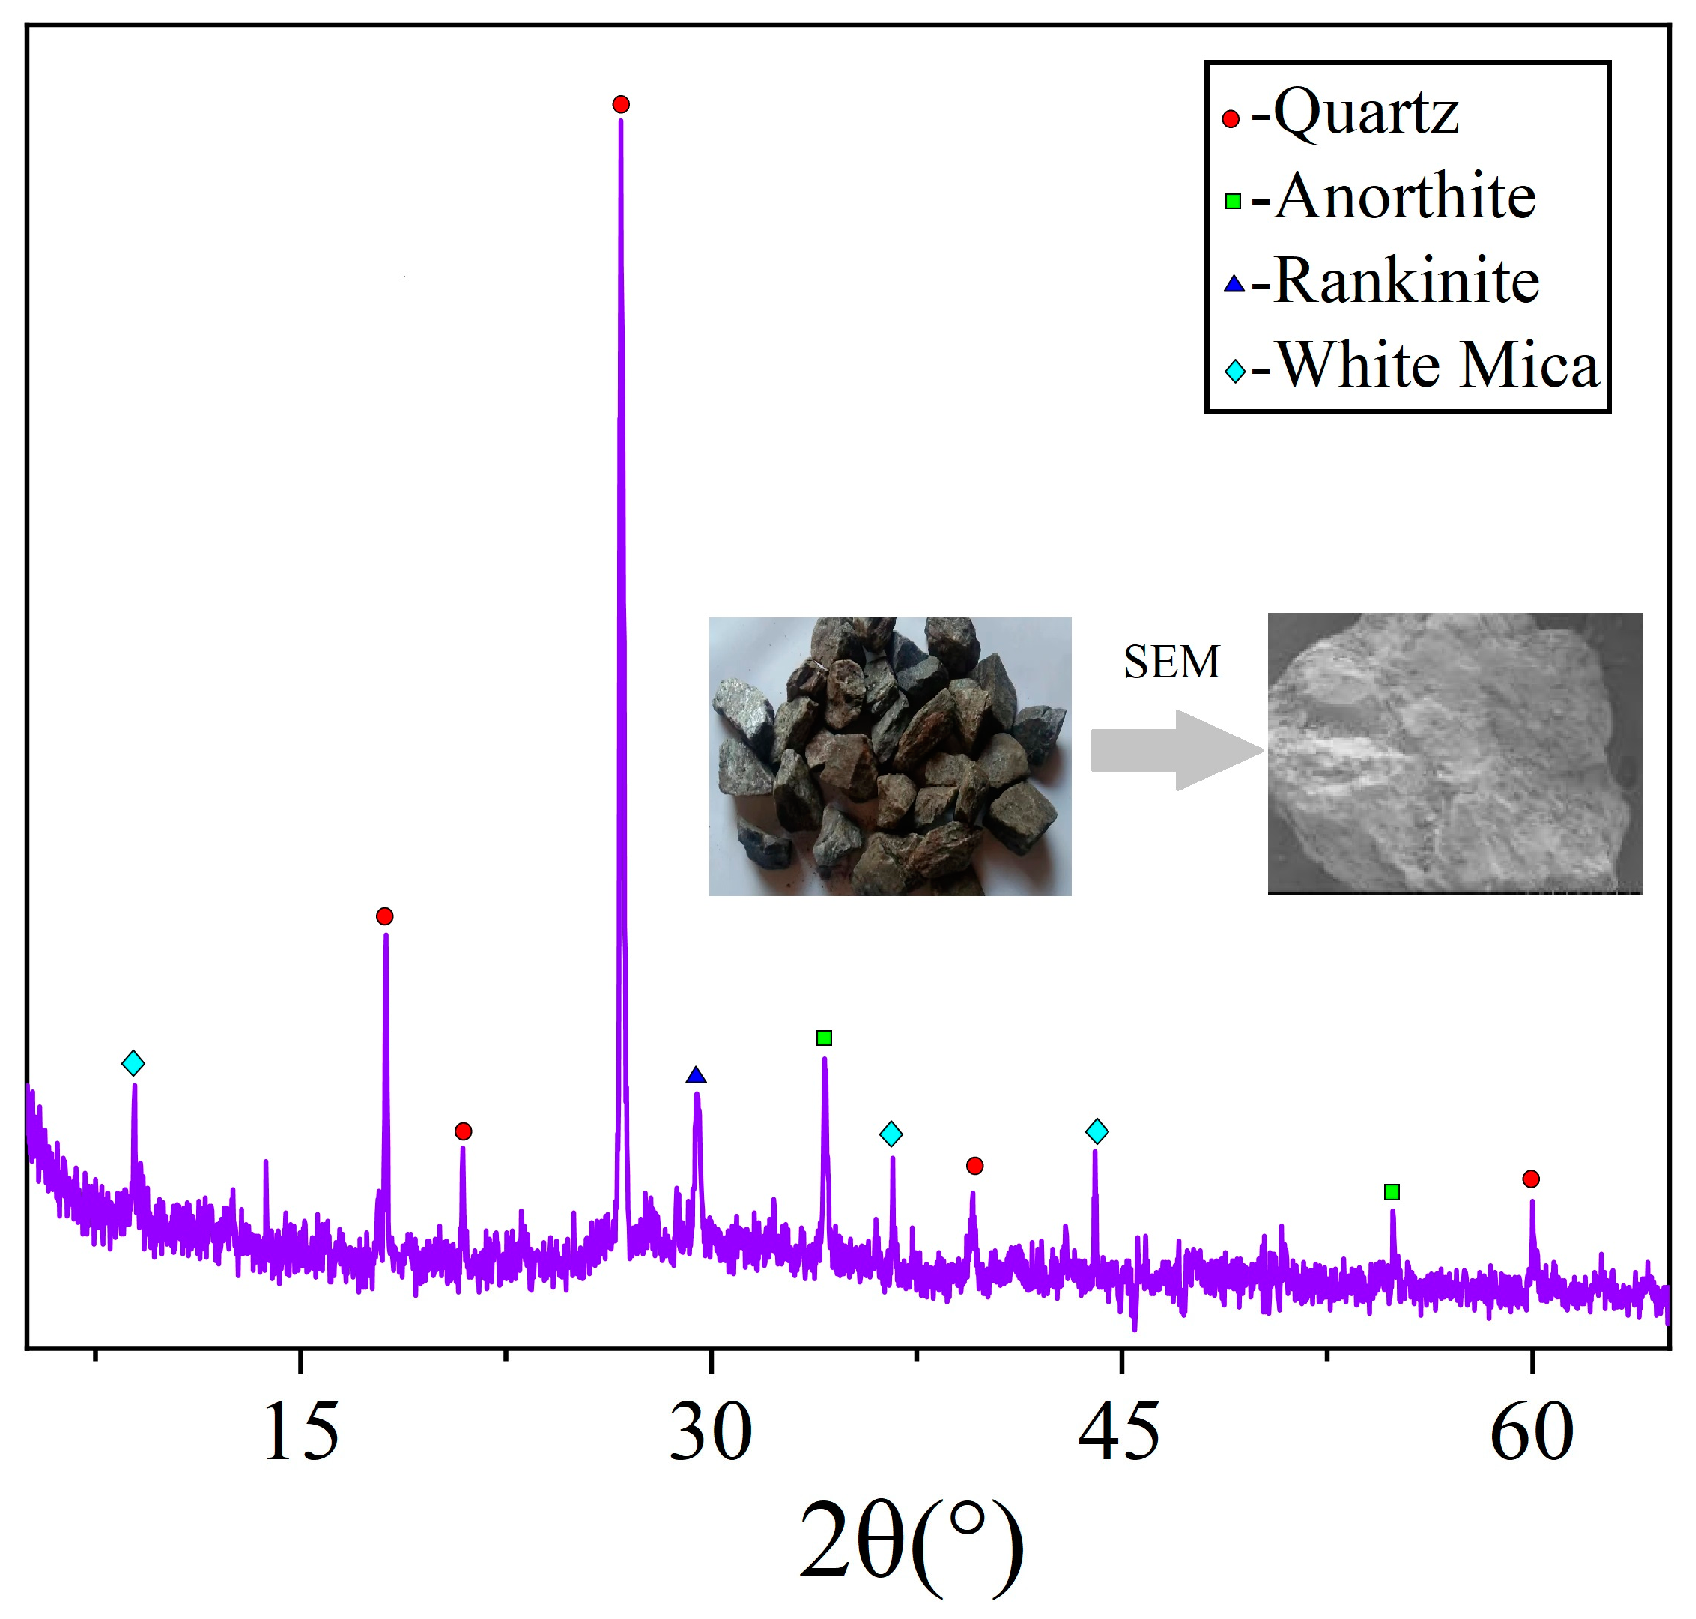
2.1.3. Calcium Carbonate Whiskers

CWs were used as a performance-enhancing material in the preparation of the concrete. Their performance parameters are shown in Table 2.

2.2. Mix Proportions
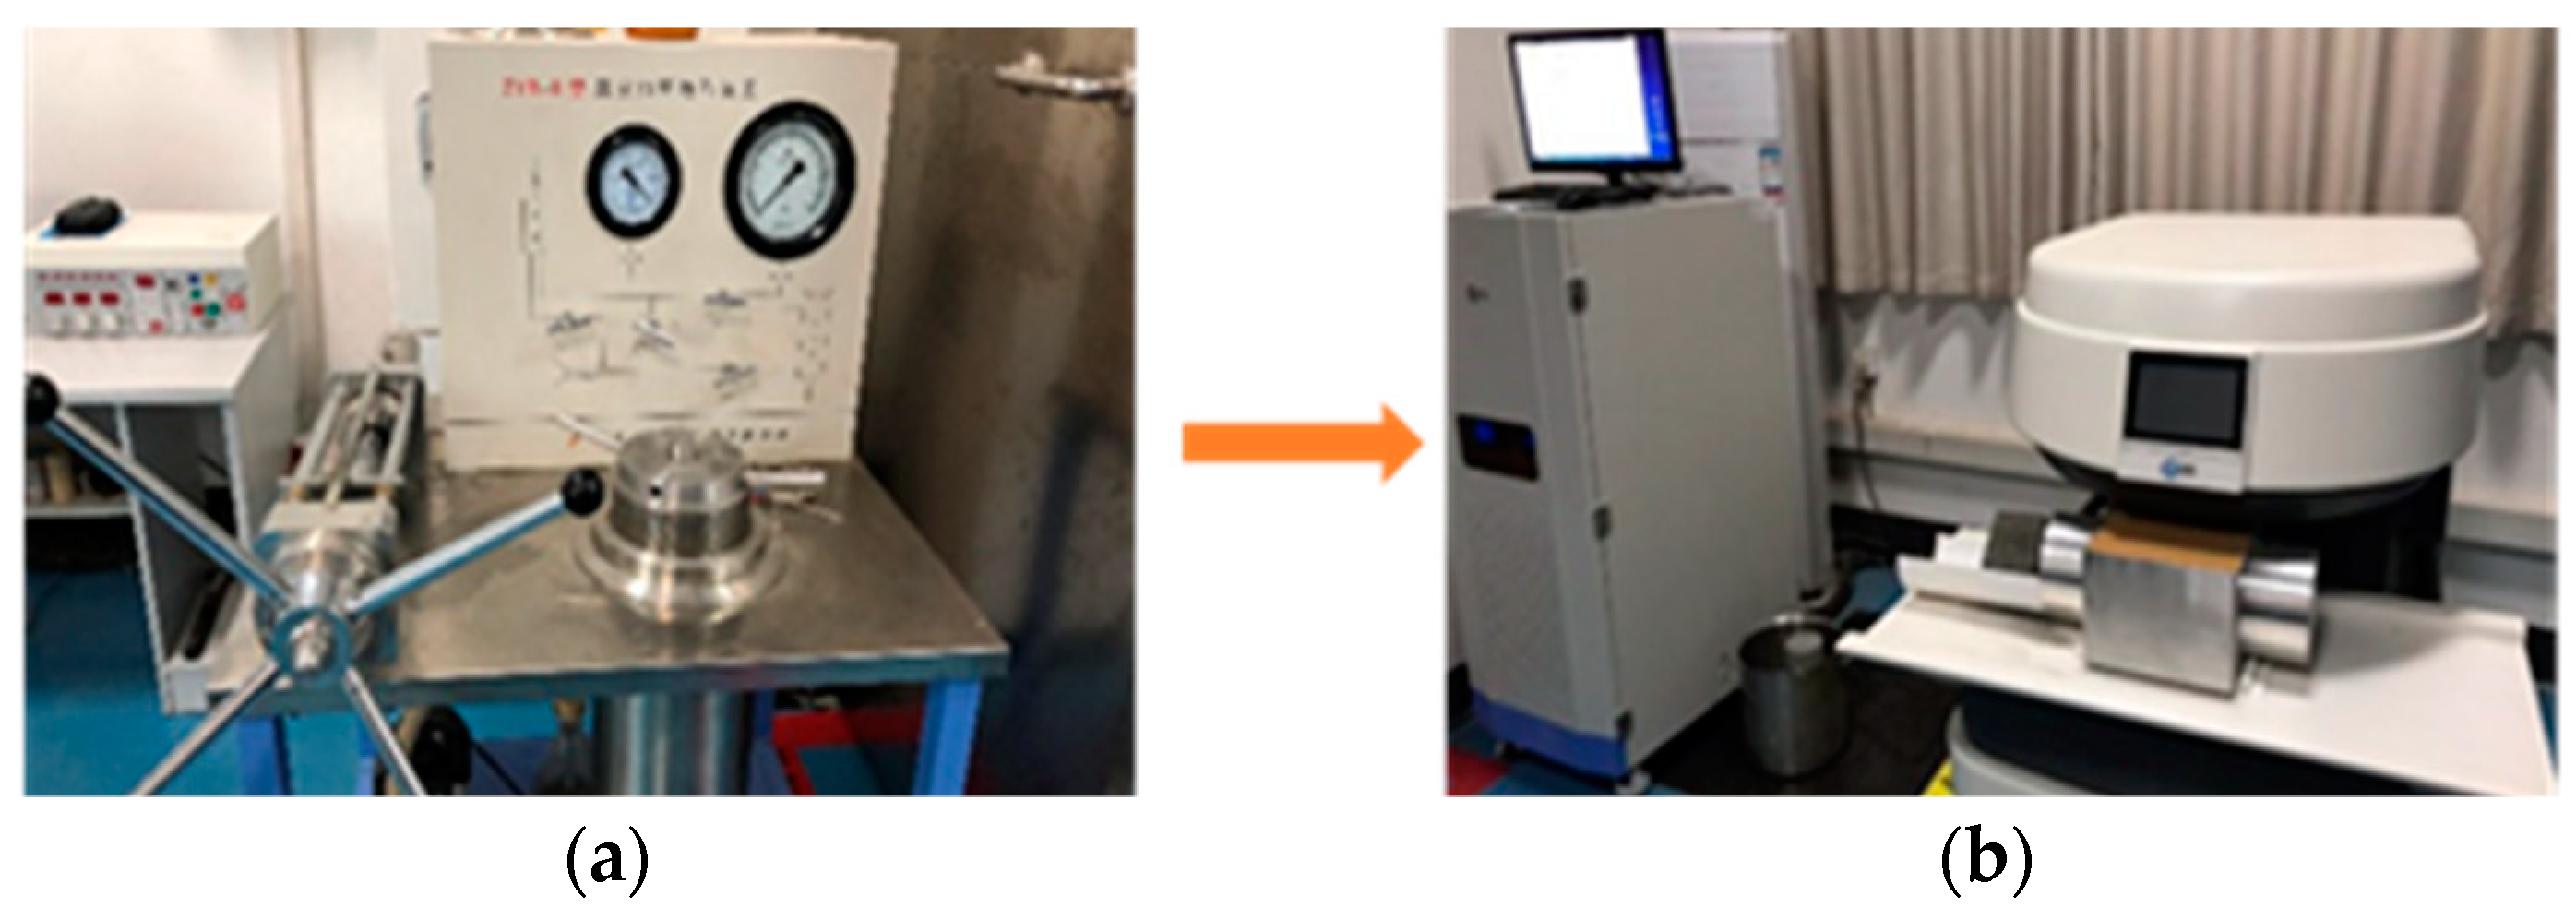
The mix proportions of the three series (NAC, TAC, and TAC-CW) are listed in Table 3. NAC (the control group) contained 100% NA. To maximize the reuse of industrial byproducts, the replacement ratio of IOTA in TAC was set at 100%. TAC-CW was prepared with 10%, 20%, and 30% CWs [29]. Cubic specimens (100 mm × 100 mm × 100 mm) and prismatic specimens (100 mm × 100 mm × 400 mm) were produced. The preparation process of the concrete specimens, including primary mixing, pouring, and curing, is shown in Figure 3.

2.3. Test Methods

2.3.1. Mechanical Performance

The fcu and fst of the concrete at 28 days were tested using cubic specimens with geometric dimensions of 100 mm × 100 mm × 100 mm according to Chinese National Standard GB/T 50081-2019. The parallel tests were carried out with three cubic specimens for each mixture. The tests were carried out in an MT pressure testing machine, and the loading rate was set to 0.5 MPa/s.

2.3.2. Accelerated Sulfate F-T Cycle

The F-T durability test was executed utilizing a state-of-the-art automatic rapid concrete F-T machine with a 3.5% sodium Na2SO4 solution, following the ASTM C666/C666M-03 standard. The temperatures at the centers of the specimens were maintained within a range of −18.0 ± 1 to 5.0 ± 1 °C. The maximum F-T cycle of the test was set at 300. Before the implementation of the test, 100 mm cubes and prisms of 100 mm × 100 mm × 400 mm were submerged in water for four days, followed by air-drying to conduct initial assessments of their compressive strength, elastic modulus, and mass. Upon completion of the initial testing and collection of necessary data, the specimens were placed inside the automatic rapid concrete freeze–thaw machine to undergo the F-T cycles. The specimens were periodically removed after every 50 cycles, and their compressive strength, mass, and elastic modulus were tested.

2.3.3. Non-Destructive Pore Testing by NMR

As a non-destructive testing technique, NMR has been widely used to analyze the pore structure of porous materials (without magnetically conductive components). The 100 mm concrete specimens underwent NMR analysis using a MacroMR12-150H-I NMR system with a magnetic field strength of 0.5 T and a frequency range of 50–60 Hz. The specimens were positioned within a pressurized saturation device, facilitating complete water penetration before testing to ensure thorough saturation, as shown in Figure 4.
For porous materials, when their pores exclusively contain water and there is no gradient field, the T2 relaxation time is approximately directly proportional to the structural characteristics of the pores, as indicated by Equation (1):
1 T 2 = ρ ( S p V p )
where T2 represents the transverse relaxation time of the fluid (ms), Vp represents the pore volume (μm3), ρ represents the transverse surface relaxation strength (μm/s), and Sp represents the pore surface area (μm2).

2.3.4. SEM for Morphology Analysis

Fractured under pressure, concrete samples were cut into 5 mm × 5 mm × 2 mm specimens and ground to achieve a flat surface. These prepared samples underwent immersion in anhydrous ethanol for three days to halt the hydration reaction, followed by drying at 40 °C for 24 h. After the pre-treatment, the samples were affixed to S-4800 cold field emission SEM sample supports using a conductive adhesive and then subjected to gold spraying and vacuuming. SEM observations in this study ranged from 5000× to 20,000× magnification.

3. Results and Discussion

3.1. Mechanical Properties

3.1.1. Compressive Strength

The changes in fcu at 28 days of concrete with different CW contents are provided in Figure 5. It can be observed from the histogram that the fcu of TAC was reduced by 11.68% as compared to NAC. This may be attributed to the high crushing index and water absorption of IOTA, as the level of water absorption reflects to some extent the number of pores within the IOTA. The compressive strength of the concrete exhibited varying degrees of enhancement with 10%, 20%, and 30% CWs, and the trend in strength improvement initially increased with the growing amount of CWs but eventually displayed a rising followed by a decreasing pattern. Specifically, the compressive strengths of TAC-CW10, TAC-CW20, and TAC-CW30 increased by 5.22%, 23.26%, and 14.3%, respectively, compared to TAC. The compressive strength of TAC-CW20, with the best CW level of 3%, exceeded that of NAC by 8.86%. This enhancement is mainly attributed to CWs having good compatibility with cementitious materials and, at the micron scale, being able to play the role of microfine powder to optimize and fill the large-size pores generated within the matrix of iron tailings concrete during the casting process and hydration process. At the same time, CWs dispersed within the matrix can inhibit microcracking, convergence, and expansion [30]. Unfortunately, when the dosage of CWs is high, they will agglomerate inside the matrix, which will lead to the deterioration of the internal microstructure of the matrix (poorly bonded interfaces as well as an increase in porosity), and the corresponding enhancement effect will be reduced [22,31].

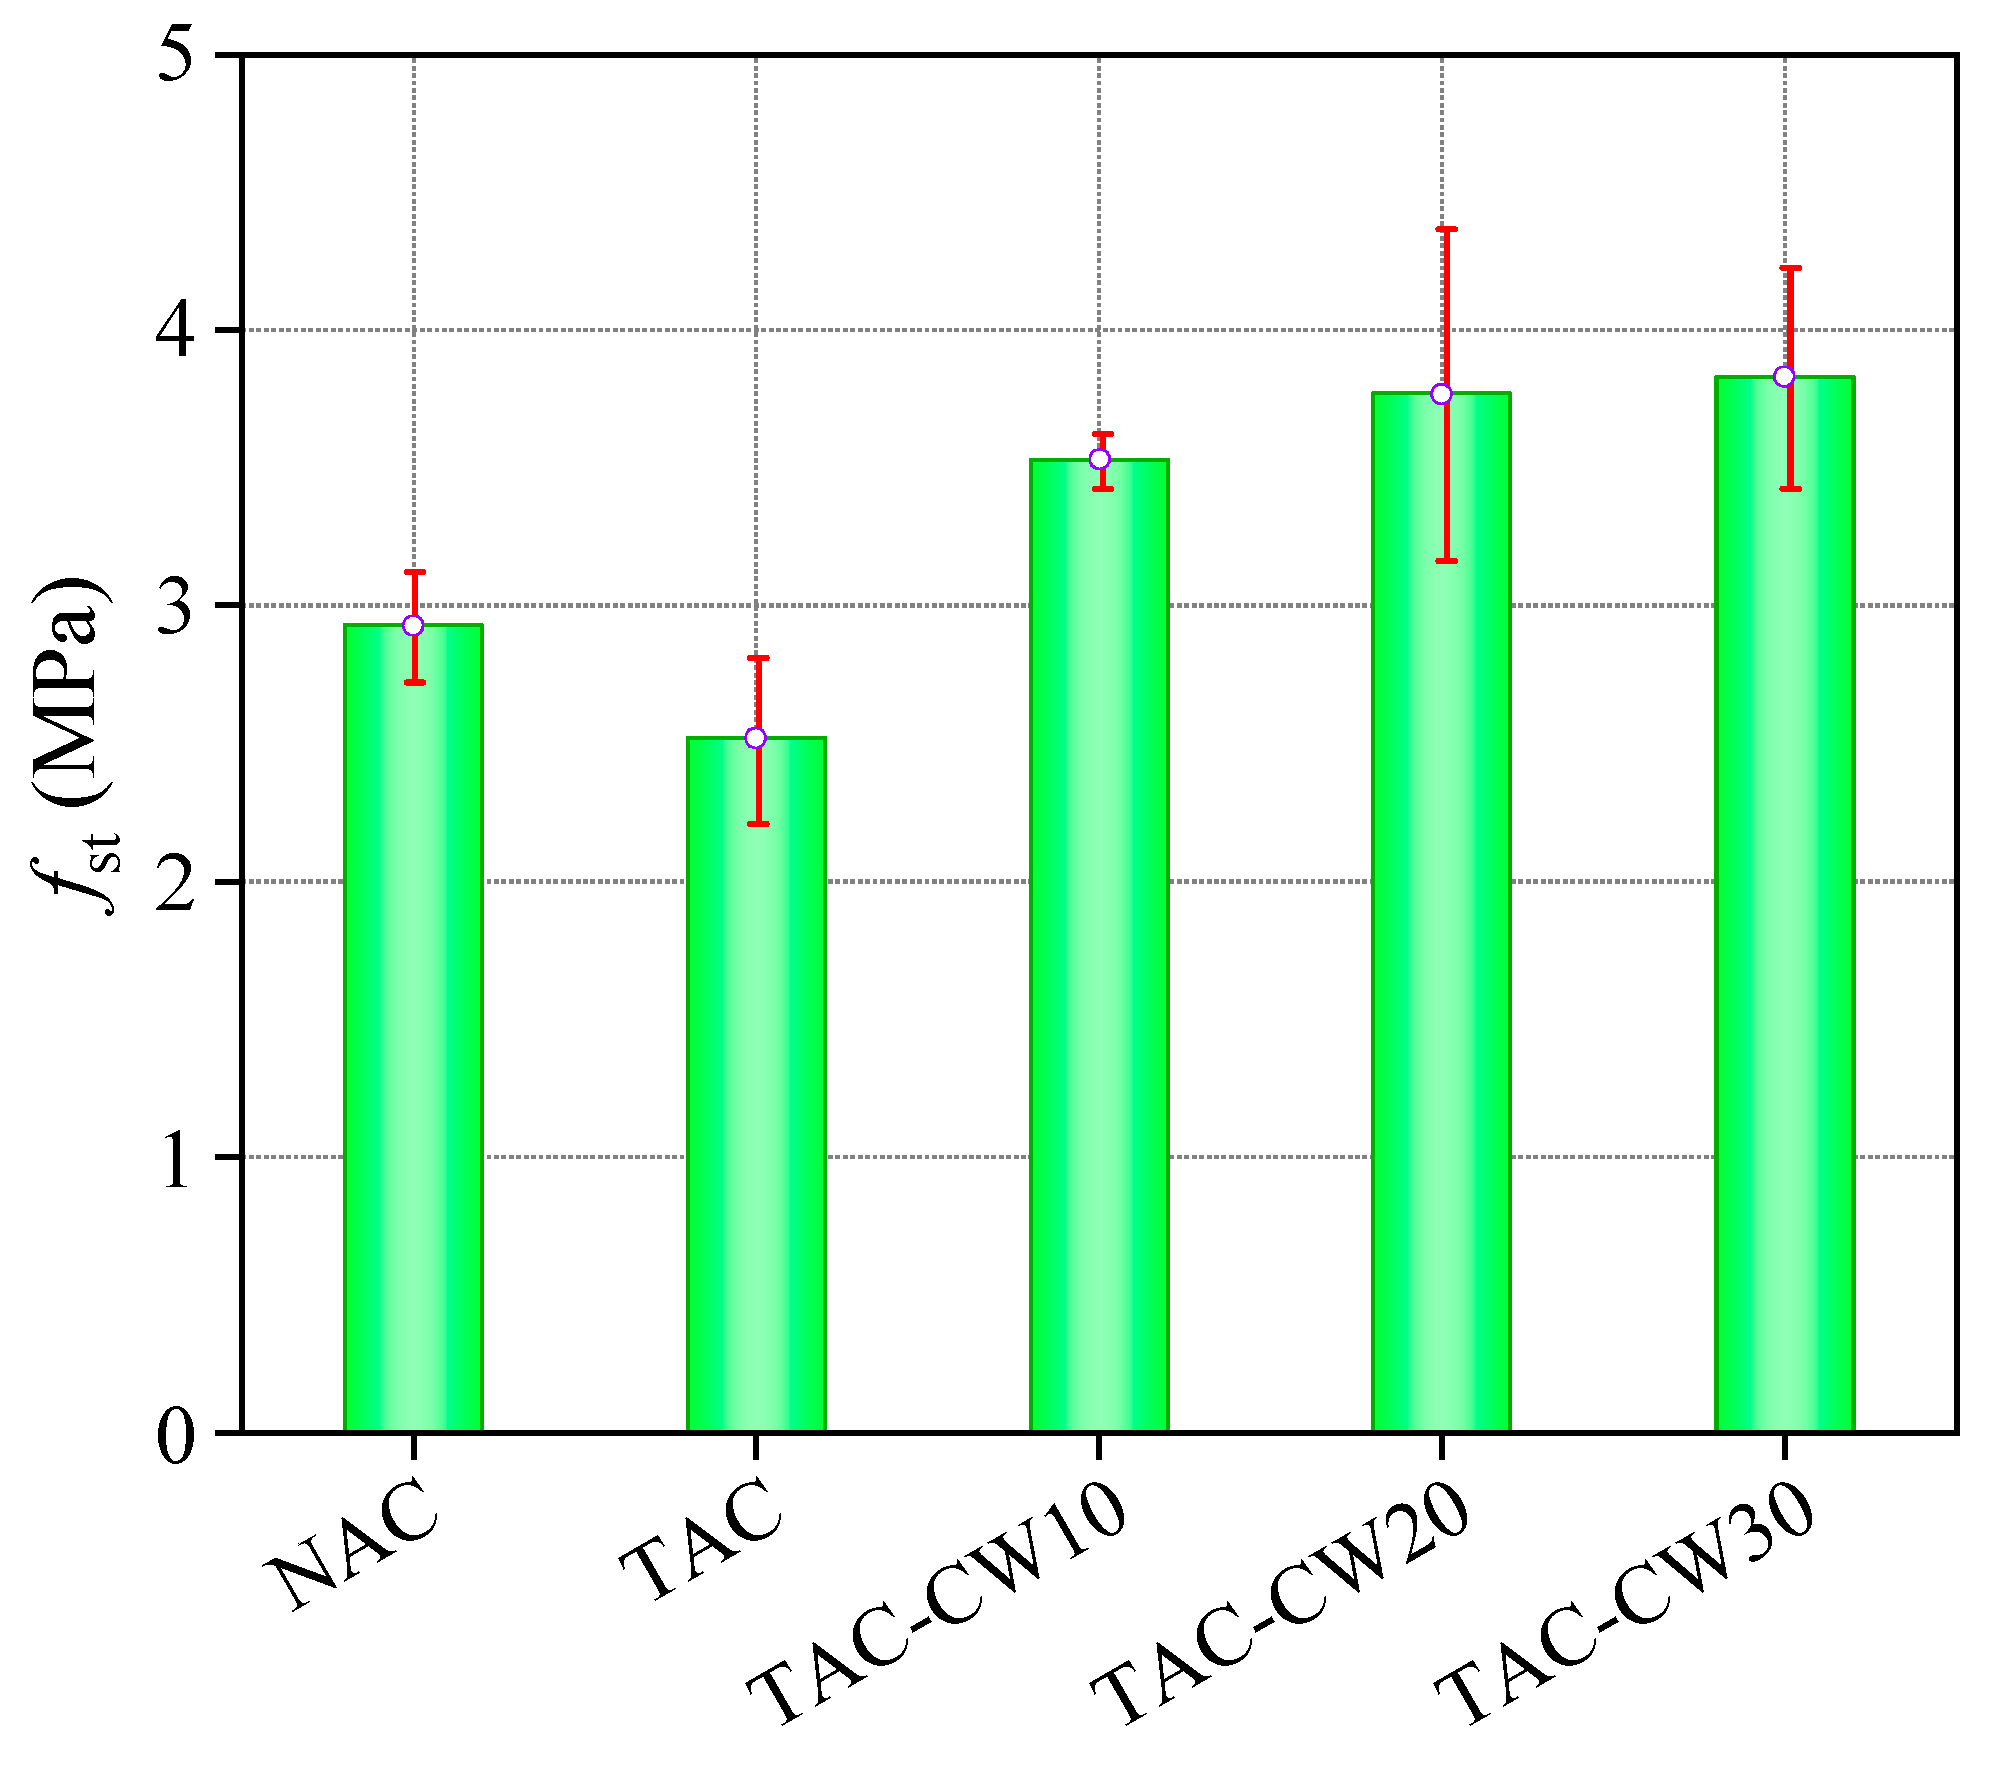
3.1.2. Splitting Tensile Strength

The test results provided in Figure 6 present the fst results for concrete at 28 days. Figure 6 reveals that the fst of TAC, which includes 100% IOTA, undergoes a 14% decrease compared to NAC. This suggests that the substitution of NA with IOTA results in a deterioration in the fst of the concrete. When CWs are added to TAC, a significant increase in fst results. For example, incorporating 10%, 20%, and 30% CWs led to respective increases of 40.07%, 49.6%, and 51.98% in the fst values of TAC-CW10, TAC-CW20, and TAC-CW30 compared to TAC. Furthermore, the fst values of all three variants exceeded that of NAC. The primary factor contributing to concrete’s heightened splitting tensile capacity lies in the disorderly distribution of CWs adhered to the matrix, which could occur through the formation of tensile knots, bridging links, and fracture of CWs [32].

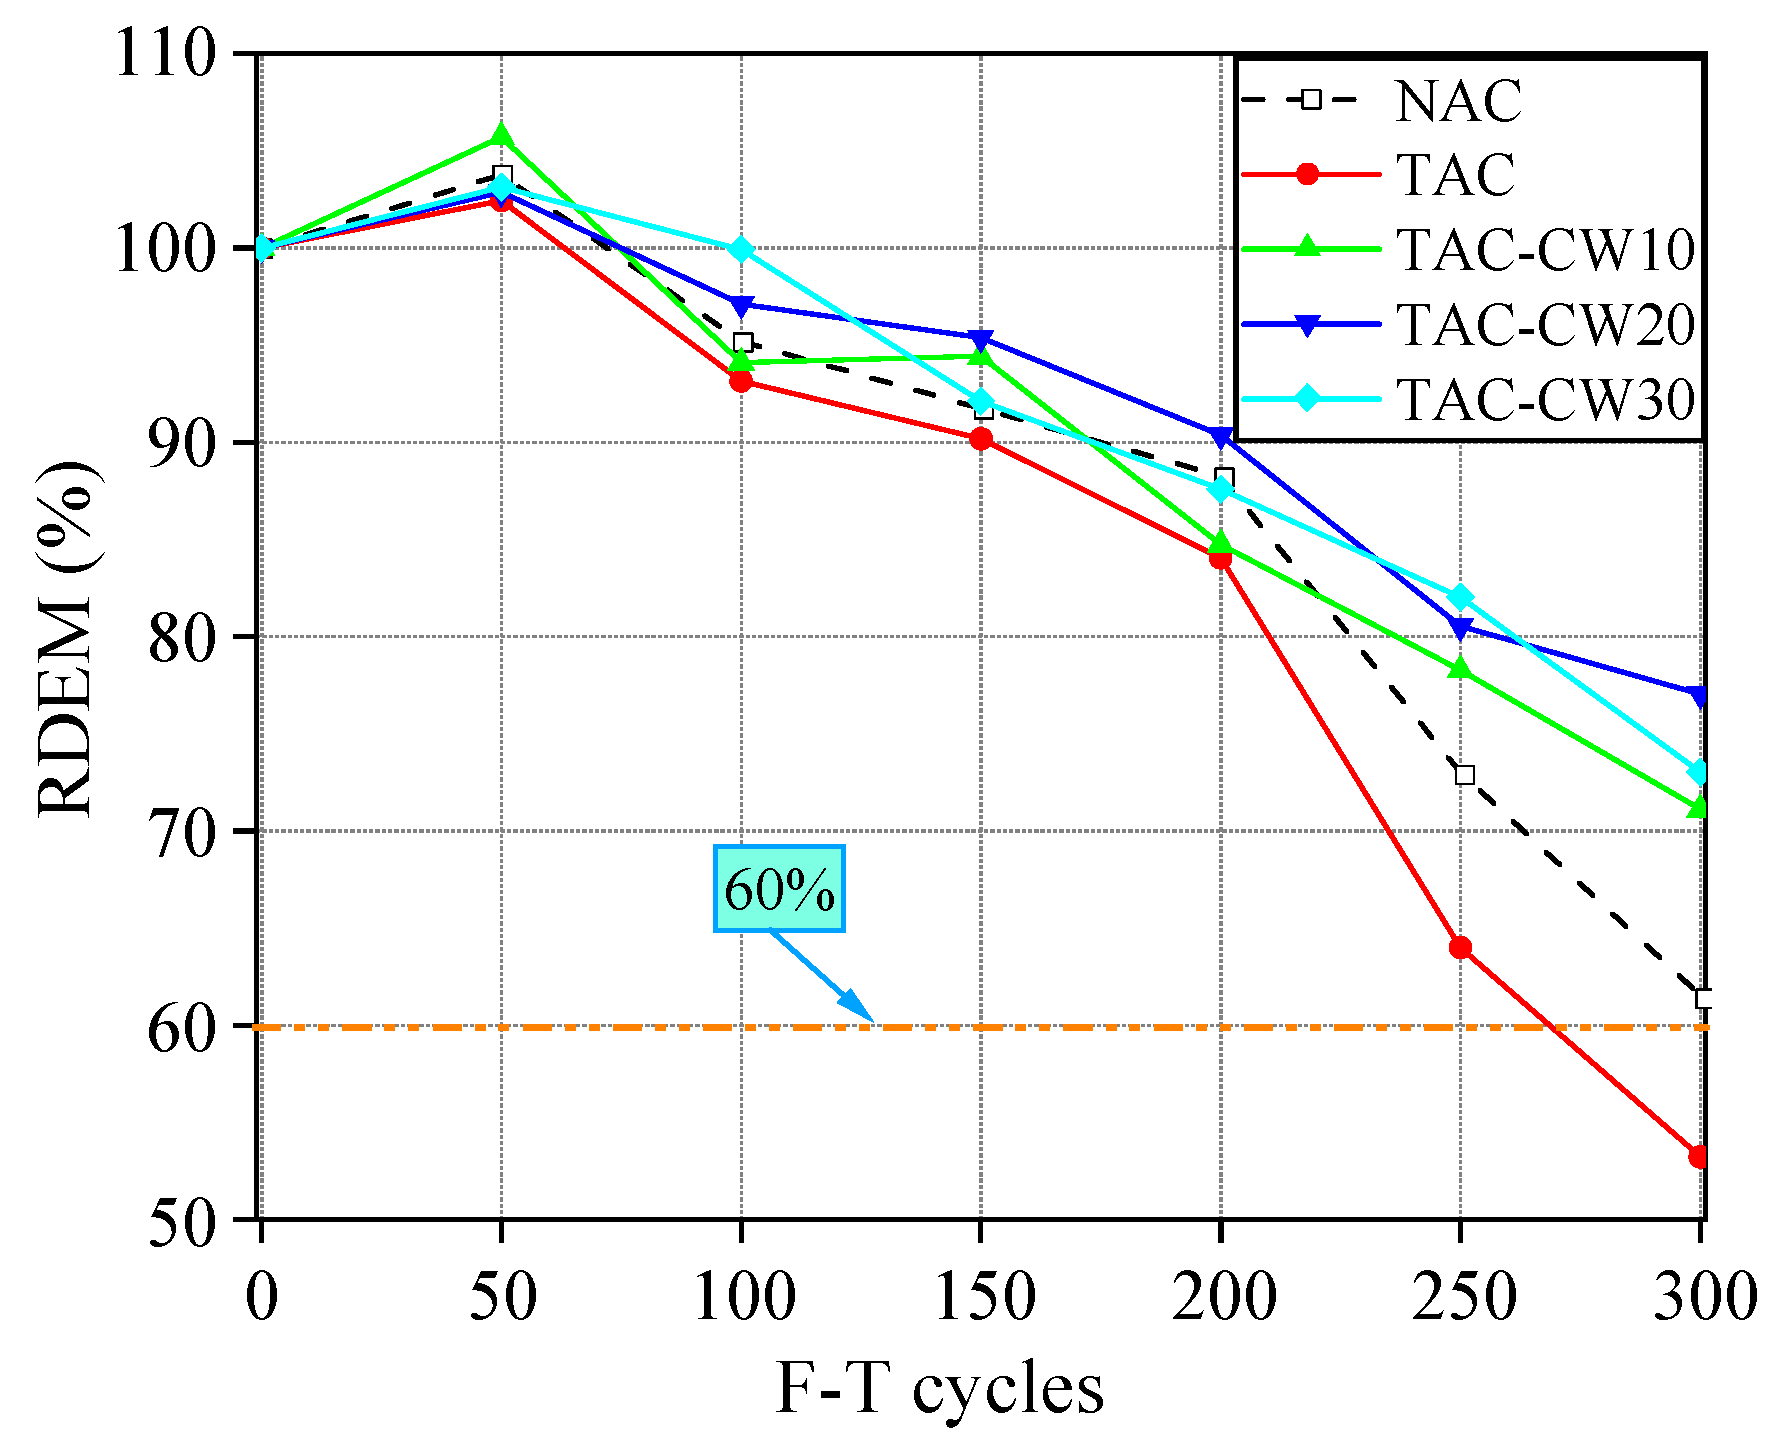
3.2. Sulfate F-T Cyclic Resistance
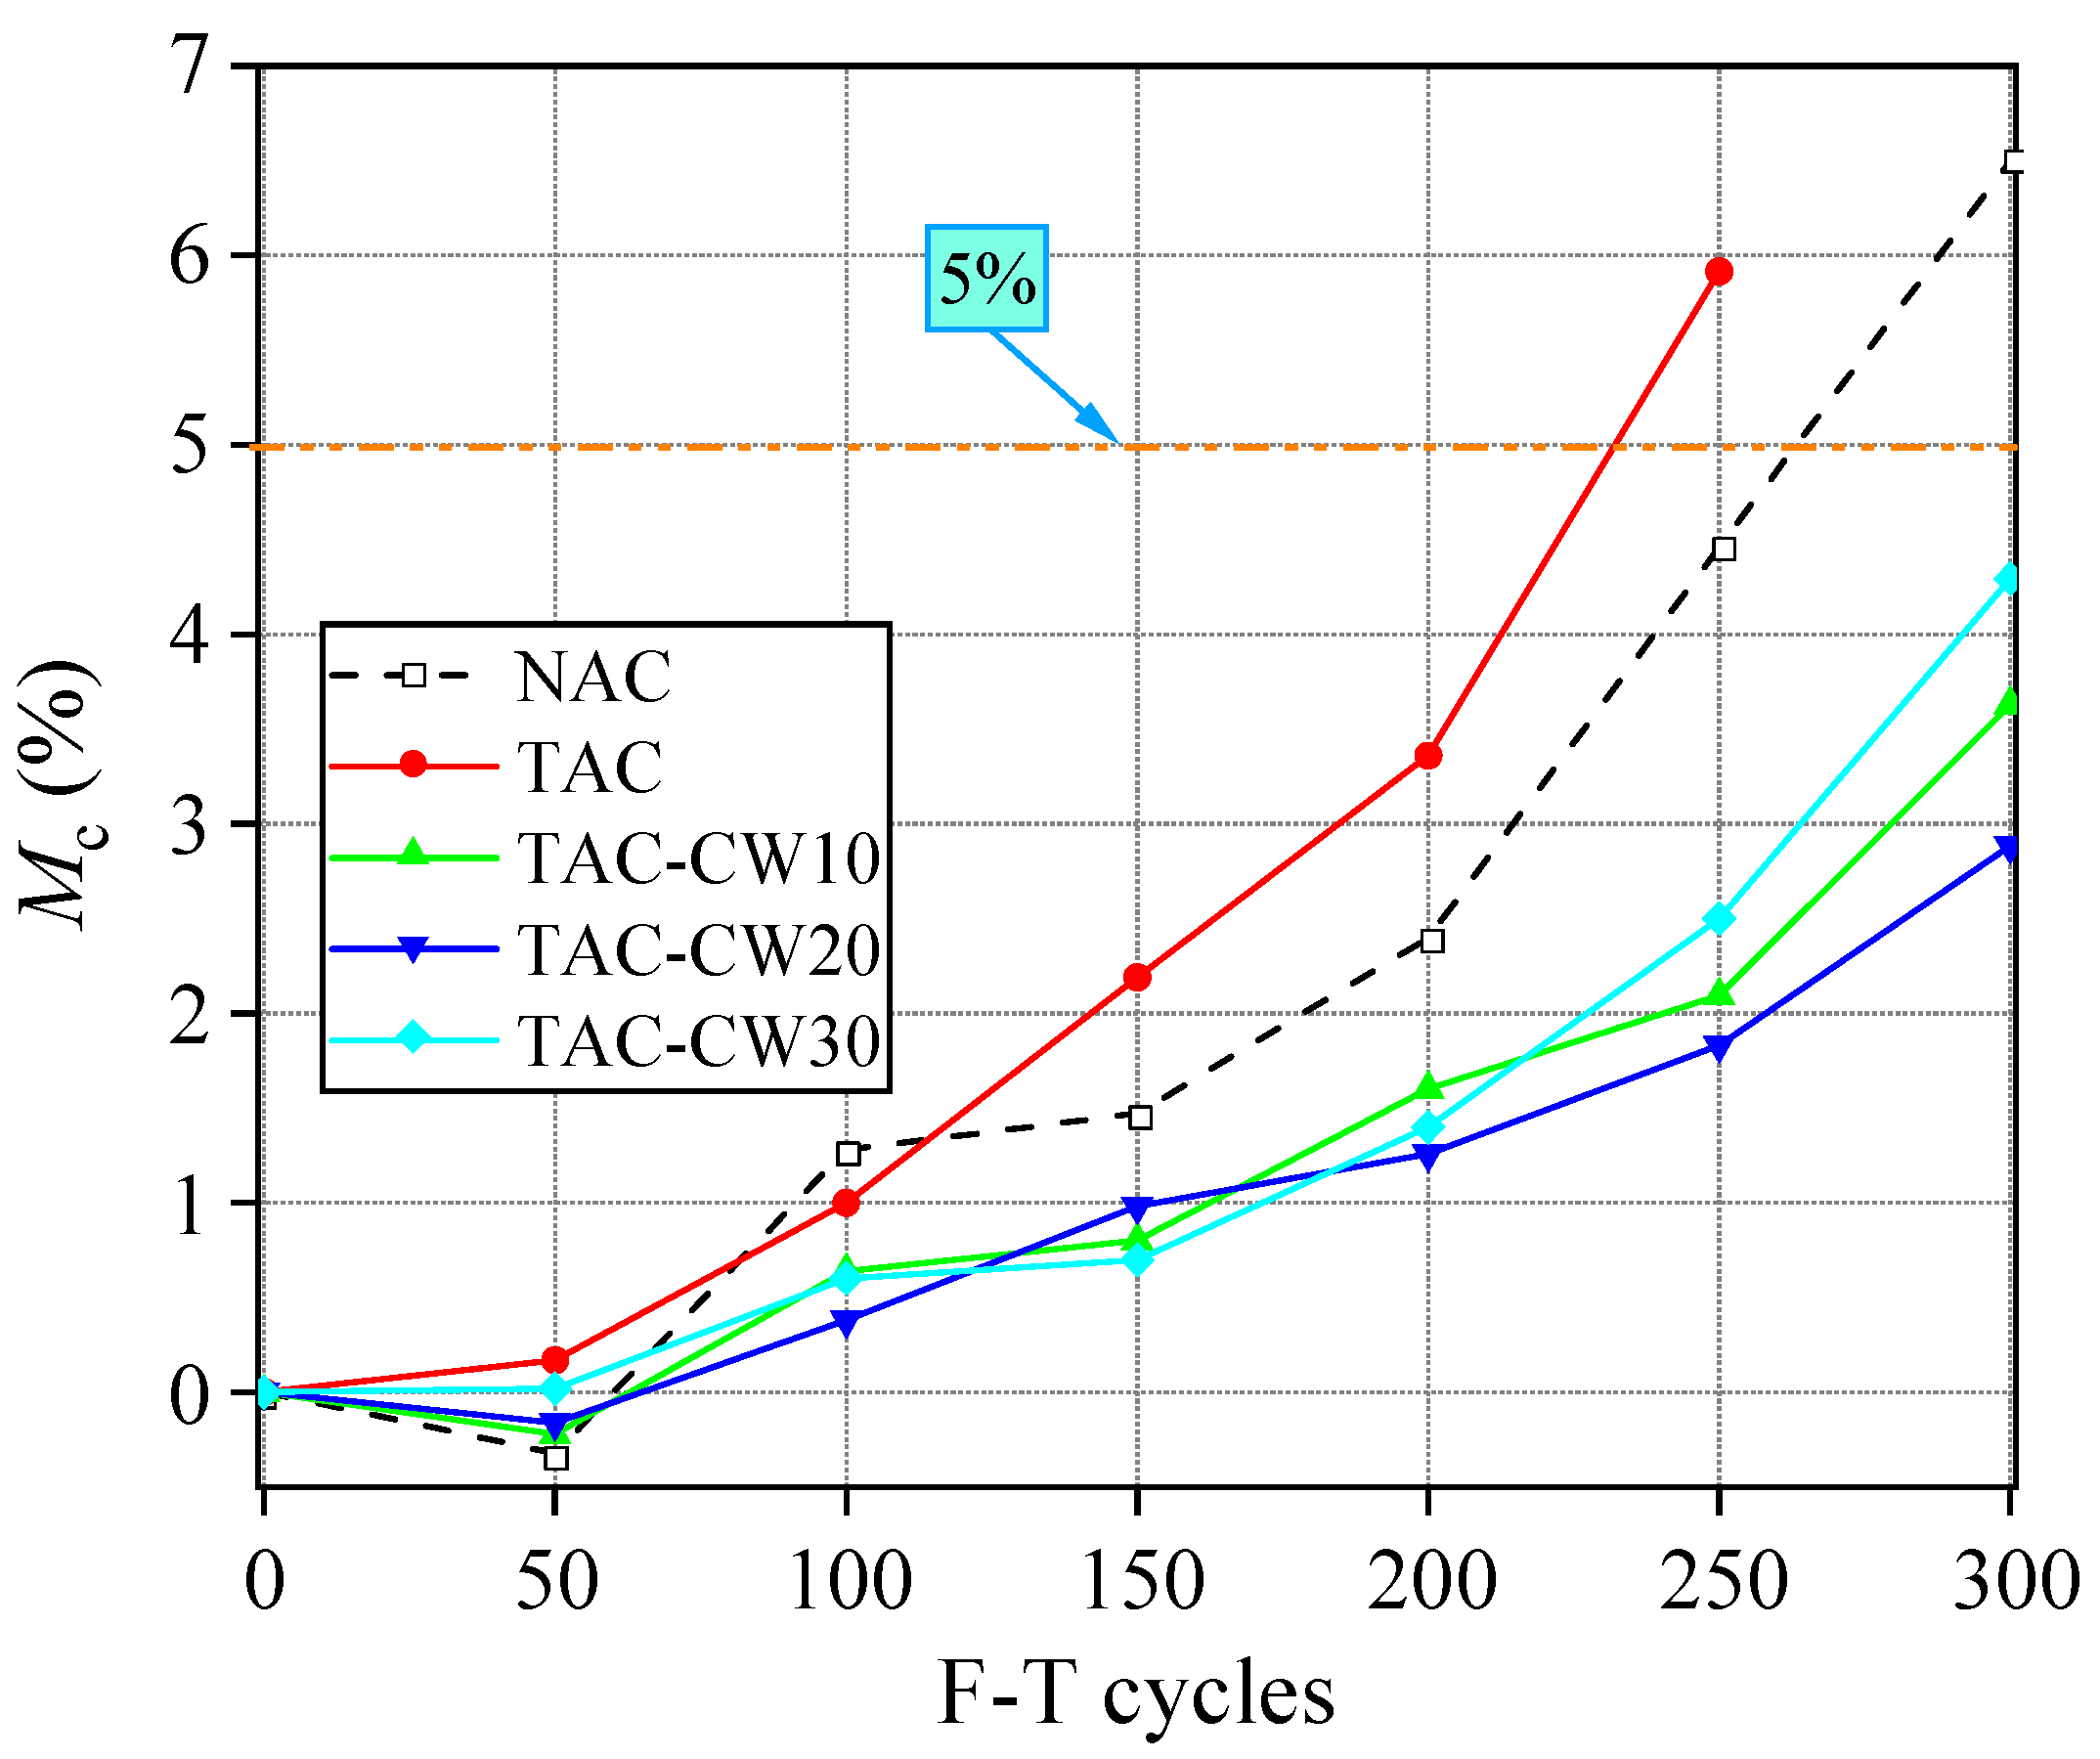
3.2.1. Mass Loss

Concrete mass deterioration under the influence of F-T cycles, a primary evaluation criterion, is attributed to the detachment of surface mortar and aggregates. The changes in specimen mass loss (Mc) under different sulfate F-T cycles are demonstrated in Figure 7. It can be generally observed from Figure 7 that the Mc values of individual specimens gradually increase in the early stages with the increase in F-T cycles. However, it should be noted that NAC, TAC-CW10, and TAC-CW20 show increases in Mc after 50 F-T cycles. The TAC specimens experienced notable Mc beyond 100 F-T cycles, which reached the 5% damage criterion after 200 F-T cycles. However, the Mc rate of concrete was considerably mitigated by adding 10%, 20%, and 30% CWs. The Mc values of TAC-CW10, TAC-CW20, and TAC-CW30 decreased rapidly after 250 F-T cycles. When subjected to 300 F-T cycles, the Mc values of TAC-CW10, TAC-CW20, and TAC-CW30 were less than 5% of the damage criterion, and the Mc values of the three were reduced by 44.14%, 55.61%, and 33.92%, respectively, compared to NAC.

3.2.2. RDEM

The test results for RDEM for the calcium carbonate whisker-reinforced iron ore tailings concrete specimens subjected to F-T cycles are presented in Figure 8. It is evident that each specimen follows a similar degradation pattern during the sulfate F-T cycle. Initially, there is an increase in RDEM with F-T cycles, followed by a subsequent decline, particularly after 200 F-T cycles. This indicates sulfate infiltration and crystallization within the matrix, leading to an initial RDEM increase and later decline due to increased pore damage and F-T erosion. For example, after 50 F-T cycles, the RDEM increased by 3.77%, 2.44%, 5.72%, 2.87%, and 3.14% for NAC, TAC, TAC-CW10, TAC-CW20, and TAC-CW30, respectively. However, from 50 to 200 F-T cycles, RDEM decreased by 11.73%, 15.94%, 15.24%, 9.63%, and 12.41%, respectively, without reaching the failure threshold of 60%. By 300 F-T cycles, TAC had failed, whereas NAC exhibited a 38.45% decrease in RDEM but did not fail. Conversely, RDEM for TAC-CW10, TAC-CW20, and TAC-CW30 remained above 70% by 300 F-T cycles, increasing by 15.54%, 25.18%, and 18.63%, respectively, compared to NAC. These results highlight the improved frost resistance of TAC-CW20 due to the appropriate addition of CWs.

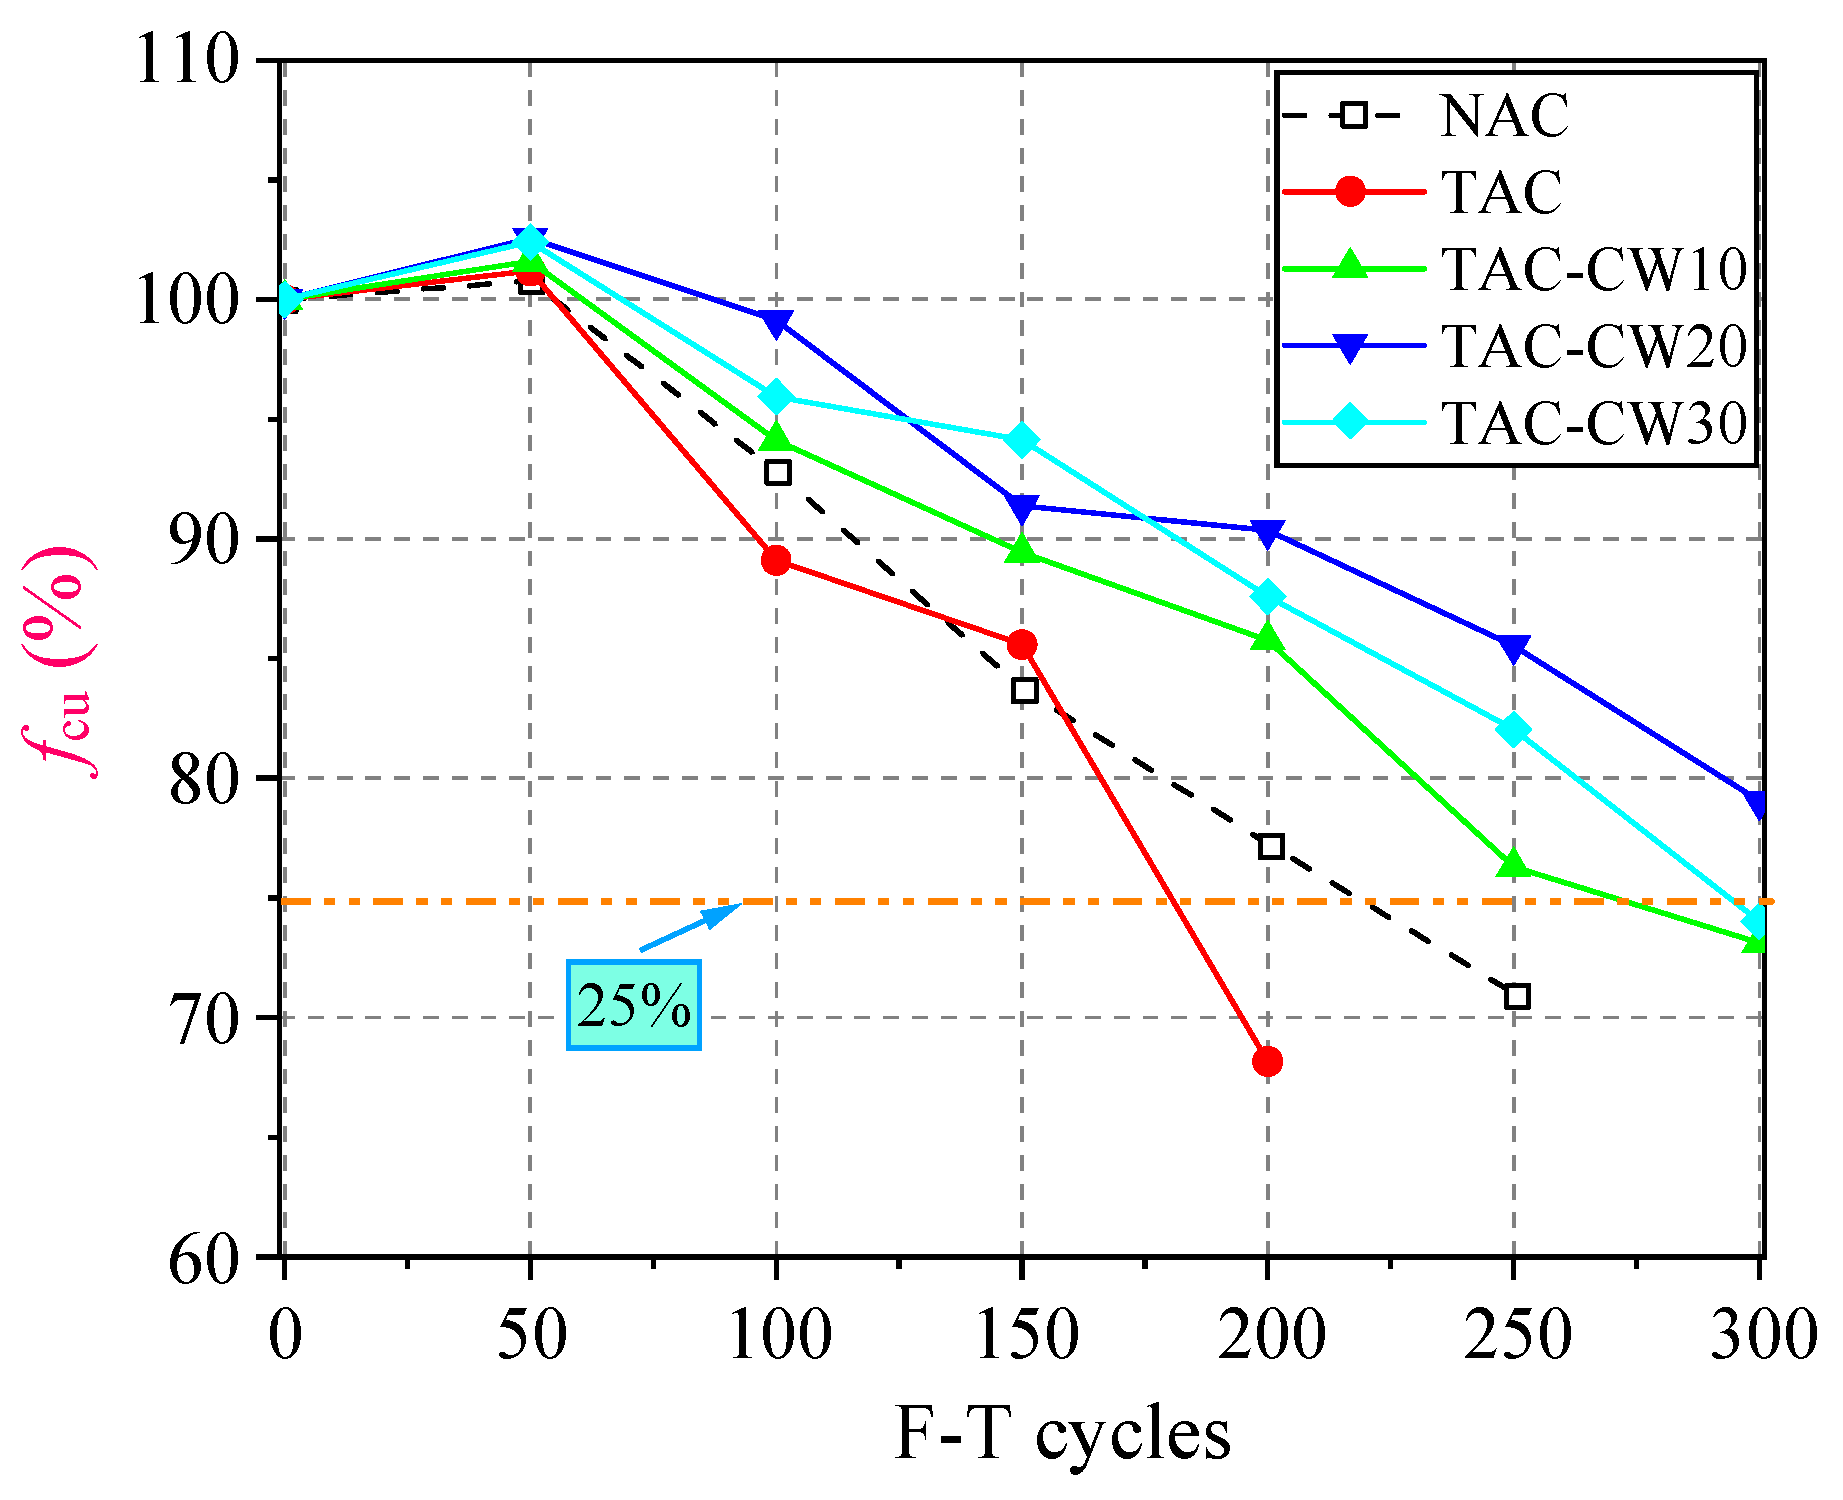
3.2.3. Relative Compressive Strength

Figure 9 depicts the trends in fcu variations for specimens with diverse CW contents subjected to 0–300 F-T cycles. It is evident from Figure 9 that, as the F-T cycles increase, the fcu values of the concrete initially increase (less than 50 F-T cycles) and subsequently decrease (more than 50 F-T cycles), akin to the deterioration pattern observed in the corresponding RDEM. Primarily, the ingress of SO42− into the matrix occurs through the pores in the initial stages, reacting with cement hydration products to generate gypsum (CaSO4·2H2O) and ettringite (3CaO·Al2O3·CaSO4·31H2O), as depicted in Equations (2) and (3). These compounds serve to occupy and fill the pores. However, as the F-T cycles repeated, more corrosion products accumulated, exerting expansion force on the inner pore wall. The rapid expansion of pores, driven by this force, results in their interconnection and microcrack formation, thereby accelerating the deterioration of concrete [33]. Macroscopically, it is characterized by a decrease in fcu. Compared with NAC, TAC experienced the fastest reduction in fcu during the complete F-T cycle. Following 200 F-T cycles, the fcu values of TAC dropped by 46.75%, exceeding the designated failure threshold of 25%. When adding 10–30% CWs to TAC, the fcu reduction rates for TAC-CW10, TAC-CW20, and TAC-CW30 were notably lower than for NAC. Notably, TAC-CW20 demonstrated only a 22.95% decrease in fcu after 300 F-T cycles, highlighting the potential of CW addition to improve concrete’s F-T resistance, particularly at a 20% dosage.
Na2SO4 + Ca(OH)2 + 2H2O → CaSO4·2H2O + 2Na2OH
4CaO·Al2O3·12H2O + 3Na2SO4 + 2Ca(OH)2 + 20H2O → 3CaO·Al2O3·CaSO4·31H2O + 6NaOH

3.3. Pore Characterization from NMR

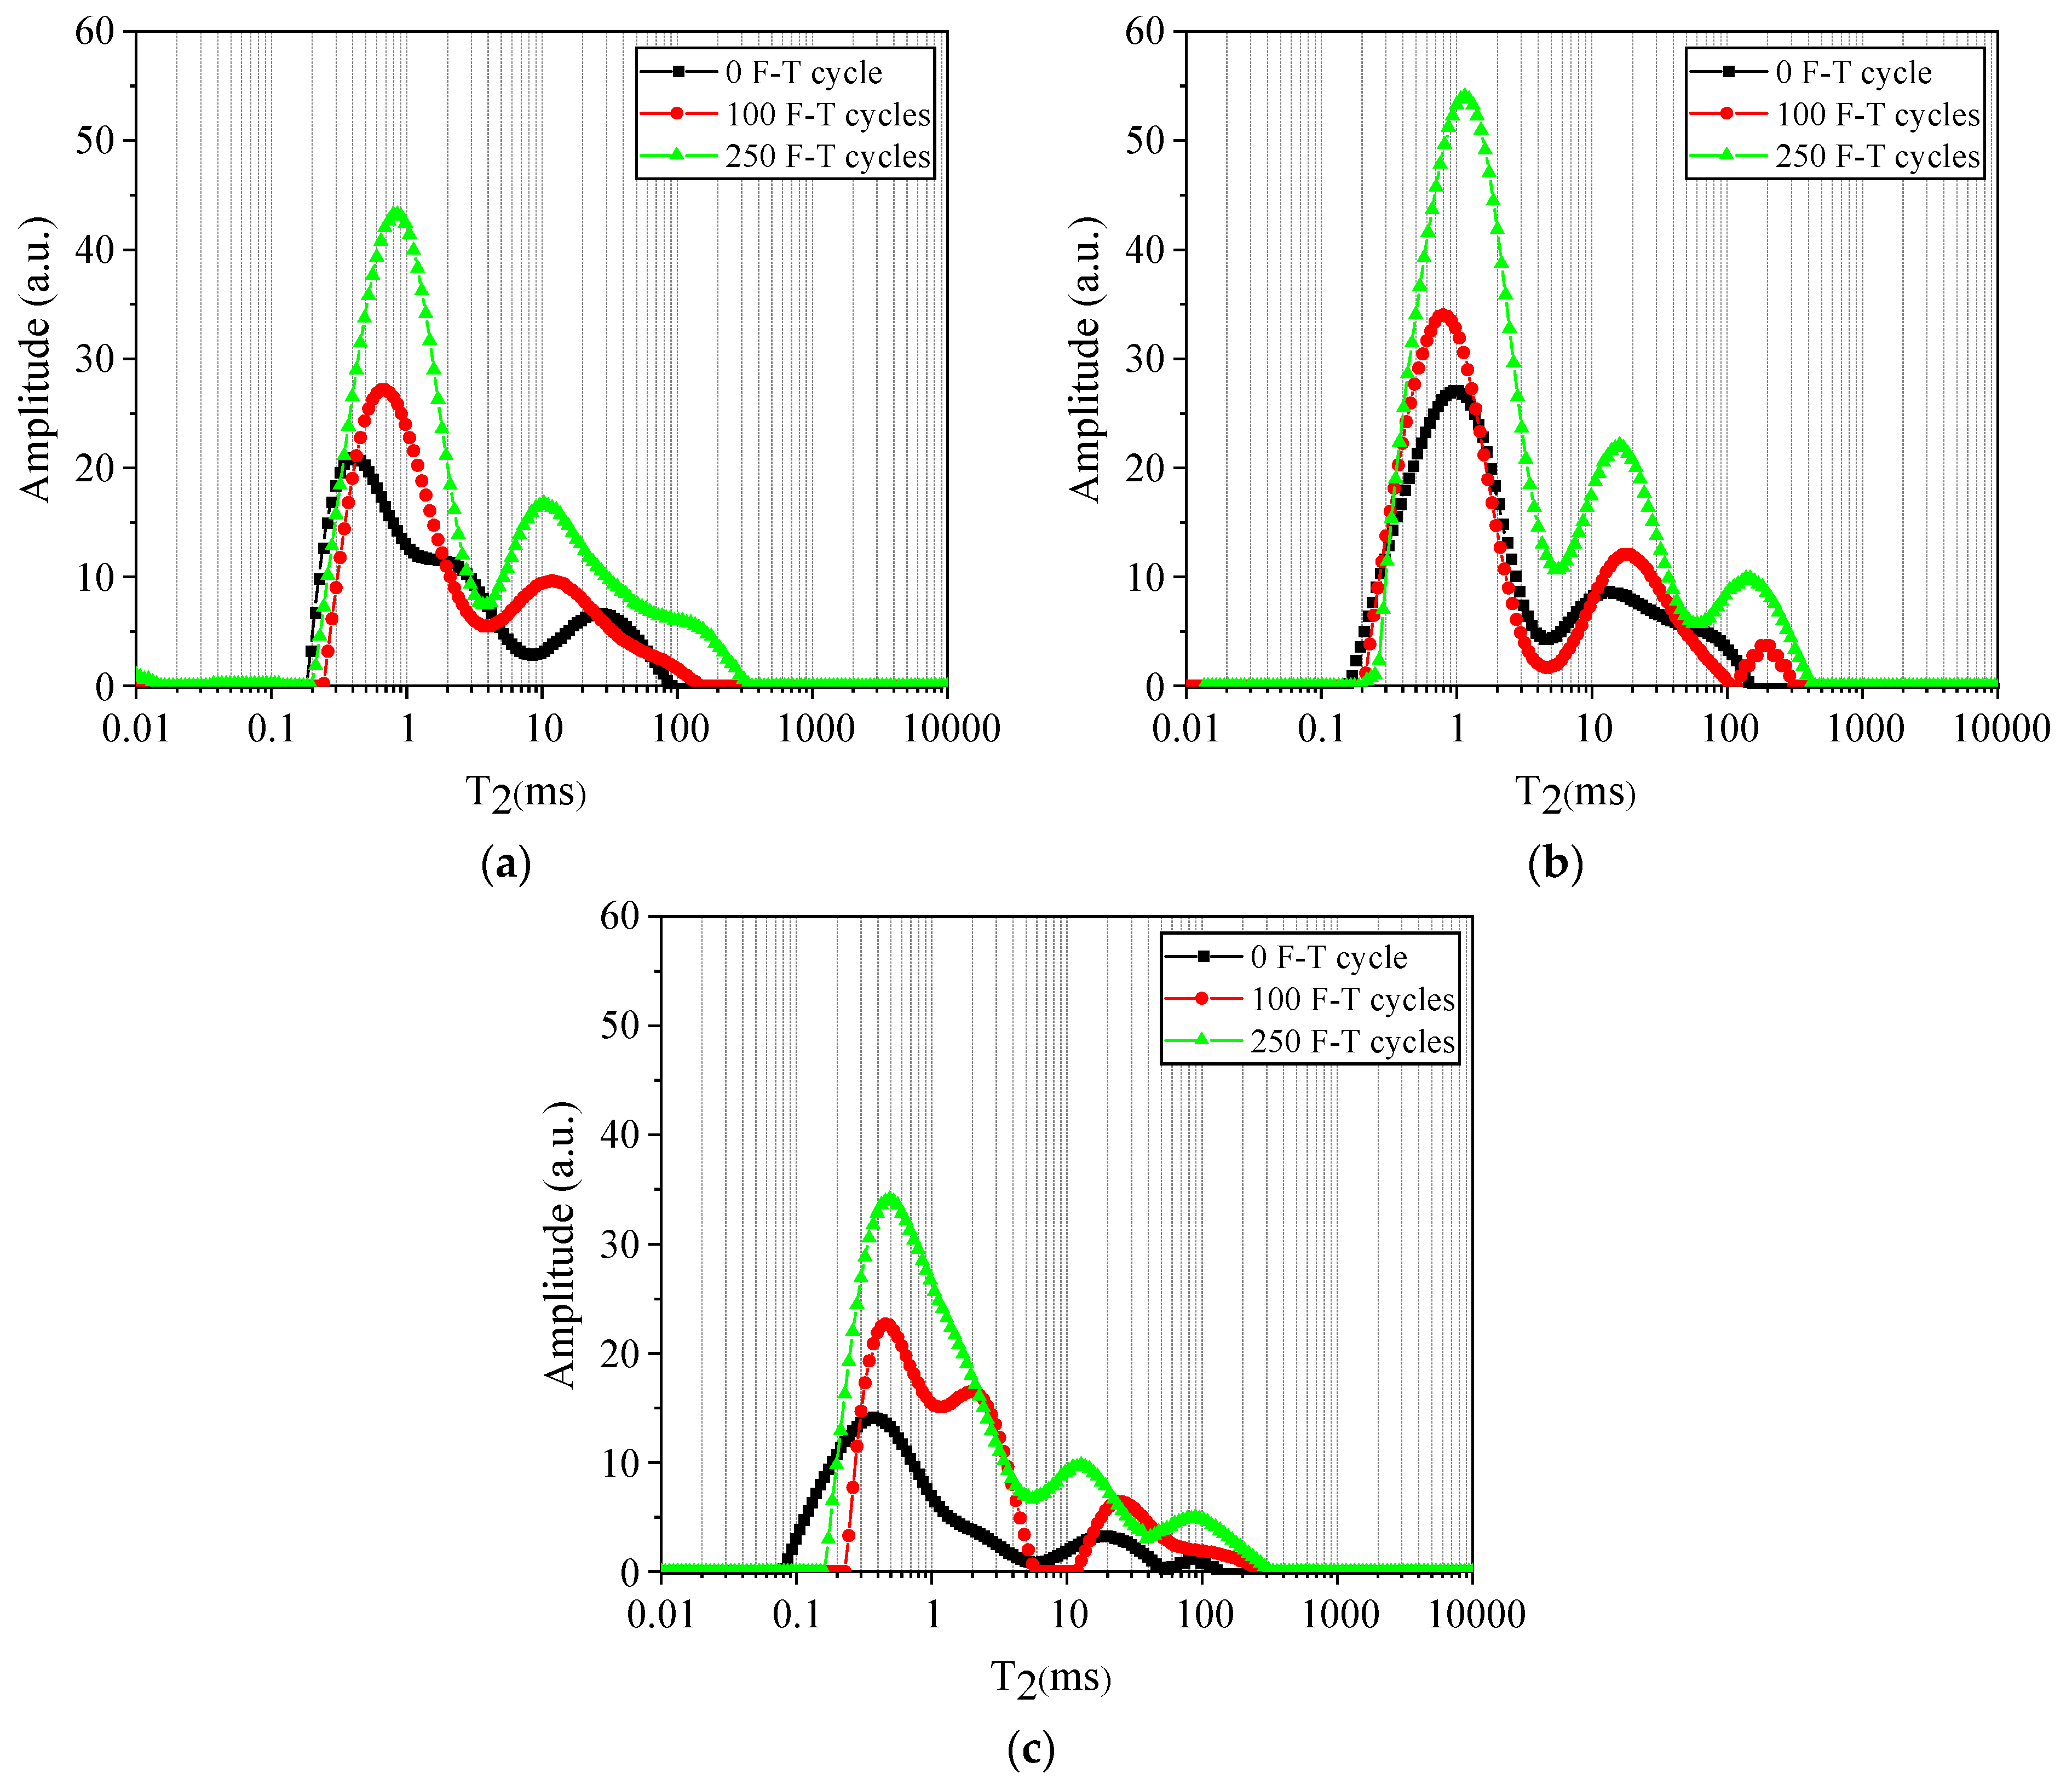
3.3.1. T2 Spectral Fluid Distribution

Figure 10 depicts the T2 spectral fluid distribution, showcasing the relationship curve between the relaxation time (T2) and the inversion signal intensity for the concrete specimens exposed to different F-T cycles. This graphical representation reveals three prominent signal peaks in the T2 spectrum, aligning from left to right with high, medium, and low peaks, respectively. The signal intensity of the three peaks from high to low are: first peak (high peak) > second peak (medium peak) > third peak (low peak), which indicates that the number of micropores in the concrete specimens is much larger than that of medium and large pores.
As the number of F-T cycles increases, the signal intensities of NAC, TAC, and TAC-CW20 gradually rise. Simultaneously, the peaks shift to the right, indicating an increase in the number of pores and an enlargement of pore size scales. At 250 F-T cycles, TAC surpasses NAC in the values of its three signal peaks, and these peaks notably shift to the right. In contrast, TAC-CW20 exhibits reduced values for its three signal peaks, and the extent of the rightward peak shift is also diminished. This difference is attributed to the addition of CWs, enhancing matrix connectivity from macro- to microlevels and, consequently, providing resistance against more severe F-T damage.

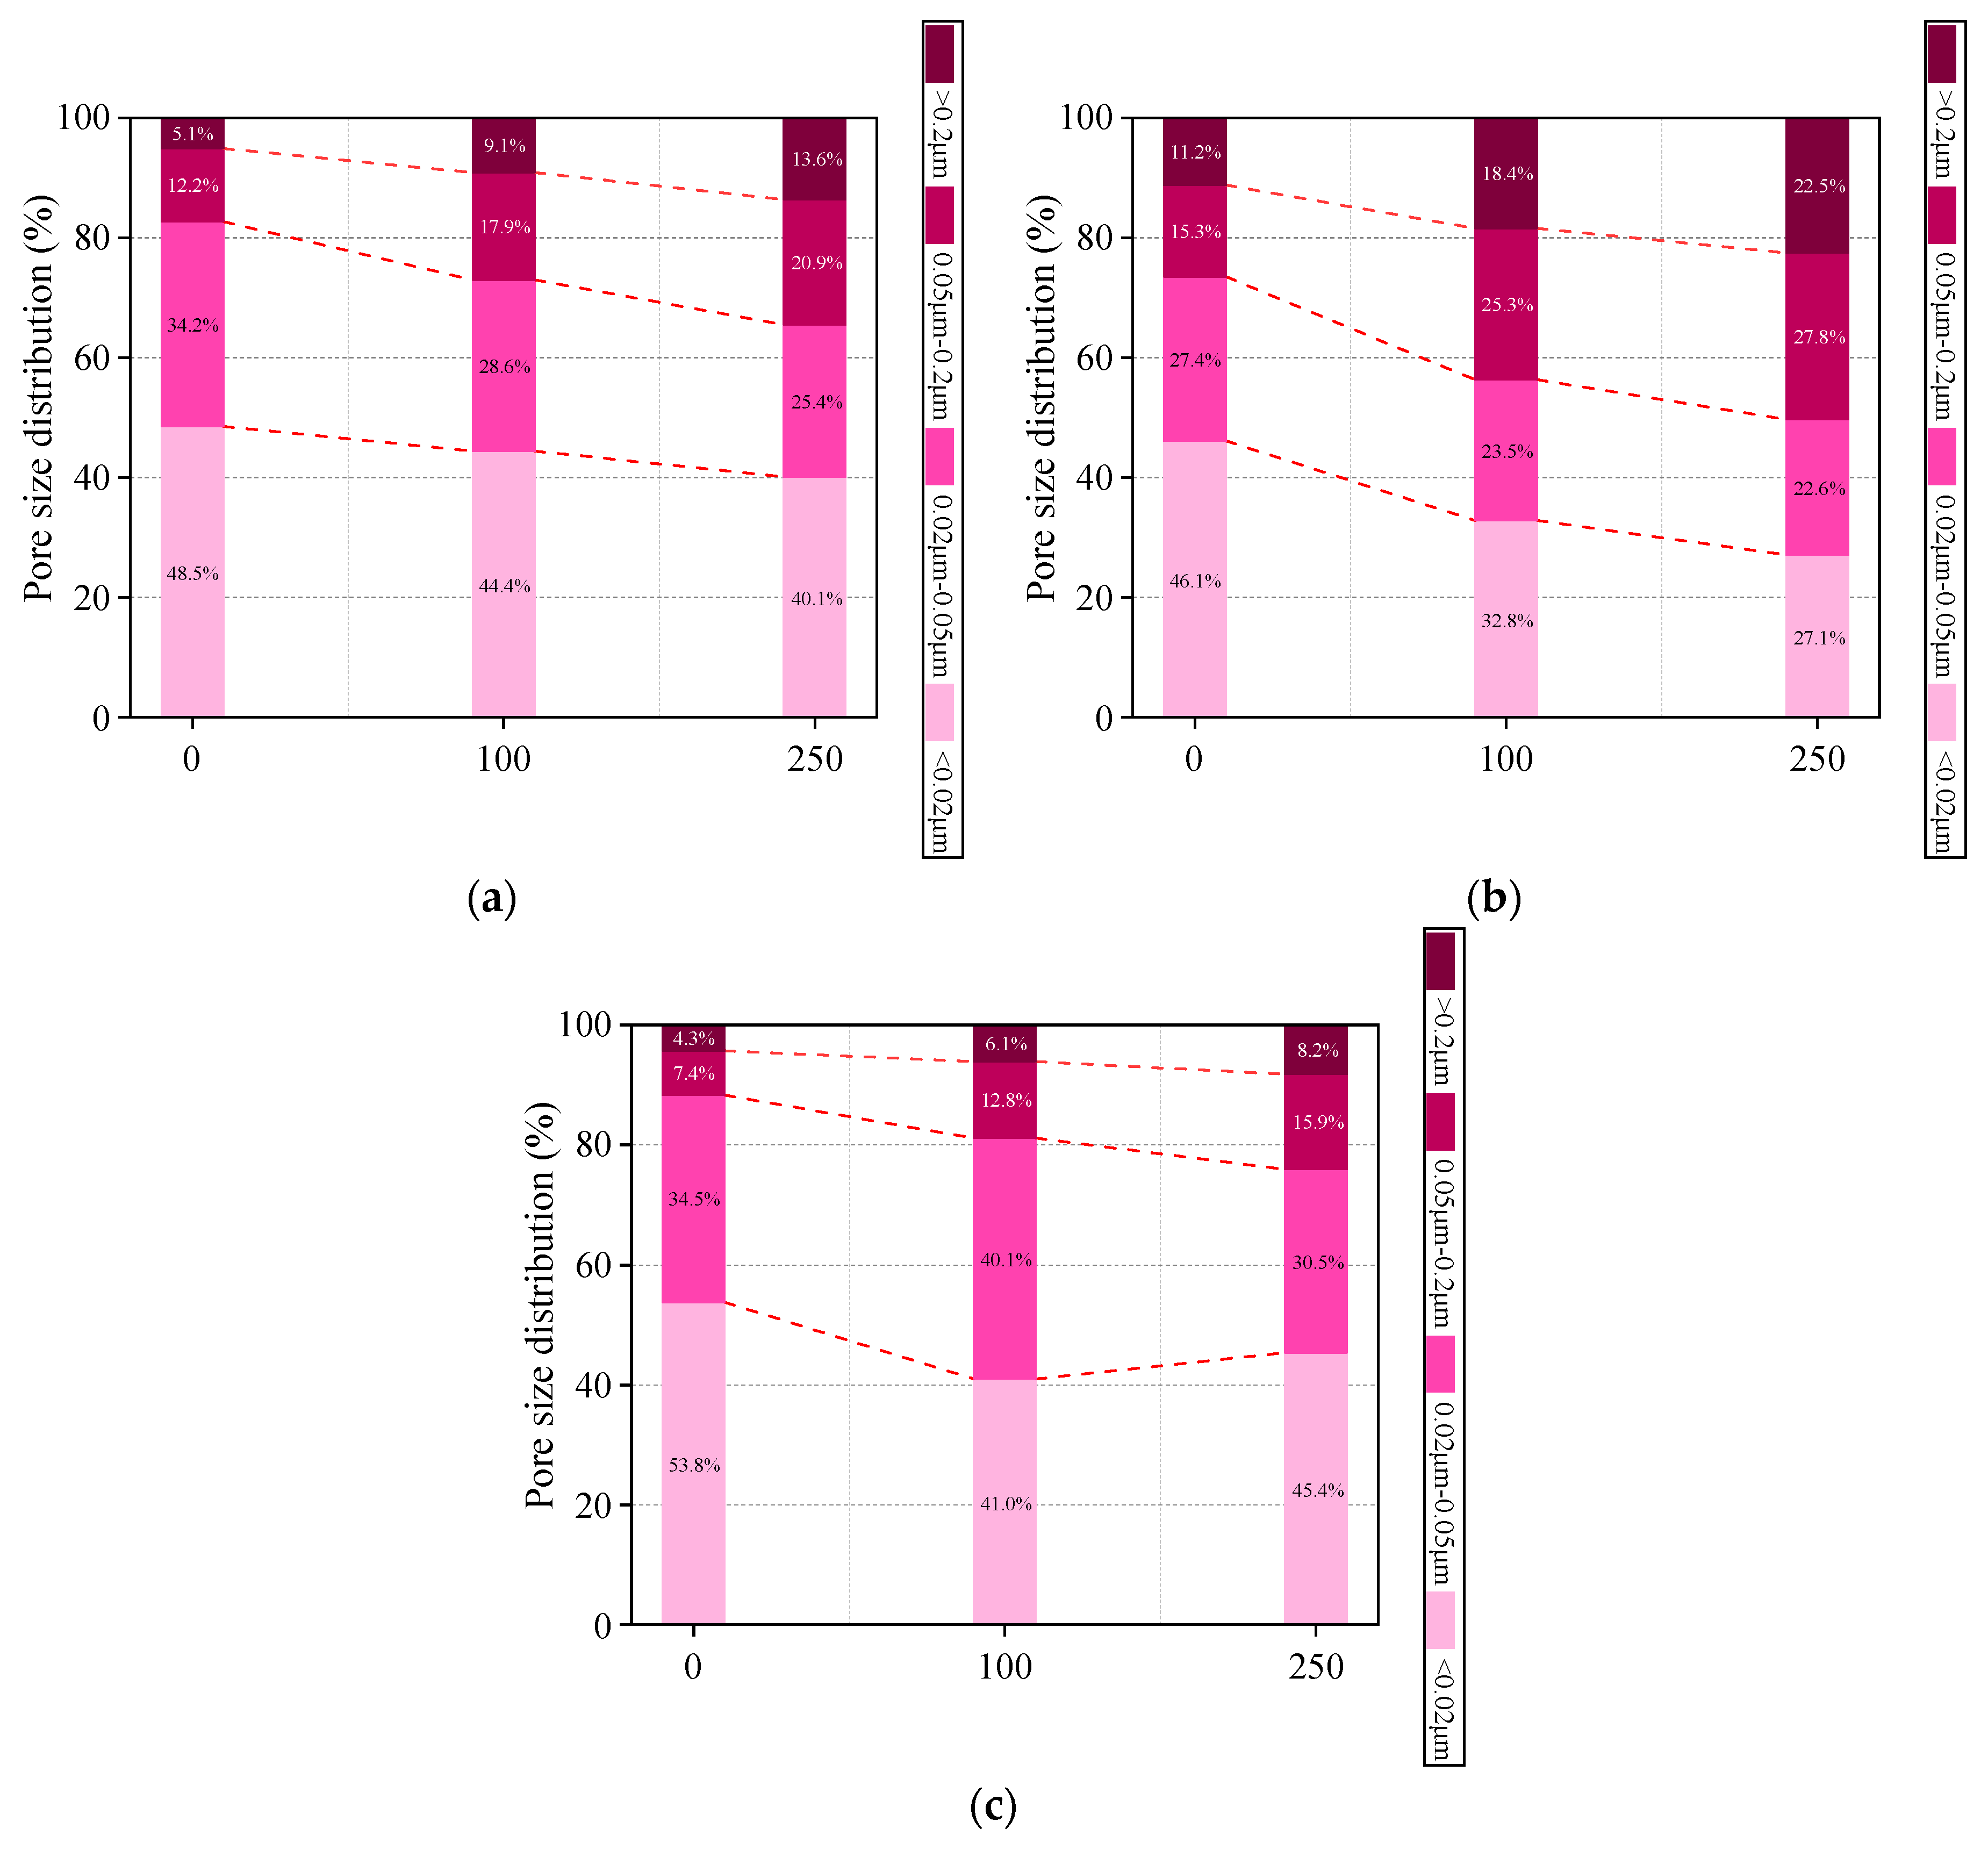
3.3.2. Pore Size Distribution
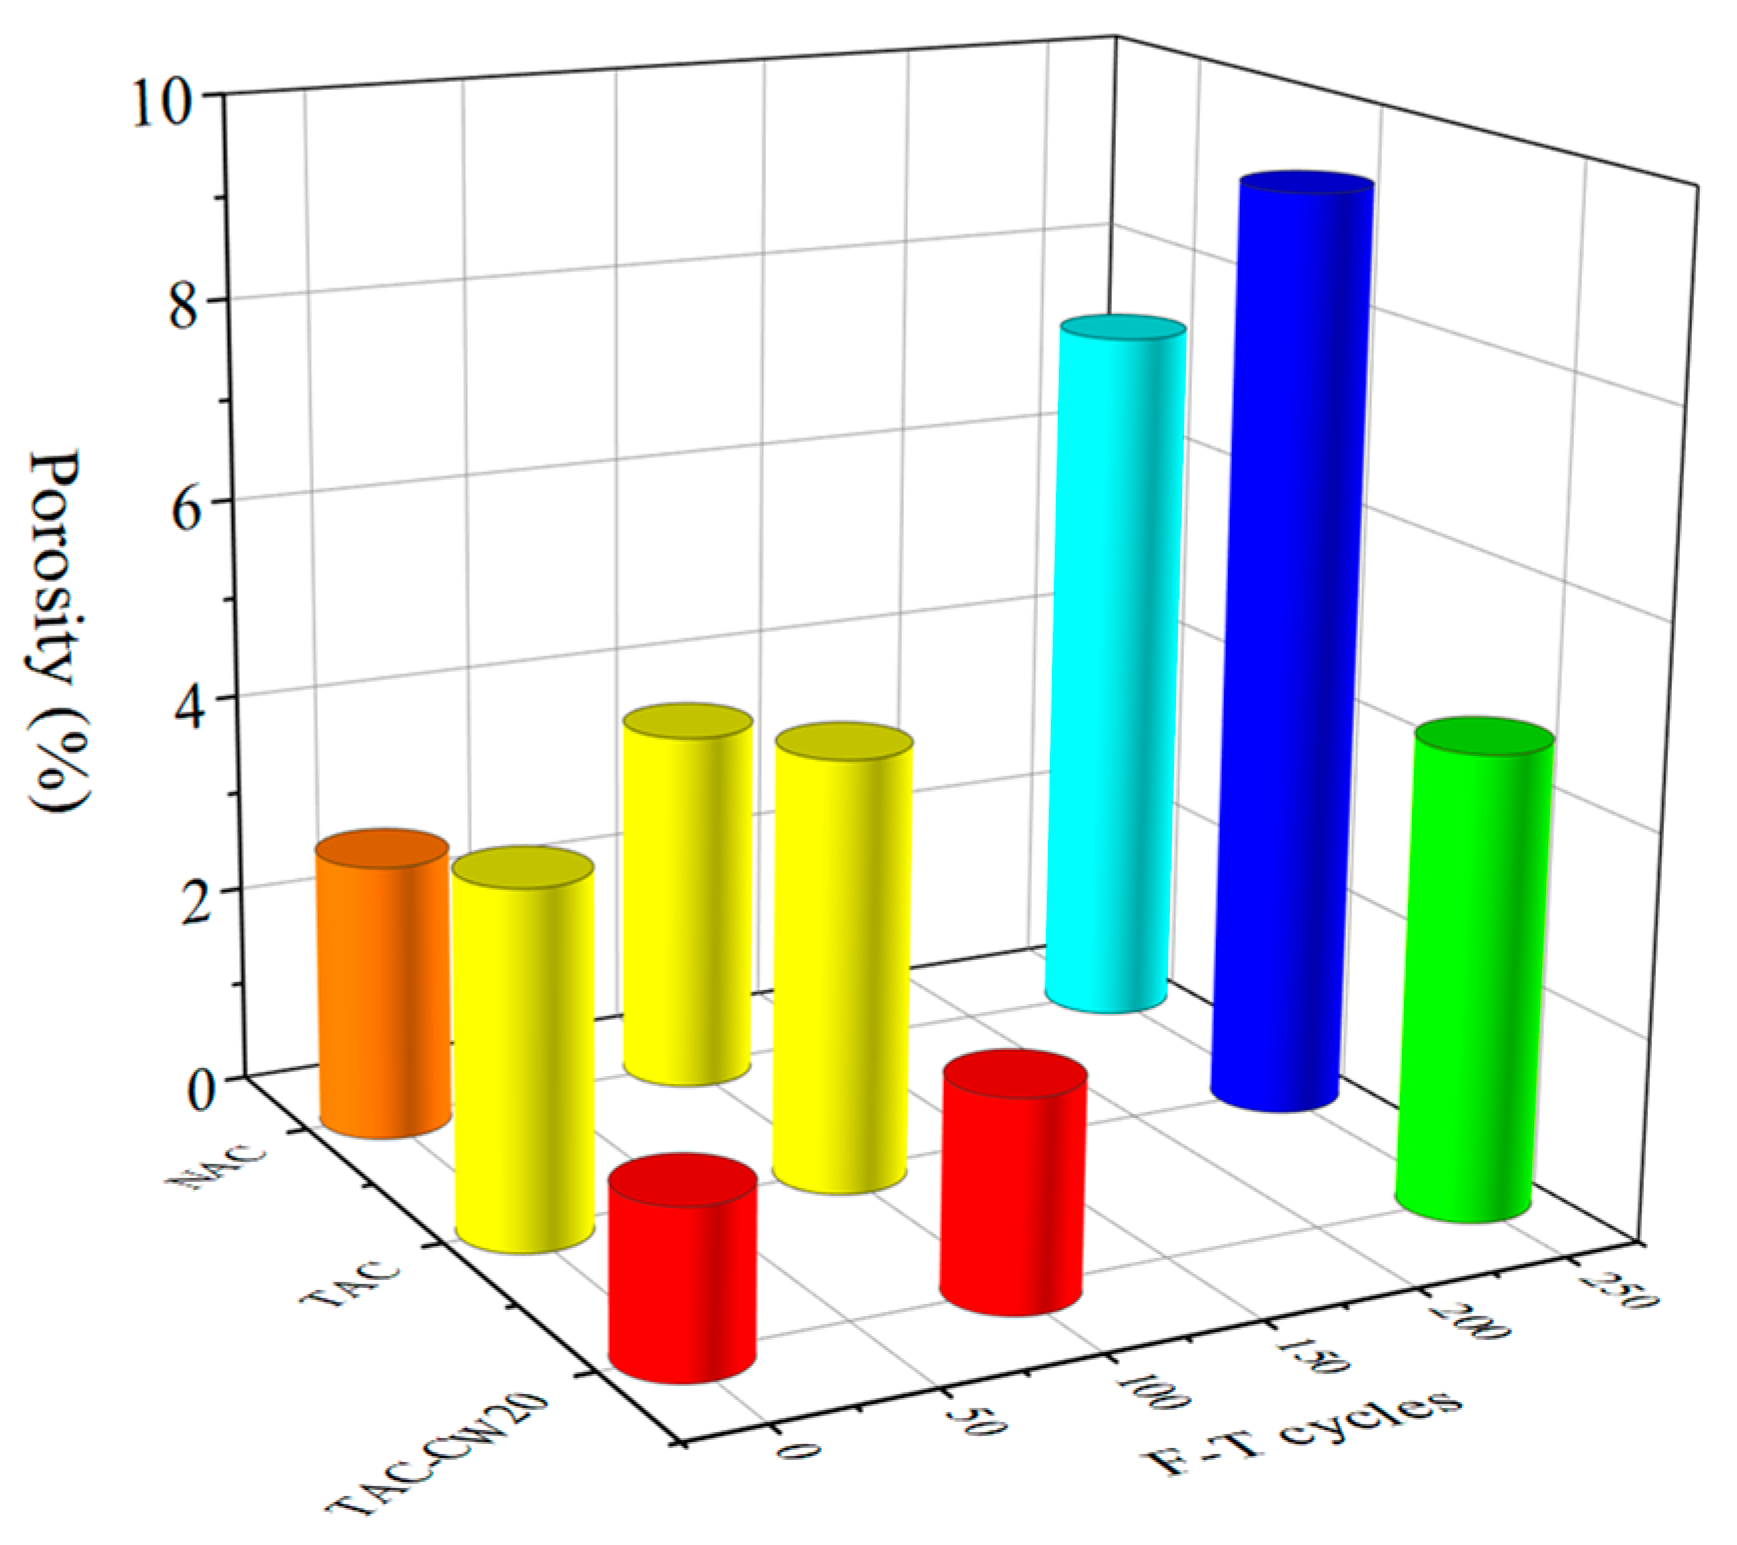
Based on the NMR T2 spectral distribution results and insights from the literature [34], concrete pores were categorized into four categories according to their radius (r), including harmless pores (r < 0.02 μm), less harmful pores (0.02 μm ≤ r < 0.05 μm), harmful pores (0.05 μm ≤ r < 0.20 μm), and more harmful pores (r ≥ 0.20 μm). Figure 11 presents the pore size distribution of specimens subjected to various F-T cycles. Figure 12 illustrates the evolution of harmless and less harmful pores into harmful and more harmful pores due to the F-T cycles. For example, before the F-T cycles, the percentages of harmless pores for NAC, TAC, and TAC-CW20 specimens were 48.5%, 44.4%, and 40.1%, respectively. However, after 250 F-T cycles, the percentages of more harmful pores increased to 13.6%, 22.5%, and 8.2% for NAC, TAC, and TAC-CW20, respectively. The ingress of SO42− into concrete, primarily facilitated by the F-T process, leads to their interaction with hydration products and the generation of erosion products such as gypsum and AFt. As the number of freeze–thaw cycles increases, the reaction between SO42− and hydration products intensifies, resulting in excess production of gypsum and AFt. The pore walls cannot withstand the expansion pressure from these products, leading to damage. Consequently, initially, harmless pores transform into more harmful ones, exacerbating the overall concrete deterioration. Furthermore, it is evident that compared to NAC, the addition of IOTA negatively impacts the pore size distribution of TAC. Conversely, TAC-CW20, incorporating CWs, exhibits superior pore characteristics compared to NAC. This improvement is primarily attributed to the hydrophilic nature of CWs, enabling the concrete to absorb unfrozen pore solution and free water, thereby reducing the hydrostatic pressure within it. Simultaneously, the “CW network” effectively separates and refines distributed air bubbles, restraining the further development of cracks during F-T cycles due to the bridging effect of CWs.

3.3.3. Porosity

Figure 12 illustrates the porosities of specimens after different F-T cycles. It is evident that the porosity gradually increases with the number of F-T cycles. Compared to the 0 F-T cycle condition, the porosity of specimens of NAC, TAC, and TAC-CW20 increased by 31.65%, 22.03%, and 26.82% after 100 F-T cycles, respectively, and increased by 161.15%, 162.71%, and 181.09% after 250 F-T cycles, respectively. In addition, compared to NAC, after 250 freeze–thaw cycles, TAC exhibited a 28.1% increase in porosity, whereas TAC-CW20 showed a notable 36.5% decrease. This reinforces the favorable mechanical properties and freeze–thaw resistance of TAC-CW20 from the mesoscopic porosity point of view.

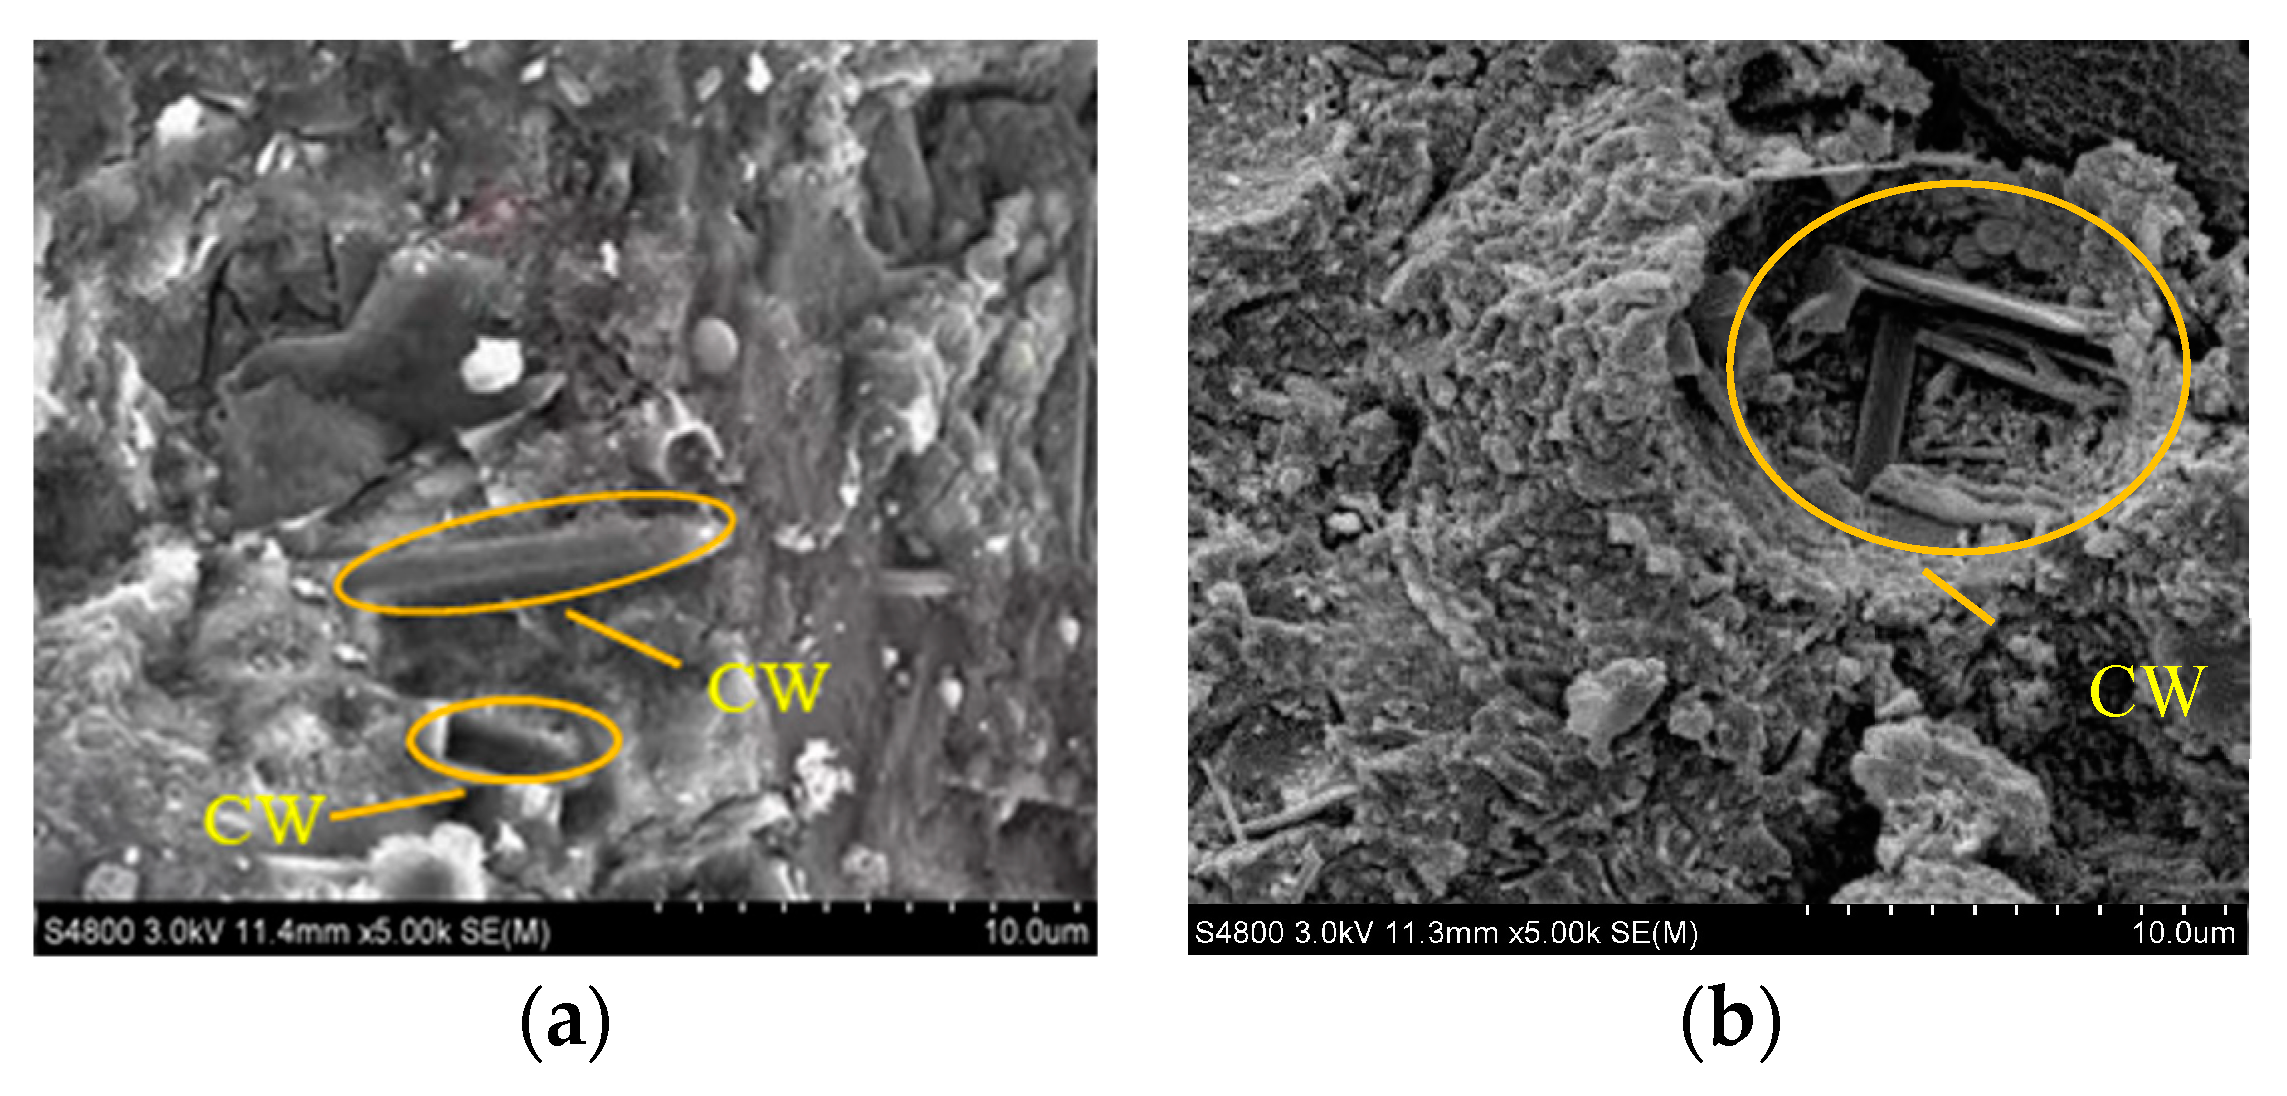
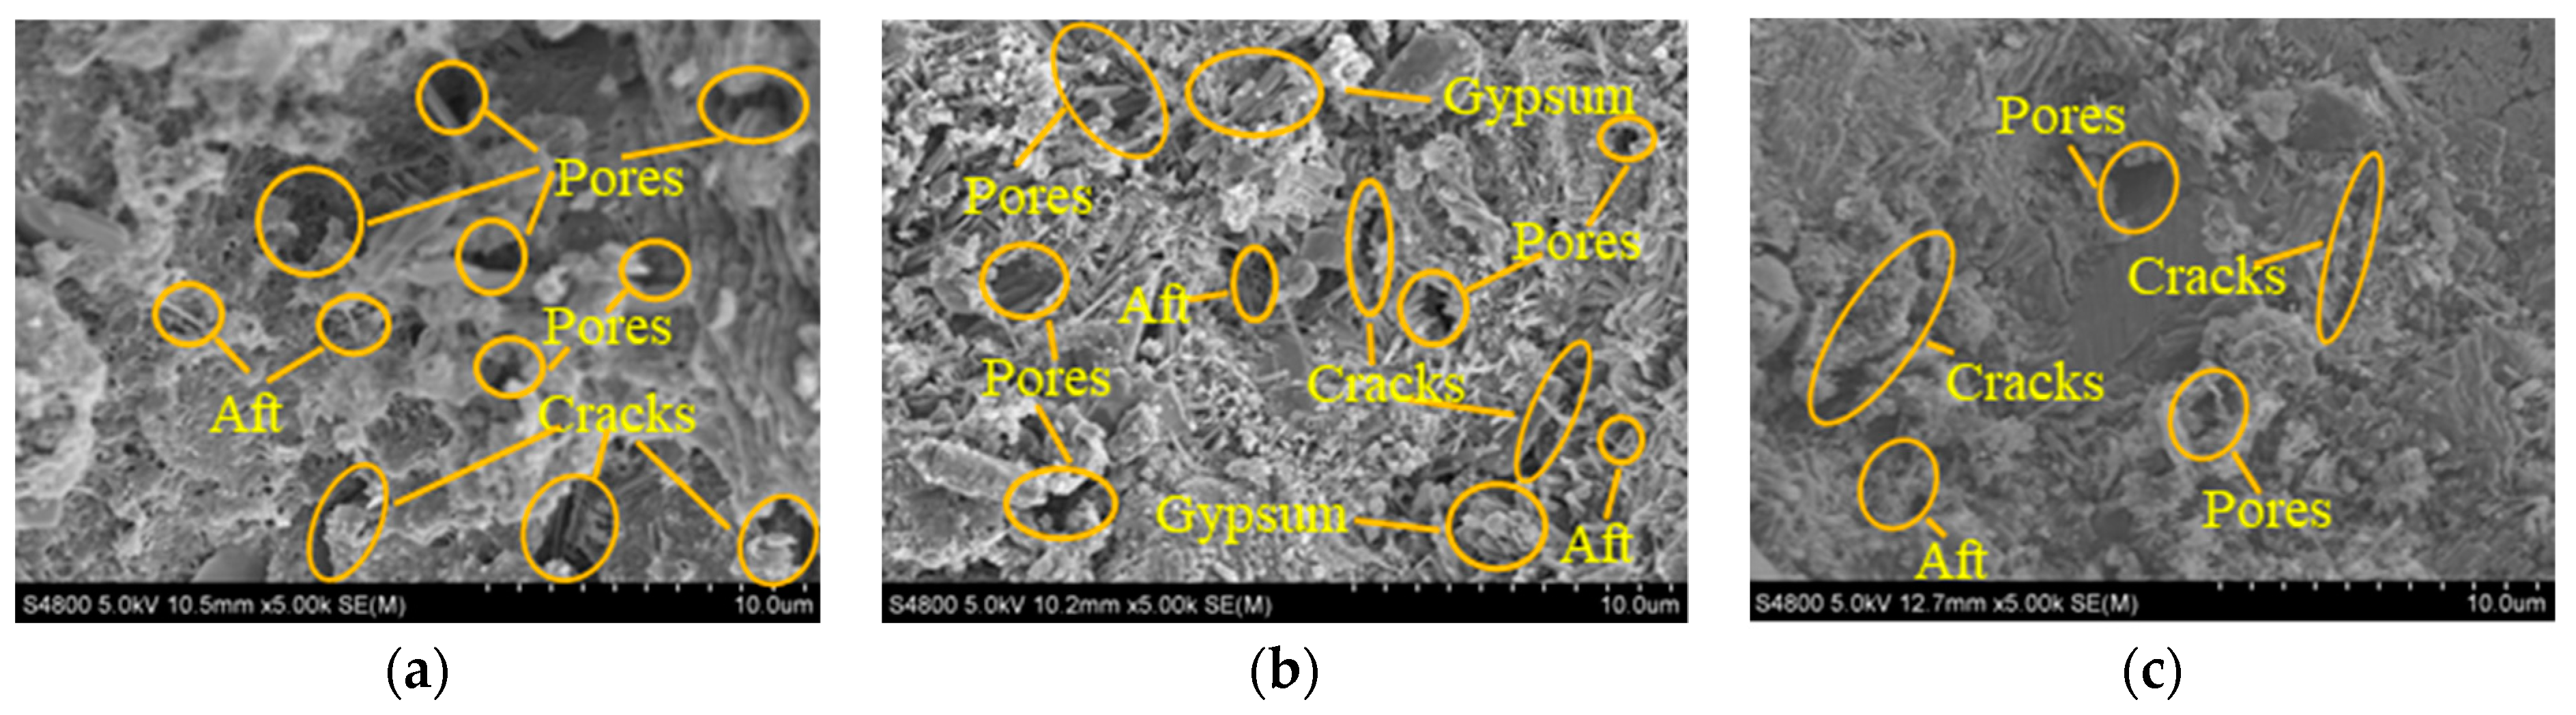
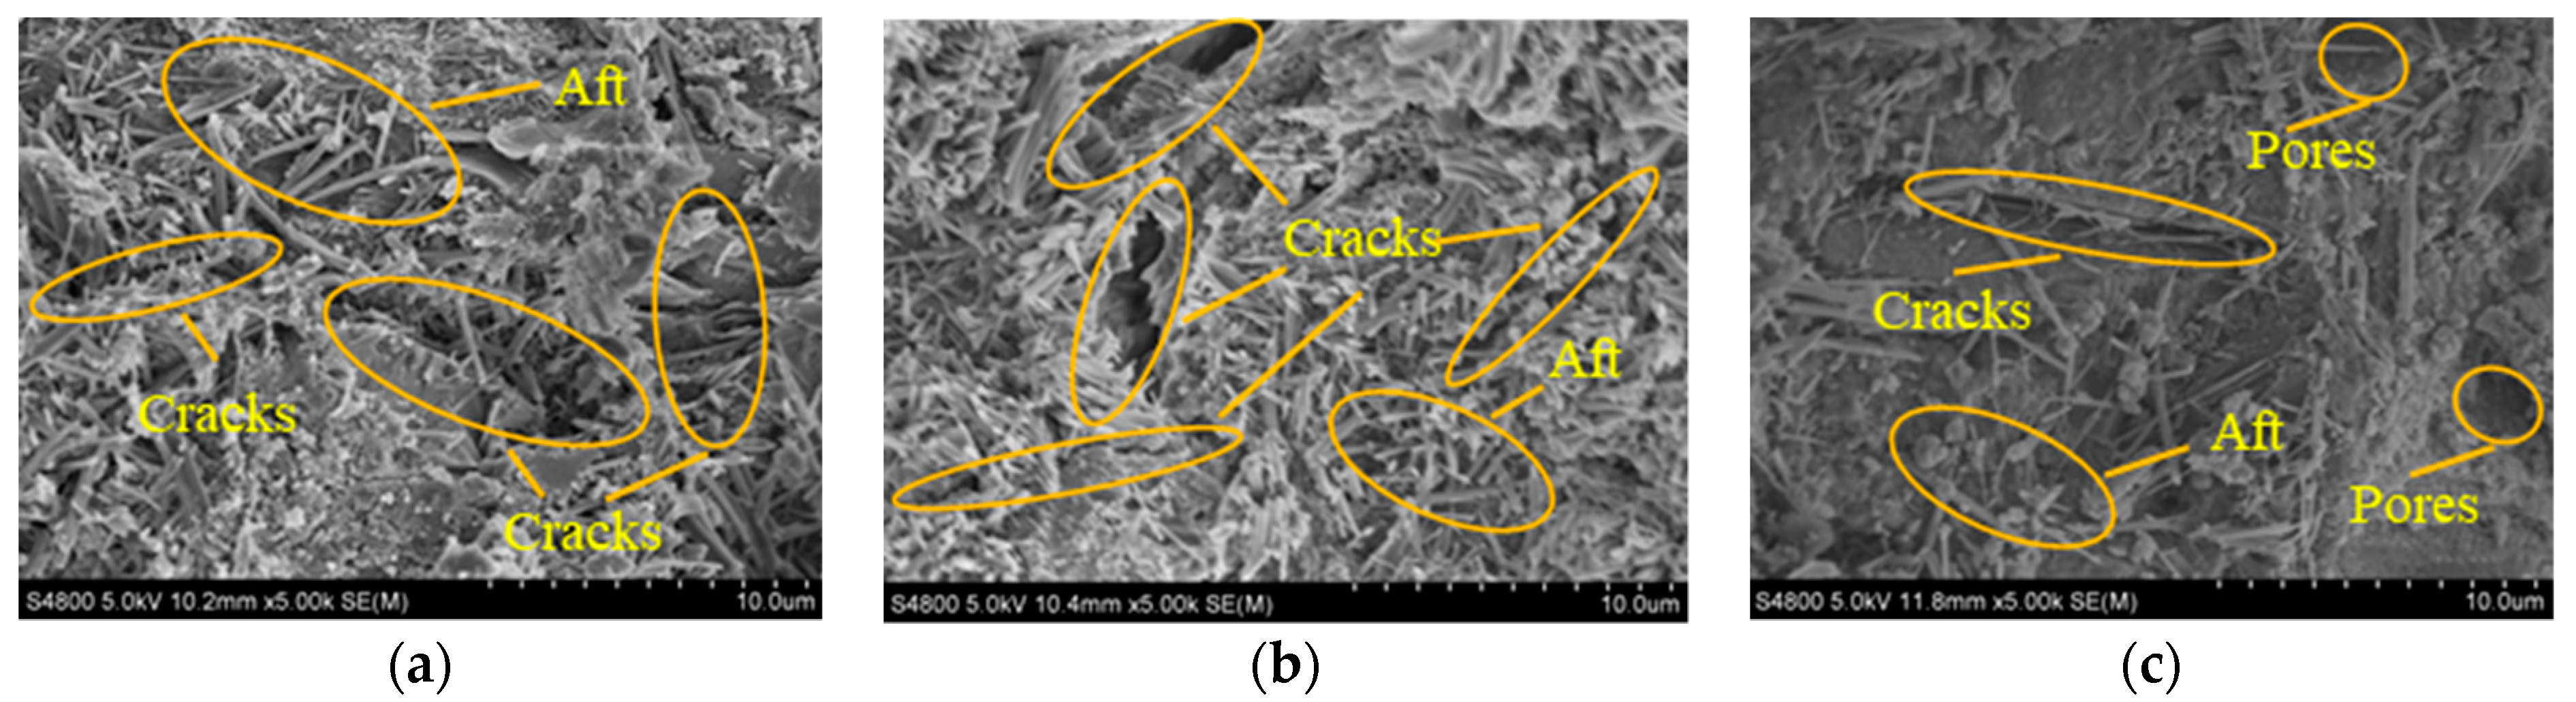
3.4. Micromorphology from SEM

Figure 13 shows the dispersion of CWs inside the matrix, and it can be found that the CWs inside the TAC-CW20 specimen are relatively well dispersed, while the CWs inside the TAC-CW30 specimen appear to be agglomerated. Figure 14 and Figure 15 depict the internal microstructures of the specimens following 100 and 250 F-T cycles. It can be seen in Figure 14a–c and Figure 15a–c that after 100 F-T cycles, the emergence of erosion produces rod-like crystals (gypsum), needle-like crystals (caliche), and fine-grained crystals in the NAC, TAC, and TAC-CW20 specimens. Additionally, distinct microcracks and micropores are visible within individual specimens, although they are not interconnected. Following 250 F-T cycles, a significant increase in erosion products is observed in all specimens, accompanied by a notable expansion in the scale of microcracks due to repeated F-T cycles and crystallization expansion stress. Furthermore, micropores develop into microcracks through connectivity. These findings elucidate the deterioration mechanism of macroscopic properties (mass, compressive strength, and relative dynamic modulus) of concrete specimens under sulfate F-T cycles. Notably, after 250 F-T cycles, the interior of TAC exhibits a looser structure than NAC. At the same time, TAC-CW20 shows a relatively denser interior with fewer erosion products, further validating the superior frost resistance of TAC-CW20.

4. Conclusions

The utilization of IOTA resources has the benefit of reducing the accumulation and dumping of industrial waste. This practice contributes to realizing sustainable development goals for natural resources. Calcium carbonate whisker-reinforced iron ore tailings concrete was prepared by replacing NA with IOTA and incorporating CWs. The mechanical properties, sulfate F-T cycle resistance, pore structure, and microstructure of the calcium carbonate whisker-reinforced iron ore tailings concrete were discussed. Based on the findings of this study, the following conclusions can be drawn.
(1)
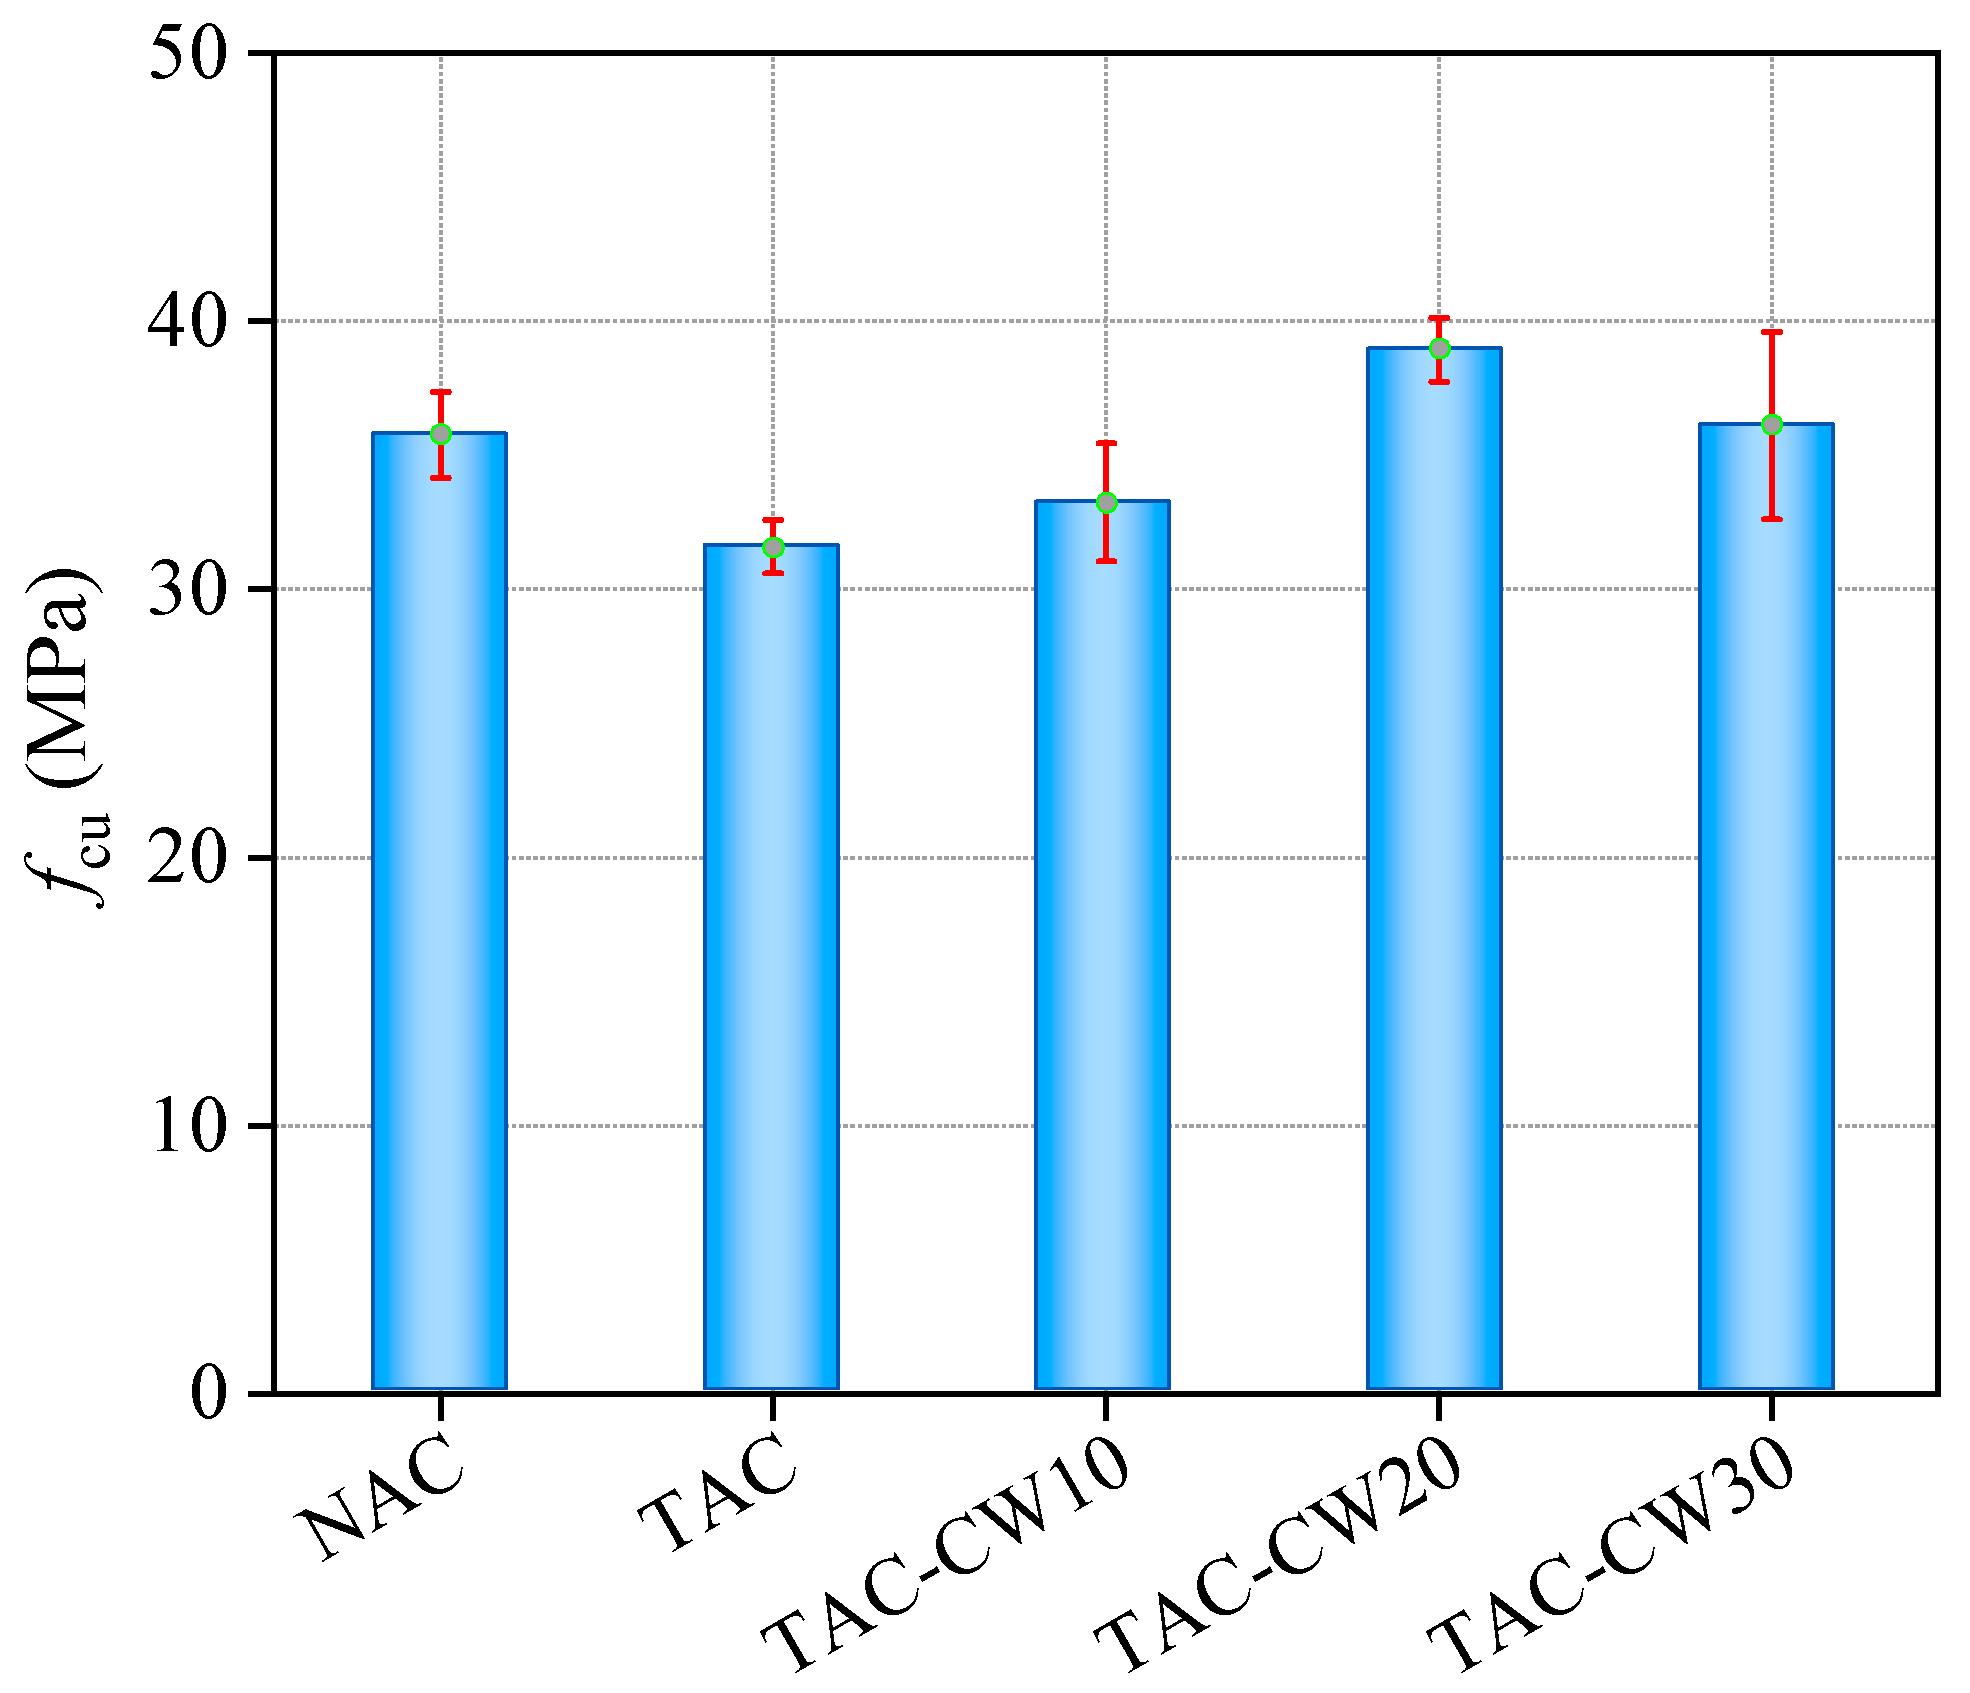
When IOTA completely replaced NA, both the fcu and fst of TAC decreased. Upon adding 10–30% CWs to TAC, the fcu and fst of TAC-CW20, incorporating 20% CWs, increased by 23.26% and 49.6% compared to TAC and were higher than those of NAC, demonstrating that incorporating 20% CWs in the TAC had a beneficial effect.
(2)
The F-T damage of concrete initially increases and subsequently decreases during F-T cycles in Na2SO4 solution. When the CWs were added to TAC, TAC-CW20 showed the best frost resistance compared to the other groups of specimens undergoing 300 F-T cycles.
(3)
NMR results showed that concrete’s internal pore size and porosity gradually increase with increasing numbers of F-T cycles. After different F-T cycles, TAC-CW20 had a lower porosity and a larger number of harmful pores than NAC. The incorporation of 20% CWs is beneficial for the development of internal pore structure in TAC.
(4)
Based on the results of SEM, as the number of F-T cycles increased, the formation of corrosion products in concrete increased the number of pores and cracks. After 250 F-T cycles, TAC-CW20 showed a relatively denser interior with fewer erosion products than NAC. This further confirms that the inclusion of 20% CWs could enhance the performance of TAC.
(5)
The macroscopic and microscopic results indicated that incorporating 20% CWs into TAC in producing concrete led to superior performance, including mechanical properties, frost resistance, pore structure, and microstructure, compared to ordinary concrete.

Author Contributions

S.W.: Conceptualization, Methodology, Formal analysis, Writing—original draft. Y.G.: Conceptualization, Investigation Funding acquisition. K.L.: Methodology, Resources, Investigation, Writing—review and editing. All authors have read and agreed to the published version of the manuscript.

Funding

This project was supported by Key Research and Development of Shaanxi, China (grant nos. 2021SF-521 and 2022SF-375), and the Natural Science Foundation of Shaanxi, China (grant no. 2021JQ-844).

Data Availability Statement

All data included in this study are available upon request by contact with the corresponding author.

Conflicts of Interest

Author Yangyang Gao was employed by the company The Engineering Design Academy of Chang’an University Co., Ltd. The remaining authors declare that the research was conducted in the absence of any commercial or financial relationships that could be construed as a potential conflict of interest.

Abbreviations

CWsCalcium carbonate whiskers
F-TFreeze–thaw
IOTAIron ore tailings as crushed stone aggregate
NANatural crushed stone aggregate
NACNormal concrete
NMRNuclear magnetic resonance
RDEMRelative dynamic elastic modulus
RSRiver sand
SEMScanning electron microscopy
TACIron ore tailings concrete
TAC-CWCalcium carbonate whisker-reinforced iron ore tailings concrete
fcuCompressive strength
fstSplitting tensile strength
McMass loss

References

  1. Zhang, L.; Xu, M.; Chen, H.; Li, Y.; Chen, S. Globalization, green economy and environmental challenges: State of the art review for practical implications. Front. Environ. Sci. 2022, 10, 870271. [Google Scholar] [CrossRef]
  2. Al-Shetwi, A.Q. Sustainable development of renewable energy integrated power sector: Trends, environmental impacts, and recent challenges. Sci. Total Environ. 2022, 822, 153645. [Google Scholar] [CrossRef] [PubMed]
  3. Cuce, P.M.; Cuce, E.; Alvur, E. Internal or external thermal superinsulation towards low/zero carbon buildings? A critical report. Gazi Mühendislik Bilimleri Dergisi 2024, 9, 435–442. [Google Scholar]
  4. Cuce, E.; Cuce, P.M.; Wood, C.; Gillott, M.; Riffat, S. Experimental Investigation of Internal Aerogel Insulation Towards Low/Zero Carbon Buildings: A Comprehensive Thermal Analysis for a UK Building. Sustain. Clean Build. 2024, 1, 1–22. [Google Scholar]
  5. Akram, M.W.; Hasannuzaman, M.; Cuce, E.; Cuce, P.M. Global technological advancement and challenges of glazed window, facade system and vertical greenery-based energy savings in buildings: A comprehensive review. Energy Built Environ. 2023, 4, 206–226. [Google Scholar] [CrossRef]
  6. Ahmed, A.; Ge, T.; Peng, J.; Yan, W.C.; Tee, B.T.; You, S. Assessment of the renewable energy generation towards net-zero energy buildings: A review. Energy Build. 2022, 256, 111755. [Google Scholar] [CrossRef]
  7. Li, L.; Lin, J.; Wu, N.; Xie, S.; Meng, C.; Zheng, Y.; Wang, X.; Zhao, Y. Review and outlook on the international renewable energy development. Energy Built Environ. 2022, 3, 139–157. [Google Scholar] [CrossRef]
  8. Bertoldi, P.; Economidou, M.; Palermo, V.; Boza-Kiss, B.; Todeschi, V. How to finance energy renovation of residential buildings: Review of current and emerging financing instruments in the EU. Wiley Interdiscip. Rev. Energy Environ. 2021, 10, e384. [Google Scholar] [CrossRef]
  9. Tsemekidi Tzeiranaki, S.; Bertoldi, P.; Diluiso, F.; Castellazzi, L.; Economidou, M.; Labanca, N.; Serrenho, T.R.; Zangheri, P. Analysis of the EU residential energy consumption: Trends and determinants. Energies 2019, 12, 1065. [Google Scholar] [CrossRef]
  10. Drewniok, M.P.; Dunant, C.F.; Allwood, J.M.; Ibell, T.; Hawkins, W. Modelling the embodied carbon cost of UK domestic building construction: Today to 2050. Ecol. Econ. 2023, 205, 107725. [Google Scholar] [CrossRef]
  11. Rashad, M.; Khordehgah, N.; Żabnieńska-Góra, A.; Ahmad, L.; Jouhara, H. The utilisation of useful ambient energy in residential dwellings to improve thermal comfort and reduce energy consumption. Int. J. Thermofluids 2021, 9, 100059. [Google Scholar] [CrossRef]
  12. Cuce, P.M. Thermal performance assessment of a novel liquid desiccant-based evaporative cooling system: An experimental investigation. Energy Build. 2017, 138, 88–95. [Google Scholar] [CrossRef]
  13. Chen, Q.; Ja, M.K.; Burhan, M.; Akhtar, F.H.; Shahzad, M.W.; Ybyraiymkul, D.; Ng, K.C. A hybrid indirect evaporative cooling-mechanical vapor compression process for energy-efficient air conditioning. Energy Convers. Manag. 2021, 248, 114798. [Google Scholar] [CrossRef]
  14. Chang, C.K.; Yih, T.Y.; Othman, Z.B. Performance Assessment of Green Filtration System with Evaporative Cooling to Improve Indoor Air Quality (IAQ). Int. J. Environ. Sci. Dev. 2022, 13, 1–7. [Google Scholar]
  15. Zhou, C.; Hu, Y.; Zhang, L.; Fang, J.; Xi, Y.; Hu, J.; Li, Y.; Liu, L.; Zhao, Y.; Yang, L.; et al. Investigation of heat transfer characteristics of deflected elliptical-tube heat exchanger in closed-circuit cooling towers. Appl. Therm. Eng. 2024, 236, 121860. [Google Scholar] [CrossRef]
  16. Lai, L.; Wang, X.; Kefayati, G.; Hu, E. Evaporative cooling integrated with solid desiccant systems: A review. Energies 2021, 14, 5982. [Google Scholar] [CrossRef]
  17. Blanco-Marigorta, A.M.; Tejero-Gonzalez, A.; Rey-Hernandez, J.M.; Gomez, E.V.; Gaggioli, R. Exergy analysis of two indirect evaporative cooling experimental prototypes. Alex. Eng. J. 2022, 61, 4359–4369. [Google Scholar] [CrossRef]
  18. Mohammed, R.H.; El-Morsi, M.; Abdelaziz, O. Indirect evaporative cooling for buildings: A comprehensive patents review. J. Build. Eng. 2022, 50, 104158. [Google Scholar] [CrossRef]
  19. Shi, W.; Min, Y.; Ma, X.; Chen, Y.; Yang, H. Performance evaluation of a novel plate-type porous indirect evaporative cooling system: An experimental study. J. Build. Eng. 2022, 48, 103898. [Google Scholar] [CrossRef]
  20. Sun, T.; Tang, T.; Yang, C.; Yan, W.; Cui, X.; Chu, J. Cooling performance and optimization of a tubular indirect evaporative cooler based on response surface methodology. Energy Build. 2023, 285, 112880. [Google Scholar] [CrossRef]
  21. Putra, N.; Sofia, E.; Gunawan, B.A. Evaluation of indirect evaporative cooling performance integrated with finned heat pipe and luffa cylindrica fiber as cooling/wet media. J. Adv. Res. Exp. Fluid Mech. Heat Transf. 2021, 3, 16–25. [Google Scholar]
  22. Zhao, X.; Liu, S.; Riffat, S.B. Comparative study of heat and mass exchanging materials for indirect evaporative cooling systems. Build. Environ. 2008, 43, 1902–1911. [Google Scholar] [CrossRef]
  23. Xu, P.; Ma, X.; Zhao, X.; Fancey, K.S. Experimental investigation on performance of fabrics for indirect evaporative cooling applications. Build. Environ. 2016, 110, 104–114. [Google Scholar] [CrossRef]
  24. Maclaine-Cross, I.L.; Banks, P.J. A general theory of wet surface heat exchangers and its application to regenerative evaporative cooling. J. Heat Transf. 1981, 103, 579–585. [Google Scholar] [CrossRef]
  25. Kettleborough, C.F.; Hsieh, C.S. The thermal performance of the wet surface plastic plate heat exchanger used as an indirect evaporative cooler. J. Heat Transf. 1983, 105, 366–373. [Google Scholar] [CrossRef]
  26. Kettleborough, C.F.; Waugaman, D.G.; Johnson, M. The thermal performance of the cross-flow three-dimensional flat plate indirect evaporative cooler. J. Energy Resour. Technol. 1992, 114, 181–186. [Google Scholar] [CrossRef]
  27. Wassel, A.T.; Mills, A.F. Design methodology for a counter-current falling film evaporative condenser. J. Heat Transf. 1987, 109, 784–787. [Google Scholar] [CrossRef]
  28. Hsu, S.T.; Lavan, Z.; Worek, W.M. Optimization of wet surface heat exchanger. Energy 1989, 14, 757–770. [Google Scholar] [CrossRef]
  29. Erens, P.J.; Dreyer, A.A. Modelling of indirect evaporative air coolers. Int. J. Heat Mass Transf. 1993, 36, 17–26. [Google Scholar] [CrossRef]
  30. Tsay, Y.L. Analysis of heat and mass transfer in a countercurrent-flow wet surface heat exchanger. Int. J. Heat Fluid Flow 1994, 15, 149–156. [Google Scholar] [CrossRef]
  31. Guo, X.C.; Zhao, T.S. A parametric study of an indirect evaporative air cooler. Int. Commun. Heat Mass Transf. 1998, 25, 217–226. [Google Scholar] [CrossRef]
  32. Halasz, B. A general mathematical model of evaporative cooling devices. Rev. Générale Therm. 1998, 37, 245–255. [Google Scholar] [CrossRef]
  33. Riffat, S.B.; Zhu, J. Mathematical model of indirect evaporative cooler using porous ceramic and heat pipe. Appl. Therm. Eng. 2004, 24, 457–470. [Google Scholar] [CrossRef]
  34. Adam, A.; Han, D.; He, W.; Amidpour, M.; Zhong, H. Numerical investigation of the heat and mass transfer process within a cross-flow indirect evaporative cooling system for hot and humid climates. J. Build. Eng. 2022, 45, 103499. [Google Scholar] [CrossRef]
Figure 1. Diffraction pattern of IOTA.
Buildings 14 01004 g001
Figure 2. Grading curves of the aggregates. (a) RS. (b) NA and IOTA.
Buildings 14 01004 g002
Figure 3. Preparation process of the specimens.
Buildings 14 01004 g003
Figure 4. Specimens for NMR pore testing. (a) Specimen saturation. (b) Specimen testing.
Buildings 14 01004 g004
Figure 5. Test results for fcu.
Buildings 14 01004 g005
Figure 6. Test results for fst.
Buildings 14 01004 g006
Figure 7. Test results for Mc after different F-T cycles.
Buildings 14 01004 g007
Figure 8. Test results for REDM after different F-T cycles.
Buildings 14 01004 g008
Figure 9. Test results for fcu after different F-T cycles.
Buildings 14 01004 g009
Figure 10. Test results represented by T2 spectral fluid distribution curves after different F-T cycles. (a) NAC. (b) TAC. (c) TAC-CW20.
Buildings 14 01004 g010
Figure 11. Test results for pore size distributions after different F-T cycles. (a) NAC. (b) TAC. (c) TAC-CW20.
Buildings 14 01004 g011
Figure 12. Test results for porosities after different F-T cycles.
Buildings 14 01004 g012
Figure 13. SEM images of concrete specimens. (a) TAC-CW20. (b) TAC-CW30.
Buildings 14 01004 g013
Figure 14. SEM images of concrete specimens after 100 F-T cycles. (a) NAC. (b) TAC. (c) TAC-CW20.
Buildings 14 01004 g014
Figure 15. SEM images of concrete specimens after 250 F-T cycles. (a) NAC. (b) TAC. (c) TAC-CW20.
Buildings 14 01004 g015
Table 1. Main chemical compositions of NA and IOTA (wt. %).
ComponentNAIOTA
SiO288.2170.26
Al2O39.026.42
Fe2O36.4413.75
MgO0.142.85
CaO0.324.21
SO30.020.24
Na2O0.161.22
Loss0.0060.014
Table 2. Characteristic parameters of CWs.
Length
(μm)
Diameter
(μm)
Density
(g/cm3)
Tensile Strength
(MPa)
Elastic Modulus (GPa)Buildings 14 01004 i001
CWs20–300.5–1.02.83000–6000410–710
Table 3. Mix proportions.
No.C
(kg/m3)
RS
(kg/m3)
IOTA
(kg/m3)
NA
(kg/m3)
W
(kg/m3)
CWs
(%)
Slump
(mm)
NAC545617108502170135
TAC545617010852170110
TAC-CW1545617108502171085
TAC-CW3545617108502172085
TAC-CW5545617108502173080
Disclaimer/Publisher’s Note: The statements, opinions and data contained in all publications are solely those of the individual author(s) and contributor(s) and not of MDPI and/or the editor(s). MDPI and/or the editor(s) disclaim responsibility for any injury to people or property resulting from any ideas, methods, instructions or products referred to in the content.

