Article

Comparative Analysis of Thermal Behavior in Different Seasons in Building Heritage: Case Study of the Royal Hospital of Granada

by
María Paz Sáez-Pérez
1,*,
Luisa María García Ruiz
2,
Jorge A. Durán-Suárez
3,
Joao Castro-Gomes
4,
Alberto Martinez-Ramirez
3 and
María Ángeles Villegas-Broncano
5
1
Building Constructions Department, Advanced Technical School for Building Engineering, University of Granada, 18071 Granada, Spain
2
International School for Postgraduate Studies, University of Granada, 18071 Granada, Spain
3
Sculpture Department, Faculty of Fine Arts, University of Granada, 18071 Granada, Spain
4
Department of Civil Engineering and Architecture, University of Beira Interior, 6201-001 Covilha, Portugal
5
CSIC Madrid, 28037 Madrid, Spain
*
Author to whom correspondence should be addressed.
Buildings 2023, 13(12), 3048; https://doi.org/10.3390/buildings13123048
Submission received: 19 October 2023 / Revised: 2 December 2023 / Accepted: 5 December 2023 / Published: 7 December 2023

Abstract

:
The present investigation carries out a thermal evaluation of two rooms located in the Royal Hospital of Granada (Rector’s Office). This is a heritage building where have been done studies that allow the as-sessment of possible improvements in future interventions that guarantee improvement in en-ergy and regulatory compliance are decisive. This article presents for the first time, through energy simulation, the behavior of two rooms in two temporal periods, thermally extreme (summer and winter) and with opposite orientations. This has allowed the potential benefits to be considered in real climate conditions. The results demonstrate and quantify that considering the location, orientation, arrangement of openings, and inclusion of transition zones between the exterior and the interior, an improvement in thermal comfort is obtained. The southwesterly orientation is favorable in the winter period and the northeasterly orientation in the summer period. It is also confirmed that the arrangement of thick masonry walls responds adequately in climates with high thermal amplitudes, favoring the mitigation of extreme conditions. It is concluded by stating that the orientation and the construction components are the main responsible factors for the thermal capacity in this type of building. In this context, the use of non-destructive study methods offers valuable scientific support through the results obtained.

1. Introduction

The built heritage, as one of the essential components of cultural heritage, requires actions that ensure its preservation and enable the protection of the environment through sustainable interventions. This approach commits all countries, governments, and society in general to aim to achieve the proposed goals. Currently, these “needs” are framed within the so-called Sustainable Development Goals (SDGs) [1]. Their implementation not only involves generating economic growth but also assisting in the sustainability of the environment in all planned actions across various domains. Specifically, the protection of Cultural Heritage is addressed in the fourth target of SDG 11, where the aim is to double efforts to protect and safeguard the world’s cultural and natural heritage, serving as a means to “make cities and human settlements inclusive, safe, resilient, and sustainable”. In addition, the proposal and development of the conservation of cultural heritage and its enhancement contribute to achieving other SDGs, thereby attaining additional goals related to the safety and sustainability of cities, the slowing down of environmental degradation, and even gender equality, all of which are intertwined with the promotion of peaceful and inclusive societies [2].
The implementation of the SDGs, in the context of the present study, creates a circular relationship between economic, social, and environmental aspects, contributing to the protection and preservation of cultural heritage [3,4]. In this way, the European Union sets forth a strategic proposal for the achievement of architectural heritage building sustainability throughout the 21st century [5].
According to data from the IEA (2022) [6], in 2021, buildings were responsible for 30% of global energy consumption and up to 27% of total energy sector emissions. Furthermore, constructions generated 8% of direct emissions and 19% of indirect emissions resulting from the production of electricity and heat required during their use, not including emissions from the production of construction materials.
According to the latest available data in 2021, direct and indirect emissions from buildings increased by 2% compared to 2019 and 5% compared to 2020. Given this situation, achieving the Net Zero by 2050 United Nations Scenario [7] (https://www.un.org/en, accessed on 11 July 2023) requires reducing building emissions by more than half by 2030.
Regarding the built environment, reducing energy consumption for heating/cooling spaces is proposed as one of the primary actions to be implemented [8,9,10].
Therefore, striving to achieve all these goals requires interventions in old buildings aimed at improving their energy efficiency and ensuring their proper preservation. The possibility of guaranteeing a new use for these buildings allows them to endure over time, making them useful and promoting environmental sustainability. In this regard, numerous research teams and scientific committees have developed guidelines and standards for the intervention in cultural heritage, including proposals to enhance energy efficiency [11,12,13,14,15,16]. The goal of their application is to ensure that building designs contribute to mitigating the effects of climate change by considering long-term future needs [17].
Currently, many studies focus on the energy efficiency of buildings [18,19,20,21,22], acknowledging the significant responsibility for greenhouse gas emissions and energy consumption [23]. Energy simulation is mostly used as a tool to verify thermal values obtained from simplified models [24,25]. Its application confirms that the energy performance of a building is strongly influenced by its envelope and physical characteristics, undoubtedly linked to the climatic conditions of the surroundings. All of this necessitates the development of estimation methodologies applied to diverse climatic situations [26], considering the impact of construction typologies and the material composition of building units [27].
Thus, building envelopes must offer thermal resistance against extreme outdoor temperatures [28], recognizing that the energy demand of buildings increases [29]. Proposed approaches for improvement typically focus on reducing the thermal transmittance of the building envelope and working on construction solutions to prevent heat loss from the interior, primarily through its façades [30,31,32].
Some research dedicated to studying energy efficiency in historic buildings has focused on understanding how to reduce energy consumption without compromising comfort [33,34], determining the best HVAC system [35,36], or conducting simulations to identify the most optimal energy solution [37]. These studies have also carried out comparative studies of thermal comfort by quantifying and evaluating thermal sensations inside these buildings [38]. In all cases, these are typically large-scale buildings that provide insights into the unique challenges posed by such properties.
During rehabilitation interventions to address many of these cases, the most common proposal involves adding an external insulation layer to the walls. Unfortunately, this solution is severely limited when applied to architectural heritage buildings with valuable and protected façades [39,40,41], where preserving their original state is mandatory. In such cases, the alternative often involves adding insulation material to the interior face of the walls [42,43]. The peculiarity of these interventions creates a dilemma when addressing the conservation of cultural heritage, as it requires balancing the need to meet current regulations for energy consumption and CO2 emissions with the imperative of preserving heritage values. Recent studies highlight the importance of preserving heritage values [44,45,46,47] in contrast to those that focus on environmental sustainability, primarily energy efficiency measures [48].
Ideally, both challenges should be met. However, to address the second challenge and reduce energy consumption, it is necessary to understand the thermal performance of the building envelope, particularly the façades, as they represent the largest surface area.
Furthermore, it is important to note that the energy efficiency of heritage buildings does not follow a universal model [49,50]. Instead, it has evolved constantly in the pursuit of comfort for different climates and locations [51]. In the past, optimization was achieved through passive strategies due to limited resources. However, modernization in the construction sector has led to a loss of knowledge regarding bioclimatic design [52]. Nevertheless, many of these buildings have a layout compatible with new and current uses, primarily for public purposes, which is where their potential for reuse lies, as it is the main goal for the majority of heritage buildings. In these cases, the objective is not necessarily achieving zero emissions but rather improving energy performance [53] through studying the energy demand of different spaces in various climatic conditions [54,55,56].
The quantification of design and potential improvements in heritage architecture has been conducted through evaluation studies using energy simulations following the modeling procedure with software like SketchUp and the EnergyPlus simulation program [57,58].
The reality of various research studies in the context of heritage architecture [59,60,61,62,63,64] confirms that the characterization and behavior values obtained “in situ” can be significantly different from those calculated theoretically. The main reasons for these differences are the construction systems, which are not always known, the wall/mortar proportions, material characteristics, or the presence of defects (moisture, cracks, fissures, degradation, etc.), in addition to the variability of environmental conditions over time [65,66]. This highlights the need for specific studies.
Despite previous research, energy simulations of existing buildings or “white box” models [67] in heritage contexts require further investigation due to the uniqueness of each case. Understanding their energy efficiency within the regulatory framework is essential to guide decision-making toward bioclimatic design and achieving better adaptation of built heritage to climate change.
In line with the above, climate conditions and the changes that have occurred in recent decades have become a pressing issue that requires attention, as indicated by various studies such as [68,69]. This challenge needs ongoing investigation both for the habitability and comfort conditions required in buildings and for the energy consumption consequences of new needs.
Based on all the aforementioned points, this research analyzes the temperature gradient of façade walls and the thermal behavior of one of Granada’s most emblematic heritage sites, the Hospital Real, which currently serves as the Rector’s Office of the University of Granada (Spain) and features a stone façade. The study was conducted in two rooms with different orientations and during two extreme climatic seasons (winter and summer).
In this study, the objectives are focused on studying the impact of the building’s geometry on its thermal behavior and quantifying the time of thermal comfort indoors according to applicable regulations. This allows for a thorough assessment of the building’s behavior throughout the year, considering the influence of sunlight and materials. The research involves simulations to quantify its thermal behavior and establish a comparison between both rooms and external climatic conditions during the two time periods with the highest thermal gradients. Building models are compared under free-floating conditions, measuring the percentage of hours of thermal comfort.
The contributions made by this research provide innovative criteria for the study of a specific construction typology and shed light on the thermal bioclimatic design of a 16th-century building [70]. The study will help assess conservation interventions as part of monument-scale strategic planning, enabling evaluation, management, protection, and sustainable development actions applied to cultural heritage. It also provides guidelines for developing strategies to adapt heritage architecture to new uses demanded by modern society, improving its performance during extreme weather events.
More specifically, the results of the simulations will provide insights into the thermal behavior during different periods, offering specific information about how the building responds based on its characteristics. This knowledge will lead to optimizing the performance of these buildings for compatible uses, such as in the case of administrative buildings that require partial occupancy. During such periods, it can be confirmed that thermal comfort conditions are met without the need for additional conditioning measures, considering the associated costs. In other cases, such as residential use, the need for heating support during specific periods can be determined. This information will aid in sizing installations according to responsiveness, avoiding overdimensioning.
Finally, it is important to note that the study of energy efficiency in historical buildings involves simplifying certain characteristics and factors applied in calculations due to the construction complexity of these types of properties. Most were constructed using traditional techniques and materials, along with construction systems that are not common today. Additionally, there are other formal and dimensional aspects related to room height, wall thickness, and window sizing. Research conducted by [71,72] highlights the main limitations of such studies and identifies factors that influence the behavior and results of simulations. Therefore, it is necessary to incorporate these considerations to mitigate uncertainties inherent to these types of constructions.

2. Case Study

The study was conducted in the building known as the Hospital Real of Granada, which currently serves as the headquarters of the University of Granada. Its construction began in the year 1513 and was inaugurated in an unfinished state in 1526 during a visit by Charles V. Although the building began functioning at that time, the works for its conditioning and completion continued until the 18th century. This building has been classified as a Cultural Heritage Site (Bien de Interés Cultural or BIC) since 1931 [73].
Architecturally, the property features a Greek cross floor plan with four symmetrical courtyards at its corners, constructed using stone masonry, and galleries covered with wooden frameworks. This architectural style reflects a clear Italian hospital influence of the era. Various rooms are arranged around the courtyards and in the galleries. In terms of elevation, it comprises two floors, except for the southwest corner, which exhibits a third floor. Figure 1 displays elevations, sections, images of the building, and the locations of the rooms included in the study.
In this research, the thermal evaluation focuses on two representative rooms located on the ground floor of the Hospital Real of Granada. Room A has its external façade oriented toward the northeast, while Room B’s external façade faces the southwest (see Figure 2). Both rooms are directly exposed to outdoor air conditions, with party walls on the other sides. In the case of Room B, one of the party walls opens to an interior courtyard.

2.1. Geometric and Construction Characteristics

Regarding the geometric and construction characteristics, both areas have the same material composition, with differences in their location, orientation, and surface. The data are shown in Table 1.
In relation to the percentage of openings in the building façades (WWR), this is determined by the window area (Sh) and the solid façade area (Sf), as expressed in Equation (1).
WWR = Sh/Sf × 100 [%]
Table 2 displays the calculated WWR value for the two façades corresponding to the two rooms under study, based on the presence or absence of openings.
Based on the WWR ranges determined by [74], and with the data provided in Table 2, it is confirmed that the façades of Room B, as well as the northwest façade of Room A, fall within the range between 11 and 20%. However, the northeast façade of Room A, which has no openings, is within the 0–10% range.
Regarding the obtained data, it is worth noting that the highest value is found in the northwest façade of Room B, which borders an inner courtyard and has a value of 16.92%. In contrast, the lowest value is found in the northwest façade of Room A, with a value of 10.26%.
In the study of the thermal behavior of façades, it is essential to calculate the thermal transmittance (U-factor). This factor is defined as the heat flow passing through a unit of surface area of the element per degree of temperature difference between two environments separated by that element.
It is calculated according to Equation (2),
U = 1/Rt,
where Rt (m2K)/W is the sum of thermal resistances of the interior and exterior air layers as well as all layers of the construction element, as shown in Equation (3),
Rt = Rsi + Rse + ∑Rti,
Rsi and Rse are the surface thermal resistances corresponding to the indoor and outdoor air, respectively, for vertical enclosures and horizontal heat flow, with values of Rsi = 0.13 m2K/W and Rse = 0.04 m2K/W according to CTE [74].
To calculate the thermal resistance of each layer, Equation (4) is used.
Rt = e/λ,
where e (m) is the thickness of the layer, and λ (W/(m·K)) is the thermal conductivity of the material.
The regulations applicable in the geographical area where the building is located [74] establish limit values for thermal transmittance for each construction element to ensure thermal quality inside newly constructed buildings. In the case of this research, the same values were used since it is an existing building that can comply with the current regulations.

2.2. Climatic Conditions

The case study is located in the province of Granada, situated in the southeast of Spain. It is at an elevation of approximately 738 m above sea level. The climate is Mediterranean, classified within the temperate climate category, with dry summers and an average monthly temperature of 32 °C, and mild winters with irregular precipitation and an average monthly temperature of 5.3 °C [75,76].
In addition to its climatic conditions, and in order to establish external energy-related calculation demands, the standard [74] provides a classification of climatic zones in Spain based on geographical location and altitude above sea level in a typical year. In the present case study, for the province of Granada and an altitude within the defined range of 701 to 750 m above sea level, the assigned climatic zone is C3. Where the letter C indicates a medium winter climate severity, ranging from 0.5 to 0.93, and the number 3 indicates a high summer climate severity, ranging from 0.83 to 1.38.
Lastly, it is worth noting that to understand the implications of the harshest conditions in the region, the research focuses on the winter and summer periods when the most extreme temperatures occur. The data used are from the year 2022, which is the most recent year for which complete data are available.

3. Materials and Methods

3.1. Simulation: Numerical Study

In this research, an energy simulation of two rooms in the described building was conducted with the objective of evaluating the thermal performance of historical constructions built with thick stone walls in a state of ‘free floating’. This means not using artificial systems for heating, cooling, ventilation, or air conditioning. EnergyPlus, through the OpenStudio application for SketchUp, was used for the simulation.
Recognizing the exclusivity of the building and its construction characteristics, in the current study, to obtain results closer to reality and reduce uncertainties resulting from the simplification of geometry, the conditions considered are outlined, with the guidelines established by [71,72].
First, geometric data were input into SketchUp 2019, defining the building envelopes, openings, and boundary conditions, distinguishing whether they are interior construction elements, interior spaces, or elements in contact with the ground.
Regarding the modeling of thermal bridges, the influence of possible cracks in the masonry was considered negligible due to the undeniable consolidation of stone walls built in the 16th century. However, linear thermal bridges located at the edges of openings and floor edges were taken into account by modeling subsurfaces in the envelope. The linear thermal transmittance (Ψ) of the thermal bridges was recorded in these subsurfaces, whose surface thermal transmittance (UP) is equivalent to the linear thermal transmittance of the thermal bridges. This transformation was carried out using the following Equation:
UP = Ψ/h,
where:
UP is the equivalent surface thermal transmittance (W/m2K) of the thermal bridge.
Ψ is the linear thermal transmittance (W/mK) of the thermal bridge. Tabulated values in CTE DB HE3 [74].
h is the length equivalent to the dimension of the existing thermal bridge (m).
Resolving the situation of thermal bridges through the simplification that OpenStudio allows, in line with what is established by [77,78], is an acceptable approximation according to [79,80].
Secondly, thermal characteristics were defined in OpenStudio 1.1.0, specifying thermal zones and the simulation type as ‘free floating’. Additionally, to establish the conditions of use for the two spaces, it was confirmed that during the study period, the spaces were not occupied, preventing occupants from manipulating doors and windows.
Finally, EnergyPlus 8.6.0 was configured with all the previously input data to implement the climate data for Granada, Spain. For this study, the climatic data collected by the Spanish State Meteorological Agency (AEMET) [81] corresponding to the summer period of 2022 and the winter period of 2022–2023 were taken, using the compatible format required by the EnergyPlus program.
Table 3 displays the thermal and physical properties of the materials that make up the building envelope. The numerical data of the thermal properties of the opaque materials in the envelope were obtained from [82,83]. Glass data are available in the EnergyPlus database.
Regarding the transparent materials of the envelope, it was mentioned that the façades of the studied spaces have a relatively small maximum window-to-wall ratio (WWR) of 16%. The thermal and physical characteristics of the transparent material considered in the simulation are detailed in Table 4.
It is important to note that each room is studied with a unique behavior as they are composed of a single thermal zone.
Figure 3a,b show that the values increase due to the typical urban heat island effect in urban cores. The AEMET [81] values of the Climatic File used are taken from the Cartuja Meteorological Station (Granada), located at an altitude of 775 m above sea level and 1.4 km away from the building under study.
Figure 4 illustrates the process followed.

3.2. Model Calibration and Validation

In this research, the calibration of the model was developed in two monitoring periods, the first from 21 June 2022 to 22 September 2022 and the second from 22 December 2022 to 21 March 2023. For this purpose, the Elitech RC-5+ temperature logger was used. Following the criteria of [84], for the calibration and validation of the model, the interior air temperature of the rooms was used, because the study is focused on the temperature oscillation caused by the operation of the building envelope.
To calibrate the model, the uncertainty indices included in the ASHRAE Guideline 14-2014 guidelines were followed [85]. These are the normalized mean bias error (NMBE), the coefficient of variation of the root mean square error (CVRMSE), and the coefficient of determination (R2), defined in Equations (6), (7), and (8), respectively. For validation, data monitored every hour during the entire summer period and winter period studied were used.
N M B E = 1 m × i = 1 n m i s i n × 100
C V R M S E = 1 m × i = 1 n m i s i 2 n × 100
R 2 = 1 × i = 1 n m i s i 2 i = 1 n m i 2
where:
m = monitored temperature
s = simulated temperature
n = number of temperature data to work with
Table 5 shows that the final results meet the limits established by ASHRAE.

3.3. Adaptive Thermal Comfort According to ASHRAE 55 [84]

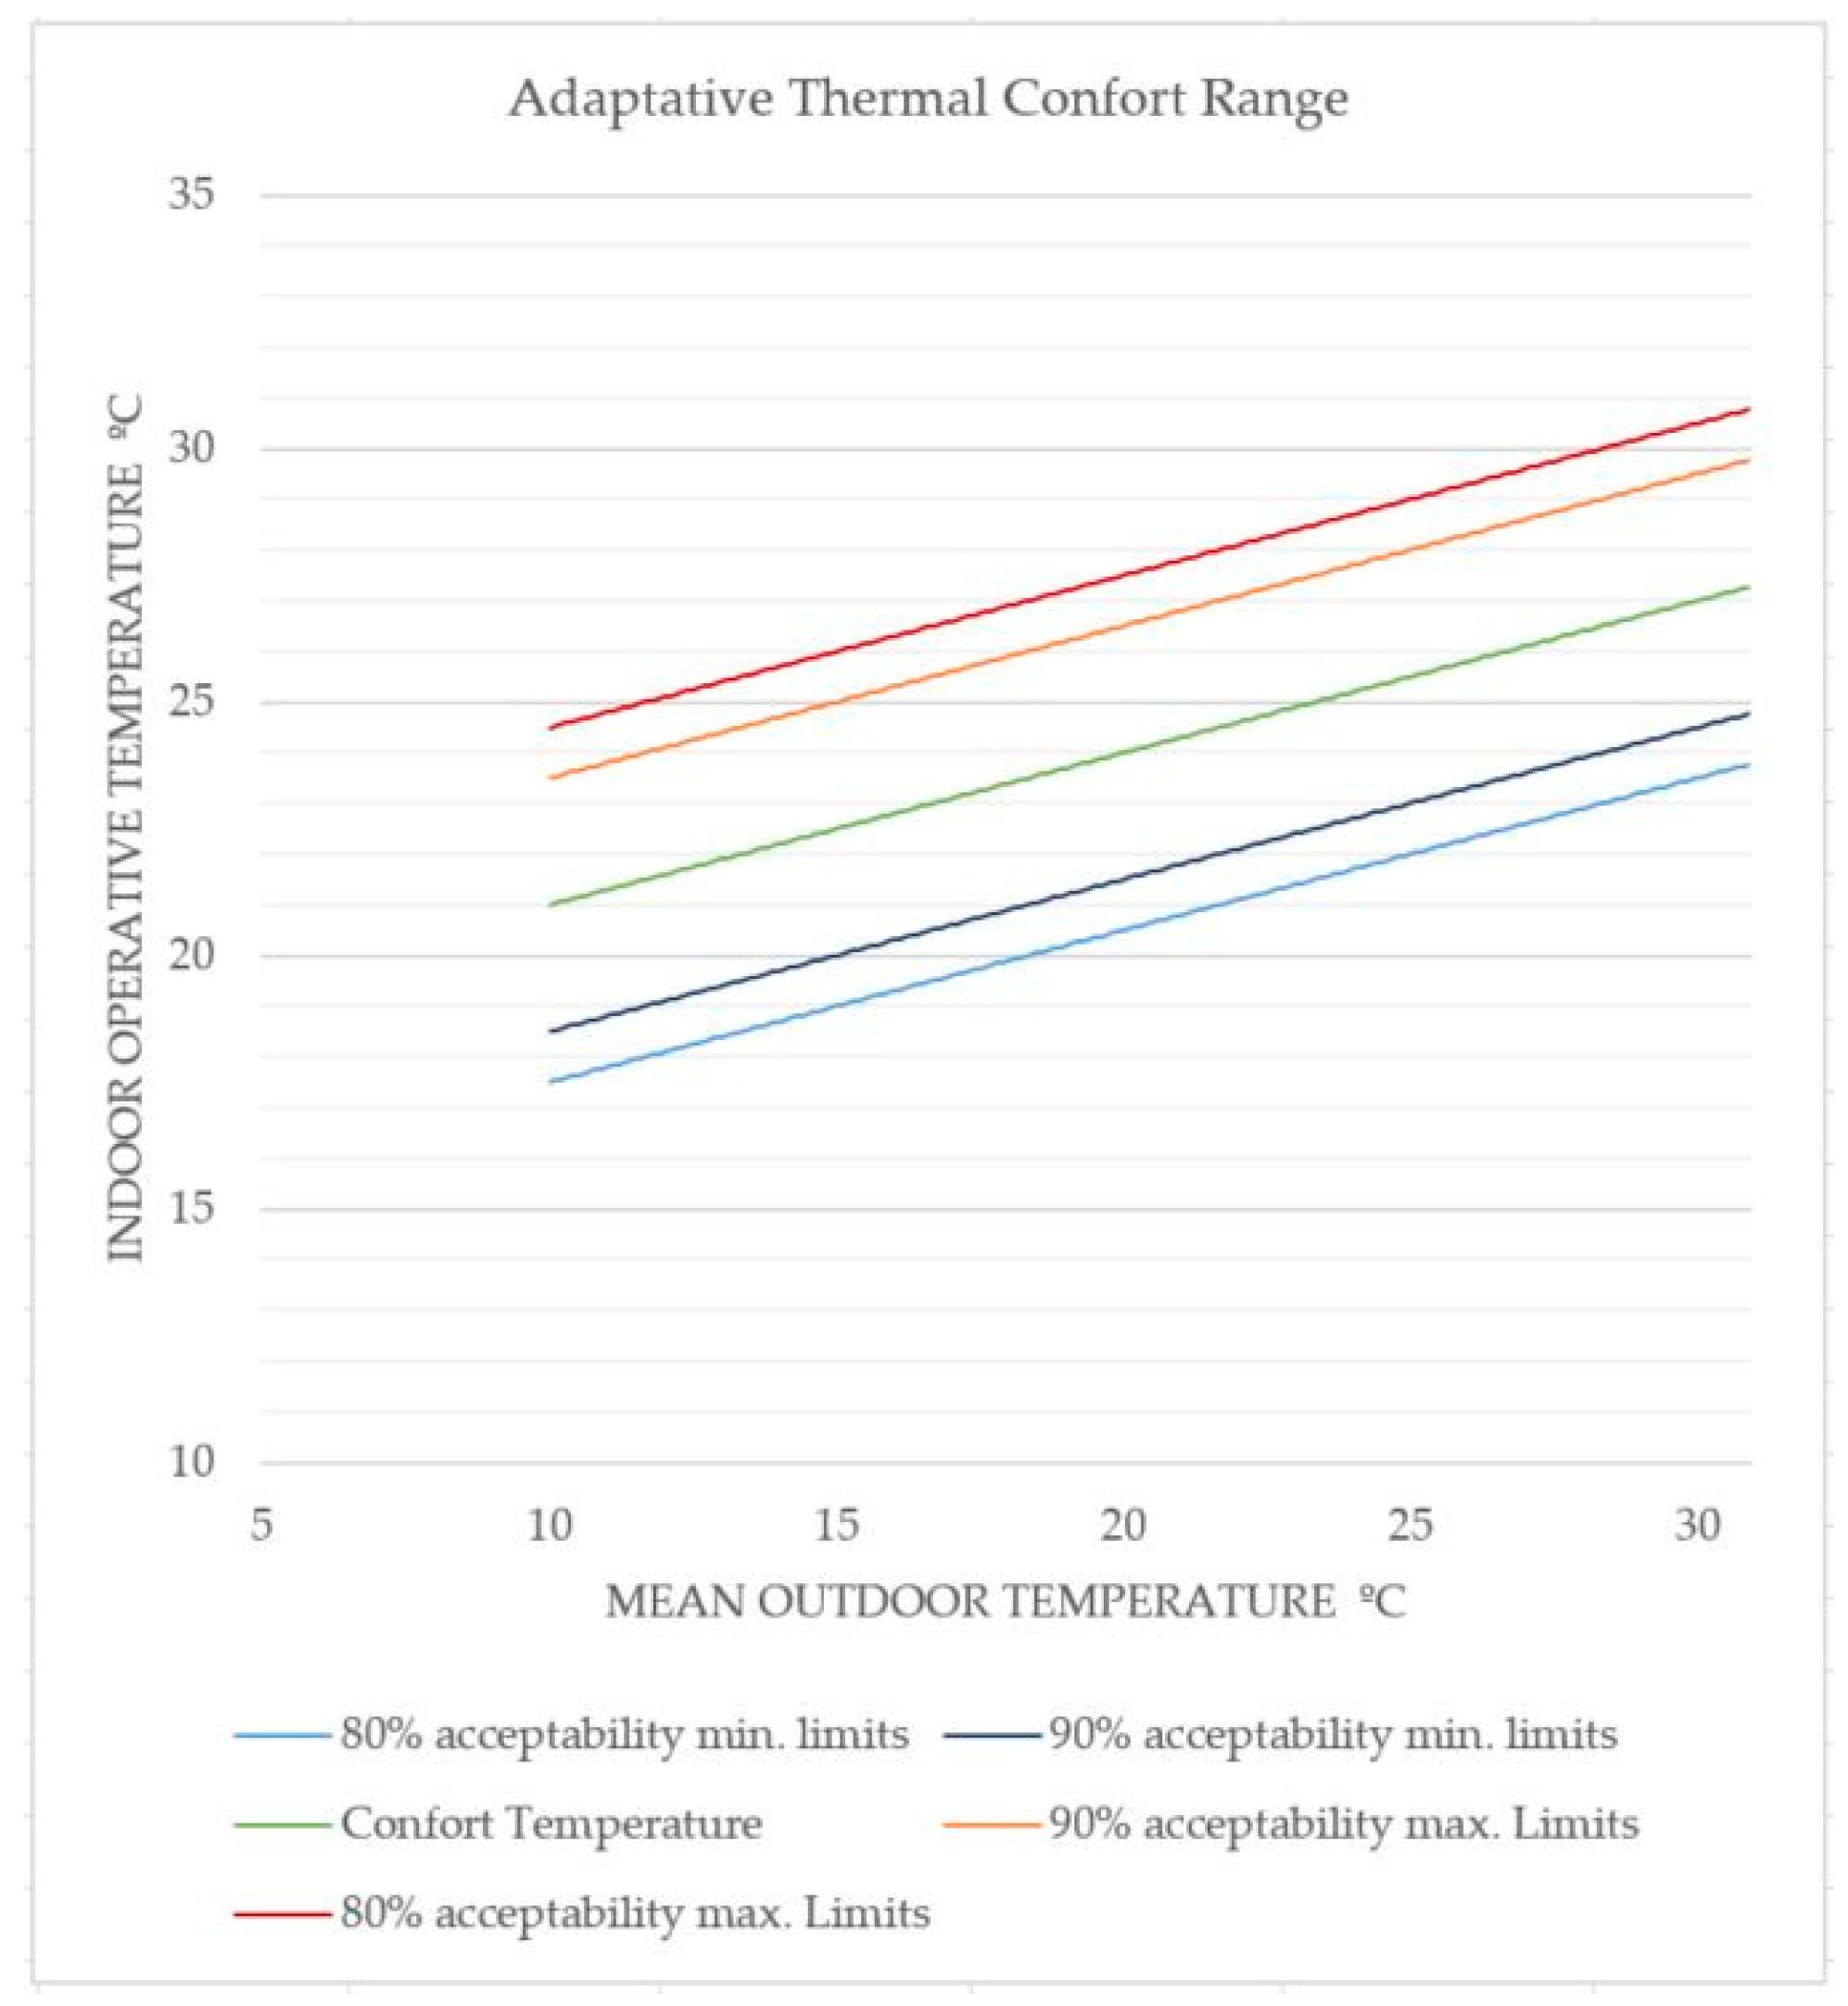
Thermal comfort is determined based on the adaptive thermal comfort values established by standard [86]. Subsequently, two ranges of comfort operative temperatures were proposed based on the values of outdoor mean temperatures. The first of these is an 80% acceptability range, and the second is a 90% acceptability range. The values for the ideal comfort temperature are obtained using the following equation:
T0 = (TMT + Tmed)/2,
where TMT is the temperature of the analyzed room, and Tmed is the mean indoor temperature. In order to understand and analyze the most unfavorable situation during the study period, the maximum daily interior values were considered as room temperatures (TMT). Once T0 was known, the values for 80% and 90% acceptability were calculated by excess and deficiency to determine the corresponding values for those percentages of acceptability. Figure 5 displays the adaptability percentage ranges for the mean outdoor temperature in Granada during the period considered in this study.

4. Results

4.1. Impact of Orientation on Room Performance

The impact of orientation on the thermal performance of the studied rooms was determined through the comparative analysis of the thermal transmittance (U-factor) values calculated for the rooms (walls and openings) and the limit values established by the applicable regulations [74] for the climatic zone where the sample and the construction elements of rooms A and B are located.
First, Table 6 presents the results of thermal transmittance obtained for the envelope of the two rooms, as well as the limit values according to the regulations.
Compared to the limits of regulations [74], the values exceed the limits in both cases. As observed, the highest results correspond to the floors of the rooms, with their thermal transmittance being up to +3.5 (300%) times higher than allowed by the standard. In contrast, the façade walls, although they exceed the permitted value, do so by 35%.
These results confirm that surfaces in contact with the ground have lower insulating capacity and are therefore more vulnerable. However, this does not pose an excessive problem since they are in contact with surfaces that maintain stable temperatures. In the case of the walls that make up the envelope, the goodness of their results is related to their thickness, confirming their adequate performance without the need for insulation material.
Secondly, Table 7 displays the thermal transmittance of the existing openings in the various façades, as well as the limit values established in [74] CTE DB HE (2022) for different orientations. As mentioned earlier and based on the WWR value, all exterior façades of the rooms with openings fall within the range of 11–20%, corresponding to a U value of 3.3 W/m2K.
In this case, the results confirm that the values for both rooms do not exceed the limit values established by the regulations in any case.
Table 8 displays the thermal transmittance values for the two façades of each of the two rooms, determined from the data obtained in Table 6 and Table 7.
In the comparison of the four façades, the lowest U-factor is found on the northeast façade of Room A because it has no openings. The highest U-factor is identified on the southwest façade of Room B, which opens towards an interior courtyard. The results confirm the direct relationship that the U-factor maintains with the orientation of the façades and the arrangement of transition elements, as seen in this case with the courtyard.

4.2. Analysis of the Interior Temperature of the Rooms vs. Exterior Temperature

In this section, the results of the thermal simulation carried out inside the rooms for the two study periods, summer and winter, are presented and compared with the temperatures outside the building.

4.2.1. Analysis of Maximum Room Temperature—Summer Period

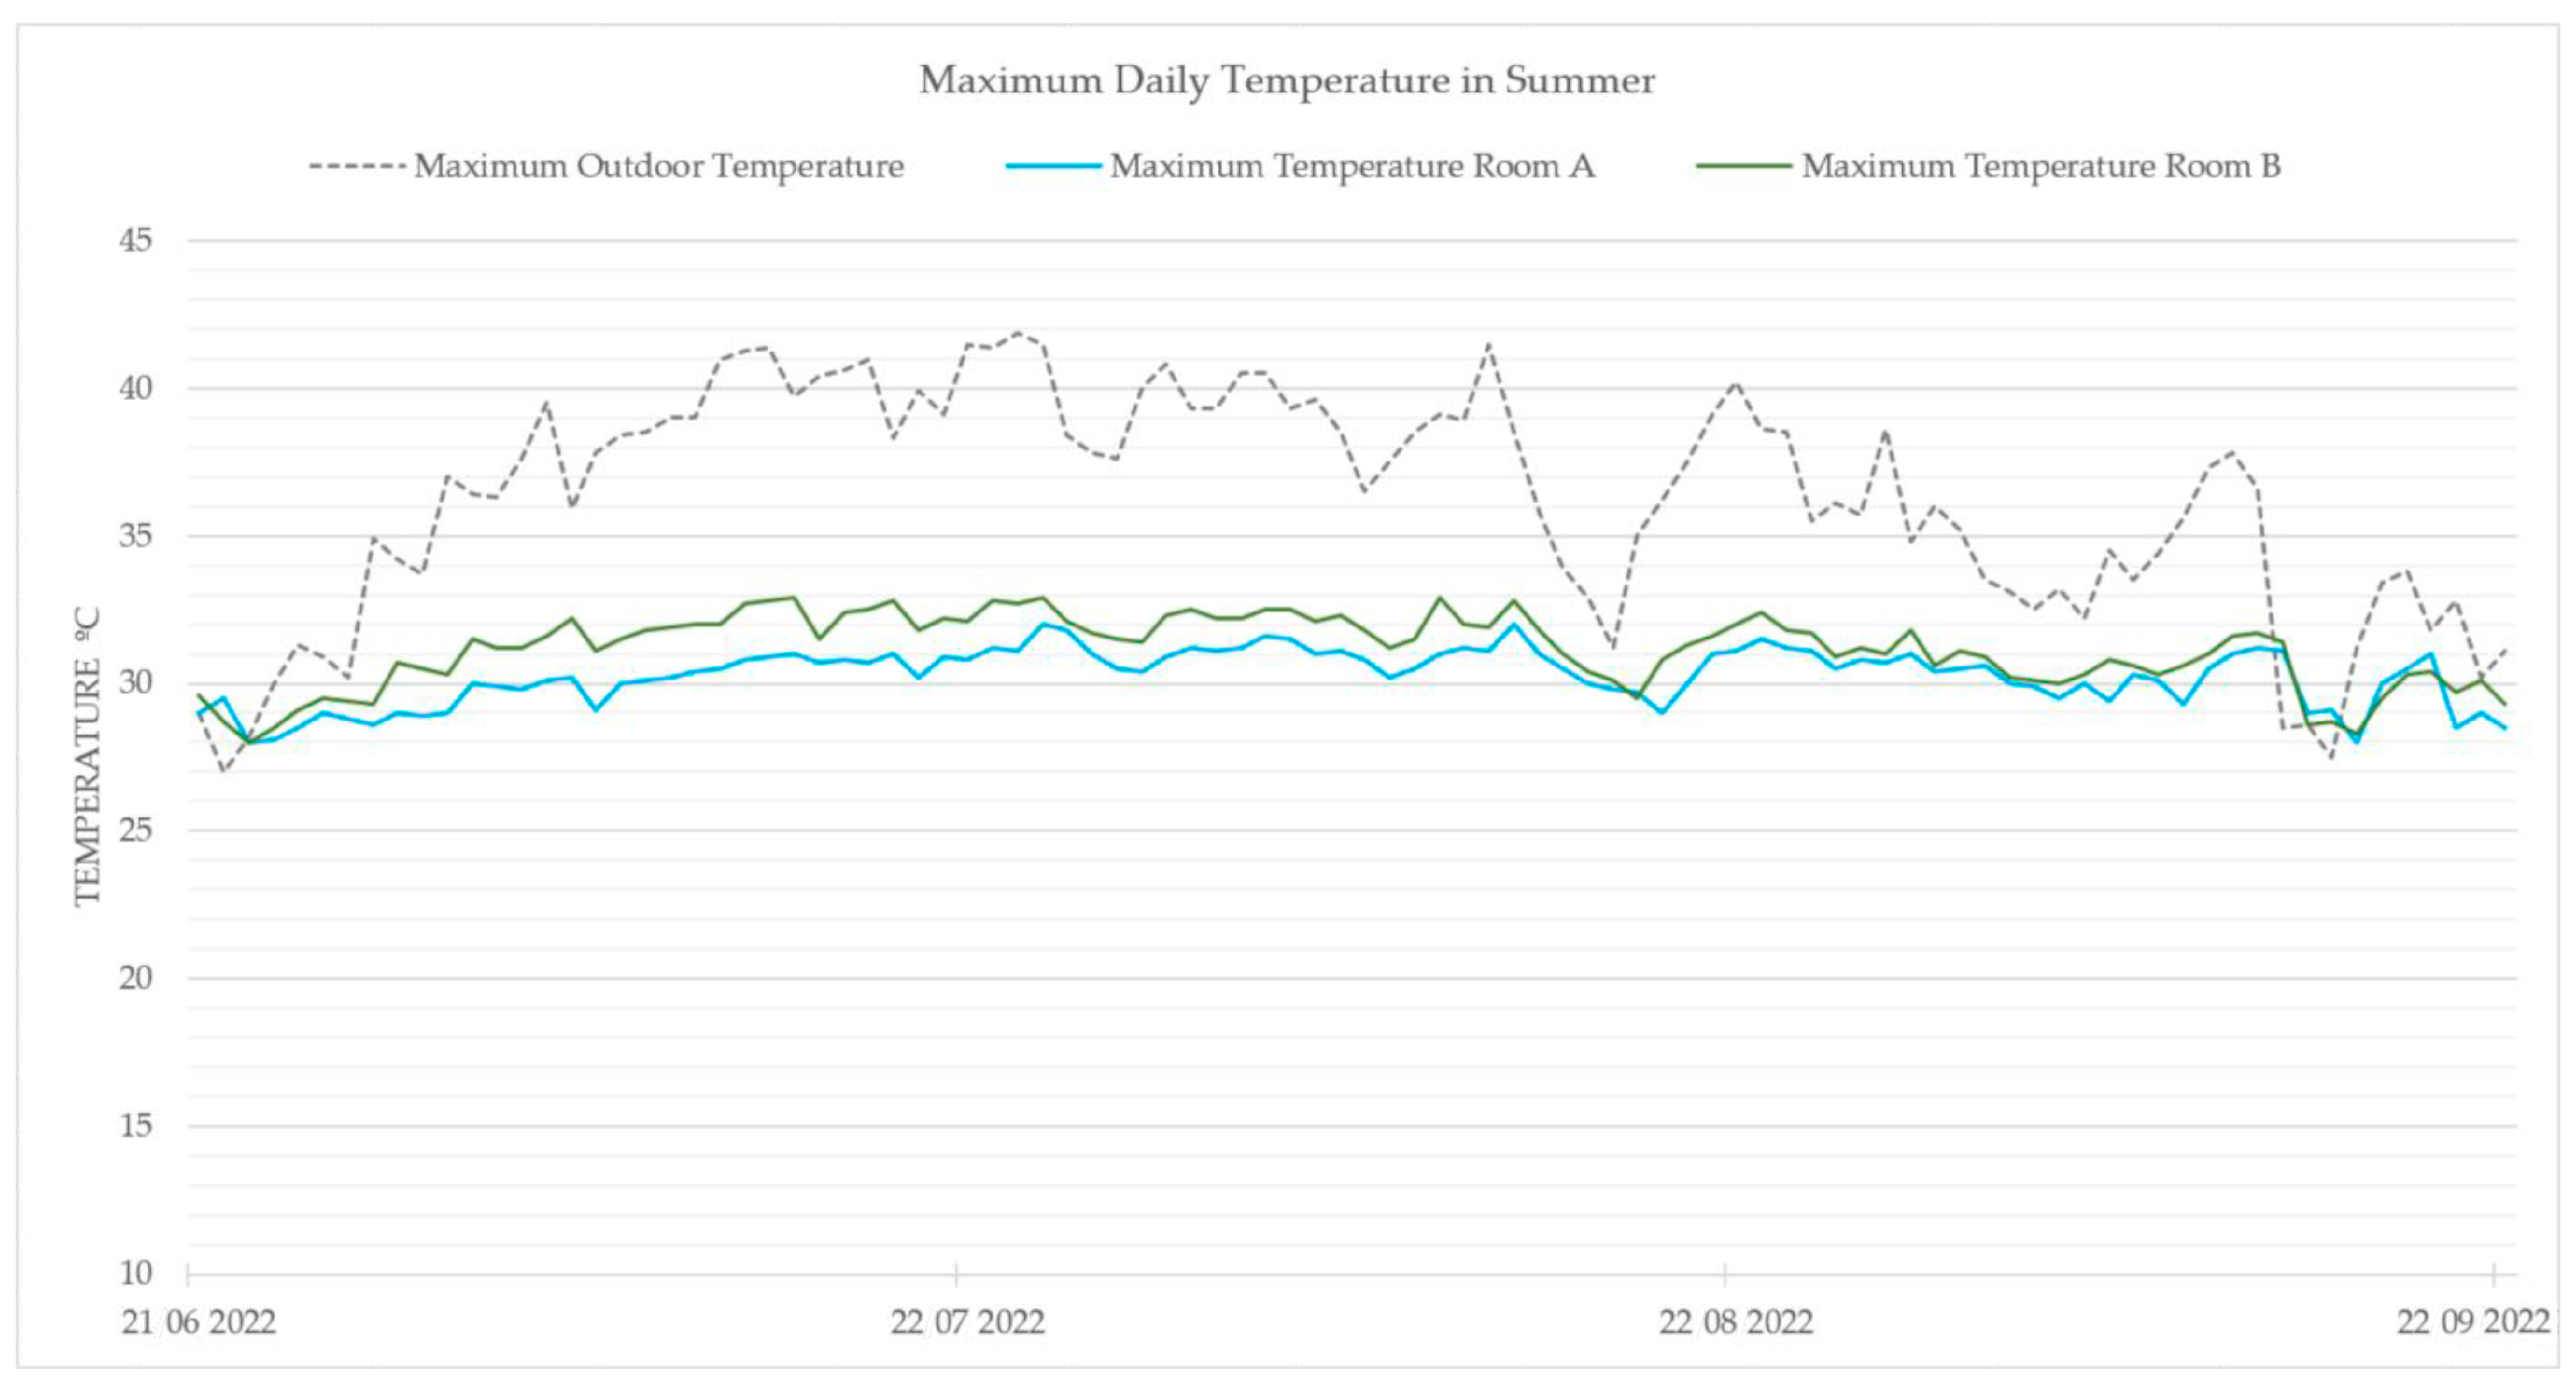
Figure 6 displays the evolution of the daily maximum temperatures inside Rooms A and B, as well as the daily maximum temperatures outside. The period corresponds to the summer season (June 2021–September 2022).
In terms of daily maximum temperatures, the results indicate that in the summer, the maximum outdoor temperature reaches 41.9 °C with an average maximum temperature of 36.1 °C (±3.80). For the rooms, Room A has a maximum indoor temperature of 32 °C and an average temperature of 30.3 °C (±0.94). Room B, on the other hand, reaches a maximum daily indoor temperature of 33 °C and an average indoor temperature of 31.4 °C (±1.21).
The simulation results confirm that for the summer period, both rooms exhibit a significant improvement in thermal performance in absolute values, reducing the temperature by up to 9.9 °C for Room A and 8.9 °C for Room B compared to the outside temperature. The difference in behavior between the two rooms reaches up to 2 °C in some cases, which could be attributed to the different orientations of the rooms, with Room A appearing to have a more favorable orientation.

4.2.2. Analysis of Minimum Room Temperature—Winter Period

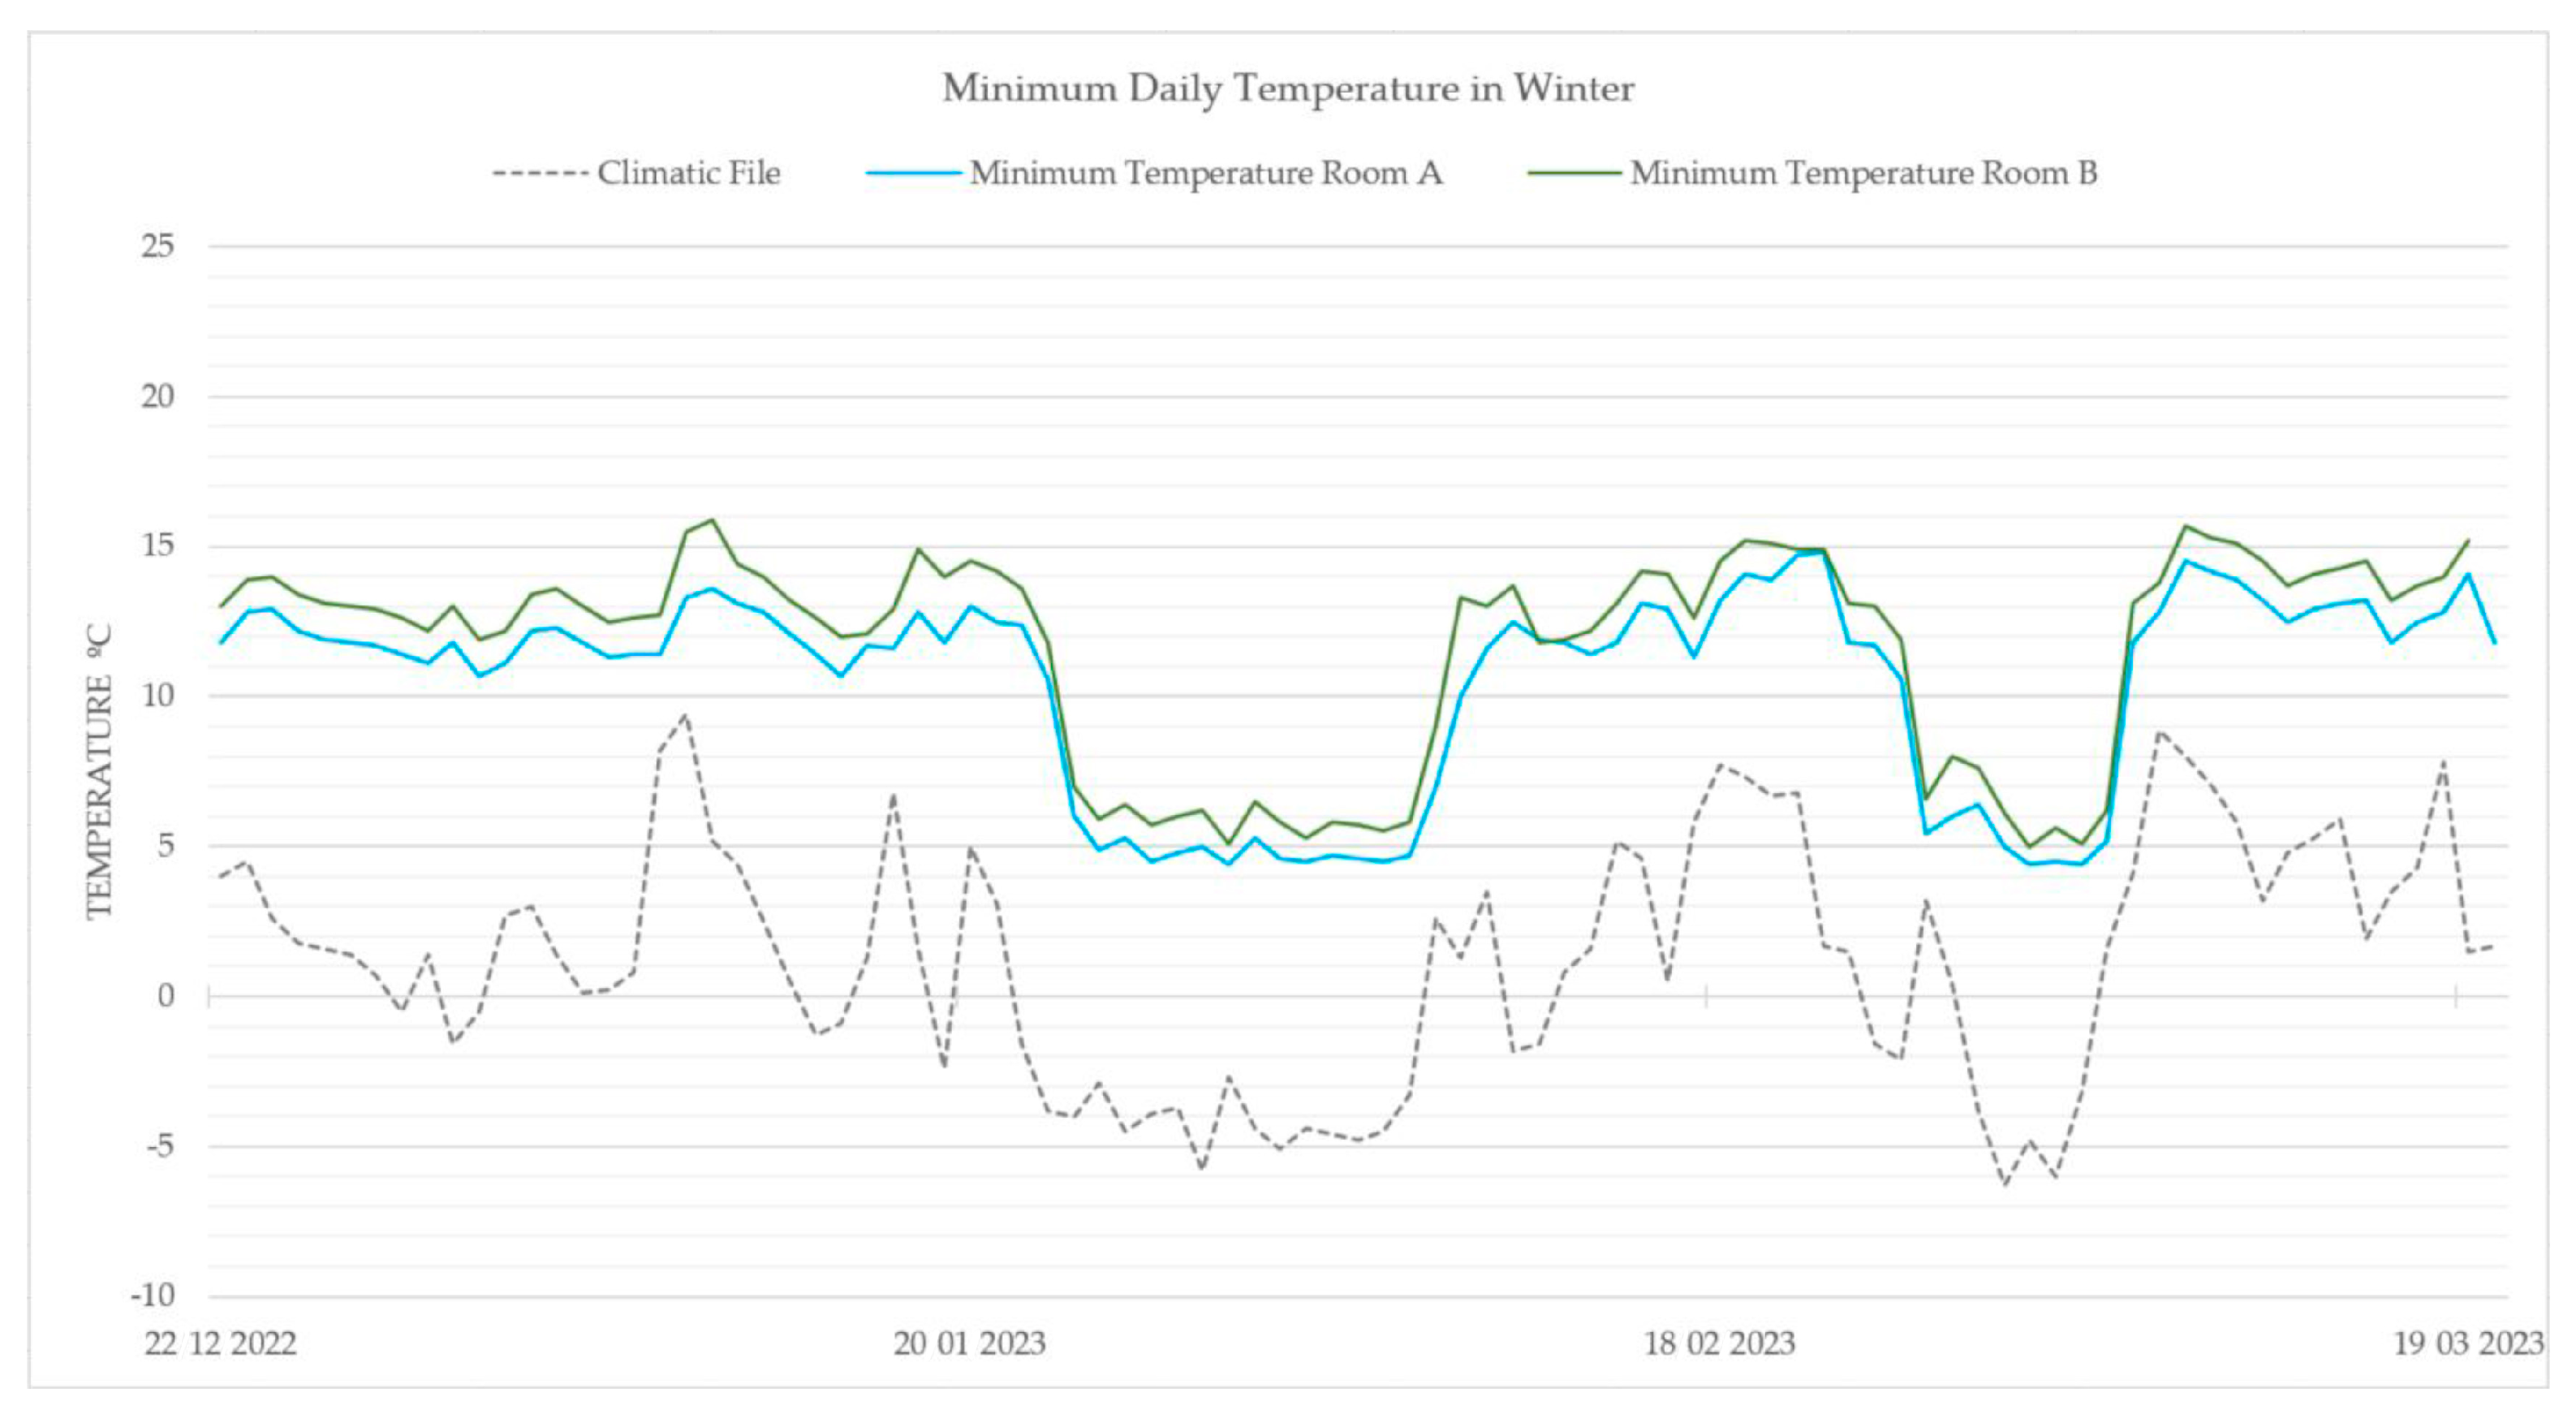
Figure 7 shows the daily minimum interior temperatures in Rooms A and B, as well as the daily minimum temperatures outside. In this case, the daily minimum temperature values during the winter period encompass the period between December 2022 and March 2019.
In the winter, the daily minimum outdoor temperature is −6.3 °C, with an average daily minimum temperature of 1.2 °C (±4.02). For the indoor temperature of the rooms, it is observed that Room A reaches a daily minimum interior temperature of 9.4 °C and an average temperature of 10.4 °C (±3.35). Room B experiences a daily minimum interior temperature of 10 °C, with an average temperature of 11.5 °C (±3.43). For this period, the simulation results confirm that both rooms exhibit a significant improvement in thermal performance, with a maximum difference of up to 12.4 °C for Room B and 11.3 °C for Room A compared to the outside temperature.

4.3. Adaptive Thermal Comfort in Prototype Models According to ASHRAE 55 [86]

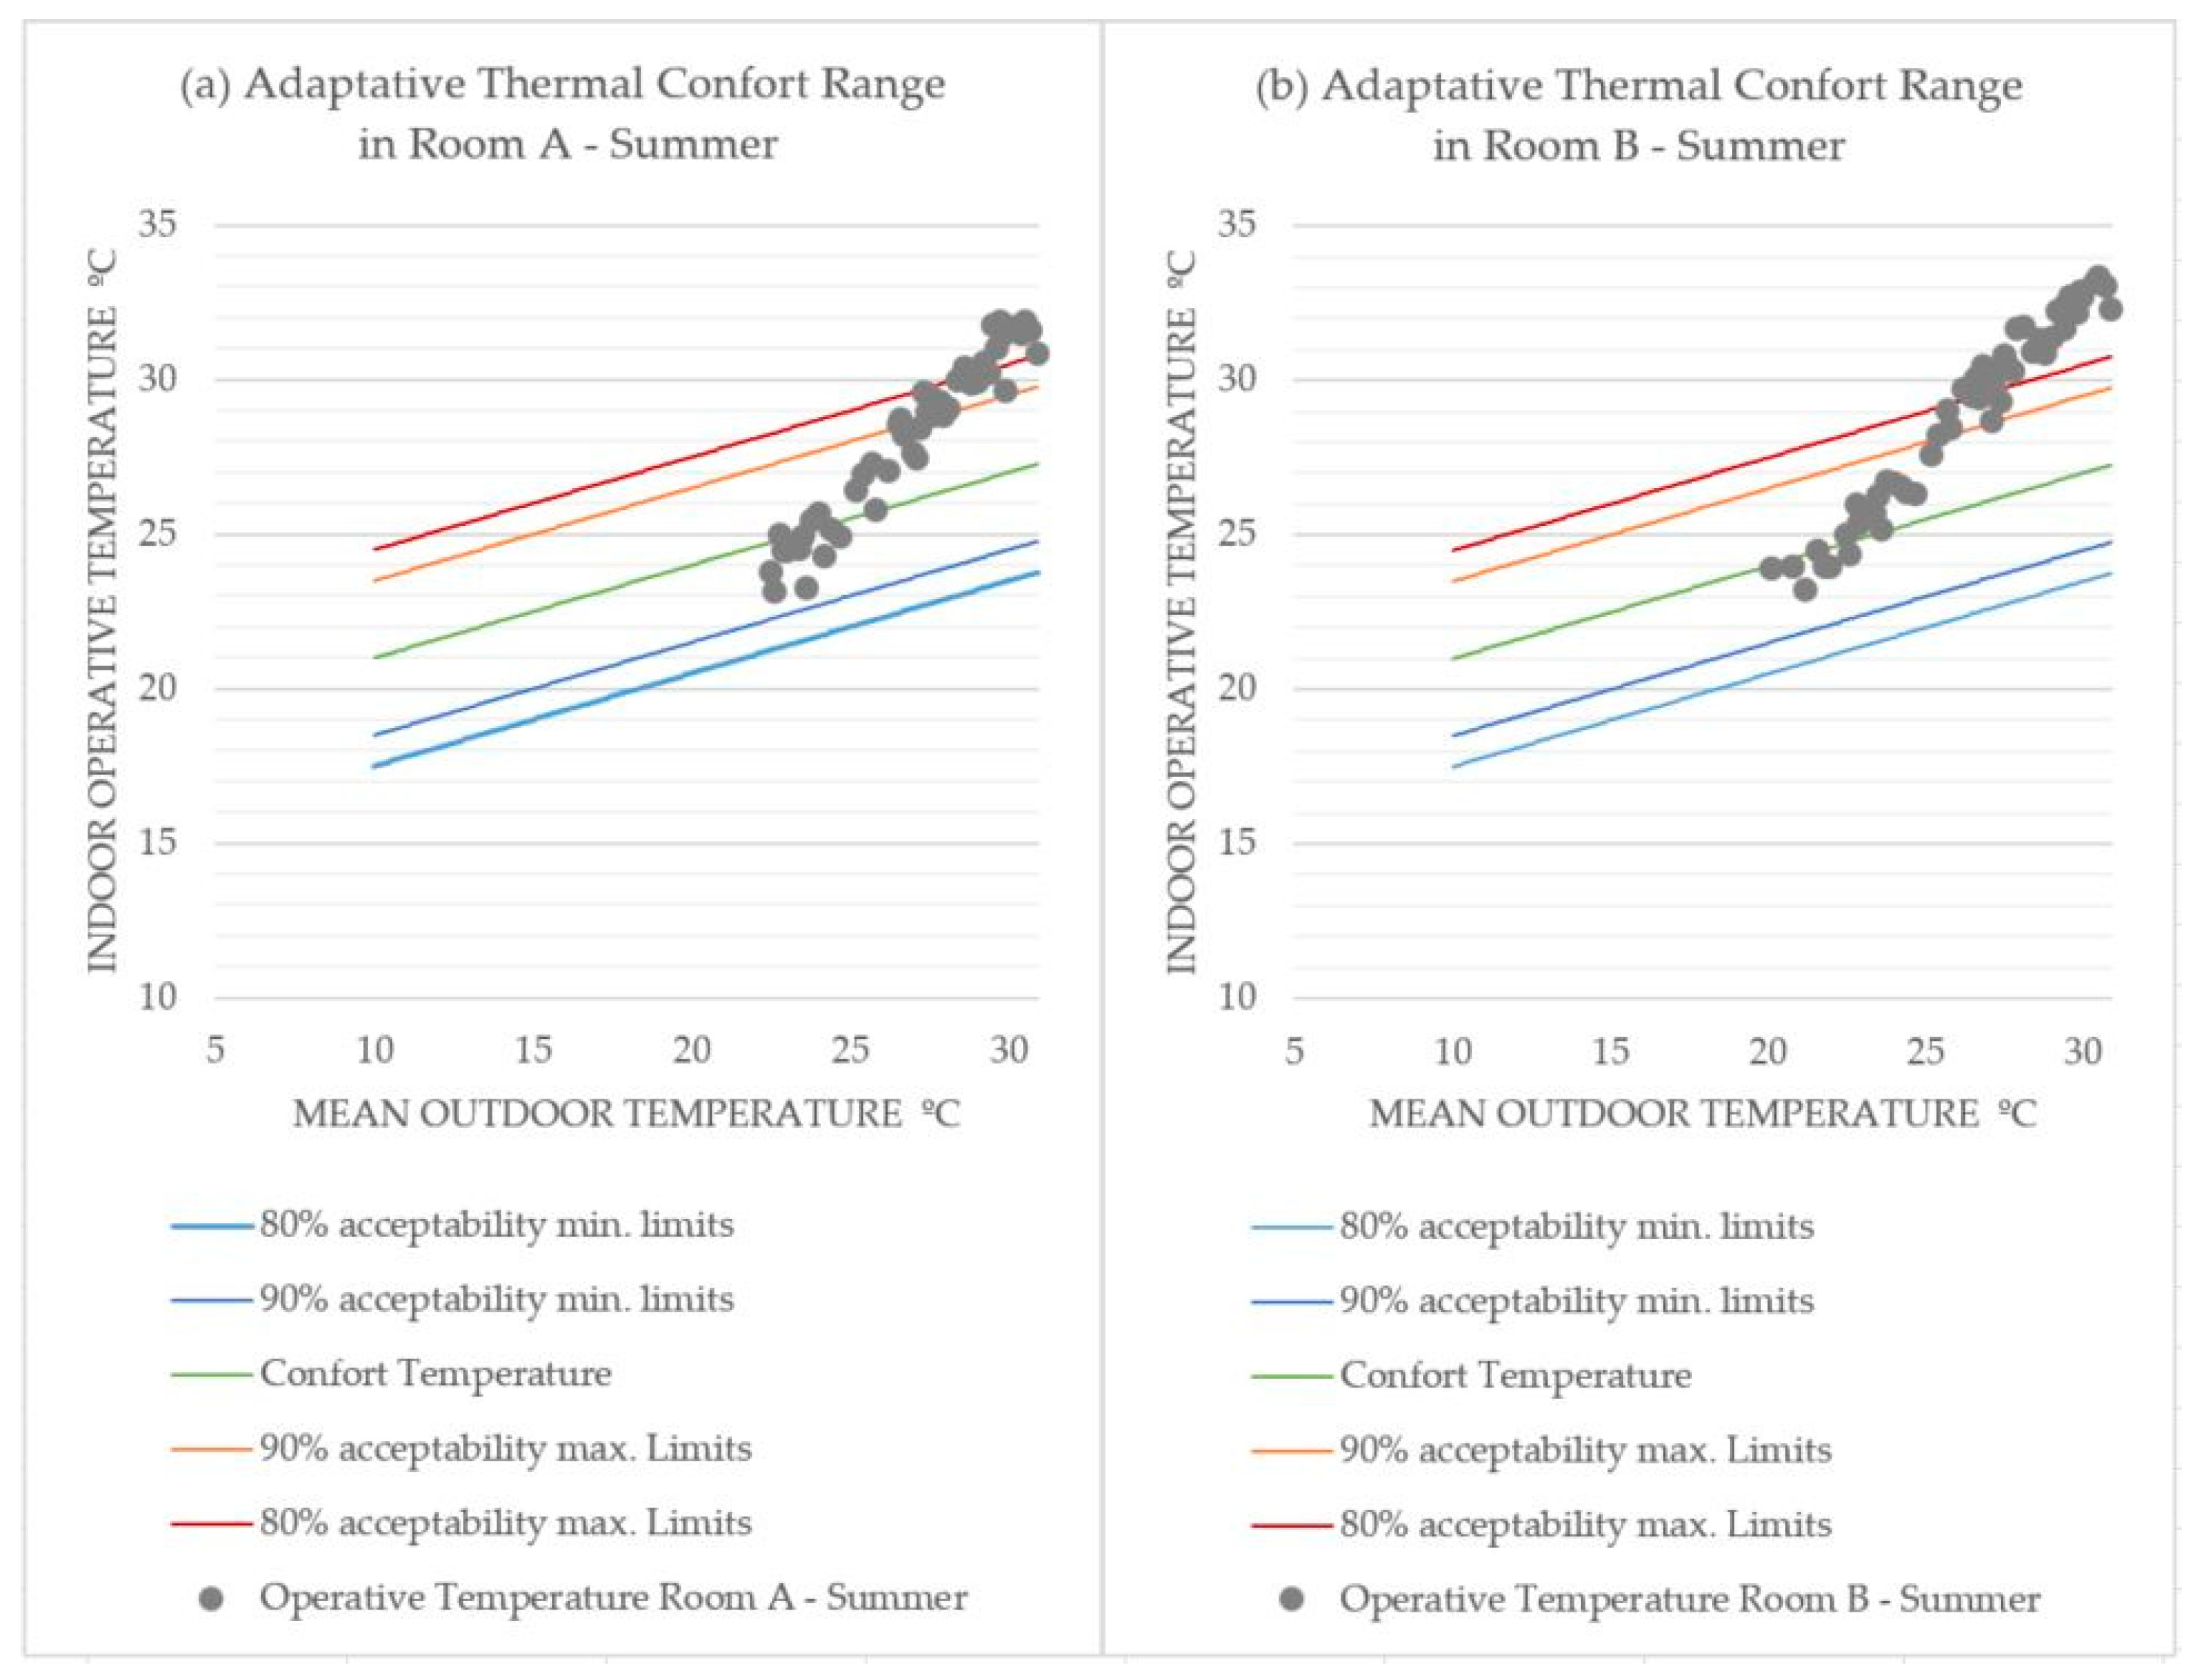
Figure 7 and Figure 8 display the ranges of adaptive thermal comfort established based on the indoor operative temperatures during the study periods in Rooms A and B, along with the outdoor mean temperature.

4.3.1. Summer Period

Figure 8 indicates that in Room A, 20% of the days during the summer period fall outside the comfort range, 25% are within the limits of 80% acceptability, 45% are within the limits of 90% acceptability, and 10% coincide with the comfort temperature. For Room B, Figure 8 shows that 35% of the days during the summer period fall outside the comfort range, 15% are within the limits of 80% acceptability, 40% are within the limits of 90% acceptability, and 10% of the days coincide with the comfort temperature.

4.3.2. Winter Period

For the winter period, the results of adaptive thermal comfort are shown in Figure 9. For Room A (left in Figure 9), it is confirmed that 45% of the days during the winter period fall outside the comfort range, 2% are within the limits of 80% acceptability, 50% are within the limits of 90% acceptability, and 3% coincide with the comfort temperature. In Figure 9 (right), it is observed that in Room B, 40% of the days during the winter period fall outside the comfort range, 5% are within the limits of 80% acceptability, 45% are within the limits of 90% acceptability, and 10% of the days coincide with the comfort temperature.

5. Discussions

5.1. Critical Issues and Solutions

With regard to the data and features used in the conducted simulation, the reliability of the results is confirmed. On the one hand, the minimal difference between the values from the used climatic file and those obtained ‘in situ’ through the monitoring conducted during the study period and subsequently subjected to an exhaustive calibration and validation process through uncertainty indices to assess the model accuracy confirms the validity of the data. The observed differences are attributed to the impact caused by the heat island effect inherent in urban environments.
On the other hand, the factors corresponding to the case study have been taken into account, following [71,72], in order to eliminate the uncertainty associated with these types of buildings due to their uniqueness, which affects the obtained results. It should be noted that, for the studied building, characteristics related to thermal bridges, thermophysical and material properties, and opening/façade ratio were applied, while others were not considered due to the constructional and formal simplicity of the property (absence of ornamental elements). Additionally, mild climatic conditions and the good state of conservation and construction system of the envelope were considered, allowing for the exclusion of factors related to moisture content and transfer.
Finally, the use of EnergyPlus software 8.6.0, currently considered the most widely used tool in simulations for historical buildings [71], combined with the modeling of OpenStudio and the inclusion of specific characteristics defined by the various regulations applied to this type of property, are considered key factors for obtaining precise results.

5.2. Influence of Thermal Transmittance and Orientation in the Rooms

The four analyzed façades have similar values in their surface areas and window-to-wall ratio (WWR), except for the northeast façade of Room A, which has no openings. The results confirm that, for an equal range of WWR, higher transmittance values are detected in the southwest and northeast façade of Room B, indicating that Room A has better thermal performance.
As the WWR increases, the thermal transmittance values also increase. In the northeast façade of Room B, which has a high WWR, there is a slight increase in thermal transmittance. For compliance with the thermal transmittance limits set by CTE DB HE (2022) [74], it is observed that the values of both rooms in the exterior enclosures exceed the limits set by CTE. The same is true for the floors of both rooms. As for the transmittance of the rooms (Table 6), given that they have similar characteristics, their values are similar, with differences recognized when WWR is significantly different.
The results of this study align with previous research [87,88], confirming that a north orientation offers good thermal performance when combined with low WWR. Additionally, the best results are obtained with a northwest orientation, in contrast to [89,90], which reported more favorable results for south and east orientations based on their geographical context. This emphasizes the impact of orientation in such studies.

5.3. Room Performance in Extreme Temperatures

The research highlights the relevance of extreme temperatures during the study periods for the location of the two rooms in the studied building. During the summer period, both rooms demonstrate their ability to mitigate heat to some extent when the external temperature is at its maximum. Room A shows better performance in this situation, capable of reducing the temperature by up to 10% more compared to Room B.
Similarly, during the winter period, both rooms demonstrate their ability to prevent heat loss when the external temperature is at its minimum. When analyzing the performance of each room, small differences between them are observed. Room B provides a higher temperature increase, specifically 2.1 °C, compared to Room A, representing a 12% improvement.
The validation results also suggest, in line with [89], that the difference between the data obtained on site and the simulation results for different orientations is relatively small, allowing the behavior model obtained to be extrapolated beyond the simulation phase. However, it is important to note that the results are not entirely free from occasional uncertainty, as they have to account for climatic variability, which, in the case of Granada, tends to lead to rising temperatures in both studied periods.

5.4. Adaptive Thermal Comfort in Standard Models According to ASHRAE 55 [86]

Regarding adaptive thermal comfort, different behaviors are recognized for the studied periods, with differences also observed between the rooms within the same period. It is confirmed that during the summer, the operation of both rooms is in line with ASHRAE (2020) [86], meeting the acceptability limits for most of the period. It is only outside the limit for 10% of the summer period in both spaces, which aligns with [91,92] and contradicts [93,94,95,96]. However, during the winter, up to 45% of the period in Room A and 40% in Room B fall outside the limits established by [86], in line with the results obtained by [91,92,93,95,96]. Nevertheless, it is important to highlight that Room B complies with the comfort temperature for 10% of the study period, while Room A only does so for 3%. The possibilities for improvement during this period are reduced to 3% in the northeast orientation (Room A), while they are higher in the southwest façade (Room B), reaching up to 10% of the study period in comfortable conditions. In this case, the improvement is attributed to the orientation and the impact of the patio in this room, as the rest of the conditions are similar.

6. Conclusions

This research conducts a comparative analysis of the thermal performance, through simulation, of two rooms located in the Hospital Real of Granada. This study addresses the need to analyze the thermal behavior of heritage buildings using energy simulations, allowing us to understand their capabilities and implement energy efficiency measures according to the relevant regulations. This knowledge can help establish bioclimatic design strategies and adapt heritage structures to the current global warming. The results obtained aim to demonstrate the potential benefits of the buildings’ orientation based on their geographic location, taking into account both the materials and construction systems of the rooms under study.
The following conclusions have been drawn:
-
The calibration and validation of the model are necessary to obtain precise, solid, and valid results, for the correct preservation of the heritage.
-
The thermal capacity of the building improves as the window-to-wall ratio (WWR) decreases, which, in turn, leads to improved thermal transmittance (U-Factor) of the building envelope.
-
Concerning materials, the study confirms the impact of construction components on thermal behavior and achieving thermal comfort, with more relevance in summer temperatures. The microclimate created within the spaces plays a significant role in reducing high temperatures and improving minimum temperatures, even in climates with high thermal amplitudes, as is the case in Granada.
-
Regarding thermal comfort, both orientations fall within relevant percentage limits established by regulations. The constructive layout of the rooms and their orientation significantly influence this, offering the best thermal performance during the summer period for the northeast façade (Room A), which yields more favorable results compared to the southwesterly orientation (Room B). This behavior is reversed in the winter period, where the southwesterly orientation and the presence of a courtyard considerably improve the conditions.
The research conducted confirms the ability to enhance the climatic conditions in Granada, demonstrating preparedness to respond to high temperatures during the study periods. The performance of the rooms, with similar complexity and opposite orientations, reveals thermal resilience and the ability to improve climatic conditions. It is important to take specific conditions into account. This information will be useful for interventions aimed at improving the energy efficiency of the building, providing insights for implementing effective solutions tailored to each specific case and situation. The validity of this type of study is confirmed by its applicability to different periods, climates, and construction typologies, highlighting the utility of this evaluation method for bioclimatic design in existing buildings.
Finally, it is important to indicate that, for thermal simulation studies, the acknowledged limitations are mostly associated with the uncertainty arising from the lack of knowledge about the conditions of the building envelope and its behavior. In the current research, the main limitation is determining the potential heterogeneities in the material of the building envelope, considering that it is a stone wall approximately one meter thick. However, its well-preserved state (despite the building’s age), has enabled the consideration of joint consolidation and reliance on the standardization established by [84]. On the other hand, a recognized limitation of the study involves the interior height, specifically the potential temperature stratification that may occur in the rooms.

Author Contributions

Conceptualization, M.P.S.-P. and J.A.D.-S.; methodology, M.P.S.-P., L.M.G.R. and J.A.D.-S.; validation, M.P.S.-P., L.M.G.R. and J.A.D.-S.; formal analysis, M.P.S.-P., L.M.G.R. and J.C.-G.; investigation, M.P.S.-P., L.M.G.R. and J.A.D.-S.; resources, M.P.S.-P., L.M.G.R., J.A.D.-S., J.C.-G. and M.Á.V.-B.; data curation, M.P.S.-P., L.M.G.R. and J.A.D.-S.; writing—original draft preparation, M.P.S.-P., L.M.G.R., J.A.D.-S., J.C.-G., M.Á.V.-B. and A.M.-R.; writing—review and editing M.P.S.-P., L.M.G.R. and J.A.D.-S.; visualization M.P.S.-P., L.M.G.R. and J.A.D.-S.; supervision, M.P.S.-P., L.M.G.R., J.A.D.-S., J.C.-G., M.Á.V.-B. and A.M.-R.; project administration, M.P.S.-P., J.A.D.-S., J.C.-G. and M.Á.V.-B. All authors have read and agreed to the published version of the manuscript.

Funding

This research was funded by the University of Granada and the Vicerrectorado de Investigación y Transferencia, with the project PP2022.PP.27 belonging to the Research and Transfer Plan.

Data Availability Statement

Data are contained within the article.

Acknowledgments

The authors would like to thank the reviewers for their thoughtful comments and efforts toward improving our manuscript. This work was supported by the Research Groups RNM 0179 and HUM 629 of the Junta de Andalucía and the projects REMINE Programme for Research and Innovation Horizon 2020 Marie Skłodowska-Curie Actions, WARMEST Research and Innovation Staff Exchange (RISE) H2020-MSCA-RISE-2017, and RRRMAKER H2020-MSCA-RISE-2020 (Marie Skłodowska-Curie Research and Innovation Staff Exchange and Scientific Unit of Excellence “Ciencia en la Alhambra”, ref. UCE-PP2018-01, University of Granada).

Conflicts of Interest

The authors declare no conflict of interest.

Abbreviations

eThickness (m)T0Operative temperature (°C)
hWidth (m)TMTIndoor temperature of the model type (°C)
HVACHeating, ventilation and air conditioningTmedAverage indoor temperature
RseOutdoor air superficial thermal resistance (mK/W)U-factorSuperficial thermal transmittance (W/m2K)
RsiIndoor air superficial thermal resistance (mK/W)UHIUrban heat island
RtSuperficial thermal resistance (mK/W)UPEquivalent superficial thermal transmittance of the thermal bridge (W/m2K)
R2Coefficient of determinationWWRWindow-to-wall ratio
SDGSustainable Development GoalλThermal conductivity (W/mK)
SfFaçade area (m2)ΨLinear thermal transmittance (W/mK)
ShWindow area (m2)

References

  1. UNESCO—United Nations Educational, Scientific and Cultural Organization. Available online: https://es.unesco.org/sdgs (accessed on 3 December 2022).
  2. Hosagrahar, J. Culture: At the Heart of SDGs. The UNESCO Courier 2017. Available online: https://en.unesco.org/courier/april-june-2017/culture-heart-sdgs (accessed on 3 December 2022).
  3. Ortega Sánchez, K.M. La cultura como categoría del bienestar social y su vinculación con la Agenda 2030 y los Objetivos del Desarrollo Sostenible en tiempos de COVID-19. Cofactor 2021, 10, 50–79. [Google Scholar]
  4. Soler Marchán, S.D. La perspectiva sociocultural para la actuación patrimonial con actores sociales y articulantes en el desarrollo local. Univ. Soc. 2020, 12, 31–40. [Google Scholar]
  5. European Commission. EU Research, Cultural Heritage; European Union: Bruxelles, Belgium, 2013. [Google Scholar]
  6. IEA—International Energy Agency. Available online: https://www.iea.org/reports/world-energy-outlook-2022?language=es (accessed on 3 December 2022).
  7. UN—United Nations. Available online: https://www.un.org/es (accessed on 3 December 2022).
  8. Rosso, F.; Ciancio, V.; Dell’Olmo, J.; Salata, F. Multi-objective optimization of building retrofit in the Mediterranean climate by means of genetic algorithm application. Energy Build. 2020, 216, 109945. [Google Scholar] [CrossRef]
  9. Flores-Larsen, S.; Hongn, M.; Valdez, M.; Gonzalez, S.; Gea-Salim, C. In-Situ Determination of The Wall’s Thermal Properties for Energy Retrofit in a Colonial Heritage Building: The Cabildo of Salta, Argentina. Int. J. Conserv. Sci. 2021, 12, 1191–1208. [Google Scholar]
  10. European Commission. European Parliament, Directive (EU) 2018/844 of The European Parliament and of The Council of 30 May 2018 amending Directive 2010/31/EU on the energy performance of buildings and Directive 2012/27/EU on energy efficiency. Off. J. Eur. Union 2018, 156, 75–91. [Google Scholar]
  11. CSN EN 16883; Conservation of Cultural Heritage—Guidelines for Improving the Energy Performance of Historic Buildings. European Standards: Berlin, Germany, 2017.
  12. Lucchi, E.; Pracchi, V. Efficienza Energetica e Patrimonio Costruito: La sfida del Miglioramento delle Prestazioni Nell’edilizia Storica; Maggioli SpA: Milano, Italy, 2013; pp. 154–196. [Google Scholar]
  13. HeLLo Project—Heritage Energy Living Lab Onsite. Available online: https://hellomscaproject.eu/ (accessed on 15 October 2023).
  14. Lidelöw, S.; Örn, T.; Luciani, A.; Rizzo, A. Energy-efficiency measures for heritage buildings: A literature review. Sustain. Cities Soc. 2019, 45, 231–242. [Google Scholar] [CrossRef]
  15. De Santoli, L. Guidelines on energy efficiency of cultural heritage. Energy Build. 2015, 86, 534–540. [Google Scholar] [CrossRef]
  16. Co2olBricks—Climate Change, Cultural Heritage & Energy-Efficient Monuments. Project in the Framework of the Baltic Sea Region Programme 2007–2013. Available online: http://www.co2olbricks.de/index.php?id=175 (accessed on 15 October 2023).
  17. Xiong, J.; Guo, S.; Wu, Y.; Yan, D.; Xiao, C.; Lu, X. Predicting the response of heating and cooling demands of residential buildings with various thermal performances in China to climate change. Energy 2023, 269, 126789. [Google Scholar] [CrossRef]
  18. Bardhan, R.; Debnath, R.; Gama, J.; Vijay, U. REST framework: A modelling approach towards cooling energy stress mitigation plans for future cities in warming Global South. Sustain. Cities Soc. 2020, 61, 102315. [Google Scholar] [CrossRef]
  19. Cholewa, T.; Siuta-Olcha, A.; Smolarz, A.; Muryjas, P.; Wolszczak, P.; Guz, Ł.; Bocian, M.; Sadowska, G.; Łokczewska, W.; Balaras, C.A. On the forecast control of heating system as an easily applicable measure to increase energy efficiency in existing buildings: Long term field evaluation. Energy Build. 2023, 292, 113174. [Google Scholar] [CrossRef]
  20. Adly, B.; El-Khouly, T. Combining retrofitting techniques, renewable energy resources and regulations for residential buildings to achieve energy efficiency in gated communities. Ain Shams Eng. J. 2022, 13, 101772. [Google Scholar] [CrossRef]
  21. Bui, D.K.; Nguyen, T.N.; Ghazlan, A.; Ngo, T.D. Biomimetic adaptive electrochromic windows for enhancing building energy efficiency. Appl. Energy 2021, 300, 117341. [Google Scholar] [CrossRef]
  22. Song, K.; Jang, Y.; Park, M.; Lee, H.S.; Ahn, J. Energy efficiency of end-user groups for personalized HVAC control in multi-zone buildings. Energy 2020, 206, 118116. [Google Scholar] [CrossRef]
  23. Vieites, E.; Vassileva, I.; Ariasa, J.E. European initiatives towards improving the energy efficiency in existing and historic buildings. Energy Procedia 2015, 75, 1679–1685. [Google Scholar] [CrossRef]
  24. Coelho, G.B.; Henriques, F.M. Performance of passive retrofit measures for historic buildings that house arte-facts viable for future conditions. Sustain. Cities Soc. 2021, 71, 102982. [Google Scholar] [CrossRef]
  25. Coelho, G.B.; Silva, H.E.; Henriques, F.M. Impact of climate change on cultural heritage: A simulation study to assess the risks for conservation and thermal comfort. Int. J. Glob. Warm. 2019, 19, 382–406. [Google Scholar] [CrossRef]
  26. Wani, M.; Hafiz, F.; Swain, A.; Ukil, A. Estimating thermal parameters of a commercial building: A meta-heuristic approach. Energy Build. 2021, 231, 110537. [Google Scholar] [CrossRef]
  27. Yang, X.; Peng, L.L.; Jiang, Z.; Chen, Y.; Yao, L.; He, Y.; Xu, T. Impact of urban heat island on energy demand in buildings: Local climate zones in Nanjing. Appl. Energy 2020, 260, 114279. [Google Scholar] [CrossRef]
  28. Lassandro, P.; Di Turi, S. Multi-criteria and multiscale assessment of building envelope response-ability to rising heat waves. Sustain. Cities Soc. 2019, 51, 101755. [Google Scholar] [CrossRef]
  29. Wang, R.; Lu, S.; Feng, W.; Xu, B. Tradeoff between heating energy demand in winter and indoor overheating risk in summer constrained by building standards. Build. Simul. 2021, 14, 987–1003. [Google Scholar] [CrossRef]
  30. Kisilewicz, T. On the role of external walls in the reduction of energy demand and the mitigation of human thermal discomfort. Sustainability 2019, 11, 1061. [Google Scholar] [CrossRef]
  31. Zhou, X.; Carmeliet, J.; Derome, D. Influence of envelope properties on interior insulation solutions for masonry walls. Build. Environ. 2018, 135, 246–256. [Google Scholar] [CrossRef]
  32. Evola, G.; Marletta, L.; Costanzo, V.; Caruso, G. Different Strategies for Improving Summer Thermal Comfort in Heavyweight Traditional Buildings. Energy Procedia 2015, 78, 3228–3233. [Google Scholar] [CrossRef]
  33. Cabeza-Prieto, A.; Camino-Olea, M.S.; Sáez-Pérez, M.P.; Llorente-Álvarez, A.; Ramos-Gavilán, A.B.; Rodríguez-Esteban, M.A. Comparative Analysis of the Thermal Conductivity of Handmade and Mechanical Bricks Used in the Cultural Heritage. Materials 2022, 15, 4001. [Google Scholar] [CrossRef] [PubMed]
  34. Mauri, L. Feasibility analysis of retrofit strategies for the achievement of NZEB target on a historic building for tertiary use. Energy Procedia 2016, 101, 1127–1134. [Google Scholar] [CrossRef]
  35. Alongi, A.; Scoccia, R.; Motta, M.; Mazzarella, L. Numerical investigation of the Castle of Zena energy needs and a feasibility study for the implementation of electric and gas driven heat pump. Energy Build. 2015, 95, 32–38. [Google Scholar] [CrossRef]
  36. Pisello, A.L.; Petrozzi, A.; Castaldo, V.L.; Cotana, F. On an innovative integrated technique for energy refurbishment of historical buildings: Thermal-energy, economic and environmental analysis of a case study. Appl. Energy 2016, 162, 1313–1322. [Google Scholar] [CrossRef]
  37. Bakonyi, D.; Dobszay, G. Simulation aided optimization of a historic window’s refurbishment. Energy Build. 2016, 126, 51–69. [Google Scholar] [CrossRef]
  38. Atmaca, A.B.; Gedik, G.Z. Determination of thermal comfort of religious buildings by measurement and survey methods: Examples of mosques in a temperate-humid climate. J. Build. Eng. 2020, 30, 101246. [Google Scholar] [CrossRef]
  39. Boarin, P.; Lucchi, E.; Zuppiroli, M. An Assessement Method for Certified Environmental Sustainability in the Preservation of Historic Buildings. A Focus on Energy Efficiency and Indoor Environmental Quality in the Italina Experience of GBC Historic Building. Restor. Build. Monum. 2019, 1–15. [Google Scholar] [CrossRef]
  40. Buda, A.; de Place Hansen, E.J.; Rieser, A.; Giancola, E.; Pracchi, V.N.; Mauri, S.; Marincioni, V.; Gori, V.; Fouseki, K.; López, C.S.P.; et al. Conservation-Compatible Retrofit Solutions in Historic Buildings: An Integrated Approach. Sustainability 2021, 13, 2927. [Google Scholar] [CrossRef]
  41. Magrini, A.; Franco, G. The energy performance improvement of historic buildings and their environmental sustainability assessment. J. Cult. Herit. 2016, 21, 834–841. [Google Scholar] [CrossRef]
  42. Onecha, B.; Dotor, A. Simulation Method to Assess Thermal Comfort in Historical Buildings with High-Volume Interior Spaces: The Case of the Gothic Basilica of Sta. Maria del Mar in Barcelona. Sustainability 2021, 13, 2980. [Google Scholar] [CrossRef]
  43. Ghazi, S.; Sayigh, A.; Ip, K. Dust effect on flat surfaces—A review paper. Renew. Sust. Energy Rev. 2014, 33, 742–751. [Google Scholar] [CrossRef]
  44. Ruggeri, A.G.; Calzolari, M.; Scarpa, M.; Gabrielli, L.; Davoli, P. Planning energy retrofit on historic building stocks: A score-driven decision support system. Energy Build. 2020, 224, 10066. [Google Scholar] [CrossRef]
  45. Buda, A.; Pracchi, V.; Sannasardo, R. Built Cultural Heritage and Energy Efficiency. The Sicily Case: Pros and Cons of an Innovative Experience. IOP Conf. Ser. Earth Environ. Sci. 2019, 296, 012001. [Google Scholar] [CrossRef]
  46. Mazzola, E.; Dalla Mora, T.; Peron, F.; Romagnoni, P. An Integrated Energy and Environmental Audit Process for Historic Buildings. Energies 2019, 12, 3940. [Google Scholar] [CrossRef]
  47. Siandou, E. Heritage Values and Sustainable Development: The Case of the Modern Heritage in Cyprus. In Proceedings of the Sustainability in Architectural Cultural Heritage BIOCULTURAL 2015, Limassol, Cyprus, 11–12 December 2015. [Google Scholar]
  48. Cornaro, C.; Puggioni, V.A.; Strollo, R.M. Dynamic simulation and on-site measurements for energy retrofit of complex historic buildings: Villa Mondragone case-study. J. Build. Eng. 2016, 6, 17–28. [Google Scholar] [CrossRef]
  49. Mallea, M.E.; Igiñiz, L.E.; de Diego, M.D.L.G. Passive hygrothermal behaviour and indoor comfort concerning the construction evolution of the traditional Basque architectural model. Lea valley case study. Build. Environ. 2018, 143, 496–512. [Google Scholar] [CrossRef]
  50. Schibuola, L.; Scarpa, M.; Tambani, C. Innovative technologies for energy retrofit of historic buildings: An experimental validation. J. Cult. Herit. 2018, 30, 147–154. [Google Scholar] [CrossRef]
  51. Manzano-Agugliaro, F.; Montoya, F.G.; Sabio-Ortega, A.; García-Cruz, A. Review of bioclimatic architecture strategies for achieving thermal comfort. Renew. Sustain. Energy Rev. 2015, 49, 736–755. [Google Scholar] [CrossRef]
  52. Bodach, S.; Lang, W.; Hamhaber, J. Climate responsive building design strategies of vernacular architecture in Nepal. Energy Build. 2014, 81, 227–242. [Google Scholar] [CrossRef]
  53. Ghoreishi, K.; Fernández-Gutiérrez, A.; Fernández-Hernández, F.; Parras, L. Retrofit planning and execution of a Mediterranean villa using on-site measurements and simulations. J. Build. Eng. 2021, 35, 102083. [Google Scholar] [CrossRef]
  54. D’Ambrosio Alfano, F.R.; Olesen, B.W.; Palella, B.I.; Riccio, G. Thermal comfort: Design and assessment for energy saving. Energy Build. 2014, 81, 326–336. [Google Scholar] [CrossRef]
  55. Ascione, F.; De Masi, R.F.; De Rossi, F.; Ruggiero, S.; Vanoli, G.P. Optimization of building envelope design for nZEBs in Mediterranean climate: Performance analysis of residential case study. Appl. Energy 2016, 183, 938–957. [Google Scholar] [CrossRef]
  56. D’Agostino, D.; Parker, D.; Epifani, I.; Crawley, D.; Lawrie, L. How will future climate impact the design and performance of nearly Zero Energy Buildings (nZEBs)? Energy 2022, 240, 122479. [Google Scholar] [CrossRef]
  57. Sakiyama, N.R.M.; Mazzaferro, L.; Carlo, J.C.; Bejat, T.; Garrecht, H. Natural ventilation potential from weather analyses and building Simulation. Energy Build. 2021, 231, 110596. [Google Scholar] [CrossRef]
  58. Ciardiello, A.; Rosso, F.; Dell’Olmo, J.; Ciancio, V.; Ferrero, M.; Salata, F. Multi-objective approach to the optimization of shape and envelope in building energy design. Appl. Energy 2020, 280, 115984. [Google Scholar] [CrossRef]
  59. De Berardinis, P.; Rotilio, M.; Marchionni, C.; Friedman, A. Improving the energy-efficiency of historic masonry buildings. A case study: A minor centre in the Abruzzo region, Italy. Energy Build. 2014, 80, 415–423. [Google Scholar] [CrossRef]
  60. Llorente-Alvarez, A.; Camino-Olea, M.S.; Cabeza-Prieto, A.; Sáez-Pérez, M.P.; Rodríguez-Esteban, M.A. The thermal conductivity of the masonry of handmade brick Cultural Heritage with respect to density and humidity. J. Cult. Herit. 2022, 53, 212–219. [Google Scholar] [CrossRef]
  61. Onecha, B.; Dotor, A.; Marmolejo-Duarte, C. Beyond Cultural and Historic Values, Sustainability as a New Kind of Value for Historic Buildings. Sustainability 2021, 13, 8248. [Google Scholar] [CrossRef]
  62. Cabeza-Prieto, A.; Camino-Olea, M.S.; Rodríguez-Esteban, M.A.; Llorente-Álvarez, A.; Sáez-Pérez, M.P. Moisture Influence on the Thermal Operation of the Late 19th Century Brick Facade, in a Historic Building in the City of Zamora. Energies 2020, 13, 1307. [Google Scholar] [CrossRef]
  63. Bottino-Leone, D.; Larcher, M.; Herrera-Avellanosa, D.; Haas, F.; Troi, A. Evaluation of natural-based internal insulation systems in historic buildings through a holistic approach. Energy 2019, 181, 521–531. [Google Scholar] [CrossRef]
  64. Galatioto, A.; Ricciu, R.; Salem, T.; Kinab, E. Energy and economic analysis on retrofit actions for Italian public historic buildings.Energy and economic analysis on retrofit actions for Italian public historic buildings. Energy 2019, 176, 58–66. [Google Scholar] [CrossRef]
  65. Rotilio, M.; Cucchiella, F.; De Berardinis, P.; Stornelli, V. Thermal transmittance measurements of the historical masonries: Some case studies. Energies 2018, 11, 2987. [Google Scholar] [CrossRef]
  66. Lucchi, E. Thermal transmittance of historical stone masonries: A comparison among standard, calculated and measured data. Energy Build. 2017, 151, 393–405. [Google Scholar] [CrossRef]
  67. Nie, Z.; Chen, S.; Zhang, S.; Wu, H.; Weiss, T.; Zhao, L. Adaptive Façades Strategy: An architect-friendly computational approach based on co-simulation and white-box models for the early design stage. Energy Build. 2023, 296, 113320. [Google Scholar] [CrossRef]
  68. Sesana, E.; Gagnon, A.S.; Ciantelli, C.; Cassar, J.; Hughes, J.J. Climate change impacts on cultural heritage: A literature review. Wiley Interdiscip. Rev. Clim. Chang. 2021, 12, e710. [Google Scholar] [CrossRef]
  69. Fatoric, S.; Seekamp, E. Are cultural heritage and resources threatened by climate change? A systematic literature review. Clim. Chang. 2017, 142, 227–254. [Google Scholar] [CrossRef]
  70. Félez, C. El Hospital Real, 1st ed.; Editorial Universidad de Granada: Granada, Spain, 2014. [Google Scholar]
  71. Akkurt, G.G.; Aste, N.; Borderon, J.; Buda, A.; Calzolari, M.; Chung, D.; Costanzo, V.; Del Pero, C.; Evola, G.; Huerto-Cardenas, H.E.; et al. Dynamic thermal and hygrometric simulation of historical buildings: Critical factors and possible solutions. Renew. Sustain. Energy Rev. 2020, 118, 109509. [Google Scholar] [CrossRef]
  72. Huerto-Cardenas, H.E.; Leonforte, F.; Aste, N.; Del Pero, C.; Evola, G.; Costanzo, V.; Lucci, E. Validation of dynamic hygrothermal simulation models for historical. Build. Environ. 2020, 180, 107081. [Google Scholar] [CrossRef]
  73. Diario Oficial. Gaceta de Madrid 1931, 155, 1–5. Available online: https://www.boe.es/gazeta/dias/1931/06/04/pdfs/GMD-1931-155.pdf (accessed on 17 July 2023).
  74. Código Técnico de la Edificación. Documento Básico de Ahorro de Energía (CTE DB HE 2022); Ministerio de Transportes, Movilidad y Agenda Urbana: Madrid, Spain, 2022. [Google Scholar]
  75. Pietrapertosa, F.; Olazabal, M.; Simoes, S.G.; Salvia, M.; Fokaides, P.A.; Ioannou, B.I.; Viguié, V.; Spyridaki, N.A.; Hurtado, S.G.; Geneletti, D.; et al. Adaptation to climate change in cities of Mediterranean Europe. Cities 2023, 140, 104452. [Google Scholar] [CrossRef]
  76. Mühr, B. Klimadiagramme Weltweit. Available online: http://www.klimadiagramme.de/index.html (accessed on 21 January 2022).
  77. ISO 10211:2017; Thermal Bridges in Building Construction—Heat Flows and Surface Temperatures—Detailed Calculations. International Organization for Standardization (ISO): Geneva, Switzerland, 2017.
  78. Solé, J. La Introducción de Puentes Térmicos en OpenStudio/EnergyPlus. Available online: https://ibpsa.es/la-introduccion-de-puentes-termicos-en-openstudio-energy-plus/ (accessed on 30 March 2023).
  79. Tronchin, L.; Fabbri, K.; Tronchin, L.; Fabbri, K. Energy and microclimate simulation in a heritage building: Further studies on the Malatestiana library. Energies 2017, 10, 1621. [Google Scholar] [CrossRef]
  80. Chatzivasileiadi, A.; Lannon, S.; Jabi, W.; Wardhana, N.M.; Aish, R. Addressing Pathways to Energy Modelling through Non-Manifold Topology; SimAUD: Delft, The Netherlands, 2018. [Google Scholar]
  81. AEMET. Vicepresidencia Tercera del Gobierno de España. Ministerio Para la Transición Ecológica y el reto Demográfico. Agencia Estatal de Meteorología. Available online: http://www.aemet.es (accessed on 2 April 2023).
  82. ISO 10456; Building Materials and Products. Hygrothermal Properties. Tabulated Design Values and Procedures for Determining Declared and Design Thermal Values. International Organization for Standardization (ISO): Geneva, Switzerland, 2007.
  83. CTE WEB, Prontuario de Soluciones Constructivas/Materiales. Available online: http://cte-web.iccl.es/materiales.php?a=4 (accessed on 21 January 2022).
  84. Lizana, J.; López-Cabeza, V.P.; Renalidi, R.; Diz-Mellado, E.; Rivera-Gómez, C.; Galán-Marín, C. Integrating courtyard microclimate in building performance to mitigate extreme urban heat impacts. Sustain. Cities Soc. 2022, 78, 103590. [Google Scholar] [CrossRef]
  85. ANSI/ASHRAE Guideline 14-2014; Measurement of Energy, Demand and Water Savings. American Society of Heating, Ventilating and Air Conditioning Engineers (ASHRAE): Atlanta, GA, USA, 2014. Available online: www.ashrae.org/technology (accessed on 13 May 2023).
  86. ASHRAE Standard 55; Thermal Environmental Conditions for Human Occupancy. ANSI/ASHRAE: Peachtree Corners, GA, USA, 2020.
  87. Taleghani, M.; Swan, W.; Johansson, E.; Ji, Y. Urban cooling: Which façade orientation has the most impact on a microclimate? Sustain. Cities Soc. 2021, 64, 102547. [Google Scholar] [CrossRef]
  88. Chi, F.; Wang, Y.; Wang, R.; Li, G.; Peng, C. An investigation of optimal window-to-wall ratio based on changes in building orientations for traditional dwellings. Sol. Energy 2020, 195, 64–81. [Google Scholar] [CrossRef]
  89. Mangkuto, R.A.; Tresna, D.N.A.T.; Hermawan, I.M.; Pradipta, J.; Jamala, N.; Paramita, B. Experiment and simulation to determine the optimum orientation of building-integrated photovoltaic on tropical building façades considering annual daylight performance and energy yield. Energy Built Environ. 2023, 5, 414–425. [Google Scholar] [CrossRef]
  90. Almumar, M.M.S. Understanding the environmental performance of the Iraqi traditional courtyard house, Is there an order of façades orientation in randomly oriented land plots? J. Build. Eng. 2019, 22, 140–146. [Google Scholar] [CrossRef]
  91. Wang, C.; Li, C.; Xie, L.; Wang, X.; Chang, L.; Wang, X.; Li, H.X.; Liu, Y. Thermal environment and thermal comfort in metro systems: A case study in severe cold region of China. Build. Environ. 2023, 227, 109758. [Google Scholar] [CrossRef]
  92. Passi, A.; Nagendra, S.S.; Maiya, M.P. Evaluation of comfort perception of passengers in urban underground metro stations. Energy Sustain. Development 2022, 68, 273–288. [Google Scholar] [CrossRef]
  93. Forcada, N.; Gangolells, M.; Casals, M.; Tejedor, B.; Macarulla, M.; Gaspar, K. Field study on adaptive thermal comfort models for nursing homes in the Mediterranean climate. Energy Build. 2021, 252, 111475. [Google Scholar] [CrossRef]
  94. Kajjoba, D.; Kasedde, H.; Olupot, P.W.; Lwanyaga, J.D. Evaluation of thermal comfort and air quality of low-income housing in Kampala City, Uganda. Energy Built Environ. 2022, 3, 508–524. [Google Scholar] [CrossRef]
  95. Chu, H.H.; Almojil, S.F.; Almohana, A.I.; Alali, A.F.; Anqi, A.E.; Rajhi, A.A.; Alamri, S. Evaluation of building integrated with phase change material considering of ASHRAE classification using seasonal and annual analysis. J. Build. Eng. 2022, 15, 104457. [Google Scholar] [CrossRef]
  96. Carlucci, S.; Erba, S.; Pagliano, L.; de Dear, R. ASHRAE Likelihood of Dissatisfaction: A new right-here and right-now thermal comfort index for assessing the Likelihood of dissatisfaction according to the ASHRAE adaptive comfort model. Energy Build. 2021, 250, 111286. [Google Scholar] [CrossRef]
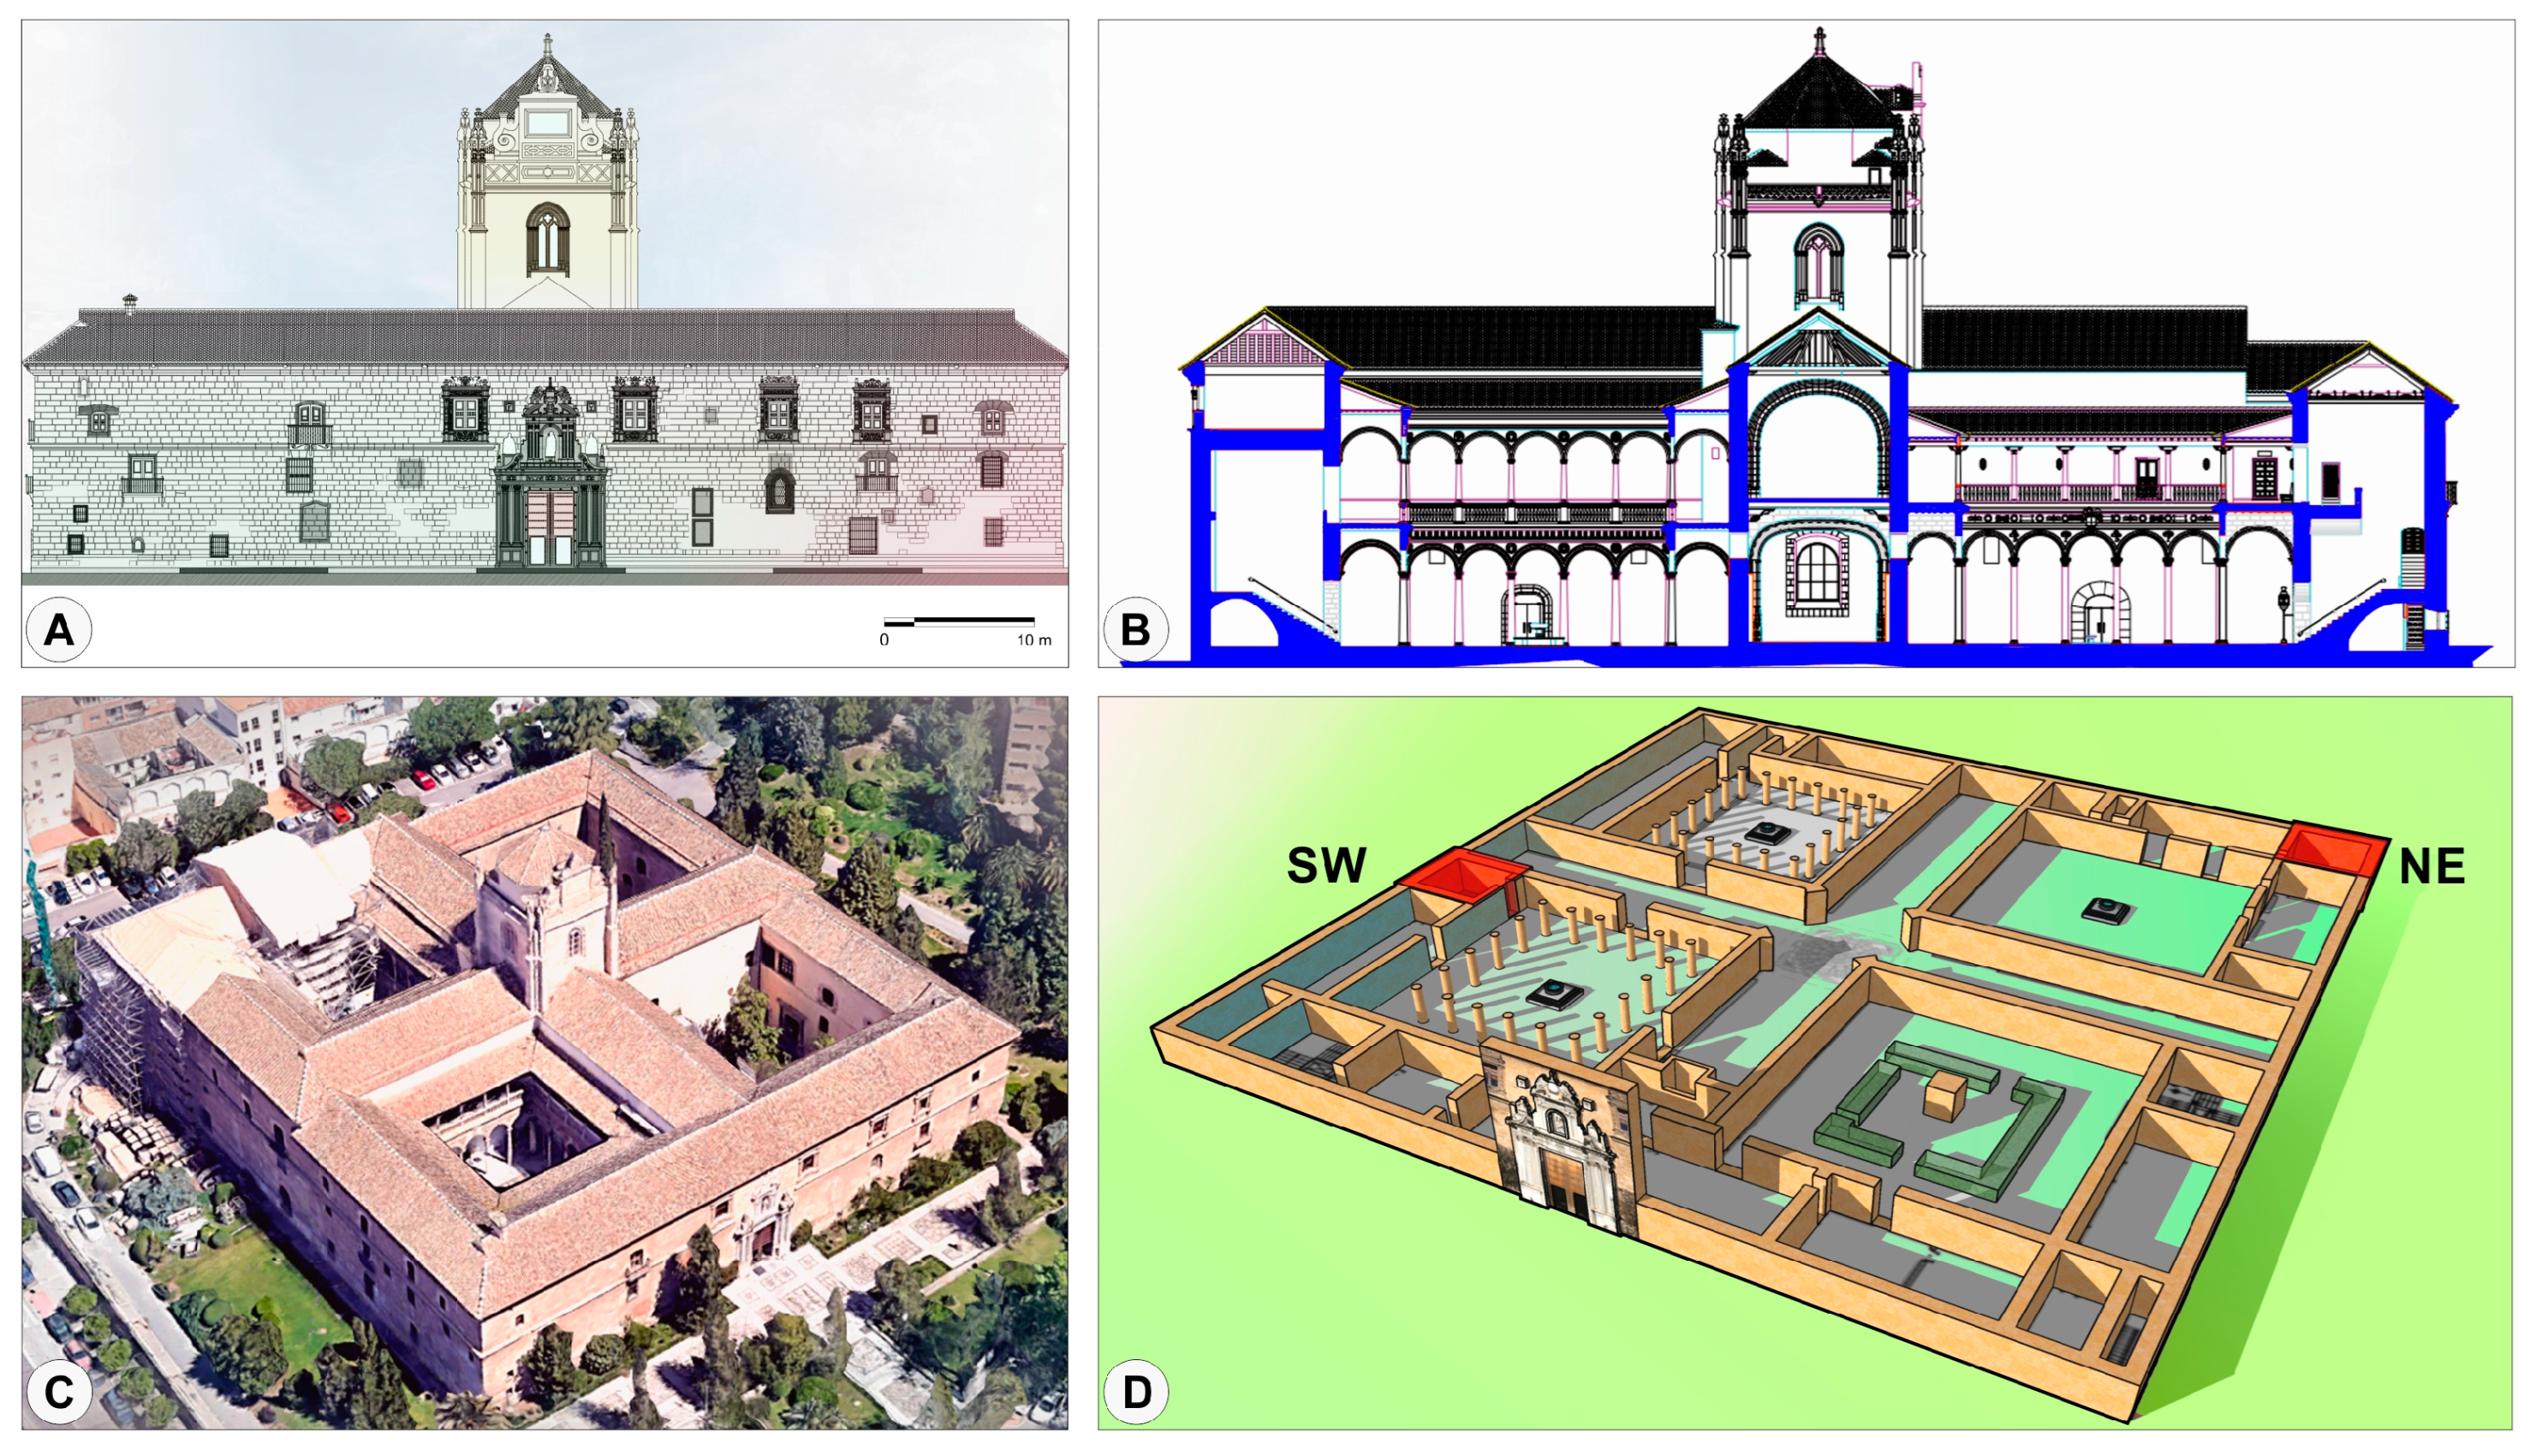
Figure 1. Elevation (A), section (B), picture of façade (C), and graphic aerial view with room locations in the building (D).
Buildings 13 03048 g001
Figure 2. Plan with indication of the rooms.
Buildings 13 03048 g002
Figure 3. Thermal difference between the climatic data available from AEMET [81] and the monitored temperature. (a) Summer period with temperature differences due to the urban heat island effect. (b) Winter period with temperature differences due to the isolated building typology.
Buildings 13 03048 g003
Figure 4. Procedure of the energy simulation.
Buildings 13 03048 g004
Figure 5. Acceptability percentage ranges for adaptive thermal comfort in Granada during the studied periods (summer and winter).
Buildings 13 03048 g005
Figure 6. Daily maximum temperatures during the summer period inside the rooms and outside.
Buildings 13 03048 g006
Figure 7. Daily minimum temperatures during the winter period inside the rooms and outside.
Buildings 13 03048 g007
Figure 8. Adaptive thermal comfort in the rooms according to ASHRAE 55 [84] during the summer period. (Left) Room A. (Right) Room B.
Buildings 13 03048 g008
Figure 9. Adaptive thermal comfort in the rooms according to ASHRAE 55 [86] during the winter period. (Left) Room A. (Right) Room B.
Buildings 13 03048 g009
Table 1. Characteristics of rooms A and B.
FeaturesRoom ARoom B
Geographic orientation (outside wall)SouthwestNortheast
Area38.60 m229.58 m2
Height of the room4.50 m4.50 m
Outside walls
(composition and thickness)
Travertine masonryTravertine masonry
Wall 1.10 mWall 1.10 m
Inside walls
(composition and thickness)
Travertine masonryTravertine masonry
Wall 0.87 mWall 0.87 m
Table 2. WWR for the façades where rooms A and B are located.
LocationFaçadeWWR (%)
Room ANorthwest10.26
Northwest (outdoor)0.00
Room BSouthwest12.82
Northeast (indoor)16.92
Table 3. Thermal and physical properties of the opaque materials in the envelope [82,83].
Thickness (m)Density (kg/m3)Conductivity (W/mK)Specific
Heat (J/kgK)
Thermal EmissivitySolar Absorptance
Travertine1.0825703.5010000.970.30
Cement mortar0.0520001.8010000.960.90
Lime
mortar
0.0516201.3010000.940.90
Table 4. Thermal and physical properties of the transparent materials in the envelope [82,83].
Thickness (m)Density (kg/m3)Conductivity (W/mK)Specific
Heat (J/kgK)
Thermal EmissivitySolar Absorptance
Glass0.0726001.607200.850.15
Table 5. Statistical indices for model validation with the ASHRAE limit in parentheses.
NMBE (%)CVRMSE (%)R2
Room A−2.5 (<±10)5.9 (<30)0.97 (>0.75)
Room B−4.0 (<±10)6.5 (<30)0.86 (>0.75)
Table 6. Thermal transmittance values of the construction elements of rooms A and B and limit values according to [74].
ElementRoom A and Room B
(W/m2K)
CTE DB HE limit [72]
(W/m2K)
Walls in contact with the outside air0.870.56
Floors in contact with the ground2.820.75
Table 7. % openings and thermal transmittance values of openings in the façades of the two rooms and limit values according to standard [74].
Openings
Rooms A and B
U-factor
(W/m2K)
DB HE Limit [72]
(CTE Version)
% OpeningsFaçadesNortheast and Northwest (W/m2K)Southwest
(W/m2K)
11–203.33.44.4
Table 8. Thermal Transmittance values of the façades corresponding to the two rooms under study.
RoomsFaçades
ANorthwestNortheast (outdoor) without openings
U = 1.12 W/m2KU = 0.87 W/m2K
BSouthwestNortheast (indoor)
U = 1.18 W/m2KU = 1.19 W/m2K
Disclaimer/Publisher’s Note: The statements, opinions and data contained in all publications are solely those of the individual author(s) and contributor(s) and not of MDPI and/or the editor(s). MDPI and/or the editor(s) disclaim responsibility for any injury to people or property resulting from any ideas, methods, instructions or products referred to in the content.