3.1. Raw Material Characteristics
The particle size distribution of the SW is shown in
Figure 3, where a bimodal distribution (two peaks) can be observed between 0.50 µm and 1120 µm, which are the sizes with the highest frequency. The first is 20 µm, and the second is 100 µm. The assay also found a d(0.5) of 53.224 µm.
Although SW, compared to other insulation materials, has a lower environmental impact in terms of life cycle energy consumption [
29], its disposal at the end of its life cycle is of concern due to its deficient post-consumer related to technical, economic and health problems [
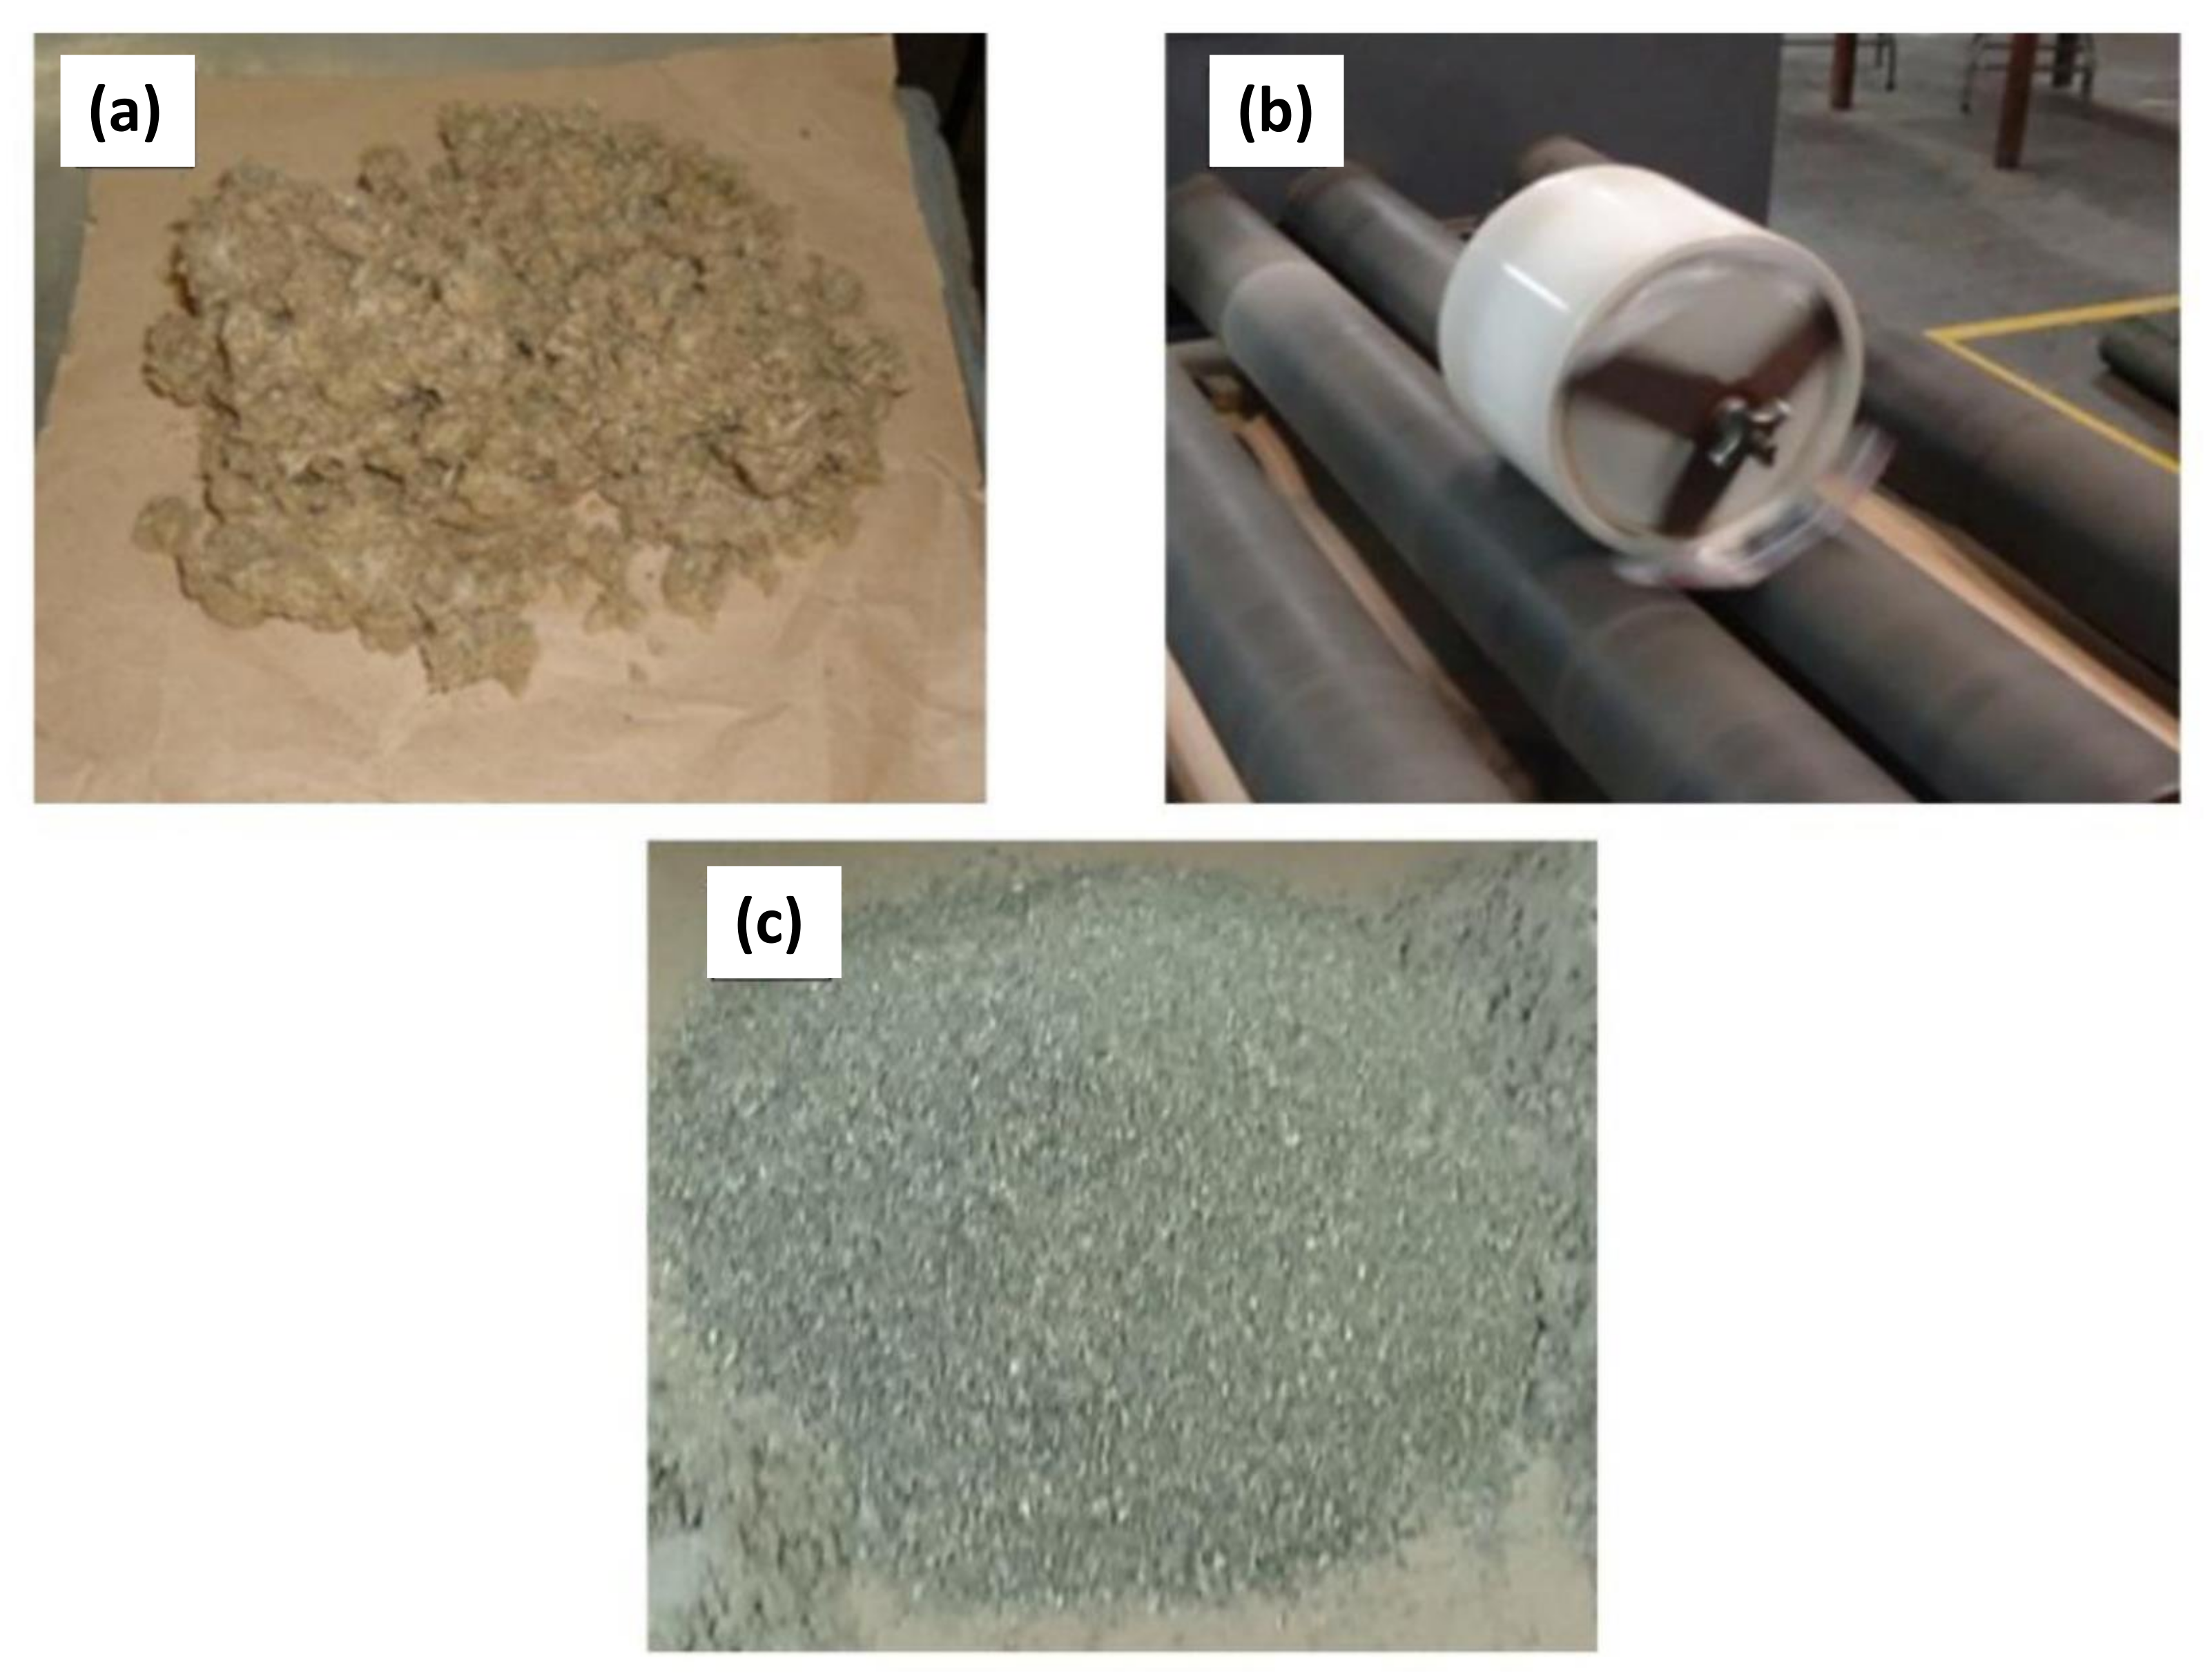
50]. Among the size reduction methods for stone wool fiber, the ball mills method is an effective method for bulk density and particle size reduction. It is recommended as a feasible method to be scaled up to the industrial level [
50]. Therefore, this method can be used at the industrial level to produce AAC materials, with lower energy consumption in waste shredding and, consequently, a lower environmental impact.
The XRF results in
Table 3 show SiO
as the oxide component with the highest percentage in the SW, followed by CaO Al
O
, MgO, and Fe
O
. Meanwhile, the main component for OPC was CaO, followed by SiO
, Al
O
, and Fe
O
. In
Figure 4, the SEM images of the ground fiber are shown, while
Figure 5 shows the EDS results obtained from the fiber. In
Figure 4, approximate fiber diameters between 2.98 and 17.77 µm and approximate lengths between 20 and 80 µm can be seen per the particle size ranges shown in
Figure 3. Meanwhile, a smooth morphology of the fiber can be observed, with small particles adhering to its surface, possibly of the same material as the fiber. Similarly, in
Figure 5, it can be observed that, according to the EDS spectra carried out on the fiber’s surface, its chemical composition consists mainly of Si, Ca, Al, Mg, Fe, Na, and Ti. This chemical element distribution follows the XRF analysis shown in
Table 3. As for ignition losses (LOI at 950 °C), the OPC showed a loss of 5.2%, while a sample of SW without the phenolic resin binder showed no loss.
3.2. Unconfined Compressive Strength (UCS) of the AAC and AAHC Samples
Figure 6 shows the UCS results for the nine grouped combinations, with the levels of OPC percentage and W/(SW+OPC) ratio. As shown in
Figure 6, the highest UCS, of 12.35 MPa, was achieved for the Act.2—15% mixture corresponding to the AAHC samples, followed by the Act.1—15% mixture at 10.50 MPa. Of the AAC samples, the highest strength, at 6.62 MPa, was achieved with the Act.2—0% mixture, followed by the Act.3—0%, with 4.18 MPa. The highest strength values were obtained at the 15% OPC level for Act.1 and Act.2, while with Act.3, they were obtained at a 30% OPC level. Similarly, the strength tended to increase from Act.1 to Act.2 before decreasing when passing to Act.3, independently of the OPC level. This suggests a synergy in the reactions when OPC is combined with the alkaline activators Act.1, Act.2, and the SW.
Yliniemi et al. [
42] reported that using sodium aluminate kinetically retards the SW reaction when compared with using sodium hydroxide and sodium silicate. These authors conducted calorimetric studies using a 40 °C isotherm. In the present work, a combination of sodium aluminate and sodium hydroxide was used at room temperature. This could explain the prolonged time required, of four days, for the setting of the AAC samples to be visually apparent.
Some works have studied the effect of adding OPC in alkali-activated materials. For instance, Garcia-Lodeiro et al. [
23] and Palomo et al. [
51] reported that in systems containing fly ash (FA) in proportions of 30% OPC–70% FA, the addition of OPC accelerated the alkaline activation of the fly ash at room temperature. This acceleration is caused by the energy released by the OPC during the hydration process in the form of heat, which in turn causes the activation of chemical reactions that result in the setting and hardening of the fly ash in a highly alkaline material. Moreover, these authors add that the hydration of OPC in these systems depends on the concentration of OH and the presence of soluble silicate in the medium.
Similarly, Angulo–Ramírez et al. [
52] evaluated OPC + GBFS (granulated blast furnace slag 80%) mixtures through calorimetric assays, varying the combinations of the sodium silicate and sodium hydroxide activator. Their results showed that the heat released by these alkali-activated systems is much greater than if they had been hydrated with water but much lower than a mixture of 100% OPC. In addition, they concluded that the type of activator influences the reaction kinetics, especially at the early stages. The same conclusion was reached by Garcia-Loderio et al. [
25] when they evaluated a cement hybrid of 70% FA–30% OPC.
In the present work, the AAC samples containing OPC (15 and 30%) were set more quickly than the samples that did not contain OPC (0%). OPC probably accelerates the setting and hardening of the matrix, as is the case in OPC + FA and OPC + GBFS in highly alkaline media.
Additionally, some studies have evaluated sodium aluminate (NaAlO
) as an accelerator in the hydration processes of special OPC cement in low-temperature conditions. Lota et al. [
53] showed that the hydration of a special cement in aqueous solutions of 0.1 to 1 M NaAlO
is accelerated as the solution forms hydration confining shell that completely covers the cement grains. Moreover, the Al ions originating from the sodium aluminate react rapidly with the Ca ions released due to the dissolution of the calcium silicates of the cement, thereby forming hydrated calcium aluminates. Similarly, Andersen et al. [
54] found that sodium aluminate accelerates the hydration of the alite and belite in white OPC in a temperature range between 5 and 20 °C.
Based on the above, using sodium aluminate (NaAlO) as an alkaline activator may have favored the acceleration of the hydration processes of OPC and, in turn, the alkaline activation of the SW by releasing hydration heat and thereby accelerating the setting process.
3.4. Quadratic Model Experiment with AAC and AAHC
The quadratic equation (Equation (
2)), following the coefficients found by the R software, is presented below. Also,
Table 6 shows a summary of the model’s parameters.
where:
R = UCS, in MPa.
Act = Na:Al ratio of the alkaline activator, at a constant Si:Al ratio (1.9).
OPC = Percentage of OPC.
Table 6.
Summary quadratic model alkaline-activated cement.
Table 6.
Summary quadratic model alkaline-activated cement.
| | Degrees of Freedom | F-Value | p-Value |
|---|
| Quadratic model | 5 | 10.49 | |
| Coefficient of determination | 0.7141 | | |
| Adjusted coefficient of determination | 0.646 | | |
As seen in
Table 6, the model is significant considering the p-value, which is much lower than the significance level of 0.05. Also, it shows that the
is 0.7141, which means that around 71.41% of the variability of the UCS is explained by the model, which is an acceptable value. Afterward, the
is shown, with a value of 0.646. The fact that the
drops concerning
indicates that there are terms within the model that do not contribute significantly. For prediction purposes, it is recommended that
be adjusted to at least 0.70 [
55]. In this case, the
-value is approximately at that level.
Figure 8a shows the contour map graph, while
Figure 8b shows the surface response of the quadratic equation mentioned. It can be observed in
Figure 8a that the region that includes the maximum UCS values is located between the Act. values: 1.6–1.8, and OPC: 15–20%, approximately. Additionally,
Figure 8b shows that the maximum surface response value corresponds to the domain region or contour map described previously. Although it is sensitive to the lack of adjustment, it is considered that this model can graphically represent an approximation of the behavior of the response variable (UCS) relative to the activators and OPC factors based on the UCS results.
3.5. X-ray Diffraction (XRD)
Figure 9,
Figure 10 and
Figure 11 show the x-ray diffraction results on the nine samples of combinations of alkali-activated cements, including both AAC and AAHC samples. According to the three activators, these results have been grouped into three figures. The three activators consist of Act.1 (Na:Al = 1.3), corresponding to
Figure 9; Act.2 (Na:Al = 1.8) corresponding to
Figure 10; and Act.3 (Na:Al = 2.2) corresponding to
Figure 11. Each group’s combination is shown with its respective OPC level (0–15–30%). Additionally, they are compared with the diffractogram of the inactivated stone wool (denoted as “Fiber”) to analyze the changes in the AAC and AAHC samples.
The phases identified were: hydrotalcite, ((Mg
Al
)(OH)
(CO
)(H
O)
)
: Powder Diffraction File (PDF) #00-014-0191; hydroandradite, Ca
Fe
(SiO
)
(OH)
: (PDF) #01-075-0553; Y-type zeolite, Na
H
Al
Si
O
: (PDF) #00-038-0239; sodium alumina-silicate hydrate, N-A-S-H: (PDF) #00-041-0009; calcium alumina-silicate hydrate C-A-S-H (PDF) #00-033-0306; calcium silicate hydrate, I-type C-S-H: (PDF) #00-034-0002; portlandite Ca(OH)
: (PDF) #00-004-0733 and calcite, CaCO
: (PDF) #00-013-0135. All these phases were found in each of the three types of AAC, except for the Y-type zeolite, whose characteristic peaks were identified in the AAC with Act.2 (
Figure 10) but could only be seen slightly in the AAC with Act.1 (
Figure 9) and could not be seen in the AAC with Act.3 (
Figure 11).
The fiber without alkaline activation presents an amorphous structure with two broad bands between the angles 2
:10–15° and 20–35°, approximately. Meanwhile, in the nine combinations with alkaline activation, the shape of these bands is different from the inactivated fiber, while the formation of some crystalline phases with very good intensity is observed with the addition of OPC. The change in the shifting and the shape of the bands in an amorphous structure in materials rich in aluminosilicates can indicate the formation of zeolite nanocrystals [
56]. This change in the shifting of the bands in alkali-activated SW was also found by Yliniemi et al. [
38] and Kinnunen et al. [
40], who reported the formation of geopolymer phases.
The phases associated with the formation of a alkali-activated material that was identified were the gels N-A-S-H (sodium alumina-silicate hydrate) and C-A-S-H (calcium alumina-silicate hydrate). The C-S-H type I phase identified has also been found in an alkali-activated stone wool system, as reported by Erofeev et al. [
41]. The gel N-A-S-H is known to be the main alkaline reaction product in alkali-activated cement systems, while the gel C-(A)-S-H is the main binding phase of OPC [
24]. Additionally, the N-A-S-H gel’s formation mechanisms and chemical structure are substantially different from that of the C-S-H gel produced by the hydration of OPC [
25,
57].
Following these XRD results, the identification of the Y-type zeolite in the AAC with Act.2 suggests a more significant development of the N-A-S-H gel, given that Y-type zeolite is known to be a secondary reaction product of alkali-activated cement systems [
23]. Therefore, the superior mechanical strength achieved for AAC-Act.2 and AAHC-Act.2 could be attributed to the greater development of N-A-S-H and Y-type zeolite, as shown in
Figure 10. The formation of the N-A-S-H gel improves the mechanical strength of the alkali-activated material because this gel fills the porosity and eventual cracks that may form during hardening, generating more compact cement and, therefore, with improved mechanical properties. In addition, authors have found that the formation of the N-A-S-H gel leads to more ordered structures increasing the crystallinity [
58].
Some studies have investigated the co-precipitation of C-S-H and N-A-S-H gels in alkali-activated systems using FA as a precursor [
23,
24,
25,
57,
59]. These results have shown that, in the presence of Ca
and Al
and at pH greater than 12, C-S-H gel and N-A-S-H gel are converted to the gels C-A-S-H and (N,C)-A-S-H (aluminosilicate with partial substitution of sodium and calcium), respectively. These last two gels have a three-dimensional structure with a relatively high degree of polymerization and crosslinking of Si [
22]. Moreover, it has been found that the N-A-S-H gel, when stable at low pH, behaves like a zeolite and exhibits ion exchange behavior in which Ca displaces Na until the available Ca within the medium is exhausted. According to this, the identification of the Y-type zeolite would indicate a higher development of the (N,C)-A-S-H gel which has a higher degree of polymerization and higher Si crosslinking. Therefore, a higher mechanical performance would be obtained [
24].
Garcia-Lodeiro et al. [
57] propose a nanostructural model of the formation of gels in AAHCs. According to this model, the gels C-S-H and N-A-S-H are simultaneously precipitated after dissolution until saturation of the dissolved species of aluminosilicate and calcium silicate in the alkaline medium is reached. In this process, the two gels compete for the absorption of Si that originates in an early form from the calcium silicate of the OPC. In parallel to this process, the Ca
and Al
ions present in the aqueous solution begin to diffuse through the hardened cementitious matrix, and some of the Ca
ions that are not taken by the C-S-H interact with the N-A-S-H gel to form the (N,C)A-S-H gel, where their three-dimensional structure is conserved. In the presence of high concentrations of Al
, C-S-H is absorbed in the gels’ bonding sites, forming C-(A)-S-H. As the concentration of Al
increases, C-A-S-H is formed [
20]. Meanwhile, the OH:AI ratio in the activator solution can also be vital in understanding the formation of these phases. Depending on the OH:Al ratio, the dissolved aluminum can contain 4 or 6 coordination numbers, affecting the formation of the aluminosilicate phases [
59].
Given the above, the AAC and AAHC systems were kept in an alkaline state (pH = 13) for the Ca
and Al
ions to interact in the cementitious matrix. Additionally, as there was a greater presence of the Al
ion due to the combined use of sodium aluminate and sodium hydroxide as an activator, the formation of C-A-S-H gel was favored over that of the N-A-S-H gel. With the addition of OPC (AAHC system), the processes leading to forming the reaction products mainly identified in the AAC system were accelerated. This is reflected in the more excellent crystallinity in all the AAHC combinations, which can be observed in the XRD results shown in
Figure 9–
Figure 11.
Meanwhile, it is possible that the formation of the N-A-S-H and (N C)-A-S-H gels was favored by the addition of OPC in the AAHC-Act.1 and AAHC-Act.2 combinations. This is particularly likely with the 15% OPC level, which resulted in greater development of UCS. Indeed, in all the AAHC combinations, increasing the level of OPC (15% and 30%) resulted in excess Ca
in the system. This could have led to a greater development of C-A-S-H gel than of N-A-S-H and (N C)-A-S-H gels, which would, in turn, lead to a lower UCS, as can be seen in
Figure 6 and
Figure 7b. However, an excess of the Ca
ion in the system, with the addition of OPC at a level of 30%, would cause a reduction in UCS.
N-A-S-H gel constantly interacts with Ca
due to the strongly polarizing effect of Ca
, which distorts the Si-O-Al bonds, leading to forces that result in the breakage and reorganization of a new polymeric structure in which Si-O-Ca type bonds are formed. This, in turn, results in the conversion of N-A-S-H to (N C)-N-A-S-H and, finally, to C-A-S-H, provided there is sufficient Ca
for this last gel to be formed [
25]. The prevalence of C-A-S-H gel over N-A-S-H gel explained the reduction in UCS when 30% OPC was used for all the activators, in particular for Act.1 and Act.2 (see
Figure 6), given that the development of this last gel is responsible for the increase in resistance in the alkali-activated cements [
58].
About the hydrotalcite phase ((Mg
Al
)(OH)
(CO
)(H
O)
)
, which is also known as quintinite and belongs to the layered-double hydroxides (LDHs) [
42], this has been observed together with the formation of geopolymer structures where SW was activated [
38,
41,
42]. This phase is formed due to the high level of MgO provided by the fiber and its exposure to the atmosphere (CO
). This phase co-exists stably with the principal reaction product (C-(N)-A-S-H) in alkali-activated SW. It could be a control parameter in the reaction kinetics in AAC. None of the studies related this phase to the increase in the strength of the samples.
Concerning the hydroandradite phase (Ca
Fe
(SiO
)
(OH)
), in the previous studies of alkaline activation of SW known to the authors, this has not been identified. It makes its identification in the current study a novel finding. The formation of this phase could be associated with the high CaO content (21.6%), as well as the Fe
O
content (6.8%) present in this fiber in its natural state (see
Table 3). Additionally, it has not been suggested by the authors of the studies that both MgO and Fe
O
take part in geopolymer reactions. SW presents contents of these oxides that are higher than the unit (10.4 and 6.8%, respectively), as can be observed in the XRF results for the fiber shown in
Table 3.
Finally, about the calcite or calcium carbonate (CaCO
) phases and the portlandite or calcium hydroxide Ca(OH)
, identified in both the AAC and AAHC samples, it has been reported that these materials are more susceptible to carbonation than OPC mortars, despite the microstructure of AAHC being more compact and less permeable than that of AAC. This behavior could be explained by the fact that there was not sufficient Ca(OH)
to neutralize CO
. Therefore, the C-S-H gel reacts with the CO
, causing the disintegration of the C-A-S-H gel due to decalcification, resulting in superficial carbonation in the material [
22].
3.6. Scanning Electron Microscopy (SEM) and Energy-Dispersive X-ray Spectroscopy (SEM-EDS)
The following are the results of the scanning electron microscopy (SEM) and energy-dispersive X-ray spectroscopy (SEM-EDS) assays carried out on the AAC and AAHC samples after 28 days of curing and failing compressive strength tests. The SEM images compare the AAC samples with the three activators (Act.1, Act.2, and Act.3) and different OPC levels (0–15–30%). Concerning the EDS results, the activators Act.1 and Act.3 at 0 and 30% OPC are compared to identify and analyze the differences in chemical composition between the mixtures with the most significant differences in alkali activators (Act.1 and Act.3) and OPC percentage (0 and 30%).
In the first two images (a and b) in
Figure 12,
Figure 13 and
Figure 14, corresponding to the AAC, reaction products can be observed adhering to the surface due to the alkaline activation of the SW. This shows that new alkaline reaction products have been formed independently of the variation in the alkaline activator’s molar ratio (Na:Al). Meanwhile, comparing the SEM images (c and d) corresponding to AAHC, reaction products can also be seen on the surface of the fiber, especially in
Figure 12c and
Figure 13c; showing a rougher surface morphology of the fiber. Also, in
Figure 12d and
Figure 14c, a morphology associated with the formation of reaction products can be observed, specifically the formation of N-A-S-H and C-A-S-H gels, as has also been reported by Kinnunen et al. [
40].
Figure 15 and
Figure 16 show the EDS results of the samples with Act.1—0% and Act.3—0%, i.e., AAC. Based on the atomic percentages, an increase can be seen in Na from 7.82% to 14.48% in the AAC samples activated with Act.1 and with Act.3. Similarly, a slight increase in Al, from 8.06% to 10.37%, can be seen. The increase in the two elements is due to the increase in the Na:Al molar ratio between the two activators, which is 1.3 in the sample using Act.1 and 2.2 in the sample using Act.3. Therefore, it is confirmed through EDS analysis that the Na:Al molar ratio variable between Act.1 and Act.3 was effectively controlled.
In the case of Si, the content decreases from 15.96% in Act.1 to 13.93% in Act.3. Comparing the atomic contents with Act.1, the Si/Al ratio is found to be 1.98, very similar to the value defined in the experimental design. In contrast, with Act.3, this ratio decreased to 1.34. This is due to the variability of the atomic composition in the different phases formed, considering that the analysis is punctual.
Meanwhile,
Figure 17 and
Figure 18 show the EDS results of the samples with Act.1-30% and Act.3—30%, i.e., AAHC samples with 30% OPC addition. Based on the atomic percentages and the spectra shown in the images, it can be seen that Ca is higher than in the alkali-activated cement shown in
Figure 15 and
Figure 16. Specifically, the Ca percentage increases from 7.79% (Act.1—0%
Figure 15), to 12.42% (Act.1—30%—
Figure 17); and from 6.11% (Act.3—0%—
Figure 16) to 13.35% (Act.3—30%—
Figure 18). This increase is a result of the Ca content provided by the addition of OPC, which has a very active role in forming reaction products in the alkaline activation of SW.


