Article

Subzero Material Properties of Advanced High-Strength Cold-Formed Steel Alloys

Department of Civil and Environmental Engineering, University of Wisconsin-Madison, Madison, WI 53706, USA
*
Author to whom correspondence should be addressed.
Current address: School of Engineering and Technology, China University of Geosciences (Beijing), Beijing 100083, China.
Buildings 2023, 13(2), 399; https://doi.org/10.3390/buildings13020399
Submission received: 30 November 2022 / Revised: 14 January 2023 / Accepted: 19 January 2023 / Published: 1 February 2023
(This article belongs to the Special Issue Advances in the Behaviour of Steel Structures)

Abstract

:
The overall temperature in high latitude regions has been rapidly increasing in recent years, creating a demand for infrastructure to support increasing human activities. Recent advances in material science have resulted in the development of advanced high-strength steels (AHSS), which are new grades of cold-formed steel (CFS) with unprecedented strength. To design safe infrastructure, the material properties of AHSS under subzero temperatures must be quantified. An experimental investigation following the steady-state test protocol was carried out to quantify the subzero temperature effects on the material properties of AHSS and conventional CFS sheets with yield strengths ranging from 395 MPa to 1200 MPa. Two types of AHSS (dual phase and martensitic) and two types of conventional CFS (mild and high-strength low-alloy) were investigated at temperatures down to −60 C. The stress–strain relationship, elastic modulus, and key stresses and strains were reported from the experiments. The results show that AHSS’s material properties do not degrade but are mildly strengthened at subzero temperatures than at ambient, which indicates that AHSS is a suitable construction material for structural members in high-latitude regions. Furthermore, modeling on stress–strain relationships of AHSS and conventional CFS at subzero temperatures was developed, demonstrating excellent fits with the experiment data.

1. Introduction

As a result of rapid temperature increases in recent decades [1], the frigid high-latitude regions, including northern Russia, northern Canada, northern Scandinavia, Greenland, Alaska, and the Arctic, are open to more frequent human activities during warm seasons, instead of people being discouraged by the gelid temperatures. Potentially linked to this shift, a rapidly increasing population has been observed in these high latitude regions for natural resource exploitation, scientific studies, and traveling [2,3], although the permanent resident population has shown only a marginal increase [4]. For example, tourism was estimated to have quadrupled in summer and increased by over 600% in winter between 2006 and 2016 in the Arctic [2]. These rapid changes lead to an increasing demand for infrastructure in cold regions, which is both a challenge and an opportunity [5].
Cold-formed structural steel is a lesser-known structural material compared to hot-rolled structural steel (HRS), but its popularity has been growing since the mid-twentieth century in the United States. Cold-formed steel (CFS) structural members are typically formed by roll-forming or press-braking steel sheets, with typical thicknesses ranging from 0.378 mm to 6.35 mm. CFS has several advantages over HRS, including a higher strength-to-weight ratio and nestable sections that require fewer transportation costs [6]. CFS systems are typically formed using mechanical fasteners to connect members such as bolts and screws, and the lighter-weight members are easier to assemble. This can result in reduced construction costs compared to HRS structures which have heavier members and typically require welding to connect members. Therefore, CFS may be an ideal structural material for regions with cold climates, as there is no need for formwork or skilled welders on site.
Similar to HRS, CFS comes in a variety of grades and can be classified as conventional strength or high-strength. High-strength steel (HSS) typically has a minimum yield strength of 450 or 460 MPa [7,8] and therefore has a higher strength-to-weight ratio than conventional CFS. High-strength CFS is gaining in popularity, and its use in structures is becoming more common [8]. One downside of high-strength steel is that some grades have a lower ductility compared to conventional steel, which can impact structural behavior if the material cannot meet the required ductility demand.
Existing studies on the material properties of structural steel at subzero temperatures or even under a cryogenic environment are not rare, but most of them discuss HRS [9,10,11,12,13,14,15,16,17,18,19,20,21,22,23], including hot-rolled stainless steel [24,25,26,27,28,29,30,31,32,33,34], where a large portion of the studies tested bar specimens with diameters between 4 mm and 20 mm or flat coupons with thicknesses greater than 3 mm.
However, because interest in the performance of CFS structures at subzero temperatures is relatively new, limited data on the material performance of CFS, including cold-formed stainless steel, under subzero temperatures are available. Abdel-Rahim and Polyzois [35] investigated the subzero material properties of cold-formed ASTM A715 and CSA G40.21–300 W steel, where the specimen thicknesses were 4–4.5 mm. It was found that for both types of steel, the yield and ultimate strengths increased by 10% to 13% at −50 C compared with the ambient cases, while the elongations decreased by 35%. Nykänen et al. [36] tested the material properties of 5 mm-thick specimens cut from a cold-formed rectangular hollow section at ambient and −40 C. The results showed the tested S960 steel had around a 2% higher yield and ultimate strengths but a 20% lower elongation at −40 C than ambient. Azhari et al. [37] investigated the mechanical response of ultra-high-strength steel with a yield strength of 1200 MPa, and a thickness of 3.2 mm extracted from cold-formed tubes at ambient, −40 C, and −80 C. It was found that the tested high-strength steels experienced an ultimate strength increase up to 15% when cooled from ambient to −80 C, meanwhile pronounced ductility losses were also observed at both −40 C and −80 C. Rokilan and Mahendran [38] investigated the mechanical properties of G300 and G550 cold-rolled steel sheets with various thicknesses from 0.55 mm to 1.0 mm at subzero temperatures down to −70 C. It was concluded that all key stresses increased with reducing temperatures for all steels, while this trend was more pronounced for G300 than G550 and more pronounced for cold-rolled steels than other types of steel. More importantly, it was found that most specimens exhibited significant fracture strain reductions from −50 C to −70 C. Park et al. [28] studied the mechanical behaviors of cold-worked 304 L and 316 L austenitic stainless steel bars at cryogenic temperatures down to 110 K (−163 C). A clear trend of increasing strengths and decreasing ductility was observed for both steels when the temperature decreased, and this trend was the most significant for both steels when the temperature decreased from 223 K (−50 C) to 153 K (−120 C). Kosaraju et al. [39] characterized a 0.6-mm thick ASS316L cold-formed steel at 0 C, −25 C, and −50 C. The results showed increasing strengths and decreasing elongations with decreasing temperatures. Yan et al. [40] studied the behavior of concrete stub columns confined by steel tubes at subzero temperatures, where they reported the material properties of the cold-rolled steel specimens cut from steel tubes with thicknesses varying from 2.75 mm to 4.50 mm at subzero temperatures down to −80 C. From the material test, it was found that both the strengths and fracture strain increased when temperatures decreased.
Among these existing CFS studies, different specimens showed significantly different behaviors, and the strengths and elongations were overall affected by the decrease in temperature. This was likely caused by the different microstructure transformations as observed in the tensile fracture morphology using scanning electron microscopy for steel at ambient and low temperatures [15,16,19,23,26,30,31,33,41,42]. Meanwhile, from the existing studies, few cover thin (e.g., less than 3 mm thick) high-strength CFS with a higher strength-to-weight ratio, thus requiring further investigation to provide reliable data for future use in the high latitude regions.
Among the different types of cold-formed high-strength steel, advanced high-strength steel (AHSS) is promising with significantly enhanced capabilities, owing to recent material science advances at the microstructural level over the past two decades, at a competitive cost [43]. AHSS is steel with unique microstructures utilizing complex deformation and phase transformation processes to achieve unprecedented combinations of strength and ductility. Macroscopically, AHSS includes new steel grades with a yield strength up to 1250 MPa, ultimate strength up to 1900 MPa, or tensile elongation upwards of 20% to 30%. The material properties of the steels are significantly dependent on the manufacturing technology and chemical composition. For example, dual-phase (DP) steel is manufactured by controlling the cooling from the two-phase ferrite plus austenite to transfer some austenite to ferrite before the rapid cooling transforms the remaining austenite to martensite. Martensitic (MS) steel is manufactured by transforming the austenite that exists during the annealing stage to martensite by cooling. Although AHSS has shown outstanding performance in the automobile industry for its excellence in stiffness, formability, and crash performance [44], its performance as a structural material is unclear because the construction industry requires different design constraints than the automobile industry does. Specifically, although there is limited research on the material properties of AHSS at ambient and elevated temperatures [45,46,47,48], the AHSS properties under the subzero temperature environment are unknown.
In this paper, an experimental investigation was carried out to determine the material properties of advanced high-strength cold-formed steel at subzero temperatures following a steady-state test protocol. The specimens were tested at various subzero temperatures from ambient down to −60 C at 20 C intervals for each steel. From the experiments, the stress–strain ( σ ε ) curves and key material properties, including elastic modulus, yield strength, ultimate strength, and elongations for the tested steels were collected and were compared with existing test data and various steel standards requirements. Additionally, predictive equations for the σ ε behaviors for AHSS at subzero temperatures were developed and verified.

2. Experimental Study

An experimental study investigating the subzero material properties of AHSS was carried out. The specimens were cut from steel sheets. However, structural members are formed by roll-forming or press-braking sheets, which affect the mechanical properties of CFS sections. Cold-forming increases the yield strength and tensile strength while decreasing the ductility [6]. The impact of cold work on the mechanical properties of steel corners depends on the steel grade/alloy, the ultimate strength-to-yield strength ratio, the inside radius-to-thickness ratio, the applied stress type and direction, and the amount of cold work. The increase in yield strength is higher for hot-rolled steel sheets than for cold-reduced sheets [6]. Experiments on the residual stresses of CFS members have shown that the cold-work effects are limited to the corner regions and do not affect the entire cross-section [49,50,51,52]. Cold work affects the corners of the cross-section; therefore, buckling or yielding begins in the flat portion due to the lower yield strength. Design provisions allow the consideration of increased yield strength of corners for a specific range of inside radius to thickness ratio and ultimate strength to yield strength ratio. However, for all situations, the mechanical properties of the plain material can be used [53]. Therefore, this study on determining the effect of subzero temperatures on AHSS cut from steel sheets is applicable and relevant to cold-formed structural sections.

2.1. Test Apparatus

The experimental study was carried out in the Manufacturing and Mechanics Laboratory at the University of Wisconsin-Madison. An ADMET F-280DT environmental test chamber with the capability of active heating and cooling from −80 C to 200 C was used to obtain the target subzero temperature environment. The chamber was connected to an Airgas liquid cylinder, which input the liquid nitrogen into the chamber for the cooling stage. The target temperature inside the chamber was controlled using an Omron E5AC digital temperature controller, which could set the target temperature and display the present temperatures and real-time cooling rate. The present temperature reading was measured using three thermocouples attached to the chamber’s internal surfaces, where one thermocouple was placed on the top surface and the other two were on the two side surfaces. The cooling rate was controlled with the temperature controller. Generally, the cooling rate was approximately 5 C/min at the start of the cooling stage, and it gradually decreased when the chamber temperature approached the target temperature. The chamber was mounted on a 100 kN loading capacity ADMET eXpert 1600 Series hydraulic testing frame with specially designed subzero temperature-resistant tension grips. The loading process of the tensile test was controlled using MTESTQuattro software, which can control the loading rate and stopping criterion and record and output the test data. The setup of the experiment is shown in Figure 1.
The strain was measured using an MTS model 632.12B-20 extensometer, which is subzero temperature resistant. It originally had a gauge length of 25.4 mm (1 inch) and a maximum displacement of 12.7 mm (0.5 inches). The gauge length of the test specimen was designed as 50.8 mm (2 inches) per ASTM E8 [54] (refer to Section 2.2). To ensure the fracture of the specimen would occur inside the gauge of the extensometer, a 25.4 mm (1 inch) extender was manufactured and fixed to the original extensometer. As the extender could not displace, the extensometer now had a 50.8 mm (2 inches) gauge length with a 25% maximum strain measurement range.

2.2. Test Materials and Specimens

The tensile specimens were cut from various steel sheets, including three AHSS steel sheets with two thicknesses and three different grades. Although the material properties of the steel sheets might be affected by the manufacturing processes (e.g., the galvanizing process for coated steel sheets [35]), the purpose of this test is to investigate the subzero material properties of the steel sheets as finished structural products only, where the steel sheets could be directly used in structural engineering practices. The materials were labeled with their steel families and nominal yield and ultimate strengths (in MPa) following the nomenclature adopted in [43], i.e., DP-580/980, MS-1030/1300, and MS-1200/1500. For comparison of AHSS to mild and high-strength steel, specimens cut from a conventional mild CFS sheet (Mild-395/450) and a conventional high-strength CFS sheet (HSLA-700/980) were also studied. All AHSS and HSLA-700/980 steel sheets were kindly donated by US Steel, and Mild-395/450 steel sheets were kindly donated by Rack Manufacturers Association together with catalog information of these steel sheets. The chemical composition of the five steel sheets is listed in Table 1, which is provided by the steel manufacturers. Nominal information of the steel sheets, including the nominal yield strength σ n y , nominal ultimate strength σ n u , nominal thickness t n , and coating, is given in Table 2.
The specimens were cut along the rolling direction of the steel sheets using a waterjet in the TeamLab at UW-Madison. The dimension of the specimen was designed per ASTM E8 [54]. Although ASTM E8 [54] permits both mm and inches, the unit system of inches was required by the waterjet. The specimen dimensions have a length of 203.2 mm (8 inches), a width of 12.7 mm (0.5 inches), and a reduced parallel section length of 57.15 mm (2.25 inches), as shown in Figure 2. For each test temperature, two specimens each were tested for AHSS and HSLA steels, while one specimen was tested for mild steel. Mild steel has previously been tested at subzero temperatures [38,40], therefore, this test was for validation, and one sample for mild steel was sufficient. The specimen was labeled with its sheet designation (e.g., DP-580/980) plus its target test temperature in Celsius (e.g., +20 for ambient and −20 for −20 C) and the test number (e.g., 1 or 2). The actual width and thickness for the reduced parallel section of each specimen were measured to determine the initial cross-section area before the test. For each specimen, the width and thickness were measured at the center and two ends of the reduced parallel section, and the average of the three readings was used. The width was measured using a caliper with a precision of 0.01 mm, and the thickness was measured using a micrometer with a precision of 0.001 mm. For coated HSLA specimens, four specimens were used to measure the total thickness of the coating layers on both sides t c b ; because the coating layer did not carry loads, the coating thickness should be subtracted from the measured total thickness to obtain the base metal thickness [55]. The zinc coating of the four HSLA specimens was removed by immersing the specimens into one molar hydrochloric acid until the complete reaction. The thicknesses before and after the removal of the zinc coating were measured, and their difference was calculated as t c b . The average t c b for the four HSLA specimens was 0.04 mm, and it was used as the total thickness of the coating layers on both sides for other HSLA specimens without coating removal, as used in the steady-state subzero tensile test. The zinc coating of HSLA specimens was removed by immersing the specimens into one molar hydrochloric acid until the complete reaction. The thicknesses before and after the removal of the zinc coating were measured. The average thickness difference was 0.04 mm, and it was used as the coating thickness for HSLA specimens. The measured width (b) and uncoated thickness (t) of the reduced parallel section for each specimen are shown in Table 3.

2.3. Test Procedures

The steady-state test protocol was adopted in this study, where the material properties of the steels at a steady subzero temperature were measured using a uniaxial tensile test. The target test temperatures included ambient (represented by 20 C), 0 C, −20 C, −40 C, and −60 C. Although the lowest natural temperature in Earth’s recorded history is below −60 C [56], the lowest test temperature was selected as −60 C because the recorded lowest natural temperatures in the high latitude regions with frequent human activities since the twenty-first century has been above −60 C [1,57]. Each test was divided into two stages, the cooling stage and the loading stage. At the beginning of the test, the specimen was clamped vertically using the two grips of the testing frame, and the extensometer was placed at the center of the specimen. The chamber door was then closed, and the cooling stage began. As a result of the cooling, thermal tensile stresses were introduced into the specimen due to thermal shrinkage. The position of the bottom grip was manually adjusted upwards using fine-tune controls during the cooling stage to maintain the thermal tensile load below 100 N. After the target temperature on the digital temperature controller was achieved and stabilized in the chamber, the specimen was conditioned for another twenty minutes to guarantee uniform distribution of the target temperature within the specimen. The position of the bottom grip was fine-tuned during the conditioning phase to maintain the tension in the specimen below 100 N as the internal temperature of the specimen equilibrated with the target temperate in the chamber.
After cooling and conditioning, the loading stage began, where the tensile load was applied to the specimen until specimen fracture. The tensile load was applied in a displacement control manner with a loading rate of 0.4 mm/min. This corresponded to a strain rate of 0.007/min, which met the strain rate requirement of 0.005 ± 0.002 [54]. The data collection rate was set as 10 Hz. The fracture criterion for the specimen was defined as a sudden drop of more than 10% of the applied load between two successive data points in the MTESTQuattro software. When the fracture criterion was activated, the first point of the two successive data points was regarded as the fracture point for the test.
In addition to the 50.8 mm gauge length extensometer, a grid method was also adopted to depict the elongation distribution along the specimen’s longitudinal direction. This enabled the elongation measurements over the full length of the reduced parallel section, over the regions with minimal deformation, and elongation measurements at the fracture position. The grid method has been used previously to measure elongations over various gauge lengths [58], and elongations over various gauge lengths are needed to determine ductility [59].
Before the test, uniformly distributed grids were drawn on the specimen center using Nalgene Cryoware markers, in which the ink was fade resistant at low temperatures (Figure 3). The spacing between adjacent grids was 2.5 mm. When the loading was completed, the fractured specimens were removed from the chamber and returned to ambient temperature. After several hours, the spacing between various numbers of grids around the fracture position was then measured using a digital caliper. The local ( ε 7.5 and ε 12.5 ), uniform ( ε 37.5 ), and overall ( ε 25 and ε 50 ) elongations at various gauge lengths are illustrated in Figure 3. Following the requirements of [59], the elongations were calculated using the spacing before and after the test, as shown in Equation (1):
ε g l = L g l L g l 0 L g l 0
where L g l and L g l 0 are the lengths after and before the test, respectively, along specimen length between grids for ε g l as notated in Figure 3, and the subscript g l represents the gauge length of interest.

3. Experiment Results

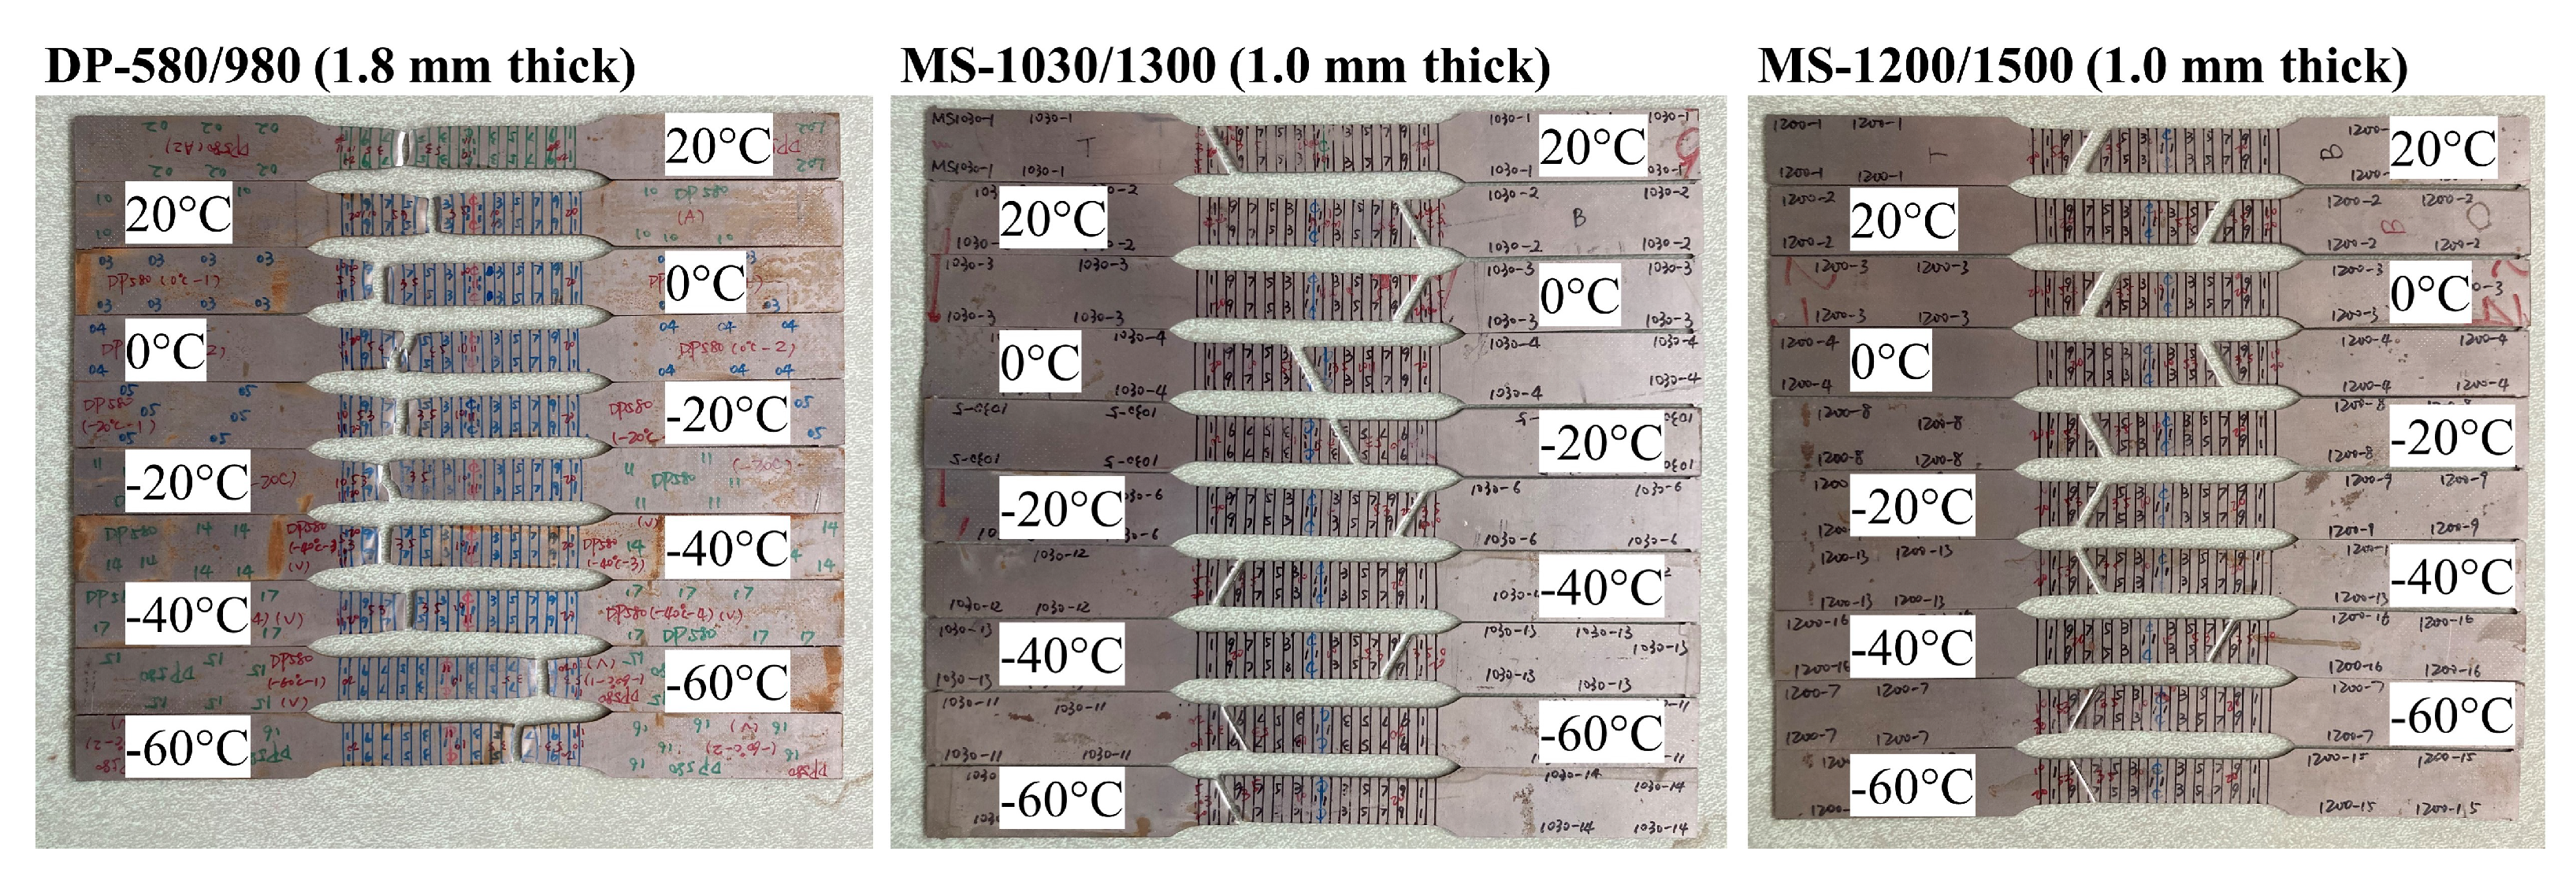
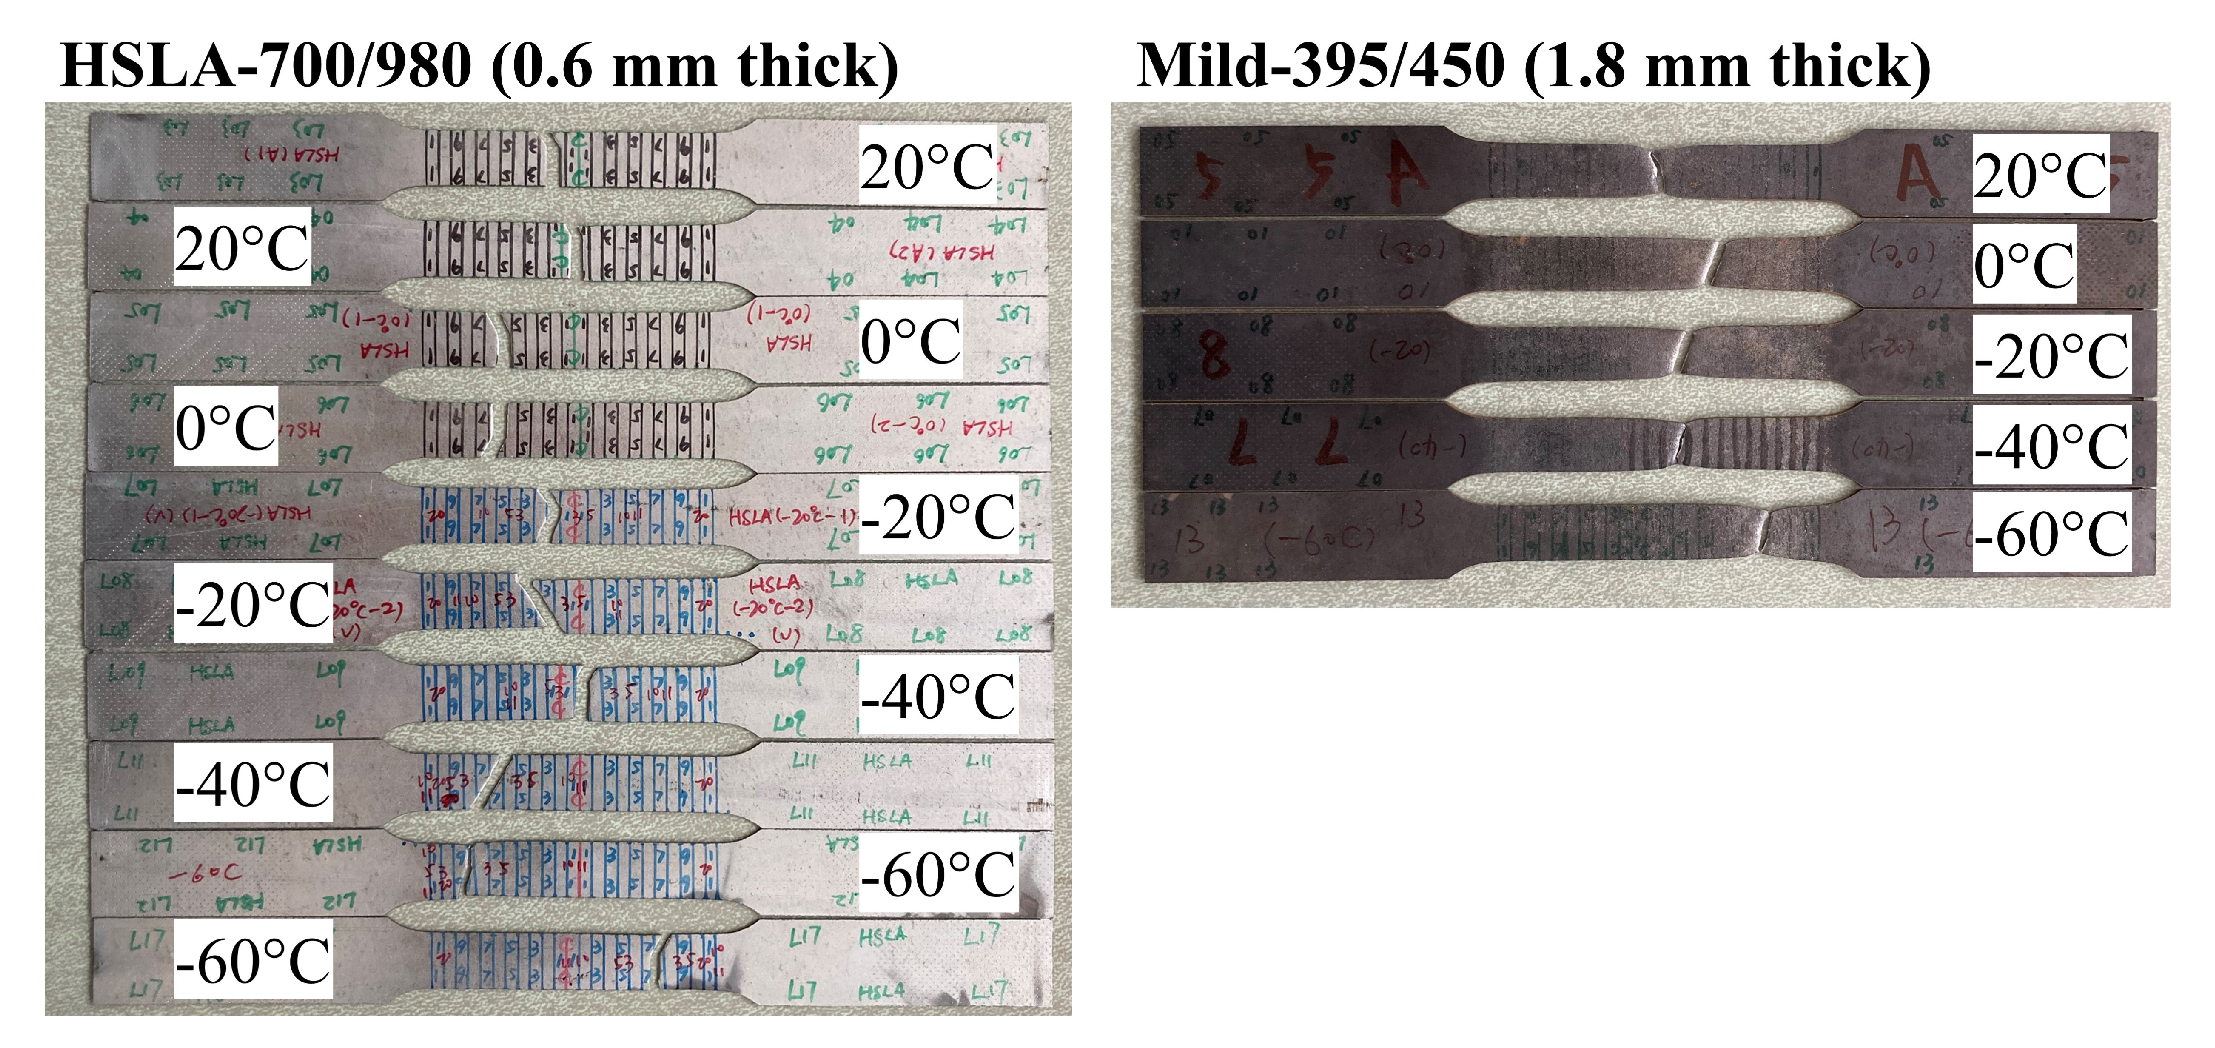
The failed specimens of the steady-state tensile tests at subzero temperatures are shown in Figure 4 and Figure 5. All specimens were fractured within the reduced parallel section. Significant necking was observed for DP-580/980 and Mild-395/450 steel sheets at both ambient and subzero temperatures. However, no noticeable necking was observed for HSLA-700/980, MS-1030/1300, and MS-1200/1500 at any tested temperatures, and the specimens fractured in relatively brittle modes. The observations indicated the fracture modes of the tested AHSS, HSLA-700/980, and Mild-395/450 were not affected by exposure to subzero temperatures down to −60 C. The major results of the subzero temperature steady-state tests are the σ ε relationship and the elongations measured at various gauge lengths.

3.1. Stress–Strain Curves

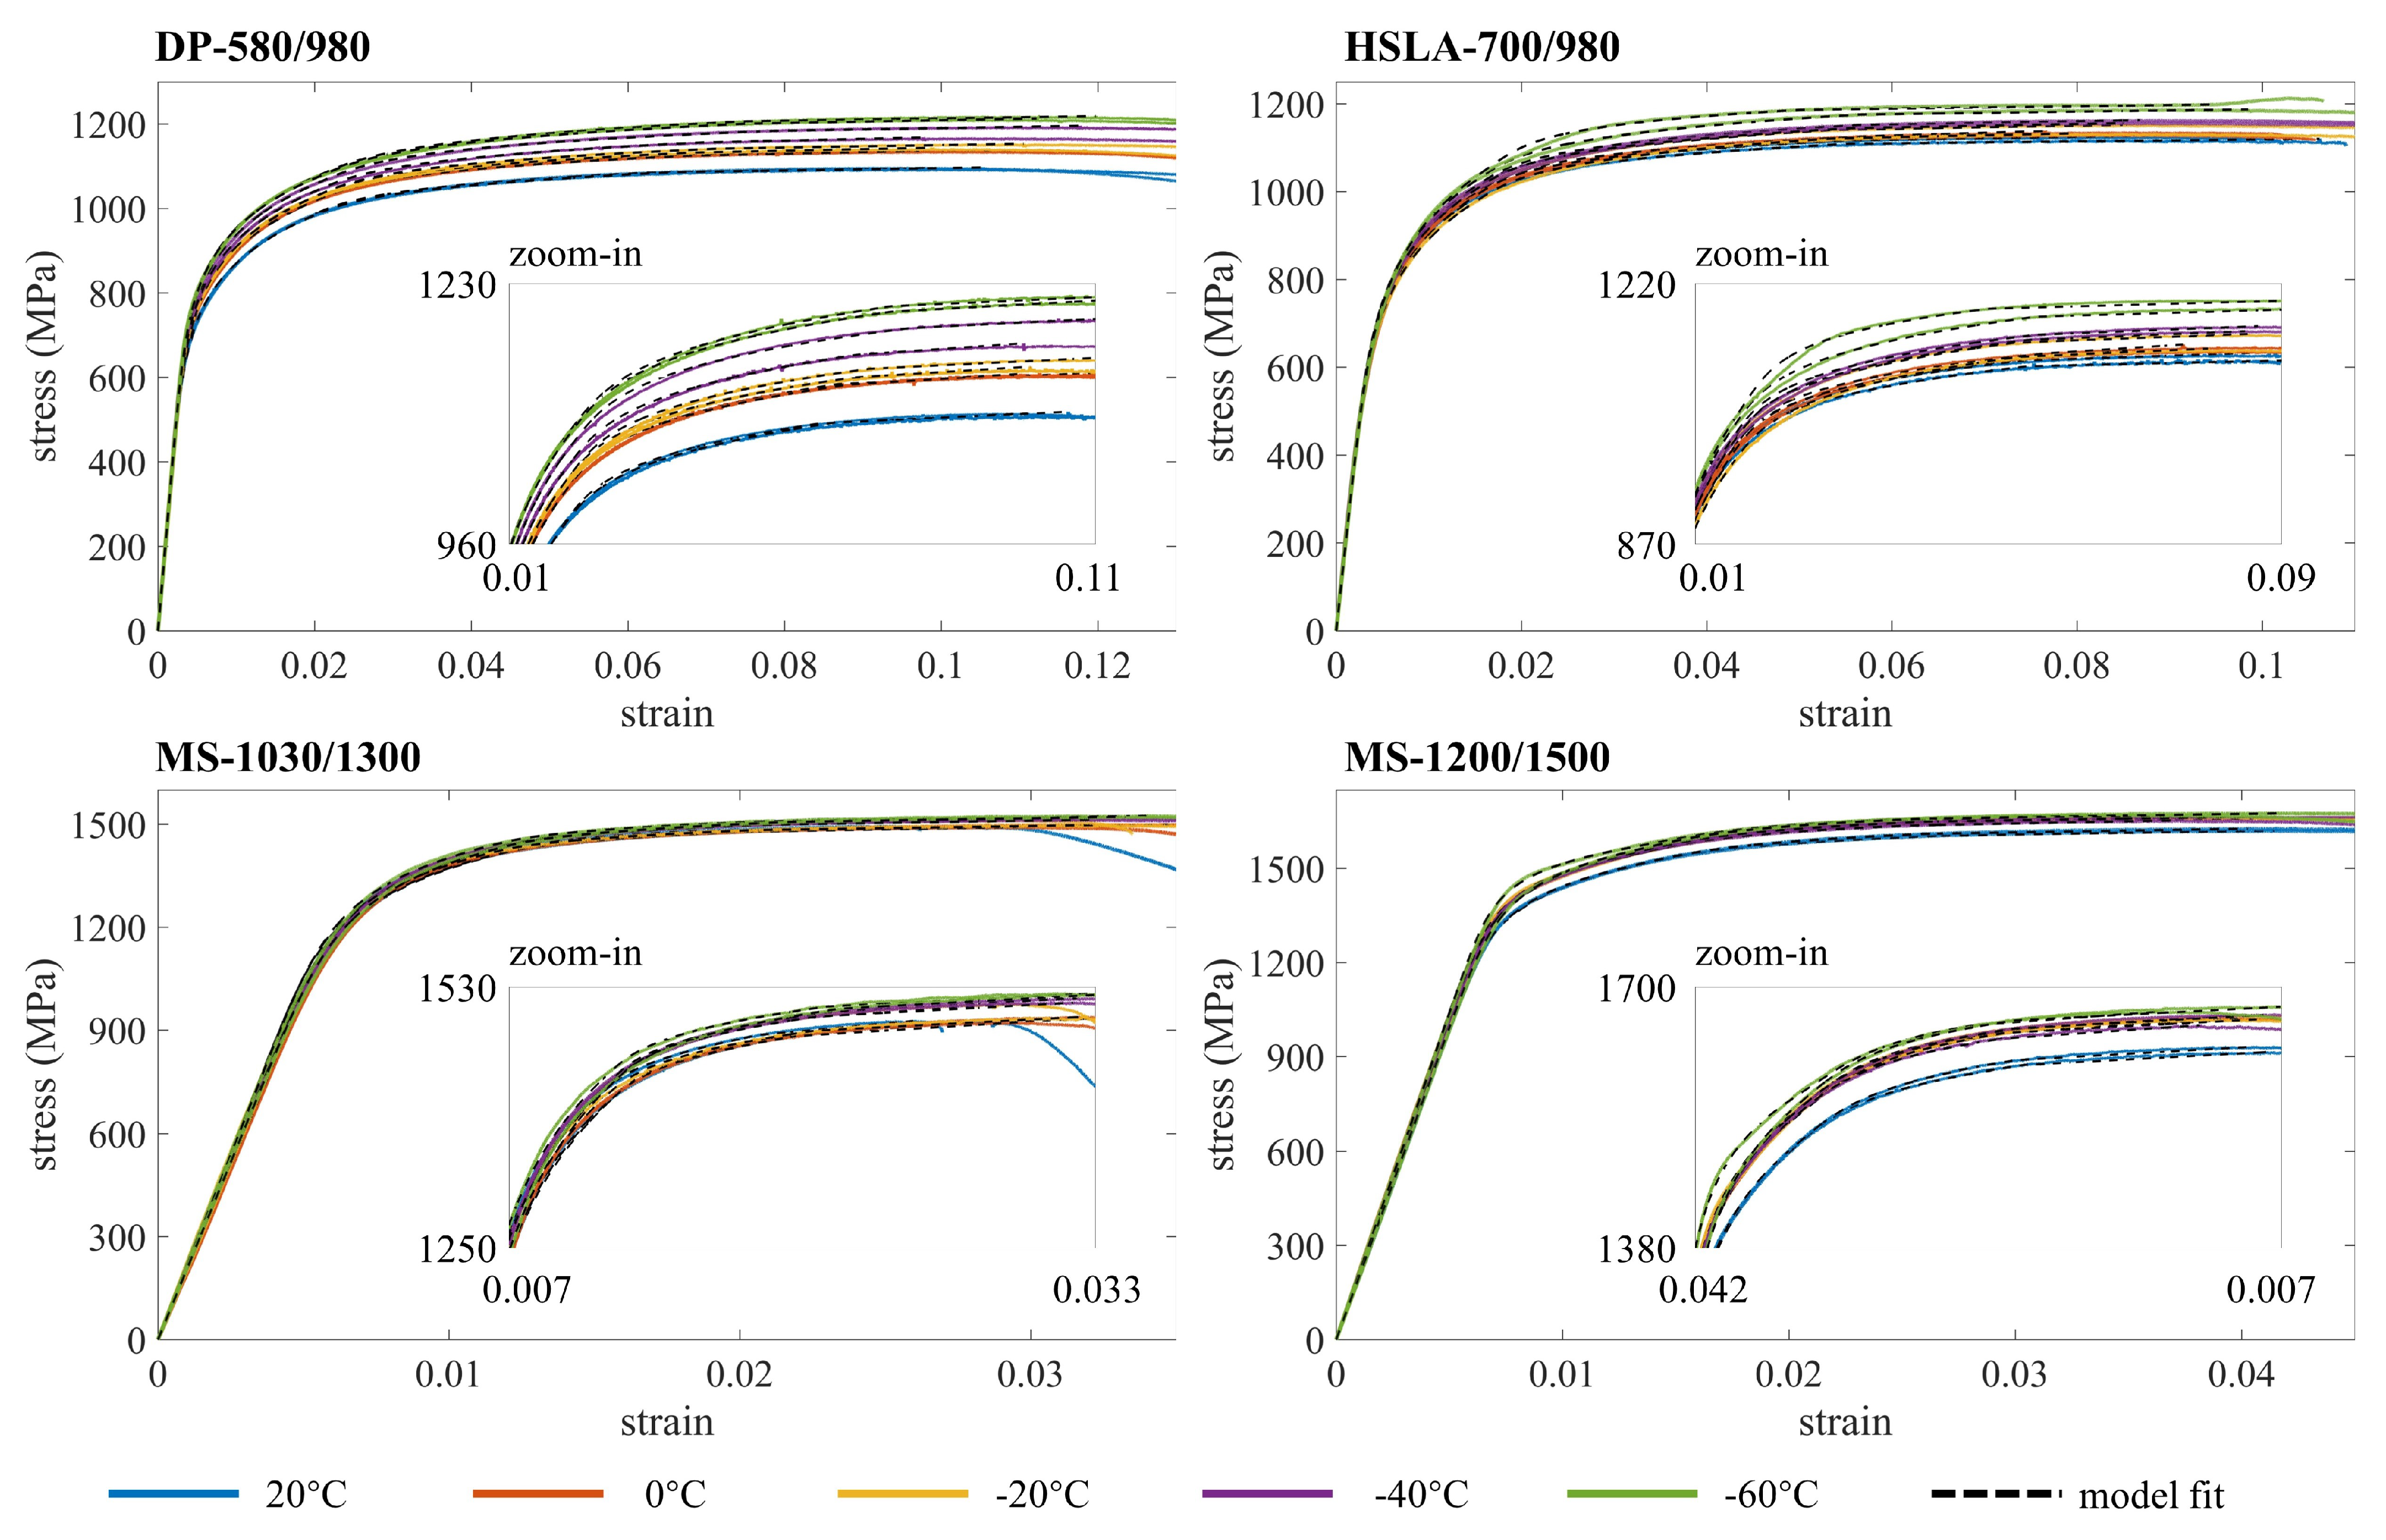
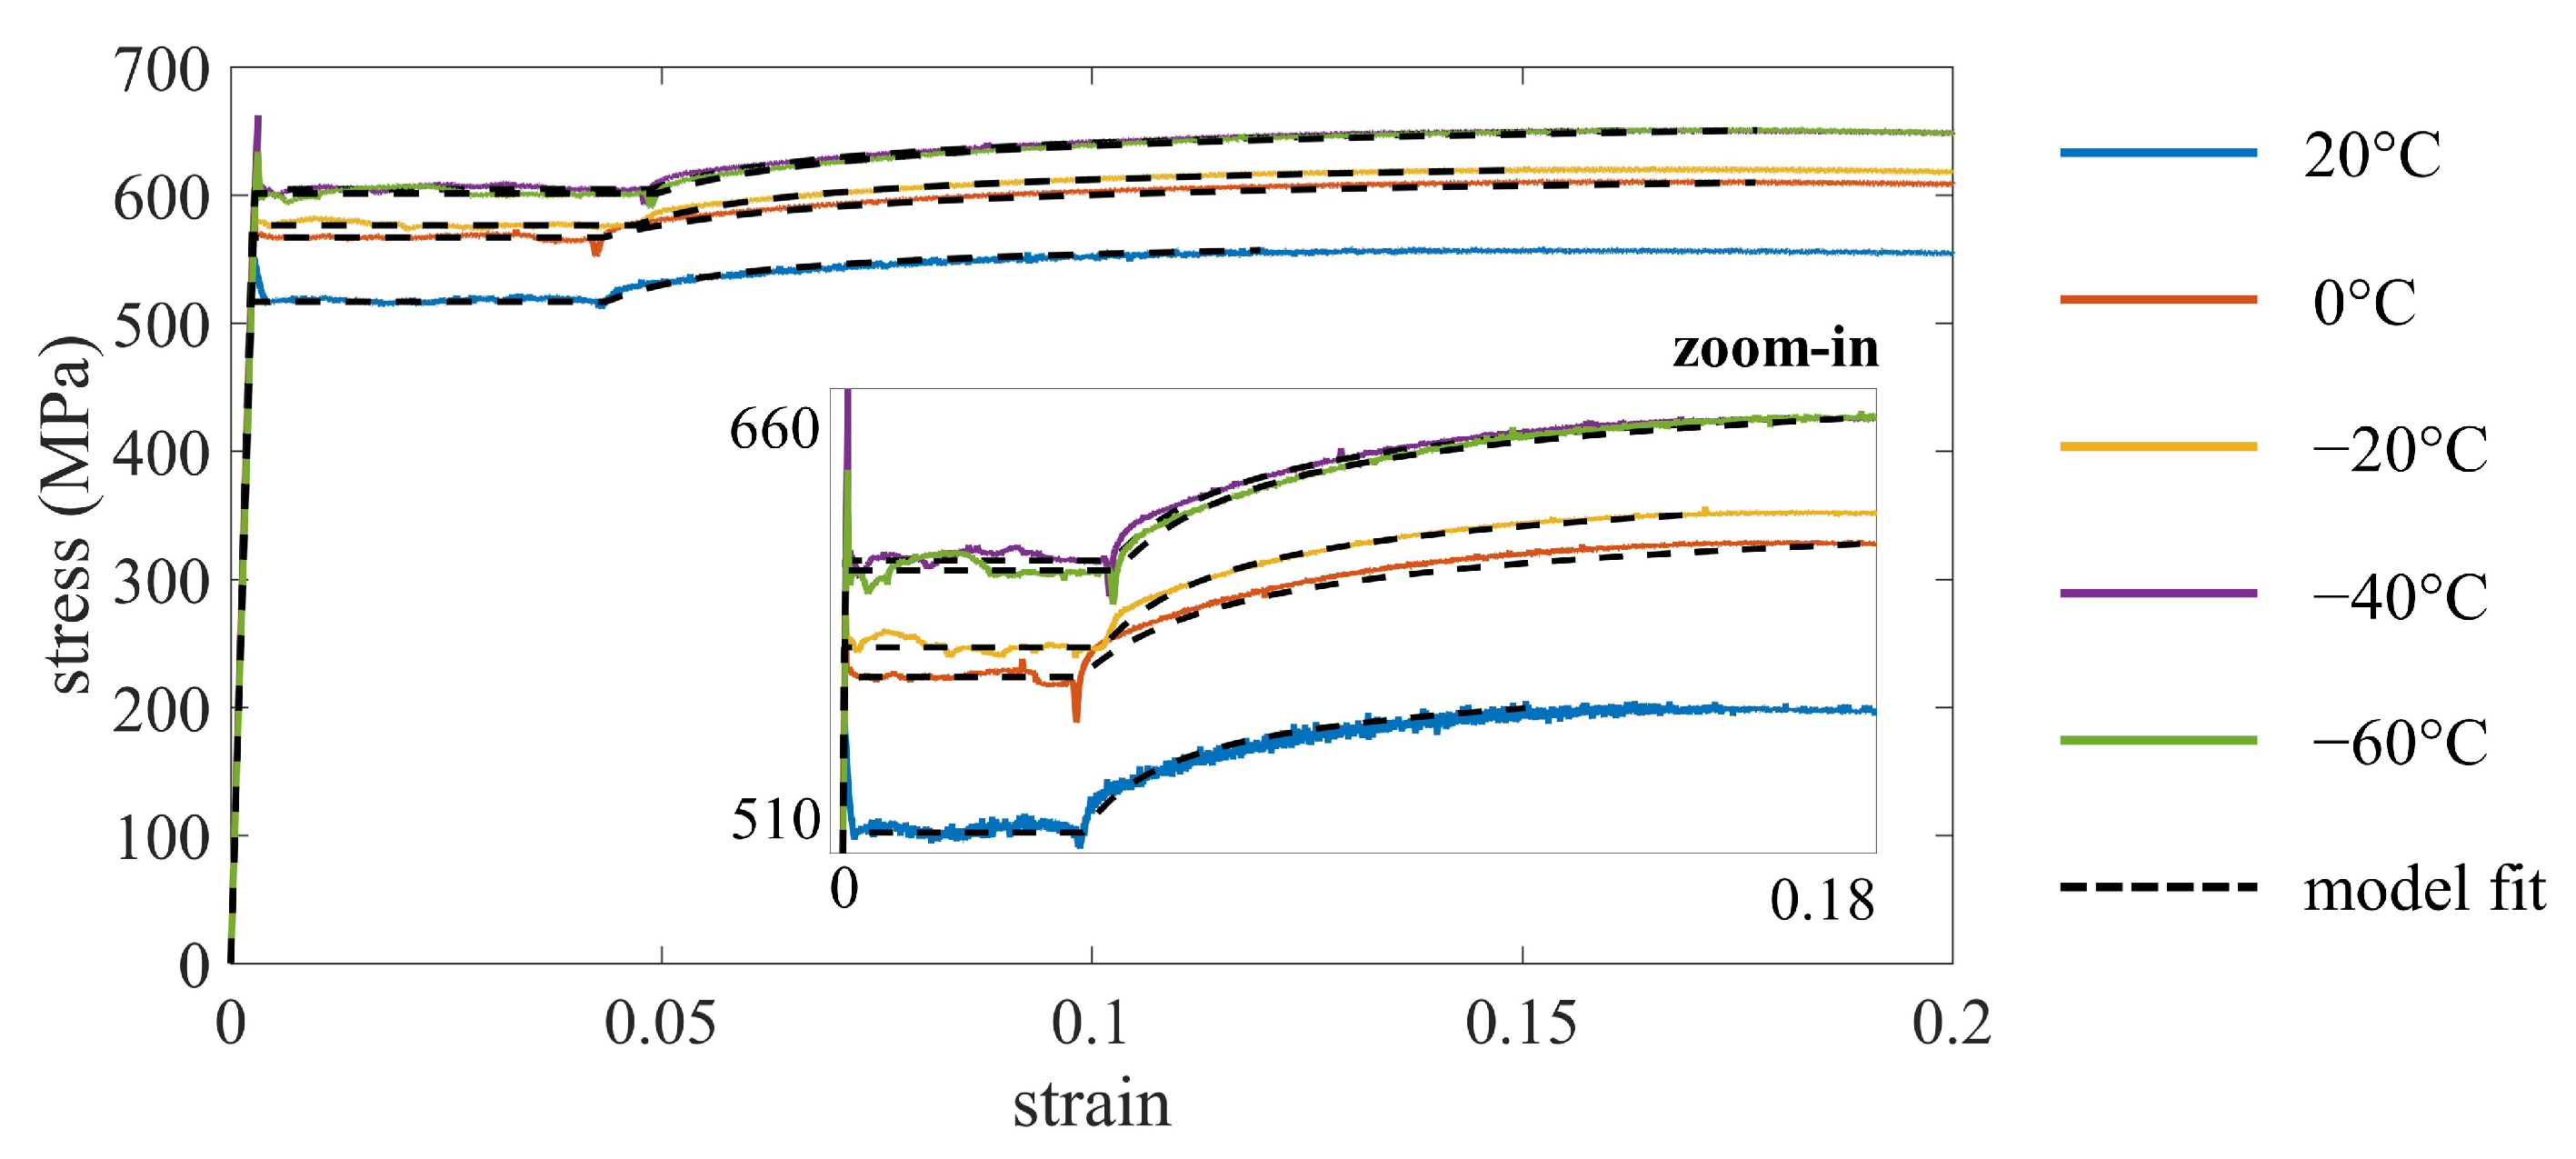
The stress was calculated as the applied load divided by the initial cross-section area of the reduced parallel section (measured b and t given in Table 3). The strain was measured using the extensometer. The σ ε curves at subzero temperature for each specimen of AHSS and HSLA steel are shown in Figure 6, and those for each specimen of mild steel are shown in Figure 7.
For AHSS and HSLA-700/980, rounded σ ε curves without a distinct yield point are observed for both ambient and subzero temperature tests. At ambient temperatures, the nonlinearity of the σ ε curve around the yield is the greatest for DP-580/980 and is reduced for HSLA-700/980, MS-1030/1300, and MS-1200/1500 (in decreasing order). As the test temperature T decreases, the steel strength tends to increase, and the nonlinearity of the σ ε curve tends to decrease. This trend is more significant for DP-580/980 and HSLA-700/980 than for MS-1030/1300 and MS-1200/1500. The fracture of HSLA specimens occurred closely after reaching the ultimate point, while for DP-580/980, MS-1030/1300, and MS-1200/1500, noticeable strain-softening processes occurred after reaching the ultimate point. For all steels, no noticeable effect on the strain-softening portion of the σ ε curve resulted from the decrease of temperature T.
Mild-395/450 did not have rounded stress–strain curves like AHSS and HSLA but rather curves with a distinct upper yield point, a yield point, and a yield plateau for all test temperatures. The yield and ultimate strengths of Mild-395/450 increased when the test temperature decreased. This trend was significant when the temperature decreased from ambient to 0 C and from −20 C to −40 C. For all tests, no fracture was observed at the extensometer strain measurement limit of 25%. Thus, the fracture elongation was not measured from the extensometer. Instead, ε 50 was calculated using the grid method and is reported as the fracture elongation for Mild-395/450. In addition, to prevent damage to the extensometer, the test was paused once the extensometer reached its maximum limit, and the extensometer was quickly detached. Afterward, the cooling and conditioning stages were repeated, and the loading process was then resumed until specimen fracture. Therefore, the σ ε curve up to 25% strain and the elongations at fracture measured using the grid method are reported, while the σ ε curve after reaching 25% strain is not reported. Although the fracture point is not observed from the σ ε curve, the ultimate point was captured for all tests (i.e., the ultimate strains are less than 25%).

3.2. Material Properties

Important material properties extracted from the σ ε curves are shown in Table 3, which includes elastic modulus E T , 0.2% proof stress σ 0.2 T and its strain ε 0.2 T = 0.002 + σ 0.2 T / E T , stress at 2% total strain σ 2.0 T , ultimate strength σ u T and ultimate strain ε u T , fracture strength σ f T , and elongation strain ε f T . The subscript T represents the material property at test temperature T.

3.2.1. Elastic Modulus

E T is defined as the slope of the initial linear elastic portion of the σ ε curve. However, for those showing rounded σ ε behaviors (e.g., AHSS and HSLA-700/980), defining the linear elastic portion is challenging. Huang and Young [55] recommended defining the linear portion for the rounded σ ε curve based on the metal grade and type (e.g., carbon steel, lean duplex stainless steel, and aluminum) where the slope of the linear regression on all σ ε data between 20% and 45% of the nominal yield strength is calculated as E for the ambient condition. For the subzero temperature cases, the nominal yield strength at ambient might not provide accurate results following this recommendation because of the strength increase with decreasing temperature observed from the experiments. The authors previously developed a method [48] to approximate the nominal yield strength at elevated temperature, and this methodology is adopted in this study, where the ratio between the nominal yield strengths at T ( σ n y T ) and ambient ( σ n y 20 ) is proportioned to the ratio between the ultimate strength at T ( σ u T ) and ambient ( σ u 20 ), as calculated in Equation (2). By adopting this method, the resulting coefficient of determination R 2 between the linear regression and the test data of the selected data range (between 20% and 45% of the adjusted nominal yield strength σ n y T ) for all steels at all test temperatures is larger than 0.99, which indicates the strong linearity of the selected data ranges and thus demonstrates the method validity. The elastic moduli for AHSS and HSLA steel fluctuate slightly without a clear trend with decreasing temperature. The differences between the average E T and E 20 for all AHSS and HSLA steels are within ±4%. For Mild-395/450, however, a decreasing trend for E T is observed with decreasing temperature with an exception at −20 C. The most significant decrease is observed at −60 C where E 60 is 93% of E 20 .
σ n y T = σ n y 20 × σ u T σ u 20

3.2.2. Key Stresses

Yield strength ( σ y T ) for AHSS and HSLA cannot be easily defined, for no distinct yield point was observed from the experiments. The 0.2% proof stress ( σ 0.2 T , the stress with a plastic strain of 0.002) is commonly used as the yield strength for metals with a rounded σ ε curve but without a distinct yield point, and therefore is reported to represent the yield strength. In addition, the stress at 2.0% total strain ( σ 2.0 T ) is also reported, which depicts the steel strain hardening process. As temperature decreases, σ 0.2 T and σ 2.0 T increase for all steels, although for varying amounts. Mild-395/450 shows the largest increase of over 16% between ambient and −60 C (although minimal change between −40 C and −60 C), followed by DP-580/980, MS-1200/1500, HSLA-700/980, and lastly, MS-1030/1300, which shows the smallest increase of 2% from ambient to −60 C.
Uniquely for Mild-395/450, an overshoot was observed at the end of the linear portion, followed by a small stress drop before the yield plateau. The peak stress of the overshoot is the upper yield strength σ u y T , and the stress at the yield plateau is reported as the yield strength σ y T , as shown in Table 4. Table 3 and Table 4 show that the differences among σ y T , σ 0.2 T , and σ 2.0 T at any tested temperature are within 0.8%, which indicates a relatively constant yield plateau stress. Similar to σ 0.2 T and σ 2.0 T for Mild-395/450, σ y T and σ u y T increase with a decreasing T down to −40 C, with minimal change between −40 C and −60 C.
The ultimate stress, σ u T , is defined as the peak stress of the nonlinear strain hardening and softening portion. As temperature decreases, the ultimate stress tends to increase. This trend is significant for Mild-395/450 and DP-580/980, moderate for HSLA-700/980, and insignificant for MS-1030/1300 and MS-1200/1500. The stress at specimen fracture, σ f T , occurs when the specimen fractures, which is depicted on the σ ε curve as a significant stress drop between two consecutive data points. As T decreases, only σ f T for DP-580/980 shows a clear increasing trend, while, for HSLA-700/980, MS-1030/1300, and MS-1200/1500, the effect of the low temperature on σ f T is not apparent.

3.2.3. Key Strains and Elongations

Yield strain ε y T and ultimate strain ε u T are essential to depict the steel strain hardening process and develop an ideal constitutive model, where ε y T = ε 0.2 T = 0.002 + σ 0.2 T / E T for AHSS and HSLA (Table 3) and ε y T = σ y T / E T for Mild-395/450 (Table 4). The yield strain ε y T is dependent on the yield strength and elastic modulus. As the elastic modulus E T is overall unaffected by the test temperature, the relationship between the yield strain ε y T and T is similar to the relationship between the yield strength σ y T and T. Specifically, the yield strain ε y T tends to increase when T decreases for each steel, while the increase is more significant for Mild-395/450 and DP-580/980. The ultimate strain ε u T varies for each test, and there is no obvious trend with decreasing temperature. The strain at the end of the yield plateau ( ε s h T ) is also important for steel with a distinct yield point and yield plateau (e.g., Mild-395/450). As shown in Table 4, there is a clear increasing trend of ε s h T with decreasing temperature T for Mild-395/450.
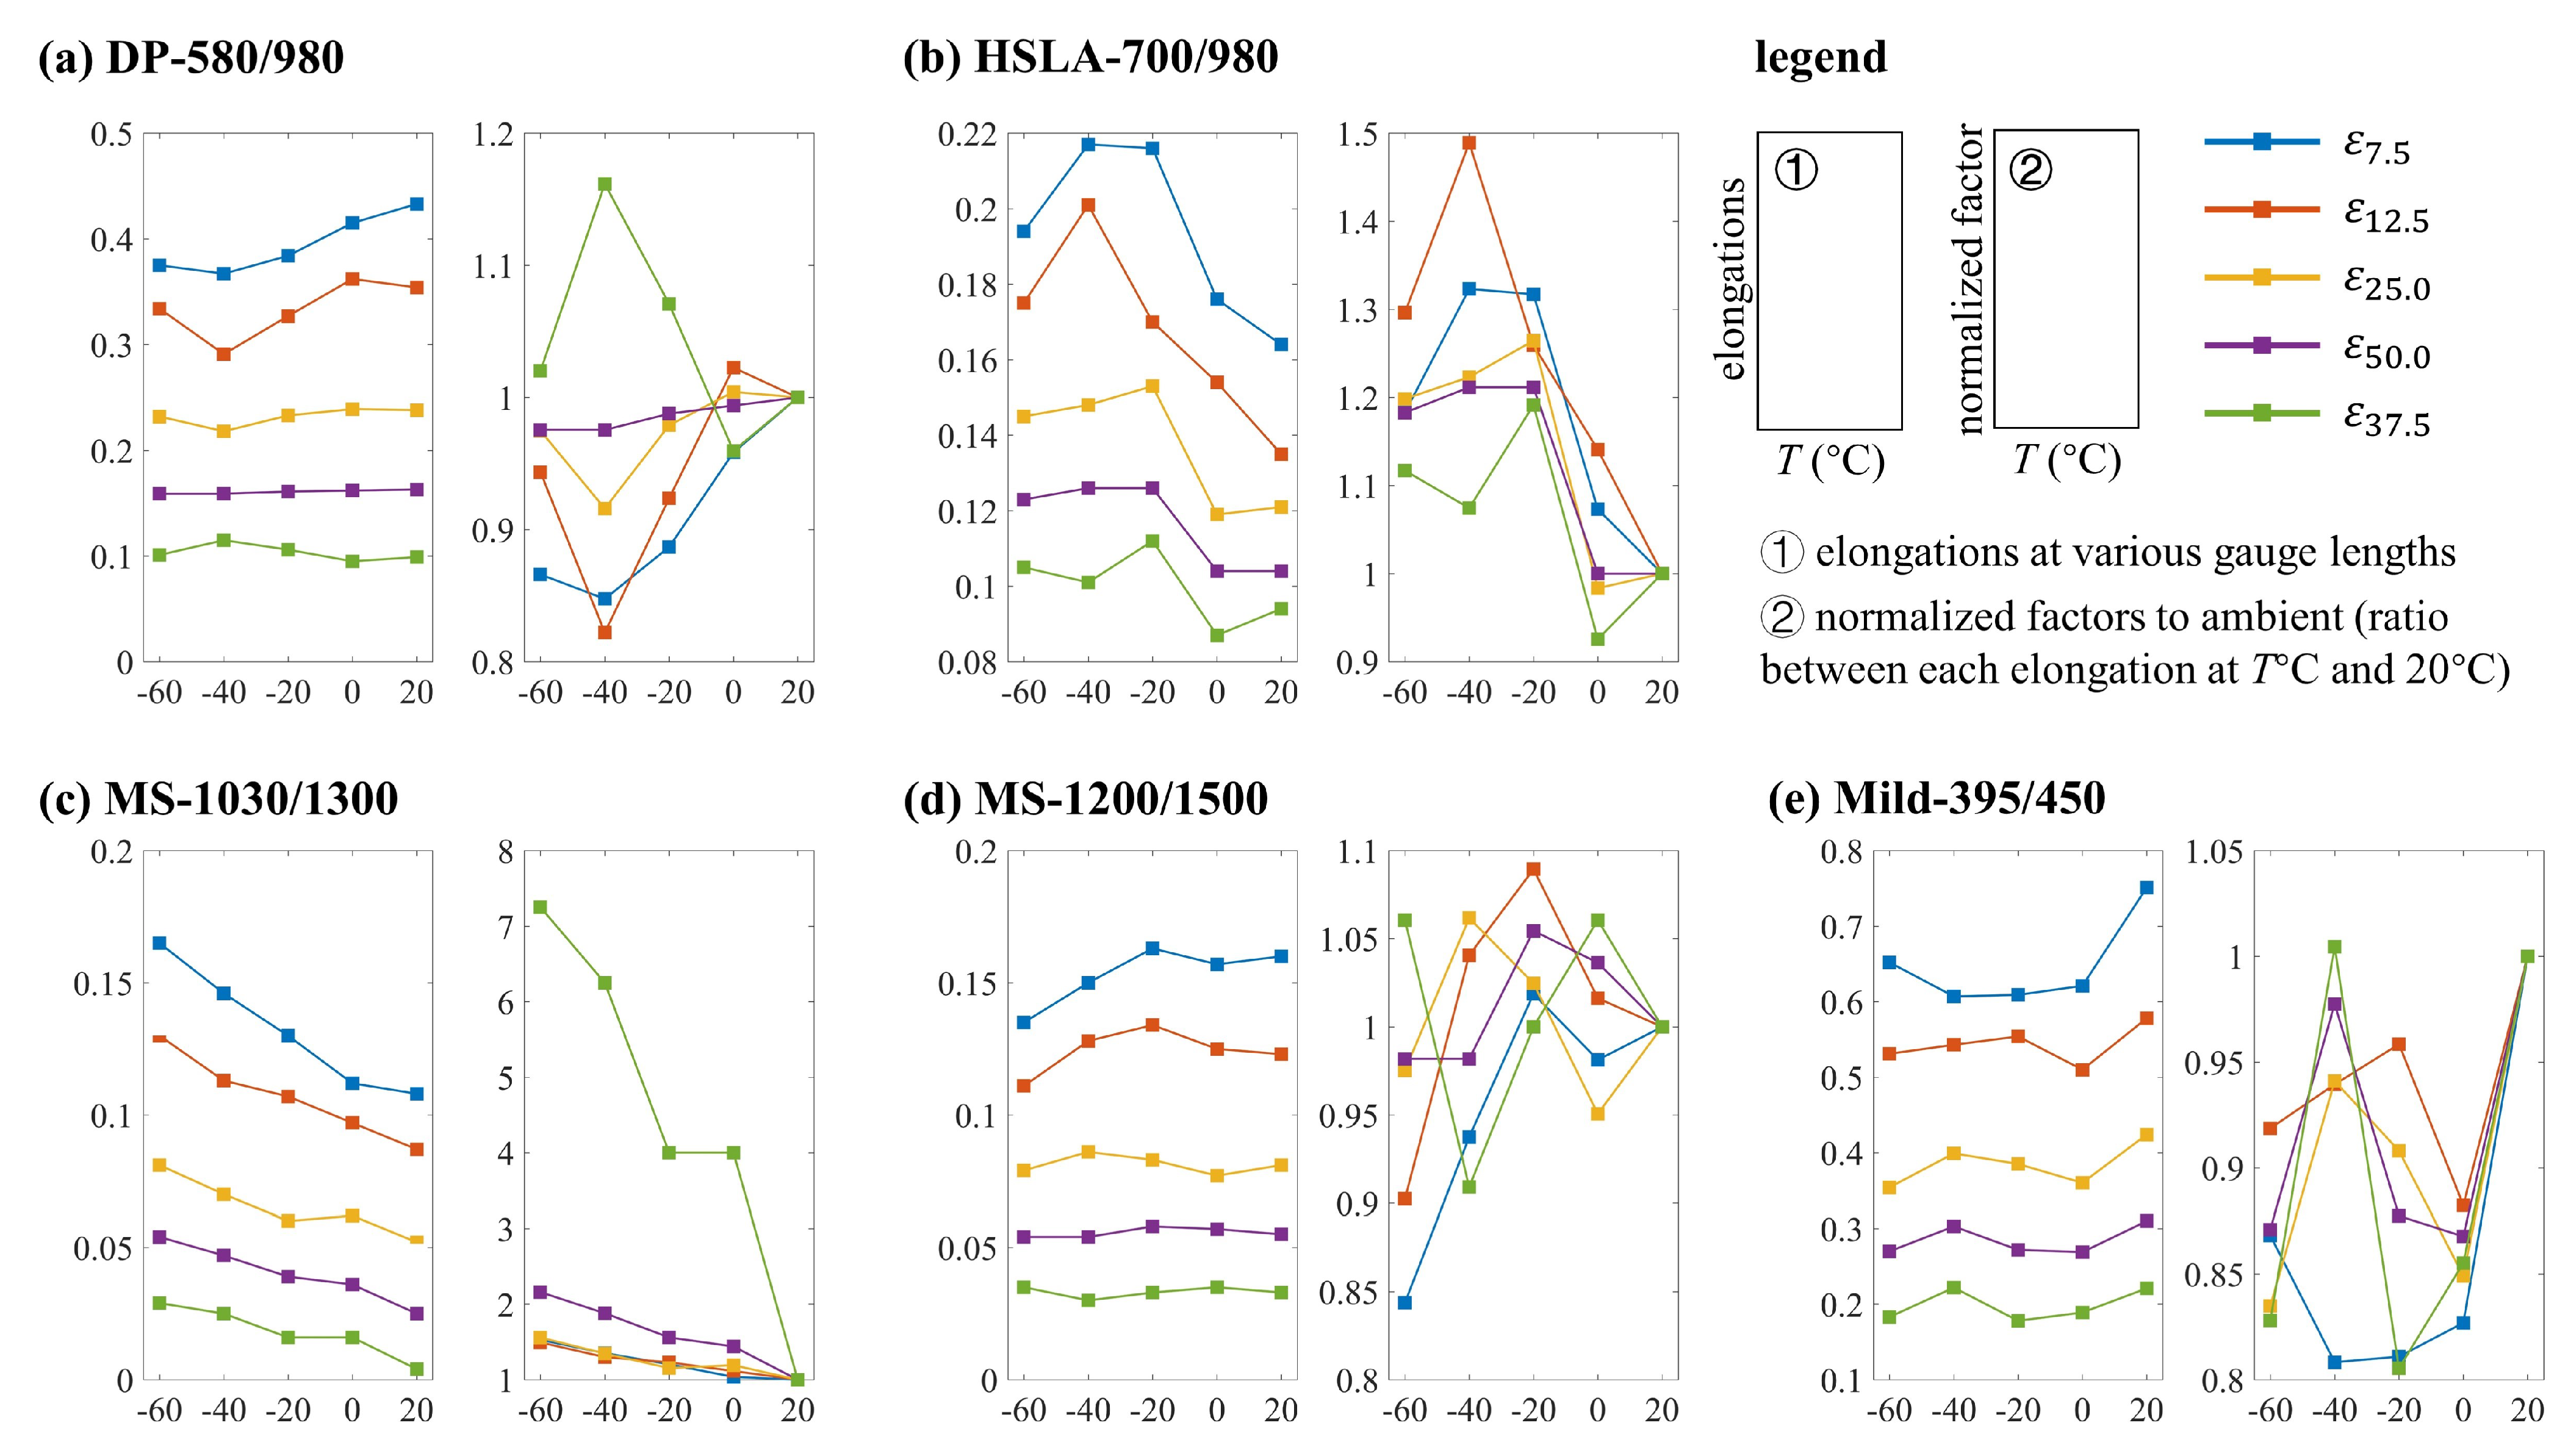
Elongation at fracture, ε f T , is one of the most critical material properties that depicts steel ductility. The strains at fracture measured using the extensometer are reported in Table 3. In addition, the average elongations for different gauge lengths measured using the grid method for each steel are defined and shown in Figure 8. Generally, ε 7.5 T > ε 12.5 T > ε 25.0 T > ε 50.0 T > ε 37.5 T for each steel at each test temperature. Recall that ε 7.5 and ε 12.5 are considered local elongations, ε 37.5 is a uniform elongation, and ε 25.0 and ε 50.0 are considered overall elongations.
Overall trends in elongation versus temperature are more obvious when viewing the normalized elongations in Figure 8. For MS-1030/1300, increasing trends are observed for all elongations when T decreases, and the uniform elongation is the most affected by subzero temperatures. For DP-580/980, HSLA-700/980, and Mild-395/450, there are anomalies in the elongation trends at −40 C. There are no clear trends for MS-1200/1500 with decreasing temperature.

4. Discussion on Experimental Results

This section compares the effect of subzero temperatures on AHSS material properties with other types of steel. This comparison includes conventional and high-strength CFS sheets/plates [37,38,40], as introduced in Section 1, hot-rolled steel (HRS) specimens including HRS bar/strand/headed studs [10,11,17,18,19,20,60], and HRS sheets/plates [13,16,21,22,32,34]. The trends of the material properties variations associated with temperature decrease for different steels are reported and then compared with AHSS, HSLA, and mild steel in this study. The normalized factor for each material property, which is the ratio of the material property at the subzero temperature T to ambient, is calculated to depict the effects of subzero temperature on different steels. The existing data is divided into three categories: CFS sheets/plates, HRS bar/strand/headed studs, and HRS sheets/plates. The comparisons among AHSS, HSLA, and mild steel and the existing test data for elastic modulus, yield strength, ultimate strength, yield strain, ultimate strain, and overall elongation are shown in this section.

4.1. Comparison of Key Material Properties

For the elastic modulus shown in Figure 9, most data, including for AHSS and HSLA steel, does not show significant change with temperature decrease, the majority being within 95% to 120% of the ambient value. The largest decrease is for a 3 mm thick S316 stainless steel plate, which shows a 9% decrease at −30 C [34]. In contrast, a few HRS specimens (12 mm thick mild steel plate [13], 6 mm thick Q690 HSS plate [21], S30408 steel plate [32], and S316 stainless steel plate [34] with various thicknesses) show increases over 20% at subzero temperatures, which are above the dashed line shown in Figure 9.
For the yield strength shown in Figure 10a, most data exhibits an increasing trend with decreasing temperature, with the increase typically within 30% of the ambient values. Some of this data shows minimal increases within 5% at low temperatures compared with the ambient values, including HSLA-700/980 and MS-1030/1300. The S355 sheet [42] is the only case that shows a decrease at subzero temperatures, with a decrease of only 2%. The data with an increase greater than 30% are above the dashed line in Figure 10a, including G300 CFS sheets with thicknesses varying from 0.55 mm to 1.00 mm [38], which have 33% to 75% greater yield strengths at −50 C and −70 C than at ambient, as well as S30408 and S316 stainless steel plates with thicknesses varying from 3 mm to 6 mm [32,34], which have 32% to 42% greater yield strengths at −60 C and −80 C than at ambient.
For the ultimate strength, shown in Figure 10b, the effect of decreasing temperature is similar to the effect on yield strength. Increased ultimate strengths are observed in most studies where most steels possess an increase within 30% of the ambient values. The increase is more pronounced for G300 CFS sheets [38], which show approximately a 50% increase at −70 C compared to the ambient values, and S30408 and S316 stainless steel plates [32,34], which show 34% to 98% increase at subzero temperatures compared to the ambient values. These data points are shown above the dashed line in Figure 10b.
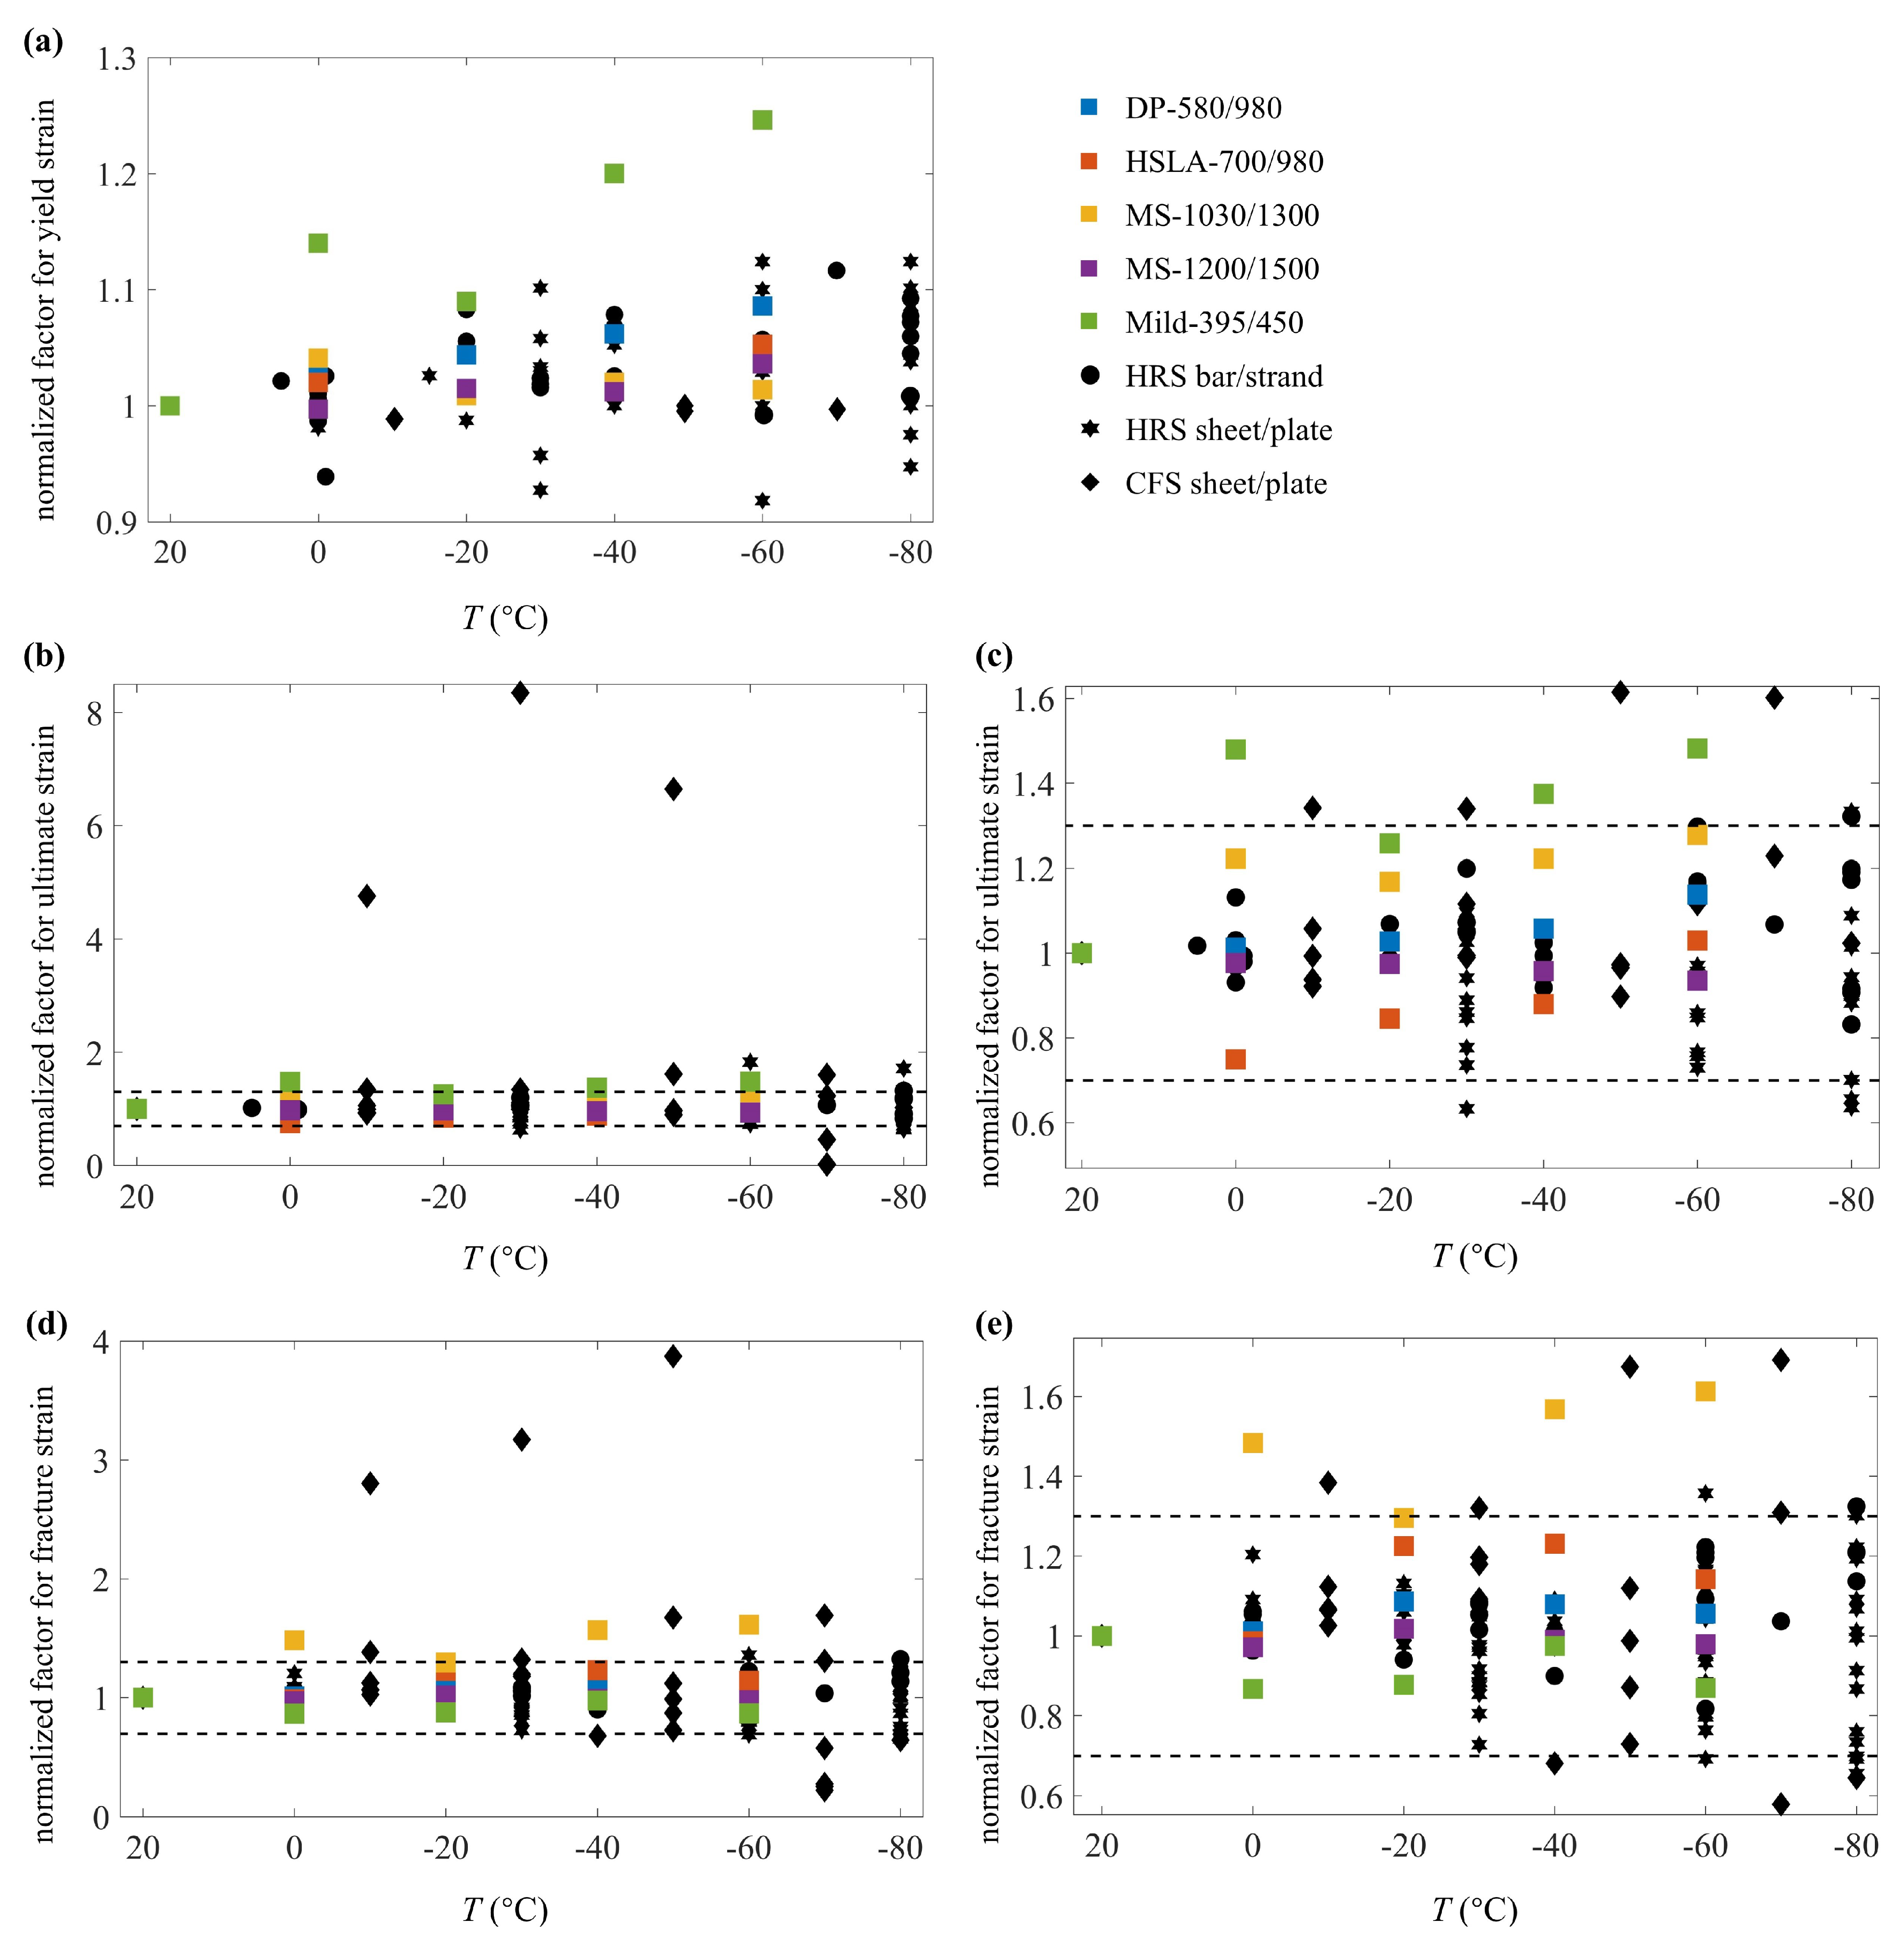
For the yield strain as shown in Figure 11a the majority of the data is not significantly affected by subzero temperatures where most data is within ±10% of the ambient values. Most HRS bar/strand specimens and CFS sheet/plate specimens, including AHSS and HSLA-700/980 in this study, show minor increases compared with ambient values and a clear increasing trend with decreasing temperature. Mild-395/450 shows a greater increase than any other steel, where the maximum yield strain observed at −60 C is 125% of its ambient value. Some HRS sheet/plate specimens show decreased yield strains at certain subzero temperatures.
For the ultimate strain, several trends are observed with decreasing temperature as shown in Figure 11b. In general, increasing trends are found for most steels; however, various fluctuations are observed. Most data from existing literature are within ±30% of corresponding ambient values (emphasized in Figure 11c), which show similar behaviors with AHSS, HSLA-700/980, and Mild-395/450, while two groups of steel illustrate substantially different behaviors. The first group includes ϕ 13 headed stud [17], 0.70 and 0.95 mm thick G550 CFS sheets [38], and 4 mm thick Q690 and Q960 HRS plates [21]. These specimens exhibit significant increases in ultimate strain with decreasing temperature, where the maximum increases are larger than 30% as shown above the upper dashed line in Figure 11b. A special case, the 0.75 mm thick G550 CFS sheet [38], has ultimate strain increases more than four times the ambient value at −10, −30, and −50 C (the outliers in Figure 11b), but suddenly decreases to less than half of the ambient value at −70 C due to the ductility loss and change of the yielding mode. The second group (data below the bottom dashed line as shown in Figure 11c) includes G300 CFS sheets [38], 3 mm thick Q960 HRS plate [21], and 2.8 mm and 4.5 mm thick S316 stainless steel plates [34], where the ultimate strains show a significant decrease at specific subzero temperatures due to the shape change in the σ ε curves.
The changing trends for the fracture strain or the total elongation over the full specimen gauge length over the temperature range are compared in Figure 11d. Overall, for the majority of the tested steels, the fracture strains at subzero temperatures are within ±30% of the ambient values as shown in Figure 11e. Specifically, for most HRS specimens, the fracture strains are close to or higher than their ambient values. The exceptions are the G20Mn5QT cast steel bar [19] and 3 mm thick Q690 HRS plate [21], which show clear decreasing trends with decreasing temperature where maximum decreases of 18% and 12% are observed, respectively. For CFS specimens, AHSS, HSLA-700/980, and 0.95 and 0.75 mm thick G550 sheets [38] (the outliers in Figure 11d) show increased fracture strains with decreasing temperature, while other data shows either gradual or sudden ductility loss when exposed to subzero temperatures (i.e., the data below the bottom dashed line as shown in Figure 11e). Mild-395/450 shows a gradually decreasing trend with a maximum decrease of 13% at −60 C. For the UHSS 1200 [37], 0.55 mm thick G550 sheet [38], and G300 sheet [38], large ductility losses are observed at certain subzero temperatures. A ductility loss of 32% is observed at −40 C and continues decreasing to 36% of ambient at −80 C for the UHSS 1200 [37]. Ductility losses between 30% to 34% of ambient are observed for S30408 stainless steel sheet at −60 C or −80 C [32]. For the G300 sheet and 0.55 mm thick G550 sheet [38], the fracture strain is increased to higher than the ambient value at −30 C or −50 C, followed by decreases of up to 78% of the ambient value at −70 C.

4.2. Comparison to Design Standards Ductility Requirements

Unlike conventional CFS, which shows a transition from relatively ductile to brittle fracture modes at specific low temperatures, the fracture strains of AHSS and HSLA-700/980 are not noticeably affected by subzero temperatures. In addition to studying the trend of fracture strain with decreasing temperature, it is also critical to compare the ductility of AHSS, HSLA-700/980, and Mild-395/450 with current CFS standards, which include the elongation, the ratio between ultimate strength and yield strength, and the ratio between ultimate strain and yield strain.
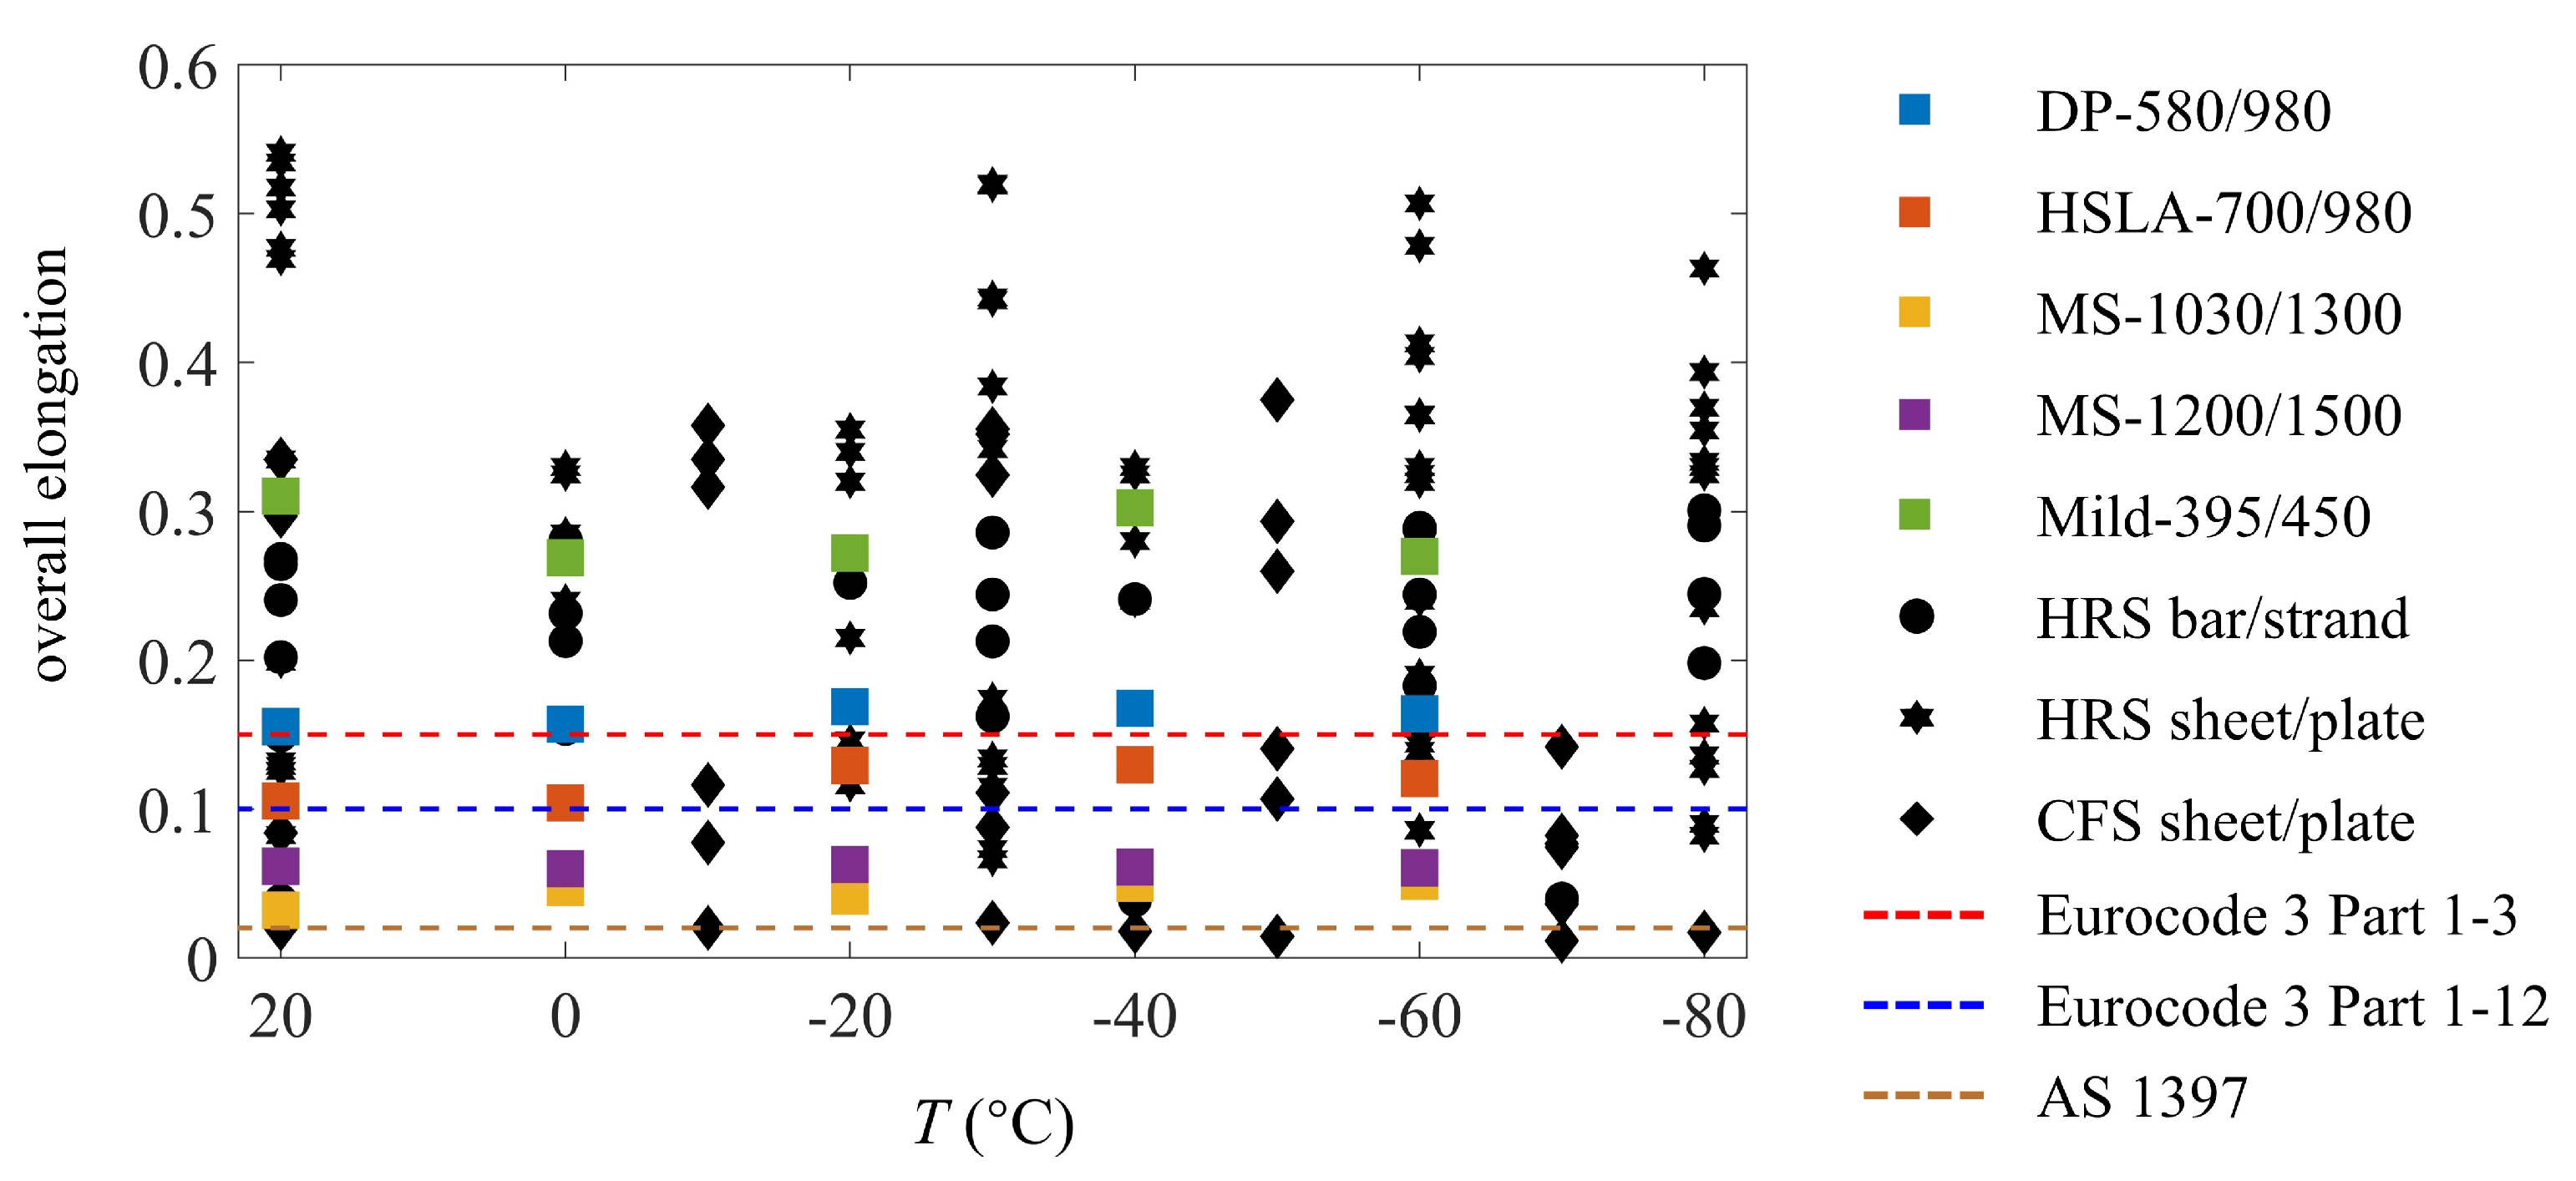
Eurocode 3, Part 1.3 [61], which cites Eurocode 3, Part 1.1 [62], requires an elongation at failure no less than 15% for cold-formed structural steel, while Eurocode 3, Part 1.12 [7] reduces this limit to 10% for HSS with a nominal yield strength between 460 MPa and 700 MPa. The minimum elongation with a 50 mm gauge length required by the Australian and New Zealand standards [63] is dependent on the steel grade. For example, for the highest listed grade, G550, the minimum elongation is 2%. No requirement in the current standard is available for steel with a grade higher than 700 MPa, including MS-1030/1300 and MS-1200/1500. The overall elongation for existing test data and standard limits are plotted in Figure 12. Although steel elongation is significantly dependent on steel grade and cross-section geometry, most available data below the 15% (red dashed line) [61] and/or the 10% (blue dashed line) [7] limits are CFS specimens, including the HSLA-700/980, MS-1030/1300, and MS-1200/1500 materials tested in this study. Even worse, a few cases of cold-formed HSS specimens, including UHSS 1200 [37] and 0.55 mm thick G550 CFS sheet [38], also fail to meet the 2% elongation requirement (brown dashed line) [63].
In addition to the overall elongation, the local and uniform elongation recommendations for structural steels [58,64] are also checked for AHSS, HSLA-700/980, and Mild-395/450 (Figure 8). The lower limit is 20% for the local elongations ( ε 7.5 T and ε 12.5 T ) and 3% for the uniform elongation ( ε 37.5 T ). DP-580/980 and Mild-395/450 pass all elongation checks at all test temperatures. HSLA-700/980 does not meet the local elongation requirement at ambient and 0 C, while it passes the uniform elongation check at all temperatures. MS-1200/1500 meets the uniform elongation requirement, while it does not pass the local elongation requirements at any temperature. MS-1030/1300 does not meet any of the local or uniform elongation requirements.
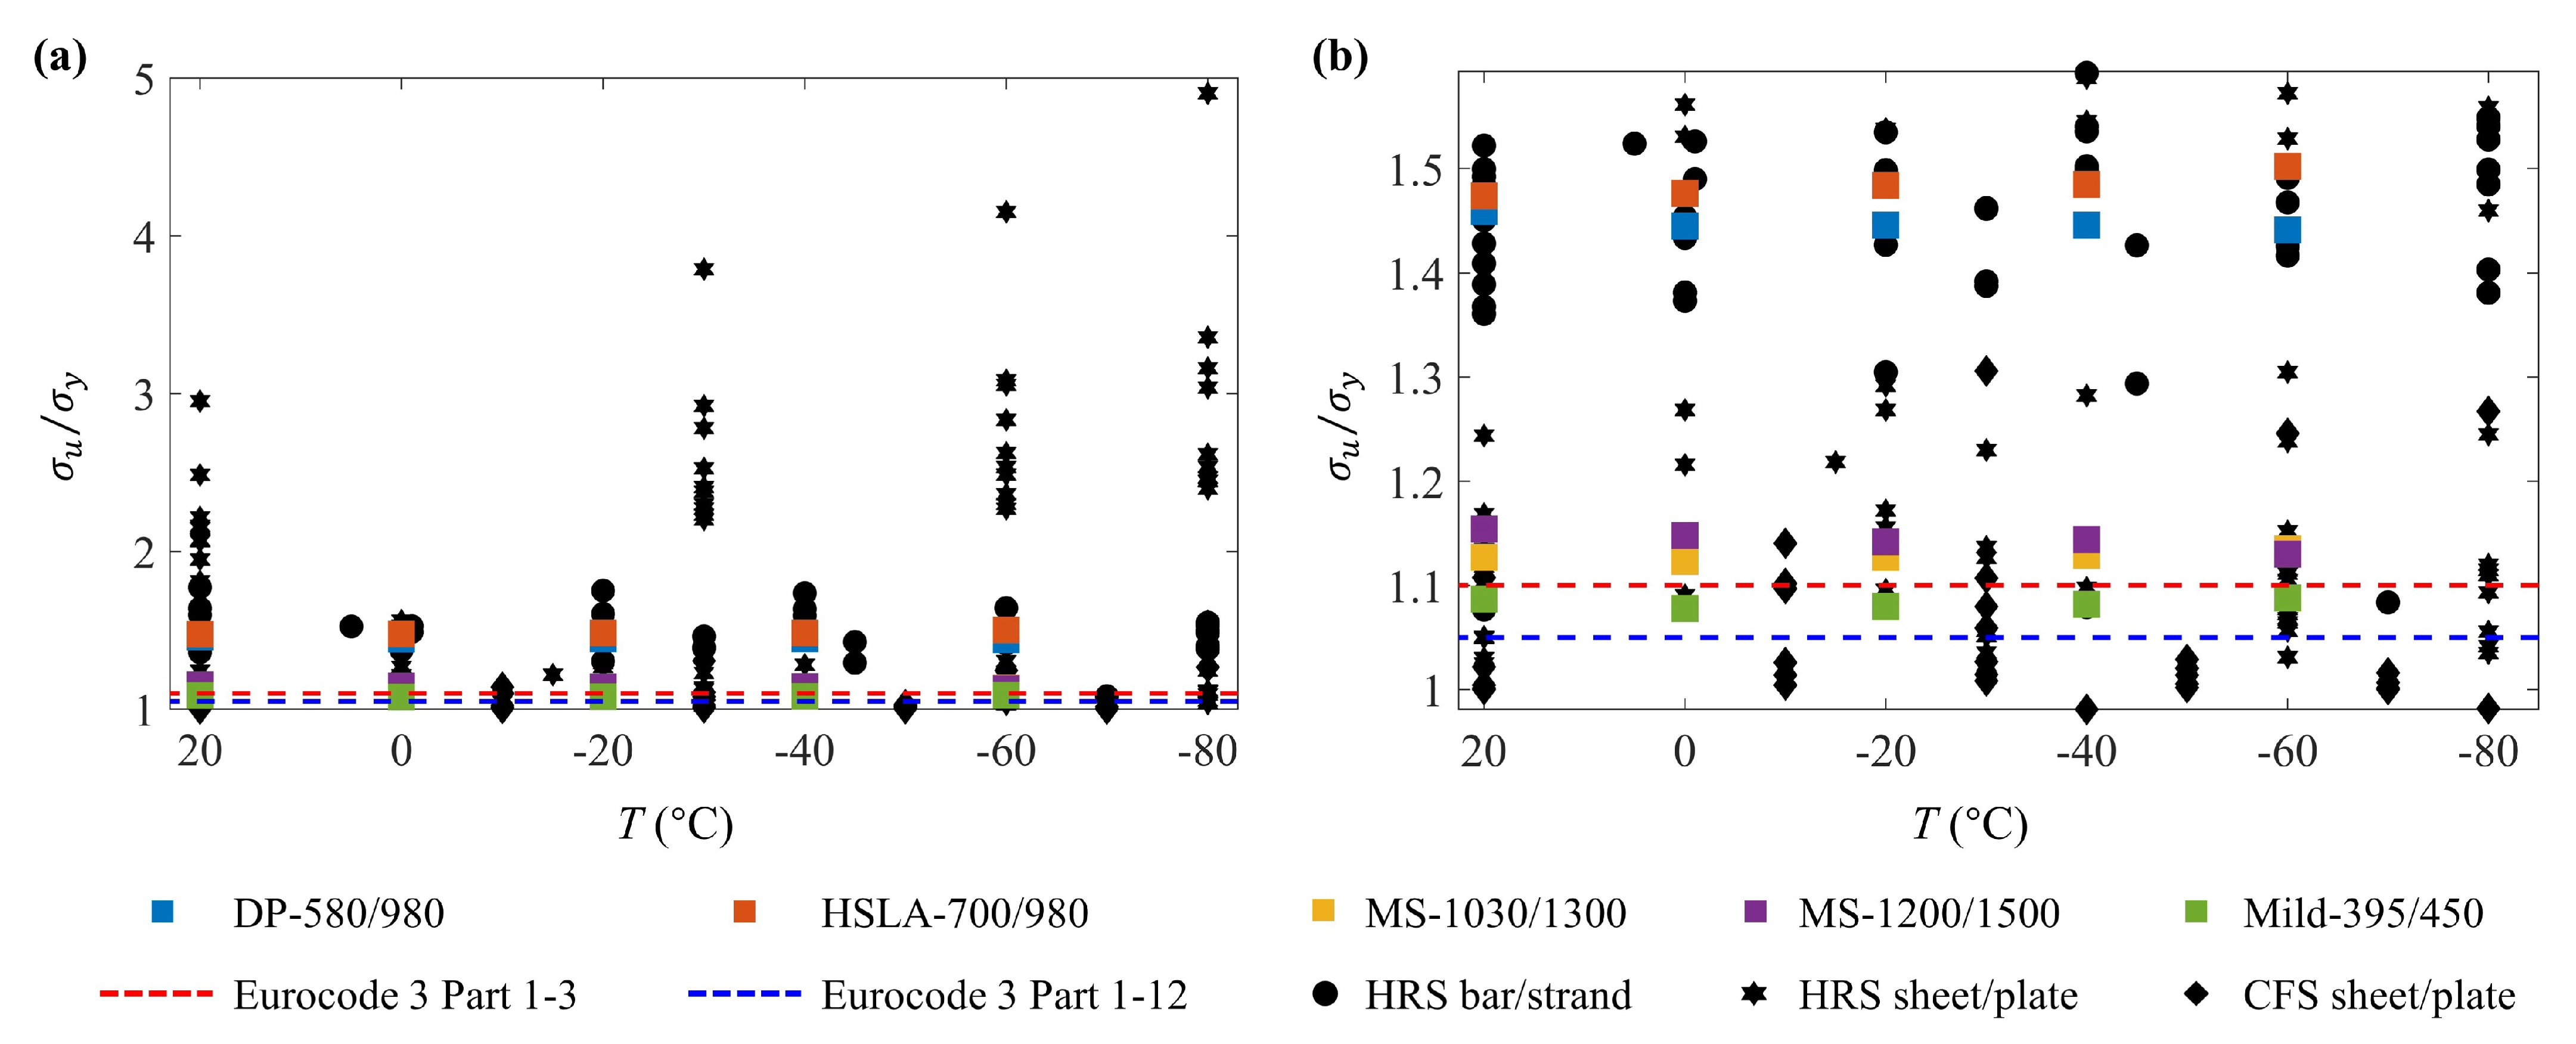
The ratio between ultimate strength and the yield strength is also a steel ductility indicator required by Eurocode 3, Part 1.3 [61] and Part 1.12 [7], where the minimum ratio is 1.10 and 1.05, respectively. As shown in Figure 13a, most data are far above the limit, including DP-580/980, HSLA-700/980, and many HRS specimens, which indicates a significant strain hardening process after reaching the yield point. MS-1030/1300 and MS-1200/1500 also possess adequate ductility to pass these requirements. Nevertheless, as shown in Figure 13b, a few specimens cannot pass the limit, particularly some CFS specimens at subzero temperatures, including Mild-395/450, most G550 and G300 CFS sheets [38], and most Q960 HRS plates [21,22].
In addition, Eurocode 3 Part 1.3 [61] and Eurocode 3 Part 1.12 [7] require ε u 15 σ y / E as an additional ductility requirement. DP-580/980, HSLA-700/980, and Mild-395/450 possess sufficient ductility to meet this requirement at all test temperatures. MS-1030/1300 and MS-1200/1500 are not able to pass the requirement at any test temperature, while the ratios at subzero temperatures are larger than the ratios at ambient.

5. Stress–Strain Relationship Characterization

For simplicity, the ambient values could be used to represent the yield strength, the ultimate strength, and elongations at subzero temperatures for the high-strength steel (i.e., AHSS and HSLA), as those tested in this study showed only mild increased strengths and elongations at subzero temperatures. However, for the mild steel (Mild-395/450), the elastic modulus and overall elongation show decreasing values with decreasing temperature, and therefore the ambient values are unconservative to represent the subzero temperature conditions. Therefore, it is recommended to adopt 90% and 80% of the ambient values for the elastic modulus and overall elongation, respectively, for Mild-395/450 at subzero temperatures.
An accurate description of the steel σ ε relationship is necessary for advanced numerical analysis, which plays an increasingly important role in engineering design and a dominant role in scientific research. The most commonly-used models adopted in current design standards are multi-stage linear models (e.g., elastic-perfectly-plastic model). However, as discussed in Section 3.1, AHSS and HSLA steel show significant nonlinearity during their yielding process and lack a distinct yield plateau, and Mild-395/450 shows nonlinear behavior after the end of its yield plateau. Therefore, their σ ε behaviors are not accurately captured using simple bilinear or trilinear models.
Previous research [45] investigated the accuracy of using existing constitutive models (e.g., [65]) to portray the σ ε relationship of AHSS and HSLA at ambient temperatures. Due to the unique behavior of AHSS, it was found that standard material models using either parameters determined directly from experiments or parameters from recommended predictive equations ([66]) did not provide an accurate representation of the σ ε curve, in particular for DP and HSLA, especially around the nonlinear transition region. Therefore, a two-stage plus linear model based on the Ramberg–Osgood equation [67] was created and validated with the tested specimens [45]. Since the shape of the σ ε curves for AHSS and HSLA at subzero temperatures are similar to those at ambient, it was determined to modify the model in [45] for subzero temperatures. The updated σ ε model considering subzero temperature effects is shown in Equation (3):
ε T = σ T E T + p σ T σ p T n for   0 σ T σ p T σ T σ p T E p T + ε e u T ε p T σ e u T σ p T E p T σ T σ p T σ e u T σ p T m + ε p T for   σ p T < σ T σ e u T ε u T ε e u T σ u T σ e u T · ( σ T σ e u T ) + ε e u T for   σ e u T < σ T σ u T
where σ T is the stress and the model input; subscript T represents the material property at subzero temperature T; ε T is the strain and the model output; ε p T and σ p T are the strain and stress of p offset point (i.e., the point with a plastic strain of p); p is given based on the steel grade, which is 0.015 for DP-580/980, 0.010 for HSLA-700/980, and 0.002 for MS-1030/1300 and MS-1200/1500; E p T is the tangent modulus at the p offset point as calculated using Equation (4); ε e u T and σ e u T are the strain and stress of the equivalent ultimate point (i.e., point with a stress equal to 99% ultimate strength); n and m are the exponential coefficients determining the degree of curvature for the first stage and the second stage, respectively. Further details can be found in [45].
1 E p T = ε T ( σ T ) σ T | σ T = σ p T = 1 + p n σ T n 1 σ p T n E T E T | σ T = σ p T = 1 + p n E T σ p T E T E p T = E T 1 + p n E T σ p T
The comparison between the test σ ε curves for AHSS and HSLA steel and the two-stage plus linear model from the origin to the ultimate point are shown in Figure 6. From the regression analysis, the R 2 of the fit for any single test curve is larger than 99.5%, which indicates an excellent fit accuracy between the model and the test curve.
To model the σ ε behavior of Mild-395/450, the bilinear plus nonlinear model for HRS proposed by Yun and Gardner [68] was previously updated with fewer coefficients by the authors [48] for accurately describing the postfire σ ε relationships for AHSS, as shown in Equation (5).
σ T = E T ε T for   0 ε T ε y T σ y T for   ε y T < ε T ε s h T σ y T + ( σ u T σ y T ) K 1 ε n T + K 2 ε n T ( 1 + K 3 ε n T ) for   0 < ε n T 1
where ε n T is the normalized strain calculated using Equation (6); K 1 , K 2 , and K 3 are the numerical coefficients determining the model’s degree of curvature for the nonlinear strain-hardening part between ε s h T and ε u T .
ε n T = ε T ε s h T ε u T ε s h T for   ε s h T < ε T ε u T
The model coefficients are recalibrated as K 1 = 0.103 , K 2 = 5.360 , and K 3 = 4.974 , and the updated bilinear and nonlinear model is able to accurately fit the σ ε curves at subzero temperatures for Mild-395/450. The model fit from the origin to the ultimate point is shown in Figure 5, and the average R 2 between the test curves and the model fit is 98.7%, which shows satisfactory agreement between the test curves and the recalibrated model.

6. Conclusions

In this paper, a test series consisting of 45 tensile tests was carried out to investigate the material properties of advanced high-strength cold-formed steel (AHSS) at subzero temperatures. Specimens were cut from three different AHSS sheets, dual-phase (DP-580/980) and martensitic (MS-1030/1300 and MS-1200/1500), one cold-formed high-strength low-alloy sheet (HSLA-700/980), and one conventional CFS sheet (Mild-395/450). All steels were investigated at ambient, 0 C, −20 C, −40 C, and −60 C following the steady-state test protocol. stress–strain relationships and key material properties at subzero temperatures were reported. The change in the key material properties with decreasing temperature for AHSS, HSLA-700/980, and Mild-395/450 were compared with the existing data and the requirements in several steel design standards. The test results showed that the material performance of AHSS and HSLA steel did not deteriorate under subzero temperatures. With decreasing temperature, there is a minimal decrease in the elastic modulus and varying degrees of increases in key strengths and strains for AHSS and HSLA steel. For example, increases up to 12%, 11%, and 61% are observed for the yield strength, ultimate strength, and elongation at subzero temperatures, respectively, than at ambient. Therefore, the tested AHSS and HSLA steels could be viable construction materials in subzero temperature environments. Additionally, constitutive models for the stress–strain relationships of the steels at subzero temperatures were demonstrated to have high accuracy, thus enabling accurate material modeling of AHSS at subzero temperatures for advanced numerical analyses.

Author Contributions

Conceptualization, H.B.B.; funding acquisition, H.B.B.; supervision, H.B.B.; resources, H.B.B.; project administration, H.B.B.; Writing-review and editing, H.B.B.; methodology: H.B.B. and Y.X.; investigation, Y.X.; formal analysis, Y.X.; visualization, Y.X.; data curation, Y.X.; writing-original draft, Y.X. All authors have read and agreed to the published version of the manuscript.

Funding

This research received no external funding.

Institutional Review Board Statement

Not applicable.

Informed Consent Statement

Not applicable.

Data Availability Statement

The data presented in this study are openly available in the National Science Foundation’s DesignSafe Data Depot at https://doi.org/10.17603/ds2-my6x-6e21.

Acknowledgments

The authors would like to thank US Steel and the Rack Manufacturers Association for the donation of the steel sheets. Any opinions, findings, conclusions, or recommendations expressed in this article are those of the authors and do not necessarily reflect the views of the sponsors or other participants. Additionally, the authors would like to thank the Manufacturing and Mechanics Lab at UW-Madison for the use of the Environmental Test Chamber and accompanying equipment.

Conflicts of Interest

The authors declare no conflict of interest.

Abbreviations

The following abbreviations are used in this manuscript:
AHSSadvanced high-strength steel
CFScold-formed steel
DPdual phase
HSLAhigh-strength low-alloy
HSShigh-strength steel
HRShot-rolled steel
MSMartensitic

References

  1. Box, J.E.; Colgan, W.T.; Christensen, T.R.; Schmidt, N.M.; Lund, M.; Parmentier, F.J.W.; Brown, R.; Bhatt, U.S.; Euskirchen, E.S.; Romanovsky, V.E.; et al. Key indicators of Arctic climate change: 1971–2017. Environ. Res. Lett. 2019, 14, 045010. [Google Scholar] [CrossRef]
  2. Runge, C.A.; Daigle, R.M.; Hausner, V.H. Quantifying tourism booms and the increasing footprint in the Arctic with social media data. PLoS ONE 2020, 15, e0227189. [Google Scholar] [CrossRef] [PubMed]
  3. Agarkov, S.A.; Kozlov, A.V.; Fedoseev, S.V.; Teslya, A.B. Major trends in efficiency upgrading of the economic activity in the arctic zone of Russian Federation. J. Min. Inst. 2018, 230, 209–216. [Google Scholar] [CrossRef]
  4. Smirnov, A.V. The Arctic Population: Dynamics and Centers of the Settlement System. Arct. North 2020, 40, 270–290. [Google Scholar] [CrossRef]
  5. Hovelsrud, G.K.; Poppel, B.; Van Oort, B.; Reist, J.D. Arctic societies, cultures, and peoples in a changing cryosphere. Ambio 2011, 40, 100–110. [Google Scholar] [CrossRef]
  6. Yu, W.; LaBoube, R.A.; Chen, H. Cold-Formed Steel Design, 5th ed.; John Wiley & Sons, Inc.: Hoboken, NJ, USA, 2019; pp. 1–528. [Google Scholar]
  7. European Committee for Standardization (CEN). Eurocode 3: Design of Steel Structures, Part 1–12: General—High Strength Steels; CEN: Brussels, Belgium, 2007. [Google Scholar]
  8. Schafer, B.; Bjorhovde, R.; Fahnestock, L.; Finnigan, S.; Gilsanz, R.; Griffis, L.; Leon, R.; Lepage, A.; Poulos, T.; Rassati, G.; et al. Ad Hoc Task Group Report on High Strength Steel; Technical Report; American Institute of Steel Construction: Chicago, IL, USA, 2019. [Google Scholar]
  9. Shin, H.S.; Lee, H.M.; Kim, M.S. Impact tensile behaviors of 9% nickel steel at low temperature. Int. J. Impact Eng. 2000, 24, 571–581. [Google Scholar] [CrossRef]
  10. Filiatrault, A.; Holleran, M. stress–strain behavior of reinforcing steel and concrete under seismic strain rates and low temperatures. Mater. Struct. 2001, 34, 235–239. [Google Scholar] [CrossRef]
  11. Levings, J.; Sritharan, S. Effects of Cold Temperature and Strain Rate on the stress–strain Behavior of ASTM A706 Grade 420(60) Steel Reinforcement. J. Mater. Civ. Eng. 2012, 24, 1441–1449. [Google Scholar] [CrossRef]
  12. Wang, Y.; Liu, X.; Hu, Z.; Shi, Y. Experimental study on mechanical properties and fracture toughness of structural thick plate and its butt weld along thickness and at low temperatures. Fatigue Fract. Eng. Mater. Struct. 2013, 36, 1258–1273. [Google Scholar] [CrossRef]
  13. Yan, J.B.; Liew, J.Y.; Zhang, M.H.; Wang, J.Y. Mechanical properties of normal strength mild steel and high strength steel S690 in low temperature relevant to Arctic environment. Mater. Des. 2014, 61, 150–159. [Google Scholar] [CrossRef]
  14. Furuya, H.; Tagawa, T.; Ishikawa, T. Effect of Tempering Temperature on Tensile Straining Behavior in Ni Bearing Cryogenic Steel. J. Iron Steel Inst. Jpn. 2014, 100, 104–111. [Google Scholar] [CrossRef]
  15. Li, Y.j.; Fu, R.d.; Li, Y.; Peng, Y.; Liu, H.j. Tensile properties and fracture behavior of friction stir welded joints of Fe-32Mn-7Cr-1Mo-0.3 N steel at cryogenic temperature. J. Mater. Sci. Technol. 2018, 34, 157–162. [Google Scholar] [CrossRef]
  16. Li, Z.; Zhang, D.; Wu, H.; Huang, F.; Hong, W.; Zang, X. Fatigue properties of welded Q420 high strength steel at room and low temperatures. Constr. Build. Mater. 2018, 189, 955–966. [Google Scholar] [CrossRef]
  17. Xie, J.; Zhao, X.; Yan, J.B. Mechanical properties of high strength steel strand at low temperatures: Tests and analysis. Constr. Build. Mater. 2018, 189, 1076–1092. [Google Scholar] [CrossRef]
  18. Xie, J.; Zhu, G.R.; Yan, J.B. Mechanical properties of headed studs at low temperatures in Arctic infrastructure. J. Constr. Steel Res. 2018, 149, 130–140. [Google Scholar] [CrossRef]
  19. Yin, Y.; Li, S.; Han, Q.; Li, M. Material parameters in void growth model for G20Mn5QT cast steel at low temperatures. Constr. Build. Mater. 2020, 243, 118123. [Google Scholar] [CrossRef]
  20. An, L.; Jiang, W.; Zhang, H.; Wu, J. Experimental research on bolted joint strength and dispersion in steel lattice transmission tower legs under low temperatures. Fatigue Fract. Eng. Mater. Struct. 2020, 43, 919–931. [Google Scholar] [CrossRef]
  21. Yan, J.B.; Luo, Y.L.; Lin, X.C.; Luo, Y.B.; Zhang, L.X. Effects of the Arctic low temperature on mechanical properties of Q690 and Q960 high-strength steels. Constr. Build. Mater. 2021, 300, 124022. [Google Scholar] [CrossRef]
  22. Yan, J.B.; Luo, Y.L.; Su, L.; Lin, X.; Luo, Y.B.; Zhang, L. Low-temperature compression behaviour of square CFST columns using Q960 ultra-high strength steel. J. Constr. Steel Res. 2021, 183, 106727. [Google Scholar] [CrossRef]
  23. Li, C.; Li, K.; Dong, J.; Wang, J.; Shao, Z. Mechanical behaviour and microstructure of Fe-20/27Mn–4Al-0.3 C low magnetic steel at room and cryogenic temperatures. Mater. Sci. Eng. A 2021, 809, 140998. [Google Scholar] [CrossRef]
  24. Fujimura, Y.; Ishii, H. Tensile behaviors of high Cr-low Ni two-phase stainless steels at room and low temperatures. J. Jpn. I. Met. 1973, 37, 33–39. [Google Scholar] [CrossRef] [PubMed]
  25. Miura, R.; Ohnishi, K.; Nakajima, H.; Shimamoto, S. Effects of carbon and nitrogen on the tensile deformation behavior of SUS304 and 316 stainless steels at cryogenic temperatures. J. Iron Steel Inst. Jpn. 1987, 73, 715–722. [Google Scholar] [CrossRef] [PubMed]
  26. He, J.; Han, G.; Fukuyama, S.; Yokogawa, K. Tensile behaviour of duplex stainless steel at low temperatures. Mater. Sci. Technol. 1999, 15, 909–920. [Google Scholar] [CrossRef]
  27. Sun, D.; Han, G.; Vaodee, S.; Fukuyama, S.; Yokogawa, K. Tensile behaviour of type 304 austenitic stainless steels in hydrogen atmosphere at low temperatures. Mater. Sci. Technol. 2001, 17, 302–308. [Google Scholar] [CrossRef]
  28. Park, W.S.; Yoo, S.W.; Kim, M.H.; Lee, J.M. Strain-rate effects on the mechanical behavior of the AISI 300 series of austenitic stainless steel under cryogenic environments. Mater. Des. 2010, 31, 3630–3640. [Google Scholar] [CrossRef]
  29. Yoo, S.W.; Lee, C.S.; Park, W.S.; Kim, M.H.; Lee, J.M. Temperature and strain rate dependent constitutive model of TRIP steels for low-temperature applications. Comput. Mater. Sci. 2011, 50, 2014–2027. [Google Scholar] [CrossRef]
  30. Zheng, C.; Yu, W. Effect of low-temperature on mechanical behavior for an AISI 304 austenitic stainless steel. Mater. Sci. Eng. A 2018, 710, 359–365. [Google Scholar] [CrossRef]
  31. Ding, H.; Wu, Y.; Lu, Q.; Xu, P.; Zheng, J.; Wei, L. Tensile properties and impact toughness of S30408 stainless steel and its welded joints at cryogenic temperatures. Cryogenics 2018, 92, 50–59. [Google Scholar] [CrossRef]
  32. Yan, J.B.; Lin, Z.; Xie, P.; Luo, Y.B.; Li, Y. Tensile behavior of stainless steel S30408 at the Arctic low temperature. Steel Compos. Struct. 2021, 40, 633–648. [Google Scholar] [CrossRef]
  33. Koga, N.; Nameki, T.; Umezawa, O.; Tschan, V.; Weiss, K.P. Tensile properties and deformation behavior of ferrite and austenite duplex stainless steel at cryogenic temperatures. Mater. Sci. Eng. A 2021, 801, 140442. [Google Scholar] [CrossRef]
  34. Yan, J.B.; Geng, Y.; Xie, P.; Xie, J. Low-temperature mechanical properties of stainless steel 316L: Tests and constitutive models. Constr. Build. Mater. 2022, 343, 128122. [Google Scholar] [CrossRef]
  35. Abdel-Rahim, A.; Polyzois, D. Effect of temperature and galvanization on cold-formed steel. J. Mater. Civ. Eng. 1996, 8, 114–122. [Google Scholar] [CrossRef]
  36. Nykänen, T.; Björk, T.; Mettänen, H.; Ilyin, A.; Koskimäki, M. Residual strength at −40 °C of a precracked cold-formed rectangular hollow section made of ultra-high-strength steel–an engineering approach. Fatigue Fract. Eng. Mater. Struct. 2014, 37, 325–334. [Google Scholar] [CrossRef]
  37. Azhari, F.; Hossain Apon, A.A.; Heidarpour, A.; Zhao, X.L.; Hutchinson, C.R. Mechanical response of ultra-high strength (Grade 1200) steel under extreme cooling conditions. Constr. Build. Mater. 2018, 175, 790–803. [Google Scholar] [CrossRef]
  38. Rokilan, M.; Mahendran, M. Sub-zero temperature mechanical properties of cold-rolled steel sheets. Thin-Walled Struct. 2020, 154, 106842. [Google Scholar] [CrossRef]
  39. Kosaraju, S.; Singh, S.K.; Buddi, T.; Kalluri, A.; Haq, A.U. Evaluation and characterisation of ASS316L at sub-zero temperature. Adv. Mater. Proc. Technol. 2020, 6, 365–375. [Google Scholar] [CrossRef]
  40. Yan, J.B.; Xie, W.J.; Luo, Y.; Wang, T. Behaviours of concrete stub columns confined by steel tubes at cold-region low temperatures. J. Constr. Steel Res. 2020, 170, 106124. [Google Scholar] [CrossRef]
  41. Mu, W.; Li, Y.; Cai, Y.; Wang, M. Low-cycle Fatigue and Fracture Behaviour of 9%Ni Steel Flux Cored Arc Welding joint at Cryogenic Temperature. MATEC Web Conf. 2019, 269, 3008. [Google Scholar] [CrossRef]
  42. Valtonen, K.; Ratia, V.; Ramakrishnan, K.R.; Apostol, M.; Terva, J.; Kuokkala, V.T. Impact wear and mechanical behavior of steels at subzero temperatures. Tribol. Int. 2019, 129, 476–493. [Google Scholar] [CrossRef]
  43. Keeler, S.; Kimchi, M.; Mooney, P. Advanced High-Strength Steels Application Guidelines; WorldAutoSteel: Brussels, Belgium, 2017. [Google Scholar]
  44. Kuziak, R.; Kawalla, R.; Waengler, S. Advanced high strength steels for automotive industry. Arch. Civ. Mech. Eng. 2008, 8, 103–117. [Google Scholar] [CrossRef]
  45. Xia, Y.; Ding, C.; Li, Z.; Schafer, B.W.; Blum, H.B. Numerical modeling of stress–strain relationships for advanced high strength steels. J. Constr. Steel Res. 2021, 182, 106687. [Google Scholar] [CrossRef]
  46. Yan, X.; Xia, Y.; Blum, H.B.; Gernay, T. Elevated temperature material properties of advanced high strength steel alloys. J. Constr. Steel Res. 2020, 174, 106299. [Google Scholar] [CrossRef]
  47. Yan, X.; Xia, Y.; Blum, H.B.; Gernay, T. Post-fire mechanical properties of advanced high-strength cold-formed steel alloys. Thin-Walled Struct. 2021, 159, 107293. [Google Scholar] [CrossRef]
  48. Xia, Y.; Yan, X.; Gernay, T.; Blum, H.B. Elevated temperature and post-fire stress–strain modeling of advanced high-strength cold-formed steel alloys. J. Constr. Steel Res. 2022, 190, 107116. [Google Scholar] [CrossRef]
  49. Weng, C.C.; Peköz, T. Residual Stresses in Cold-Formed Steel Members. J. Struct. Eng. 1990, 116, 1611–1625. [Google Scholar] [CrossRef]
  50. Abdel-Rahman, N.; Sivakumaran, K. Material properties models for analysis of cold-formed steel members. J. Struct. Eng. 1997, 123, 1135–1143. [Google Scholar] [CrossRef]
  51. Xia, Y.; Blum, H.B. Experimental study on residual stresses in press-braked advanced high-strength cold-formed steel lipped angles by sectioning method. In Proceedings of the Cold-Formed Steel Research Consortium Colloquium, Online, 17–19 October 2022. [Google Scholar]
  52. Koh, H.; Blum, H.B. Calibration and validation of the hole-drilling method to measure residual stresses in advanced high-strength cold-formed steel members. In Proceedings of the Cold-Formed Steel Research Consortium Colloquium, Online, 17–19 October 2022. [Google Scholar]
  53. American Iron and Steel Institute (AISI). S100-16 (2020): North American Specification for the Design of Cold-Formed Steel Structural Members; AISI: Washington, DC, USA, 2020. [Google Scholar]
  54. ASTM. E8-22 Standard Test Methods for Tension Testing of Metallic Materials; ASTM: West Conshohocken, PA, USA, 2022. [Google Scholar] [CrossRef]
  55. Huang, Y.; Young, B. The art of coupon tests. J. Constr. Steel Res. 2014, 96, 159–175. [Google Scholar] [CrossRef]
  56. Serreze, M.C.; Barry, R.G. The Arctic Climate System, 2nd ed.; Cambridge University Press: Cambridge, UK, 2014. [Google Scholar] [CrossRef]
  57. Vavrus, S.J.; Holland, M.M.; Jahn, A.; Bailey, D.A.; Blazey, B.A. Twenty-First-Century Arctic Climate Change in CCSM4. J. Clim. 2012, 25, 2696–2710. [Google Scholar] [CrossRef] [Green Version]
  58. Rogers, C.A.; Hancock, G.J. Ductility of G550 Sheet Steels in Tension. J. Struct. Eng. 1997, 123, 1586–1594. [Google Scholar] [CrossRef]
  59. American Iron and Steel Institute (AISI). S903-20: Test Standard for Determining the Uniform and Local Ductility of Carbon and Low-Alloy Steels; AISI: Washington, DC, USA, 2020. [Google Scholar]
  60. Yan, J.B.; Xie, J. Experimental studies on mechanical properties of steel reinforcements under cryogenic temperatures. Constr. Build. Mater. 2017, 151, 661–672. [Google Scholar] [CrossRef]
  61. European Committee for Standardization (CEN). Eurocode 3: Design of Steel Structures, Part 1–3: General Rules—Supplementary Rules for Cold-Formed Members and Sheeting; CEN: Brussels, Belgium, 2006. [Google Scholar]
  62. European Committee for Standardization (CEN). Eurocode 3: Design of Steel Structures, Part 1–1: General Rules and Rules for Buildings; CEN: Brussels, Belgium, 2016. [Google Scholar]
  63. Standards Australia. AS/NZS 1397:2021; Continuous Hot-Dip Metallic Coated Steel Sheet and Strip—Coatings of Zinc and Zinc Alloyed with Aluminium and Magnesium. Standards Australia: Sydney, Australia, 2021. [Google Scholar]
  64. Dhalla, A.K.; Winter, G. Suggested steel ductility requirements. J. Struct. Div. 1974, 100, 445–462. [Google Scholar] [CrossRef]
  65. Mirambell, E.; Real, E. On the calculation of deflections in structural stainless steel beams: An experimental and numerical investigation. J. Constr. Steel Res. 2000, 54, 109–133. [Google Scholar] [CrossRef]
  66. Gardner, L.; Yun, X. Description of stress–strain curves for cold-formed steels. Constr. Build. Mater. 2018, 189, 527–538. [Google Scholar] [CrossRef]
  67. Ramberg, W.; Osgood, W.R. Description of stress–strain Curves by Three Parameters; NACA-TN-902; National Advisory Committee for Aeronautics: Washington, DC, USA, 1943. [Google Scholar]
  68. Yun, X.; Gardner, L. stress–strain curves for hot-rolled steels. J. Constr. Steel Res. 2017, 133, 36–46. [Google Scholar] [CrossRef]
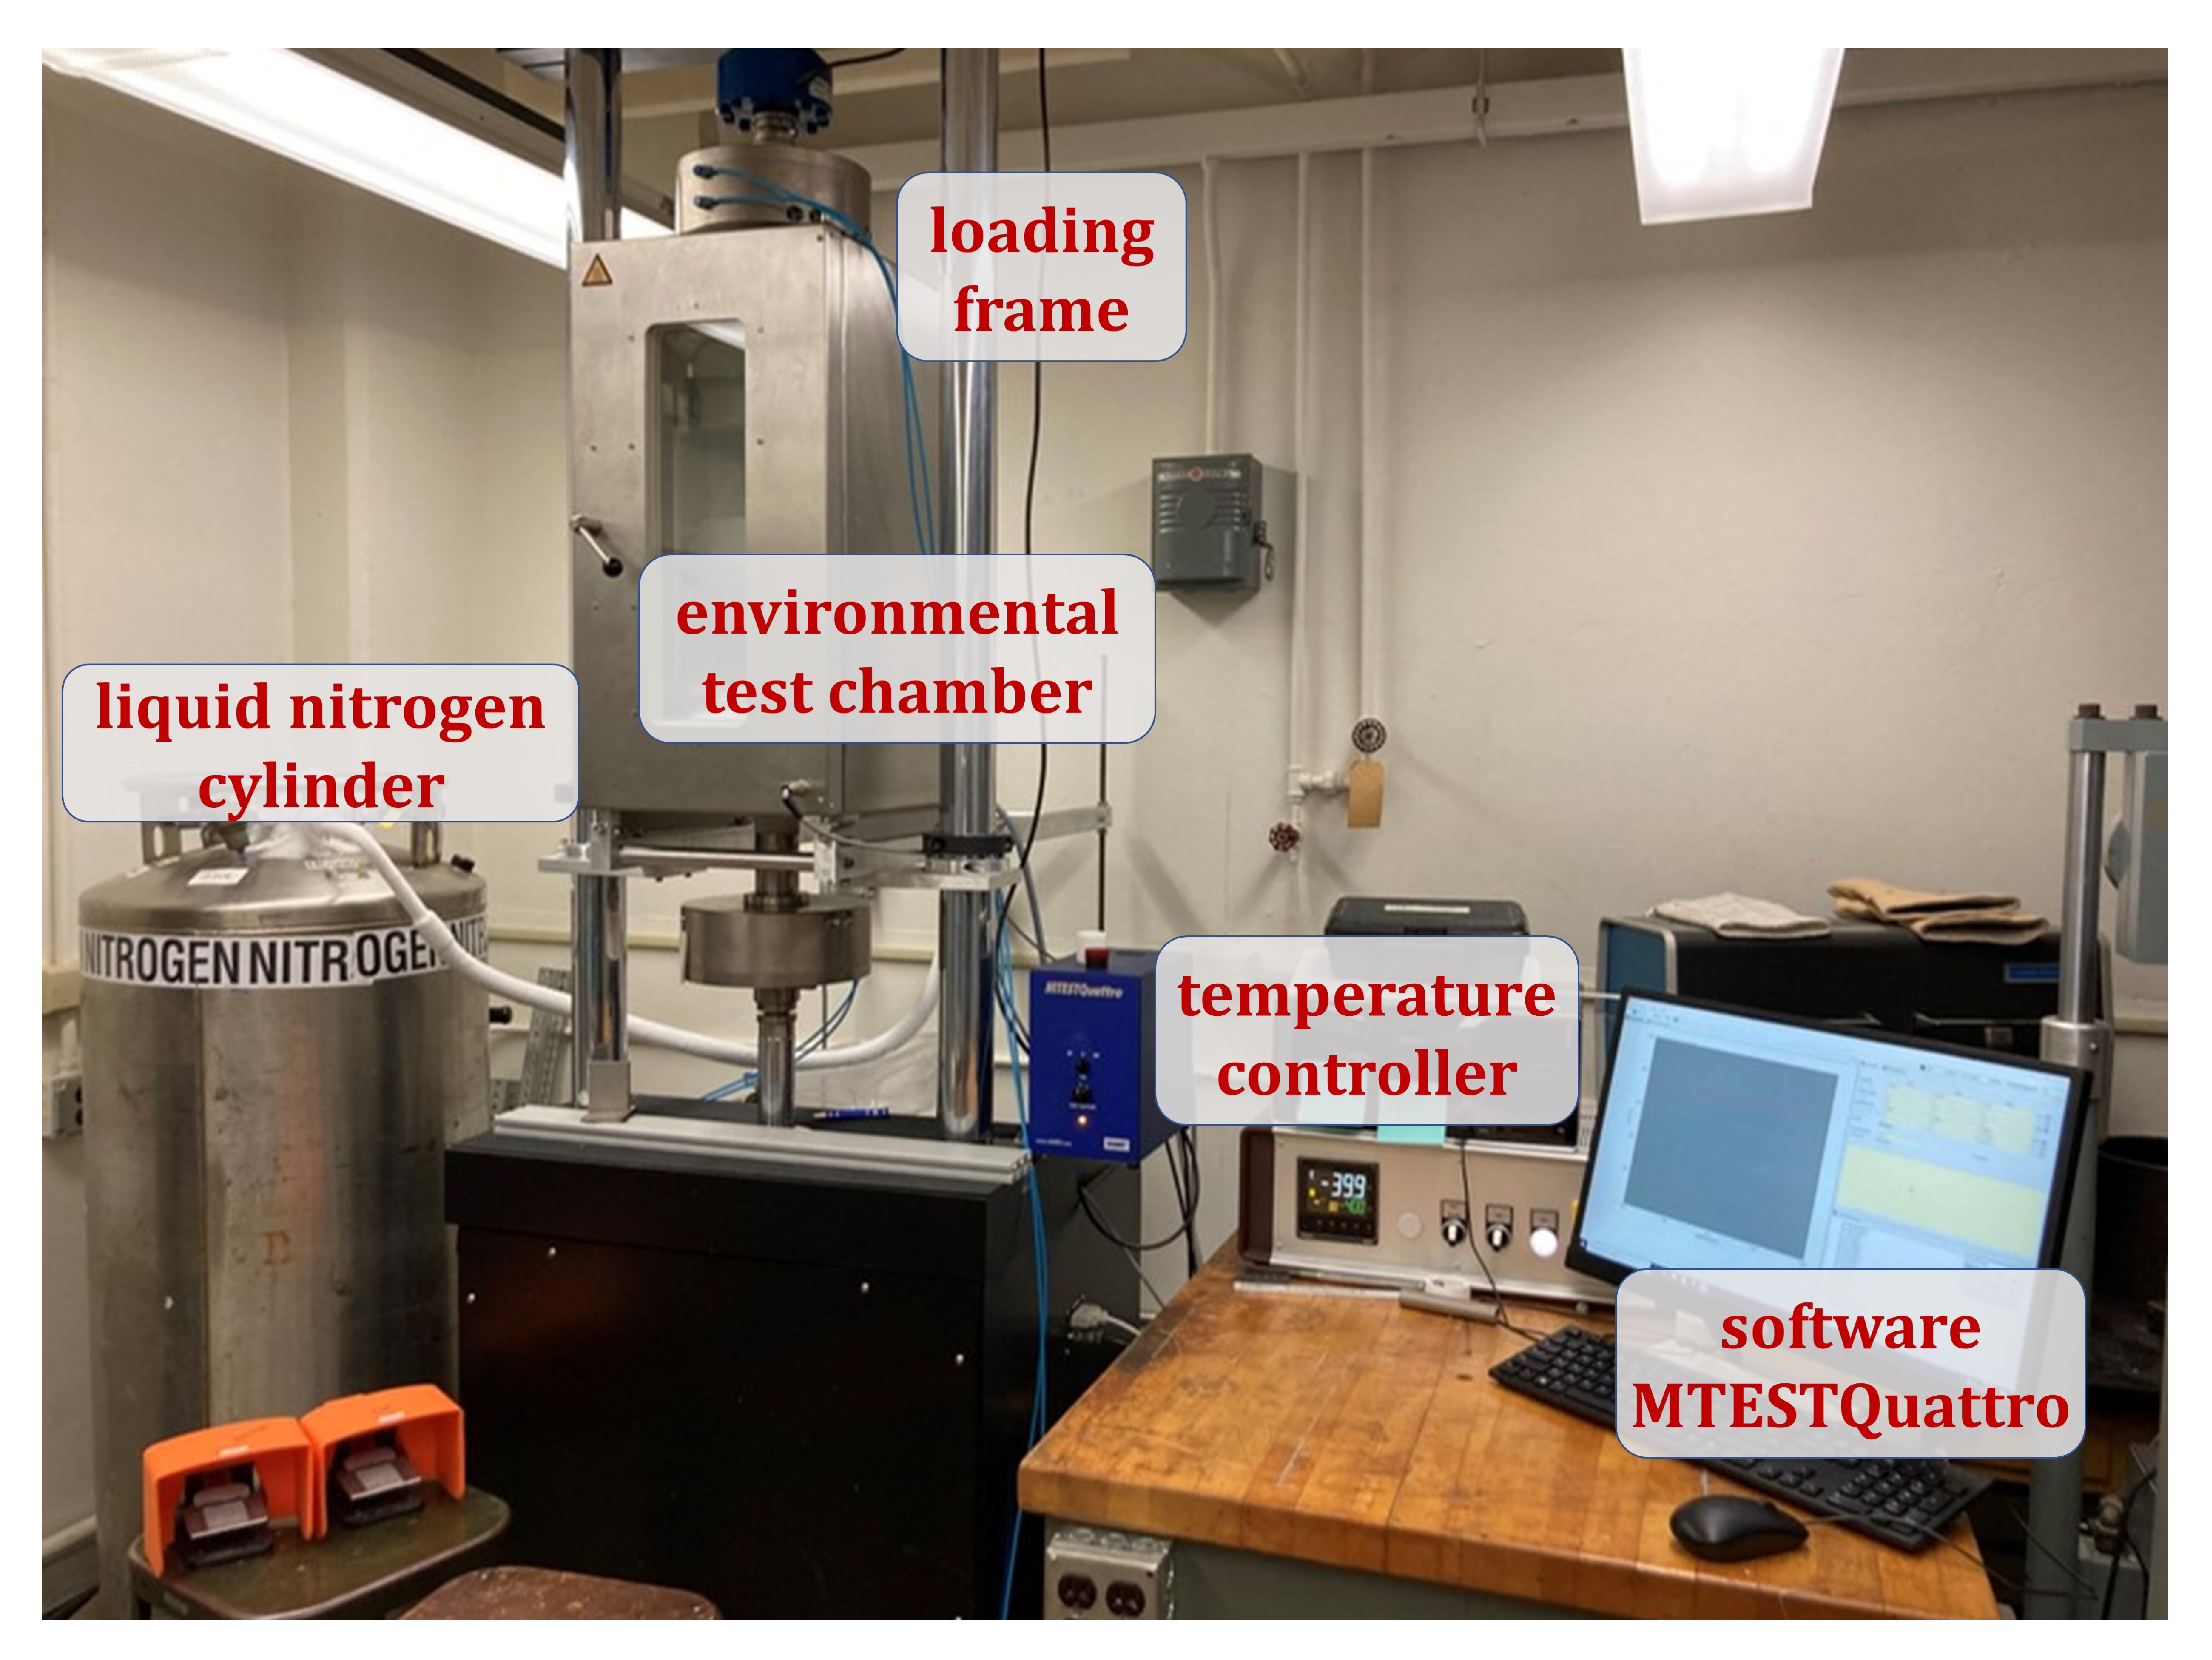
Figure 1. Test apparatus setup for the subzero temperature experiment.
Buildings 13 00399 g001
Figure 2. Nominal dimension of the tensile specimen (unit: mm).
Buildings 13 00399 g002
Figure 3. Elongations measured at various gauge lengths.
Buildings 13 00399 g003
Figure 4. The failure modes of AHSS specimens at fracture. Necking is observed in DP-580/980 specimens.
Buildings 13 00399 g004
Figure 5. The failure modes of HSLA-700/980 and Mild-395/450 specimens at fracture. Necking is observed in Mild-395/450 specimens.
Buildings 13 00399 g005
Figure 6. Experimental stress-strain curves from the steady-state subzero temperature tests with the fit between the test curves and the two-stage plus linear model for AHSS and HSLA steel.
Buildings 13 00399 g006
Figure 7. Experimental stress–strain curves from the steady-state subzero temperature tests with the fit between the test curves and the updated bilinear plus nonlinear model with recalibrated coefficients for Mild-395/450 at ambient and subzero temperatures.
Buildings 13 00399 g007
Figure 8. Elongations of various gauge lengths measured using the grid method and corresponding normalized factors for (a) DP-580/980; (b) HSLA-700/980; (c) MS-1030/1300; (d) MS-1200/1500; (e) Mild-395/450.
Buildings 13 00399 g008
Figure 9. Normalized factors of elastic modulus for AHSS, HSLA-700/980, Mild-395/450, and data from published experiments. The dashed line represents an increase of 20% compared with ambient.
Buildings 13 00399 g009
Figure 10. Normalized factors of (a) yield strength and (b) ultimate strength for AHSS, HSLA-700/980, Mild-395/450, and data from published experiments. The dashed line represents an increase of 30% compared with ambient.
Buildings 13 00399 g010
Figure 11. Normalized factors of (a) yield strain, (b) ultimate strain, and (d) fracture strain for AHSS, HSLA-700/980, Mild-395/450, and data from published experiments. Subplot (c) is a magnification of subplot (b) at a normalized factor of 1. Subplot (e) is a magnification of subplot (d) at a normalized factor of 1. The dashed lines represent an increase/decrease of 30% compared with ambient.
Buildings 13 00399 g011
Figure 12. Overall elongations for AHSS, HSLA-700/980, Mild-395/450, and data from published experiments compared with current standard requirements [7,61,63].
Buildings 13 00399 g012
Figure 13. (a) The ratio between ultimate strength and yield strength for AHSS, HSLA-700/980, Mild-395/450, and data from published experiments compared with current standard requirements [7,61]; (b) magnification of plot (a) at a normalized factor of 1.3.
Buildings 13 00399 g013
Table 1. Chemical composition of the steel sheets measured in mass percentage.
ElementDP-580/980HSLA-700/980MS-1030/1300MS-1200/1500Mild-395/450
C0.1670.1040.160.280.04
Si1.4130.0120.40.40.02
Mn2.02.321.81.30.65
P0.010.0130.020.020.015
S0.0020.0040.010.010.003
Al0.0470.0310.0150.0150.025
Nb + Ti0.006-0.10.10.018
Cr + Mo0.0430.6061.01.00.08
V0.0050.001--0.002
B0.00030.00010.0050.01-
Cu0.020.020.20.20.09
Ni0.010.01--0.03
Sn0.0080.002--0.005
N0.0040.005--0.008
Cb0.0030.002---
Sb-0.001---
Ca-0.001--0.002
Table 2. Nominal properties and coating of the steel sheets.
Steel t n (mm) σ ny (MPa) σ nu (MPa)Coating
Mild-395/4501.8395450uncoated
DP-580/9801.8580980uncoated
HSLA-700/9800.6700980zinc-coated
MS-1030/13001.010301300uncoated
MS-1200/15001.012001500uncoated
Table 3. Experimental properties of AHSS and conventional steel specimens.
Specimenbt E T σ 0.2 T ε 0.2 T σ 2.0 T σ uT ε uT σ fT ε fT
mmmmGPaMPa%MPaMPa%MPa%
Mild-395/450+20-112.921.905226.7514.40.427516.2559.111.97-31.04
Mild-395/450-0-112.861.912218.1566.80.460567.4611.117.71-26.90
Mild-395/450-20-112.831.905231.9575.70.449576.0621.815.05-27.22
Mild-395/450-40-112.861.908220.9601.70.472605.9651.216.45-30.26
Mild-395/450-60-112.891.910211.7600.00.483606.3652.717.73-26.98
DP-580/980+20-112.941.804213.2750.50.552985.61095.59.84967.514.84
DP-580/980+20-212.911.822216.6752.50.548982.31097.010.53964.016.22
DP-580/980-0-112.951.820212.9785.20.5691019.61137.210.921005.315.32
DP-580/980-0-212.961.806215.5788.60.5661016.61136.39.72963.616.10
DP-580/980-20-112.941.810218.0789.40.5621023.21143.79.89998.316.05
DP-580/980-20-212.931.833207.4798.80.5851027.61153.011.051013.317.69
DP-580/980-40-112.911.832212.0826.50.5901056.91195.511.771042.816.89
DP-580/980-40-212.971.815214.0808.20.5771039.81167.99.771039.016.64
DP-580/980-60-112.941.830210.0846.50.6031074.11218.411.971071.516.29
DP-580/980-60-212.951.816214.7840.40.5921070.91212.911.221061.016.51
HSLA-700/980+20-112.700.590203.6767.00.5771033.21127.78.911112.110.17
HSLA-700/980+20-212.700.591202.4758.20.5751023.91119.910.621103.710.91
HSLA-700/980-0-112.730.589199.8772.60.5871037.21137.97.651127.510.23
HSLA-700/980-0-212.750.584197.6764.50.5871031.01130.66.981117.310.57
HSLA-700/980-20-112.800.581199.7760.40.5811021.71132.48.001096.012.96
HSLA-700/980-20-212.760.591203.2779.30.5831049.31152.08.541103.712.86
HSLA-700/980-40-112.710.593202.4782.00.5861055.51162.58.681123.912.73
HSLA-700/980-40-212.760.585202.2779.60.5851048.01155.78.501093.913.21
HSLA-700/980-60-112.730.597198.9798.60.6011070.91187.09.851134.213.40
HSLA-700/980-60-212.790.598194.2798.60.6111083.81212.710.261205.910.66
MS-1030/1300+20-112.630.991215.91333.00.8171484.11493.32.491196.22.48
MS-1030/1300+20-212.620.992208.01317.10.8331477.91492.72.771199.63.91
MS-1030/1300-0-112.630.990201.61332.30.8611479.61498.13.471220.05.04
MS-1030/1300-0-212.620.991202.41329.60.8571477.41491.92.951143.94.44
MS-1030/1300-20-112.580.993216.41323.00.8111479.91497.83.251172.65.06
MS-1030/1300-20-212.650.990205.91347.40.8541496.41511.42.901182.53.22
MS-1030/1300-40-112.560.985209.91343.10.8401499.21517.93.221199.45.03
MS-1030/1300-40-212.540.986208.41341.90.8441496.51513.13.211153.24.99
MS-1030/1300-60-112.540.985215.01348.40.8271505.51524.13.401177.25.15
MS-1030/1300-60-212.630.988206.41335.40.8471501.01521.73.321173.55.16
MS-1200/1500+20-112.531.010204.61401.60.8851578.41620.34.151282.36.16
MS-1200/1500+20-212.571.003199.61412.50.9081584.11626.44.031282.56.15
MS-1200/1500-0-112.581.006208.61442.40.8921620.01660.74.021301.26.05
MS-1200/1500-0-212.600.996208.51452.10.8961622.71661.53.971307.45.90
MS-1200/1500-20-112.631.000203.21452.50.9151619.51660.04.051322.95.84
MS-1200/1500-20-212.601.007206.51457.60.9051625.41664.73.921275.46.68
MS-1200/1500-40-112.631.011205.71450.10.9051615.01652.83.711253.15.86
MS-1200/1500-40-212.471.008204.81451.60.9091623.91665.64.111295.36.33
MS-1200/1500-60-112.560.992207.91495.80.9191637.01669.43.451288.85.64
MS-1200/1500-60-212.581.011198.61464.10.9371633.51675.54.191350.96.41
(acronyms) AHSS: advanced high-strength steel; DP: dual phase; HSLA: high-strength low-alloy; MS: martensitic.
Table 4. Key stresses and strains of Mild-395/450 at subzero temperatures.
T20 C0 C−20 C−40 C−60 C
σ y T (MPa)517.0566.8576.5604.2601.2
σ u y T (MPa)555.9591.2625.6662.3633.7
ε y T (%)0.2280.2600.2490.2740.284
ε s h T (%)4.364.324.704.874.95
Disclaimer/Publisher’s Note: The statements, opinions and data contained in all publications are solely those of the individual author(s) and contributor(s) and not of MDPI and/or the editor(s). MDPI and/or the editor(s) disclaim responsibility for any injury to people or property resulting from any ideas, methods, instructions or products referred to in the content.