Article

Shear and Punching Capacity Predictions for One-Way Slabs under Concentrated Loads Considering the Transition between Failure Mechanisms

by
Alex Micael Dantas de Sousa
1,
Eva Olivia Leontien Lantsoght
2,3,* and
Mounir Khalil El Debs
1
1
São Carlos School of Engineering, University of São Paulo, São Carlos 13566-590, SP, Brazil
2
Colegio de Ciencias e Ingenierías, Universidad San Francisco de Quito, Quito 170901, Ecuador
3
Engineering Structures, Delft University of Technology, 2628 CD Delft, The Netherlands
*
Author to whom correspondence should be addressed.
Buildings 2023, 13(2), 434; https://doi.org/10.3390/buildings13020434
Submission received: 26 December 2022 / Revised: 31 January 2023 / Accepted: 2 February 2023 / Published: 4 February 2023
(This article belongs to the Special Issue Advanced Design & Behavior of Concrete Structures)

Abstract

:
Reinforced concrete one-way slabs under concentrated loads can develop different shear failure mechanisms: as wide beams in one-way shear, punching shear around the load or a mixed mode between them. Until now, most publications presented recommendations to assess the shear capacity considering only the one-way shear failure mechanism. This study proposed developing recommendations to assess both the one-way shear and punching shear capacity of such slabs. Different codes of practice were addressed, including the current Eurocode and fib Model Code 2010 expressions. The recommendations were validated against 143 test results from the literature. Following these recommendations, one-way shear and punching capacities predictions achieved enhanced and almost the same level of accuracy.

1. Introduction

Reinforced concrete one-way slabs under concentrated loads are commonly found in bridge decks (Figure 1a). In the last decades, this case attracted the increasing attention of the research community because bridges built between the 1960s and 1970s are reaching the end of the design service life [1,2]. To extend the service life of these structures, it is necessary to attest that bridges designed with old codes fulfill the requirements of the current ones. In this context, the expressions to calculate the nominal shear capacity (shear force per unit length) from past codes were replaced by expressions that may be more conservative than those used in the past [2]. In addition, the design trucks became heavier, which increased the design actions. In other words, the same structures must support higher design actions with a lower design resistance. Owing to this, many slab bridges were rated as critical in one-way shear following the traditional design rules applied to assessment.
The traditional approach to verify the one-way shear capacity of such kinds of slabs is the assumption that only a slab strip, of a width equal to the effective shear width (beff), contributes to the one-way shear capacity (Figure 1b). In practice, this means that the load effect from each loading axle can be distributed over a certain length (the effective shear width) to calculate the total shear stress at the control section (Figure 1b). In assessing existing structures, the actual shear demand vE is compared to the nominal shear resistance vR to define if the structure satisfies the requirements of one-way shear resistance. Figure 1b shows the approach frequently named the French load-spreading method resulting in the French effective shear width [3,4], which assumes that the load is spread horizontally from the load back sides with a fixed angle of 45 degrees.
Until now, most investigations regarding the accuracy of the approach presented in Figure 1b have been based on reduced-scale laboratory tests (Figure 1c) [5,6,7,8,9,10,11]. For such tests, it is more frequent to compare tested and predicted resistances in terms of force (Vtest for the achieved sectional shear in the test and VR for the predicted sectional one-way shear capacity). In the last approach, the effective shear width beff is frequently multiplied by the unitary shear resistance (vR) in comparing tested and predicted resistances.
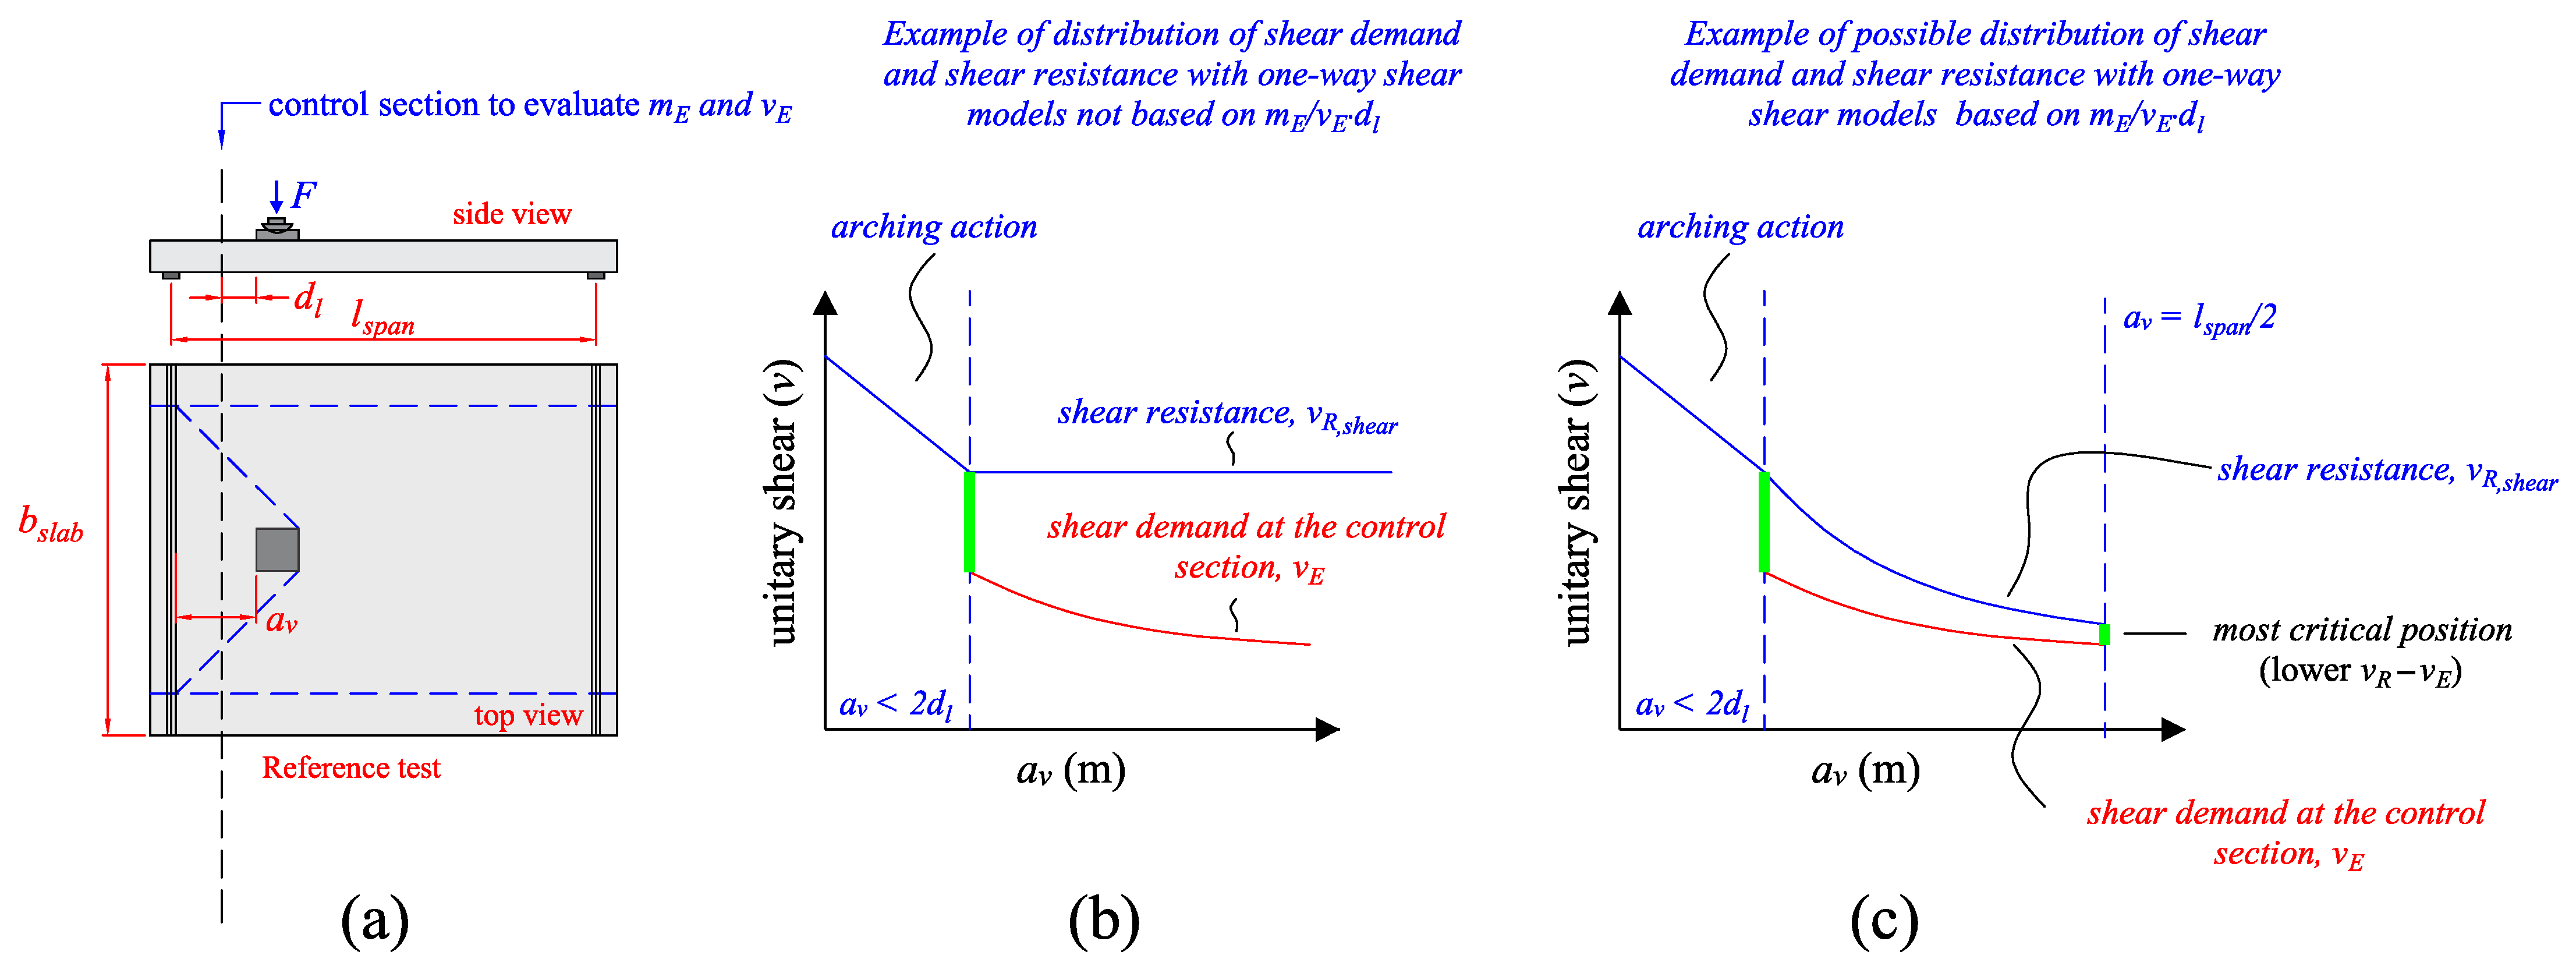
In some studies [5,12], different models of the effective shear width were tested with the current Eurocode shear expressions. Between the main results, it was observed that the French effective shear width provides good predictions of one-way shear capacity when the load is placed close to the support (av/dl ≤ 2) or when the slabs fail in one-way shear as wide beams [13]. However, this approach presents the shortcoming that the effective shear increases excessively as the distance from the load to the support av increases. In practice, this causes the predicted one-way shear capacity to frequently overestimate the tested resistance when the loads are placed far from the support [7,10,13,14]. Until the last years, this has not been considered a significant deficiency because the most critical position of the design tandem for one-way shear was always considered close to the support (av = 2dl). In practice, this occurs because arching action improves the shear capacity for a distance av ≤ 2dl and because placing the load close to the support increases the shear demand at the support vE (Figure 2a,b). However, with the advancing understanding of the one-way shear behavior [15,16,17], this argument is subject to discussion. In fact, increasing the load distance from the support decreases the load effect vE close to the load (action side). On the other hand, the unitary shear capacity vR also decreases by increasing av due to the higher bending moments around the load (Figure 2c). In summary, the most critical position for one-way shear in Figure 2a can be at the mid-span and not at the support, depending on how the load effect vE and the shear resistance vR vary by increasing av. Additionally, the approach of checking only one position of the design tandem for one-way shear comes from the use of hand calculations in the past. Nowadays, with the aid of computational tools, it is possible to calculate the load effect for several load positions and for each control section in such a way as to search for the most critical position (resulting in the highest ratio between shear demand vE and shear capacity vR). Therefore, a correction in the predicted effective shear width may be needed to evaluate the one-way shear resistance at different load positions.
Furthermore, most publications frequently address the problem by discussing only the one-way shear failure mechanism, even though some tests reported in the literature failed by punching [6,7,18]. Consequently, recommendations to assess the punching capacity of such slabs are scarce or focused on specific boundary conditions [18,19,20]. For instance, most publications did not discuss how to consider the influence of the free edges on the effective contribution of the sides of the control perimeter close to them. Moreover, most codes do not discuss the consideration of arching action in a portion of the control perimeter for loads close to the support.
Based on the presented ideas, the following research question was identified: how can the one-way shear and punching shear capacity predictions reach enhanced levels of accuracy by simple and effective enhancements of the current approaches?
This study addresses the research question and proposes a set of recommendations that allow assessing the one-way shear and punching capacity of one-way slabs under concentrated loads with better precision using the European [22] and fib Model Code expressions [21]. For this purpose, key parameters influencing the transition between one-way and two-way shear failures for such slabs were addressed and considered in the proposed approaches: (i) the load position, (ii) load size and (iii) the slab width [23,24]. Although simple, accurate predictions of shear and punching shear capacity can be achieved, regardless of the governing failure mechanism of the slabs. In other words, for instance, precise and safe predictions of one-way shear capacity for such slabs can be achieved, even when the test results indicate a punching failure. In practice, the presented approach increases the safety of the global verification since both one-way shear and punching shear capacity predictions will present enhanced levels of accuracy.

2. Literature Review

2.1. Background Calculations for One-Way Shear

The one-way shear capacity of one-way slabs under concentrated loads is commonly calculated by multiplying the unitary shear resistance (shear resistance per unit length) by a given effective shear width:
V R , p r e d i c t e d = v R , s h e a r b e f f
The expressions to calculate the unitary shear capacity vR,shear according to EN 1992-1-1:2004 [25] are presented below (the legend of each parameter appears in the Notations Section; these expressions use average values for material properties to compare tested and predicted resistances):
v R , s h e a r , E N = max C R , c k ( 100 ρ l f c ) 1 / 3 + k 1 σ c p d l v min + k 1 σ c p d l with   d l   in   [ mm ]   and   f c   in   [ MPa ]
v min = 0.035 k 3 / 2 f c 1 / 2
C R , c = 0.18
k = 1 + 200 d l 2 ,   with   d l   in   [ mm ]
The expressions to calculate the unitary shear capacity vR,shear according to fib Model Code 2010 [21] are presented below:
v R , s h e a r , M C = k v f c z ,   with   f c   in   [ MPa ]
k v = 0.4 1 + 1500 ε x 1300 1000 + k d g z ,   with   z   in   [ mm ]
ε x = 1 2 E s A s m E z + v E
k d g = 32 16 + d g 0.75 ,   with   d g   in   [ mm ]
z 0.9 d l
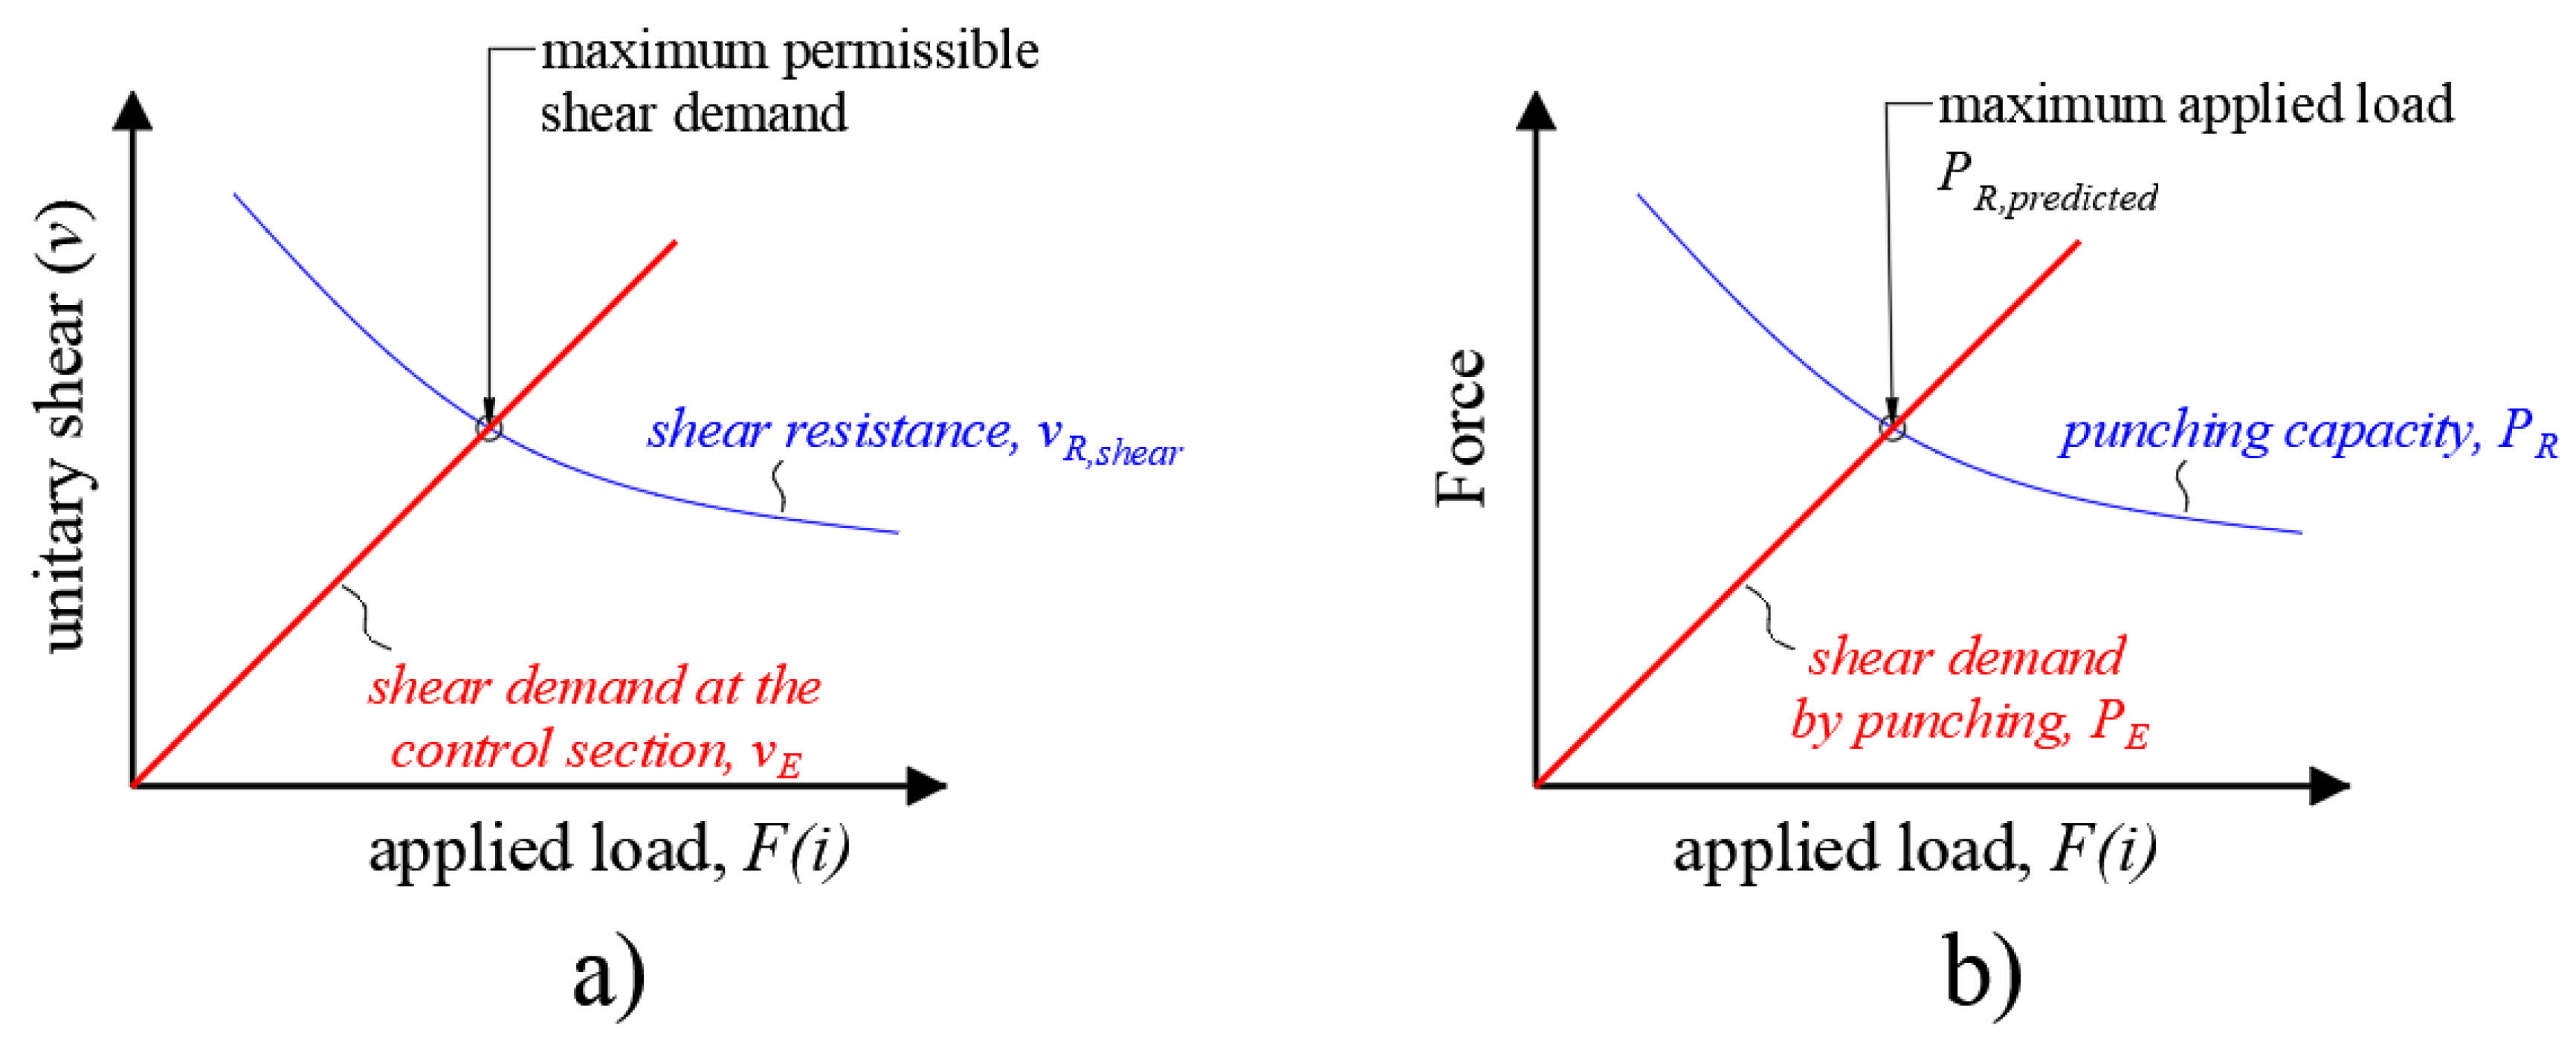
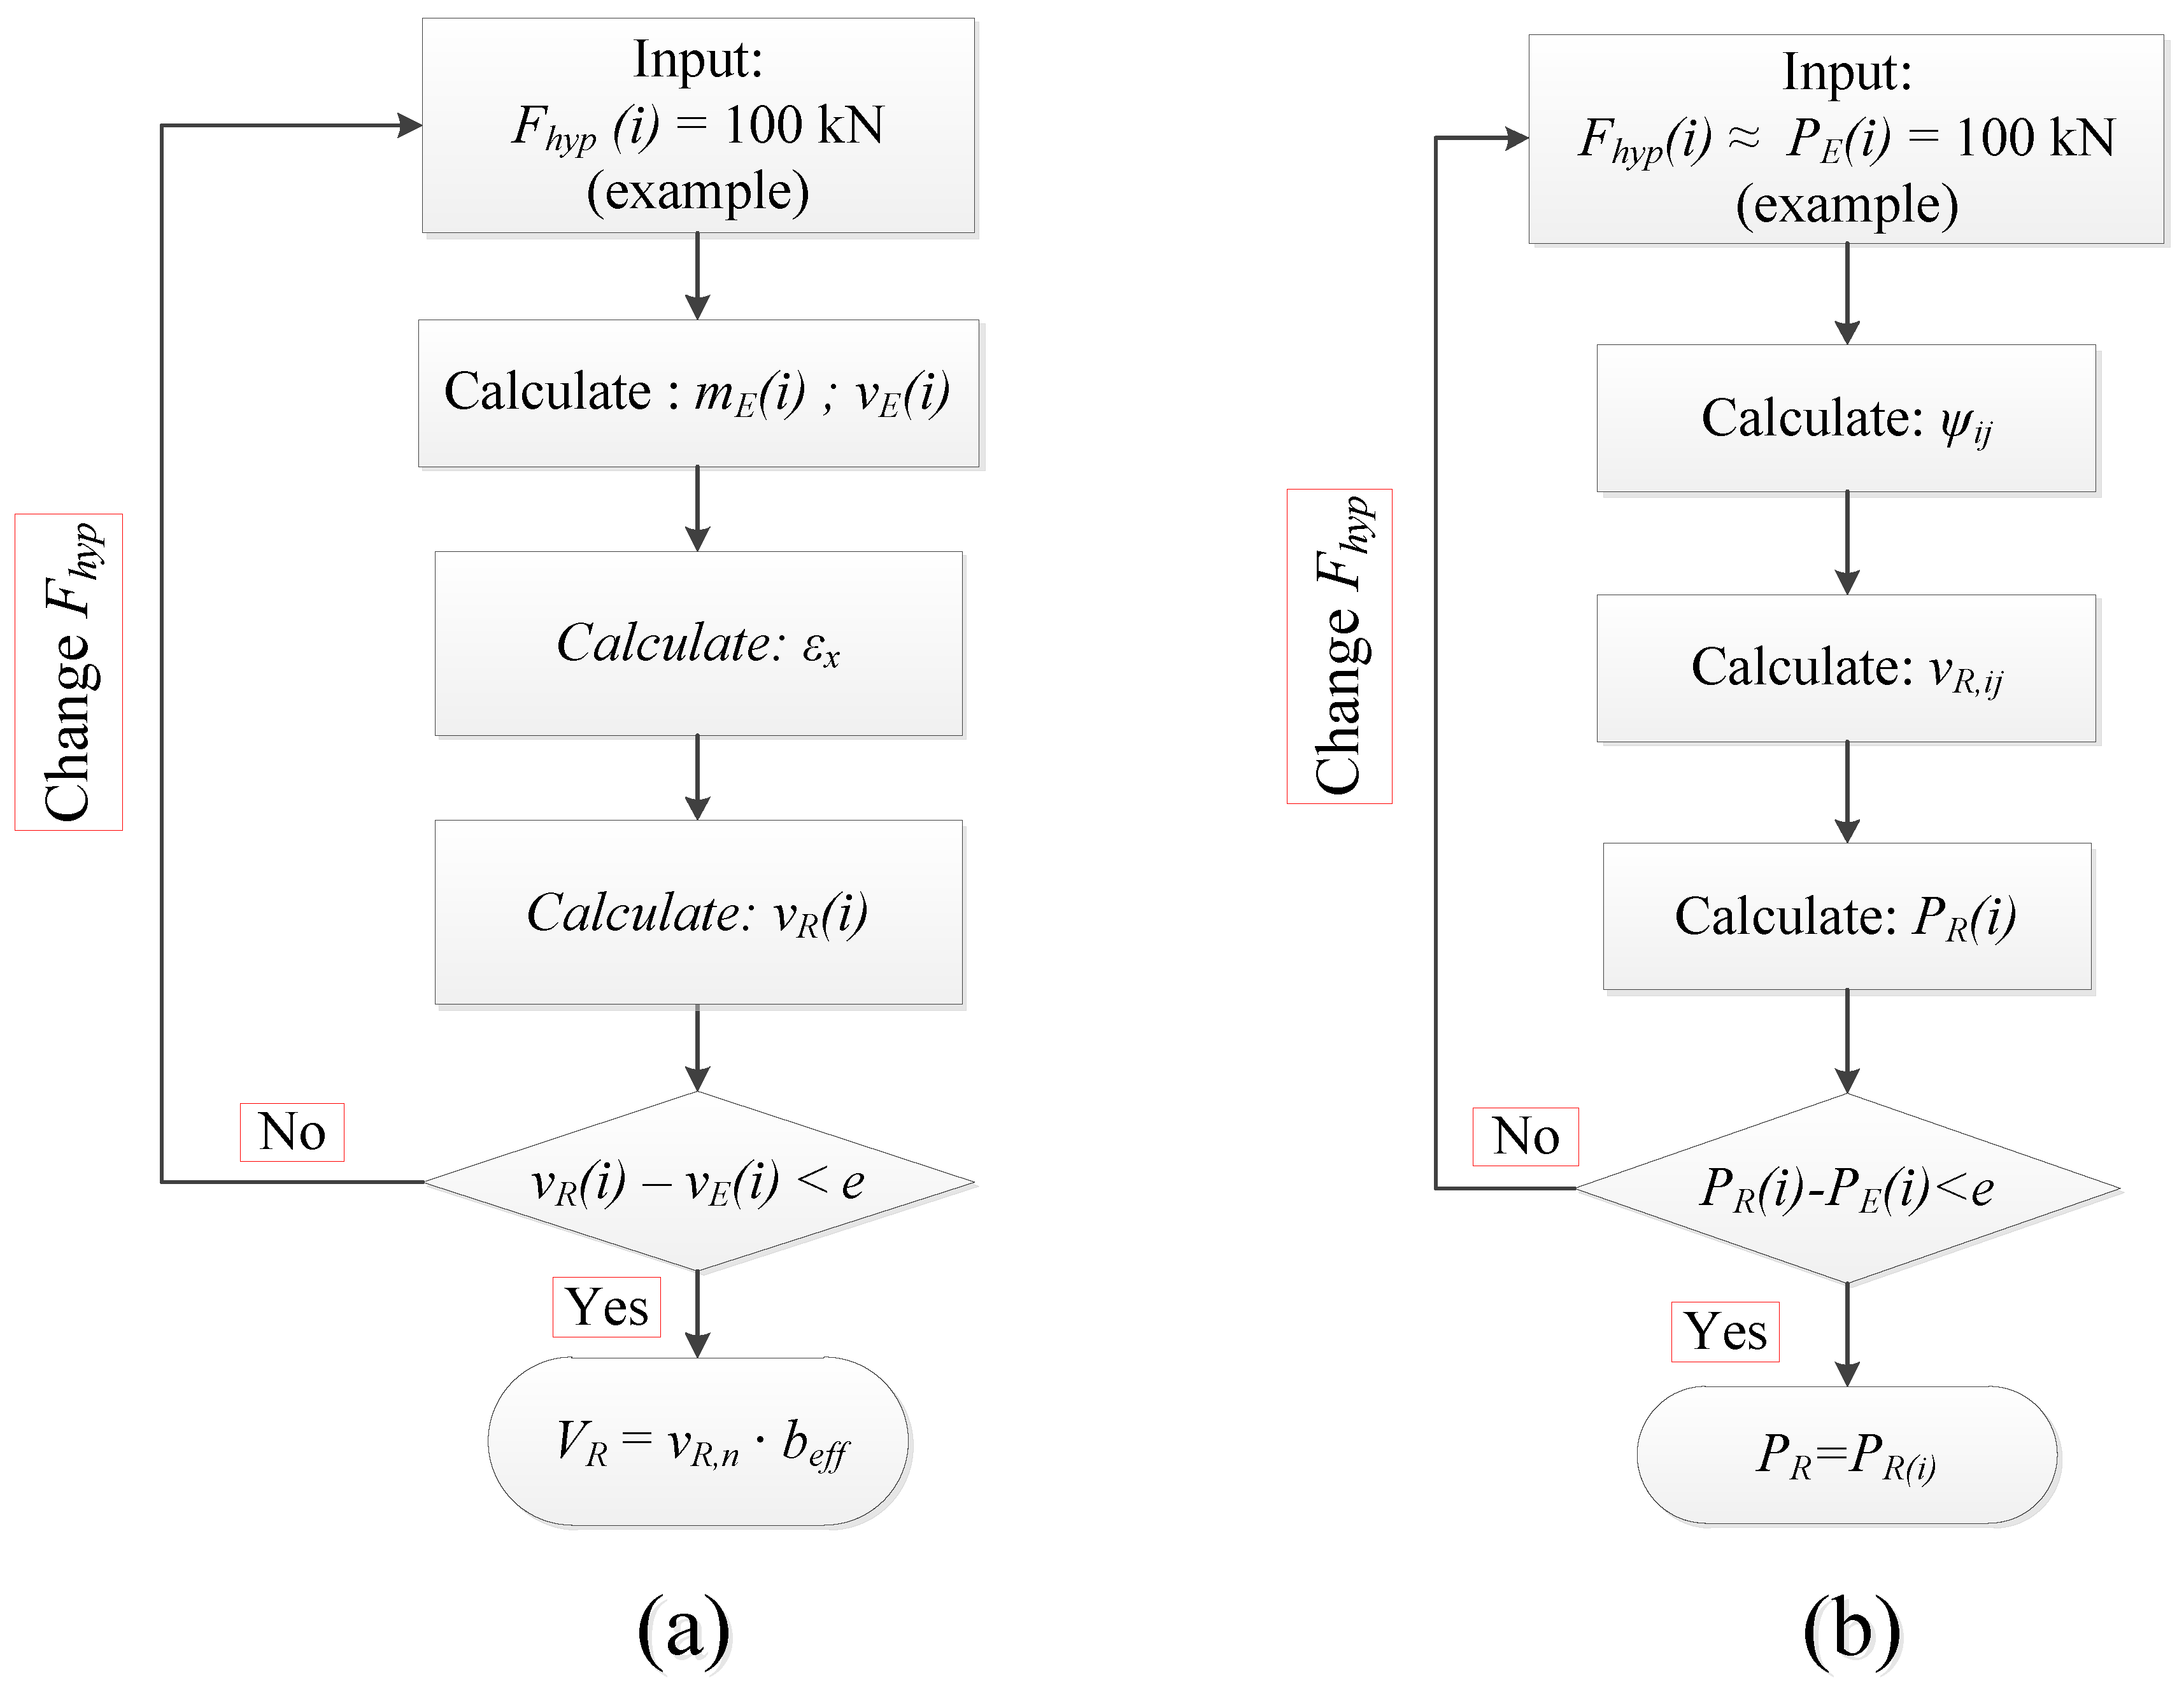
In the case of the fib Model Code 2010 [21], the reader can realize that the unitary shear capacity vR,shear,MC is a function of the applied concentrated load F and, consequently, the unitary bending moments in the control section mE. In the design or assessment of existing structures, the loads F are generally known, and the solution of vR,shear,MC becomes direct (closed-form solution). However, in the comparison between tested and calculated resistances, the load that causes the failure or the predicted one-way shear capacity is determined iteratively by varying the applied load F(i) until the calculated unitary shear capacity vR(i) is equal to the unitary shear demand vE(i) (Figure 3a). Figure 4 shows a summary of the main calculations in the iterative process to calculate the unitary shear capacity and punching shear capacity with the fib Model Code expressions (the punching capacity calculations are discussed in more detail in the next sections).
While for beams, the relation between F and vE becomes straightforward, for slabs, most designers recur to using finite element analyses to determine the relation between F(i) and vE(i) and between F(i) and mE(i) in the case of one-way slabs under concentrated loads [10].
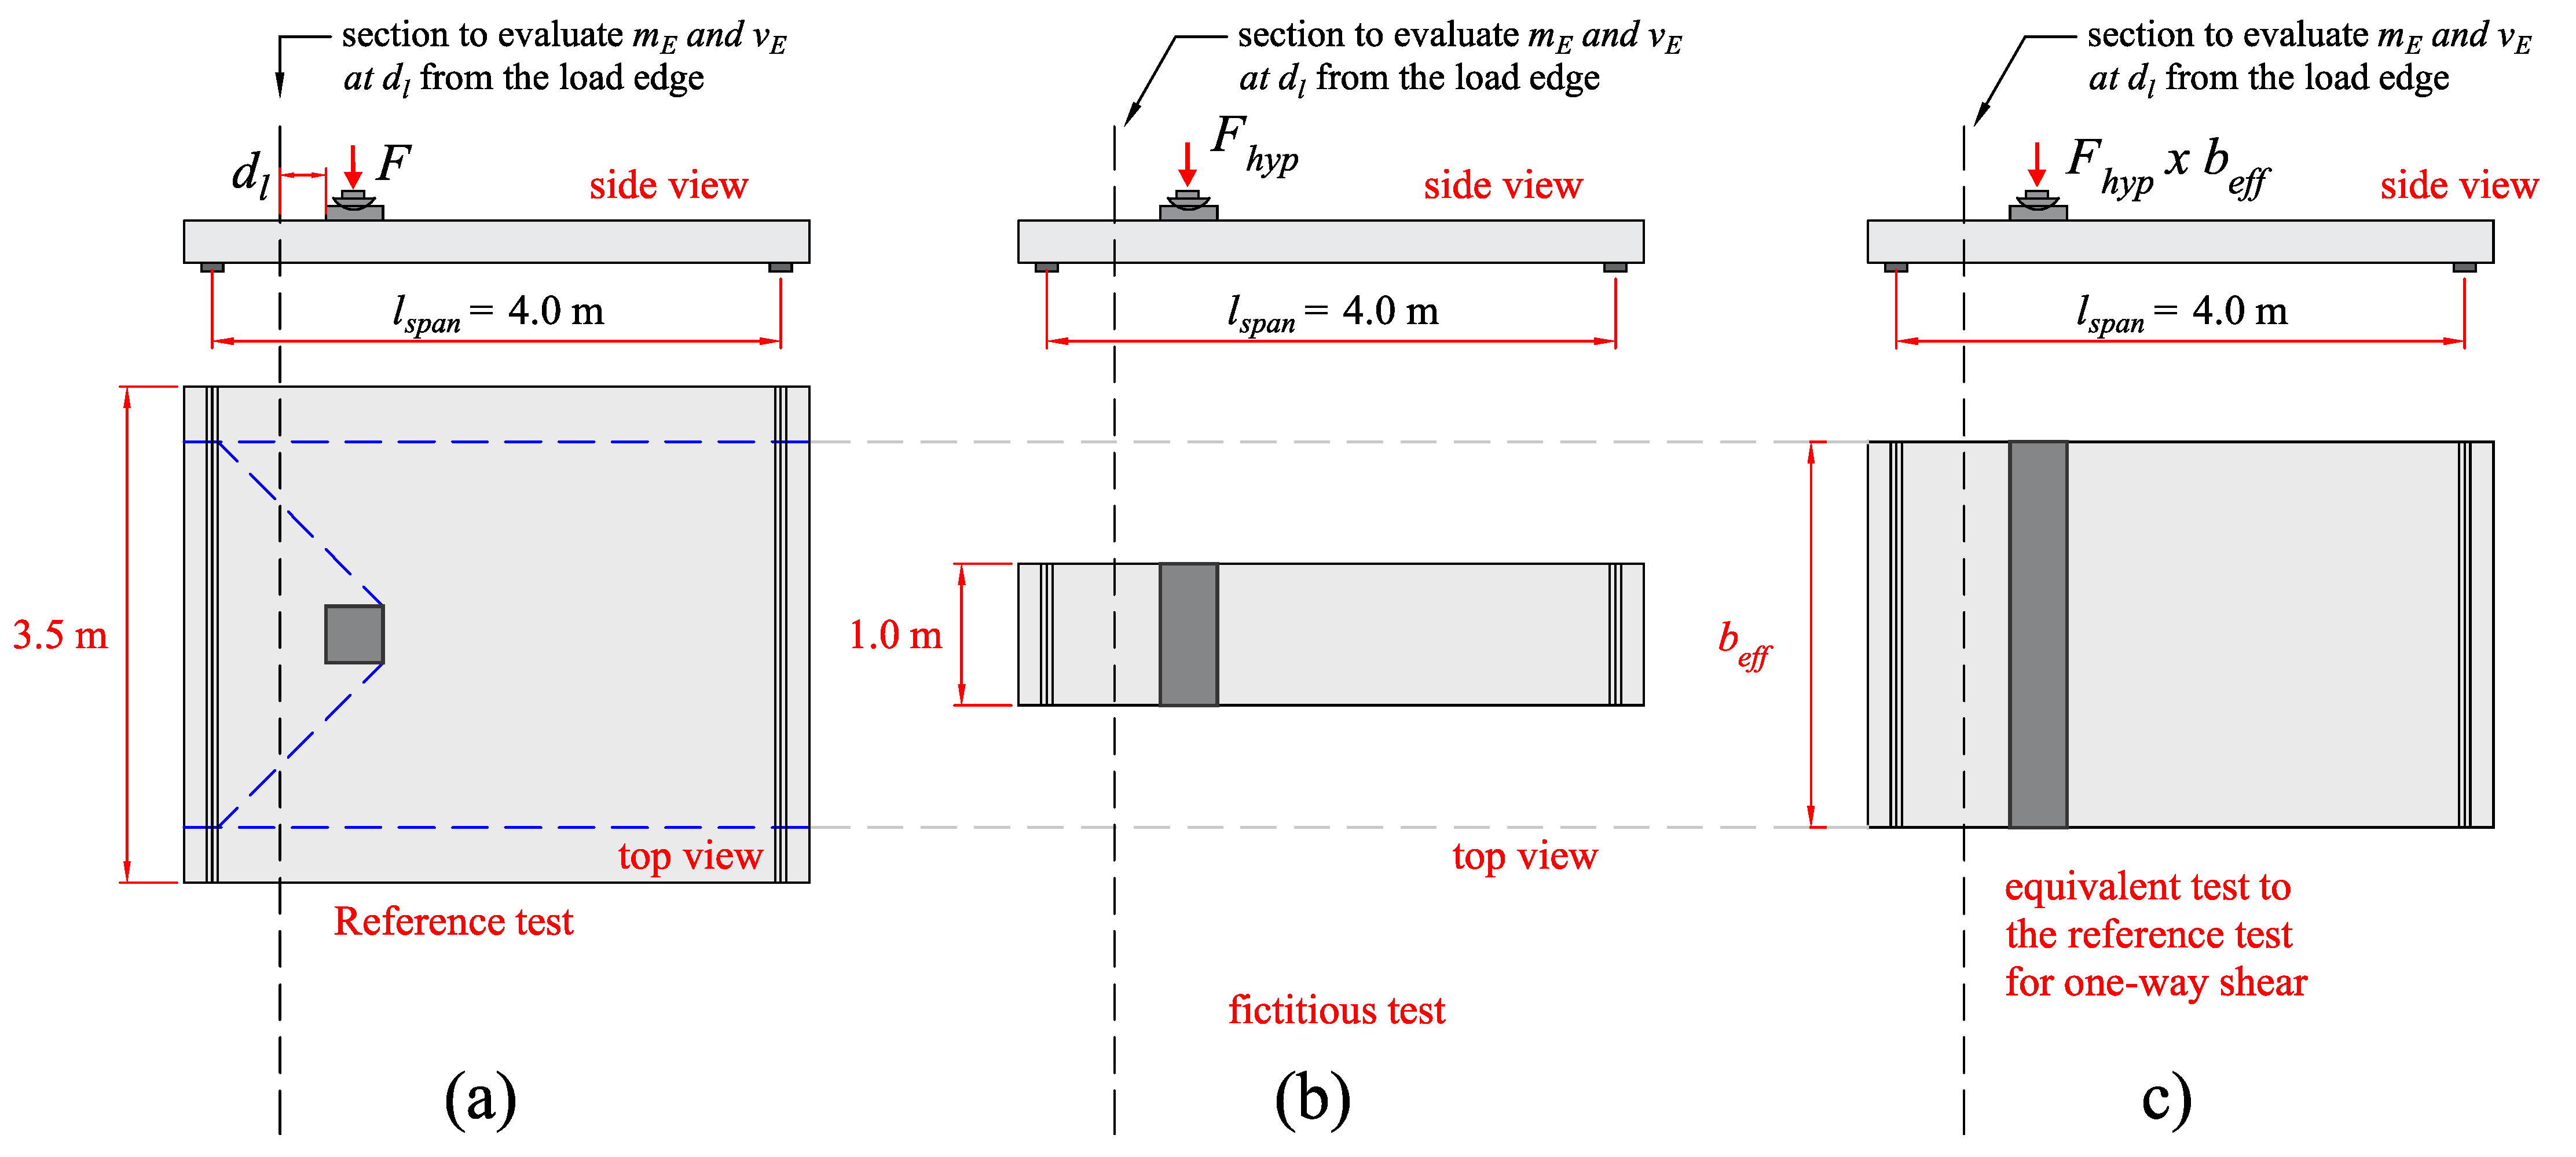
In order to allow the evaluation of the acting bending moments and shear forces for one-way slabs under concentrated loads, a simplified approach is proposed (Figure 5): (i) the reference test is transformed into a similar test with a width of 1 m and the bending moments and shear forces are calculated as in a beam loaded over the entire width. After determining iteratively the unitary shear capacity vR,shear,MC and the related concentrated load F(i) for a 1 m slab width, the total shear capacity and concentrated loads are multiplied by the respective effective shear width beff (Figure 5c). According to the fib Model Code 2010, the control section to evaluate the shear force vE and bending moments mE is placed at the distance of dl ≤ av/2 from the load edge for simply supported slabs and at dl ≤ av/2 from the support edge for cantilever slabs. For continuous members, the control section is placed closer to the load or the support, depending on which one leads to the lower shear resistance (typically the section with the higher ratio mE/vEdl).
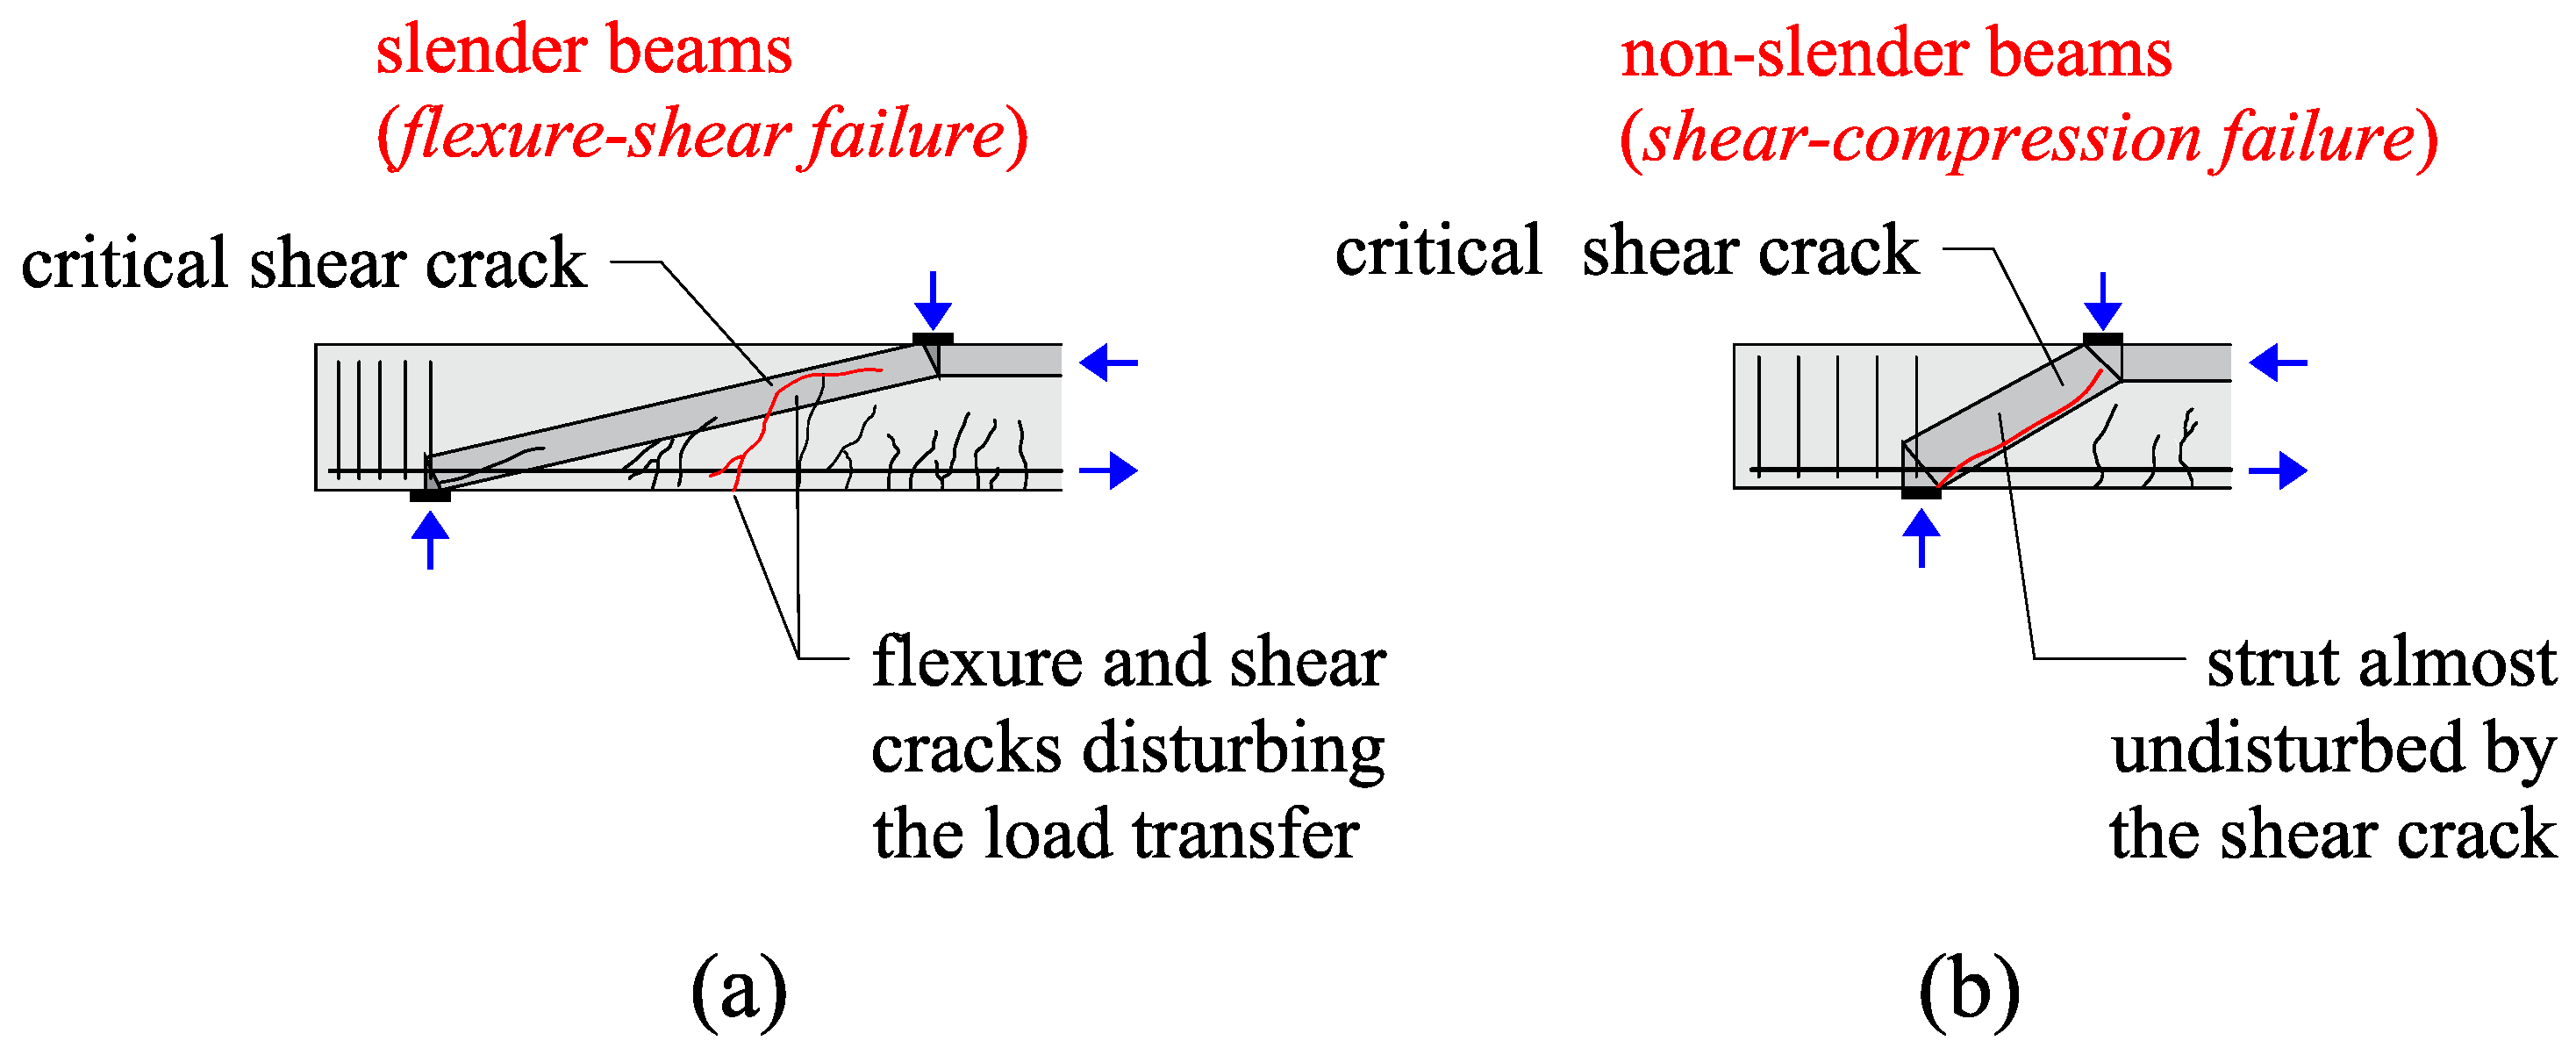
For concentrated loads close to the support, the EN 1992-1-1:2004 [25] and fib Model Code 2010 [21] allow decreasing the design shear load VEd for loads placed at av ≤ 2dl by considering that a portion of the load is taken directly to the support by strut or arching action. Figure 6 shows the cracking pattern of slender members failing in flexure-shear (here assumed with av/dl > 2, Figure 6a) and non-slender members failing in compression-shear (Figure 6b). It can be noted that the flexure-shear crack in Figure 6a disturbs the load transfer in the fictitious strut between the load and the support. On the other hand, when the concentrated loads are placed closer to the support (Figure 6b), the members fail in shear-compression, and direct load transfer between the load and the support can occur by a strut, which is named herein as arching action.
In this study, the following reduction factors β can be multiplied by the shear load VFu caused by the concentrated load Fu (Table 1).
Therefore, the shear load (VE) can be calculated as (considering the effect of the self-weight vg over the effective shear width assumed):
V E = V F u β + v g b e f f
Alternatively, one can also consider an enhanced shear capacity due to arching action instead of decreasing the shear demand VE [11]. In this way, the factor μ = 1/β can be multiplied by the unitary shear resistance vR, and VE and VR become:
V E = V F u + v g b e f f
V R = v R μ b e f f
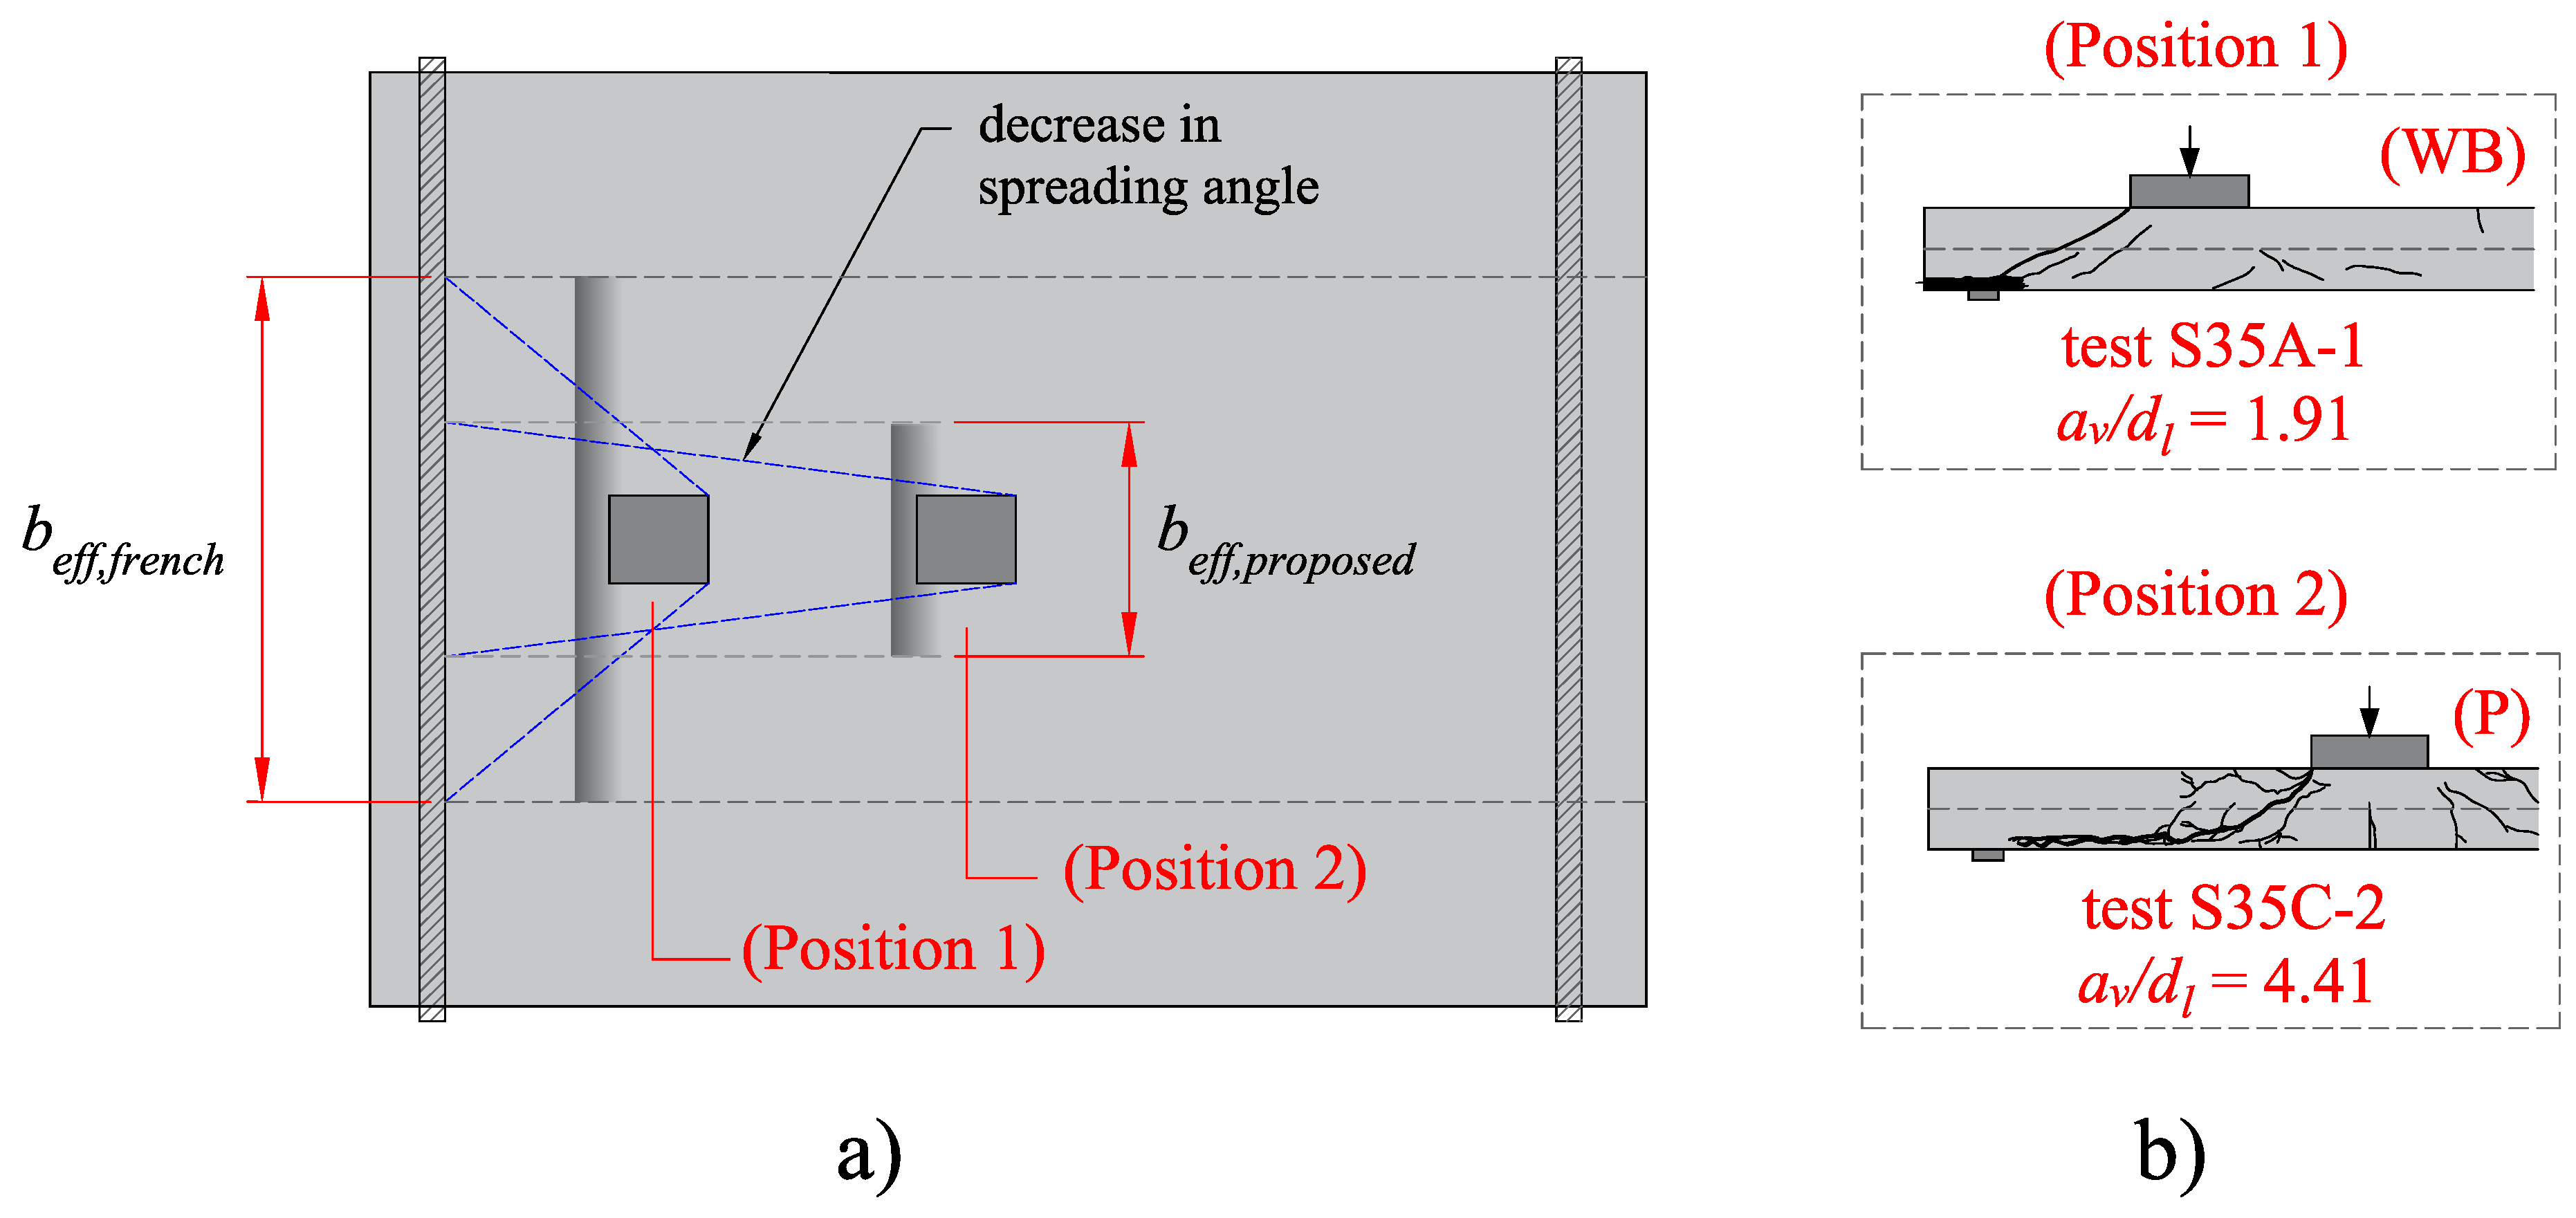
Nowadays, the most widespread approach to defining the effective shear width beff [3,4,5,12], also referred to as the French approach, is based on the horizontal load spreading toward the supports from the back sides of the load (Figure 7a). In the French approach, the angle of this horizontal spreading is fixed at 45 degrees. In the fib Model Code 2010 [21], the angle of spreading varies as a function of the support conditions (Figure 7b), and the reference line to calculate the effective shear width is placed at min{dl;av/2} from the support edge.

2.2. Insights from the Literature for One-Way Shear

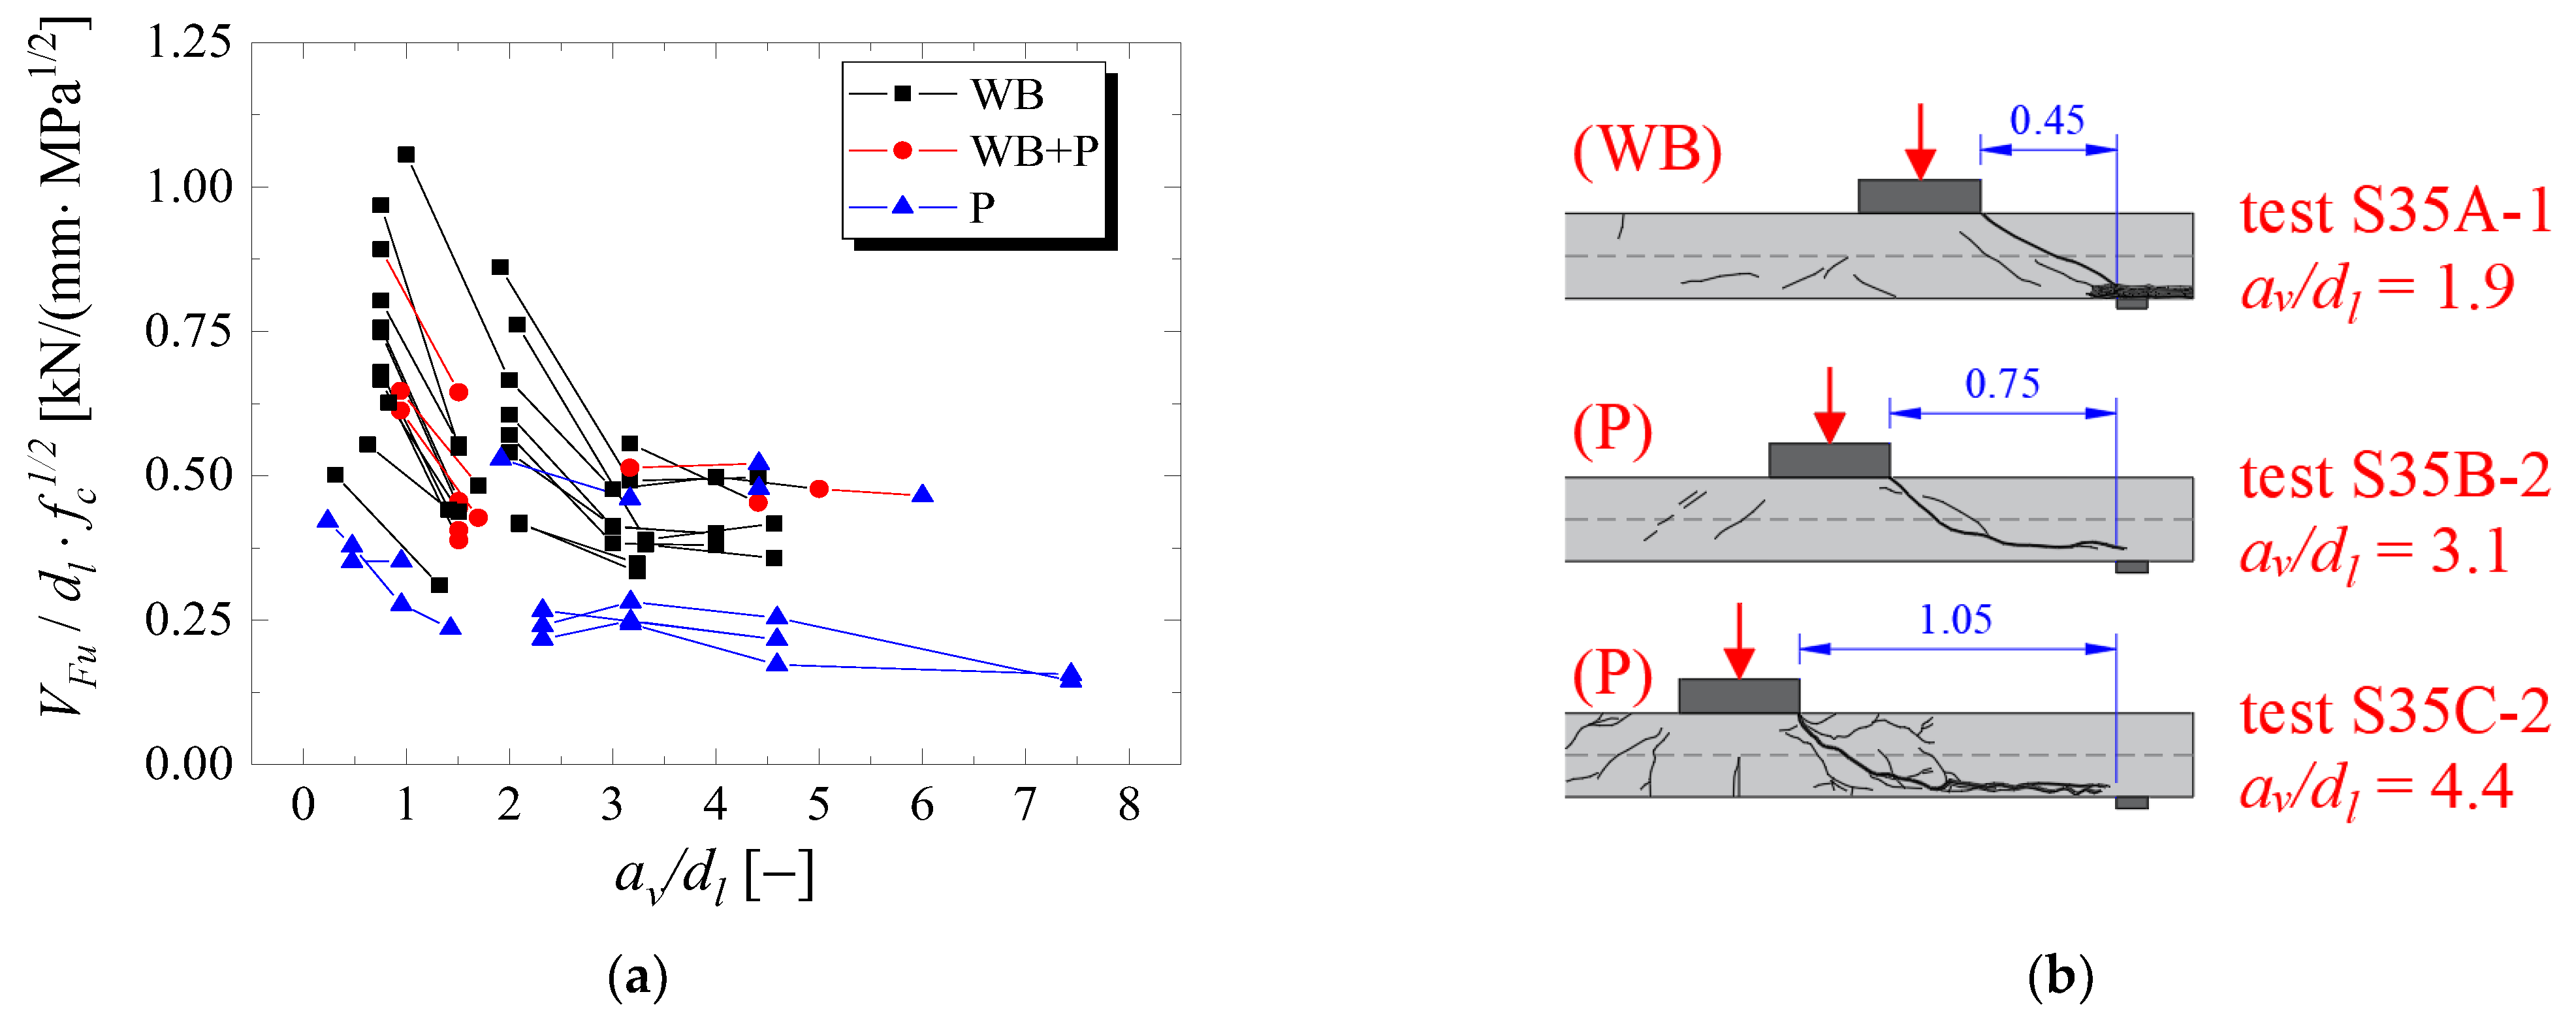
Recently, Sousa, Lantsoght and El Debs [24] evaluated a dataset of 143 one-way slabs under concentrated loads that presented different shear failure mechanisms (shear, punching or a mixed mode between them). Subgroups of tests were organized on which only a specific parameter was varied in the respective references. The sectional shear caused by the concentrated loads achieved in the tests VFu was normalized by the effective depth dl and the root of the compressive strength of concrete fc. Figure 8a shows the normalized shear resistance as a function of the shear slenderness av/dl for 75 test results and Figure 8b shows the cracking pattern of a set of tests from Reiβen et al. [6] that vary only the ratio av/dl.
The results indicated that the tested one-way shear load does not increase by increasing the ratio av/dl, as also demonstrated by other authors [5,7,14]. In fact, the tested shear load decreases markedly until a certain value of av/dl = 2 or 3, and after this, it keeps almost the same level. Added to that, it was observed that punching failures become the critical failure mechanism for av/dl > 4. In practice, this means that the failure restricts to a narrower length around the load, which could support the definition of a reduced effective shear width when the shear slenderness av/dl increases.
Figure 8b shows how the failure mechanism changes by increasing the ratio av/dl (these figures show the cracking pattern by cut views at the symmetry axis of a set of slabs tested by Reiβen et al. [6]). When the load is placed relatively close to the support, arching action and shear compression failure are most likely to occur along a larger slab strip. In such cases, it is frequent that a one-way shear crack is also visible at the slab sides. Increasing the ratio av/dl, the cracking pattern from such tests indicates a punching failure around the load, which naturally is a failure mechanism concentrated around the load. Therefore, the corresponding effective shear width should be decreased compared to that with the load closer to the support.

2.3. Background Calculations for Punching Capacity Predictions

The punching capacity of one-way slabs under concentrated loads is generally less discussed than the respective one-way shear capacity of such slabs. Consequently, enhanced recommendations to assess the punching capacity of such slabs using analytical code expressions are scarce [20]. Until now, most publications showed a large scatter between tested and predicted resistances of one-way slabs under concentrated loads when using punching shear expressions [12,26]. Since such slabs may fail either by one-way shear or two-way shear (punching), this study addressed both shear failure mechanisms.
In both EN 1992-1-1:2004 [25] and fib Model Code 2010 [21], the punching capacity can be determined by the following expressions:
P R , p r e d i c t e d = v R , p u n c h b 0
where vR,punch is the unitary punching capacity (punching capacity per unit length) and b0 is the shear-resisting control perimeter.
The unitary punching capacity according to the Eurocode EN 1992-1-1:2004 [25] is calculated as (using average values for material properties to compare tested and predicted resistances):
v R , p u n c h , E N = max C R , c k ( 100 ρ a v g f c ) 1 / 3 + k 1 σ c p d a v g v min + k 1 σ c p d a v g with   d a v g   in   [ mm ]   and   f c   in   [ MPa ]
ρ a v g = ρ l ρ t 0.02
d a v g = d l + d t / 2
v min = 0.035 k 3 / 2 f c 1 / 2
C R , c = 0.18
k = 1 + 200 d a v g 2 ,   with   d a v g   in   [ mm ]   and   f c k   in   [ MPa ]
The unitary punching capacity according to the fib Model Code 2010 [21] is calculated as (using average values for material properties to compare tested and predicted resistances):
v R , p u n c h , M C = k ψ f c d a v g ,   with   f c k   in   [ MPa ]
k ψ = 1 1.5 + 0.9 ψ d a v g k d g 0.6 ,   with   d a v g   in   [ mm ]
k d g = 32 16 + d g 0.75 ,   with   d g   in   [ mm ]
For Level of Approximation III:
ψ = 1.2 r s d a v g f y E s m E m R 3 / 2
In order to allow the predictions of punching capacity with the fib Model Code 2010 expressions without the use of linear elastic finite element analyses to estimate mE, some adaptations are needed. The first one is to replace the relation mE/mR by PE(i)/Pflex in the expression of ψ. In this study, PE(i) is the actual applied concentrated load and Pflex is the slab flexural capacity calculated according to yield line analyses. In this way:
ψ i j = 1.2 r s , i j d a v g P E ( i ) P f l e x 3 / 2 , with   i = x , y ; j = 1 , 2
At this point, it is important to note that the punching capacity is determined iteratively until the applied concentrated load PE(i) equals the calculated punching capacity PR,predicted (see Figure 3b).
In Equation (27), rs,ij is generally defined as the length of the loading center to the point of contra-flexure (zero bending moment) in the evaluated direction. In this study, the following values are adopted as a simplification in the absence of results from numerical analyses:
r s , x 1 = a r s , x 2 = l s p a n a   r s , y 1 = r s , y 2 = b s l a b / 2
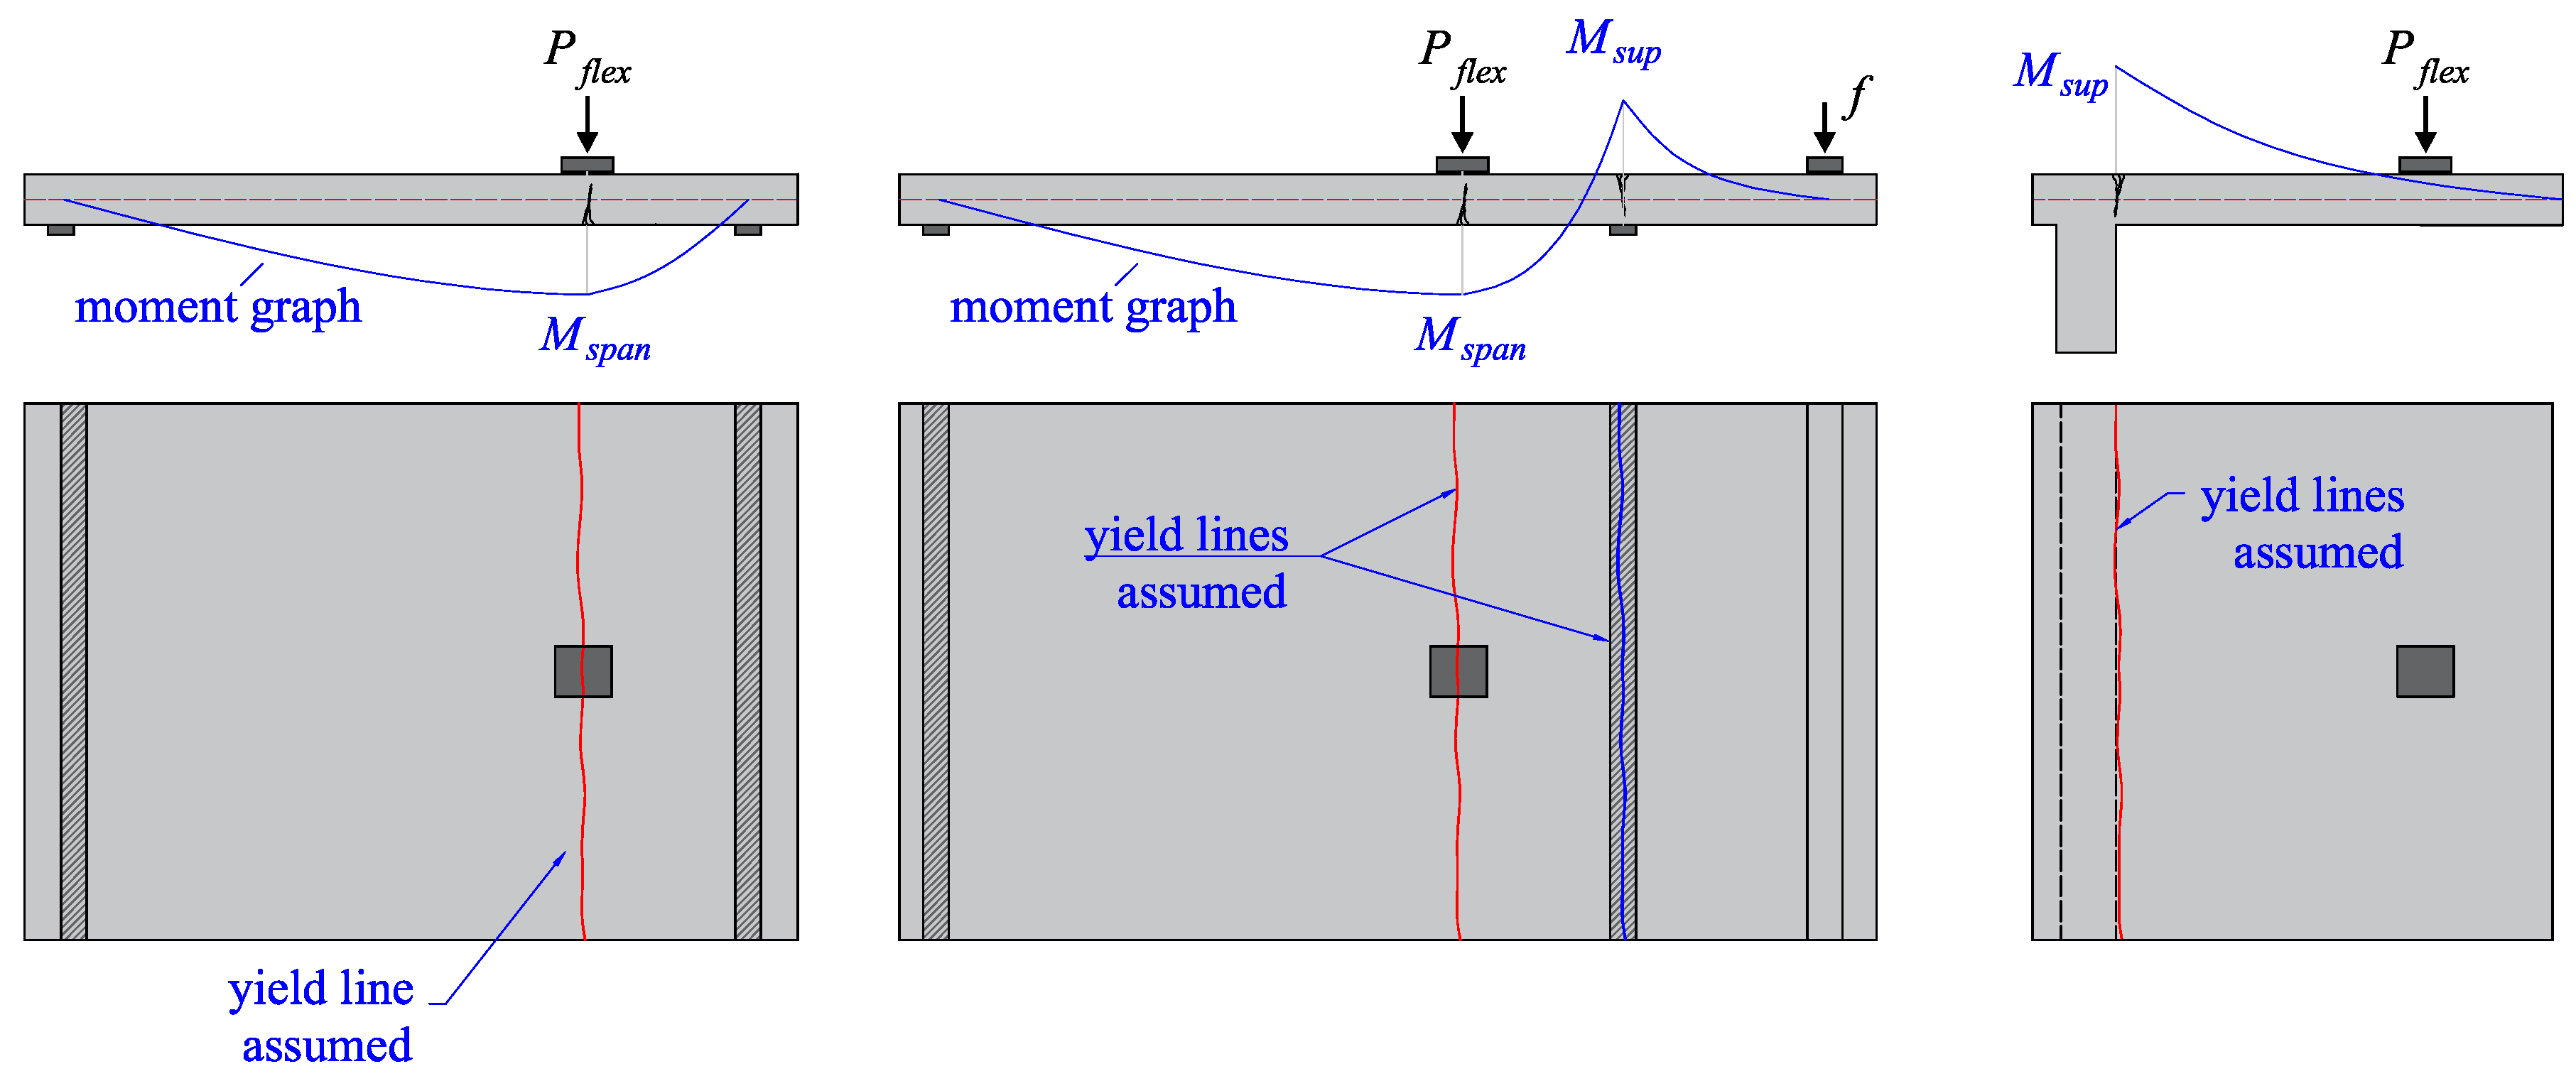
Figure 9 shows the assumed yield line patterns to the flexural assessment of the tests for varying support conditions. For the one-way slabs with continuity on one of the supports, both moments at the support and at the span were checked. The flexural capacity Pflex was assumed as the load F that causes Mspan or Msup to be equal to Mr. The yielding moment Mr was calculated according to the equation (where ρl is the reinforcement ratio and bslab the slab width) [17]:
M r = m r b s l a b m r = ρ l f y b s l a b d l ² 1 ρ l f y 2 f c
The shear-resisting control perimeter b0 is set at the distance α∙davg from the loaded area according to the studied code. The value of α is 2 for the Eurocode [25] and 0.5 for the fib Model Code 2010 [21].
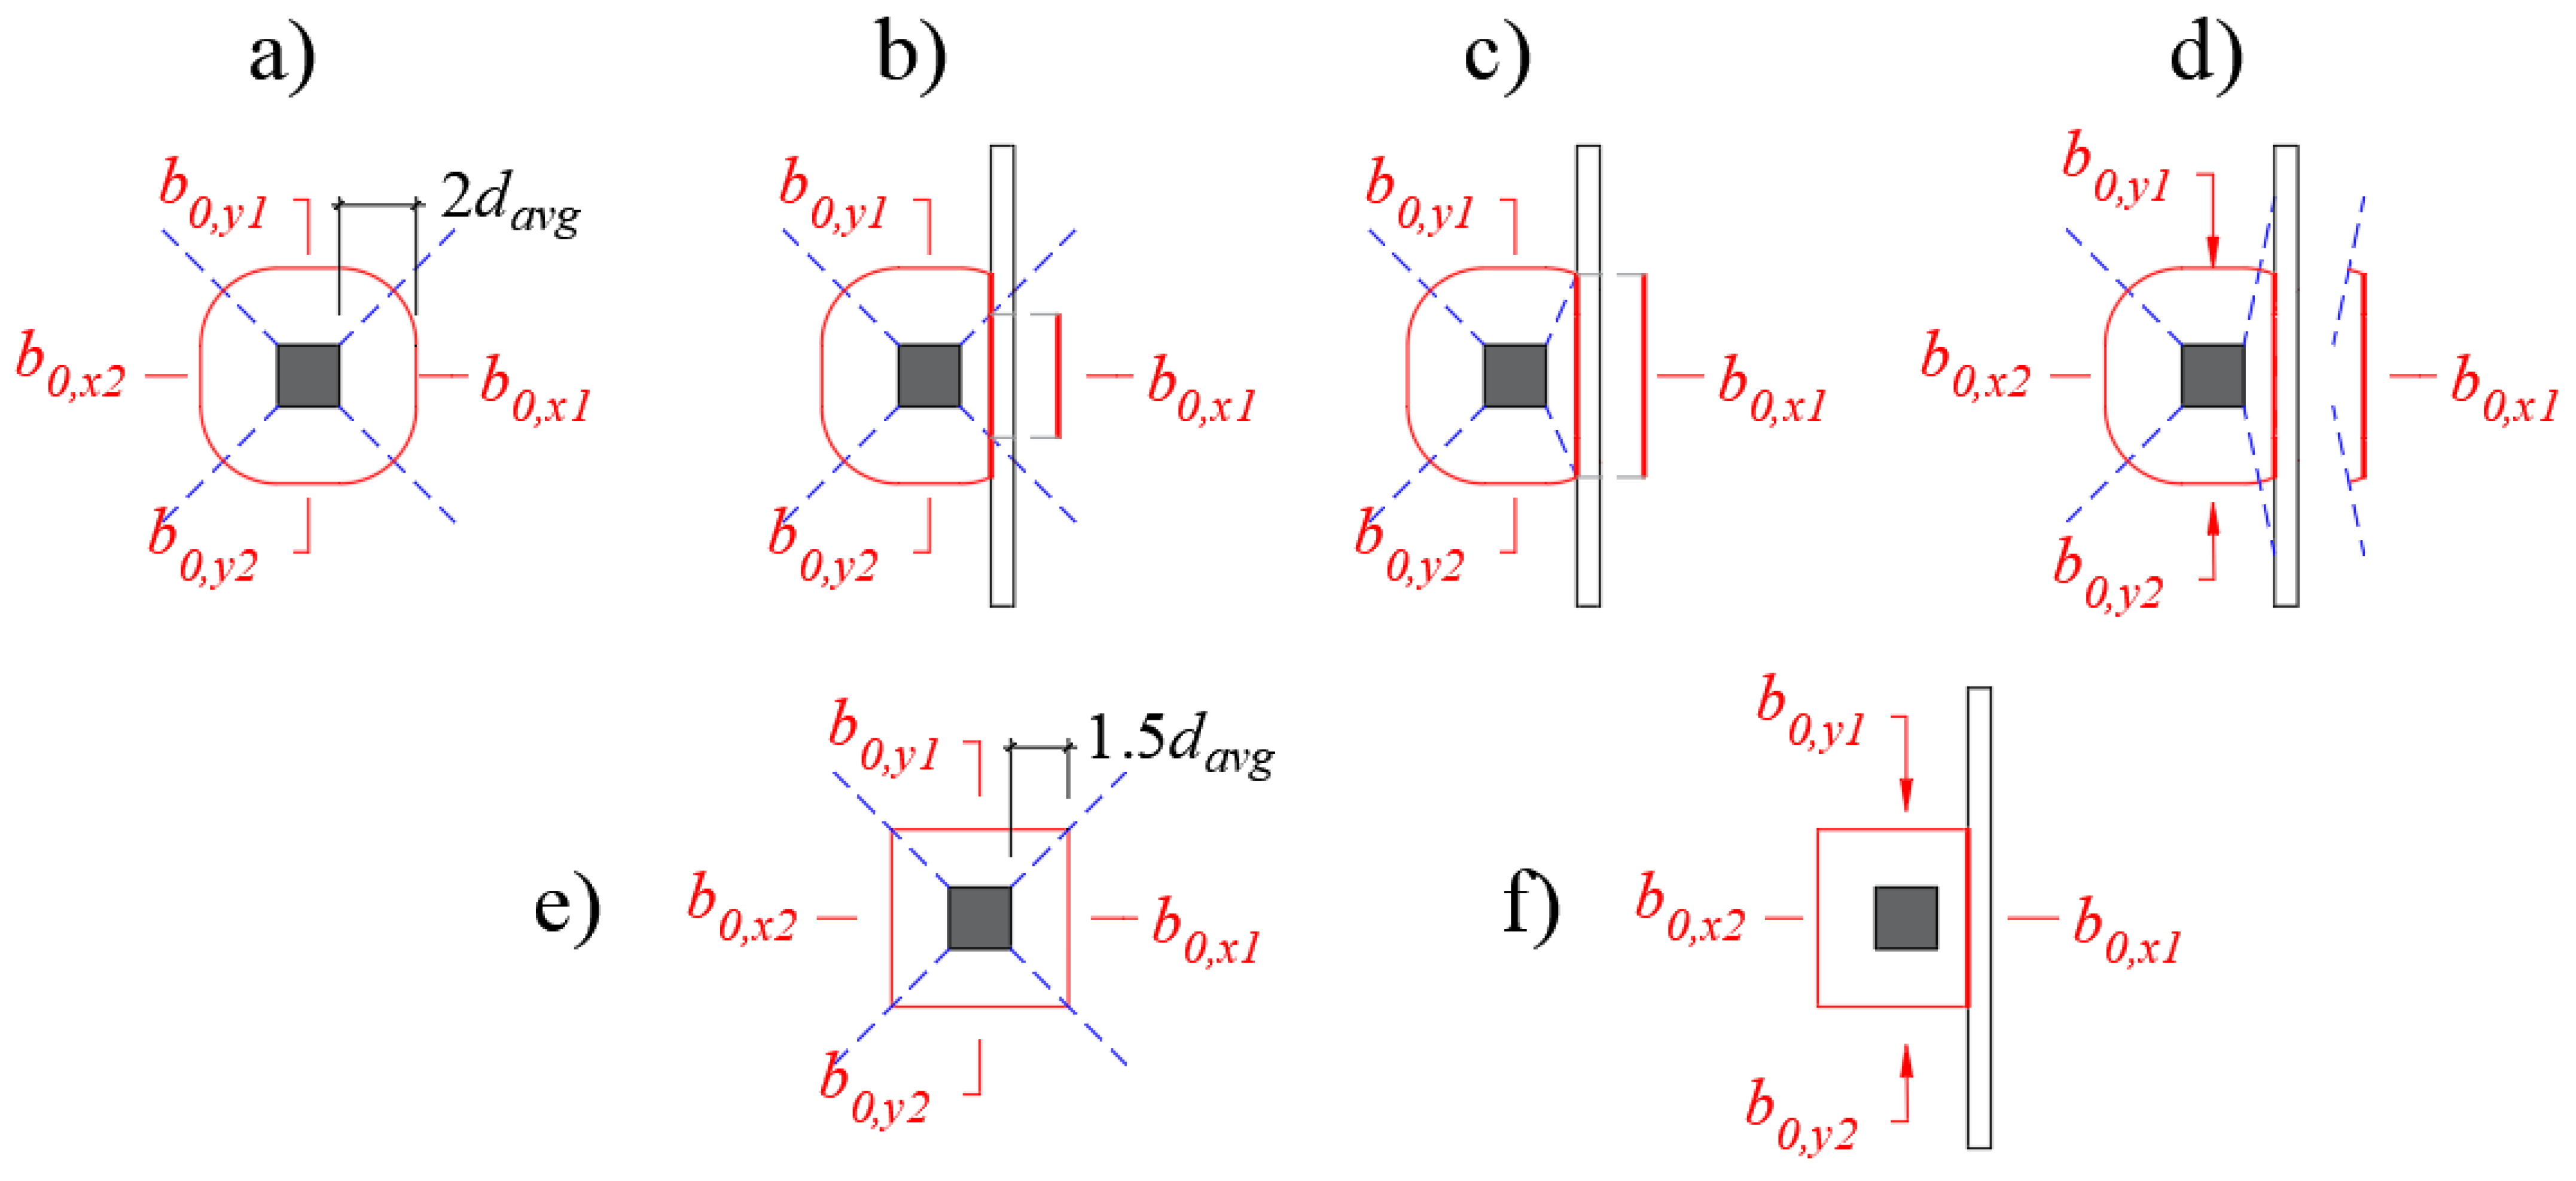
Another rule of thumb is that different layouts of the control perimeter can be critical and should be tested (Figure 10). In the case of one-way slabs with a large width, the most traditional control perimeter with four sides for simply supported slabs (Figure 10a) and three sides for cantilever slabs (Figure 10d) are the most critical ones. However, for simply-supported slabs with a reduced slab width compared to the load size, the control perimeter with two sides for simply supported slabs can be the most critical one (Figure 10b). Similarly, for loads close to the free edge, the layout with three sides can provide the lowest length for the control perimeter (Figure 10c).
In the case of cantilever slabs under concentrated loads, another aspect is discussed: the length bk of the control perimeter (see Figure 10d). For slab–column connections, the length bk has the following values for both Eurocode [25] and fib Model Code 2010 [21]:
b k = min 0.5 b l o a d ; 1.5 d a v g
However, Vaz Rodrigues et al. [20] suggest using the following value for bk (used in the following calculations):
b k = b l o a d

2.4. Insights from the Literature for Punching Capacity Predictions

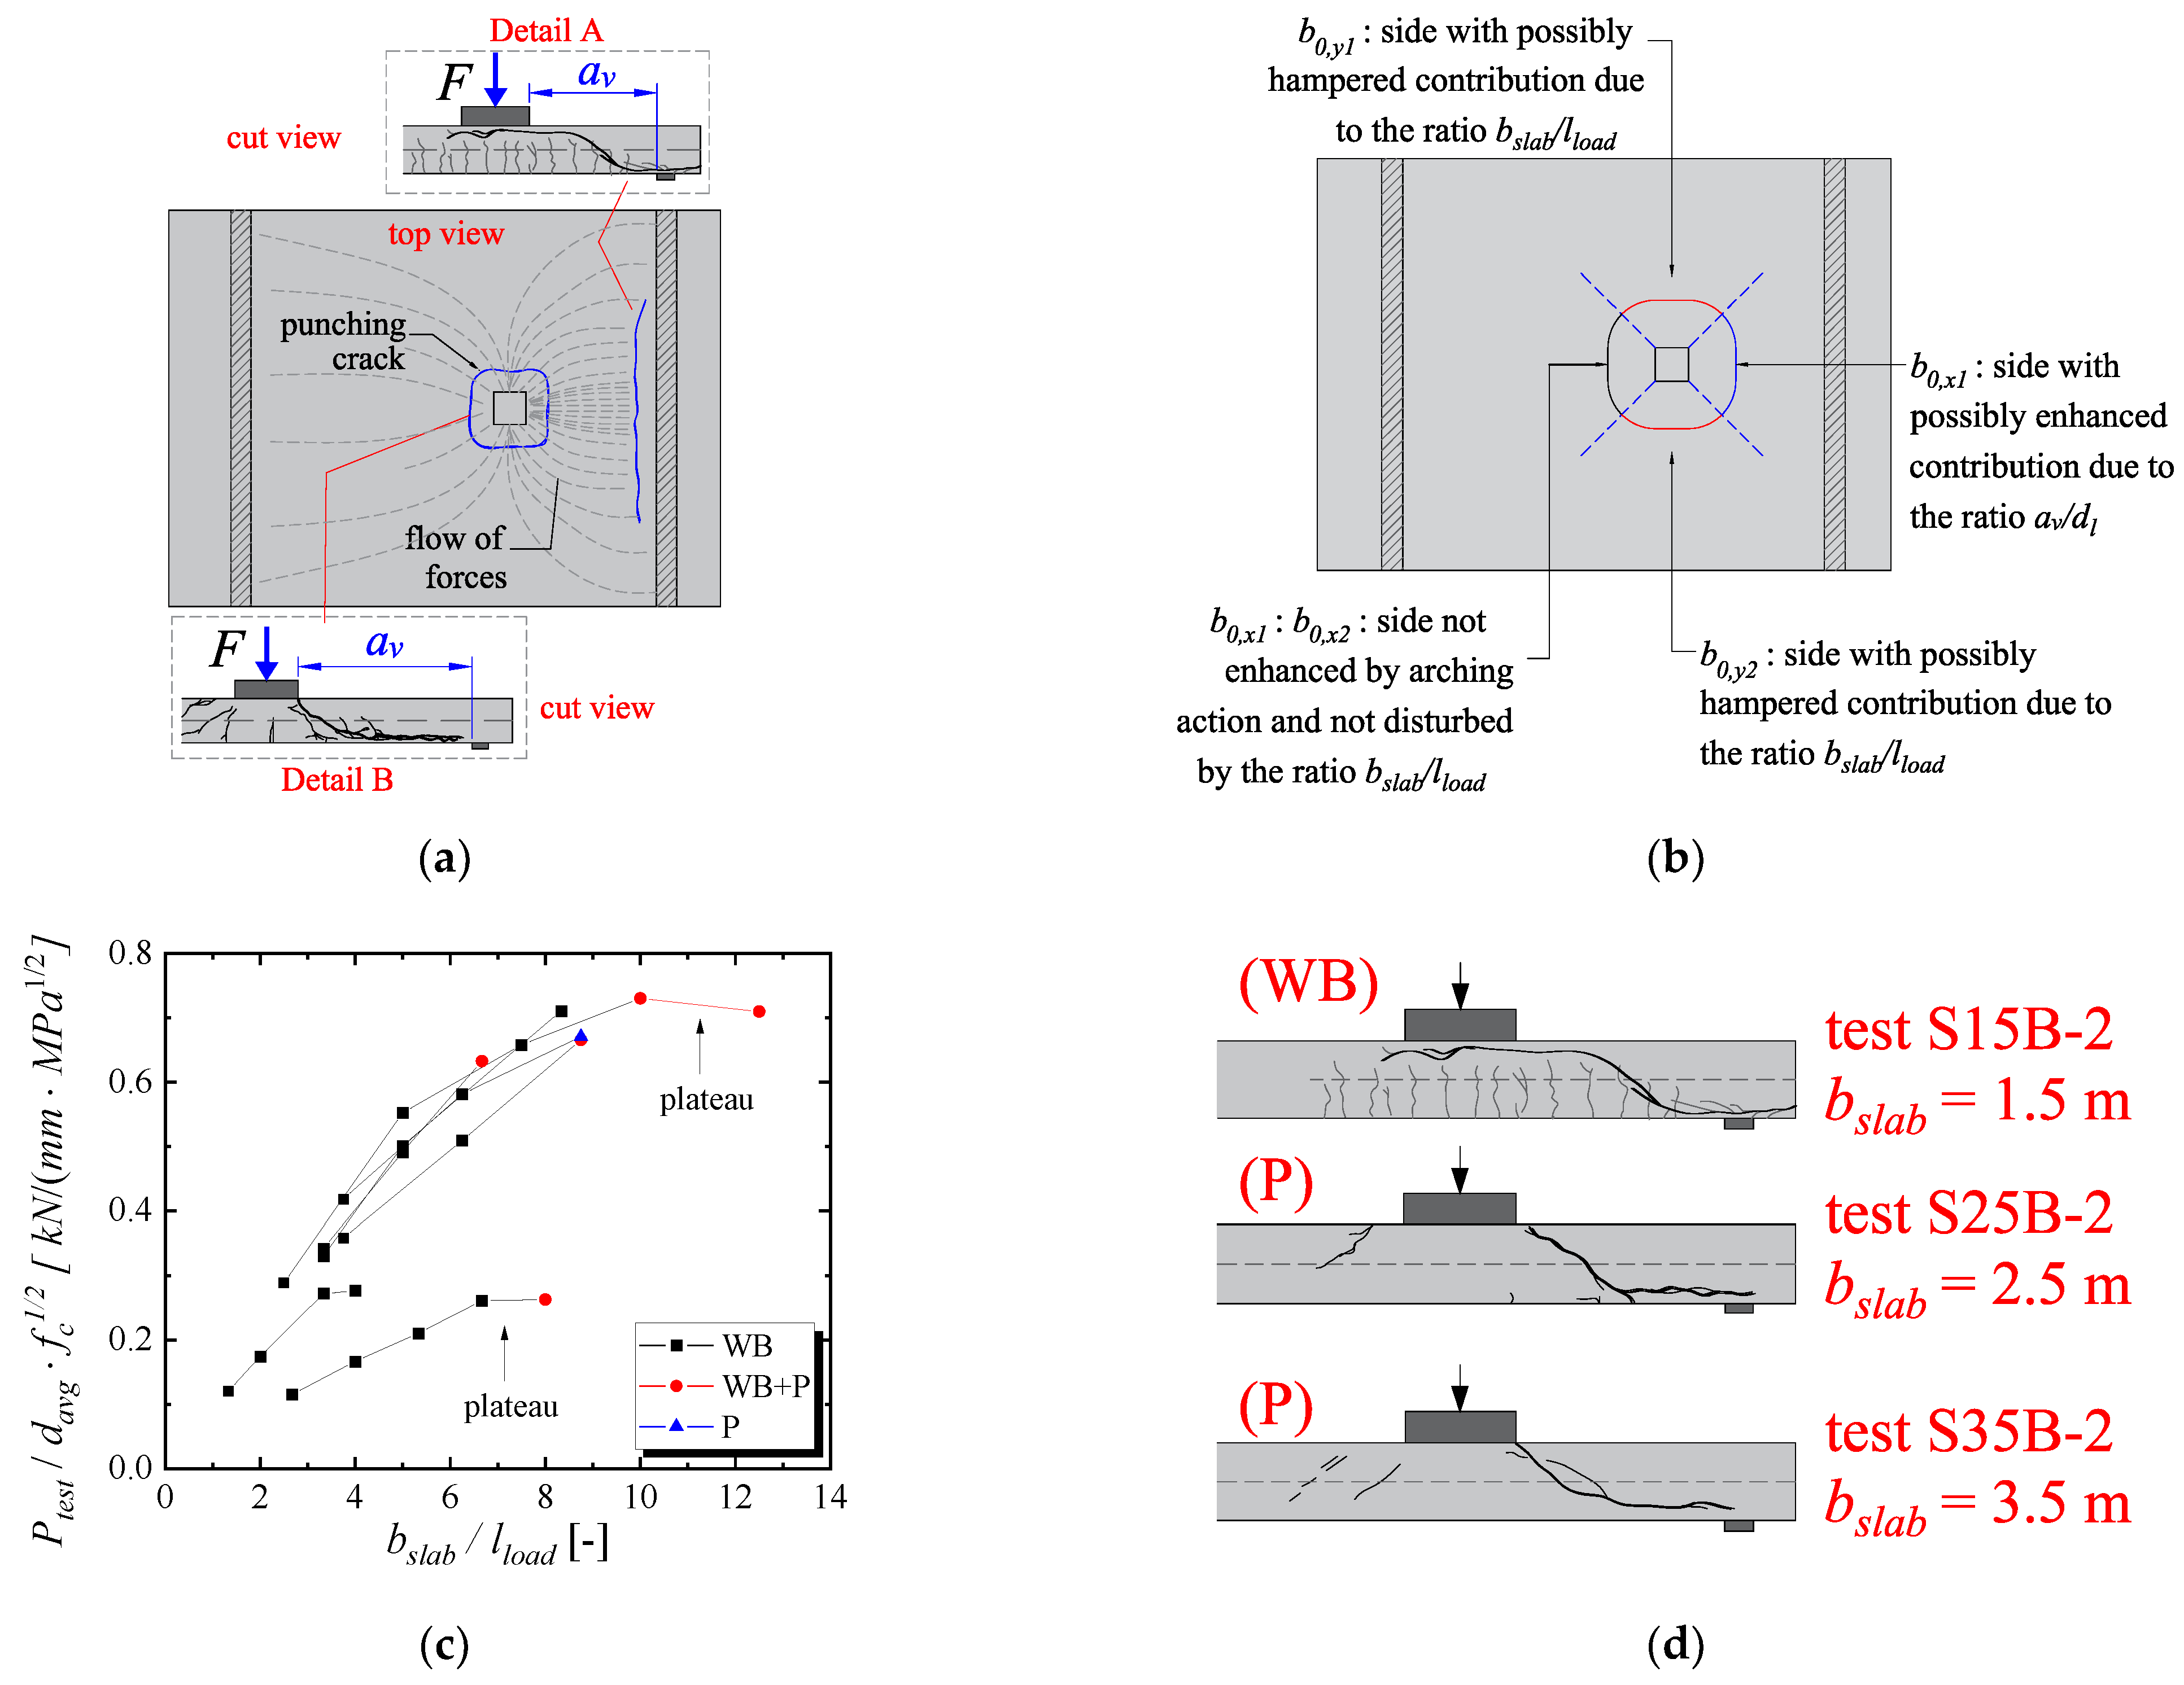
Traditionally, one-way slabs under concentrated loads have been investigated in most publications from the perspective of one-way shear failure [6,10]. However, Figure 11a shows that, based on the shear flow characteristics from such slabs, both one-way shear or punching failures may take place: (i) the shear flow close to the support is predominantly linear, which favor one-way shear failures (Detail A in Figure 11a); (ii) on the other hand, the shear flow in the load vicinity is always radial, which could favor punching failures (Detail B in Figure 11a).
According to previous studies [24], one or other failure mechanisms may occur as a function of the load position (or the ratio av/dl) and slab width (or the ratio bslab/lload). At this point, it is important to note that the shear flow through the sides of the control perimeter close to the free edges is higher or lower as a function of the slab width (Figure 11a). Therefore, for punching capacity predictions, the effective contribution of these sides should be considered as a function of the slab width.
In other words, a possible way to improve the predictions of punching capacity for one-way slabs under concentrated loads would be to consider different contributions for each side of the control perimeter as a function of the load position and slab width (Figure 11b). At this point, Regan [19] was one of the first that propose to consider the influence of arching action for punching expressions. However, the effect of the slab width was not considered in this original approach.
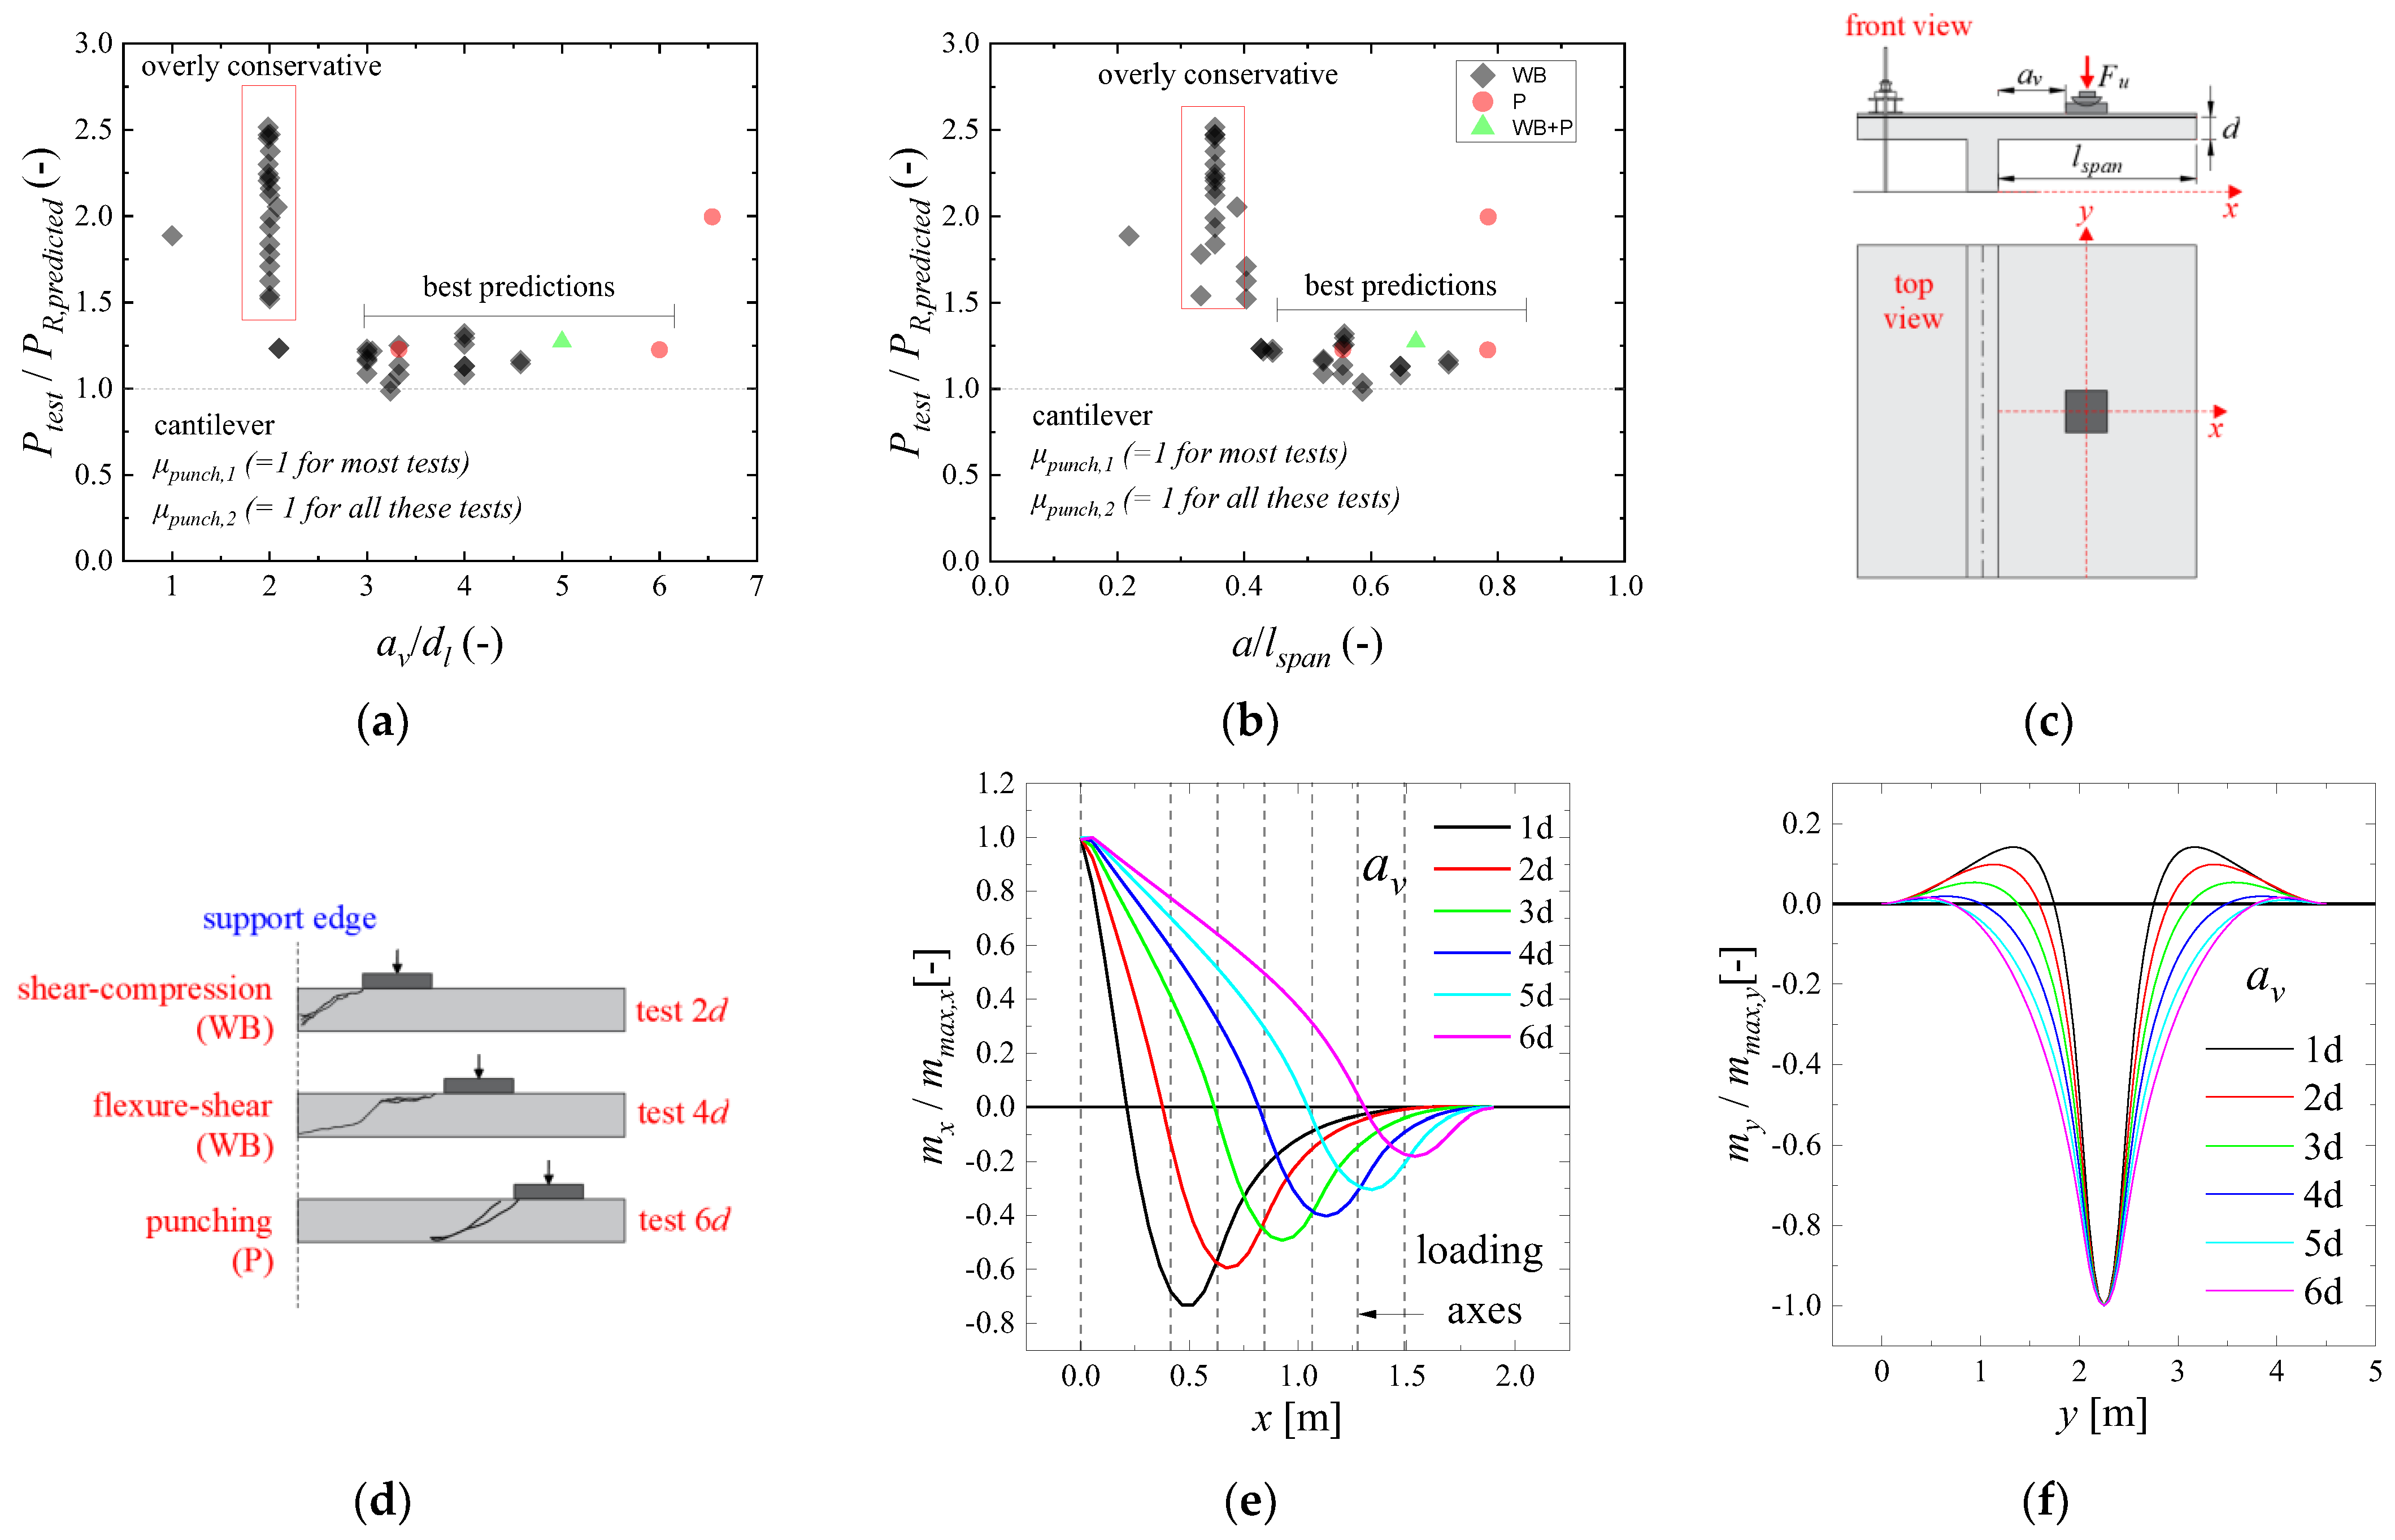
Figure 11c shows the normalized failure load by the average effective depth and root of the compressive strength of the concrete for a set of 20 test results organized by Sousa, Lantsoght and El Debs [24]. In this subset of test results, the only parameter that varied among the tests connected by lines was the slab width and, consequently, the ratio bslab/lload. The reader can realize that by increasing the ratio bslab/lload, the normalized failure load increases almost linearly for each series of tests until reaching a plateau on which the governing failure mechanism starts to be punching. Before reaching such a plateau, the governing failure mechanism of such slabs is most likely one-way shear as a wide beam.
Figure 11d shows how the cracking pattern and, consequently, the governing failure mechanism changes by changing the slab width. In the test S15B-2 from Reiβen et al. [6], the shear crack that crosses the compression chord arises from flexural cracks and reaches the load almost horizontally, typical of flexural-shear failures as wide beams. Additionally, such cracks extend over the whole slab width. On the other hand, in the tests with a slab width of 2.5 or 3.5 m, the shear crack at the cut view reaches the load with a crack inclined at around 45 degrees. Moreover, such cracking is not visible at the free sides of the slab, as is typical of punching failures.

3. Proposed Approach

3.1. Proposed Approach for One-Way Shear

In this study, it is assumed that the one-way shear capacity increases for loads close to the support due to arching action benefitting the direct load transfer [27,28]. Therefore, the unitary shear capacity can be multiplied by the following factor:
μ s h e a r , 1 = 1 / β E C
Herein, the factor βEC is suggested for both shear codes (Eurocode and fib Model Code) since it correlated better with test results for loads close to the support.
The French effective shear width (Figure 7a) has been demonstrated to be adequate mainly to check the one-way shear capacity of slabs that failed in one-way shear or that are influenced by arching action [5,13]. The higher spreading angle of the fib Model Code 2010 for simply supported slabs overestimates the shear capacity of such slabs in comparisons between tested and predicted resistances of laboratory tests [14]. Because of this, the reference effective shear width is assumed as the French effective shear width.
In order to consider that the ultimate capacity of one-way slabs under concentrated loads does not increase by increasing the shear slenderness av/dl [6,11] (see Figure 8a) and to avoid unsafe predictions of one-way shear capacity for av/dl > 3 [10] (as shown in the following sections), a correction in the predicted effective shear width is proposed. In practice, this correction allows considering that the failure occurs along a narrower region in front of the load, mainly by punching, by increasing the shear slenderness av/dl (Figure 12b). To this effect, a factor μshear,2 is multiplied by the effective shear width calculated according to the French approach, beff,french. Consequently, the predicted effective shear width decreases as av/dl increases (see Figure 12a).
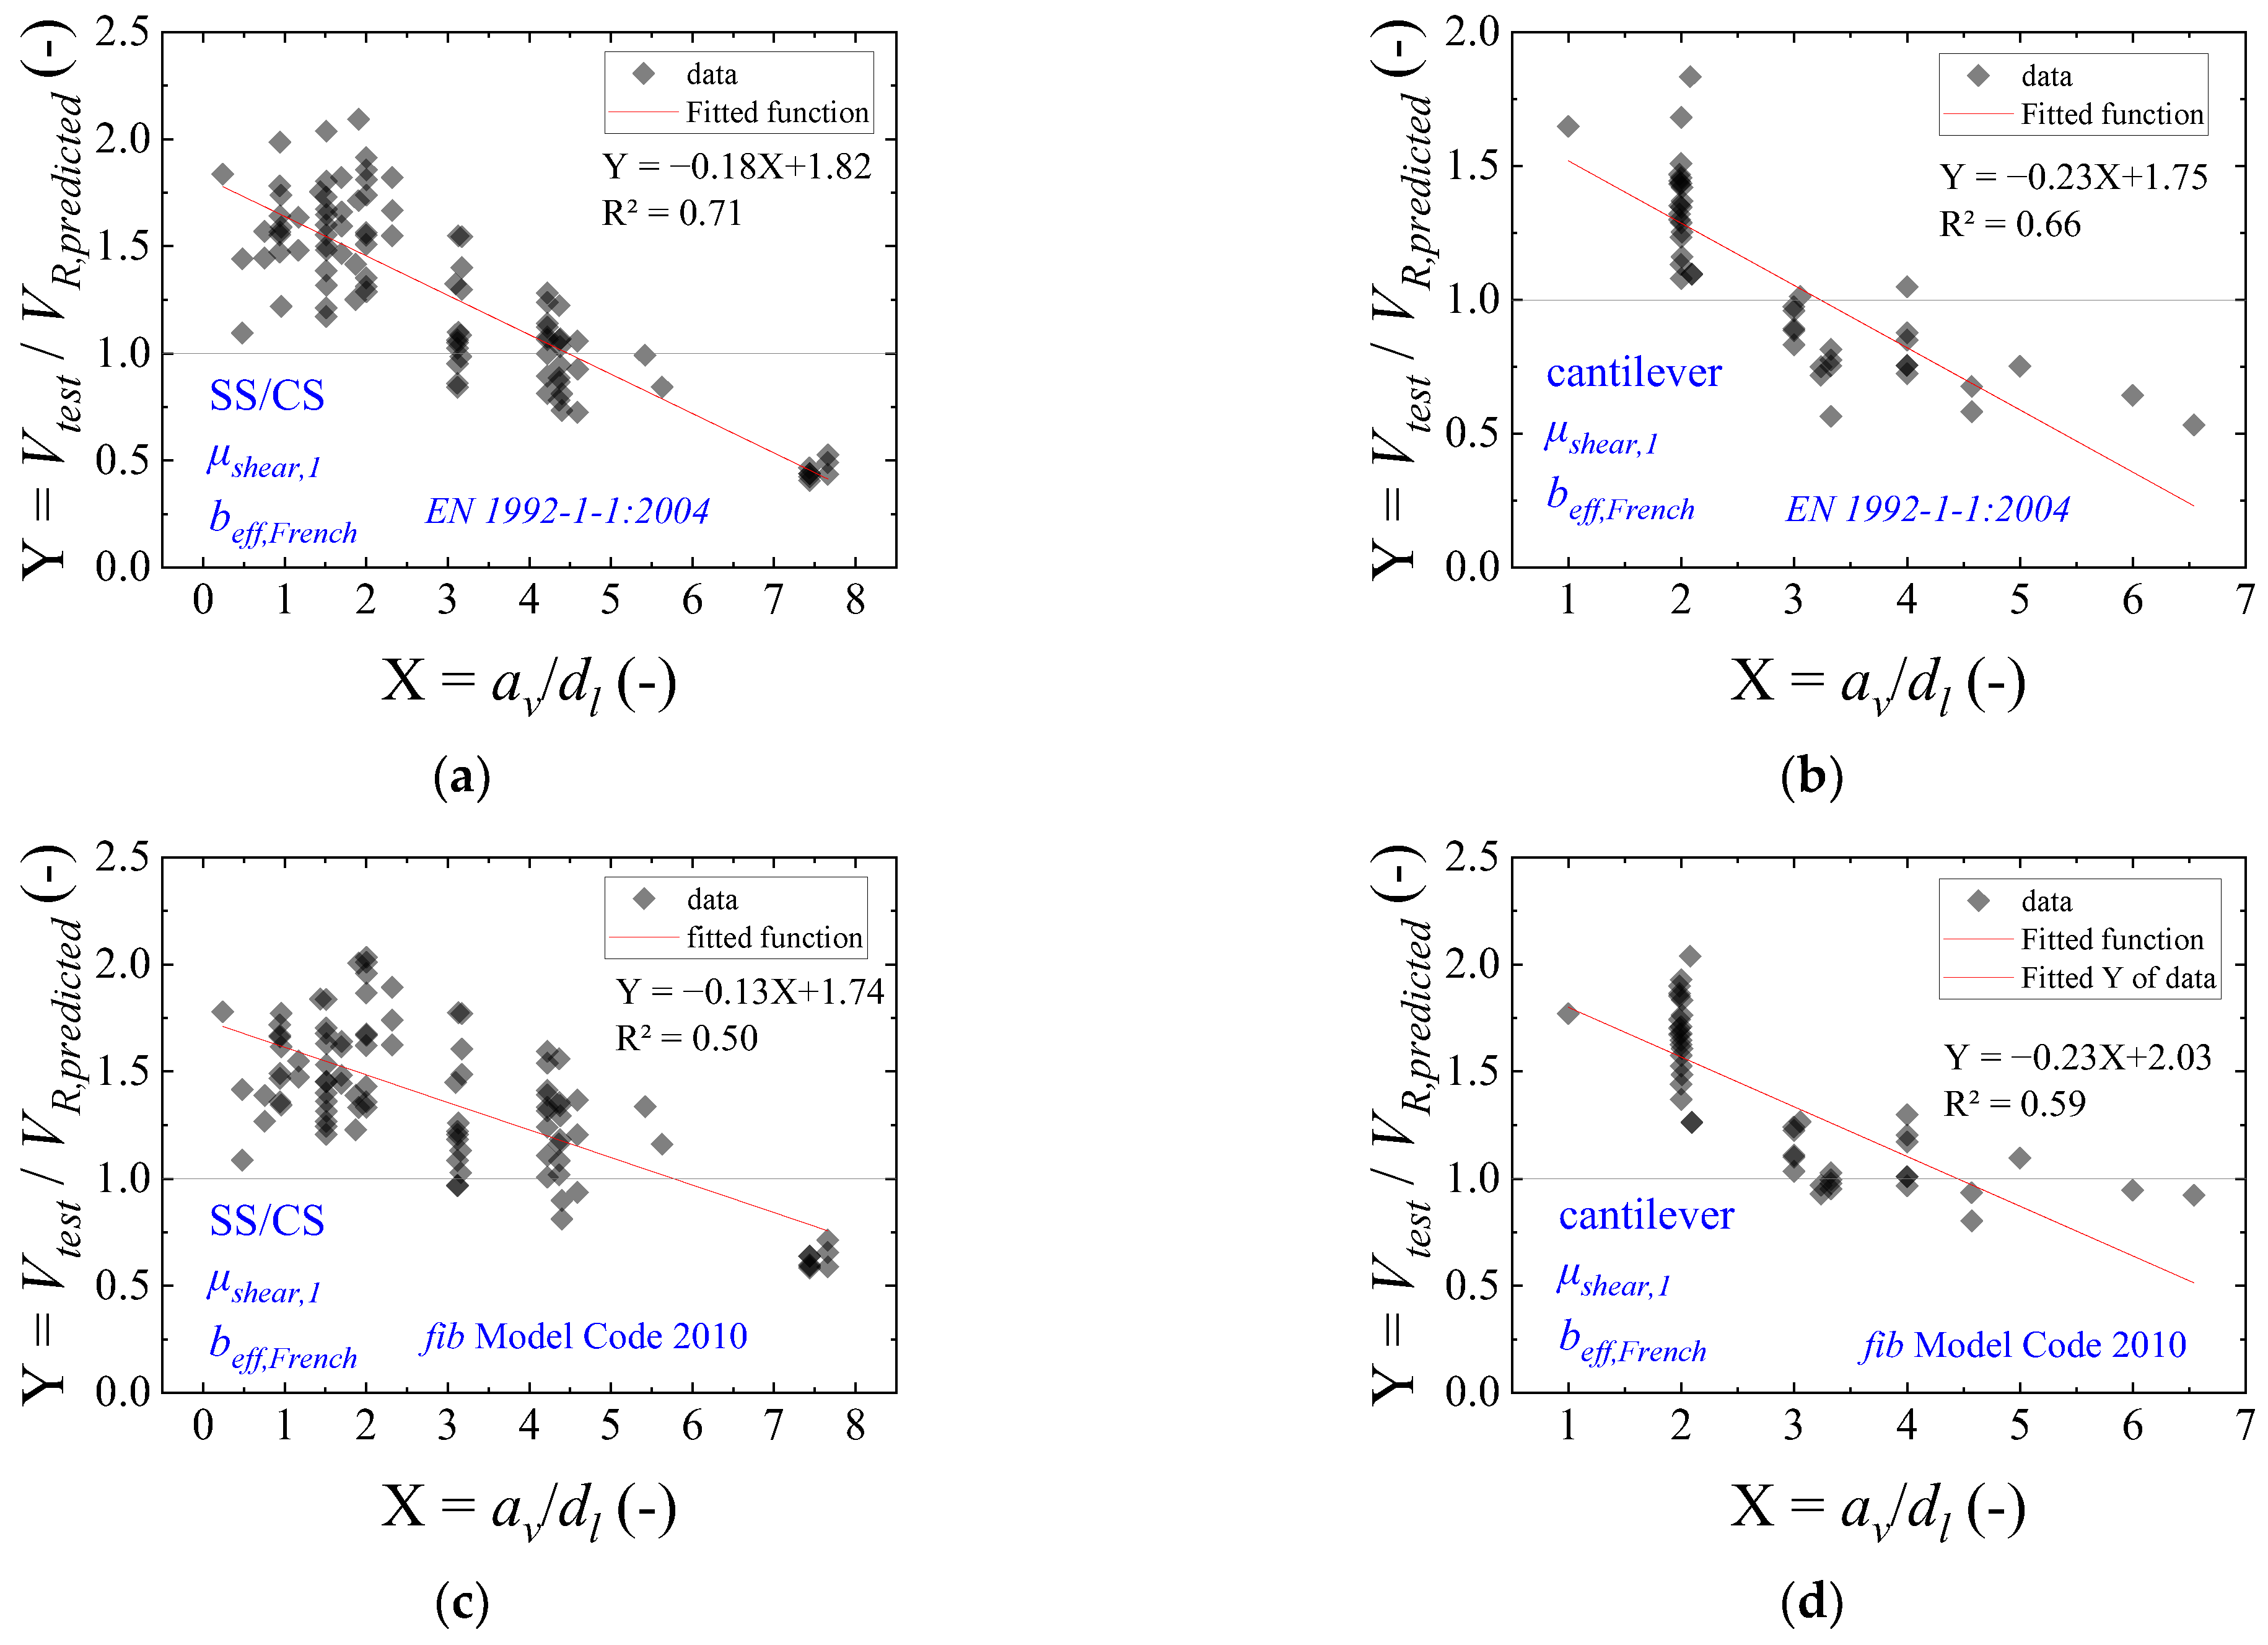
The correction factor for each code and support condition was derived by statistical regression analyses (Figure 13). In this approach, a comparison between the tested and predicted resistances was performed with the following set of assumptions: (i) the enhanced shear capacity for loads close to the support was considered by μshear,1; (ii) the French effective shear width was used for both codes to estimated VR,predicted; (iii) a linear fitting function was assumed for simplicity. In this study, the calibration of the factors according to the support condition was based on the different coefficients observed for the fitting functions. In practice, this method can be justified mainly due to the different shear flow that occurs for cantilever members (one line support) and simply supported or continuous members (two line supports).
In this way, the proposed effective shear width for any one-way shear model is calculated as:
b e f f , p r o p o s e d = b e f f , f r e n c h μ s h e a r , 2 ,   with   b e f f , p r o p o s e d b s l a b 4 d l
Table 2 describes the detailed expressions of μshear,2 calibrated for each shear code provision. These factors were derived based on linear regression analyses observing the functions that fitted the ratio Vtest/VR,predicted for each code (see Figure 13). For each code (VR,predicted), the French effective shear width model and the factor μshear,1 were applied.
Therefore, the following expression can be applied to determine the predicted one-way shear capacity VR,predicted:
V R , p r e d i c t e d = v R , s h e a r , a n y μ s h e a r , 1 b e f f , p r o p o s e d

3.2. Proposed Approach for Punching Shear Capacity Predictions

In the literature, a large scatter between tested and predicted resistances is commonly reported for punching capacity predictions of one-way slabs under concentrated loads [12,26]. In practice, this occurs mainly due to two reasons: (i) most design codes do not discuss how the enhanced shear capacity for loads close to the support could be considered in punching capacity predictions; and (ii) the effect of the free edges disturbing the contribution of the control perimeter lateral sides is not considered in the calculations (Figure 2c). Consequently, the predictions of punching capacity may be overly conservative if the arching action is not considered for loads close to the support, or even the predictions may be unsafe for slabs with a reduced slab width compared to the load size [24].
The first step in order to improve the predictions of punching capacity with current design expressions, as suggested by Regan [19], is to consider that the different sides of the control perimeter develop different contributions to the punching capacity. In this study, the partition of the control perimeter, such as that shown in Figure 14a, addresses this need. However, the intersection of the control perimeter with the support for loads close to the support needs attention. Using the rounded corners for the control perimeter of the Eurocode, one may assume b0x,1 as the length covered by the dashed blue lines (Figure 14b) or the straight length that intercepts the support (Figure 14c). However, such approaches would lead to very small values of b0x,1 when the load is placed at av = 0 or when av = 2davg, respectively. Because of this, we concluded that the most consistent approach would consider b0,x1 as the length between the middle points of the rounded corners (Figure 14d). Alternatively, and most simply for the Eurocode control perimeter, one can also use a squared control perimeter at 1.5davg (Figure 14e), which simplifies the calculations for the partitions of the control perimeter, as suggested by Regan [19]. In this way, the length b0,x1 would not vary as a function of av (Figure 14f), and the total control perimeter b0 would be very similar to that using rounded corners.
In the following sections, we compare the results using the partitions of Figure 14d,e for the Eurocode. In the case of the fib Model Code 2010 expressions, using the control perimeter with rounded and square corners at 0.5davg provides similar results (this is demonstrated in the next sections).
After defining the partitions of the control perimeter, the proposed approach is grounded on two main aspects: (i) the consideration of the enhanced shear capacity of the portion of the control perimeter close to the support (b0,x1) when av/dl ≤ 2; (ii) the reductions in the capacity for the lateral sides b0,y1 and b0,y2 as a function of the slab width.
The enhanced shear capacity for the portion b0x,1 is achieved by multiplying the unitary shear capacity on this side by the factor μpunch,1, which is equal to that for one-way shear.
μ p u n c h , 1 = 1 / β E C , with   β E C = a v 2 d l 0.25 1
The impaired contribution of the sides b0y,1 and b0y,2 to the punching capacity of slabs with reduced width bslab is considered by multiplying these sides by a correction factor μpunch,2 (Table 3). In this study, the same factors were proposed for both codes.
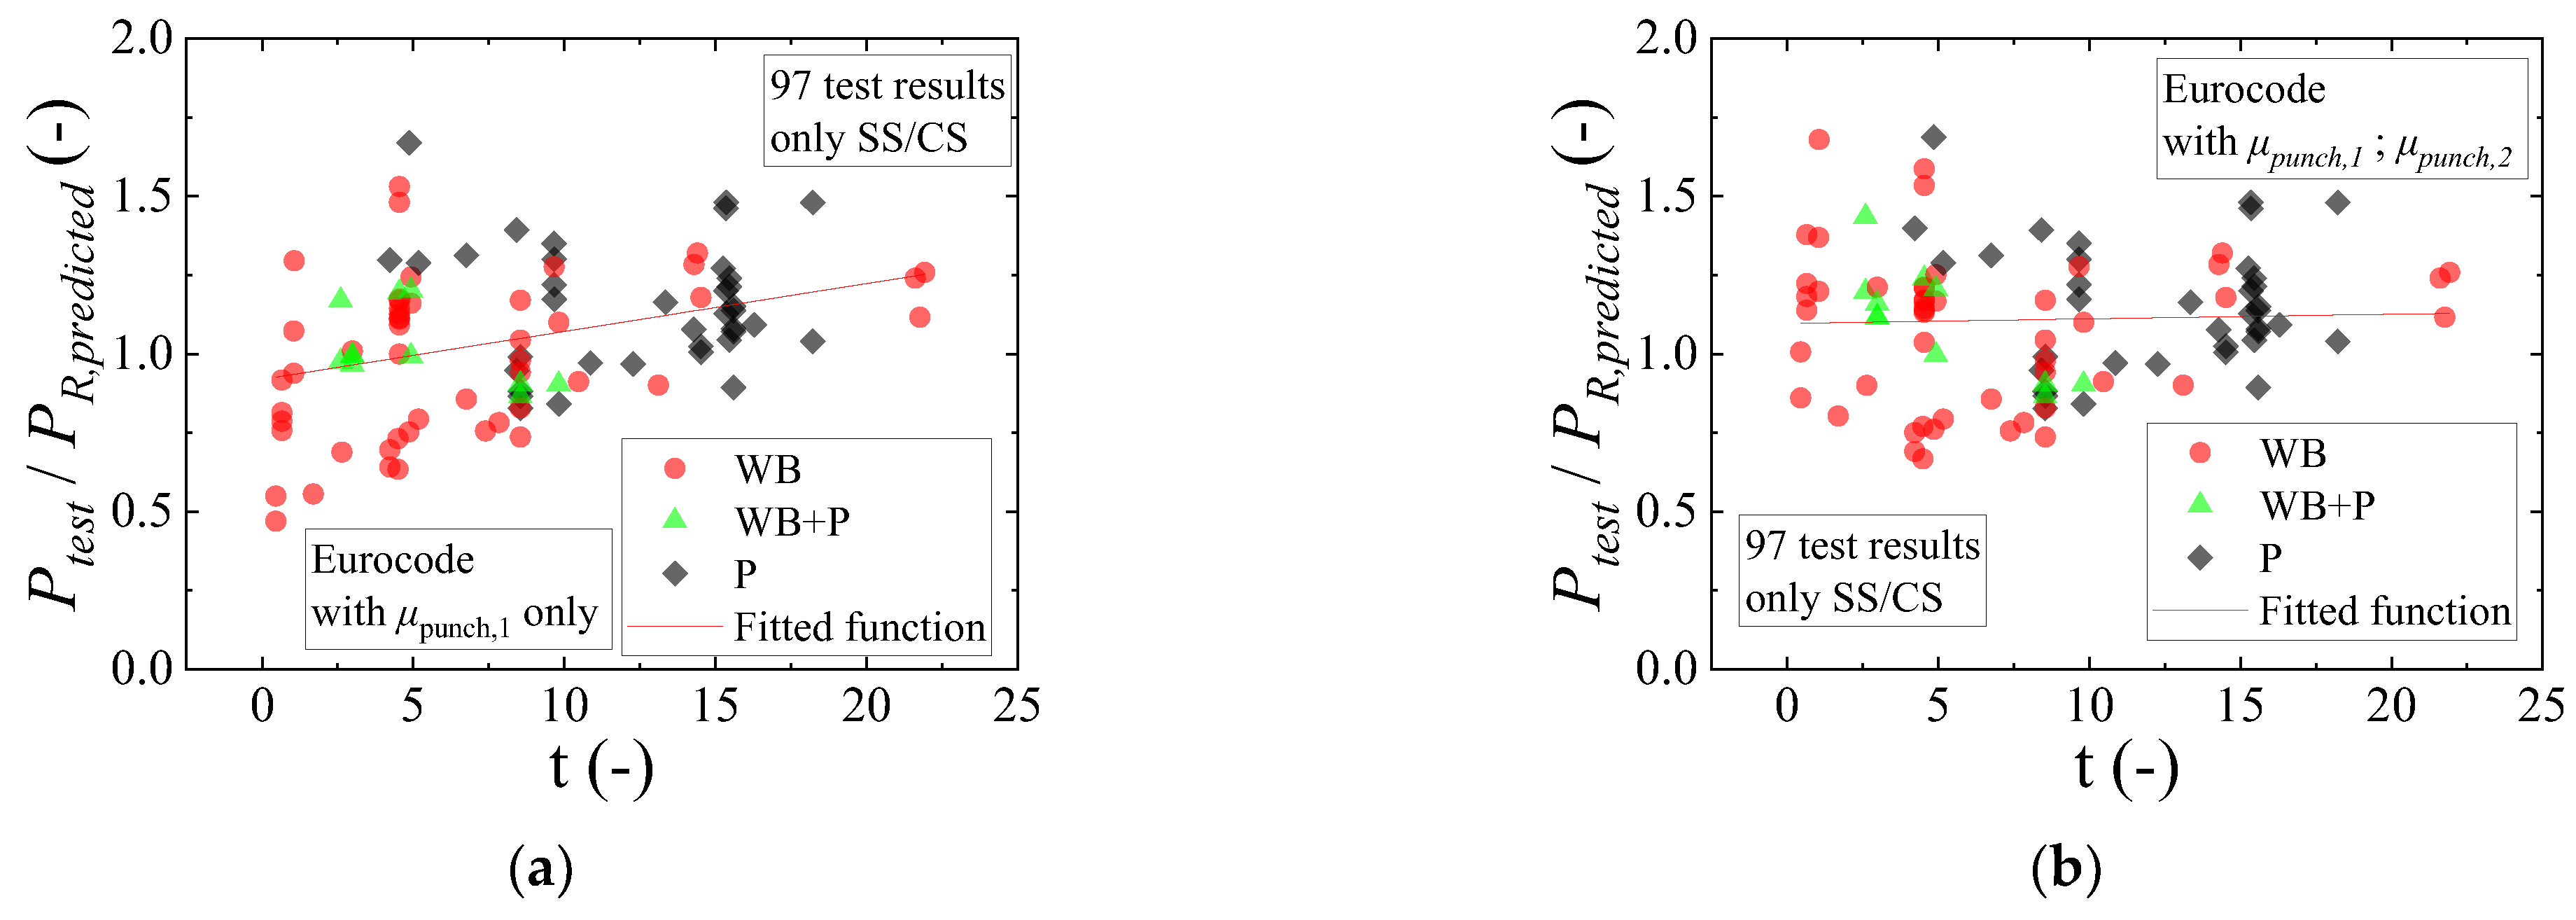
Figure 15 shows how the factor μpunch,2 was calibrated. A comparison between tested and predicted resistances with the punching capacity expressions from Eurocode was performed (Figure 15a). This comparison demonstrated sensitivity in the predictions with the value of t and, consequently, the slab width. In this way, the function of μpunch,2 (assumed linear) was modified until removing this sensitivity (Figure 15b). As only the simply supported and continuous slabs varied the parameter t more extensively in the database than the respective cantilever slabs, the derivation of such parameters was based only on the results of simply supported and continuous slabs (97 test results).
For cantilever slabs under concentrated loads, the predictions of punching capacity with the Eurocode were quite conservative for shear slenderness values of av/dl ≈ 2 (see Figure 16a). Since the effect of arching action by μpunch,1 was considered only until av/dl = 2, this could indicate that a different factor should be used for cantilever slabs. However, even extending the length of influence until av/dl = 3 did not significantly change the results. Because of this, another explanation was needed for such results. A possible explanation for these results was that observing the cracking pattern of the tests from Henze et al. [7], the failure mechanism for loads closer to the support of cantilever slabs would be more influenced by the longitudinal reinforcement at the top side of the slabs (Figure 16c,d). In other words, considering the predicted resistance as a function of the bottom reinforcement of cantilever slabs would lead to overly conservative predictions since such reinforcement ratios are significantly lower than the ones used at the top side of the slab. At this point, it is important to note that the bending moments for cantilever slabs are slightly different from cantilever beams since we always have sagging bending moments and hogging bending moments for cantilever slabs (see Figure 16e,f). In order to keep the core of the expressions for the punching capacity of cantilever slabs by considering the bottom reinforcement in the expressions, an alternative is to consider another load position parameter in the expressions, such as the ratio a/lspan (Figure 16b). Consequently, it would be possible to consider some enhancements in the punching capacity as a function of the load position on the cantilever slab not related to arching action.
In this study, the same tendency was not observed when using the fib Model Code expressions. At this point, it is important to note that the expressions of punching capacity (vR,punch) with the fib Model Code 2010 [21] expressions already lead to enhanced resistances for loads close to the support by considering that the flexural capacity of the slabs Pflex is enhanced in such regions and, hence, smaller slab rotations ψ around the load occur for these regions. In the end, this effect is combined with the one expected from arching action, which leads to significant enhancements in resistance. In the expressions from Eurocode [25], on the other hand, the unitary shear capacity predicted is not influenced by the load position and can be enhanced only as a function of the arching action.
As a result, a third factor was considered in the expressions of punching capacity when using the Eurocode expressions μpunch,3 (Table 4).
Neglecting the influence of the shear demand from the self-weight in the control perimeter, the punching capacity can be determined for any of the codes by the following calculations (for cantilever slabs, the term b0,x2 = 0):
P R , p r o p o s e d = v R , p u n c h b 0 , x 1 μ p u n c h , 1 + v R , p u n c h b 0 , x 2 + v R , p u n c h b 0 , y 1 μ p u n c h , 2 + v R , p u n c h b 0 , y 2 μ p u n c h , 2 μ p u n c h , 3

4. Database

The database used for validation of the proposed recommendations was organized by the authors and was published in the public domain [29]. This dataset includes 143 test results. The following references are included in this database: Bui et al. [30], Carvalho [31], Coin and Thonier [3], Damasceno [32], Ferreira [33], Lantsoght [34], Natário et al. [11,35], Reiβen [14], Regan [19], Regan and Rezai-Jarobi [18], Rombach and Latte [36,37], Rombach and Henze [38], Vaz Rodrigues [39] and Vida and Halvonik [40].
In terms of support conditions: (i) 77 tests were conducted with the concentrated load applied closer to the simple support (SS: hinged support without continuity of the slab in the spanning direction); (ii) 20 tests were conducted with the concentrated load applied closer to the support with continuity of the slab in the spanning direction (CS); and (iii) 46 tests were conducted with the concentrated load applied on a cantilever slab (CT).
In terms of the governing failure mechanism in shear of the slabs: (i) 40 tests were classified as failing by punching (P: with predominant radial and circumferential cracks at the slab tensile side, occasionally with a visible conical crack at the bottom side, and without the arising of inclined shear cracks at the slab sides); (ii) 91 tests were classified as failing as wide beams in shear (WB = shear cracks similar to those of beams that failed in shear are visible at the slab sides and most cracks at the tension side of the slabs are parallel to the line support); (iii) 12 tests were classified as presenting a mixed mode between wide-beam shear and punching shear (WB + P = combines characteristics from both failure mechanisms).
Table 5 shows the ranges of parameters in the database. All experiments were conducted on thicknesses less than 0.60 m. Hence, such tests do not include the size effect that may occur for actual solid slab bridges. In addition, all tests selected have a relation between the member width and effective depth higher than 5 and, therefore, are representative of slabs according to the Eurocode. The shear slenderness tested varied between 0.24 and 7.66. Therefore, the database includes tests both influenced and not influenced by arching action.

5. Results

In this section, the results are presented separately according to the design code expressions applied and show the tendencies as a function of the governing failure mechanism of the tests. In this way, the benefits of the proposed recommendations can be distinguished more closely.

5.1. Results with the European Code Expressions

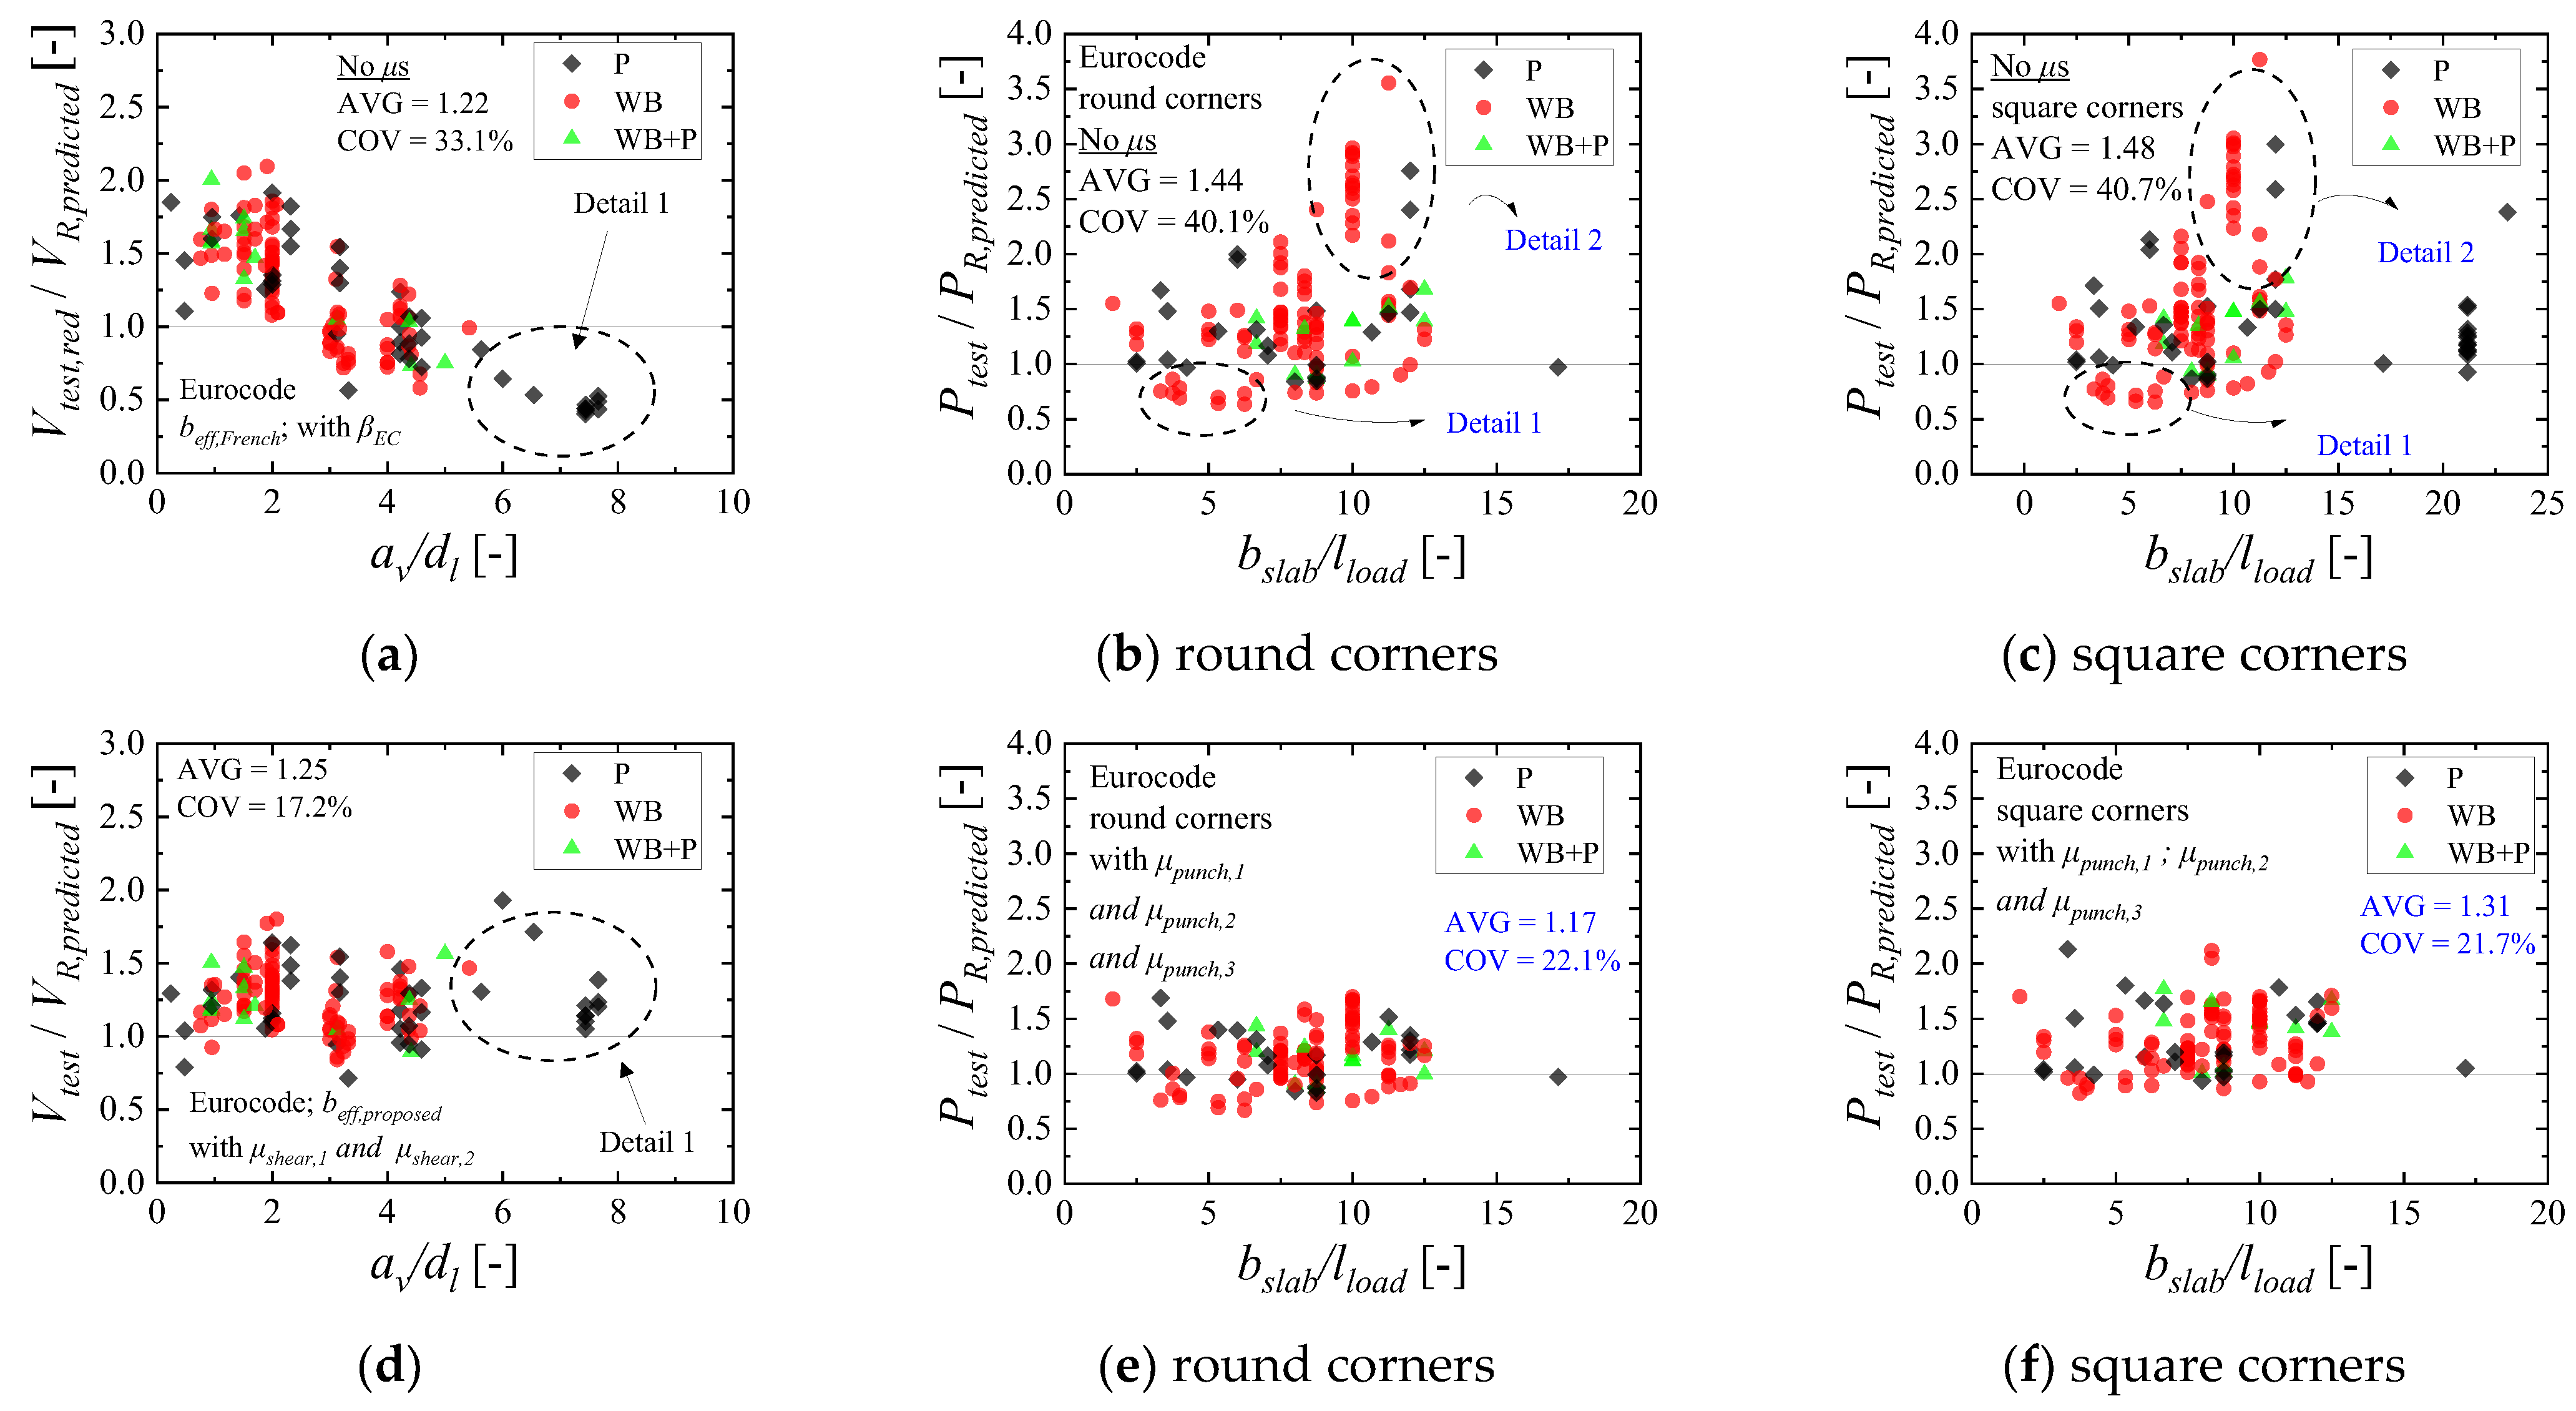
Figure 17 shows the ratio between tested and predicted resistances for one-way shear (Vtest/VR,predicted) and punching shear (Ptest/PR,predicted) considering two cases: (i) without the use of any correction factor μshear or μpunching; (ii) with the use of the correction factors μshear or μpunching.
Figure 17a shows that the predictions of one-way shear capacity are conservative in the range av/dl < 2, even using βEC to decrease the sectional shear Vtest (Vtest,red/VR,predicted > 1). On the other hand, the predictions of one-way shear capacity for the tests with av/dl > 5 may become quite unsafe (Vtest/VR,predicted < 0.6). In Figure 17a, this occurs because the effective shear width predicted with the French approach increases excessively by increasing the shear slenderness av/dl. Figure 17d shows that the accuracy and precision of the predictions improved notably by using the proposed correction factors to consider the arching action and the reduced effective shear width for large shear slenderness av/dl. The average ratio Vtest/VR,predicted changed from 1.22 to 1.25 and the coefficient of variation decreased from 33.1% to 17.2%.
Figure 17b shows the predictions of punching capacity with the EN 1992-1-1:2004 as a function of the ratio between the slab width and load size in the transverse direction bslab/lload and without the use of any correction factor (μpunching,1 and μpunching,2). Figure 17b shows that the predictions may become quite unsafe for the tests that failed as wide beams in one-way shear, mainly for ratios bslab/lload < 7.5 (see Detail 1 in Figure 17b). This occurs because the contribution of the sides of the control perimeter parallel to the slab-free edges was overestimated with the traditional approach (which is rarely discussed in most publications). In the same way, the predictions of punching capacity with the European code expressions may become overly conservative if arching action is not considered in the portion of the control perimeter close to the line support when av/dl < 2 (see Detail 2 in Figure 17b). On the other hand, Figure 17e shows that the proposed recommendations significantly improve the predictions of punching capacity. Comparing Figure 17b,e, the average ratio between tested and predicted resistances changes from 1.44 to 1.17 and the coefficient of variation decreases from 40.1% to 22.1%.
Figure 17c,f also shows the relation Ptest/PR,predicted, with and without the corrections factors for punching, respectively, but using a square control perimeter such as suggested by Regan [19] and sketched in Figure 14e,f. As can be seen, the results using a square control perimeter is similar to that achieved with the round control perimeter but slightly more conservative (see Figure 17c,f).

5.2. Results with the Fib Model Code 2010 Code Expressions

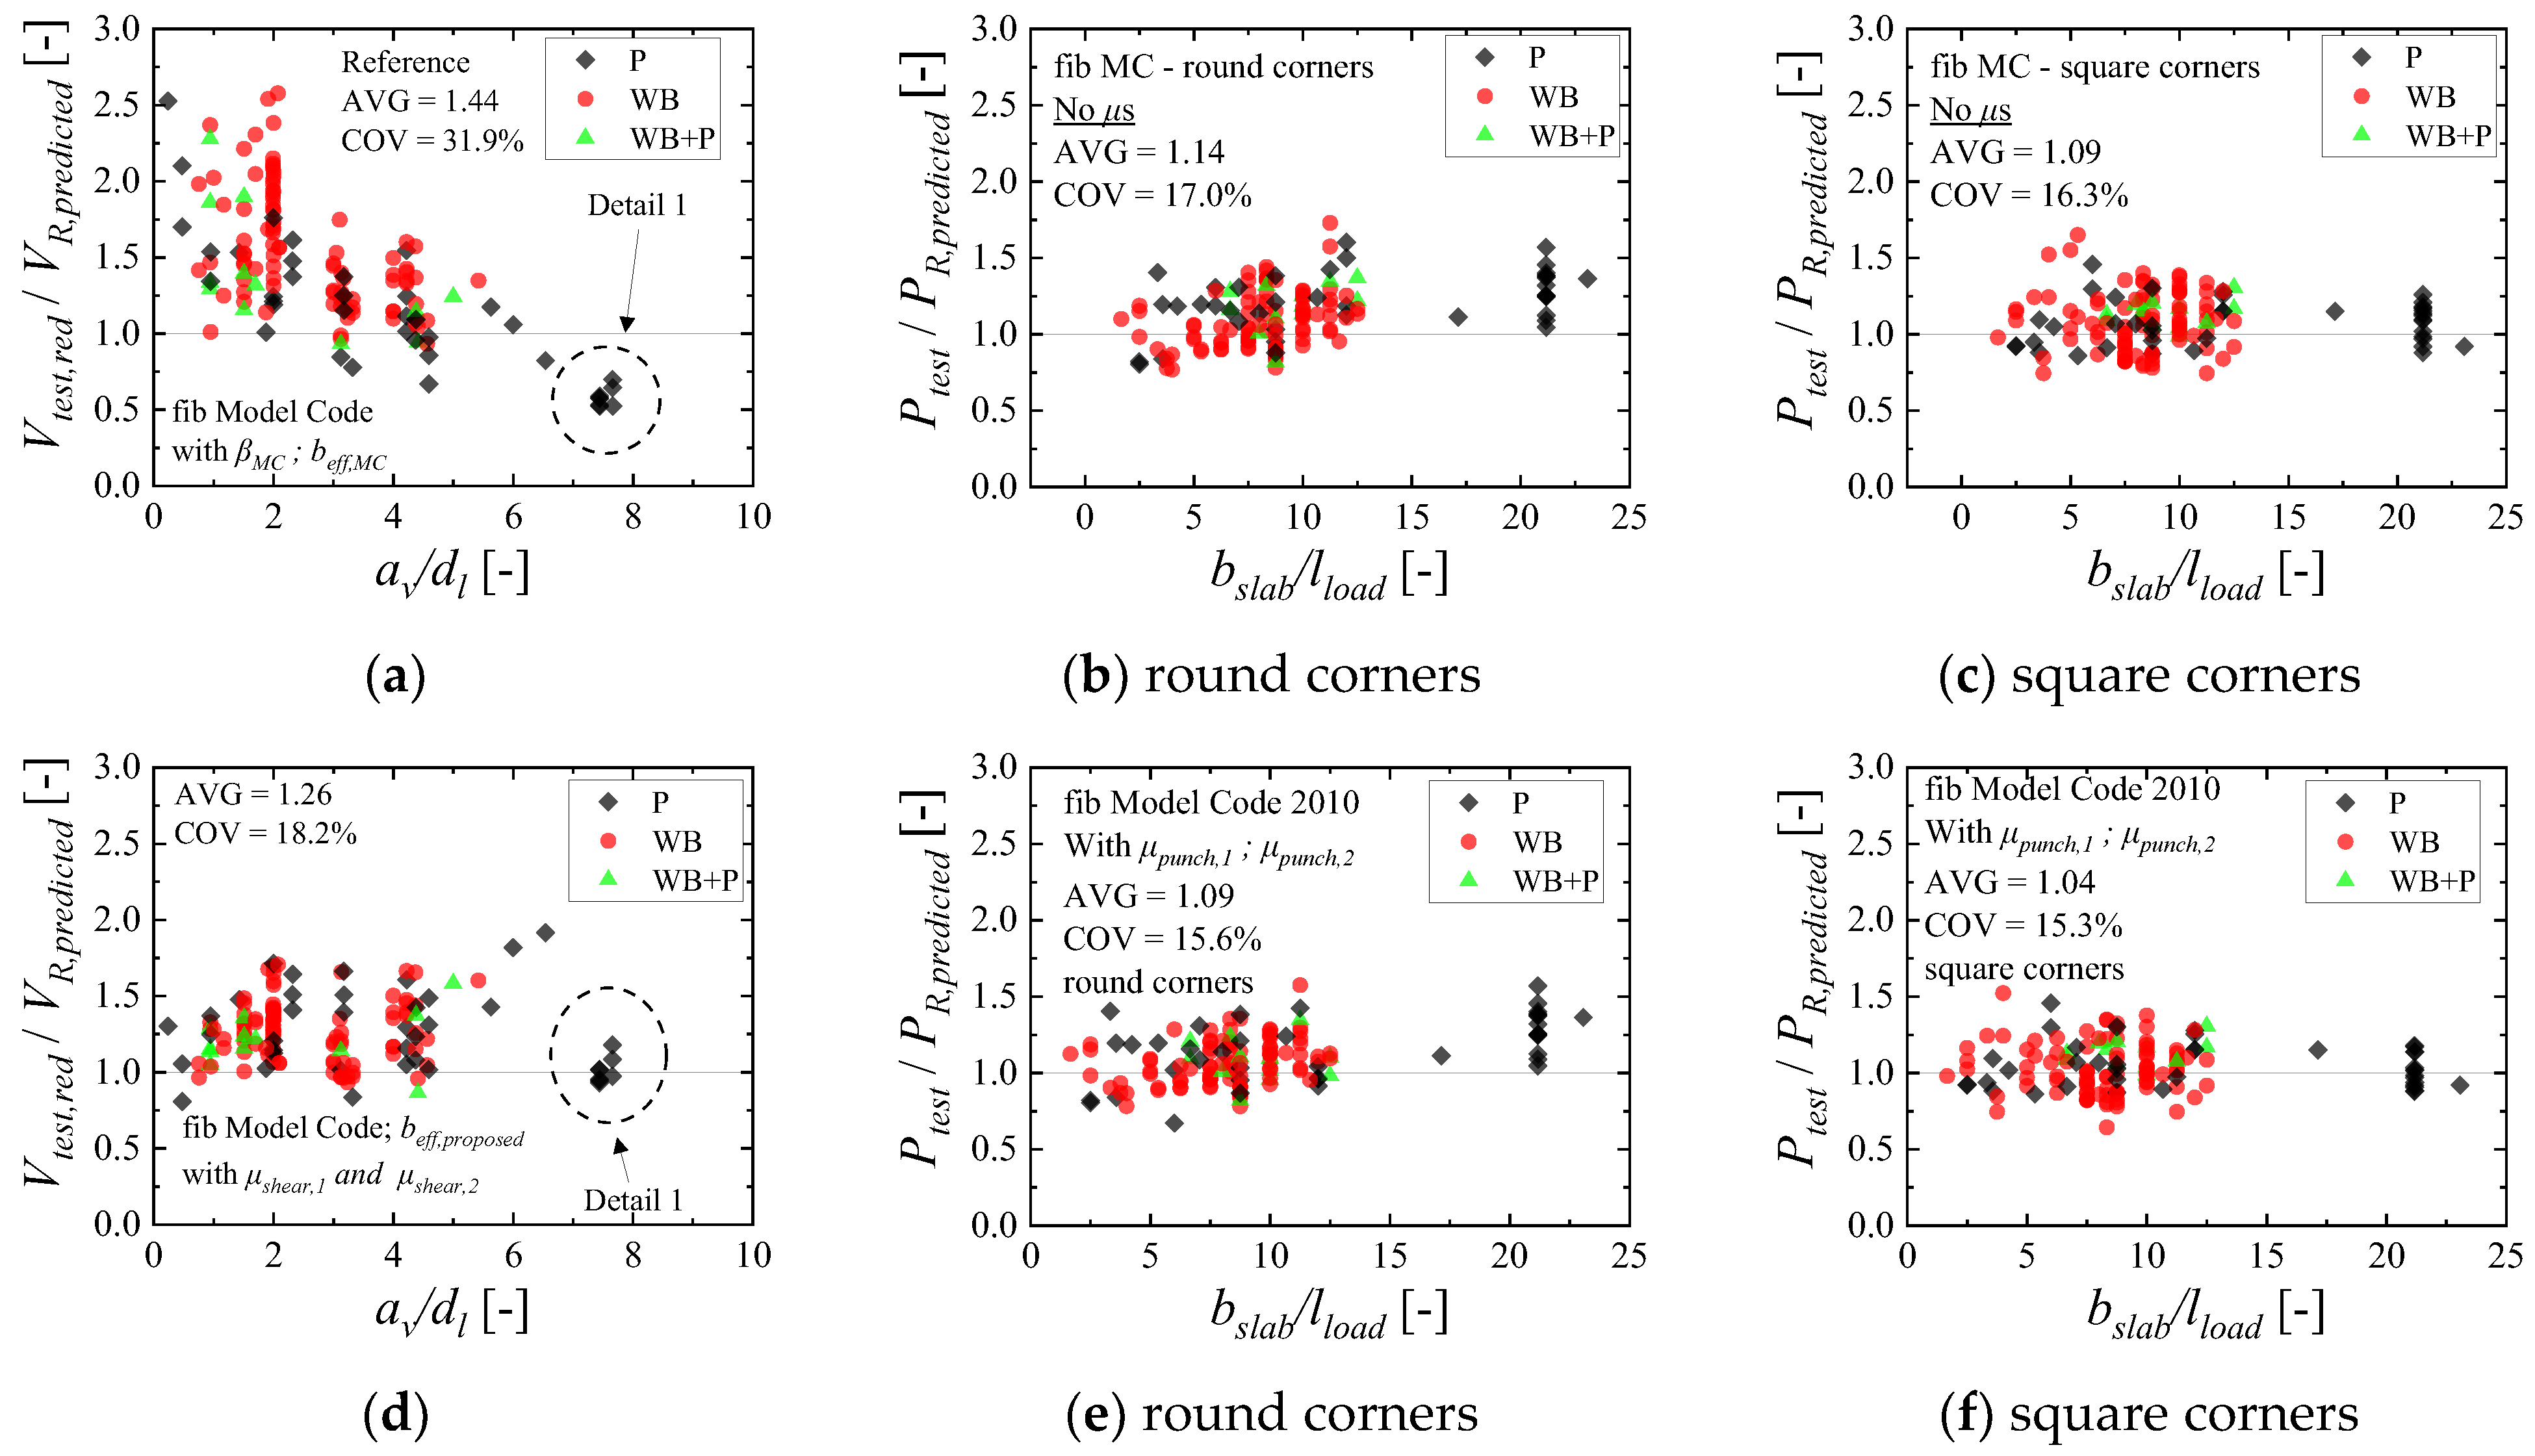
Figure 18a,d evaluates the relation between tested and predicted resistances for one-way shear with the fib Model Code expressions. The results shown in Figure 18a do not include any correction factor μshear,1 or μshear,2. At this point, however, it is important to note that the fib Model Code 2010 adopts the factor βMC, to consider the arching action (having a similar effect to the proposed μshear,1). Figure 18d shows the results, including the proposed correction factors μshear,1 or μshear,2.
In summary, similar results compared to that presented for the Eurocode expressions are observed (Figure 17). The predictions of one-way shear capacity were conservative in the range av/dl < 2. On the other hand, these predictions were quite unsafe for av/dl > 5 (Figure 18a). Using the correction factors μshear,1 and μshear,2, these shortcomings are corrected (Figure 18d). The average ratio Vtest/VRpredicted reduced from 1.44 to 1.26 and the coefficient of variation decreased from 31.9% to 18.2%, comparing Figure 18a,d.
Evaluating the predictions with the punching capacity expressions from fib Model Code 2010 (Figure 18b,e), the results differ more from those observed with the Eurocode expressions (Figure 17b,e). Figure 18b shows that, in general, the predictions of punching capacity without the correction factors μpunching already reached enhanced levels of accuracy (coefficient of variation lower than 20%, for instance, and the average ratio Ptest/PR,predicted between 1.0 and 1.20). Using the proposed correction factors to consider the disturbed contribution as a function of the slab width, the predictions on this range were slightly enhanced (Figure 18e). Comparing Figure 18b,e, the average ratio Ptest/PR,predicted decreased slightly from 1.14 to 1.09 and the coefficient of variation varied from 17.0% to 15.6%.
These results indicate that the presented approach, without the correction factors, already takes into consideration some important aspects of the problem. For instance, the critical shear crack theory (CSCT) expressions of punching already take into account the part of the enhanced shear capacity for loads close to the support due to the smaller slab rotations in such regions.
Comparing the predictions of punching capacity using round corners (Figure 18b,e) and square corners (Figure 18c,f), the results are quite similar. This occurs because placing the control perimeter at 0.5davg makes the total length of the control perimeter more similar, even with the different shapes.

6. Discussion

In the literature, most evaluations of the shear capacity of one-way slabs under concentrated loads focus on the predictions of the one-way shear capacity [6,7,10]. Consequently, most recommendations until now have focused on improving the definitions of the effective shear width [5,10] or improving the evaluation of the shear demand by the concentrated loads [7,41,42]. Therefore, these studies contributed to evaluating the problem from a narrower perspective since, in practice, these slabs may fail either by one-way shear or punching shear, even for loads close to the support (Detail 1 in Figure 17a, for instance).
In addition, in most studies in which the one-way shear capacity was evaluated, the proposed recommendations were frequently validated only to a specific support condition (such as cantilever slabs, [10]). Consequently, this study brings a more comprehensive contribution since it discusses both one-way shear and two-way shear failure mechanisms and is validated to a dataset of slabs with varied support conditions and load layouts. At this point, the following aspects of the problem are highlighted: (i) For either cantilever slabs, simply supported slabs and continuous slabs, a decrease in the effective shear width as a function of the shear slenderness is justified, regardless of the code expressions. In the end, despite being based on very different expressions, both Eurocode and fib Model Code expressions reached similar levels of accuracy. (ii) The level of accuracy for the punching expressions from different codes varies more significantly. In practice, it is more difficult to reach enhanced predictions of punching capacity with the Eurocode expressions for cantilever slabs since the reinforcement considered for punching is different from that considered for one-way shear and because the punching resistance expressions are not sensitive to the load position. As a consequence, the failure load predicted with the punching expressions can be overly conservative if the slabs fail as wide beams in one-way shear. On the other hand, as the fib Model Code expressions take into consideration the load position in the determination of the punching capacity through the slab rotations, the predictions of punching capacity are more accurate, even when the slabs failed in one-way shear and despite considering the bottom reinforcement for cantilever slabs.
By evaluating the governing failure mechanism of the tests, it is interesting to note that both one-way shear and punching shear failures may occur for loads close to the support (av/dl < 2) (Figure 17a, for instance). Additionally, it can be seen that the ultimate loads were enhanced for av/dl < 2 regardless of the governing failure mechanism being one-way shear or punching shear (Figure 17a). Therefore, these results indicate a close relation between one-way shear mechanisms and two-way shear mechanisms for loads close to the support in one-way slabs.
It is also interesting to note that the predictions of one-way shear capacity with the fib Model Code 2010 expressions follow the same tendency observed with the European code expressions: conservative results for shear slenderness av/dl ≤ 2 and unsafe predictions for large values of av/dl. Since the shear expressions of the fib Model Code 2010 already take into account the beneficial effect of short shear spans and the detrimental effect of the large shear spans through the calculations of mE and vE, this result draws attention. In practice, this occurs because the influence of the arching action is more significant than the effect of smaller mE for av/dl < 2 [15]. In the same way, the effect of larger bending moments mE for av/dl > 5 (which decreases the unitary shear capacity vR,shear,MC) does not compensate for the increase in the effective shear width when the load is placed so far from the support with the current French approach beff,French or fib Model Code rules to determine the effective shear width. Therefore, the predictions of one-way shear capacity for large shear slenderness can be safe only if the effect of a reduced effective shear width is considered in the expressions, as proposed in this paper.
Notably, the predictions of the punching capacity with the fib Model Code expressions did not change significantly by using the proposed factors compared to the Eurocode expressions. The reasons for this are: (i) the shear-resisting control perimeter with the fib Model Code is less sensitive to the slab width, as the control perimeter is set at the distance of 0.5davg from the loaded area, and (ii) because the expressions of the fib Model Code 2010 already take into account the influence of a reduced shear span in the expressions by calculating the slab rotations. Moreover, the unitary punching capacity is greater than the corresponding unitary shear capacity in one-way shear [43], as the failure for the first always occurs around the load, which is enhanced by significant confinement stresses [44]. In this way, the enhanced punching capacity for loads close to the support is already partially considered without a factor μpunching,1 through the (i) enhanced unitary punching capacity compared to the one-way shear capacity and (ii) the calculations of the slab rotations around the load.
In summary, this study shows that arching action is a key parameter for loads close to the support, mainly for the one-way shear expressions. Additionally, this study shows that considering a reduced shear demand VE by the factor β or improved shear capacity VR by μshear,1 leads to similar results for the tests with av/dl < 2. Concerning the effective shear width, this study demonstrates with different one-way code expressions that a simple correction in the French effective shear width by the factor μshear,2 allows for improving the accuracy of the one-way shear expressions for loads far from the support. In this way, the factor μshear,2 allows consideration that a possible one-way shear failure or punching failure will develop under a narrower slab strip.
For the punching shear expressions, however, different results were observed. For the Eurocode expressions, consideration of arching action, slab width and the position a/lspan plays a key role in enhancing the predictions of punching capacity, mainly when the slabs may fail as wide beams and for cantilever slabs. On the other hand, the fib Model Code expressions are less dependent on such factors to reach enhanced levels of accuracy. In practice, this occurs mainly because the arching action is indirectly considered for the punching shear expressions through the calculations of the slab rotations, which decrease for loads close to the support, and also because the unitary punching strength in the fib Model Code is larger than the corresponding unitary one-way shear strength.
For future studies, however, it seems essential to validate such insights for the combination of concentrated loads representing the whole design truck or tandem. At this point, it is important to note that the number of tests with a combination of concentrated loads is very limited compared to that with single concentrated loads. Since testing such loading combinations is challenging, using numerical models may be a good alternative [23,45,46].

7. Conclusions

This study evaluated one-way slabs under concentrated loads that failed in different shear failure mechanisms. Both one-way shear and punching shear resistance predictions were discussed according to the current Eurocode [25] and fib Model Code 2010 expressions [21]. From the results observed with and without the proposed recommendations, the following conclusions can be drawn:
  • The ultimate capacity of one-way slabs under concentrated loads increases significantly when the loads are placed close to the support at distances av/dl ≤ 2, due to arching action, regardless of the slabs failing in one-way shear as wide-beam (WB) or punching shear (P). In this study, the enhancement factor μshear,1 and μpunch,1 are applied for both one-way shear and punching shear expressions to consider this mechanism. Comparatively, the ultimate resistance of the slabs decreases significantly when the loads are placed at distances av/dl ≥ 3. At such positions, most slabs from the database failed by punching, which is a failure mechanism concentrated around the load. Therefore, a reduced effective shear width should be employed if the one-way shear resistance needs to be checked at such positions. In this study, the factor μshear,2 allows for decreasing the effective shear width for larger distances from the load to the support.
  • In the punching shear resistance predictions, however, the slab width may also play a significant role. For slabs with a reduced slab width compared to the effective depth, for instance, t < 5 with t = (bslablload − 4davg)/davg, the contribution of the sides of the control perimeter parallel to the free edges is reduced due to the small shear flow going through these sides. In this study, it is proposed to multiply the contribution of these sides by μpunch,2 to consider this effect. In the case of cantilever slabs, and particularly with the Eurocode expressions, another aspect considerably influences the predictions of punching capacity. The punching capacity expressions use the bottom reinforcement of the slab in the calculations, and many of these slabs fail in one-way shear, presenting higher demand on the top reinforcement of the slabs. Consequently, the predictions of punching capacity can become overly conservative for loads placed at distances av/dl close to 2. Because of this, a third factor was needed to reach enhanced predictions for cantilever slabs using the Eurocode expressions.
  • The one-way shear capacity predictions are significantly enhanced by considering the arching action for loads close to the support by a factor μshear,1. Furthermore, the transition from one-way shear failures as wide-beam (WB) to punching failures (P) by increasing the shear slenderness av/dl can be considered in a simplified way by multiplying the predicted effective shear width beff,french by the factor μshear,2. In this way, enhanced predictions of one-way shear capacity can be achieved for the tests, even when they fail by punching. In practice, these observations were valid for both codes (Eurocode and fib Model Code).
  • The predictions of punching capacity with the Eurocode expressions are significantly enhanced considering the factors related to arching action and to the slab width in the proposed approach. In the case of the fib Model Code 2010 expression, these enhancements were less pronounced since the results without the proposed factors already led to relatively enhanced predictions. In other words, the proposed recommendations to calculate the slab rotations and respective shear capacity on each portion of the control perimeter (without the use of numerical models) have already led to good levels of accuracy.
  • In general, the one-way shear and punching shear predictions led to similar levels of accuracy when using the proposed recommendations. In the case of the current Eurocode, the average ratio Vtest/VR,predicted was 1.25 with a coefficient of variation of 17.2%, while the average ratio Ptest/PR,predicted was 1.17 with a coefficient of variation of 22.1%. In the case of the fib Model Code 2010, the average ratio Vtest/VR,predicted was 1.26 with a coefficient of variation of 18.2% and the average ratio Ptest/PR,predicted was 1.09 with a coefficient of variation of 15.6%. Therefore, both one-way shear and punching shear predictions may lead to close estimations of the ultimate capacity, regardless of the governing failure mechanism of the slabs, when the parameters that influence the transition from one failure mechanism to another are embedded in the calculations.

Author Contributions

Conceptualization, A.M.D.d.S. and E.O.L.L.; methodology, A.M.D.d.S. and E.O.L.L.; software, A.M.D.d.S.; validation, A.M.D.d.S.; formal analysis, A.M.D.d.S.; investigation, A.M.D.d.S. and E.O.L.L.; resources, A.M.D.d.S. and M.K.E.D.; data curation, A.M.D.d.S. and E.O.L.L.; writing—original draft preparation, A.M.D.d.S. and E.O.L.L.; writing—review and editing, A.M.D.d.S. and E.O.L.L.; visualization, A.M.D.d.S.; supervision, E.O.L.L. and M.K.E.D.; project administration, M.K.E.D.; funding acquisition, M.K.E.D. All authors have read and agreed to the published version of the manuscript.

Funding

The authors acknowledge financial support provided by the São Paulo Research Foundation (FAPESP), grant number #2018/21573-2, grant number #2019/20092-3 and grant number #2021/13916-0; and by the Brazilian National Council for Scientific and Technological Development (CNPq), grant number #303438/2016-9.

Data Availability Statement

The main database used in the investigations is available through the open-access repository Zenodo at: https://zenodo.org/record/5911469 (accessed on 24 November 2022). Other supplementary data that support the findings of this study are available from the first author, A.M.D.d.S., upon reasonable request.

Conflicts of Interest

The authors declare no conflict of interest.

Notation

ashear span: distance between the center of the support and the center of the load
avclear shear span: distance between face of support and face of load
b0total length of the shear-resisting control perimeter
b0,x1side of the control perimeter in the spanning direction between the load and the closer support
b0,x2side of the control perimeter in the spanning direction between the load and the far support
b0,y1side of the control perimeter in the transverse direction close to the free edge 1
b0,y2side of the control perimeter in the transverse direction close to the free edge 2
beffeffective shear width
beff,proposedproposed effective shear width
beff,frenchFrench effective shear width
bslabslab width
bloadsize of the concentrated load in the slab width direction (transverse direction)
davgaverage effective depth of the flexural reinforcement
dleffective depth towards longitudinal steel
dteffective depth towards transverse steel
dgmaximum aggregate size
dg0reference aggregate size (=16 mm in fib Model Code 2010)
ddgparameter that considerers the crack roughness
fcaverage compressive strength measured on cylinder specimens
fyisteel yielding stress in the evaluated direction (x = longitudinal direction and y = transverse direction)
hslabslab thickness
kconstant accounting for size effect in one-way shear for EN 1992-1-1:2004
k1factor accounting for axial forces in one-way shear for EN 1992-1-1:2004
kdgcoefficient for aggregate size (=32/(16 mm + dg) in fib Model Code 2010)
kvfactor accounting for strain effect and member size in fib Model Code 2010
kψfactor accounting for effect of crack widths and roughness of cracks on shear strength in fib Model Code 2010
lspanspan length
lloadsize of the concentrated load in the span direction
lsis the length of the sides with one-way shear behavior
mR,iyielding moment per unit length in the evaluated direction
mmaxmaximum bending moment at the control section for a given applied load
ms,ijaveraged acting bending moment at the loading plate edge ij within the width bs
mEddesign bending moment at the control section
rsdistance between the center of the concentrated load and the line of contraflexure of moments (subscripts x, y refers to the direction considered)
rs,ijdistance between the center of the concentrated load and the point of contraflexure in the evaluated direction
vshear force per unit length (nominal shear force)
vEshear force at the control section
vEddesign shear force at the control section
vminminimum one-way shear resistance per unit length in EN 1992-1-1:2004
vR,shearunitary one-way shear resistance
vgshear forcer per unit length in the control section placed at a/2 due to the self-weight
wcrwidth of the critical shear crack
zeffective shear depth in fib Model Code 2010
Ascross-sectional area of flexural reinforcement
CR,ccalibration factor in the shear and punching expressions of EN 1992-1-1:2004
Ecmodulus of elasticity of concrete
Essteel modulus of elasticity
Fapplied concentrated load
FEddesign concentrated load
Fpredictedpredicted load that causes a one-way shear failure or two-way shear failure
Fuapplied concentrated load at failure
Fhyparbitrary concentrated load
Lspan length
Vcontroltotal shear force going through the evaluated direction along the slab width
VEddesign shear action
VFushear force due to the concentrated load Fu
Vtestmeasured one-way shear force at failure in the tests for a section at a/2.
VRone-way shear capacity
VR,predictedpredicted one-way shear resistance
VRddesign one-way shear capacity
VR,CSCTpredicted one-way shear resistance with the CSCT expressions
VR,ijpunching shear strength corresponding to b0,ij
Ptestmaximum applied concentrated load at failure
PEddesign concentrated loads
PRddesign punching capacities
Ppredictedpredicted punching resistance
Pflexconcentrated load associated with the slab flexural capacity
PR,punchingtotal shear force resisted by punching
βshearenhancement factor to account for arching action
ρavgaverage flexural reinforcement ratio considering both directions
ρlflexural reinforcement ratios in longitudinal direction
ρtflexural reinforcement ratio in transverse direction
ψrotations around the loaded area
ψijrotations in each side of the control perimeter
εxstrain in the control depth for one-way shear analyses
εyis the flexural reinforcement yield strain
γconcrete specific weight (assumed = 24 kN/m3 in this study)
γcpartial safety factor of concrete
μshear,1factor accounting for arching action in one-way shear analyses
μshear,2factor accounting for reduced beff for loads far away from the support
μpunch,1factor accounting for arching action in punching shear analyses
μpunching,2factor accounting for the influence of the slab width in the effective contribution of the sides b0,y1 and b0,y2 to the punching capacity
μpunching,3correction factor related to the load position in cantilever slabs for punching capacity predictions
AVGaverage
COVcoefficient of variation
Pobserved failure mode is punching failure
SStest was performed with the load closer to the simple support
CStests was performed with the concentrated loads close to a continuous support
CTtest was performed with the concentrated load applied on a cantilever slab
WBobserved failure mode is wide-beam shear failure
WB + Pthe observed failure mode combines characteristics of WB and P

References

  1. Lantsoght, E.O.L.; van der Veen, C.; Walraven, J.; de Boer, A. Recommendations for the Shear Assessment of Reinforced Concrete Slab Bridges from Experiments. Struct. Eng. Int. 2013, 23, 418–426. [Google Scholar] [CrossRef]
  2. Lantsoght, E.O.L.; de Boer, A.; van der Veen, C. Levels of Approximation for the Shear Assessment of Reinforced Concrete Slab Bridges. Struct. Concr. 2017, 18, 143–152. [Google Scholar] [CrossRef]
  3. Coin, A.; Thonier, H. Essais Sur Le Cisaillement Des Dalles En Beton Arme. In Annales du Batiment et des Travaux Publics; EIVP: Paris, France, 2007; pp. 7–16. [Google Scholar]
  4. FD P 18-717; Eurocode 2-Calcul des Structures en Béton-Guide D’application des Normes NF EN 1992. Association Française de Normalisation (AFNOR): Saint-Denis, France, 2013.
  5. Lantsoght, E.O.L.; van der Veen, C.; Walraven, J.C. Shear in One-Way Slabs under Concentrated Load Close to Support. ACI Struct. J. 2013, 110, 275–284. [Google Scholar] [CrossRef]
  6. Reiβen, K.; Classen, M.; Hegger, J. Shear in Reinforced Concrete Slabs-Experimental Investigations in the Effective Shear Width of One-Way Slabs under Concentrated Loads and with Different Degrees of Rotational Restraint. Struct. Concr. 2018, 19, 36–48. [Google Scholar] [CrossRef]
  7. Henze, L.; Rombach, G.A.; Harter, M. New Approach for Shear Design of Reinforced Concrete Slabs under Concentrated Loads Based on Tests and Statistical Analysis. Eng. Struct. 2020, 219, 110795. [Google Scholar] [CrossRef]
  8. Fernández, P.G.; Marí, A.; Oller, E. Theoretical Prediction of the Shear Strength of Reinforced Concrete Slabs under Concentrated Loads Close to Linear Supports. Struct. Infrastruct. Eng. 2021, 1–14. [Google Scholar] [CrossRef]
  9. Fernández, P.G.; Marí, A.; Oller, E. Experimental Investigation of the Shear Strength of One-Way Reinforced Concrete (RC) Slabs Subjected to Concentrated Loads and in-Plane Transverse Axial Tension. Struct. Concr. 2021, 22, 3661–3676. [Google Scholar] [CrossRef]
  10. Halvonik, J.; Vidaković, A.; Vida, R. Shear Capacity of Clamped Deck Slabs Subjected to a Concentrated Load. J. Bridge Eng. 2020, 25, 04020037. [Google Scholar] [CrossRef]
  11. Natário, F.; Fernández Ruiz, M.; Muttoni, A. Shear Strength of RC Slabs under Concentrated Loads near Clamped Linear Supports. Eng. Struct. 2014, 76, 10–23. [Google Scholar] [CrossRef]
  12. Sousa, A.M.D.; el Debs, M.K. Shear Strength Analysis of Slabs without Transverse Reinforcement under Concentrated Loads According to ABNT NBR 6118:2014. IBRACON Struct. Mater. J. 2019, 12, 658–693. [Google Scholar] [CrossRef] [Green Version]
  13. de Sousa, A.M.D.; Lantsoght, E.O.L.; Yang, Y.; el Debs, M.K. Extended CSDT Model for Shear Capacity Assessments of Bridge Deck Slabs. Eng. Struct. 2021, 234, 111897. [Google Scholar] [CrossRef]
  14. Reißen, K. Zum Querkrafttragverhalten von Einachsig Gespannten Stahlbe-Tonplatten Ohne Querkraftbewehrung Unter Einzellasten. Ph.D. Thesis, Faculty of Civil Engineering, RWTH Aachen University, Aachen, Germany, 2016. [Google Scholar]
  15. de Sousa, A.M.D.; Lantsoght, E.O.L.; el Debs, M.K. One-Way Shear Strength of Wide Reinforced Concrete Members without Stirrups. Struct. Concr. 2020, 968–992. [Google Scholar] [CrossRef]
  16. Yang, Y.; den Uijl, J.; Walraven, J.C. Critical Shear Displacement Theory: On the Way to Extending the Scope of Shear Design and Assessment for Members without Shear Reinforcement. Struct. Concr. 2016, 17, 790–798. [Google Scholar] [CrossRef]
  17. Muttoni, A.; Fernandez Ruiz, M. Shear Strength of Members without Transverse Reinforcement as Function of Critical Shear Crack Width. ACI Struct. J. 2008, 105, 163–172. [Google Scholar] [CrossRef]
  18. Regan, P.E.; Rezai-Jorabi, H. Shear Resistance of One-Way Slabs Under Concentrated Loads. ACI Struct. J. 1988, 85, 150–157. [Google Scholar] [CrossRef]
  19. Regan, P.E. Shear Resistance of Concrete Slabs at Concentrated Loads Close to Supports; Polytechnic of Central: London, UK, 1982. [Google Scholar]
  20. Vaz Rodrigues, R.; Fernández Ruiz, M.; Muttoni, A. Shear Strength of R/C Bridge Cantilever Slabs. Eng. Struct. 2008, 30, 3024–3033. [Google Scholar] [CrossRef]
  21. Fédération Internationale du Béton (FIB). Fib Model Code for Concrete Structures 2010. In Ernst & Sohn-Fédération Internationale du Béton; Bulletin 65: Lausanne, Switzerland, 2012; Volumes 1–2. [Google Scholar]
  22. NEN-EN 1992-1-1; Eurocode 2: Design of Concrete Structures-Part 1-1: General Rules and Rules for Buildings. Comité Européen de Normalisation: Brussels, Belgium, 2005.
  23. de Sousa, A.M.D.; Lantsoght, E.O.L.; Setiawan, A.; el Debs, M.K. Transition from One-Way to Two-Way Shear by Coupling LEFEA and the CSCT Models. In Proceedings of the fib Symposium 2021, Concrete Structures: New Trends for Eco-Efficiency and Performance, Lisbon, Portugal, 14–16 June 2021. [Google Scholar]
  24. de Sousa, A.M.D.; Lantsoght, E.O.L.; el Debs, M.K. Transition between Shear and Punching in RC Slabs: Review and Predictions with ACI Code Expressions. ACI Struct. J. 2023, 120. [Google Scholar] [CrossRef]
  25. EN 1992-1-1; Eurocode 2: Design of Concrete Structures-Part 1-1: General Rules and Rules for Buildings. Comité Européen de Normalisation: Brussels, Belgium, 2004.
  26. Lantsoght, E.O.L.; van der Veen, C.; Walraven, J.C.; de Boer, A. Database of Wide Concrete Members Failing in Shear. Mag. Concr. Res. 2015, 67, 33–52. [Google Scholar] [CrossRef]
  27. Pastore, M.V.F.; Vollum, R.L. Shear Enhancement in RC Beams with Stirrups Simultaneously Loaded within 2d and at 3d from Supports. Eng. Struct. 2022, 264, 114408. [Google Scholar] [CrossRef]
  28. Bairán, J.M.; Menduiña, R.; Marí, A.; Cladera, A. Shear Strength of Non-Slender Reinforced Concrete Beams. ACI Struct. J. 2020, 117, 277–290. [Google Scholar] [CrossRef]
  29. de Sousa, A.M.D.; Lantsoght, E.O.L.; el Debs, M.K. Databases of One-Way Slabs under Concentrated Loads: Parameter Analyses and Validation of the Proposed Approach; Zenodo: Geneva, Switzerland, 2022; Available online: https://zenodo.org/record/5911469 (accessed on 24 November 2022).
  30. Bui, T.T.; Limam, A.; Nana, W.-S.-A.; Ferrier, E.; Bost, M.; Bui, Q.-B. Evaluation of One-Way Shear Behaviour of Reinforced Concrete Slabs: Experimental and Numerical Analysis. Eur. J. Environ. Civ. Eng. 2017, 24, 190–216. [Google Scholar] [CrossRef]
  31. Carvalho, A.S. De Análise Experimental de Lajes Lisas de Concreto Armado de Alta Resistência Com Metacaulim Apoiadas Em Pilares Retangulares e Armadas à Punção. Master’s Thesis, Departamento de Engenharia Civil, Universidade Federal do Pará, Belém, Brazil, 2006. [Google Scholar]
  32. Damasceno, L.S.R. Experimental Analysis of One-Way Reinforced Concrete Flat Slabs in Punching Shear with Rectangular Columns (In Portuguese: Análise Experimental de Lajes Lisas Unidirecionais de Concreto Armado Com Pilares Retangulares Ao Puncionamento). Masters’ Thesis, Departamento de Engenharia Civil, Universidade Federal do Pará, Belém, Brazil, 2007. [Google Scholar]
  33. de P. Ferreira, M. Experimental Analysis of One-Way Reinforced Concrete Flat Slabs in Axis or Non-Axis-Symmetric Punching Shear (in Portuguese: Análise Experimental de Lajes Lisas Unidirecionais de Concreto Armado Ao Puncionamento Simétrico Ou Assimétrico). Master’s Thesis, Universidade Federal do Pará, Belém, Brazil, 2006. [Google Scholar]
  34. Lantsoght, E.O.L. Shear in Reinforced Concrete Slabs under Concentrated Loads Close to Supports. Ph.D. Thesis, Faculty of Civil Engineering and Geosciences, Delft University of Technology, Delft, The Netherlands, 2013. [Google Scholar] [CrossRef]
  35. Natário, F.; Fernández Ruiz, M.; Muttoni, A. Experimental Investigation on Fatigue of Concrete Cantilever Bridge Deck Slabs Subjected to Concentrated Loads. Eng. Struct. 2015, 89, 191–203. [Google Scholar] [CrossRef]
  36. Rombach, G.A.; Latte, S. Shear Resistance of Bridge Decks without Shear Reinforcement. In Proceedings of the International Fib Symposium, Amsterdam, The Netherlands, 19–21 May 2008; pp. 519–525. [Google Scholar]
  37. Rombach, G.; Latte, S. Querkrafttragfähigkeit Von Fahrbahnplatten Ohne Querkraftbewehrung. Beton-Und Stahlbetonbau 2009, 104, 642–656. [Google Scholar] [CrossRef]
  38. Rombach, G.; Henze, L. Querkrafttragfähigkeit von Stahlbetonplatten Ohne Querkraftbewehrung Unter Konzentrierten Einzellasten. Beton- Und Stahlbetonbau 2017, 112, 568–578. [Google Scholar] [CrossRef]
  39. Vaz Rodrigues, R. LE JOUR DE L’ESSAI A L’ L’IS-BETON. In Essai d’un Porte-à-Faux de Pont Sous Charge Concentrée; ENAC: Lausanne, Switzerland, 2002; p. 88. [Google Scholar]
  40. Vida, R.; Halvonik, J. Experimentálne Overovanie Šmykovej Odolnosti Mostovkových Dosiek (Experimental Verification of Shear Resistance of Bridge Deck Slabs). Inžinierske Stavby/InženýrskÉ Stavby 2018, 4, 2–6. [Google Scholar]
  41. Lantsoght, E.O.L.; van der Veen, C.; de Boer, A.; Walraven, J.C. Transverse Load Redistribution and Effective Shear Width in Reinforced Concrete Slabs. Heron 2015, 60, 145–179. [Google Scholar]
  42. Lantsoght, E.O.L.; de Boer, A.; van der Veen, C.; Walraven, J.C. Effective Shear Width of Concrete Slab Bridges. Proc. Inst. Civ. Eng. -Bridge Eng. 2015, 168, 287–298. [Google Scholar] [CrossRef]
  43. Muttoni, A.; Fernandez Ruiz, M. Shear in Slabs and Beams: Should They Be Treated in the Same Way? In Proceedings of the FIB Bulletin 57: Shear and Punching shear in RC and FRC Elements, Salò, Italy, 15–16 October 2010; pp. 105–128. [Google Scholar]
  44. Marí, A.; Cladera, A.; Oller, E.; Bairán, J.M. A Punching Shear Mechanical Model for Reinforced Concrete Flat Slabs with and without Shear Reinforcement. Eng. Struct. 2018, 166, 413–426. [Google Scholar] [CrossRef]
  45. Shu, J.; Honfi, D.; Plos, M.; Zandi, K.; Magnusson, J. Assessment of a Cantilever Bridge Deck Slab Using Multi-Level Assessment Strategy and Decision Support Framework. Eng. Struct. 2019, 200, 109666. [Google Scholar] [CrossRef]
  46. de Sousa, A.M.D.; Lantsoght, E.O.L.; Genikomsou, A.S.; Krahl, P.A.; el Debs, M.K. Behavior and Punching Capacity of Flat Slabs with the Rational Use of UHPFRC: NLFEA and Analytical Predictions. Eng. Struct. 2021, 244, 112774. [Google Scholar] [CrossRef]
Figure 1. (a) Example of bridge deck slab under the concentrated loads of the European design tandem; (b) example of calculation of the design shear stress vE at the support combining the actions from the self-weight and the ones from the load axes using the effective shear width definition; (c) example of laboratory test.
Buildings 13 00434 g001
Figure 2. (a) Sketch of the test S35B1-1 from Reiβen [14] and position of the control section on which the acting bending moments and shear demand are evaluated with fib Model Code 2010 [21]; (b) example of possible distribution in shear demand vE and shear resistance vR using one-way shear models that do not consider the influence of the ratio mE/vEdl in the unitary shear capacity (note that the most critical position for one-way shear will always be close to the support in this approach); (c) example of possible distribution in shear demand vE and shear resistance vR at the control section with the models that consider the lower shear resistance increasing the ratio mE/vE dl.
Buildings 13 00434 g002
Figure 3. Determination of the (a) unitary shear resistance vR,shear and (b) punching capacity PR,predicted iteratively for the fib Model Code expressions.
Buildings 13 00434 g003
Figure 4. Flowchart of calculations for (a) one-way shear resistance predictions and (b) punching shear capacity with the fib Model Code 2010 expressions in the comparisons between tested and predicted resistances.
Buildings 13 00434 g004
Figure 5. Proposed approach to calculate the relation between the applied concentrated load and the acting shear vE and bending moments mE when using the fib Model Code 2010 expressions for one-way shear: (a) Sketch of a test to be evaluated; (b) assumption of fictitious a test with 1 m width with equal support conditions to calculate vE, mE and, subsequently, the unitary shear capacity vR; (c) multiplying of the test sketched in (b) by the respective effective shear width calculated in (a).
Buildings 13 00434 g005
Figure 6. Influence of the shear slenderness (here defined as av/dl) in the cracking pattern and failure mechanism of members loaded over the entire width: (a) slender beams failing in flexure-shear; (b) non-slender beams failing in shear-compression (adapted from Muttoni and Fernandez Ruiz [17]).
Buildings 13 00434 g006
Figure 7. Effective shear width defined according to the (a) French guidelines [4]; (b) fib Model Code 2010 [21].
Buildings 13 00434 g007
Figure 8. (a) Normalized sectional shear achieved in the tests as a function of (a) shear slenderness av/dl and (b) change in the cracking pattern and corresponding failure mechanism as a function of the ratio av/dl (cut views of a set of tests from Reiβen et al. [6]). Source: Adapted from Sousa, Lantsoght and El Debs [24]. Note: WB = wide-beam shear failure (one-way shear); P = punching failure; WB + P = mixed failure mode between one-way shear and punching shear.
Buildings 13 00434 g008
Figure 9. Yield line pattern for flexural assessment of simply supported, continuous and cantilever slabs.
Buildings 13 00434 g009
Figure 10. Different layouts of the control perimeter for simply supported slabs: (a) four sides, (b) two sides and (c) three sides; and for cantilever slabs: (d) three sides, (e) one side and (f) two sides.
Buildings 13 00434 g010
Figure 11. (a) Shear flow and possible shear failure mechanisms for the slab: one-way shear as wide beams, punching shear around the load and a mixed-failure mode; (b) sides enhanced or disturbed due to the ratio av/dl and bslab/lload for a simply supported slab; (c) influence of the slab width to load size ratio bslab/lload on the failure load of slabs under concentrated loads (adapted from [24]); (d) influence of the slab width on the cracking pattern and consequently on the failure mechanism of the tests (adapted from Reiβen et al. [6]). Note: WB = wide-beam shear failure (one-way shear); P = punching failure; WB + P = mixed failure mode between one-way shear and punching shear.
Buildings 13 00434 g011
Figure 12. (a) Effective shear width corrected as a function of the shear slenderness av/dl (the proposed effective shear width decreases as the shear slenderness increases) and (b) failure mechanism varying from one-way shear as wide-beam (WB) to punching shear (P) increasing av/dl for the tests from Reiβen et al. [6].
Buildings 13 00434 g012
Figure 13. Calibration of μshear,2 for (a) simply supported and continuous slabs using the current Eurocode expressions; (b) cantilever slabs using the current Eurocode expressions; (c) simply supported and continuous slabs using the fib Model Code 2010 expressions; (d) cantilever slabs using the fib Model Code 2010 expressions. Note: SS = simple support (hinged support); CS = continuous support; CT = cantilever slab.
Buildings 13 00434 g013
Figure 14. Possible partitions of the shear-resisting control perimeter for simply supported slabs and EN 1992-1-1:2004: (ad) using the rounded corners; (e,f) using the squared control perimeter.
Buildings 13 00434 g014
Figure 15. Comparison between tested and predicted resistances using the punching capacity expressions from Eurocode according to the parameter t (related to the slab width) for the dataset of simply supported and continuous slabs (97 tests results): (a) using only the factor μpunch,1 and (b) using both factors μpunch,1 and μpunch,2.
Buildings 13 00434 g015
Figure 16. (a) Comparison between tested and predicted resistances with the punching capacity expressions from the Eurocode for cantilever slabs as function of the shear slenderness av/dl; and (b) as function of the ratio a/lspan; (c) sketch of the tests performed by Henze et al. [7] on cantilever slabs; (d) cracking pattern of the tests performed by Henze et al. [7] (cut views); (e) distribution in the bending moments in the axis of symmetry of the slabs (axis x); (f) distribution in the bending moments in the transverse direction of the slabs (axis y).
Buildings 13 00434 g016
Figure 17. Comparison between tested and predicted resistances the European code expressions for: (a) one-way shear and without the correction factors μ; (b) punching shear, without the correction factors μ, and using round corners for the control perimeter; (c) punching shear, without the correction factors μ, and using square corners for the control perimeter; (d) one-way shear with the correction factor μ; (e) punching shear expressions, with the correction factors, and using round corners for the control perimeter; (f) punching shear expressions, with the correction factors μs, and using square corners for the control perimeter. Note: P = punching failure; WB = wide-beam shear failure in one-way shear; WB + P = mixed mode between one-way shear and punching.
Buildings 13 00434 g017
Figure 18. Comparison between tested and predicted resistances the fib Model Code 2010 expressions for: (a) one-way shear and without the correction factors μ; (b) punching shear, without the correction factors μ, and using round corners for the control perimeter; (c) punching shear, without the correction factors μ, and using square corners for the control perimeter; (d) one-way shear, with the correction factors μ; (e) punching shear expressions, with the correction factors, and using round corners for the control perimeter; (f) punching shear expressions, with the correction factors, and using square corners for the control perimeter. Note: P = punching failure; WB = wide-beam shear failure in one-way shear; WB + P = mixed mode between one-way shear and punching.
Buildings 13 00434 g018
Table 1. Definition of the factor β according to different guidelines.
Code
EN 1992-1-1:2004 [25] β E C = a v 2 d l 1.00 0.25  (11)
fib Model Code 2010 [21] β M C = a v 2 d l 1.00 0.50  (12)
Table 2. Factors μshear,2 to correct the predicted effective shear width with the French approach when using different codes and support conditions. Note: Sup. Cond = support condition close to the load; SS = simple support (hinged support); CS = continuous support; CT = cantilever slab.
CodeSup. Cond.Factors
EN 1992-1-1:2004 [25]SS, CS μ s h e a r , 2 = 0.144 a v / d l + 1.456 0 1.50  (34)
EN 1992-1-1:2004 [25]CT μ s h e a r , 2 = 0 0.184 a v / d l + 1.400 0 1.50  (35)
fib Model Code 2010 [21]SS, CS μ s h e a r , 2 = 0.104 a v / d l + 1.392 0 1.50  (36)
fib Model Code 2010 [21]CT μ s h e a r , 2 = 0.184 a v / d l + 1.624 0 1.50  (37)
Table 3. Factor μpunch,2 for EN 1992-1-1:2004 and fib Model Code 2010.
CodeParameterFactor μpunch,2
Eurocode EN 1992-1-1:2004 t = b s l a b l l o a d 4 d a v g / d a v g μ p u n c h , 2 = 0.2 t 0 1  (40)
fib Model Code 2010 t = b s l a b l l o a d d a v g / d a v g μ p u n c h , 2 = 0.2 t 0 1  (41)
Table 4. Factor (μpunch,3) related to the ratio a/lspan.
CodeFactor μpunch,2
Eurocode EN 1992-1-1:2004 μ p u n c h , 3 = 0.672 a / l s p a n 0.76 0.80 2.15  (42)
fib Model Code 2010 μ p u n c h , 3 = 1  (43)
Table 5. Ranges of parameters in the database.
ParameterMinimumMaximum
h (m)0.100.30
bslab (m)0.604.50
t = (bslab − lload4davg)/davg0.4527.21
lspan (m)0.904.00
bslab/lload (-)1.6723.08
bslab/dl (-)5.6629.41
av/dl (-)0.247.66
fc (MPa)19.2077.74
ρl (%)0.6022.150
ρt (%)0.1321.526
Disclaimer/Publisher’s Note: The statements, opinions and data contained in all publications are solely those of the individual author(s) and contributor(s) and not of MDPI and/or the editor(s). MDPI and/or the editor(s) disclaim responsibility for any injury to people or property resulting from any ideas, methods, instructions or products referred to in the content.