1. Introduction
Over-height vehicle impact is one of the major factors causing damage to or even collapse of bridges. Many surveys show that accidents of over-height vehicle collisions on bridges are experiencing a significant increase across the world. It is reported that more than half of the bridge superstructures in Beijing, China, were threatened by the impact of over-height vehicles [
1], and around 20% of the damaged bridges in Beijing are induced by over-height vehicle collisions [
2]. The United Kingdom Department of Transport reported that the number of over-height vehicle collisions at railway bridges increased from 729 to 1870 during the period of 1990–1994 [
3]. Further, a survey from the Texas Department of Transportation in the United States revealed that the number of accidents of over-height vehicle impact on overpasses increased stably from 1987 to 1992, with 14% of the investigated bridges experiencing serious damage on the bridge girder [
4]. In the meantime, the frequency of over-height vehicle collisions on bridge superstructures in Maryland increased by 81% from 1995 to 2000 [
5]. This type of over-height vehicle collision accident not only threatens the safety of the bridge but also causes certain economic losses and casualties, which has raised great concern in the engineering field.
The dynamic behaviors and failure modes of the concrete beams under impact loading have been studied through small-scale impact tests or finite element simulations in recent years [
6,
7,
8,
9,
10,
11,
12]. Fujikake et al. [
6] carried out drop-weight impact tests on the reinforced concrete (RC) beams by releasing a steel hammer from different heights. The experimental result shows that the failure mode of the RC beam is strongly controlled by the drop height of the hammer. Kishi et al. [
7] conducted a falling weight impact test on 27 simply supported RC beams without shear rebars, where the test results illustrated that the RC beams failed in a shear mode when the static shear-bending capacity ratio was less than 1.0. Jin et al. [
8] studied the influence of different combinations of impact mass and velocity on the dynamic response of RC beams by establishing a three-dimensional meso numerical model. It was found that with the increase of impact impulse, the failure mode of reinforced concrete beams changes from shear failure to bending failure, and the energy dissipation of reinforcement and the whole member increases. Xu et al. [
9] carried out small-scale pendulum impact tests on different types of girders and the test results implied that the girder configuration controlled the failure mode of the above component, where a global failure was obtained for the steel box girder, whereas a local failure was obtained for the steel plate and RC T-shaped girder. Jing et al. [
10] carried out a full-scale lateral impact test on a prestressed concrete (PC) girder by releasing a rigid impact cart from a certain height. The experiment shows that both a serious overall failure and local damage occurred on the PC box girder, which confirms the threat of the over-height vehicle collision on the safety of the bridge. For the bridge superstructure, the finite element analysis method is generally used to investigate its dynamic responses and damage mechanism [
13,
14,
15,
16]. Yang et al. [
13] studied the lateral impact resistance of a prestressed concrete beam bridge by conducting finite element simulation. In the study, the influence of several key parameters was investigated and the results showed that the use of the diaphragm would significantly enhance the impact resistance of prestressed concrete beam bridges. Zhang et al. [
14] conducted a refined finite element simulation on a PC box girder bridge impacted by falling objects. The dynamic response and damage mechanism were explored by changing the impact parameters and the residual bearing capacity of the impacted girder was evaluated as well. Cao et al. [
15] performed a computational study of the Skagit River bridge collapse under an over-height tractor–semitrailer impact. The characteristic of the impact force and the collapse mechanism of the bridge were investigated and a protection beam was suggested to be used to mitigate the risk from the over-height vehicles.
In addition, for the design of the superstructure to resist vehicle collision, the impact force is an intuitive factor to indicate the intensity of the vehicular impact, once it is determined, the structural analysis and damage evaluation can be conducted. Current specifications provide very limited methods to estimate the impact force transferred to the bridge structures during the vehicle collision. The General Specifications for Design of Highway Bridges and Culverts (JTG D60-2015) in China [
17] and AASHTO LRFD Bridge Design Specification [
18] specify the magnitude and location of the equivalent impact force generated from the vehicle impact; however, both are for the bridge substructure. The European Code (Eurocode EN1991-1-7) [
19] provides a simple design provision, where a value of 500 kN is specified as the equivalent static design force for the superstructure of the bridge subjected to a vehicle collision. This equivalent static design force is derived from the hard impact which, thus, does not account for the characteristics of both vehicle and bridge superstructures. In order to solve the above problems, a few studies were performed to calculate the impact force of the bridge superstructure. Xu et al. [
20] conducted a finite element analysis on the vehicle-bridge collision and proposed a simplified calculation model for the impact between over-height vehicles and the bridge superstructure by simplifying the influence parameters and making a series of assumptions. Based on this simplified calculation model, the impact force calculation equations were proposed. Liu et al. [
21] established a refined finite element model using LS-DYNA. The peak impact force of the bridge superstructure was explored by changing the vehicle mass and vehicle speed. Based on a large number of data fitting analyses, the calculation formula of impact force related to vehicle mass and vehicle speed was obtained. Kong et al. [
22] investigated the damage process and collision force of PC box girder bridge under over-height vehicle impact through FE simulation. The results showed that the vehicle velocity and carriage thickness have an important effect on the peak value of the impact force, while the average impact force is mainly influenced by vehicle mass and velocity, impact height and thickness of carriage. Oppong et al. [
23] studied the influences of different types of impacting objects on the bridge superstructure through a refined FE model and developed a set of equations to predict the impact force as a function of impact velocity, impact area and dimension of the impacting object.
Despite a certain amount of studies have been conducted on the structural members under impact loading, the systematic study of the bridge superstructure under over-height vehicle collision still needs to be performed to better understand the damage mechanism. In addition, the determination of the impact force during the collision is essential to understand the dynamic behavior of the structure, which also needs further investigation. In this study, the dynamic response and damage mechanism of a prestressed concrete box girder bridge under the impact of an over-height vehicle are studied by using the finite element analysis software LS-DYNA. A parametric analysis is conducted to investigate the effects of different influence factors, i.e., girder configuration, vehicle speed, vehicle mass, impact angle, concrete strength and strand prestress, on both local damage and the overall performance of the bridge. Further, a formula for predicting the peak and average impact force of the prestressed concrete box girder bridge under the impact of the over-height vehicle is developed based on the results obtained from the numerical simulation and parametric analysis. The proposed impact force formula comprehensively accounts for the influence of the vehicle speed, vehicle mass and impact angle, which can be used as an effective tool for the impact design of bridge superstructure.
3. Parametric Study on the Dynamic Responses of PC Box Girder Bridge under the Impact of Over-Height Vehicle
The impact process between a bridge and an over-height vehicle is a complex nonlinear dynamic problem, which is affected by a series of factors. In this section, a parametric study is conducted to investigate the effects of different factors on the dynamic response of the prestressed concrete bridge. Six factors, including girder configuration, vehicle speed, vehicle mass, impact angle, concrete strength and prestress of the strand, are varied one by one to explore their influence on the dynamic behavior of the bridge. Further, three aspects of behaviors of the bridge, i.e., failure mode, impact force and displacement at the midspan of the bridge, are quantitatively investigated in the parametric analysis. The benchmark working condition adopted in the analysis is as follows: vehicle speed is 80 km/h, vehicle mass is 20 tons, impact angle is 0°, concrete strength is C50, and ultimate tensile strength of prestressed strand is 1860 MPa (the prestress acted on the strand is 0.75 times the ultimate tensile strength). Other investigated working conditions can be obtained from the benchmark working condition by changing the value of a single factor each time. All detailed working conditions investigated in the parametric analysis are given in
Table 2.
3.1. Influence of the Girder Configuration on the Dynamic Behavior of the Bridge
The influence of the girder configuration on the dynamic response of the bridge is investigated in this section. Despite the box girder bridge investigated in the benchmark condition, another two types of girders, i.e., the T-shaped girder and hollow slab, are also studied here.
Figure 2 and
Figure 3 show the geometry and dimension of the cross-section of the investigated T-shaped and hollow slab girder. The corresponding finite element models of these types of bridges are illustrated in
Figure 2 and
Figure 3 as well. The T-shaped girder bridge consists of five T-beams with three prestressed strands (having a diameter of 15.24 mm and an ultimate tensile strength of 1860 MPa) embedded in each girder. The hollow slab bridge is composed of six hollow slabs, where the side beam is reinforced with 17 prestressed strands (the same strand used in the T-shaped girder), and the middle girder is reinforced with 12 prestressed strands. In the numerical analysis, the material properties, bearings and boundary conditions of the T-shaped girder and hollow slab bridges are the same as that of the box girder bridge.
- (1)
Failure modes of three types of bridges under impact
Figure 4 shows the effective plastic strain distribution on the three types of bridges after being impacted by a 20-ton vehicle at the midspan of the girder with the vehicle speed being 80 km/h. The damage degree of the bridge can be directly evaluated by the size of the plastic strain area and the number of deleted elements in the impact region. According to the result in
Figure 4a, one can find the plastic damage on the prestressed concrete box girder bridge is minimum. The effective plastic strain mainly concentrates at the impact area of the side girder. It is found in the analysis that a large amount of concrete on the web and bottom flange of the impacted girder fell off, but the steel bars and stirrups in the impact area of the girder did not yield.
Figure 4b shows the effective plastic strain diagram of the T-shaped girder bridge. As shown in the figure, extensive plastic damage occurred in the majority region of the impacted girder. Since diaphragms were arranged between each T-shaped girder, the plastic damage also spread to the other four girders through the diaphragms. It is found that a large amount of concrete fell off at the impact region and the “horseshoe” part of each T-shaped girder, with the reinforcement being ruptured as well (see
Figure 4b).
Figure 4c shows the effective plastic strain diagram of the hollow slab bridge. As can be seen in the figure, the level of plastic damage of the hollow slab bridges is between that obtained from the above two types of bridges. A certain amount of concrete falls off at the impact region with a small number of steel bars yielding. The extension of the plastic damage area on other girders is smaller than that obtained from the T-shaped girder bridge.
- (2)
Time history curve of the impact force
Figure 5a shows the time history curves of the horizontal impact force for three types of bridges. As shown in the figure, the peak values of the three impact force curves are similar (roughly 1.3 MN), but the time to reach the peak values for the three types of bridges is different, where the time to reach the maximum impact force of the box girder bridge, T-shaped girder bridge and hollow slab bridge are 0.01 s, 0.02 s and 0.06 s, respectively. Further, one can find in
Figure 5a that there are two extreme force values for the T-shaped girder bridge in the period after the peak force but only one extreme force value for the box girder and hollow slab bridge. This phenomenon may be due to the fact that diaphragms in the T-shaped girder bridge can transform more load from the impacted girder to other girders with the loading process being extended.
- (3)
Time history curve of midspan displacement for three types of bridges
Figure 5b shows the time history curves of displacement obtained at the midspan of the impacted girder for three types of bridges. According to the plastic damage results in
Figure 4, one can find that the greater the degree of plastic damage shown on the bridge, the greater the displacement. The maximum displacement of the T-shaped girder bridge, hollow slab bridge and box girder bridge are 27 mm, 17 mm, and 6.3 mm, respectively, whereas the time to reach the maximum displacement for the above three types of bridges is
t = 0.175 s,
t = 0.2 s and
t = 0.1 s, respectively. Further, by analyzing the impact animation, we find that the head of the vehicle starts to lift when the displacement of the bridge reached its maximum value. This phenomenon results in decreased contact between the carriage which further give a rise to a declining trend on both impact force and displacement time history curves.
The girder configuration has an obvious influence on the local damage and overall displacement of the bridge. Among the investigated three types of bridges, the box girder bridge exhibits the smallest damage during the collision with the displacement at the midspan of the impacted girder being controlled within 7 mm. Whereas the T-shaped girder bridge exhibits the greatest damage during the impact with both local materials at the impact regions and the overall bridge displacement reaching the maximum level. This result implies that the box girder bridge can provide better lateral impact resistance performance in practical engineering.
Further, according to the result in
Figure 5a, one can see that the girder configuration has little effect on the maximum impact force generated during the collision, which implies the girder configuration effect can be neglected in the impact force prediction formula for design, which would be discussed in detail in the following Discussion section.
3.2. Influence of the Vehicle Speed on the Dynamic Behavior of the Bridge
The influence of vehicle speed on the dynamic response of the bridge is investigated in this section. In the analysis, the dynamic behavior of the box girder bridge obtained under a vehicle speed of 40 km/h, 60 km/h and 80 km/h is investigated.
- (1)
Failure mode of the bridge
Figure 6 (
v = 40 km/h, 60 km/h) and
Figure 4a (
v = 80 km/h) show the effective plastic strain distribution on the prestressed concrete box girder bridge obtained under the three investigated impact speeds. As can be seen from the figures, with the vehicle speed increasing, the plastic damage area of the side impacted girder increased as well. When
v = 40 km/h, the plastic damage area on the impacted girder is relatively small with only a small amount of concrete falling off from the impact area. When
v = 60 km/h, the plastic damage area expands obviously with the concrete at the bottom flange of the girder being further fallen off. When
v = 80 km/h (see
Figure 4a), the impact area reaches its maximum level. It should be noted no damage was observed at the longitudinal rebars and stirrups at the impact area under the above investigated three vehicle speeds.
- (2)
Time history curve of the impact force
Both horizontal and vertical impact force time history curves of the PC box girder bridges obtained at different vehicle speeds are shown in
Figure 7. According to the results in
Figure 7, one can find that the time interval for reaching the maximum impact force continuously shortened and the peak value of the impact force gradually increased as the vehicle speed increased. When the vehicle speed increased from 40 km/h to 80 km/h, the maximum horizontal impact force generated during the collision increased from 0.95 MN to 1.32 MN and the vertical impact force increased from 0.12 MN to 0.18 MN.
- (3)
Time history curve of the displacement
The time history curve of displacement obtained at the midspan of the impacted girder under different vehicle speeds is shown in
Figure 8. One can find a certain degree of fluctuations can be observed on the three displacement curves. These fluctuations mainly resulted from the relatively low flexural rigidity at the midspan of the bridge. Further, we can find the maximum displacement of the bridge increase with the increase of the vehicle speed. When the vehicle speed increases from 40 km/h to 80 km/h, the maximum displacement obtained at the midspan of the impacted girder increases from 2.5 mm to 6.3 mm.
Vehicle speed has a certain degree of effect on both the local and global response of the PC box girder bridge. With the vehicle speed increasing, the local damage at the impact area, impact force and midspan displacement of the bridge increases.
3.3. Influence of the Vehicle Mass on the Dynamic Behavior of the Bridge
The influence of vehicle mass on the dynamic response of the PC box girder bridge is investigated in this section. Four types of vehicle mass, i.e., 10 tons, 15 tons, 20 tons and 30 tons, are adopted in the collision analysis, with the impact velocity of the vehicle being 80 km/h.
- (1)
Failure mode of the bridge
Figure 9 (
m = 10 t, 15 t and 30 t) and
Figure 4a (
m = 20 t) show the effective plastic strain distribution on the PC box girder bridge obtained under the four mass conditions. As can be seen in the figures, although the damage at the impact region of the prestressed concrete box girder gradually increases with the increase of the vehicle mass, the damage variation between different mass conditions is not as obvious as that obtained under different vehicle speeds. When the vehicle mass
m = 10 t and 15 t, only a small amount of concrete at the impact area of the impacted girder is broken, with no damage showing on the opposite side of the impact girder. When
m = 20 t (see
Figure 4a) and 30 t, the concrete located at both the impact area and bottom flange of the girder falls off with large plastic damage showing on the opposite side of the impact area.
- (2)
Time history curve of the impact force
Figure 10a shows the time history curve of the horizontal impact force of the PC box girder bridge obtained under different vehicle masses. One can see that the four loading curves basically coincide with each other before 0.075 s and then have a different variation trend in the follow-up stage. The peak impact force for four mass conditions (i.e., 10 t, 20 t, 30 t, 40 t) are 1.12 MN, 1.19 MN, 1.22 MN and 1.31 MN, respectively, which indicates the increase of the vehicle mass would increase the impact force of the bridge.
Figure 10b shows the time history curve of the vertical impact force of the bridge under different vehicle masses. A similar variation manner to the horizontal force is obtained for the vertical impact force, where the vertical impact force gradually increases with the increase of vehicle mass. Meanwhile, with the increase of vehicle mass, the curve fluctuation range increases as well, where the fluctuation values of the four curves are 0.225 MN, 0.228 MN, 0.23 MN and 0.33 MN, respectively.
- (3)
Time history curve of the displacement
Figure 11 shows the midspan displacement time history curves of the impacted box girder obtained under different vehicle mass conditions. The maximum displacements corresponding to the four different impact masses (i.e., 10 t, 15 t, 20 t and 30 t) are 4.8 mm, 5.8 mm, 6.3 mm and 8.2 mm, respectively, which conforms to the trend that the girder displacement increases with the increase of impact mass.
Variation of the vehicle mass is mainly achieved by changing the load capacity of the vehicle carriage. During the impact process, the weight of the vehicle cannot fully act on the superstructure since only a limited area at the top of the carriage collides with the bridge. Further, the head of the vehicle will lift during the collision during the impact process, which would further reduce the impact mass acting on the bridge. Therefore, although the increase of the vehicle mass would increase the local damage, impact force and midspan displacement of the bridge, the influence of this factor on the dynamic response of the bridge is not obvious as that of vehicle speed.
3.4. Influence of the Impact Angle on the Dynamic Behavior of the Bridge
The influence of impact angle (i.e., the angle between the driving direction of the vehicle and the cross-section of the bridge, which is defined as
θ, see
Figure 1d) on the dynamic response of the prestressed concrete box girder bridge is investigated in this section. Three types of impact angles, i.e., 0°, 15° and 30°, are adopted in the collision analysis.
- (1)
Failure mode of the bridge
Figure 12 (
θ = 15° and 30°) and
Figure 4a (
θ = 0°) show the plastic strain distribution on the prestressed concrete box girder bridge with the vehicle impact angle being 0°, 15° and 30°, respectively. As shown in the figures, the plastic damage that occurred on the main girder increased obviously with the increase of the impact angle. When the impact angle
θ = 0° (see
Figure 4a), the concrete at the impact area of the side girder fell off with no damage occurring on the rebars. When
θ = 15°, the plastic damage extends to the bottom flange of the girder with the rebars at the bottom flange being ruptured. When
θ = 30°, the damage degree on the bridge further increases with more steel bars at the impact area being ruptured. It should be noted, with the impact angle changing, the vehicle would continue to crash on the second girder behind the side girder. This follow-up collision further resulted in plastic damage on other girders (see
Figure 12).
- (2)
Time history curve of the impact force
Figure 13a shows the time history curves of the horizontal impact force of the bridge under different impact angles. As can be seen from the figure, the peak value of the horizontal impact force gradually decreases with the increase of the impact angle. The corresponding peak values of the impact force at 0°, 15° and 30° are 1.31 MN, 1.09 MN and 1.05 MN, respectively. Then, the impact force decreases gradually to 0 for the condition of
θ = 0°, but increases sharply for the conditions
θ = 15° and 30°. Such a phenomenon is mainly caused by a follow-up collision between the vehicle and the second girder.
- (3)
Time history curve of the displacement
Figure 13b shows the displacement time history curves of the impacted girder obtained under different impact angles. As shown in
Figure 13b, the midspan displacement of the bridge increases sharply with the increase of impact angle. When the impact angle increases from 0° to 30°, the maximum displacement increases from 6.3 mm to 68 mm. Such a phenomenon is caused by the fact that the concrete damage on the opposite side of the impacted girder increased sharply as the impact angle increased.
The vehicle impact angle has an obvious influence on the local and overall behavior of the bridge. The increase of the impact angle would increase the midspan displacement of the impacted girder and decrease the impact force generated during the collision. Therefore, this influence factor should be considered in the impact force prediction formula (see
Section 4).
3.5. Influence of the Concrete Strength on the Dynamic Behavior of the Bridge
The influence of concrete strength on the dynamic response of the PC box girder bridge is investigated in this section. Three types of concrete grade, C40, C50 and C60, are adopted in the collision analysis.
- (1)
Failure mode of the bridge
Figure 14 (C40 and C60) and
Figure 4a (C50) show the effective plastic strain distribution on the prestressed concrete box girder bridge obtained with the concrete grade being C40, C50 and C60. One can find that the concrete strength controls the local plastic damage degree that occurred in the impact area. With the concrete strength increase from C40 to C60, the area of the plastic damage region reduced with the deleted concrete elements at the impact region decreasing from 224 to 68.
- (2)
Time history curve of the impact force
Figure 15a shows the time history curve of the horizontal impact force obtained on the prestressed concrete box girder bridge at different concrete strengths. As shown in the figure, the concrete strength has a very limited influence on the impact force curves. Three loading curves almost coincide before
t = 0.045 s. The peak values of the impact force under the three working conditions are 1.30 MN, 1.31 MN and 1.32 MN, respectively.
- (3)
Time history curve of the displacement
Figure 15b shows the displacement time history curve of the impacted girder of PC box girder bridges under different concrete strengths. Similar to the horizontal impact curve, the concrete strength has limited influence on the midspan displacement of the bridge. When the concrete strength increases from C40 to C60, the maximum displacement obtained increases from 5.8 mm to 7.8 mm with peak value time gradually moving backward.
The concrete strength only has a certain influence on the damage of the local vehicle impact region with no obvious effect on the overall dynamic response of the bridge.
3.6. Influence of the Strand Prestress on the Dynamic Behavior of the Bridge
The influence of the strand prestress on the dynamic response of the PC box girder bridge is investigated in this section. Strands having three types of ultimate tensile strength, fptk = 1860 MPa, 1570 MPa and 1270 MPa, are adopted in the collision analysis, where the prestress of the three investigated strands is equal to 0.75 times its ultimate tensile strength, i.e., 0.75 fptk.
- (1)
Failure mode of the bridge
Figure 16 (
fptk = 1270 MPa and 1570 MPa) and
Figure 4a (
fptk = 1860 MPa) show the effective plastic strain distribution on the prestressed concrete box girder bridges obtained under different strand prestress conditions. As can be seen in the figure, the plastic damage generated at the impact area decreases with the increase of the strand prestress. When the strand with
fptk = 1270 MPa is adopted, the plastic damage area on the impacted girder is the largest with a large amount of concrete at both the impact area and the bottom flange of the girder falling off and steel bars in the impact area being ruptured. When the strand with
fptk = 1570 MPa is adopted, the plastic damage area becomes smaller, where no fracture occurs on the steel bars in the impact area. When the strand with
fptk = 1870 MPa is adopted, the plastic damage degree at the impact area is the minimum.
- (2)
Time history curve of the impact force
Figure 17 shows the time history curve of the horizontal impact force of the prestressed concrete box girder bridges obtained under three prestress conditions. As can be seen in the figure, three impact force curves almost coincide before
t = 0.075 s with the peak values of three impact forces being equal to 1.32 MN. After
t = 0.075 s, the three curves deviated greatly.
- (3)
Time history curve of the displacement
Figure 17b shows the time history curve of the displacement at the midspan of the impacted girder under different strand prestress. As can be seen in the figure, the maximum value of the midspan displacement of the bridge gradually decreases with the increase of the prestress on the strand. The maximum displacement of the bridge obtained from the three types of strands (
fptk =1270 MPa, 1570 MPa and 1860 MPa) is 7.5 mm, 6.6 mm and 6.3 mm, respectively.
Similar to the effect of concrete strength, the prestress of the strand only has a certain influence on the damage of the local vehicle impact region with limited effect on the overall dynamic response of the bridge.
5. Discussion
A few research works were carried out in the literature to identify the potential influencing factors on the impact force generated from the over-height vehicle to bridge collision. Xu et al. [
20] studied the collision mechanism between the over-height vehicle and different types of bridges using numerical simulation methods. The numerical results show that the vehicle-related parameters, e.g., vehicle speed, had more influence than the bridge-related parameters, i.e., the bridge type, number of spans, and support conditions, on the impact force. Berton et al. [
34] used a simplified finite element model to evaluate the influence of vehicle mass, vehicle speed, bridge deck mass and stiffness on the dynamic behavior of the bridge, which indicates the impact force is proportional to the vehicle speed, mass, and bridge deck stiffness. Kong et al. [
22] analyzed the damage of the PC box girder bridge subject to a vehicle collision via finite element analyses. The FE analyses show that the collision force was influenced by the vehicle speed, mass, impact height, and carriage thickness. Oppong et al. [
23] studied the influences of different types of impacting objects on the bridge superstructure through a refined FE model and developed a set of impact force prediction equations as a function of impact velocity, impact area, and the dimension of the impacting object. According to the results of this study, we can find that the impact force transferred to the bridge superstructure during the vehicle collision is mainly controlled by the vehicle-related parameters, whereas the bridge-related parameters, i.e., girder configuration, concrete strength and prestress of the strand, illustrate a very limited effect on it. This result was similar to that obtained from Refs. [
20,
22,
23]. The reason for such a phenomenon is that the weight and stiffness of most bridge superstructures are far greater than those of over-height vehicles. As a result, the collision between the vehicle and bridge superstructure is more like a hard impact condition, in which most of the energy and deformation is mainly dissipated by the impacted vehicles. In this context, for a bridge superstructure with a similar weight and stiffness, it seems that we can use a general impact force formula to estimate the impact force generated during the collision.
Compared with other impact force prediction methods for an over-height vehicle collision in the literature, the impact force formula proposed in this study has some advantages: (1) The formula in this study provides a general form for impact force calculation with the majority of vehicle-related parameters being considered. This formula can also degenerate into the simple hard impact force design formula provided in the European code [
19]. For different types of bridges and vehicles, researchers can directly calibrate the parameters of the proposed formula using corresponding experimental or numerical data and calculate the corresponding reference impact force for design. (2) The impact force formula in this study further accounts for the influence of impact angle, which is generally not considered in other research. This extends the scope of the current impact design methods. (3) The proposed impact formula can be used to provide reference impact force values for designing a PC box girder bridge subjected to a two-axle truck collision. According to the data in
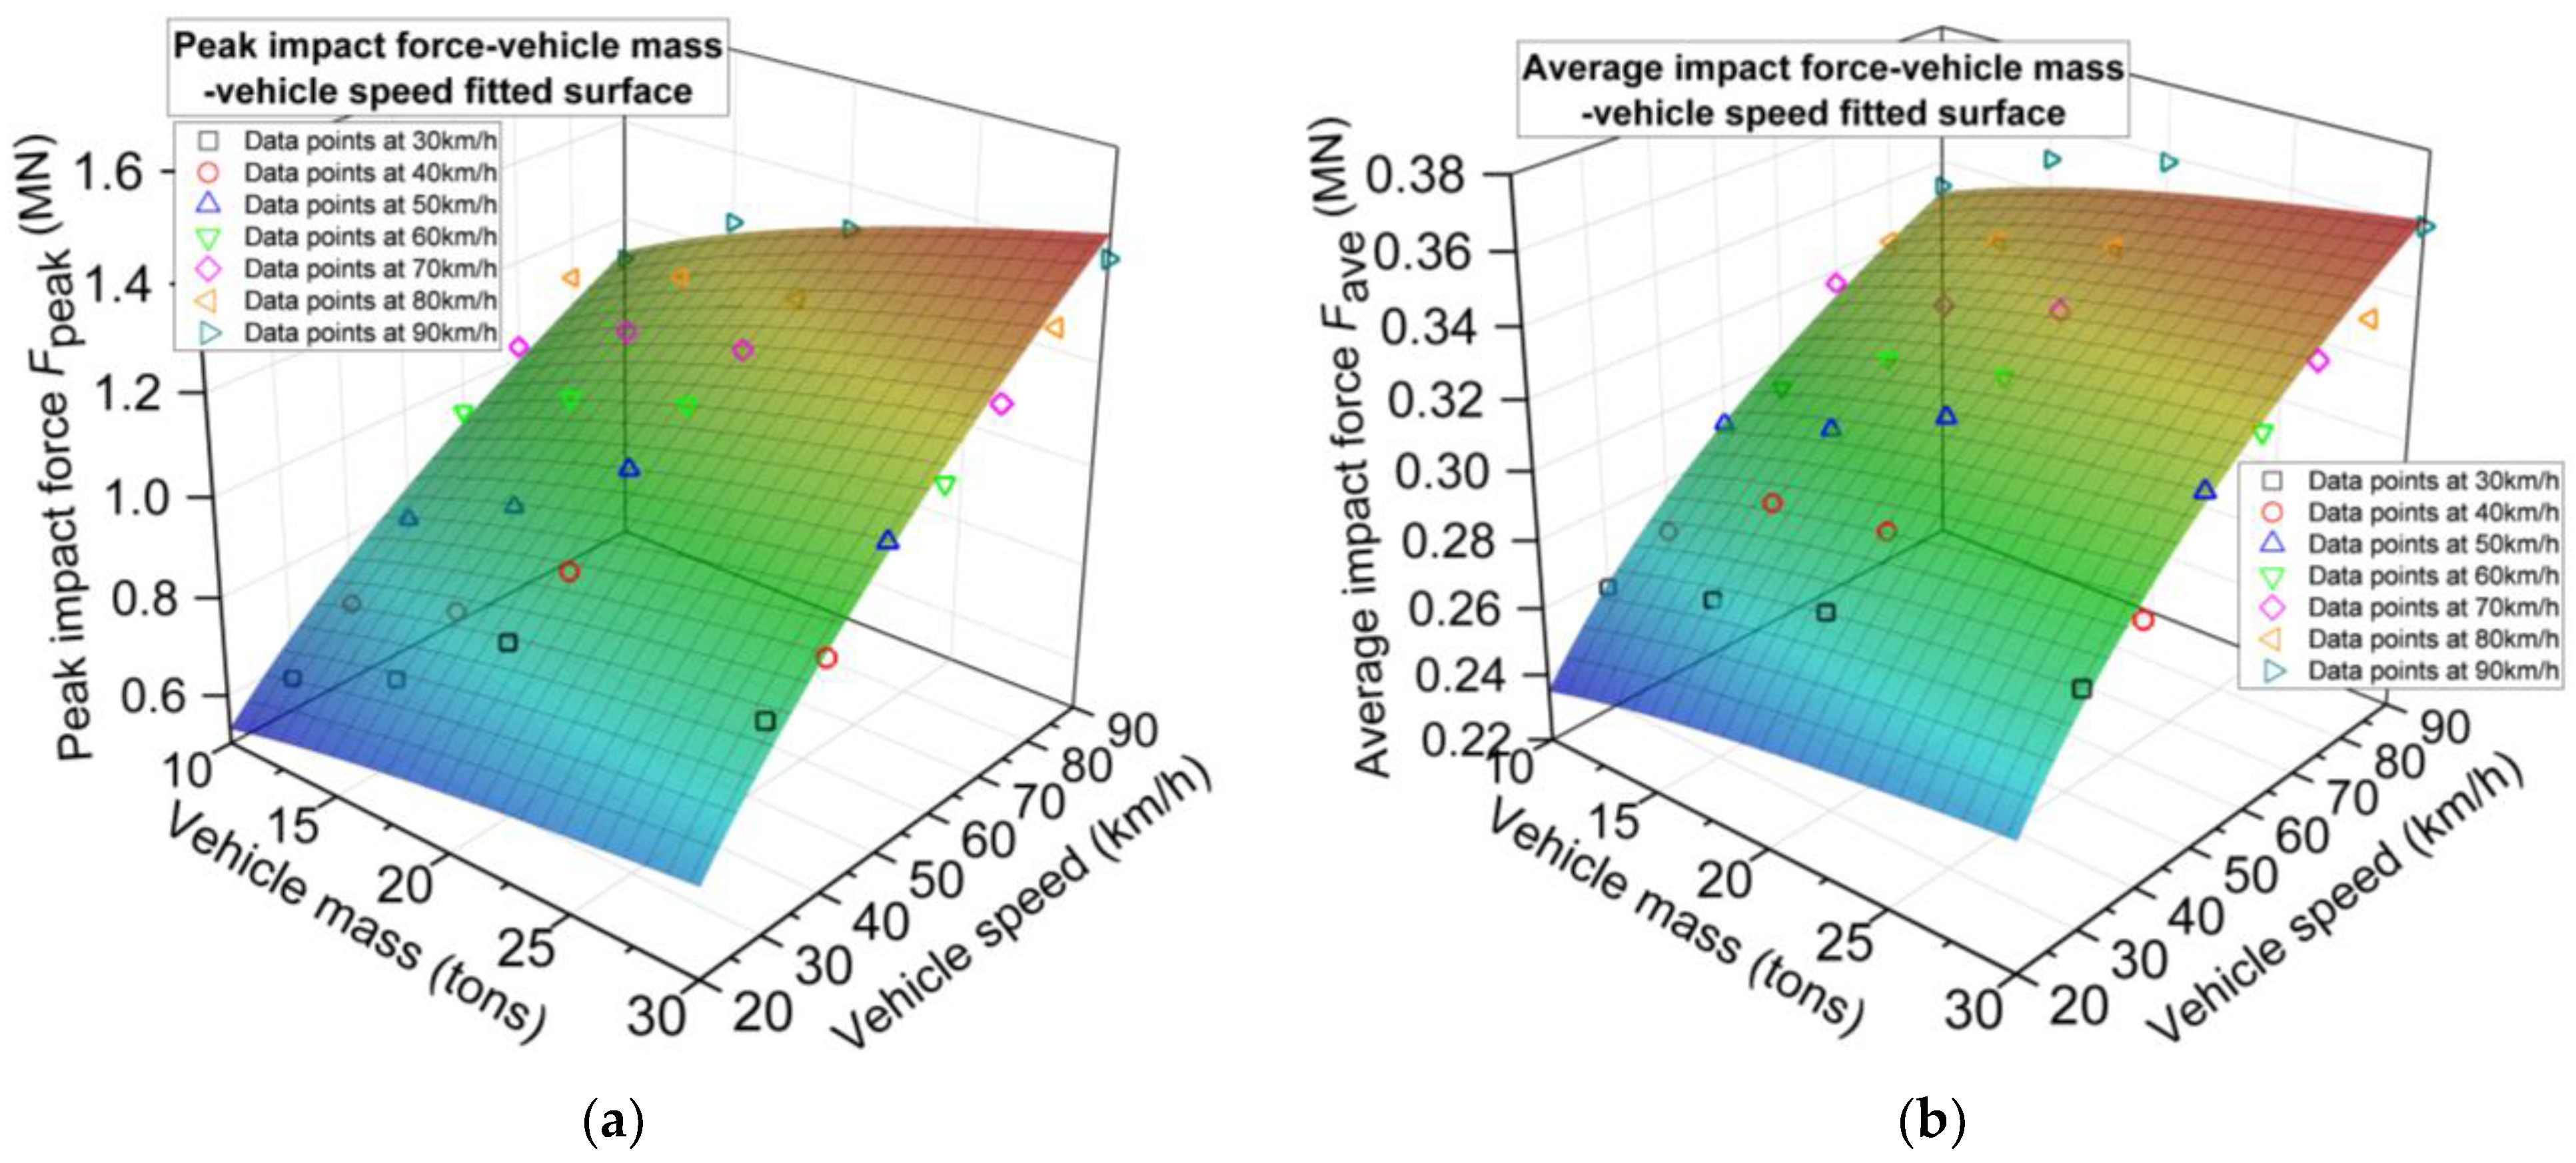
Table 3 and Equation (10), for a regular two-axle truck, the peak and average impact force transferred to the PC box girder bridge under a vehicle velocity of 30 km/h~80 km/h are in the range of 650~1360 kN and 260~350 kN.
In addition, it should be noted, as well as the influence factors investigated in this study, other parameters, such as the traffic condition and vertical clearance, etc. [
16], may also affect the impact force during the collision. In this context, more research is needed to expose the influence of these underlying factors. Finally, the impact force formula proposed in this study should be also verified by more follow-up research data.


