
Influencing Factors in Visual Preference Assessment of Redeveloped Urban Villages in China: A Case Study of Guangdong Province


Abstract
:1. Introduction
1.1. Urban Village
1.2. Visual Preference Assessment
1.3. Demographic Characteristics
1.4. Physical Factors
1.5. Research Questions
- What village physical factors affect the visual preference of urban village residents for redeveloped urban village?
- Are there differences in the visual preference assessment of village physical factors of redeveloped urban villages conducted by urban village residents with different demographic characteristics?
- Which physical factors do urban villages residents with different demographic characteristics pay more attention to when evaluating redeveloped urban villages?
2. Research Method
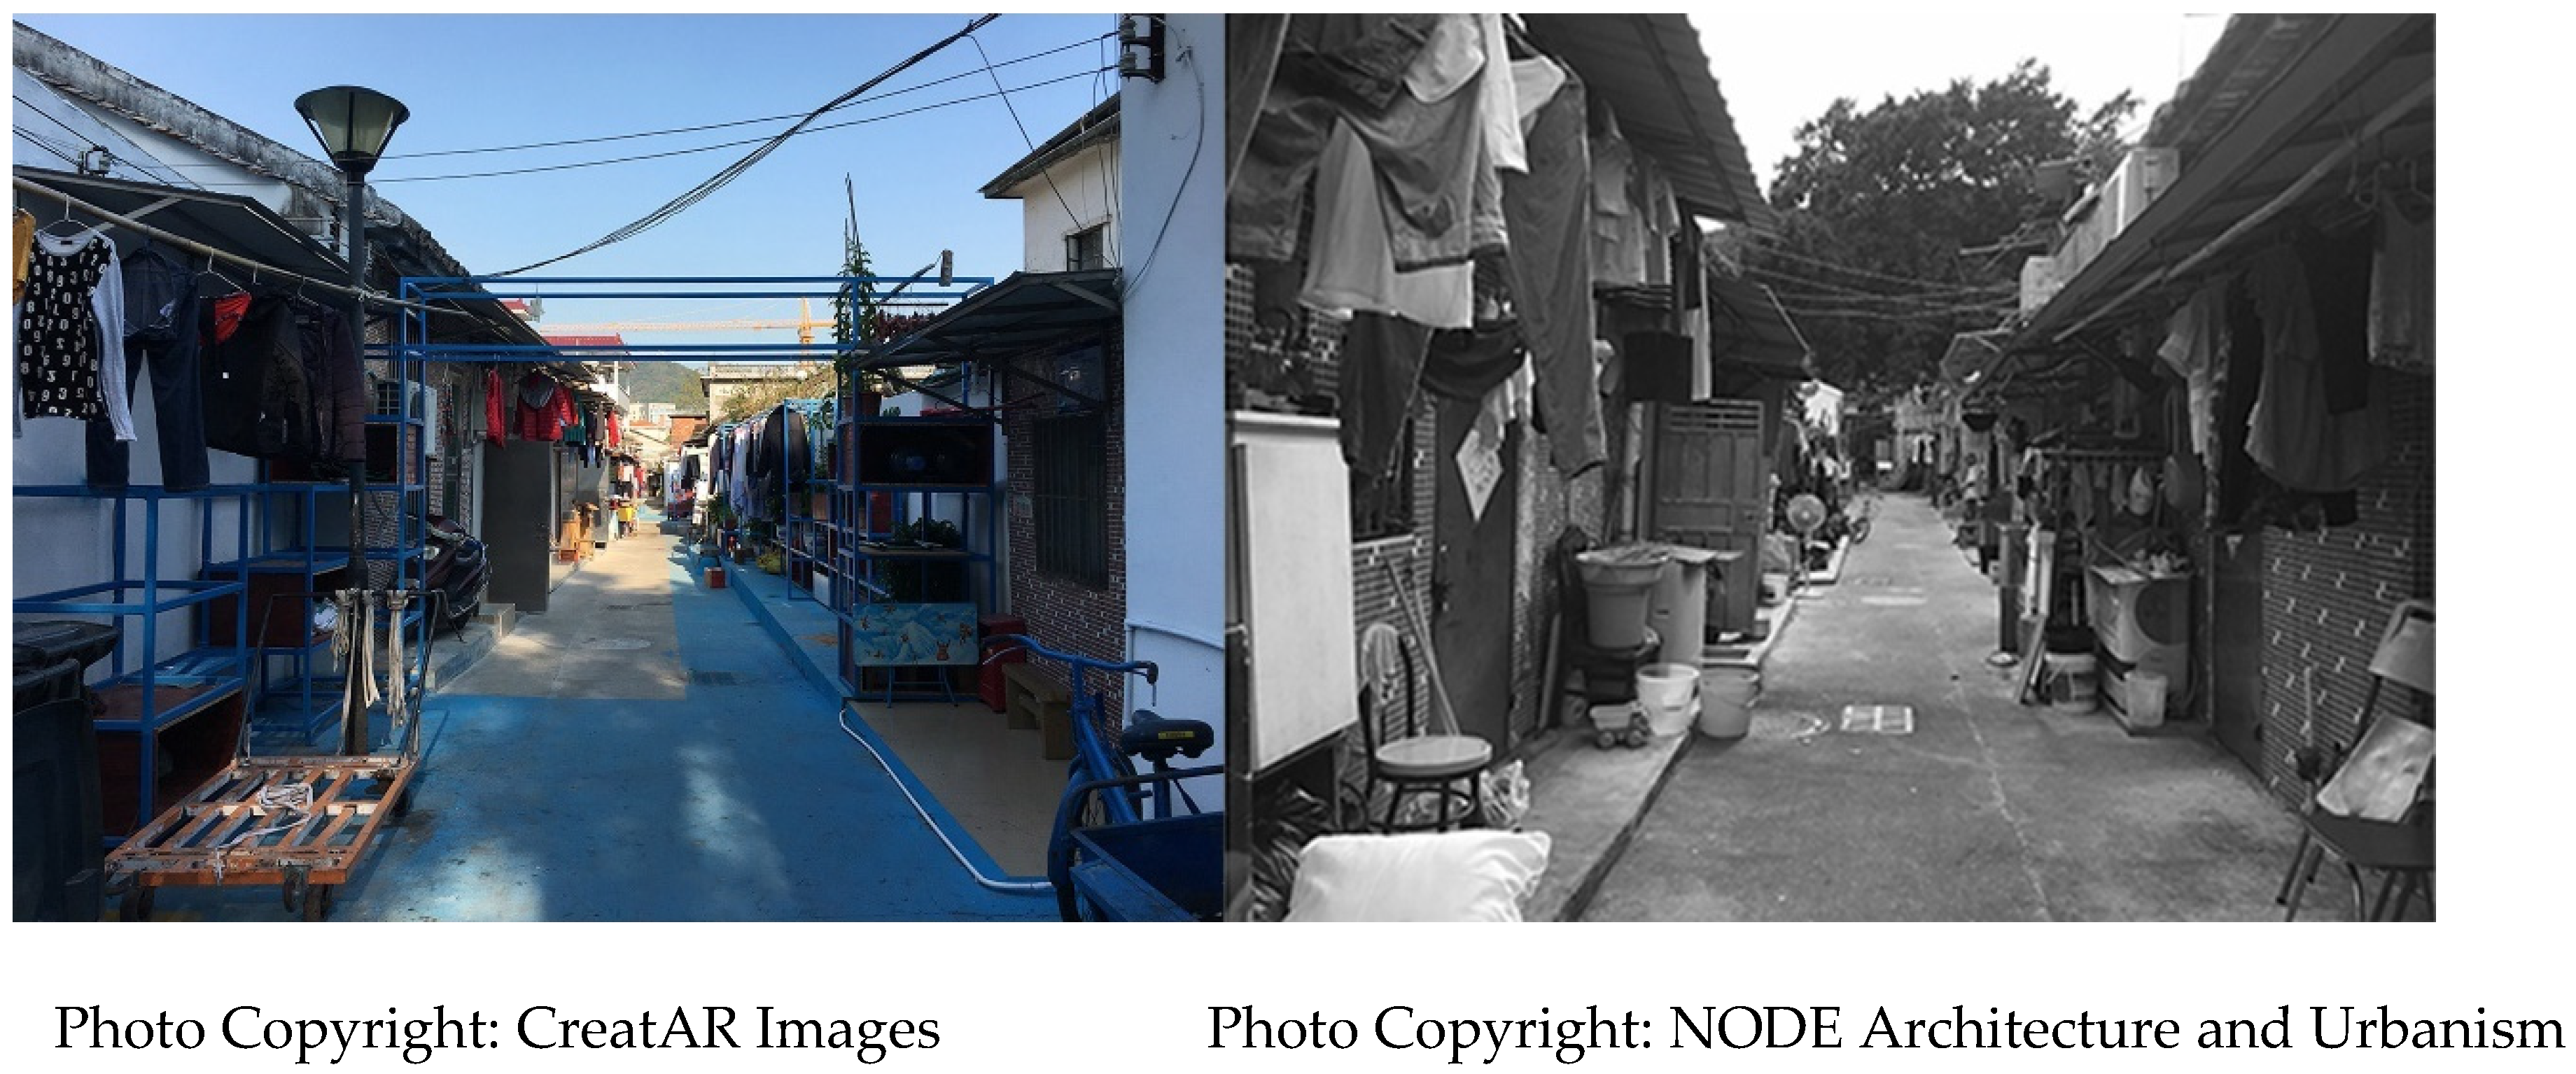
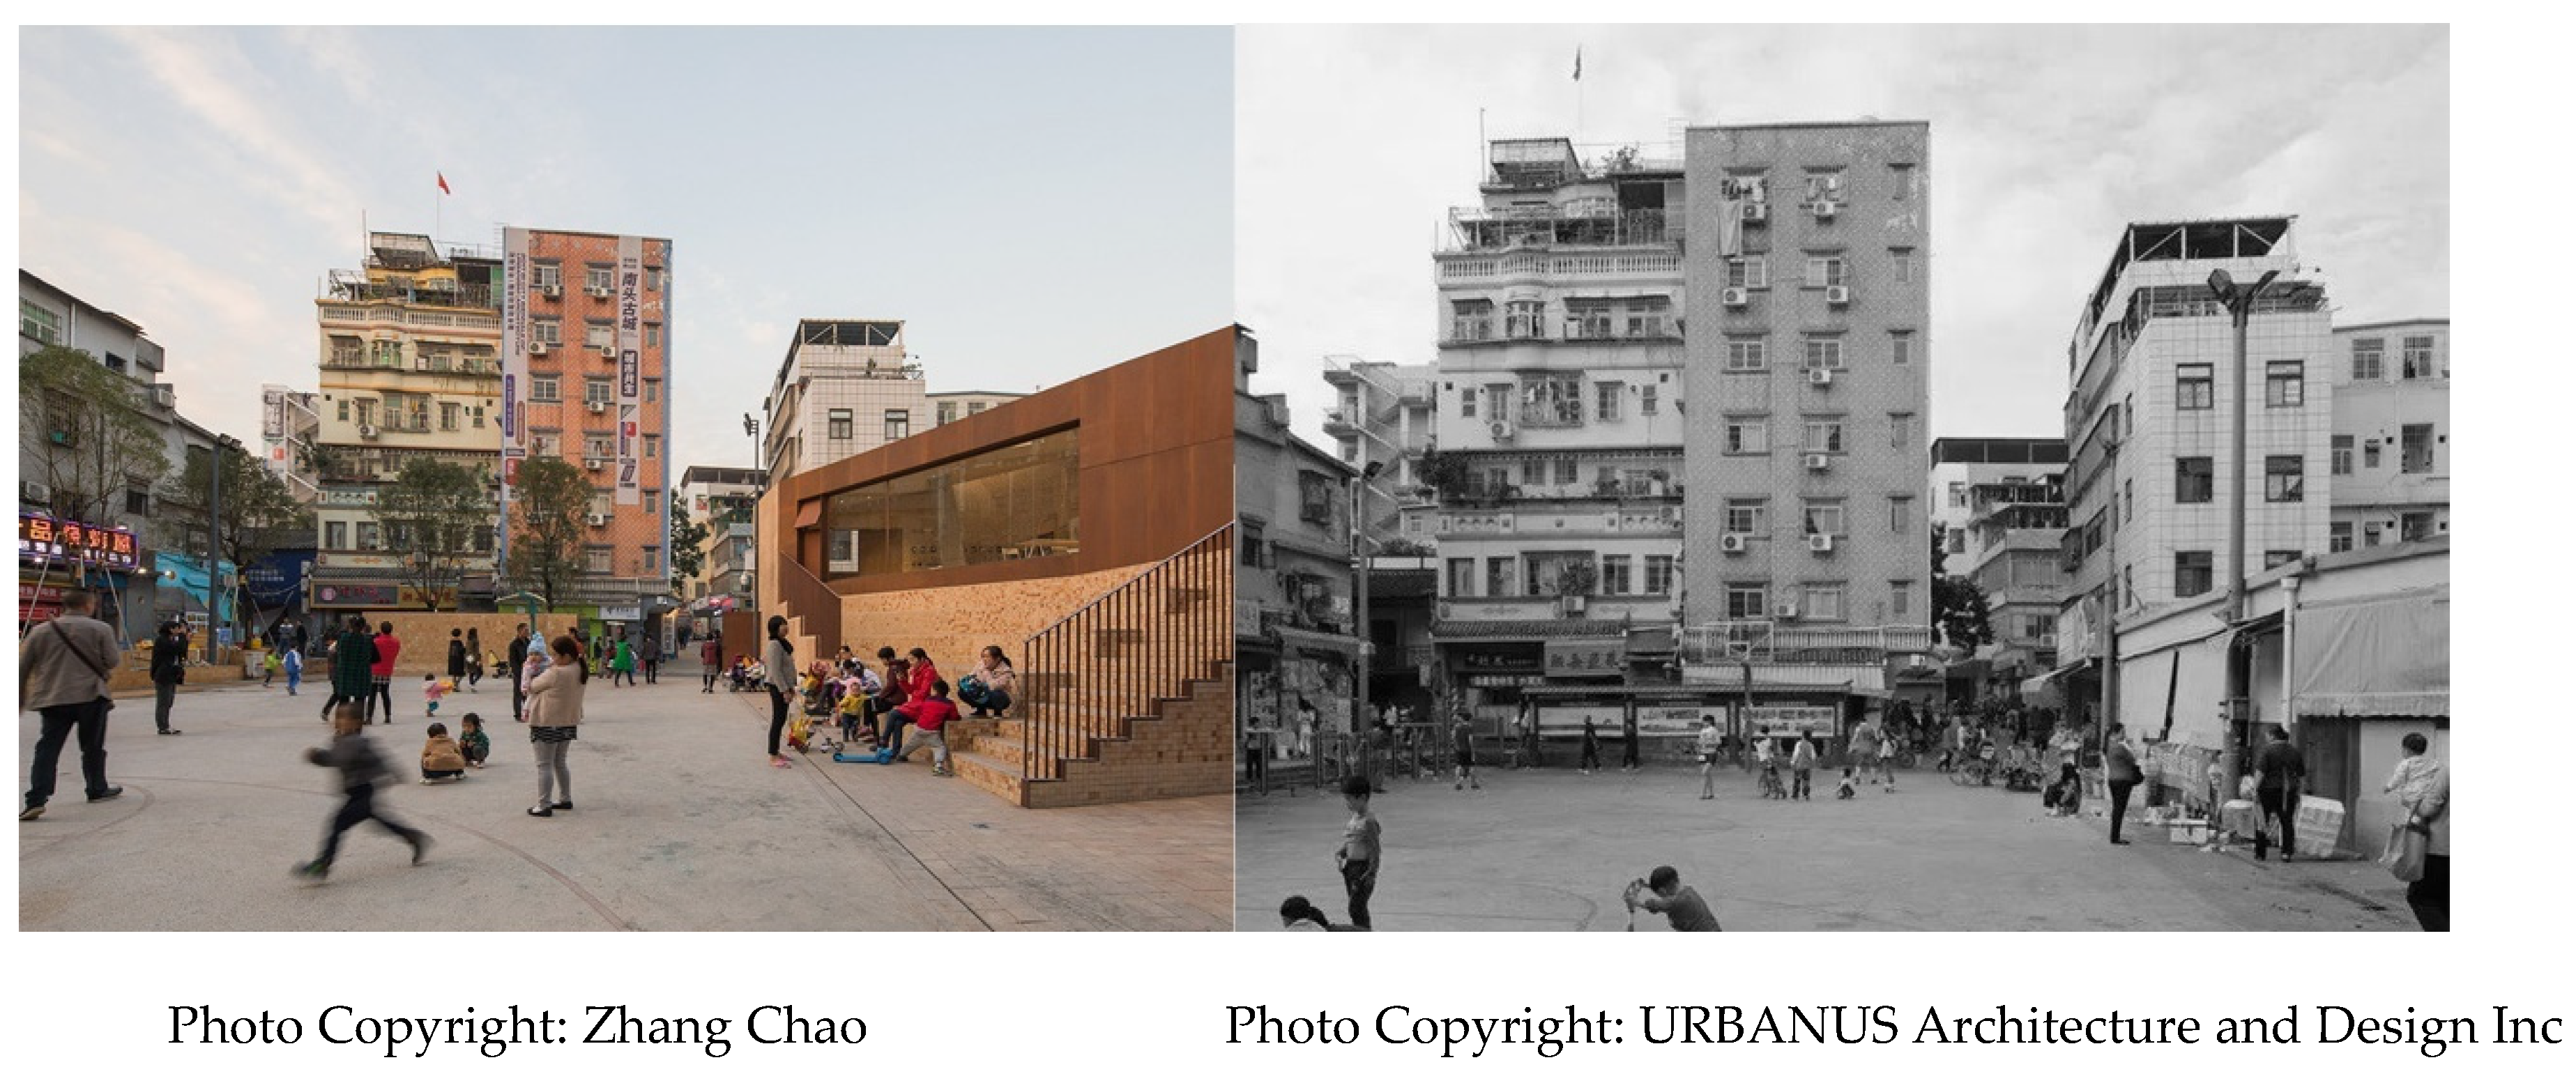
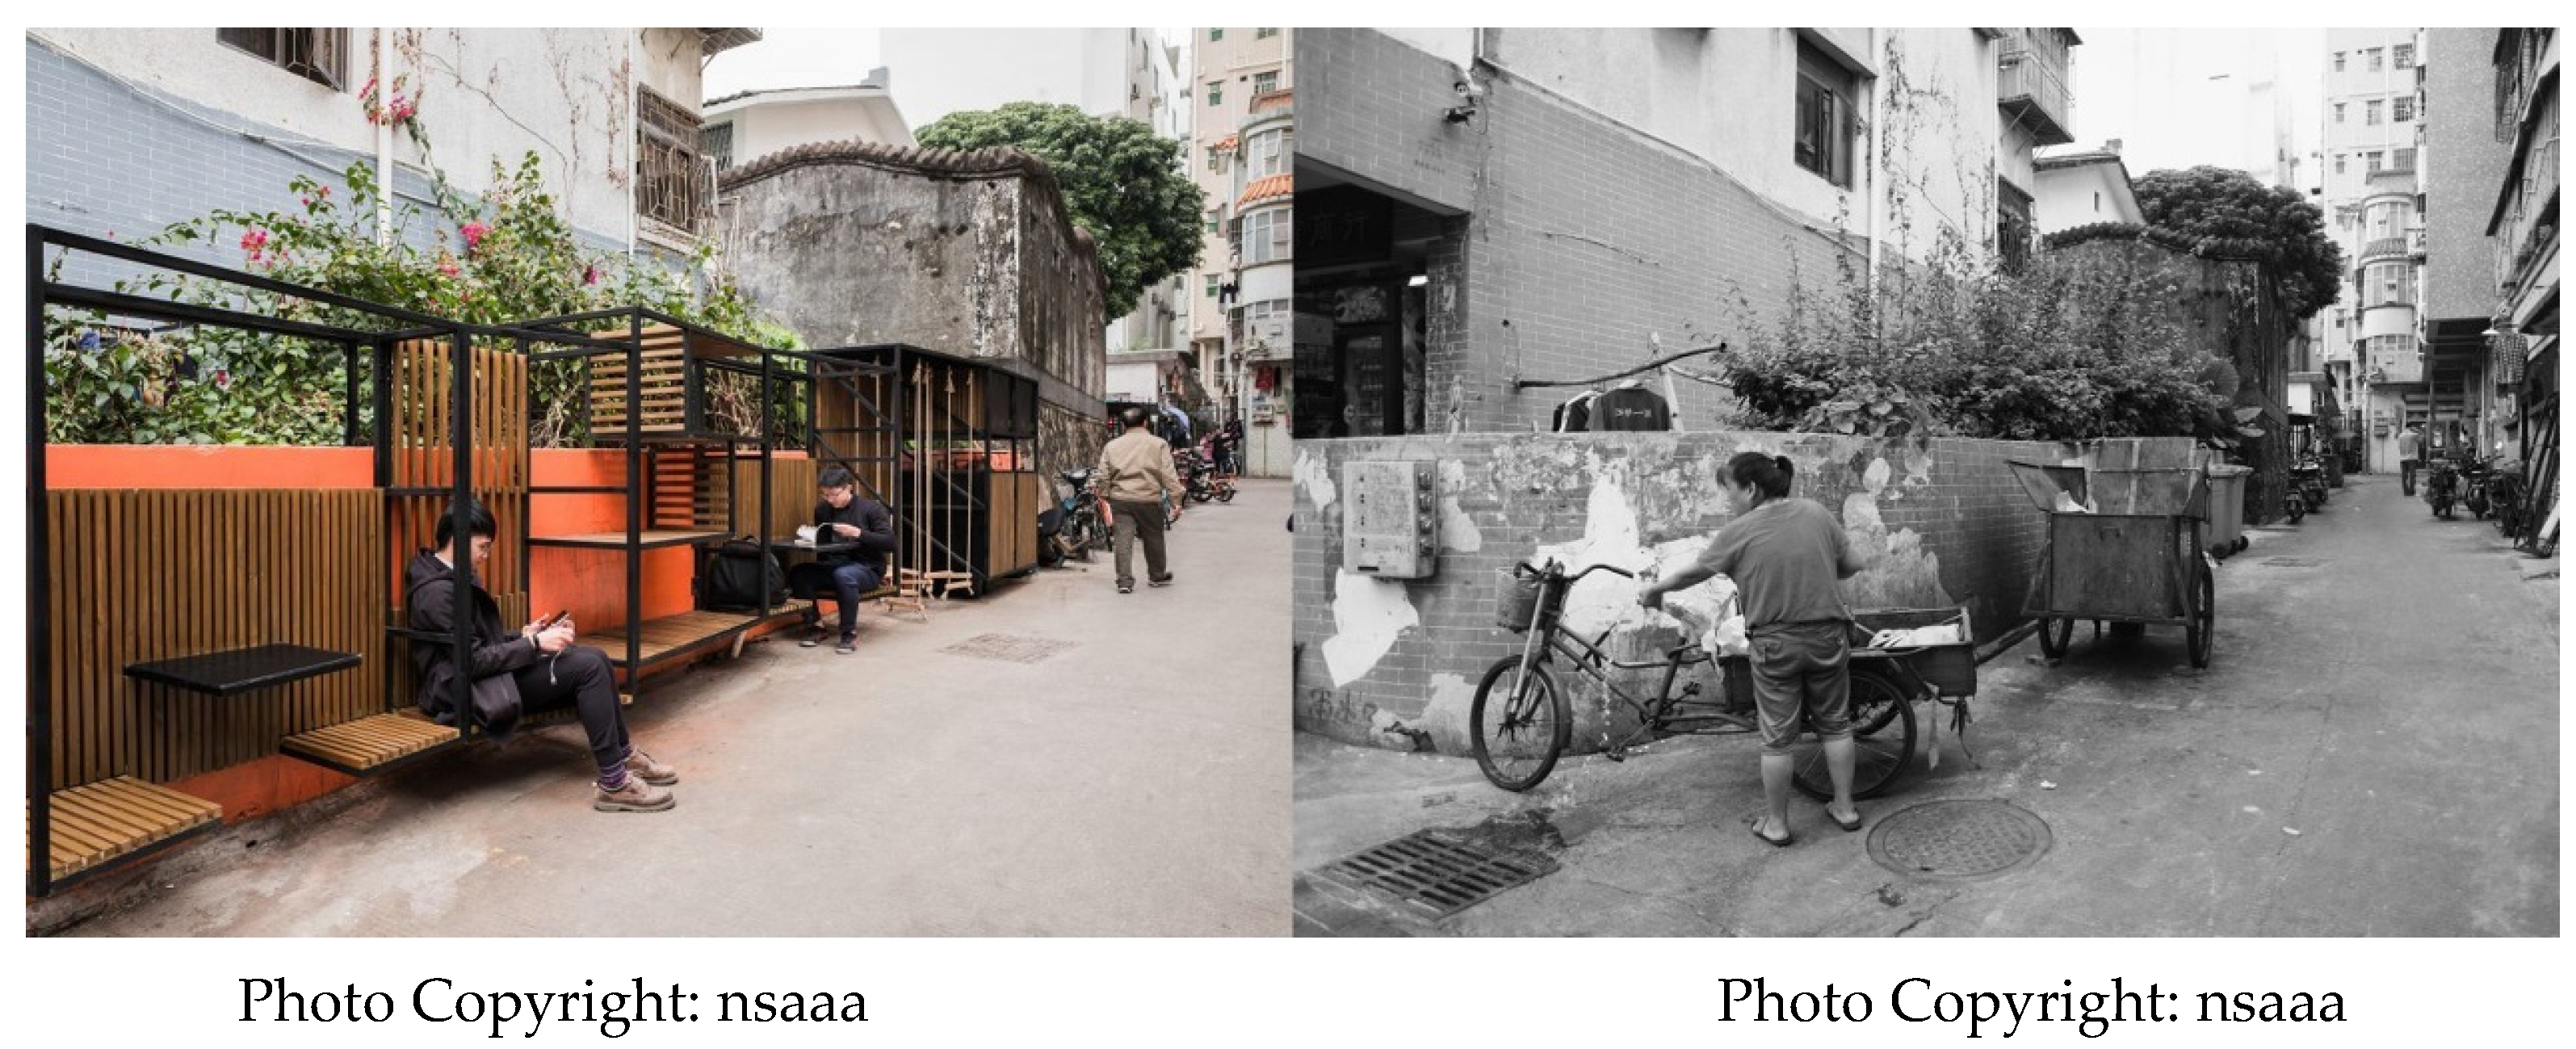
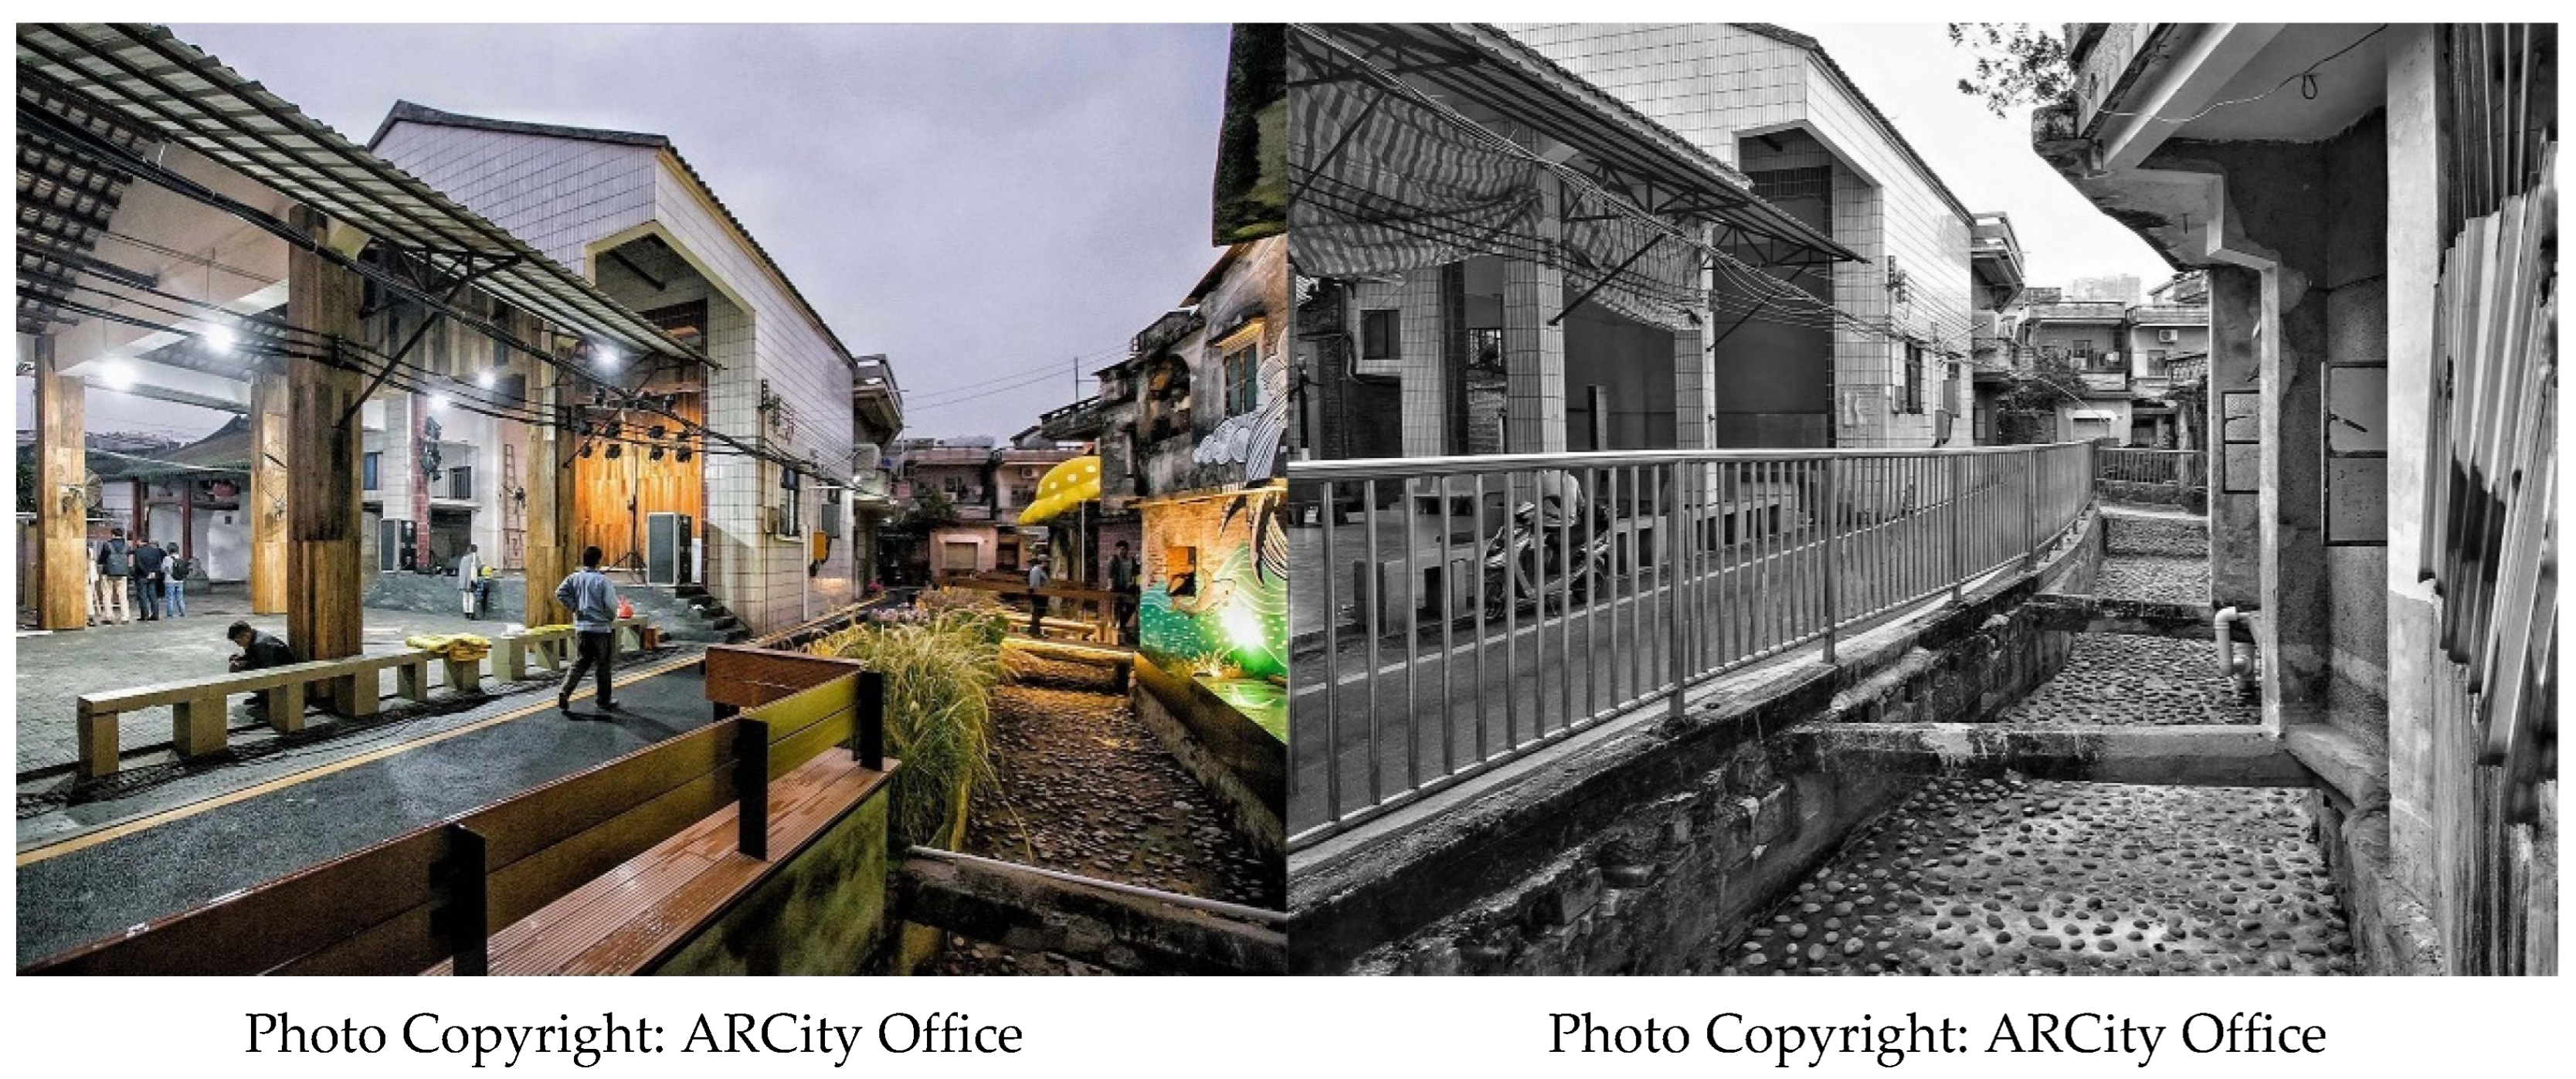
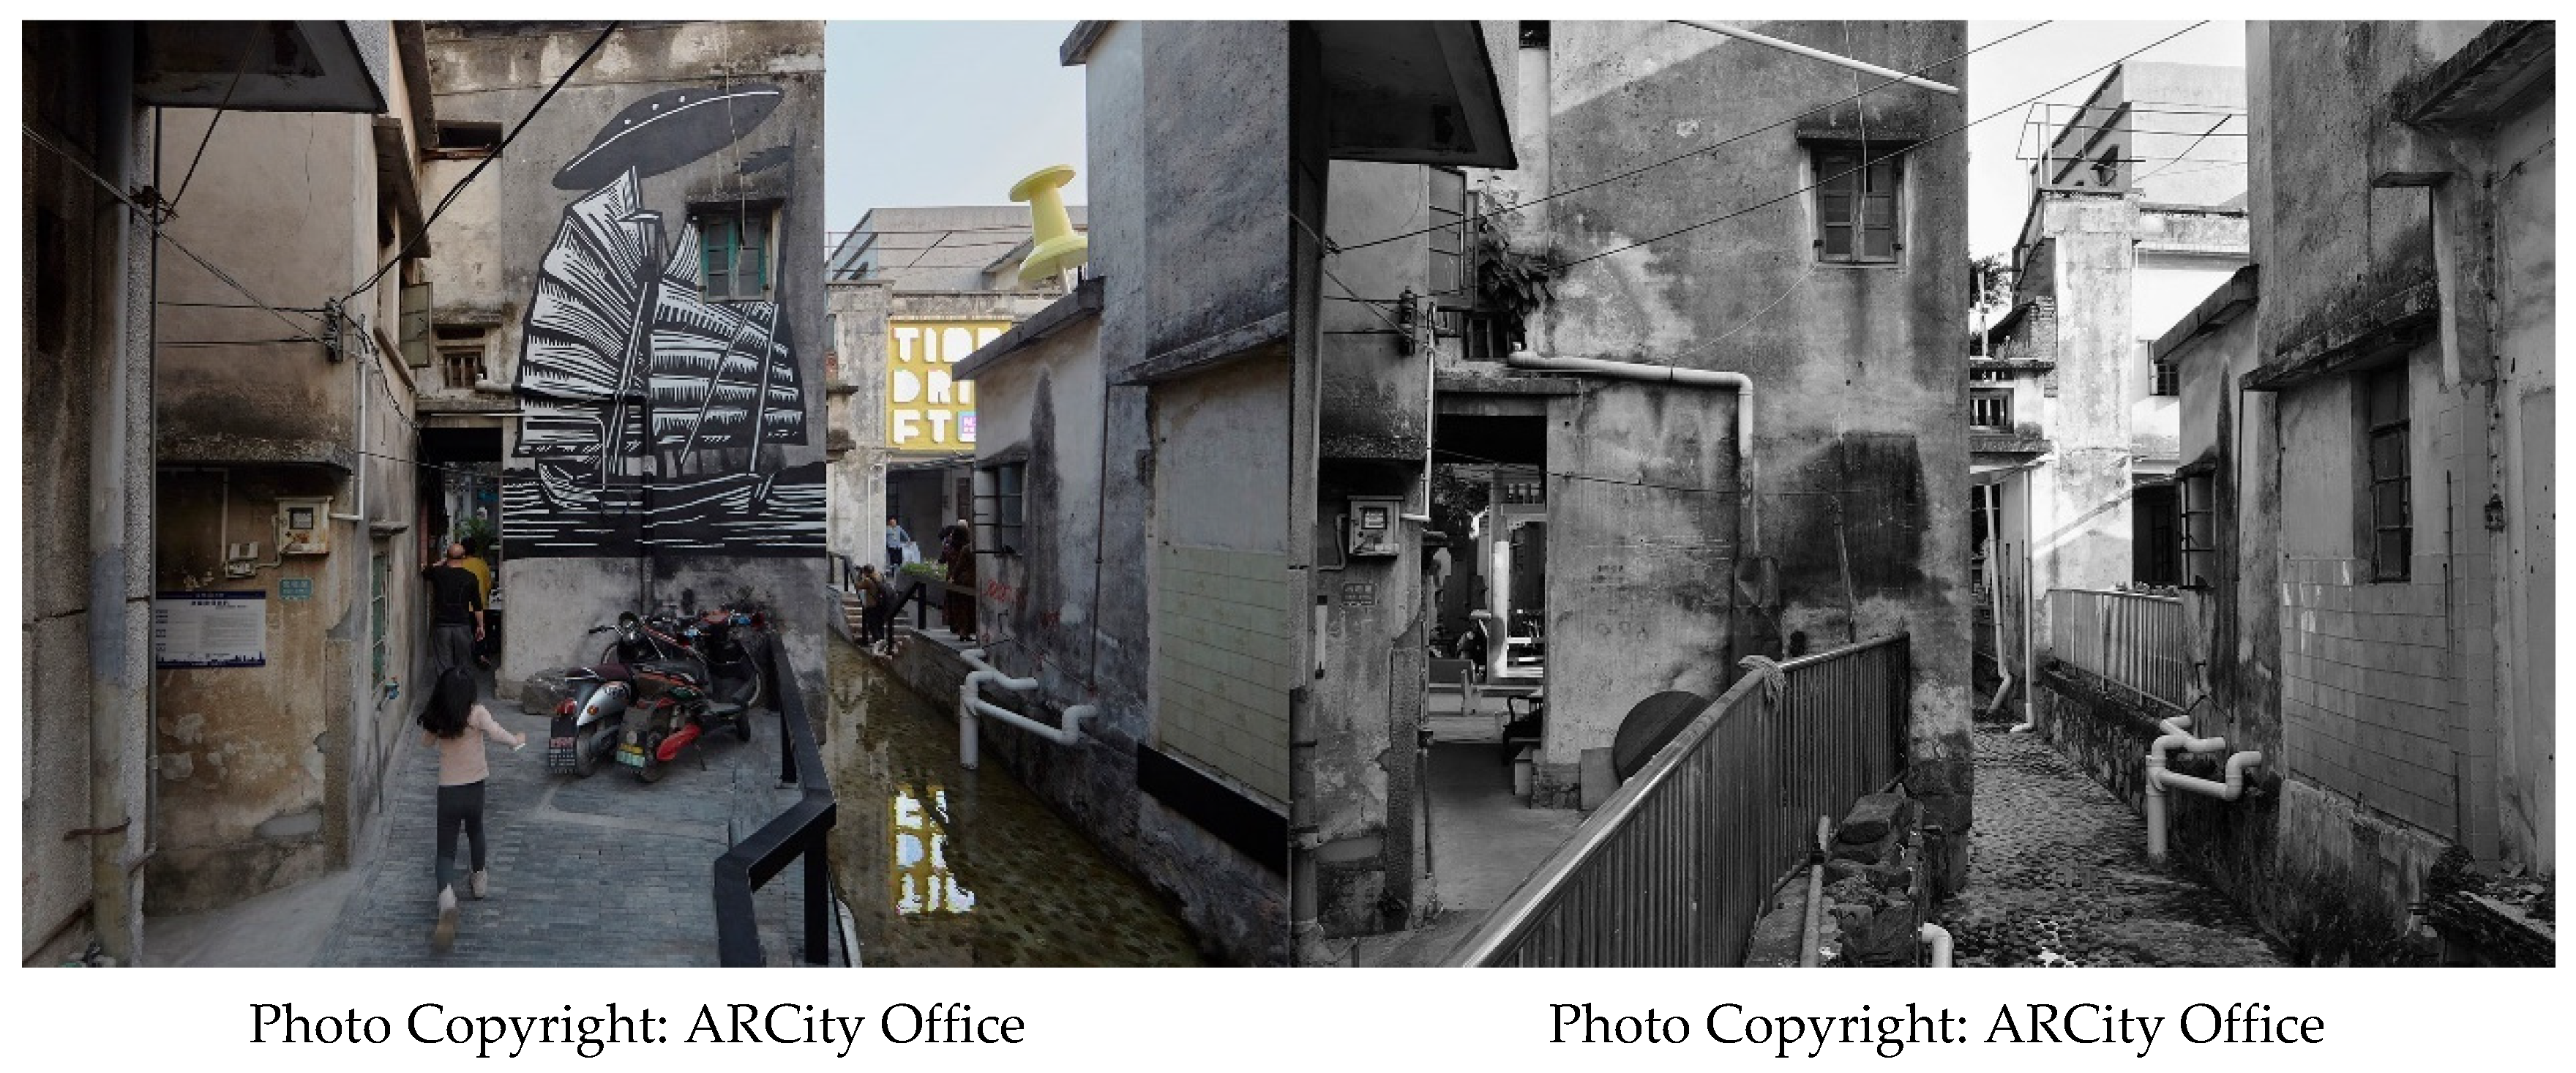
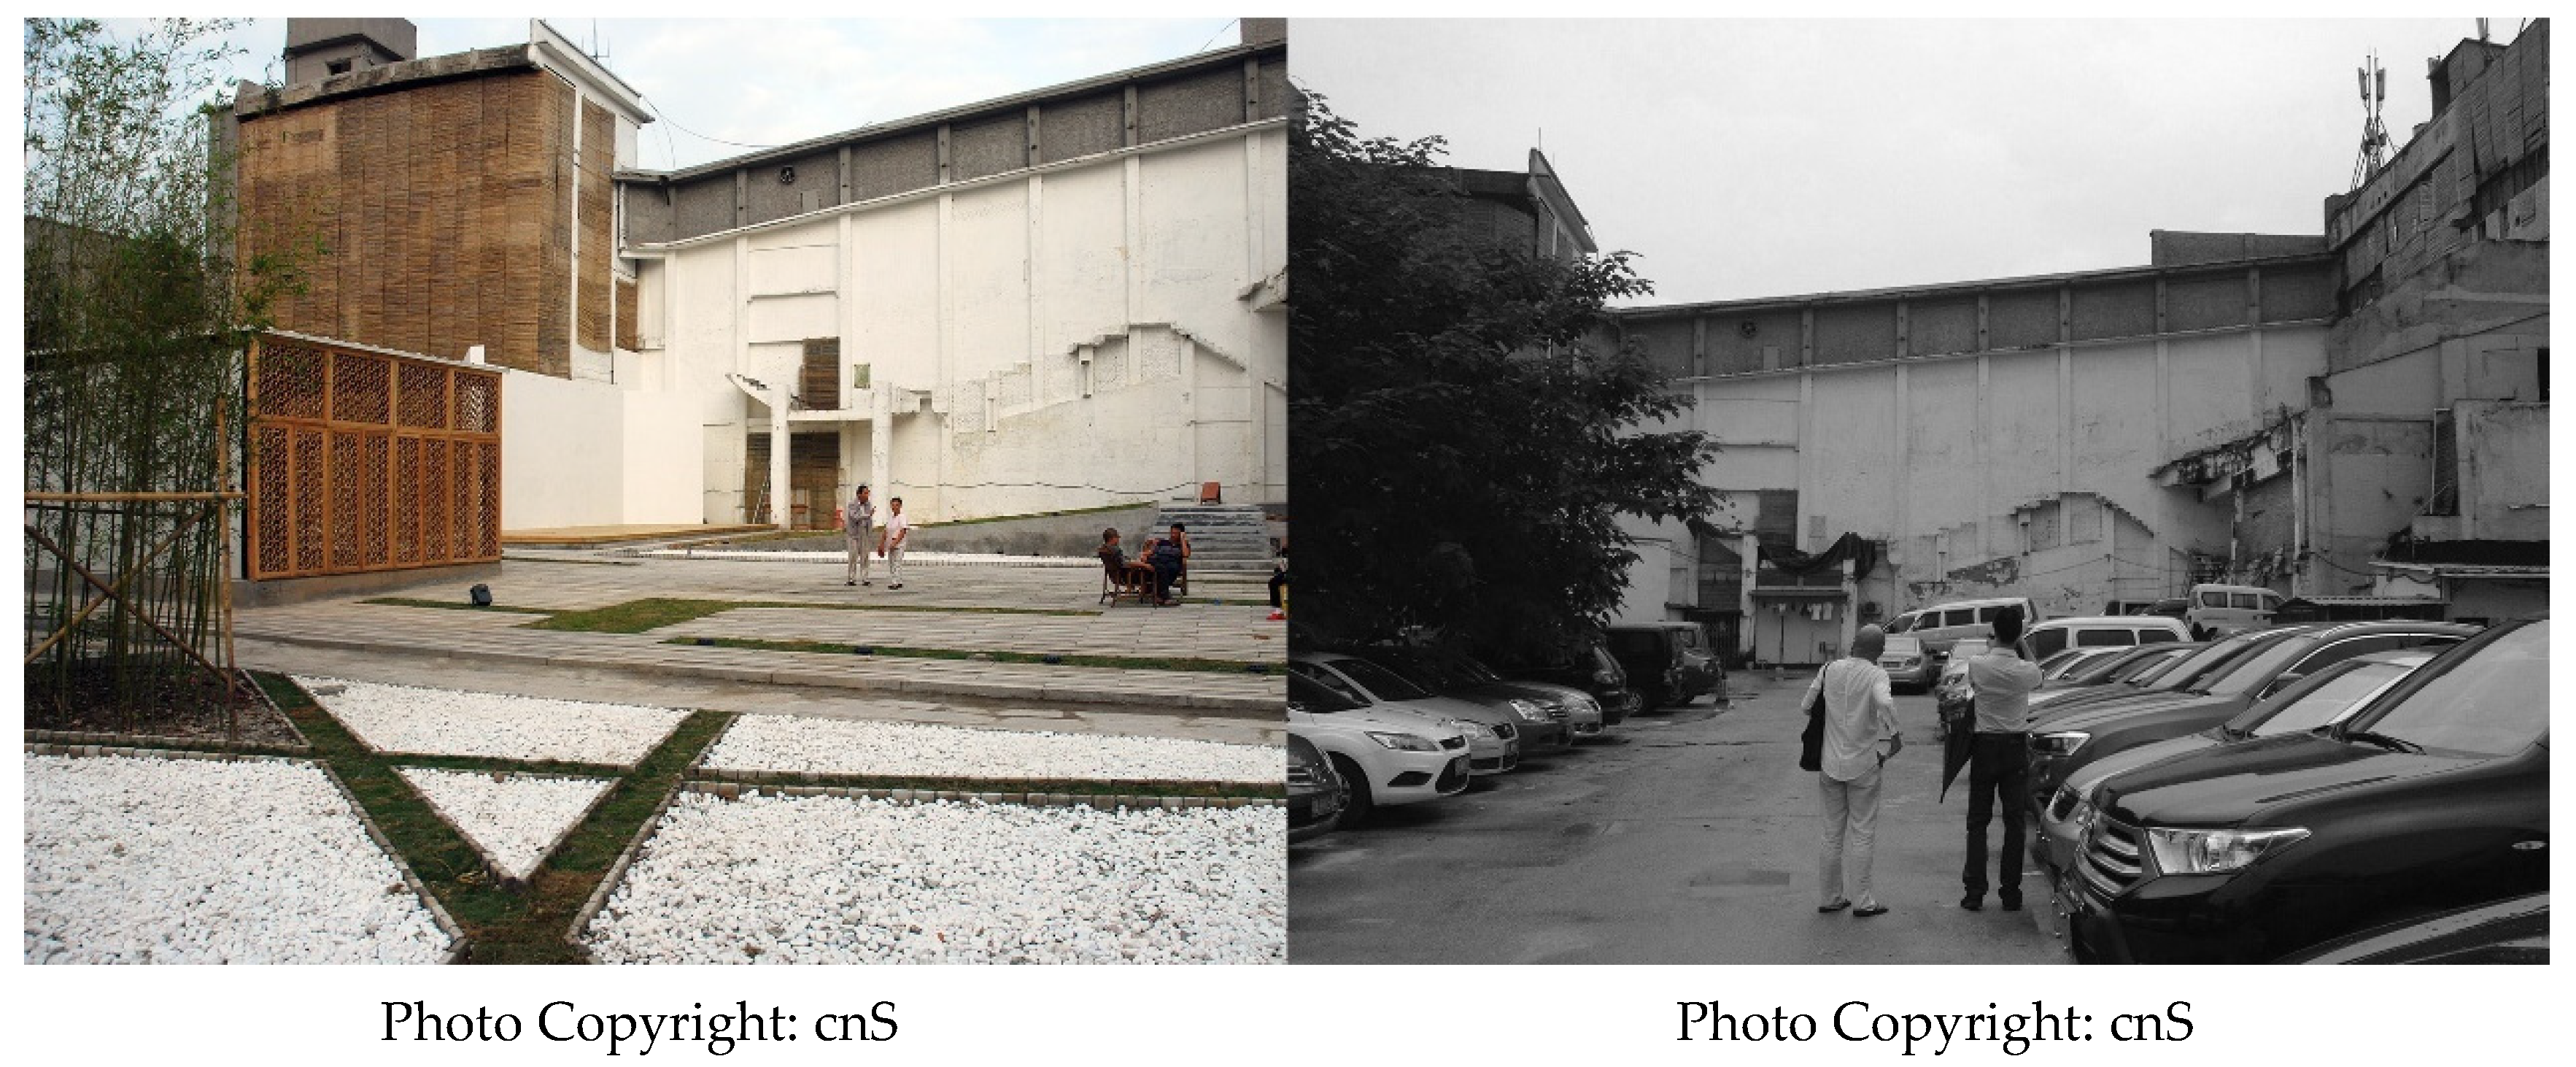
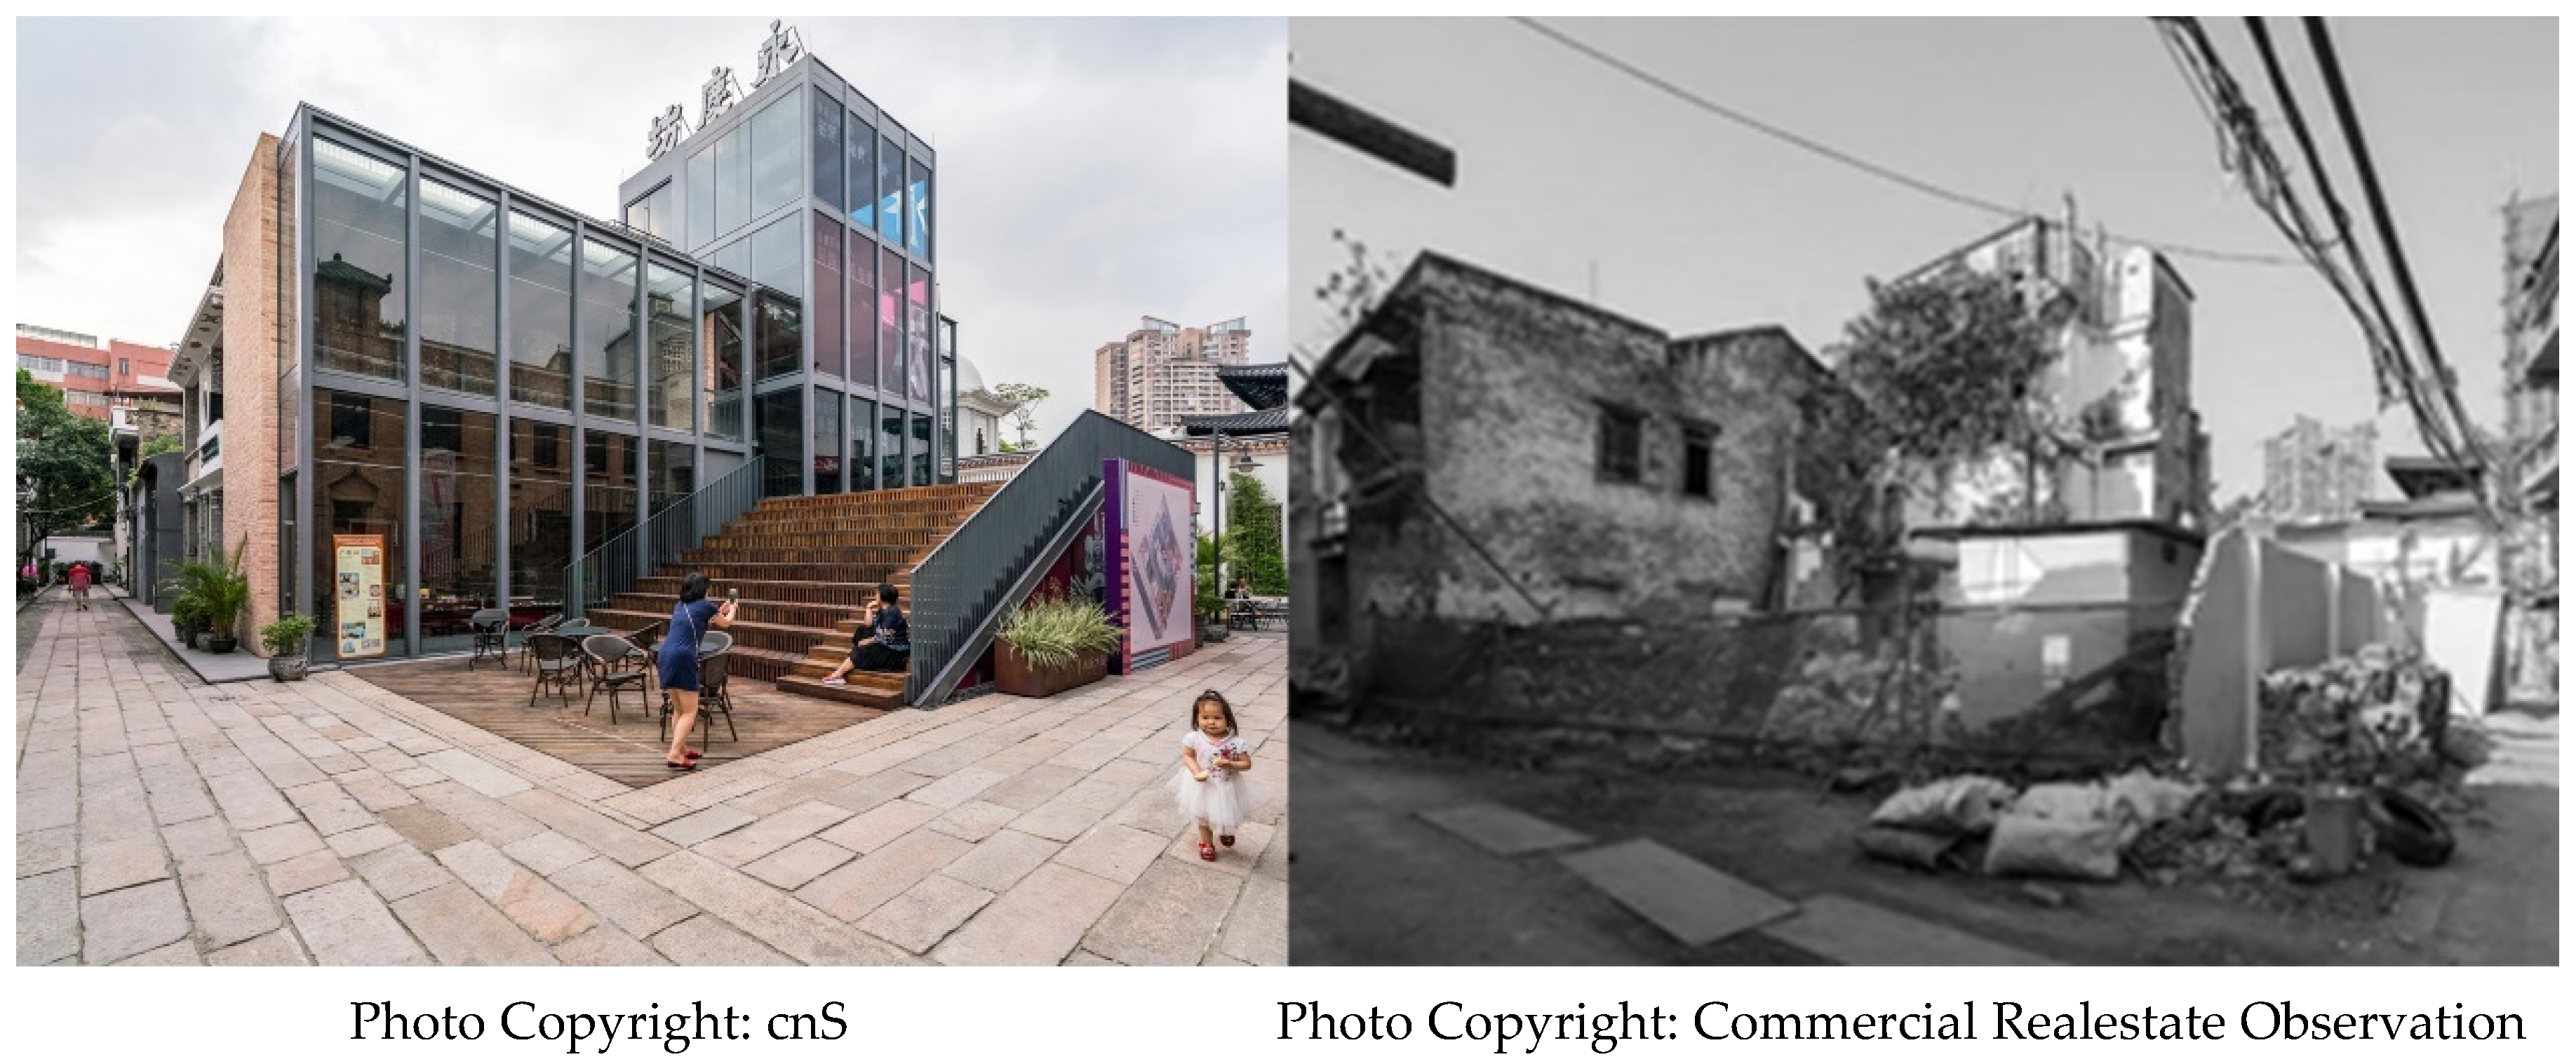
2.1. Research Site
2.2. Physical Factors of Research Sites
- Building façades: In the redevelopment of urban villages, there are three redevelopment degrees of building façades, as they can remain intact, be repaired or decorated, or be rebuilt after complete demolition. Repairing or decorating refer to repair strategies such as replacing doors and windows, and adding components, and to decoration strategies such as painting murals on external walls, respectively.
- Plant landscape: According to the number of existing plant species after urban village redevelopment, the plant landscape can be divided into three levels: poor, medium, and rich. Specifically, if the number of plant species is not greater than one, the plant landscape is considered poor; with two plant species, the landscape is considered medium; and with no less than three plant species, the landscape is considered rich.
- Roads: According to the three common redevelopment degrees of road renovation in redeveloped urban villages, roads can remain intact, be repaired, or be resurfaced. Repairing refers to the strategy of simply repairing a dilapidated road surface or removing debris that affects traffic.
- Municipal public facility variety: Municipal public facilities, in this study, are a series of ground facilities in urban villages excluding buildings, greenery, and roads, including auxiliary facilities such as guardrails and signs, public entertainment facilities, drainage facilities, road lighting facilities and household garbage disposal facilities. According to the existing types of municipal public facilities in redeveloped urban villages, the variety of municipal public facilities is distinguished according to three levels, namely poor, medium, and rich. Specifically, if there is no more than one type of municipal public facilities, the variety of municipal public facilities is considered poor; with two types, the variety of municipal public facilities is considered medium; and with no less than three types, the variety of municipal public facilities is considered rich.
2.3. Demographic Characteristics of the Respondents
2.4. Selection of Photos of Redeveloped Urban Villages
2.5. Questionnaire Survey
2.6. Data Analysis
3. Results
3.1. Overall Assessment of Photos
3.2. Correlation between Physical Factors and Visual Preference Assessment
3.3. Correlation between Demographic Characteristics and Visual Preference Assessment
3.4. Respondents’ Gender and Physical Factors
3.5. Respondent Age and Physical Factors
3.6. Respondents’ Income and Physical Factors
3.7. Respondents’ Household Size and Physical Factors
3.8. Urban Village-Native Status and Physical Factors
4. Discussion
4.1. Influence of Different Physical Factors on Visual Preference Assessment
4.2. Influence of the Demographic Characteristics on Visual Preference Assessment
4.3. Correlations between Demographic Characteristics and Physical Factors
4.4. Limitations
5. Conclusions
Author Contributions
Funding
Institutional Review Board Statement
Conflicts of Interest
References
- Forum, U.V.; Aldous, T.; Lunts, D.; Greenleaf, N. Urban Villages: A Concept for Creating Mixed-Use Urban Developments on a Sustainable Scale; Urban Villages Forum: London, UK, 1997. [Google Scholar]
- Hao, P.; Geertman, S.; Hooimeijer, P.; Sliuzas, R. Spatial analyses of the urban village development process in Shenzhen, China. Int. J. Urban Reg. Res. 2013, 37, 2177–2197. [Google Scholar] [CrossRef]
- Laclau, E.; Mouffe, C. Hegemony and Socialist Strategy: Towards a Radical Democratic Politics; Verso Books. 2014. Available online: https://files.libcom.org/files/ernesto-laclau-hegemony-and-socialist-strategy-towards-a-radical-democratic-politics.compressed.pdf (accessed on 14 January 2023).
- Abrahamson, M. Urban Enclaves; Macmillan. 2005. Available online: https://www.amazon.com/Urban-Enclaves-Identity-Contemporary-Social/dp/0716706369 (accessed on 14 January 2023).
- Lin, Y.; De Meulder, B.; Wang, S. Understanding the ‘village in the city’in Guangzhou: Economic integration and development issue and their implications for the urban migrant. Urban Stud. 2011, 48, 3583–3598. [Google Scholar] [CrossRef]
- Liu, Y. Village in the City; The Wiley Blackwell Encyclopedia of Urban and Regional Studies. 2019; pp. 1–8. Available online: https://www.wiley.com/en-us/The+Wiley+Blackwell+Encyclopedia+of+Urban+and+Regional+Studies-p-9781118568453 (accessed on 14 January 2023).
- Pan, W.; Du, J. Towards sustainable urban transition: A critical review of strategies and policies of urban village renewal in Shenzhen, China. Land Use Policy 2021, 111, 105744. [Google Scholar] [CrossRef]
- Baeten, G.; Listerborn, C. Renewing urban renewal in Landskrona, Sweden: Pursuing displacement through housing policies. Geogr. Ann. Ser. B Hum. Geogr. 2015, 97, 249–261. [Google Scholar] [CrossRef] [Green Version]
- He, S.; Wu, F. China’s emerging neoliberal urbanism: Perspectives from urban redevelopment. Antipode 2009, 41, 282–304. [Google Scholar] [CrossRef]
- Li, X.; Kleinhans, R.; van Ham, M. Shantytown redevelopment projects: State-led redevelopment of declining neighbourhoods under market transition in Shenyang, China. Cities 2018, 73, 106–116. [Google Scholar] [CrossRef] [Green Version]
- Liu, R.; Wong, T.-C. Urban village redevelopment in Beijing: The state-dominated formalization of informal housing. Cities 2018, 72, 160–172. [Google Scholar] [CrossRef]
- Marais, L.; Ntema, J. The upgrading of an informal settlement in South Africa: Two decades onwards. Habitat Int. 2013, 39, 85–95. [Google Scholar] [CrossRef]
- Muchadenyika, D.; Waiswa, J. Policy, politics and leadership in slum upgrading: A comparative analysis of Harare and Kampala. Cities 2018, 82, 58–67. [Google Scholar] [CrossRef]
- Lin, Y.; De Meulder, B. A conceptual framework for the strategic urban project approach for the sustainable redevelopment of “villages in the city” in Guangzhou. Habitat Int. 2012, 36, 380–387. [Google Scholar] [CrossRef]
- Tan, Y.; He, J.; Han, H.; Zhang, W. Evaluating residents’ satisfaction with market-oriented urban village transformation: A case study of Yangji Village in Guangzhou, China. Cities 2019, 95, 102394. [Google Scholar] [CrossRef]
- Perovic, S.; Folic, N.K. Visual perception of public open spaces in Niksic. Procedia-Soc. Behav. Sci. 2012, 68, 921–933. [Google Scholar] [CrossRef] [Green Version]
- Xiang, Y.; Hedblom, M.; Wang, S.; Qiu, L.; Gao, T. Indicator selection combining audio and visual perception of urban green spaces. Ecol. Indic. 2022, 137, 108772. [Google Scholar] [CrossRef]
- Iverson, W.D. And that’s about the size of it: Visual magnitude as a measurement of the physical landscape. Landsc. J. 1985, 4, 14–22. [Google Scholar] [CrossRef]
- Holahan, C.J. Environmental cognition. Env. Psychol. 1984, 88, 49–89. [Google Scholar]
- Hehl-Lange, S. Structural elements of the visual landscape and their ecological functions. Landsc. Urban Plan. 2001, 54, 107–115. [Google Scholar] [CrossRef]
- Lange, E. The limits of realism: Perceptions of virtual landscapes. Landsc. Urban Plan. 2001, 54, 163–182. [Google Scholar] [CrossRef]
- Misgav, A. Visual preference of the public for vegetation groups in Israel. Landsc. Urban Plan. 2000, 48, 143–159. [Google Scholar] [CrossRef]
- Kaltenborn, B.P.; Bjerke, T. Associations between environmental value orientations and landscape preferences. Landsc. Urban Plan. 2002, 59, 1–11. [Google Scholar] [CrossRef]
- García, L.; Hernández, J.; Ayuga, F. Analysis of the exterior colour of agroindustrial buildings: A computer aided approach to landscape integration. J. Environ. Manag. 2003, 69, 93–104. [Google Scholar] [CrossRef] [PubMed]
- Sung, E.; Wook, H.; Kyu, H. Analysis of the Visual Preference of Patterns in Pedestrian Roads. Int. J. Civ. Environ. Eng. 2013, 7, 26–29. [Google Scholar]
- Kelly, S.T. The Relationship between Visual Preference and Spatial Scale in Outdoor Urban Plazas; The University of Arizona: Tucson, AZ, USA, 1987. [Google Scholar]
- Balling, J.D.; Falk, J.H. Development of visual preference for natural environments. Environ. Behav. 1982, 14, 5–28. [Google Scholar] [CrossRef]
- Zhao, J.; Xu, W.; Li, R. Visual preference of trees: The effects of tree attributes and seasons. Urban For. Urban Green. 2017, 25, 19–25. [Google Scholar] [CrossRef]
- Wang, R.; Zhao, J. Demographic groups’ differences in visual preference for vegetated landscapes in urban green space. Sustain. Cities Soc. 2017, 28, 350–357. [Google Scholar] [CrossRef]
- Lee, M.S. Assessing visual preference for Louisiana river landscapes. In The Future of Wetlands: Assessing Visual-Cultural Values; Allanheld Osmun: Totowa, NJ, USA, 1983; pp. 43–63. [Google Scholar]
- Kim, S.-K.; Cho, W.-H.; Im, S.-B. Landscape evaluation of rural stream based on the factor analysis of visual preference. J. Korean Soc. Rural. Plan. 1999, 5, 35–44. [Google Scholar]
- Yoo, S.-W. Analysis of visual preference factor for Youngsan river scenery considering the variation of river stage. Arch. Des. Res. 2007, 20, 141–150. [Google Scholar]
- Huang, X.; Sherk, J.T. Evaluation and comparison of sustainability performance and visual preference of residential landscape elements. HortTechnology 2014, 24, 318–324. [Google Scholar] [CrossRef] [Green Version]
- Zhen, Z.; Ma, M.; Shao, Z.; Han, C.; Bu, X. A study of demographic difference in external visual preference evaluation of Chinese detached house. J. Asian Archit. Build. Eng. 2020, 19, 151–165. [Google Scholar] [CrossRef] [Green Version]
- Craun, R.M. Visual Determinants of Preference for Dwelling Environs. In EDRA 1, 1st ed.; Routledge: London, UK, 2021; pp. 75–85. [Google Scholar]
- Yuan, Y.; Luo, P.; Han, C.; Li, G. A study on visual impact assessment of the external form of unified houses in rural China. J. Asian Archit. Build. Eng. 2022, 21, 1445–1457. [Google Scholar] [CrossRef]
- Strumse, E. Demographic differences in the visual preferences for agrarian landscapes in western Norway. J. Environ. Psychol. 1996, 16, 17–31. [Google Scholar] [CrossRef]
- Yu, K. Cultural variations in landscape preference: Comparisons among Chinese sub-groups and Western design experts. Landsc. Urban Plan. 1995, 32, 107–126. [Google Scholar] [CrossRef]
- Bodrogi, P.; Lin, Y.; Xiao, X.; Stojanovic, D.; Khanh, T. Intercultural observer preference for perceived illumination chromaticity for different coloured object scenes. Light. Res. Technol. 2017, 49, 305–315. [Google Scholar] [CrossRef]
- Iftikhar, H.; Asghar, S.; Luximon, Y. A cross-cultural investigation of design and visual preference of signage information from Hong Kong and Pakistan. J. Navig. 2021, 74, 360–378. [Google Scholar] [CrossRef]
- Molnarova, K.; Sklenicka, P.; Stiborek, J.; Svobodova, K.; Salek, M.; Brabec, E. Visual preferences for wind turbines: Location, numbers and respondent characteristics. Appl. Energy 2012, 92, 269–278. [Google Scholar] [CrossRef] [Green Version]
- Svobodova, K.; Sklenicka, P.; Molnarova, K.; Salek, M. Visual preferences for physical attributes of mining and post-mining landscapes with respect to the sociodemographic characteristics of respondents. Ecol. Eng. 2012, 43, 34–44. [Google Scholar] [CrossRef]
- Ayuga-Téllez, E.; Ramírez-Montoro, J.J.; Grande-Ortiz, M.Á.; Muñoz-Violero, D. Differences in Visual Preference in Rural Landscapes on the Plain of La Mancha in Spain. Sustainability 2021, 13, 13799. [Google Scholar] [CrossRef]
- Lindemann-Matthies, P.; Briegel, R.; Schüpbach, B.; Junge, X. Aesthetic preference for a Swiss alpine landscape: The impact of different agricultural land-use with different biodiversity. Landsc. Urban Plan. 2010, 98, 99–109. [Google Scholar] [CrossRef]
- Yamashita, S. Perception and evaluation of water in landscape: Use of Photo-Projective Method to compare child and adult residents’ perceptions of a Japanese river environment. Landsc. Urban Plan. 2002, 62, 3–17. [Google Scholar] [CrossRef]
- Van den Berg, A.E.; Koole, S.L. New wilderness in the Netherlands: An investigation of visual preferences for nature development landscapes. Landsc. Urban Plan. 2006, 78, 362–372. [Google Scholar] [CrossRef]
- Vouligny, É.; Domon, G.; Ruiz, J. An assessment of ordinary landscapes by an expert and by its residents: Landscape values in areas of intensive agricultural use. Land Use Policy 2009, 26, 890–900. [Google Scholar] [CrossRef]
- Vartanian, O.; Navarrete, G.; Chatterjee, A.; Fich, L.B.; Leder, H.; Modroño, C.; Rostrup, N.; Skov, M.; Corradi, G.; Nadal, M. Preference for curvilinear contour in interior architectural spaces: Evidence from experts and nonexperts. Psychol. Aesthet. Creat. Arts 2019, 13, 110. [Google Scholar] [CrossRef] [Green Version]
- Howley, P.; Donoghue, C.O.; Hynes, S. Exploring public preferences for traditional farming landscapes. Landsc. Urban Plan. 2012, 104, 66–74. [Google Scholar] [CrossRef]
- Wendel, H.E.W.; Zarger, R.K.; Mihelcic, J.R. Accessibility and usability: Green space preferences, perceptions, and barriers in a rapidly urbanizing city in Latin America. Landsc. Urban Plan. 2012, 107, 272–282. [Google Scholar] [CrossRef]
- Zube, E.H.; Pitt, D.G.; Evans, G.W. A lifespan developmental study of landscape assessment. J. Environ. Psychol. 1983, 3, 115–128. [Google Scholar] [CrossRef]
- Kabiri, F.; Zamani, B.; Khajeh Ahmad Attari, A. The effect of the visual elements of the murals of Tehran Theater Metro Station on the perceptual-visual desirability from the viewpoint of citizens, professionals and artists. Motaleate Shahri 2022, 11, 17–30. [Google Scholar]
- Hami, A.; Moula, F.F.; Maulan, S.B. Public preferences toward shopping mall interior landscape design in Kuala Lumpur, Malaysia. Urban For. Urban Green. 2018, 30, 1–7. [Google Scholar] [CrossRef]
- Waddick, P. Factors Affecting the Visual Preference of Stormwater Managmeent Design Alternatives for Residential Boulevards; University of Guelph: Guelph, ON, Canada, 2004. [Google Scholar]
- Polat, A.T.; Akay, A. Relationships between the visual preferences of urban recreation area users and various landscape design elements. Urban For. Urban Green. 2015, 14, 573–582. [Google Scholar] [CrossRef]
- Smaldone, L. Feminist Streetscapes: A Study on Perceptions of Streetscapes in Eugene, Oregon; University of Oregon: Eugene, OR, USA, 2021. [Google Scholar]
- Jiang, W.; Feng, T.; Timmermans, H.; Li, H. A gap-theoretical path model of residential satisfaction and intention to move house applied to renovated historical blocks in two Chinese cities. Cities 2017, 71, 19–29. [Google Scholar] [CrossRef]
- Dekker, K.; De Vos, S.; Musterd, S.; Van Kempen, R. Residential satisfaction in housing estates in European cities: A multi-level research approach. Hous. Stud. 2011, 26, 479–499. [Google Scholar] [CrossRef]
- Abu-Ghazzeh, T.M. Signs, advertising and the imageability of buildings: A perceptual selection in the view from the street in Amman, Jordan. Habitat Int. 1997, 21, 255–267. [Google Scholar] [CrossRef]
- Askari, A.H. Influence of building façade visual elements on its historical image: Case of Kuala Lumpur city, Malaysia. J. Des. Built Environ. 2009, 5, 49–59. [Google Scholar]
- Moughtin, C.; Taner, O.; Tiesdell, S. Urban Design Ornament and Decorated; Institute of Planning Studies, Department of Architecture and Planning University of Notthingham: Nottingham, UK, 1995. [Google Scholar]
- Imamoglu, Ç. Complexity, liking and familiarity: Architecture and non-architecture turkish students’assessments of traditional and modern house facades. J. Environ. Psychol. 2000, 20, 5–16. [Google Scholar] [CrossRef]
- Utaberta, N.; Jalali, A.; Johar, S.; Surat, M.; Che-Ani, A. Building facade study in Lahijan city, Iran: The impact of facade’s visual elements on historical image. Int. J. Humanit. Soc. Sci. 2012, 6, 1839–1844. [Google Scholar]
- Bu, X.; Chen, X.; Wang, S.; Yuan, Y.; Han, C. The influence of newly built high-rise buildings on visual impact assessment of historic urban landscapes: A case study of Xi’an Bell Tower. J. Asian Archit. Build. Eng. 2022, 21, 1304–1319. [Google Scholar] [CrossRef]
- Pan, J.; Yuan, Y.; Wang, X.; Han, C. Research on Visual Preference of Chinese Courthouse Architecture Appearance. Buildings 2022, 12, 557. [Google Scholar] [CrossRef]
- Jabareen, Y.R. Sustainable urban forms: Their typologies, models, and concepts. J. Plan. Educ. Res. 2006, 26, 38–52. [Google Scholar] [CrossRef]
- Ulrich, R.S. Human responses to vegetation and landscapes. Landsc. Urban Plan. 1986, 13, 29–44. [Google Scholar] [CrossRef]
- Lamb, R.J.; Purcell, A.T. Perception of naturalness in landscape and its relationship to vegetation structure. Landsc. Urban Plan. 1990, 19, 333–352. [Google Scholar] [CrossRef]
- Lee, S.-W.; Ellis, C.D.; Kweon, B.-S.; Hong, S.-K. Relationship between landscape structure and neighborhood satisfaction in urbanized areas. Landsc. Urban Plan. 2008, 85, 60–70. [Google Scholar] [CrossRef]
- Larsen, L.; Harlan, S.L. Desert dreamscapes: Residential landscape preference and behavior. Landsc. Urban Plan. 2006, 78, 85–100. [Google Scholar] [CrossRef]
- Appleyard, D. Styles and methods of structuring a city. Environ. Behav. 1970, 2, 100–117. [Google Scholar] [CrossRef]
- Ewing, R. Residential street design: Do the British and Australians know something Americans do not? Transp. Res. Rec. 1994, 1, 42–49. [Google Scholar]
- Yin, J.; Cao, X.J.; Huang, X.; Cao, X. Applying the IPA–Kano model to examine environmental correlates of residential satisfaction: A case study of Xi’an. Habitat Int. 2016, 53, 461–472. [Google Scholar] [CrossRef] [Green Version]
- Burden, D.; Wallwork, M.; Sides, K.; Trias, R.; Rue, H. Street Design Guidelines for Healthy Neighborhoods; Center for Livable Communities: Sacramento, CA, USA, 1999.
- Massam, B.H. Quality of life: Public planning and private living. Prog. Plan. 2002, 58, 141–227. [Google Scholar] [CrossRef]
- Deelen, I.; Jansen, M.; Dogterom, N.J.; Kamphuis, C.; Ettema, D. Do objective neighbourhood characteristics relate to residents’ preferences for certain sports locations? A cross-sectional study using a discrete choice modelling approach. BMC Public Health 2017, 17, 943. [Google Scholar] [CrossRef]
- Novianto, D.; Gao, W.; Kuroki, S.; Fukahori, H. Statistical evaluation on neighborhood facilities in relation with residential satisfaction and preference. Am. J. Environ. Sci. 2016, 12, 169–181. [Google Scholar] [CrossRef]
- Hawthorne, W. Why Ontarians Walk, Why Ontarians Don’t Walk More: A Study into the Walking Habits of Ontarians; Energy Probe Research Foundation: Toronto, ON, Canada, 1989. [Google Scholar]
- Kristianova, K. Post-socialist transformations of green open spaces in large scale socialist housing estates in Slovakia. Procedia Eng. 2016, 161, 1863–1867. [Google Scholar] [CrossRef] [Green Version]
- Sohn, W.; Kim, H.W.; Kim, J.-H.; Li, M.-H. The capitalized amenity of green infrastructure in single-family housing values: An application of the spatial hedonic pricing method. Urban For. Urban Green. 2020, 49, 126643. [Google Scholar] [CrossRef]
- Ahlfeldt, G.M.; Maennig, W. Impact of sports arenas on land values: Evidence from Berlin. Ann. Reg. Sci. 2010, 44, 205–227. [Google Scholar] [CrossRef] [Green Version]
- Palmer, J.F.; Hoffman, R.E. Rating reliability and representation validity in scenic landscape assessments. Landsc. Urban Plan. 2001, 54, 149–161. [Google Scholar] [CrossRef]
- Nasar, J.L. Visual preferences in urban street scenes: A cross-cultural comparison between Japan and the United States. J. Cross-Cult. Psychol. 1984, 15, 79–93. [Google Scholar] [CrossRef]
- Herman, K. Temporary, mobile and nomadic gardens in urban space. In Proceedings of the EFLA Regional Congress, Tallin, Estonia, 2–4 November 2011. [Google Scholar]
- Ewing, R.; Clemente, O.; Neckerman, K.M.; Purciel-Hill, M.; Quinn, J.W.; Rundle, A. Measuring Urban Design: Metrics for Livable Places; Island Press: Washington, DC, USA, 2013. [Google Scholar]
- Norouzian-Maleki, S.; Bell, S.; Hosseini, S.-B.; Faizi, M.; Saleh-Sedghpour, B. A comparison of neighbourhood liveability as perceived by two groups of residents: Tehran, Iran and Tartu, Estonia. Urban For. Urban Green. 2018, 35, 8–20. [Google Scholar] [CrossRef] [Green Version]
- Deng, Y. Uncertainty measure in evidence theory. Sci. China Inf. Sci. 2020, 63, 210201. [Google Scholar] [CrossRef]
- Arriaza, M.; Cañas-Ortega, J.F.; Cañas-Madueño, J.A.; Ruiz-Aviles, P. Assessing the visual quality of rural landscapes. Landsc. Urban Plan. 2004, 69, 115–125. [Google Scholar] [CrossRef]
- Zhang, L.; Zhao, S.X.; Tian, J.P. Self-help in housing and chengzhongcun in China’s urbanization. Int. J. Urban Reg. Res. 2003, 27, 912–937. [Google Scholar] [CrossRef]
- Li, T. The Chengzhongcun land market in China: Boon or bane?—A perspective on property rights. Int. J. Urban Reg. Res. 2008, 32, 282–304. [Google Scholar]
- Wang, Y.P.; Wang, Y.; Wu, J. Urbanization and informal development in China: Urban villages in Shenzhen. Int. J. Urban Reg. Res. 2009, 33, 957–973. [Google Scholar] [CrossRef]
- Behe, B.; Hardy, J.; Barton, S.; Brooker, J.; Fernandez, T.; Hall, C.; Hicks, J.; Hinson, R.; Knight, P.; McNiel, R.; et al. Landscape plant material, size, and design sophistication increase perceived home value. J. Environ. Hortic. 2005, 23, 127–133. [Google Scholar] [CrossRef]
- Bernasconi, C.; Strager, M.P.; Maskey, V.; Hasenmyer, M. Assessing public preferences for design and environmental attributes of an urban automated transportation system. Landsc. Urban Plan. 2009, 90, 155–167. [Google Scholar] [CrossRef]
- Avižienė, D.; Pakalnis, R.; Sendžikaitė, J. Preservation, assessment and management of scenic landscape in Lithuania. In Man in the Landscape across Frontiers: Landscape and Land Use Change in Central European Border Regions. CD-ROM Conference Proceedings of the IGU/LUCC Central Europe Conference 2007, Slovenia–Austria–Slovakia–Czech Republic, August 28–September 4, 2007; Faculty of Science, Charles University: Prague, Czech Republic, 2007; Available online: http://lucc.zrc-sazu.si/Portals/31/Conferences/Central%20Europe%202007/1.pdf (accessed on 14 January 2023).
- Uzun, O.; Muuml, H. Visual landscape quality in landscape planning: Examples of Kars and Ardahan cities in Turkey. Afr. J. Agric. Res. 2011, 6, 1627–1638. [Google Scholar]
- Hur, M.; Morrow-Jones, H. Factors that influence residents’ satisfaction with neighborhoods. Environ. Behav. 2008, 40, 619–635. [Google Scholar] [CrossRef]
- Lehning, A.J. Local and regional governments and age-friendly communities: A case study of the San Francisco Bay Area. J. Aging Soc. Policy 2014, 26, 102–116. [Google Scholar] [CrossRef] [PubMed]
- Utter, J.; Denny, S.; Robinson, E.M.; Ameratunga, S.; Watson, P. Perceived access to community facilities, social motivation, and physical activity among New Zealand youth. J. Adolesc. Health 2006, 39, 770–773. [Google Scholar] [CrossRef] [PubMed]
- Ma, G. Food, eating behavior, and culture in Chinese society. J. Ethn. Foods 2015, 2, 195–199. [Google Scholar] [CrossRef] [Green Version]
- Wang, Y.; Sun, M.; Song, B. Public perceptions of and willingness to pay for sponge city initiatives in China. Resour. Conserv. Recycl. 2017, 122, 11–20. [Google Scholar] [CrossRef]
- Li, J.; Auchincloss, A.H.; Rodriguez, D.A.; Moore, K.A.; Diez Roux, A.V.; Sánchez, B.N. Determinants of residential preferences related to built and social environments and concordance between neighborhood characteristics and preferences. J. Urban Health 2020, 97, 62–77. [Google Scholar] [CrossRef]
- Rosso, A.L.; Taylor, J.A.; Tabb, L.P.; Michael, Y.L. Mobility, disability, and social engagement in older adults. J. Aging Health 2013, 25, 617–637. [Google Scholar] [CrossRef] [Green Version]
- Jia, S.; Wang, Y. Effect of heat mitigation strategies on thermal environment, thermal comfort, and walkability: A case study in Hong Kong. Build. Environ. 2021, 201, 107988. [Google Scholar] [CrossRef]
- Liao, F.H.; Farber, S.; Ewing, R. Compact development and preference heterogeneity in residential location choice behaviour: A latent class analysis. Urban Stud. 2015, 52, 314–337. [Google Scholar] [CrossRef]
- Unger, J.B.; Johnson, C.A.; Marks, G. Functional decline in the elderly: Evidence for direct and stress-buffering protective effects of social interactions and physical activity. Ann. Behav. Med. 1997, 19, 152–160. [Google Scholar] [CrossRef]
- Zhan, D.; Kwan, M.-P.; Zhang, W.; Fan, J.; Yu, J.; Dang, Y. Assessment and determinants of satisfaction with urban livability in China. Cities 2018, 79, 92–101. [Google Scholar] [CrossRef]
- Hussain, T.; Abbas, J.; Wei, Z.; Nurunnabi, M. The effect of sustainable urban planning and slum disamenity on the value of neighboring residential property: Application of the hedonic pricing model in rent price appraisal. Sustainability 2019, 11, 1144. [Google Scholar] [CrossRef] [Green Version]
- Yu, L.; Xie, B.; Chan, E.H. Exploring impacts of the built environment on transit travel: Distance, time and mode choice, for urban villages in Shenzhen, China. Transp. Res. Part E Logist. Transp. Rev. 2019, 132, 57–71. [Google Scholar] [CrossRef]


| Physical Factors | Factor Value |
|---|---|
| Building Façade | Intact = 1; repaired or decorated = 2; rebuilt = 3 |
| Plant Landscape | Poor = 1; medium = 2; rich = 3 |
| Roads | Intact = 1; repaired = 2; resurfaced = 3 |
| Municipal Public Facility Variety | Poor = 1; medium = 2; rich = 3 |
| Demographic Characteristics | Variable | Set Value |
|---|---|---|
| Gender | Male | 1 |
| Female | 2 | |
| Age | 18–34 | 1 |
| 35–59 | 2 | |
| ≥60 | 3 | |
| Monthly Income | <RMB 3420 | 1 |
| ≥RMB 3420 | 2 | |
| Household Size | 1 person | 1 |
| 2–3 persons | 2 | |
| ≥4 persons | 3 | |
| Urban Village-Native Status | Yes | 1 |
| No | 2 |
| Score | Denotation |
|---|---|
| 0 | Strongly dislike |
| 1 | Dislike |
| 2 | Mildly dislike |
| 3 | Mildly like |
| 4 | Like |
| 5 | Strongly like |
| Demographic Characteristics | Variable | Number of Urban Village Residents | Proportion |
|---|---|---|---|
| Gender | Male | 134 | 48.92% |
| Female | 139 | 52.08% | |
| Age | 18–34 | 90 | 33.09% |
| 35–59 | 130 | 47.71% | |
| ≥60 | 53 | 19.20% | |
| Monthly Income | <RMB 3420 | 147 | 53.85% |
| ≥RMB 3420 | 126 | 46.15% | |
| Household Size | 1 person | 59 | 33.36% |
| 2–3 persons | 103 | 40.91% | |
| ≥4 persons | 111 | 25.73% | |
| Urban Village-Native Status | Yes | 97 | 35.53% |
| No | 176 | 64.47% |
| Unstandardized Coefficients | Standardized Coefficient | t | Sig. | Collinearity Statistics | |||
|---|---|---|---|---|---|---|---|
| B | Std. Error | Beta | Tolerance | VIF | |||
| Constant | 2.684 | 0.693 | 3.872 | 0.018 | |||
| A | 0.133 | 0.156 | 0.359 | 1.250 | 0.043 | 0.911 | 1.098 |
| L | −0.145 | 0.137 | −0.464 | −0.856 | 0.050 | 0.840 | 1.191 |
| R | −0.049 | 0.196 | −0.120 | −3.250 | 0.015 | 0.705 | 1.418 |
| M | 0.057 | 0.157 | 0.163 | 2.961 | 0.036 | 0.797 | 1.255 |
| Age | Income | Household Size | Urban Village-Native Status | S | ||
|---|---|---|---|---|---|---|
| Gender | Correlation Coefficient | 0.207 | −0.073 | 0.183 | 0.254 | 0.388 ** |
| Sig. (2-tailed) | 0.146 | 0.630 | 0.197 | 0.092 | 0.002 | |
| N | 45 | 45 | 45 | 45 | 45 | |
| Age | Correlation Coefficient | −0.083 | −0.060 | 0.252 | 0.378 ** | |
| Sig. (2-tailed) | 0.559 | 0.655 | 0.078 | 0.002 | ||
| . | N | 45 | 45 | 45 | 45 | |
| Income | Correlation Coefficient | −0.276 | −0.200 | −0.279 * | ||
| Sig. (2-tailed) | 0.052 | 0.185 | 0.027 | |||
| N | 45 | 45 | 45 | |||
| Household Size | Correlation Coefficient | 0.123 | 0.246 * | |||
| Sig. (2-tailed) | 0.386 | 0.040 | ||||
| N | 45 | 45 | ||||
| Urban Village-Native Status | Correlation Coefficient | |||||
| Sig. (2-tailed) | ||||||
| N | ||||||
| S | Correlation Coefficient | |||||
| Sig. (2-tailed) | ||||||
| N |
| Unstandardized Coefficients | Standardized Coefficient | t | Sig. | Collinearity Statistics | |||
|---|---|---|---|---|---|---|---|
| B | Std. Error | Beta | Tolerance | VIF | |||
| Constant | 1.566 | 0.414 | 3.786 | 0.001 | |||
| Gender | 0.325 | 0.153 | 0.276 | 2.125 | 0.040 | 0.789 | 1.267 |
| Age | 0.309 | 0.097 | 0.398 | 3.192 | 0.003 | 0.853 | 1.172 |
| Income | −0.222 | 0.141 | −0.192 | −1.572 | 0.124 | 0.889 | 1.125 |
| Household Size | 0.159 | 0.088 | 0.228 | 1.807 | 0.038 | 0.836 | 1.196 |
| Urban Village-Native Status | 0.080 | 0.158 | 0.069 | 1.506 | 0.015 | 0.708 | 1.412 |
| Dependent | Unstandardized Coefficients | Standardized Coefficient | t | Sig. | Collinearity Statistics | |||
|---|---|---|---|---|---|---|---|---|
| B | Std. Error | Beta | Tolerance | VIF | ||||
| Scores for Male | Constant | 3.554 | 0.488 | 7.279 | 0.000 | |||
| A | 0.591 | 0.147 | 0.770 | 4.030 | 0.001 | 0.719 | 1.390 | |
| R | −0.366 | 0.153 | −0.426 | −2.389 | 0.033 | 0.825 | 1.212 | |
| M | −0.429 | 0.134 | −0.606 | −3.206 | 0.007 | 0.736 | 1.358 | |
| Scores for Female | Constant | 3.289 | 0.401 | 8.196 | 0.001 | |||
| A | −0.367 | 0.089 | −0.874 | −4.147 | 0.014 | 0.924 | 1.082 | |
| L | −0.130 | 0.098 | −0.342 | −2.325 | 0.036 | 0.615 | 1.627 | |
| Dependent | Unstandardized Coefficients | Standardized Coefficient | t | Sig. | Collinearity Statistics | |||
|---|---|---|---|---|---|---|---|---|
| B | Std. Error | Beta | Tolerance | VIF | ||||
| 18–35 Years of Age | Constant | 3.593 | 0.625 | 5.745 | 0.005 | |||
| R | −0.158 | 0.177 | −0.236 | −1.893 | 0.042 | 0.705 | 1.418 | |
| M | −0.517 | 0.141 | −0.907 | −3.658 | 0.022 | 0.797 | 1.255 | |
| 36–59 Years of Age | Constant | 1.860 | 0.273 | 6.804 | 0.002 | |||
| A | 0.059 | 0.062 | 0.306 | 1.953 | 0.034 | 0.911 | 1.098 | |
| L | 0.023 | 0.054 | 0.140 | 1.420 | 0.026 | 0.840 | 1.191 | |
| R | 0.133 | 0.077 | 0.624 | 2.711 | 0.012 | 0.705 | 1.418 | |
| 60 Years of Age or Older | Constant | 2.214 | 0.739 | 2.997 | 0.040 | |||
| R | −0.080 | 0.209 | −0.155 | −2.180 | 0.023 | 0.705 | 1.418 | |
| M | 0.178 | 0.167 | 0.410 | 3.866 | 0.046 | 0.797 | 1.255 | |
| Dependent | Unstandardized Coefficients | Standardized Coefficient | t | Sig. | Collinearity Statistics | |||
|---|---|---|---|---|---|---|---|---|
| B | Std. Error | Beta | Tolerance | VIF | ||||
| <RMB 3420/M | Constant | 2.402 | 0.228 | 10.551 | 0.000 | |||
| L | 0.164 | 0.045 | 0.669 | 3.649 | 0.022 | 0.840 | 1.191 | |
| M | −0.124 | 0.051 | −0.452 | −2.702 | 0.044 | 0.797 | 1.255 | |
| ≥RMB 3420/M | Constant | 2.866 | 0.595 | 4.815 | 0.009 | |||
| A | −0.017 | 0.134 | −0.061 | −4.123 | 0.008 | 0.911 | 1.098 | |
| L | −0.050 | 0.118 | −0.219 | −2.425 | 0.042 | 0.840 | 1.191 | |
| M | −0.038 | 0.135 | −0.149 | −2.281 | 0.039 | 0.797 | 1.255 | |
| Dependent | Unstandardized Coefficients | Standardized Coefficient | t | Sig. | Collinearity Statistics | |||
|---|---|---|---|---|---|---|---|---|
| B | Std. Error | Beta | Tolerance | VIF | ||||
| one-person households | Constant | 4.712 | 0.687 | 6.862 | 0.002 | |||
| L | −0.527 | 0.155 | −0.847 | −3.406 | 0.027 | 0.911 | 1.098 | |
| M | −0.022 | 0.155 | −0.038 | −0.142 | 0.894 | 0.797 | 1.255 | |
| two–three-person households | Constant | 0.734 | 0.429 | 1.709 | .163 | |||
| L | 0.467 | 0.097 | 0.709 | 4.825 | 0.008 | 0.911 | 1.098 | |
| R | 0.083 | 0.122 | 0.114 | 3.680 | 0.034 | 0.705 | 1.418 | |
| M | −0.060 | 0.097 | −0.098 | −2.921 | 0.048 | 0.797 | 1.255 | |
| four-or-more-person households | Constant | 3.285 | 0.844 | 3.890 | 0.018 | |||
| A | −0.258 | 0.167 | −0.608 | −3.543 | 0.018 | 0.840 | 1.191 | |
| R | −0.083 | 0.239 | −0.150 | −1.349 | 0.045 | 0.705 | 1.418 | |
| M | −0.097 | 0.191 | −0.205 | −2.508 | 0.038 | 0.797 | 1.255 | |
| Dependent | Unstandardized Coefficients | Standardized Coefficient | t | Sig. | Collinearity Statistics | |||
|---|---|---|---|---|---|---|---|---|
| B | Std. Error | Beta | Tolerance | VIF | ||||
| Yes | Constant | 3.239 | 1.353 | 2.395 | 0.075 | |||
| A | 0.123 | 0.305 | 0.197 | 4.405 | 0.006 | 0.911 | 1.098 | |
| M | −0.119 | 0.306 | −0.202 | −2.389 | 0.017 | 0.797 | 1.255 | |
| No | Constant | 2.114 | 0.475 | 4.451 | 0.011 | |||
| A | 0.166 | 0.107 | 0.505 | 4.653 | 0.005 | 0.911 | 1.098 | |
| R | −0.112 | 0.135 | −0.306 | −2.829 | 0.045 | 0.705 | 1.418 | |
Disclaimer/Publisher’s Note: The statements, opinions and data contained in all publications are solely those of the individual author(s) and contributor(s) and not of MDPI and/or the editor(s). MDPI and/or the editor(s) disclaim responsibility for any injury to people or property resulting from any ideas, methods, instructions or products referred to in the content. |
© 2023 by the authors. Licensee MDPI, Basel, Switzerland. This article is an open access article distributed under the terms and conditions of the Creative Commons Attribution (CC BY) license (https://creativecommons.org/licenses/by/4.0/).
Share and Cite
Shen, J.; Han, C.; Li, G.; Wang, X. Influencing Factors in Visual Preference Assessment of Redeveloped Urban Villages in China: A Case Study of Guangdong Province. Buildings 2023, 13, 612. https://doi.org/10.3390/buildings13030612
Shen J, Han C, Li G, Wang X. Influencing Factors in Visual Preference Assessment of Redeveloped Urban Villages in China: A Case Study of Guangdong Province. Buildings. 2023; 13(3):612. https://doi.org/10.3390/buildings13030612
Chicago/Turabian StyleShen, Jiamin, Chenping Han, Guanjun Li, and Xinyu Wang. 2023. "Influencing Factors in Visual Preference Assessment of Redeveloped Urban Villages in China: A Case Study of Guangdong Province" Buildings 13, no. 3: 612. https://doi.org/10.3390/buildings13030612