Abstract
Using industrial waste such as bottom ash (BA) is a potential alternative to using sand for tackling the current shortage of natural resources in the construction industry. This, along with the internal curing concept, enables proper curing inside and out, especially for low water-to-cement (w/c) ratio concrete, which has low permeability. The current work investigated the flow, compressive strength, heat flow, and microstructure characteristics (using an electron microprobe analysis, EPMA) to evaluate the use of internal curing BA as a sand-replacing material. Partial replacements of fine aggregate with BA were prepared in five different mortars (0, 20%, and 45%), with a fixed water-to-cement (w/c) ratio of 0.35. Consequently, the heat peak increased when using BA compared to the control mortar, indicating a higher hydration rate. The compressive strength of mortar with BA exceeded 50–60 MPa by 28 days. On the microstructural level, BA showed an increase in the volume fraction of small pores from 3 to 50 mm. Moreover, the content of Ca(OH)2 in the mortar with BA increased from 3 to 28 d by enhancing the hydration. This study shows the possibility of valorizing BA as a sand replacement in the internal curing of concrete with a low w/c ratio.
1. Introduction
In the contemporary construction industry, the use of “alternative aggregate” has become increasingly necessary due to shortages of construction aggregates. Accordingly, alternative aggregates are being developed with properties closer to natural aggregates, especially in terms of particle size. Based on the basic concept of using aggregate for concrete, aggregate distribution is significantly related to the maximization of the void between cement and other concrete ingredients, resulting in strength and durability. Alternative aggregates, on the other hand, are prepared by replacing the aggregate with other suitable types of materials. Several attempts to replace aggregate have been explored, such as with natural and artificial lightweight aggregates [1,2,3,4,5,6,7]. Moreover, industrial solid waste materials are mixed with natural aggregates (i.e., gravel and sand) to obtain well-graded particles, providing excellent concrete workability, thus offering a solution for the aggregate shortage. However, the aggregate-replacing materials (ARMs) should be carefully selected and proportioned to ensure superior properties (i.e., mixed aggregate concrete) over sand and gravel.
Recently, industrial wastes have been proven to be highly beneficial for the cement and construction sector. For example, waste materials, such as fly ash (FA) and bottom ash (BA), from coal-powered electricity-generating plants have attracted considerable attention. FA is widely used in the cement industry, whereas the current usage of BA is very limited on construction sites. The use of BA for partial sand replacement is well established in the literature. For instance, BA has a high porosity and a particle size close to that of aggregate due to the high temperature of coal burning. This leads to a weakening of mechanical properties [8]. On the other hand, this high porosity can become a positive feature once the BA is applied in internal curing. The pre-wetting of BA plays an important role in the internal curing [9,10,11,12].
A considerable amount of the literature is on the internal curing of BA [9,10,11,12,13,14,15,16,17,18,19,20,21,22,23,24,25,26,27]. The rough texture of BAs in concrete interlocks with the cement paste in the matrix [13,14,15,16,17], enhancing mechanical properties. However, other factors, such as the small pore sizes and low porosity of BA, have been reported to decrease the bond strength at the interface [18]. Regarding chemical reactions, some BAs are effective in activating the hydration reaction with appropriate and reactive chemical components [19]. The hydration product exhibits a pronounced void-filling ability in relation to the curing age. The desired compressive strength is achieved at a subsequent stage, which is consistent with the findings of another study [20]. The hydration products, such as C–S–H gel, of concrete with BAs appear at a mature stage, contributing to the strength of the concrete, owing to the presence of the reactive silica in the BAs that reacts with Ca(OH)2 [20]. Moreover, the appearance of the C–S–H gel improves the interparticle bonding and strength between the aggregate and cement paste [21]. Other tests have been conducted, such as isothermal conductivity calorimetry (ICC) [18,19,20,21,22,23,24]. Here, the cumulative heat or heat flow is detected during the testing period to observe the degree of chemical reaction, such as hydration. An increment in the heat peak is generally inferred to indicate the maximization of the potential degree of hydration, which depends on three inter-related aspects: (1) the appearance of a C–S–H gel [22,23,24,25], (2) moisture transport [17,19,21,22,23], and (3) setting time [24,25]. Many studies have observed that moisture transport typically maximizes the degree of hydration in the cement matrix when using another internal curing agent, such as superabsorbent polymers [17,19,23] and lightweight aggregates (LWAs) [5,6,7,8], resulting in a higher heat peak. Qin et al. [25] and Shen et al. [26] affirmed that the moisture content inside high-absorption materials (materials with a water desorption ability) protects the hydration process and macro-properties at a later stage of curing. The physical properties (compressive strength and microstructural features [27]) and chemical properties (heat flow of reaction and appearance of C–S–H gel) of the aggregate can be used to analyze the hydration reaction of the matrix. So far, however, there has been little discussion on the effect of internal curing BA on the properties of mortar or concrete.
This study, for the first time, promotes the use of BA as an alternative to sand, together with proper curing at the construction site. Two experimental series are listed. The effects of using two BAs as an internal curing agent on flow, compressive strength, heat of reaction, and microstructure characteristics are demonstrated in the first series using electron microprobe analysis (EPMA). Moreover, a selected BA is assessed via TGA curve and MIP tests to verify the hydration reaction and pore evolution over 28 d in the second series.
2. Materials and Methods
2.1. Materials
This study used ordinary Portland cement as the primary cementitious material. The studied aggregates were river sand, as well as bottom ash generated from bituminous coal (BA-I) and lignite coal combustion (BA-II). River sand, with a specific gravity of 2.60 under saturated surface dry conditions and an absorption of 1.15%, was used as the normal fine-weight aggregate in the mortar.
BA-I and BA-II were collected from a thermal power plant using bituminous and lignite coal as raw materials. The proportions of carbon in the BAs and their typical chemical compositions are listed in Table 1.

Table 1.
Chemical composition (wt. %) of highly absorptive lightweight aggregate.
The particle sizes of two BAs ranged from 75 μm to 4.75 mm (see Figure 1). Figure 2 shows the physical appearance and properties of the aggregates. Table 2 lists the compositions of BA-I and BA-II particles. BA-I and BA-II are porous and irregular in shape. Moreover, the desorption properties of the two BAs are shown in Figure 3 using vapor sorption isotherm.
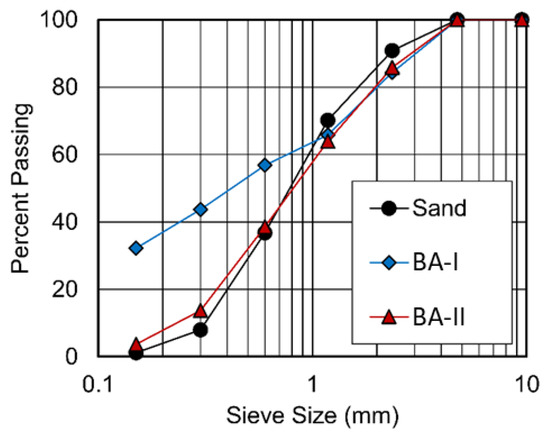
Figure 1.
Particle size distribution of river sand and two BAs.
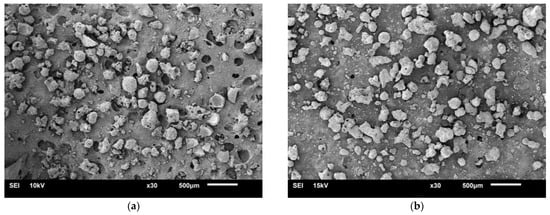
Figure 2.
Scanning electron microscopy image of a sample under 30× magnification: (a) BA-I and (b) BA-II.
Table 2.
Specific gravity of fine aggregate.
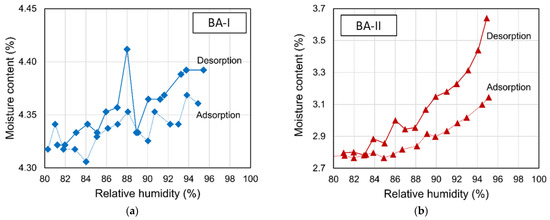
Figure 3.
Sorption isotherm of pre-wetted BAs in the chamber: (a) BA-I and (b) BA-II.
Table 2 lists the studied mix proportions with a fixed water-to-cement ratio (w/c) of 0.35, wherein the ratio of the volume of paste to the volume of aggregate was fixed at 60:40. HLWA particles were prepared with a moisture content higher than their water absorption value to evaluate the effect of the addition of water on the compressive strength and microstructure.
The water desorption of BAs at 94%RH () is used to calculate the amount of internal curing BA (), via Equation (1), proposed by Bentz and Snyder [11]:
where represents the cementitious content in kg/m3, is the chemical shrinkage (which has a constant value of 0.07 kg water to kg cement), and is the maximum degree of hydration that can be calculated, depending on the w/c ratio of the mixture. The = 0.36 (w/c) when the w/c ratio is ≤0.36. S is the degree of saturation of pre-wetted BA, which ranges from 0 to 1. For example, S = 1 when the moisture content equals the quantity of water absorption at 72 h following ASTM C1761-2015.
Then, the volume of BA () can be calculated via Equation (2),
where is the relative density under oven-dry conditions.
Next, the volume of sand () to be removed can be calculated via Equation (3), while is designed to be 400 kg/m3
Finally, the amount of sand to be replaced, expressed in %, can be calculated using Equation (4),
In determining the replacement level of BA, a greater desorption of BA-II with a mass of water release of 01573 is selected to evaluate the internal curing performance of BA. A replacement level of BA of 45% is output after careful calculation using Equations (1)–(4).
2.2. Mix Proportions
Five mortar mix designs were experimentally evaluated, including one reference mortar mix (No BA) and four mortars containing BAs, namely, 20BA-I, 45BA-I, 20BA-II, and 45BA-II—see Table 3.
Table 3.
Mix proportion of the mortar.
2.3. Experimental Methods
Two series of experimental programs were performed to assess the potential use of internal curing BA as a sand-replacing material. A former series of compressive strength, heat flow, and EPMA results was compared to verify the performances of the two Bas used as internal curing agents. Another series of TGA and pore structure results was used to identify the BA that provides the best performance, considering all test properties.
Series 1: Four test types were used, as follows: (1) workability; (2) compressive strength; (3) ICC; (4) microstructure characteristics using EPMA.
Workability was first tested via flow measurements in accordance with American Standard Testing and Materials (ASTM) standard C1437-15. The workability was measured immediately after mixing to determine the fresh properties of the mortar. Secondly, compressive strength tests were performed using a universal testing machine in accordance with ASTM C109-16. A cubic sample with dimensions of 50 mm × 50 mm × 50 mm at different curing ages (3, 7, and 28 d) sealed in a moist room was used for the test. Next, ICC was used to evaluate the heat of the chemical reaction of the mortar for 7 d. Typically, a TAM air heat conduction calorimeter contains eight channels, with reference and test samples. Herein, 100 g of mortar was prepared, poured into a bottle, sealed, and placed in a chamber for the ICC test. The initial heat was recorded 30 min after installation. Subsequent heat measurements were recorded as functions of time over 7 d. In the last test, mortar characteristics were analyzed using EPMA and presented as backscattered electron images and X-ray maps using wavelength-dispersive spectroscopy, so as to observe the development of the microstructure, the formation of the reaction product, and the distribution of key components in the reaction (Na, Ca, Si, and Al) at different curing periods.
Series 2: Two test types were used, as follows: (1) MIP; (2) TGA tests.
In this series, the crushed specimens from the compressive strength tests, with ages of 3 and 28 d, were submerged in acetone for 2 d and then vacuum-dried for another 3 d before the MIP and TGA tests were performed to study the pore structure and amount of Ca(OH)2 over time.
3. Results and Discussion
Series 1: We compared the effects of the internal curing of the two BAs on flow, compressive strength, heat flow, and microstructure characteristics using EPMA.
3.1. Initial Flow
Earlier studies [5,6,7,8] attempted to experimentally determine the increase in flow value of the mortar with BAs by investigating the flow with respect to time. Evidently, the mortar with BA was found to exhibit a higher initial flow value than the reference mortar (No BA). The initial flow values of all the mortar specimens are listed in Table 3. A comparison of the flow values between the No BA and other BA mixtures revealed an improvement after BA was used. No BA (92%) and 20BA-I (91%) had similar flow rates. The flow values of the rest of the mortars, such as 45BA-I, 20BA-II, and 45BA-II, were strikingly different from the flow values of 20BA-I when excess water was added to the BA (Table 3). This eventually leveled off at an initial value of 97%. The improvement in workability might be due to the pre-wetting procedure that was applied to the preparation with BA for internal curing. The lubrication effect may have influenced the surface of the pre-wetted sample, reducing the friction between each particle of fresh mortar.
3.2. Compressive Strength
As outlined in the Introduction, the compressive strength and microstructure of the mortar during the curing period govern the overall performance of the concrete. Hence, the effect of using BA in mortar during the curing period manifests in response to the ongoing hydration reaction. Overall, the compressive strengths of all mortars increased with the curing time (Figure 4). The compressive strength increased from day 3 to day 28. 20BA-II showed a higher compressive strength than No BA at all curing ages (3, 7, and 28 d). A higher compressive strength of 45 MPa was achieved at a curing age of 3 d, which could result in an enhancement in the microstructure and strength at curing ages of 7 d and beyond. Comparing BA-I mortar, BA-II mortar (20BA-II and 45BA-II), and No BA, the former’s strength over the entire curing period increased by approximately 20%, which was higher than that seen with the No BA mix. Moreover, it further improved from days 7 to 28. This may be due to the increment in degree of hydration, which is the main feature of effect curing. Moreover, the increases in the degree of hydration and the development of the microstructure are verified in Section 3.3 and Section 3.4.
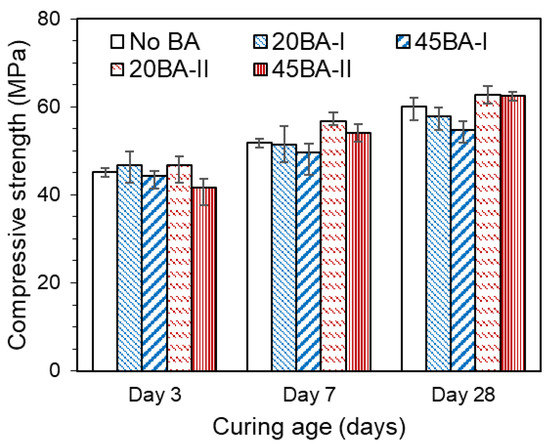
Figure 4.
Compressive strength of the mortar.
Thus, the use of BA at 20% resulted in a compressive strength of more than 45 MPa at all curing ages, which may have enhanced the overall performance of the mortar.
3.3. Heat Flow
To investigate the internal chemical reaction at a very early age, the heat of the reaction was observed using isothermal conduction calorimetry (ICC). Generally, the heat peak indicates the maximum degree of reaction and the maximum cumulative heat that is released from the reaction. The heat flow is usually derived from the relationship between the heat level (mW/g) and the testing period (h).
As shown by the heat flow curves (Figure 5), the heat peak is nearly the same across a testing period of 6.5–6.7 h. Among all mortars, No BA had the lowest heat peak, of approximately 1.2 mW/g, while the mortars with internal curing BA (i.e., 20BA-I, 45BA-I, 20BA-II, and 45BA-II) obtained higher peak heat values in a range of 2.9 to 3.4 mW/g. This may be due to the presence of internal curing water in the pre-wetted BA, which is applied to increase the degree of hydration, as in a previous study [18]. After that, the heat flow of all mixtures decreased and became steady from 72 h until the end of the testing period.
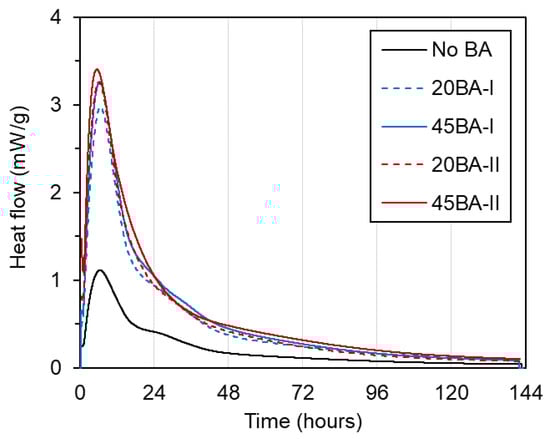
Figure 5.
Heat flow of the mortar.
3.4. Microstructure Characterization Using EPMA
Microstructural evolution and chemical reactions are interconnected. In this section, the local maps of Na, Ca, Si, and Al, which are the main elements in the reaction products, are displayed. The distributions of the elements at different curing ages (i.e., 3, 7, 14, 21, and 28 d) of No BA, 45BA-I, and 45BA-II are shown in Figure 6, Figure 7 and Figure 8. For the No BA mix (Figure 6), a homogenous distribution of Ca can be observed at the aggregate–mortar interface, while the overall intensity of Ca increased with the curing age (see the Ca level). Sand was distributed on the left, right, and bottom, which is consistent with the Si element map. The uniform distribution of Si implies its presence at the interface with sand, regardless of the curing age. On the other hand, Na was present at a relatively low energy level compared to the other key elements at all curing ages. In the paste area, the intensity of Si was very low compared to the fine aggregate area. As the curing period increased from 3 d to 7 d, the content of Si slightly changed from light blue to dark blue in color. These findings seem to agree with previous findings [21] that there are two stages in the microstructure evolution: (1) the modification of the microstructure and redistribution of the reaction product in the first 7 days; (2) the reorganization of the microstructure and redistribution of the reaction product after 7 d and up to 28 d. The high level of local Ca in the mortar with BA was observed at 7 d, after which the paste was uniform and homogenous in both BA-I and BA-II. In the early curing period (3 and 7 d), a significant change in Ca level was found at the interface of the paste and mortar in 45BA-I. However, the Ca levels in the interfacial zones of BA-I, Si, and Al stabilized with curing age. At a later curing age, a relatively high level of Ca distribution was evident, whereas sharp changes in Al level were observed after 28 d in the BA-II mortar. This indicates that the reaction product of mortar with BA may be used for further hydration reactions. The TGA results can be used to verify the effects of BA on the hydration reaction.
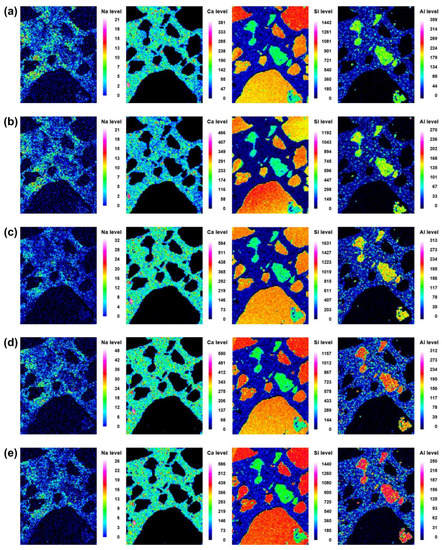
Figure 6.
Back-scattered scanning electron microscopy images and element map (Na, Ca, Si, and Al) of the interface between the aggregate and paste at different curing ages of reference mortar (No BA): (a) 3 d, (b) 7 d, (c) 14 d, (d) 21 d, and (e) 28 d.
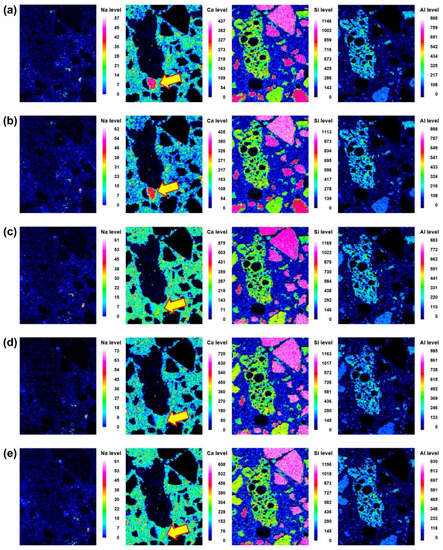
Figure 7.
Back-scattered scanning electron microscopy images and element map (Na, Ca, Si and Al) of the interface between the aggregate and paste at different curing ages of 45BA-I mortar: (a) 3 d, (b) 7 d, (c) 14 d, (d) 21 d, and (e) 28 d.
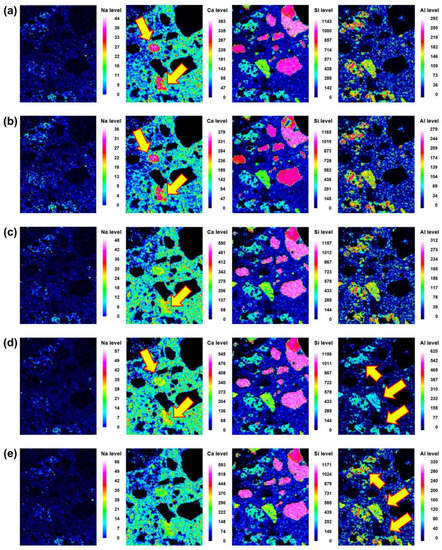
Figure 8.
Back-scattered scanning electron microscopy images and element map (Na, Ca, Si and Al) of the interface between the aggregate and paste at different curing ages of 45BA-II mortar: (a) 3 d, (b) 7 d, (c) 14 d, (d) 21 d, and (e) 28 d.
Series 2: Here, we sought to verify the effects of using a greater amount of BA for internal curing on chemical reactions using TGA tests and pore structure analyses via the MIP tests.
3.5. TGA Results
Through the thermogravimetric analysis (TGA), we observed the decomposition of the cement hydration product at 3 and 28 d, as shown in Figure 9a. The results can be used to determine the potential degrees of hydration and pozzolanic reactions. A previous study used TGA to measure the weight loss of specimens during the decomposition process at a maximum temperature of 1100 °C [24]. The amount of hydration products, particularly Ca(OH)2, can be quantified and used to describe the hydration of the specimens. As reported in a previous study [14], the weight loss between 410 and 460 °C can be used to estimate the Ca(OH)2 content. The change in weight loss between 3 d and 28 d was distinct, as shown in Figure 9b. At a later curing period (28 d), an increase in Ca(OH)2 was observed in the No BA mix, indicating an increment in the hydration reaction. Similarly, the Ca(OH)2 of mortar 45BA-II increased. This may have the same explanation as the increase in hydration resulting from the mechanism of internal curing, which is consistent with the findings of previous studies [14,19,28].
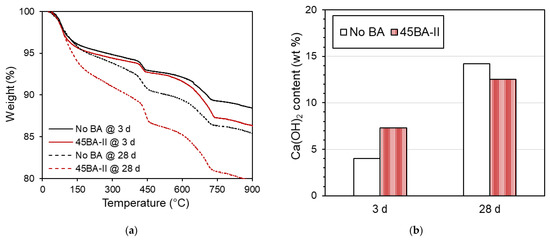
Figure 9.
Thermogravimetric analysis data of reference mortar and 45BA-II mortar at different curing ages of 3 d and 28. (a) TGA curve of No BA and BA45-II at 3 and 28 d. (b) Ca(OH)2 of No BA and BA45-II at 3 and 28 d.
3.6. MIP Results
The pore structure at different curing ages is another key feature that strongly influences microstructural development. The pore size distribution determined by MIP is illustrated with a maximum radius of approximately 6000–7000 nm. The pore structure of the matrix changed with time, as indicated by the smaller porosity and the reduction in the number of large pores. The pore size distribution and porosity of the No BA mix and 45BA-II at the ages of 3 and 28 d are shown in Figure 10.
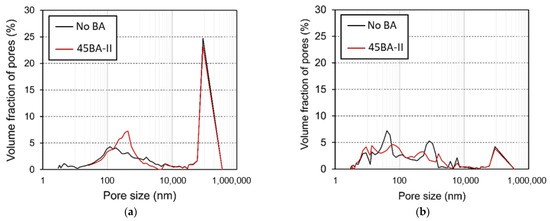
Figure 10.
Pore size distribution of reference mortar (No BA) and 45BA-II mortar at different curing ages: (a) 3 d and (b) 28 d.
In Figure 10, we compare the volume fractions of the two mixtures with large (1000–6000 nm) and small pores (smaller than 2 nm). After 3 d of curing (Figure 10a), No BA had a small dominant pore radius of approximately 100 nm, whereas H had a more uniformly distributed pore size of approximately 2000 nm. As shown in Figure 10b, R had a higher volume fraction of smaller pores than 45BA-II at 28 d. The pore structure analysis of the mortar with BA at 3 and 28 d indicates that the volume fraction of both types of large pores decreased, and that of the small pores increased in both No BA and 45BA-II (Figure 10). The reduction trend demonstrated amongst large pores indicates that the HLWA is the transport medium of moisture in the hydration of cement, and the void is filled with the hydration product. Moreover, the presence of small pores indicates that the mortar with BA has a more compact and dense structure, which is consistent with the findings of a previous study [27].
The difference between the pore size distributions in both mortars is crucial for determining the porosity of the lightweight aggregates incorporated in 45BA-II. The large pore entrances of BA-II should allow for the release of most of the absorbed water, as confirmed by desorption measurements (Figure 3). According to capillary pressure theory, the pore size distribution of a matrix plays an important role in autogenous shrinkage. The capillaries induce shrinkage because pores of different sizes consume different amounts of water. The use of BA could influence the distribution of excess water, thus leading to the refinement of the pore structure. The use of BA leads to a relatively rich water supply and a larger number of smaller pores forming over 28 d.
4. Conclusions
The following conclusions were drawn from the experimental results:
- The workability of mortar with BA increases due to the lubrication of the fresh mortar with pre-wetted BA, which greatly reduces the friction between each particle;
- The compressive strength of mortar with BA decreased with an increasing BA replacement level—the 28 d compressive strength exceeded 50 MPa. Moreover, the mortar with lignite BA achieved a higher compressive strength than the reference mortar;
- The heat peak of mortar with BA is found to be higher than that of the reference mortar due to the increase in heat release following hydration with BA;
- The high levels of CA in local areas of mortar with BA (both bituminous BA and lignite BA) present at early ages (3 d to 7 d) became uniformly distributed, with nearby interfaces at later ages. This may be due to the increase in the hydration reaction caused by BA;
- Compared with bituminous BA, lignite BA has a greater potential capacity to improve the workability, increase the hydration levels, and enhance the compressive strength;
- The degree of pore structure refinement in mortar with lignite BA was found to be greater than in mortar without BA.
In summary, lignite BA has great absorption and desorption capacities, which are beneficial to use in internal curing. Using BA as a sand-replacing material can help address the sand shortage problem in some areas. Additionally, the internal curing of BA is also beneficial for curing. Inadequate curing, which may be caused by individual construction workers who find the conventional curing method difficult to use, will be prevented. Moreover, from the environmental perspective, the heavy metals in BA will be addressed in the future.
Author Contributions
Conceptualization, P.M.; methodology, P.M. and W.K.; validation, P.M.; formal analysis, P.M.; investigation, P.M. and W.K.; resources, P.M. and W.K.; data curation, P.M.; writing—original draft preparation, P.M.; writing—review and editing, P.M.; visualization, P.M.; supervision, R.S.; project administration, P.M.; funding acquisition, P.M. and R.S. All authors have read and agreed to the published version of the manuscript.
Funding
The authors would like to acknowledge the Thailand Research Fund (TRF), the National Research Council of Thailand (NRCT) and King Mongkut’s University of Technology for their joint support through the Royal Golden Jubilee Ph.D. (RGJ-PHD) Program (grant number PHD58K0109 (PHD/0109/2558)).
Institutional Review Board Statement
Not applicable.
Informed Consent Statement
Not applicable.
Data Availability Statement
Not applicable.
Acknowledgments
The authors would like to acknowledge the Thailand Research Fund (TRF), the National Research Council of Thailand (NRCT) and King Mongkut’s University of Technology for their joint support through the Royal Golden Jubilee Ph.D. (RGJ-PHD) Program (grant number PHD58K0109 (PHD/0109/2558)) and acknowledge the Electricity Generating Authority of Thailand (EGAT) and the BLCP power plant in our work providing the bottom ash.
Conflicts of Interest
The author Pochpagee Markpiban is an employee of MDPI; however, she does not work for the journal Buildings at the time of submission and publication. All remaining authors declare no conflict of interest.
References
- Muralitharan, R.S.; Ramasamy, V. Development of lightweight concrete for structural applications. J. Struct. Eng. 2017, 44, 336–344. [Google Scholar]
- Akcay, B.; Tasdemir, M.A. Effect of distribution of lightweight aggregates on internal curing of concrete. Cem. Concr. Com. 2010, 32, 611–616. [Google Scholar] [CrossRef]
- Assaad, J.J.; Mikhael, C.; Hanna, R. Recycling of waste expanded polystyrene concrete in lightweight sandwich panels and structural applications. Clean. Mater. 2022, 4, 100095. [Google Scholar] [CrossRef]
- Yang, K.H.; Kim, G.H.; Choi, Y.H. An initial trial mixture proportioning procedure for structural lightweight aggregate concrete. Construct. Build. Mat. 2014, 55, 431–439. [Google Scholar] [CrossRef]
- Lee, H.K.; Kim, H.K.; Hwang, E.A. Utilization of power plant bottom ash as aggregates in fiber-reinforced cellular concrete. Wast. Manag. 2010, 30, 274–284. [Google Scholar] [CrossRef] [PubMed]
- Suksiripattanapong, C.; Krosoongnern, K.; Thumrongvut, J.; Sukontasukkul, P.; Horpibulsuk, S.; Chindaprasirt, P. Properties of cellular lightweight high calcium bottom ash-portland cement geopolymer mortar. Case Stud. Constr. Mater. 2020, 12, e00337. [Google Scholar] [CrossRef]
- Damene, Z.; Goual, M.S.; Houessou, J.; Dheilly, R.M.; Goullieux, A.; Quéneudec, M. The use of southern Algeria dune sand in cellular lightweight concrete manufacturing: Effect of lime and aluminium content on porosity, compressive strength and thermal conductivity of elaborated materials. Eur. J. Environ. Civ. Eng. 2016, 22, 1273–1289. [Google Scholar] [CrossRef]
- Agostini, F.; Davy, C.A.; Skoczylas, F.; Dubois, T. Effect of microstructure and curing conditions upon the performance of a mortar added with treated sediment aggregates (TSA). Cem. Concr. Res. 2010, 40, 1609–1619. [Google Scholar] [CrossRef]
- Bentur, A.; Igarashi, S.; Kovler, K. Prevention of autogenous shrinkage in high-strength concrete by internal curing using wet lightweight aggregates. Cem. Concr. Res. 2001, 31, 1587–1591. [Google Scholar] [CrossRef]
- Weber, S.; Reinhardt, H.W. A new generation of high performance concrete: Concrete with autogenous curing. Adv. Cem. Based Mater. 1997, 6, 59–68. [Google Scholar] [CrossRef]
- Bentz, D.P.; Snyder, K.A. Protected paste volume in concrete: Extension to internal curing using saturated lightweight fine aggregate. Cem. Concr. Res. 1999, 29, 1863–1867. [Google Scholar] [CrossRef]
- Cusson, D.; Hoogeveen, T. Internal curing of high-performance concrete with pre-soaked fine lightweight aggregate for prevention of autogenous shrinkage cracking. Cem. Concr. Res. 2008, 38, 757–765. [Google Scholar] [CrossRef]
- Wasserman, R.; Bentur, A. Interfacial interactions in lightweight aggregate concretes and their influence on the concrete strength. Cem. Concr. Compos. 1996, 18, 67–76. [Google Scholar] [CrossRef]
- Scrivener, K.L.; Crumbie, A.K.; Laugesen, P. The interfacial transition zone (ITZ) between cement paste and aggregate in concrete. Interface Sci. 2004, 12, 411–421. [Google Scholar] [CrossRef]
- Larbi, J.A. Microstructure of the interfacial zone around aggregate particles in concrete. Heron 1993, 38, 1–69. [Google Scholar]
- Lo, T.Y.; Cui, H.Z. Effect of porous lightweight aggregate on strength of concrete. Mater. Lett. 2004, 58, 916–919. [Google Scholar] [CrossRef]
- Lo, T.Y.; Cui, H.Z. Spectrum analysis of the interfacial zone of lightweight aggregate concrete. Mater. Lett. 2004, 58, 3089–3095. [Google Scholar] [CrossRef]
- Kim, H.K.; Lee, H.K. Hydration kinetics of high strength concrete with untreated coal bottom ash for internal curing. Cem. Concr. Compos. 2018, 91, 67–75. [Google Scholar] [CrossRef]
- Gao, X.; Yuan, Q.L.; Yu Brouwers, H.J.H. Characterization and application of municipal solid waste incineration (MSWI) bottom ash and waste granite powder in alkali activated slag. J. Clean. Prod. 2017, 164, 410–419. [Google Scholar] [CrossRef]
- Pa, S.; Shariq, M.; Abbas, H.; Pandit, A.K.; Masood, A. Strength characteristics and microstructure of hooked-end steel fiber reinforced concrete containing fly ash, bottom ash and their combination. Constr. Build. Mater. 2020, 247, 118530. [Google Scholar] [CrossRef]
- Fang, G.; Zhang, M. The evolution of interfacial transition zone in alkali-activated fly ash-slag concrete. Cem. Concr. Res. 2020, 129, 105963. [Google Scholar] [CrossRef]
- Tu, W.; Zhu, Y.; Fang, G.; Wang, X.; Zhang, M. Internal curing of alkali-activated fly ash–slag pastes using superabsorbent polymer. Cem. Concr. Res. 2019, 116, 179–190. [Google Scholar] [CrossRef]
- Pane, I.; Hansen, W. Investigation of blended cement hydration by isothermal calorimetry and thermal analysis. Cem. Concr. Res. 2005, 35, 1155–1164. [Google Scholar] [CrossRef]
- Lefever, G.; Tsangouri, E.; Snoeck, D.; Aggelis, D.G.; Belie, N.D.; Vlierberghe, S.V.; Hemelrijck, D.V. Combined use of superabsorbent polymers and nanosilica for reduction of restrained shrinkage and strength compensation in cementitious mortars. Constr. Build. Mater. 2020, 251, 118966. [Google Scholar] [CrossRef]
- Shen, P.; Lu, L.; Wang, F.; He, Y.; Hu, S.; Lu, J.; Zheng, H. Water desorption characteristics of saturated lightweight fine aggregate in ultra-high performance concrete. Cem. Concr. Com. 2020, 106, 103456. [Google Scholar] [CrossRef]
- Qin, X.; Shen, A.; Lyu, Z.; Shi, L.; Yang, J.; Liu, H. Research on water transport behaviors and hydration characteristics of internal curing pavement concrete. Constr. Build. Mater. 2020, 248, 118714. [Google Scholar] [CrossRef]
- Elsharief, A.; Cohen, M.D.; Olek, J. Influence of lightweight aggregate on the microstructure and durability of mortar. Cem. Concr. Res. 2005, 35, 1368–1376. [Google Scholar] [CrossRef]
- Kim, H.K.; Ha, K.A.; Lee, H.K. Internal-curing efficiency of cold-bonded bottom ash aggregate for high-strength mortar. Constr. Build. Mater. 2016, 126, 1–8. [Google Scholar] [CrossRef]


Disclaimer/Publisher’s Note: The statements, opinions and data contained in all publications are solely those of the individual author(s) and contributor(s) and not of MDPI and/or the editor(s). MDPI and/or the editor(s) disclaim responsibility for any injury to people or property resulting from any ideas, methods, instructions or products referred to in the content. |
© 2023 by the authors. Licensee MDPI, Basel, Switzerland. This article is an open access article distributed under the terms and conditions of the Creative Commons Attribution (CC BY) license (https://creativecommons.org/licenses/by/4.0/).