Article

Design of Rural Human Settlement Unit with the Integration of Production-Living-Ecology of China Based on Dynamic Emergy Analysis

1
School of Architecture and Urban Planning, Shandong Jianzhu University, Jinan 250101, China
2
School of Art, Shandong Management University, Jinan 250357, China
3
Shandong Co-innovation Center of Green Building, Shandong Jianzhu University, Jinan 250101, China
4
School of Art, Shandong Jianzhu University, Jinan 250101, China
*
Author to whom correspondence should be addressed.
Buildings 2023, 13(3), 618; https://doi.org/10.3390/buildings13030618
Submission received: 6 February 2023 / Revised: 20 February 2023 / Accepted: 24 February 2023 / Published: 26 February 2023
(This article belongs to the Special Issue Building Energy-Saving Technology)

Abstract

:
It is of great theoretical and practical significance to optimize and improve the design of rural human settlement units through system ecology analysis based on emergy evaluation indices. From the perspective of system ecology, the rural living environment system is multivariate and complicated, with strong correlations and obscure boundaries between levels. Therefore, the definition of a rural human settlement unit in China is proposed in this research and can be divided into three scales: the microcosmic scale, mesoscale, and macroscopic scale. This research adopted a new method for the design of rural human settlement units by adopting emergy as a common dimension in order to solve the problem of dimensionality disunity between resource environment elements and society economy elements. Through the establishment of the static emergy analysis model and dynamic emergy prediction model, qualitative and quantitative analysis approaches of the rural human settlement unit were combined. According to the design orientations of industry-invigorative, environment-friendly, and ecology-balanced, corresponding with production-living-ecology integration, emergy evaluation indices including the emergy self-sufficiency ratio, emergy investment ratio, net emergy yield ratio, environmental load ratio, and emergy sustainable indices were calculated and predicted by means of system dynamics simulation. The dynamic emergy prediction results showed that the emergy self-sufficiency ratio and emergy sustainable indices basically presented a decreasing tendency, from 0.34 to 0.15 and from 0.76 to 0.57, respectively, with the passage of time; the values of the emergy investment ratio, net emergy yield ratio, and environmental load ratio basically presented an increasing tendency, from 2.13 to 2.78, from 1.66 to 2.12, and from 2.23 to 3.61, respectively, with the passage of time. In practice, the evaluation method based on the emergy analysis of the technical strategies and spatial arrangements of the rural human settlement unit can provide data support for designing standards, planning guidelines, and creating constructional instructions for the rural living environment of China.

1. Introduction

Since the new socialist countryside construction policy was proposed in China, local governments have paid great attention to the construction of rural living environments and have advanced fruitful pilot demonstration projects [1,2]. Thus, significant progress has been made in terms of the urban development in rural areas and the construction of new rural communities [3,4]. Since the strong promotion of local government was the main approach to accelerate the pace of rural human settlement construction, we found few research or reports in the academic sector [5]. Most of the research focused on the relationship between human and land utilization [6]. The existing construction pattern blindly imitates the pattern of urban human settlement construction, which has a lack of adequate scientific and specific guidance and leads to the relatively premature advance of the construction practice process and a series of ecological issues [7,8]. The grim situation of the rural ecological environment can be specifically summarized as the disequilibrium utilization of natural resources, serious rural environmental pollution, and the weak ecological awareness of rural construction.
In the human settlement research domain, urban human settlement as the research object has been more popular than rural human settlement, and policy making, as the research hotspot, has been seen as more interesting than construction design. Xue et al. [9] conducted an analysis of the temporal and spatial changes in the suitability and characteristics of urban human settlements in which the urban real human settlements index and pseudo-human settlements index was proposed. These research results can help decision-makers to identify the key factors influencing urban human settlements and make better decisions. Musakwa [10] presented data on the land and spatially integrated urban human settlements in strategic locations in South Africa. These data were used to facilitate decision-making on the land reform of human settlements as well as requirements for land-use management. Researchers of rural human settlements usually pay attention to three major areas: spatial utilization [11,12], agricultural production [13,14], and economic activities [15,16]. In conclusion, most social scientists have considered rural human settlement as a whole for qualitative results, other than hierarchic systems with explicit boundaries and detailed energy/mass circulation. Hence, the application of system ecology analysis and the conception of unitization for quantitative technical results should be considered in further studies.
The purpose of rural living environment optimization is to solve the practical problems facing human settlement quality and to provide reasonable territory design strategies and technological update methods in order to promote the “beautiful countryside” construction and the creation of a modern livable rural environment. “Promoting Beautiful Countryside” means integrating ecological construction by vigorously conducting afforestation activities, continuously improving the rural living environment, focusing on toilet upgrading and garbage treatment, accelerating the long-term mechanism for household sewage treatment, and building an ecological environment with a blue sky, green land, green mountains, and clean water [17]. The key measures for realizing rural revitalization are also in connection with the advanced and scientific design of rural human settlements, with strong maneuverability in protecting the natural pastoral style, continuing the rural regional culture, and elevating the quality of the rural living environment. Agricultural production, the living habitat, and the ecological environment are the three important components of the rural living environment system, among which there are mutualistic symbiotic relationships [18]. Present research on “production-living-ecological” are usually focused on the coupling coordination analysis of rural space [19,20,21]. Although the “production-living-ecological” concept contains research categories from different disciplines, it is necessary to combine the production, living, and ecological systems for interdisciplinary research to propose appropriate academic theories to guide the construction of rural human settlements and living environments. A framework of water consumption prediction and optimal allocation for “production-living-ecology” was put forward in the paper by Xu et al. [22]; taking the Zhangye Basin as an example, the water consumption for “production-living-ecology” was predicted and optimized in three scenarios: an economic development priority scenario, an environmentally sustainable development scenario, and a conventional development scenario. The work of Liao et al. [23] took the administrative village as the evaluation object, conducting an evaluation system from the angle of “production-living-ecology” optimization, and the ordered weighted average operator was introduced to weigh the functional potential of low-slope hills in a cultivated land protection ecological protection preference and urbanization development in Dali City. In another work, the value evaluation and classification model of land use function was established by Zou et al. [24] in rural land use planning and management in China based on the function of “production-living-ecology”. The disunity of the evaluation system and the variableness of the evaluation criteria are common characteristics in existing studies. Introducing common indices for quantitative evaluation based on the system ecology theory for the “production-living-ecological” analysis of rural human settlement can effectively remedy the disunity and variableness issue.
To study the relationship between the natural environment and human society, scholars conducted quantitative research on the limited resources, considering energy as the common scale, which is confined to the same form of energy analysis [25,26]. Different types of energy are derived from different sources, where there is a fundamental difference between energy quality and value. Thus, incomparability between different forms of energy occurred in the quantitative research on the sustainable development of the resource environment and social economic system, defined as an organic community [27]. Emergy analysis and evaluation is the core method of system ecology research [28]. Considering the fact that different types and sources of energy possess different energy qualities, which cannot be directly compared and calculated, Odum proposed the conception of “solar emergy” as a metric to break through the barrier of different energy qualities in traditional energy analytical methods [29]. Emergy creates a uniform dimension of energy flow, mass flow, and information flow, providing a new perspective for the quantification of essential data in the quantitative evaluation and understanding of the relevance of the resource environment system and social economy system [30].
Research findings related to the emergy analysis of ecological systems recently concentrated on agricultural systems [31,32] and production, such as vegetable production [33], crop production [34], and green tea production [35]. As for the rural human settlement and living environment field, there are two research orientations: technical strategy and cultural feature. A diachronic emergy method was proposed by Zhu et al. [36] to integrate the social development model, social-ecological factors, and emergy assessment into the environmental history research framework. Some suggestions for the sustainable eco-tourism model, eco-agriculture technology, and social-ecological integrated governance were established. Methods for standardizing natural and economic inputs were developed by Falkowski et al. [37] to allow for a more comprehensive evaluation of the system. Emergy values for the transfer of traditional ecological knowledge, maintenance, and creation were assessed at the individual and community levels. The findings highlighted the importance of protecting the sustainability of knowledge transfer systems that produce traditional ecological knowledge and developing a practical education system. Table 1 shows the existing methods for comprehensive sustainability assessments with evaluation indicators on rural human settlements.
From the perspective of system ecology, the rural living environment system is multivariate and complicated, with strong correlations and obscure boundaries between all levels of the system. Drawing lessons from the concept of a “unit”, with dual properties that are systematic and self-contained, the definition of a rural human settlement unit of China was proposed which can be divided into three scales: the microcosmic scale (courtyard unit), mesoscale (cluster unit), and macroscopic scale (village unit). Energetic flow diagrams were drawn and the total energy inputs/outputs of each scale were calculated through static emergy analysis. According to the design orientations of industry-invigorative, environment-friendly, and ecology-balanced, corresponding with production-living-ecology integration for different spatial arrangements and technical strategies, respectively, emergy evaluation indices including the emergy self-sufficiency ratio (ESR), emergy investment ratio (EIR), net emergy yield Ratio (EYR), environmental load ratio (ELR), and emergy sustainable indices (ESI) were analyzed and predicted by means of a system dynamics simulation. The technical framework of this research is shown in Figure 1.

2. Methodology

2.1. Conception and Hierarchy Division of the Rural Human Settlement Unit

2.1.1. Rural Human Settlement Unit with the Integration of Production-Living-Ecology

It is necessary to establish a series of appropriate social organization patterns, metabolic technology systems, and spatial layout frameworks to support and coordinate with the sustainable development process of the rural human settlement. A “unit” is the result of the conceptualization of this appropriate scheme [47]. A unit is a self-contained system with clear boundaries, complete structure, proper scale, and specific function, which operates independently. Moreover, the element configuration is function-oriented, and the elements are mutually associated, interactive, and restrictive in a certain manner, forming an organic and orderly integrated unit. The most important feature of the unit is hierarchical, indicating that a smaller-scale unit is generally subordinate to a larger-scale unit, and the existence of a minimum unit that cannot be divided [48].
Due to the accelerating urbanization process in recent decades, the decline of the countryside has become an unavoidable objective reality, leaving dilapidated village houses and facilities as well as deserted farmland. Based on this, the government has been vigorously promoting the mergence and relocation of the villages, causing a great change in the rural human settlement form in China. In addition, capital injection has also led to unprecedented diversity in the form and substance of the countryside, such as the emergence of leisure and sightseeing agricultural parks and agricultural residences integrated with enterprises [49]. On the other hand, the inherent attribute that determines the potential scale hierarchy of the unit can be as small as a single courtyard or as large as a whole village. For this reason, unitary construction is the most appropriate analyzing approach for the classification, organization, and conceptualization of rural human settlements. Different from highly industrialized and globalized cities, rural areas are closely related to the local geography, climate, culture, and resource environment, which are so diversified that they cannot be summarized by applying a standardized formula. The unitary construction of rural human settlements means that on the basis of universal research, strategies must be generated according to the actual conditions, which is the realistic pathway necessary to implement the sustainable development of rural human settlements and the living environment [50].
Unitization is the ecological strategy frame of the rural human settlement. Based on the role definition mentioned above, rural areas must adopt innovative production-living-ecology integration strategies to reduce their dependence and impact on the local environment. The most effective and direct mode is to establish each functional unit according to ecological principles and minimize or even eliminate the input of resources/energy and the output of waste through complementary symbiosis and integrated coordination among elements in the unit. In this interaction mechanism, the unit of the smallest scale (basic unit) with a relatively simple structure still needs external material transport and waste elimination. The main function of the smallest scale unit is to satisfy the requirement of people’s activities in the unit. As the collection of the smallest scale units, the unit of intermediate scale with better functional characteristics needs to not only satisfy the requirement of people’s activities but also improve the overall operational efficiency of the unit and reduce the input and output of external substances. The largest scale unit consists of intermediate scale units with various functional patterns and complementary relationships, which can reasonably achieve self-sufficiency to the maximum extent, completely handle self-generated waste, and realize independence.
According to the current investigations of the rural living environment, this research selected and trimmed statistical data from the 2017–2020 yearbook of China, including natural information (altitude, water resources, solar radiation, air temperature, precipitation, etc.), economy information (GNP, tourist income, investment, energy consumption, etc.), social information (demographic change, salary income, social goods and services consumption, etc.), and ecological information (construction land change, water and soil loss, waste emission and disposal, etc.), to establish the typical rural human settlement unit model of China. Considering the circulation mode of mass and energy among the agricultural production, living habitat, and ecological environment, with different emphasis, the rural human settlement unit can be divided into three scales on basis of the “unitization” conception (Figure 2). The hierarchy division of the rural human settlement unit is according to the ecological self-circulation radius; the radius of the macroscopic scale is 6.25 km, which is approximately the village scale, then the mesoscale scale and microcosmic scale are defined by the rural living habitat radius, respectively [51].
  • Microcosmic scale (courtyard unit)
  • Mesoscale (cluster unit)
  • Macroscopic scale (village unit)
Figure 2. Schematic diagram of the hierarchical division of the rural human settlement unit. (a) Courtyard unit; (b) Cluster unit; and (c) Village unit.
Buildings 13 00618 g002

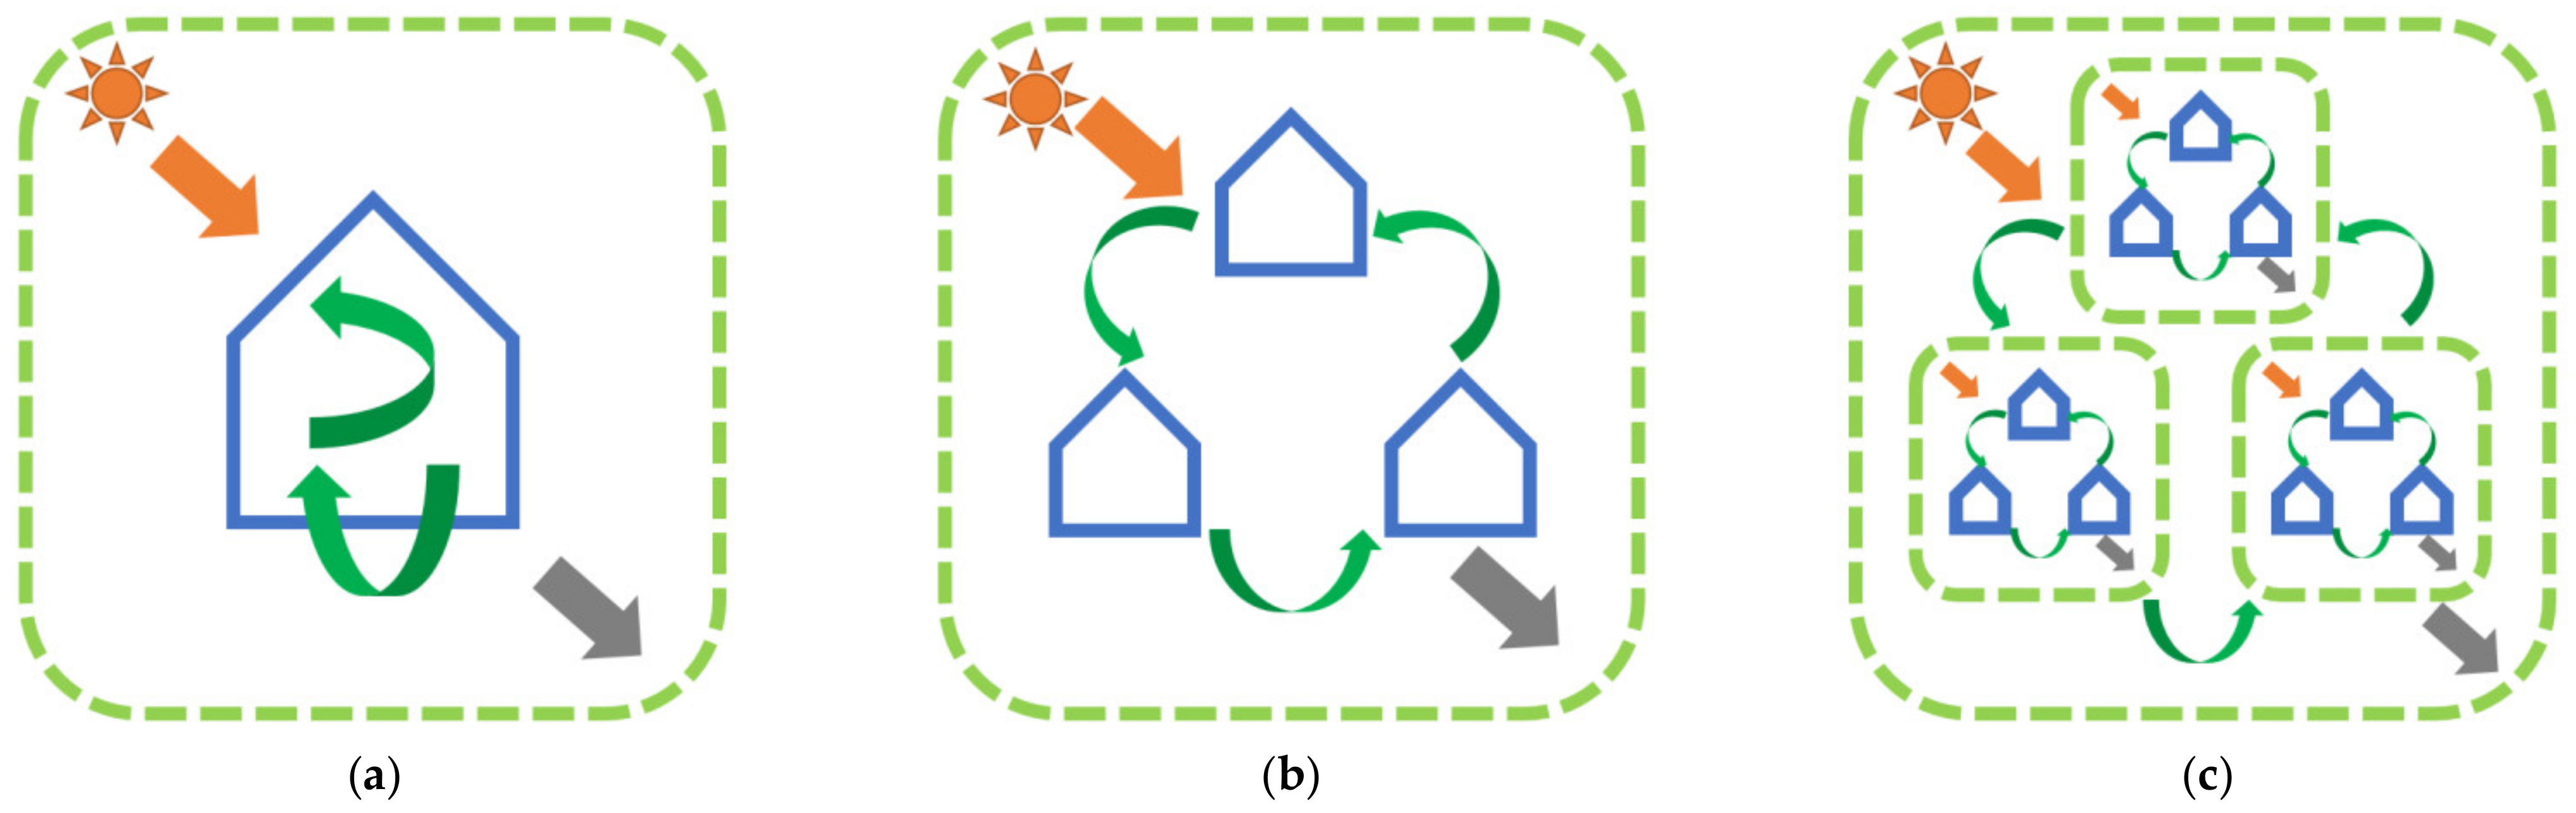
2.1.2. The Hierarchy Division of the Rural Human Settlement Unit

(1) The element composition and system circulation of the microcosmic scale (courtyard unit)
The courtyard unit is the basic unit of life and production. Since the planting area is relatively small, fertilizer can be supplied from the biogas residue generated by the biogas digester. Scattered planting and breeding provide food for people, and agricultural waste such as the remaining stems and leaves can be utilized as fodder for poultry and livestock. The feces of poultry and livestock along with the organic refuse and fecal waste generated by people are the raw materials put into the biogas digester; water resources are mainly from external transportation and rainwater collection. The water resources from external transportation should experience a step utilization process, while the water resources from the rainwater collection can be used as domestic water in daily life and planting water. Eventually, the water resources will flow into the sewage purifier for filtration before gradually seeping into the underground. The energy demand includes electric energy and heat energy; electricity resources are mainly from external transportation and photovoltaic power generation. Through the fermentation of the household biogas digester and the continuous flow of nutrients, biogas can be continuously obtained for cooking and a solar water heater can provide hot water for daily washing. The energetic flow diagram according to the element composition and system circulation of the courtyard unit is shown in Figure 3.
(2) The element composition and system circulation of the mesoscale (cluster unit)
The cluster unit consists of several courtyard units. In addition, the cluster unit contains large areas of agricultural production space, road transportation infrastructure, and public space outside the living area. Centralized agricultural production activities such as crop planting and livestock breeding can be engaged in the agricultural production space. Feces from the centralized breeding along with the organic refuse and fecal waste generated by people are collected and discharged into the biogas field for biogas, biogas residue, and biogas slurry production through fermentation. Part of the biogas is directly supplied to the dwellers for cooking, and the other part is transferred to the biogas generator as raw material and converted into electricity. The biogas residue and biogas slurry are then returned to the farmland as fertilizer. The domestic sewage is discharged into the constructed wetland through a sewage network, which can not only purify the water source but also create a public leisure landscape in the unit. The impounding reservoir collects and stores rainwater within a certain range in the cluster unit as water for agricultural plating and greening, which can save a large part of the water resources. The energetic flow diagram according to the element composition and system circulation of the cluster unit is shown in Figure 4.
(3) The element composition and system circulation of the macroscopic scale (village unit)
Compared with the cluster units, the village unit is larger in scale, more diversified in production factors, and has great differences in spatial form. In this unit, the living community is formed by high-density residential areas in which the agricultural production space basically does not exist. The agricultural production space in the form of a modern agriculture park owns plenty of biomass resources, due to its main responsibility of large-scale planting and breeding along with its partial tourism and manufacturing function. Meanwhile, a medium-sized biogas field and biogas generator are not capable of meeting the requirements of human settlement, so a multifunctional biogas factory is selected for energy supplement. The circulation of the village unit consists of two systems: a living system in the high-density community and a production system in the modern agricultural park. The energetic flow diagram according to the element composition and system circulation of the village unit is shown in Figure 5.

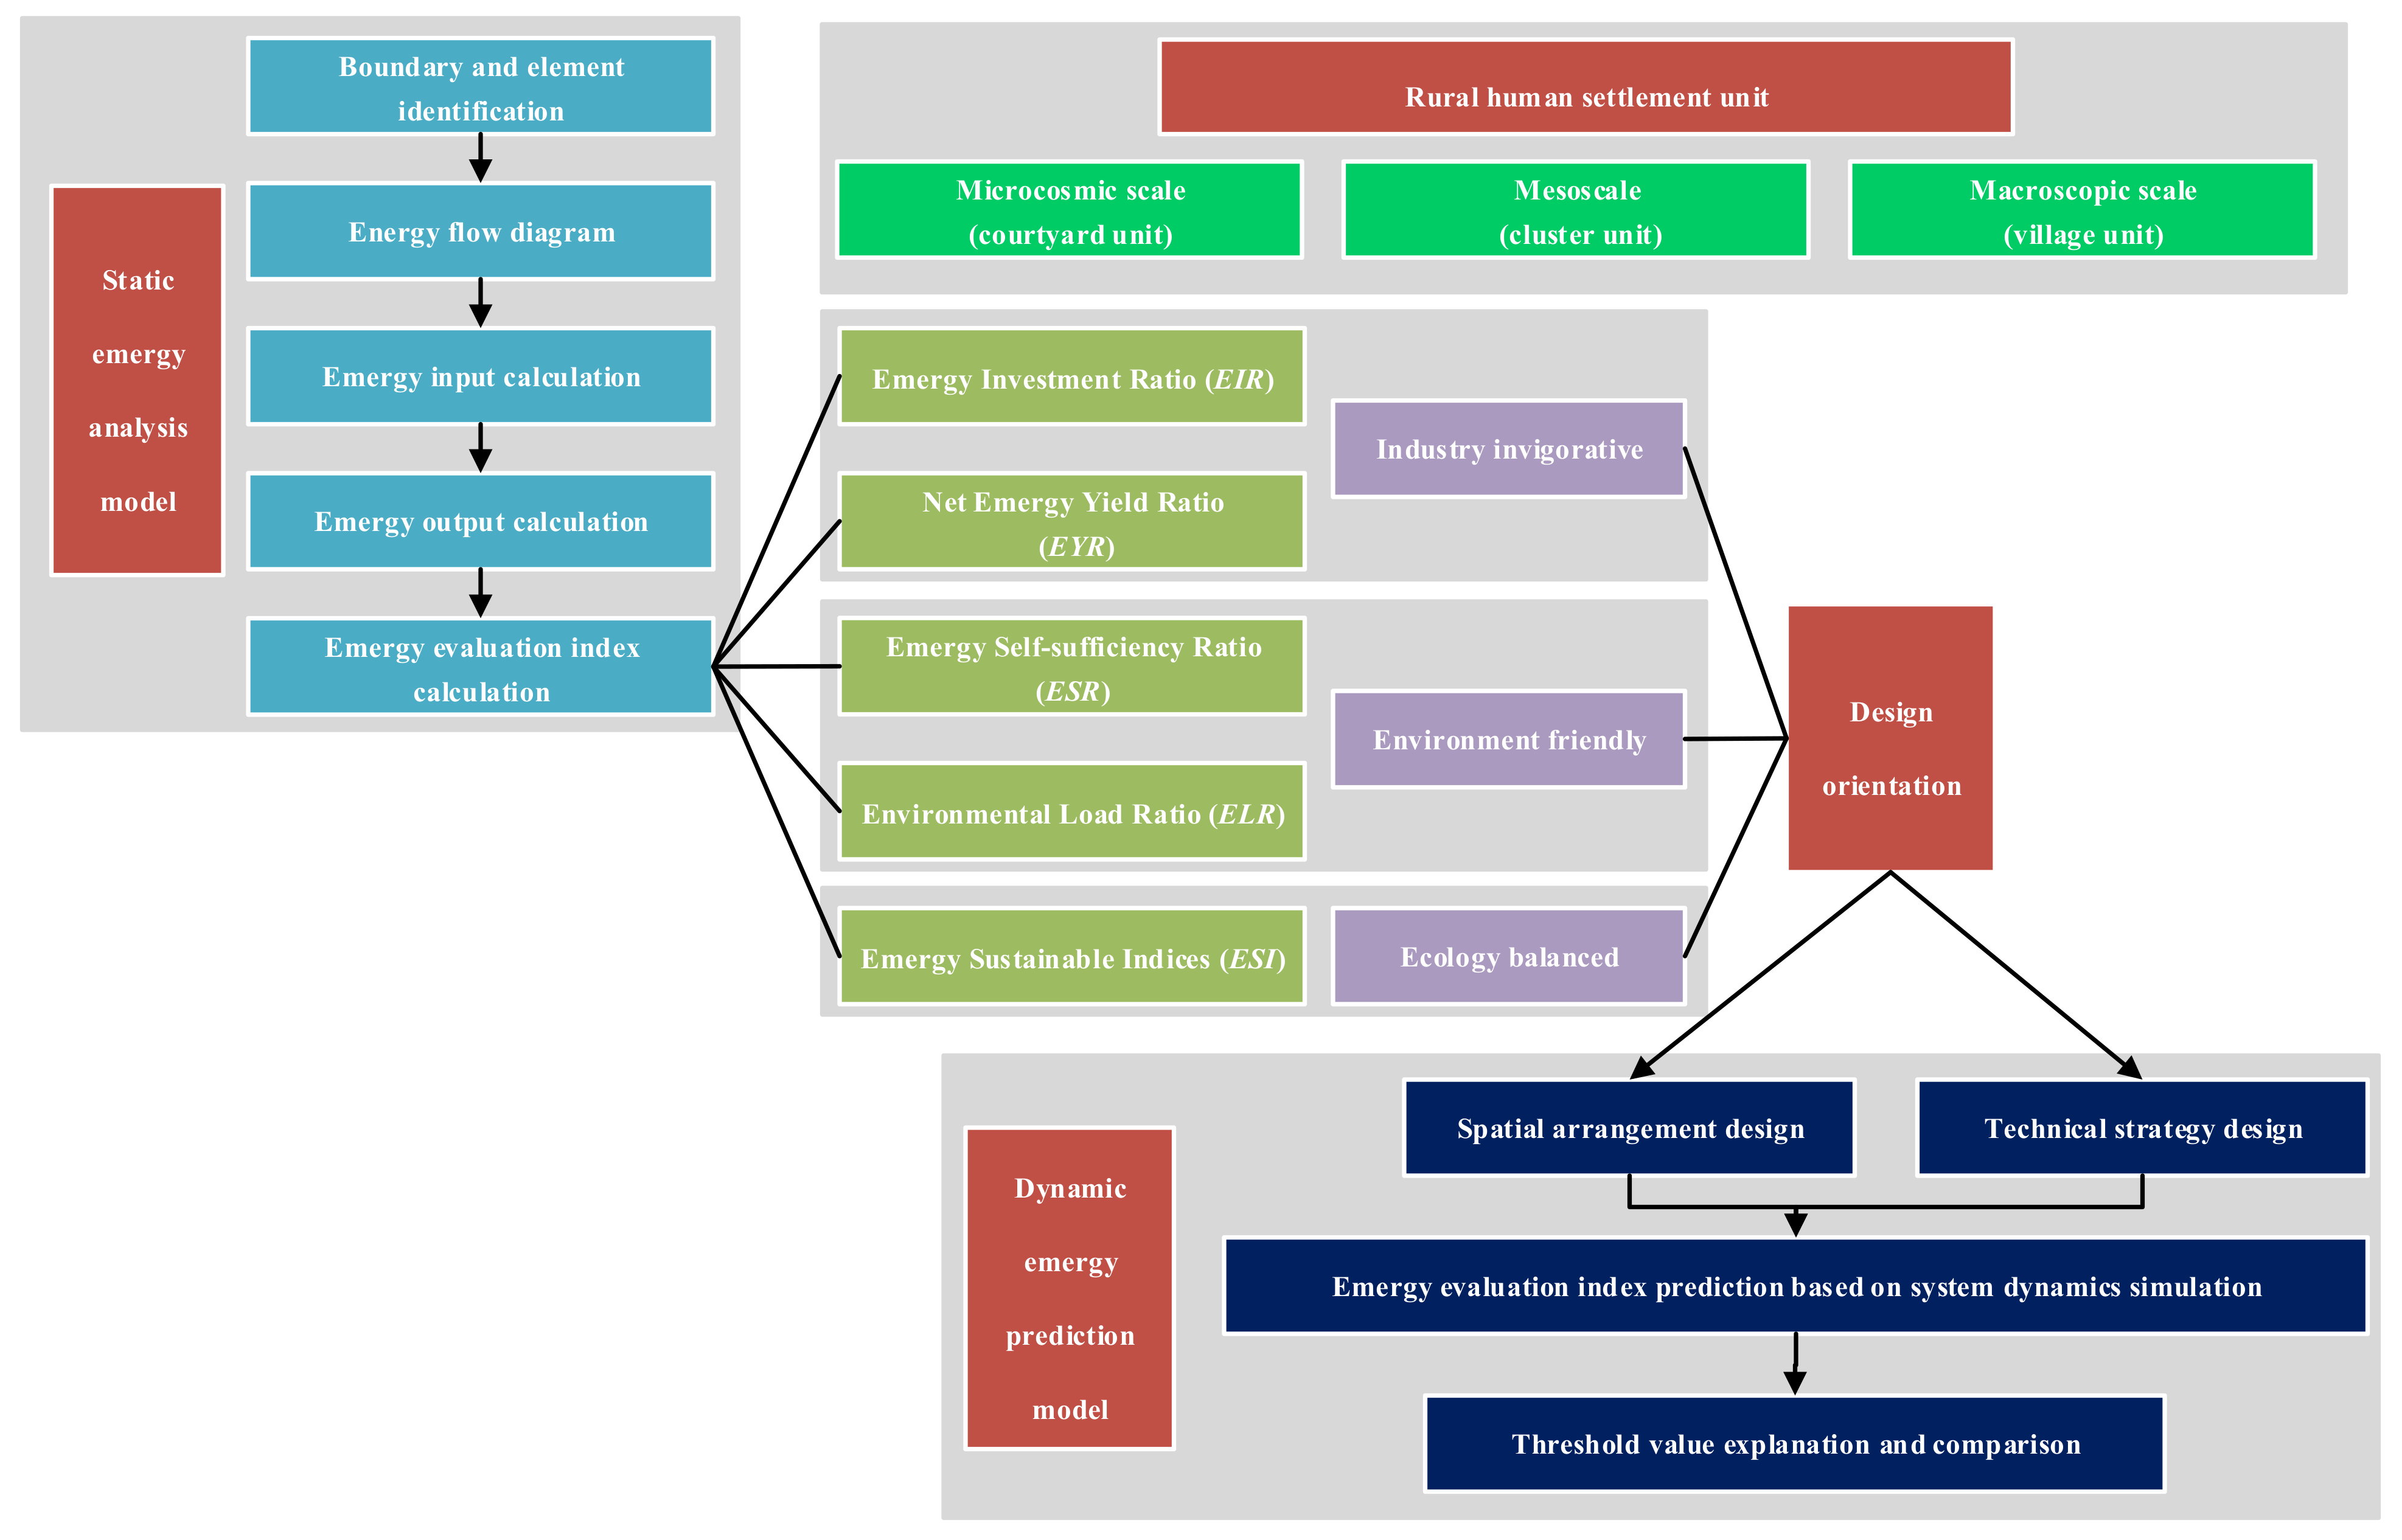
2.2. Analytical Procedures of the Ecological Emergy Theory

Emergy refers to the past available energy use to measure the flow of matter or energy into and out of a thermodynamic ecosystem account. It is the available solar energy or the energy contained in solar concrete energy used directly or indirectly to provide a service or product [29]. The unit of emergy is emjoule, to distinguish it from joule, referring to the available energy of one kind consumed or produced in transformations. For example, sunlight, fuel, electricity, and human services can be put on a common basis by expressing them all as the emjoules of solar energy required to produce each one. Different forms of energy contain different energy qualities, and energy conversion work plays a dominant role in resolving the amount of emergy. The following two terms of integration enable values that differ from other environmental accounting metrics: the “available” portion of energy volume and the contribution of memory “indirect” energy transfers. The thermodynamic basis of the emergy theory has a particular emphasis on the availability of energy resources since availability determines the distance from the thermodynamic equilibrium of the ecosystem under observation and thus the ability of the target system to do work in relation to its surroundings.

2.2.1. Static Emergy Analysis Model

The emergy of a product or service can be calculated by the multiplication of an inefficiency factor (named transformity) and the quantity of available energy input or output. Hence, the total emergy can be obtained by the summation of the emergy value of each transformation process, which is expressed by Equation (1):
E m = i = 1 n ( E i T r i )
where Em represents solar emergy, Ei is the energy or mass input and output, and Tri is the transformity referring to the specific emergy value of the input and output. Transformity measures the quality of energy, which is the intensive unit of emergy. A higher transformity indicates a higher location in the energy hierarchy chain. The unit of transformity is sej/unit (J, kg, or g). The transformity value can be obtained from emergy databases and previous research or it can also be derived from the global baseline. Thus, transformity becomes a matter of the ecosystem components and a sort of property of energy simultaneously [52].
The expression of the total emergy input of natural resources is as follows (Equation (2)):
I = R + N
where R represents the emergy input of renewable natural resources and N represents the emergy input of non-renewable natural resources. The expression of the total emergy input of auxiliary resources is as follows (Equation (3)):
U = P + O
where P represents the emergy input of non-renewable purchased resources and O represents the emergy input of organic resources. Then, the expression of total emergy input is as follows (Equation (4)):
T = I + U
Researchers have conducted a large number of original studies to propose various emergy evaluation indices for assessing the sustainability of the system or products according to the emergy concept. Odum established the definition of emergy evaluation indices, named the emergy self-sufficiency ratio (ESR), emergy investment ratio (EIR), net emergy yield ratio (EYR), environmental load ratio (ELR), and emergy sustainable indices (ESI) [53]. These emergy evaluation indices are defined as follows (Equations (5)–(9)):
E S R = I T
ESR is generally applied to analyze and evaluate the external exchange as well as the economic development level of the system. A higher value of ESR indicates more abundant internal resources, a stronger self-sufficiency capacity, and a weaker external exchange capacity of the system.
E I R = U I
EIR is also known as the ratio of economic emergy to environmental emergy, which is applied to measure the economic development level and the environmental stress of the system. A higher value of EIR indicates a higher economic development level and less dependence on the natural environment of the system.
E Y R = Y U
where Y is the total emergy output of the system.
EYR is adopted for measuring the ability of production processes to exploit internal resources. This indicator also shows the amount of gross emergy required in order to maintain the production. The higher the EYR value, the greater the return obtained from the emergy contributed to the system.
E L R = ( U + N ) R
ELR reflects the pressure of production activities on the internal environment due to the excessive exploitation of internal non-renewable resources and/or investment from the external environment compared with renewable resources. The higher the ELR value, the more environmental pressure and negative impacts the system has.
E S I = E Y R E L R
ESI is the ratio of EYR to ELR, measuring the pressure on the internal environment, the ecological sustainability, and the net benefit to the society of the system. The system is not sustainable with an ESI value of less than 1 and is moving toward a more sustainable direction with an ESI value between 1 and 10. The sustainability of the system is profound when the ESI value is greater than 10.

2.2.2. Dynamic Emergy Prediction Model

The formulas of the system dynamics model are from the combination of mathematical expressions which accurately describe the relationship among the factors in a system. Figure 6 shows the system dynamics causal relationship diagram of the rural human settlement unit. According to the influencing factors that affect the emergy evaluation indices, simplified as U (total emergy input of auxiliary resources), R (emergy input of renewable natural resources), and Y (total emergy output), and the influencing logic (dynamics causal relationship), this study adopted system dynamics simulation software Vemsim to edit the system dynamics formulas of the rural human settlement unit with different design orientations for the variation tendency prediction of the emergy evaluation indices (2021–2035).
The technical strategies and spatial arrangements of three design orientations, namely, ecology-balanced, industry invigorative, and environment-friendly, were set for the comparative analysis of the variation tendency prediction of the emergy evaluation indices.
  • Ecology-balanced design orientation
The principle of ecology-balanced design orientation is to achieve a highly adaptive, coordinated, and unified state through energy flow, material circulation, and information transfer between people and the environment within a certain period of time. When rural human settlement units attain equilibrium, the relationship among each composition inside of the system maintains a certain proportion. The input and output of energy and materials tend to be equal for a comparatively long time, and the structure and function are relatively stable. In addition, the system can return to the initial state through self-regulation when interfered with from the outside, according to the concept of sustainable development.
(1) Technical strategies
The technical strategies of ecology-balanced design orientation are identical to the technical strategies of the initial settings for static emergy analysis. In the courtyard unit, technical strategies include a biogas digester, solar water heater, photovoltaic panel, sewage purifier, and rainwater collector; in the cluster unit, technical strategies include a medium-sized biogas field, small-sized biogas generator, constructed wetland with sewage concentrated disposal functions, and impounding reservoir for rainwater collection; and in the village unit, technical strategies include a biogas factory, wetland landscape, and impounding reservoir.
(2) Spatial arrangements
The spatial arrangements of ecology-balanced design orientation are identical to the spatial arrangement of the initial settings for static emergy analysis. In the courtyard unit, spatial arrangements include roof planting, facade planting, courtyard planting, and courtyard breeding adjacent to the biogas digester; in the cluster unit, spatial arrangements include a centralized living area (courtyard units) surrounded by agricultural production space, a medium-sized biogas field combined with small-sized biogas generator adjacent to centralized breeding, and a public space consisting of constructed wetland and a leisure square; and in the village unit, spatial arrangements include a living area (cluster units) adjacent to a wetland landscape, away from large-scale breeding, combined with a biogas factory and modern agricultural park adjacent to the manufacturing infrastructure.
  • Industry invigorative design orientation
The principle of industry invigorative design orientation is to maximumly exploit the potential of rural human settlement units regarding landscape design, crop planting, livestock breeding, energy manufacturing, tourism development, and the service industry, enhancing the efficiency and speed of the internal energy flow. The main purpose of the design orientation is to realize the maximum emergy output. Of course, this design orientation will also lead to an increase in the utilization rate of non-renewable resources and the emission of pollutants.
(1) Technical strategies
The technical strategies of the industry invigorative design orientation are more suitable for agricultural-related production. Compared with the technical strategies of ecology-balanced design orientation, technical strategies are added that include automatic irrigation with more electric power consumption in the courtyard unit, a wind power generator for energy supply in the cluster unit, and geothermal energy utilization for leisure tourism and investment attraction in the village unit.
(2) Spatial arrangements
Compared with the spatial arrangements of ecology-balanced design orientation, roof planting, facade planting, and courtyard planting are replaced with greenhouse planting adjacent to buildings in the courtyard unit; the public space consisting of a constructed wetland and leisure square is replaced with distributed sewage disposal in the cluster unit; and the modern agricultural park adjacent to the manufacturing infrastructure is replaced with a modern agricultural park combined with a manufacturing infrastructure adjacent to leisure tourism in the village unit.
  • Environment-friendly design orientation
The principle of environment-friendly design orientation is to establish a positive interactive relationship between people and the environment. The core objective of the design orientation is to regulate the production and consumption activities inside of the rural human settlement unit within the ecological carrying capacity and environmental capacity limitations, formulating critical feedback mechanisms of effective control of the production and consumption activities through the quality and state variation of the ecological environment elements. By analyzing the mechanism and pathway of the metabolic waste flow generation and discharge especially, this design orientation tends to effectively monitor the whole process of production and consumption activities. Multiple measurements are then adopted in order to reduce the amount of pollution production, ultimately realizing harmless pollution and lowering the adverse impact on the external ecological environment system.
(1) Technical strategies
The technical strategies of the environment-friendly design orientation are more suitable for environmental protection. Compared with the technical strategies of the ecology-balanced design orientation, the technical strategy sewage purifier is replaced with geothermal heating in the courtyard unit; the small-sized biogas generator is replaced with solar power generation in the cluster unit; and the wetland landscape is eliminated in the village unit.
(2) Spatial arrangements
Compared with the spatial arrangements of ecology-balanced design orientation, roof planting and facade planting are eliminated in the courtyard unit; the leisure square is eliminated in the cluster unit; and the manufacturing infrastructure is eliminated in the village unit.
The dynamic variation tendency prediction of the emergy evaluation indices of the rural human settlement then can be applied in the following aspects: On the one hand, the dynamic emergy evaluation indices prediction can assist designers to analyze approaches to improve the energy efficiency levels by assessing the suitability under different design orientations, while on the other hand, the dynamic emergy evaluation indices prediction can assist administrators and developers to formulate a reasonable scheme for both economic and environmental benefits.

3. Results and Discussions

3.1. Static Emergy Analysis of the Rural Human Settlement Unit

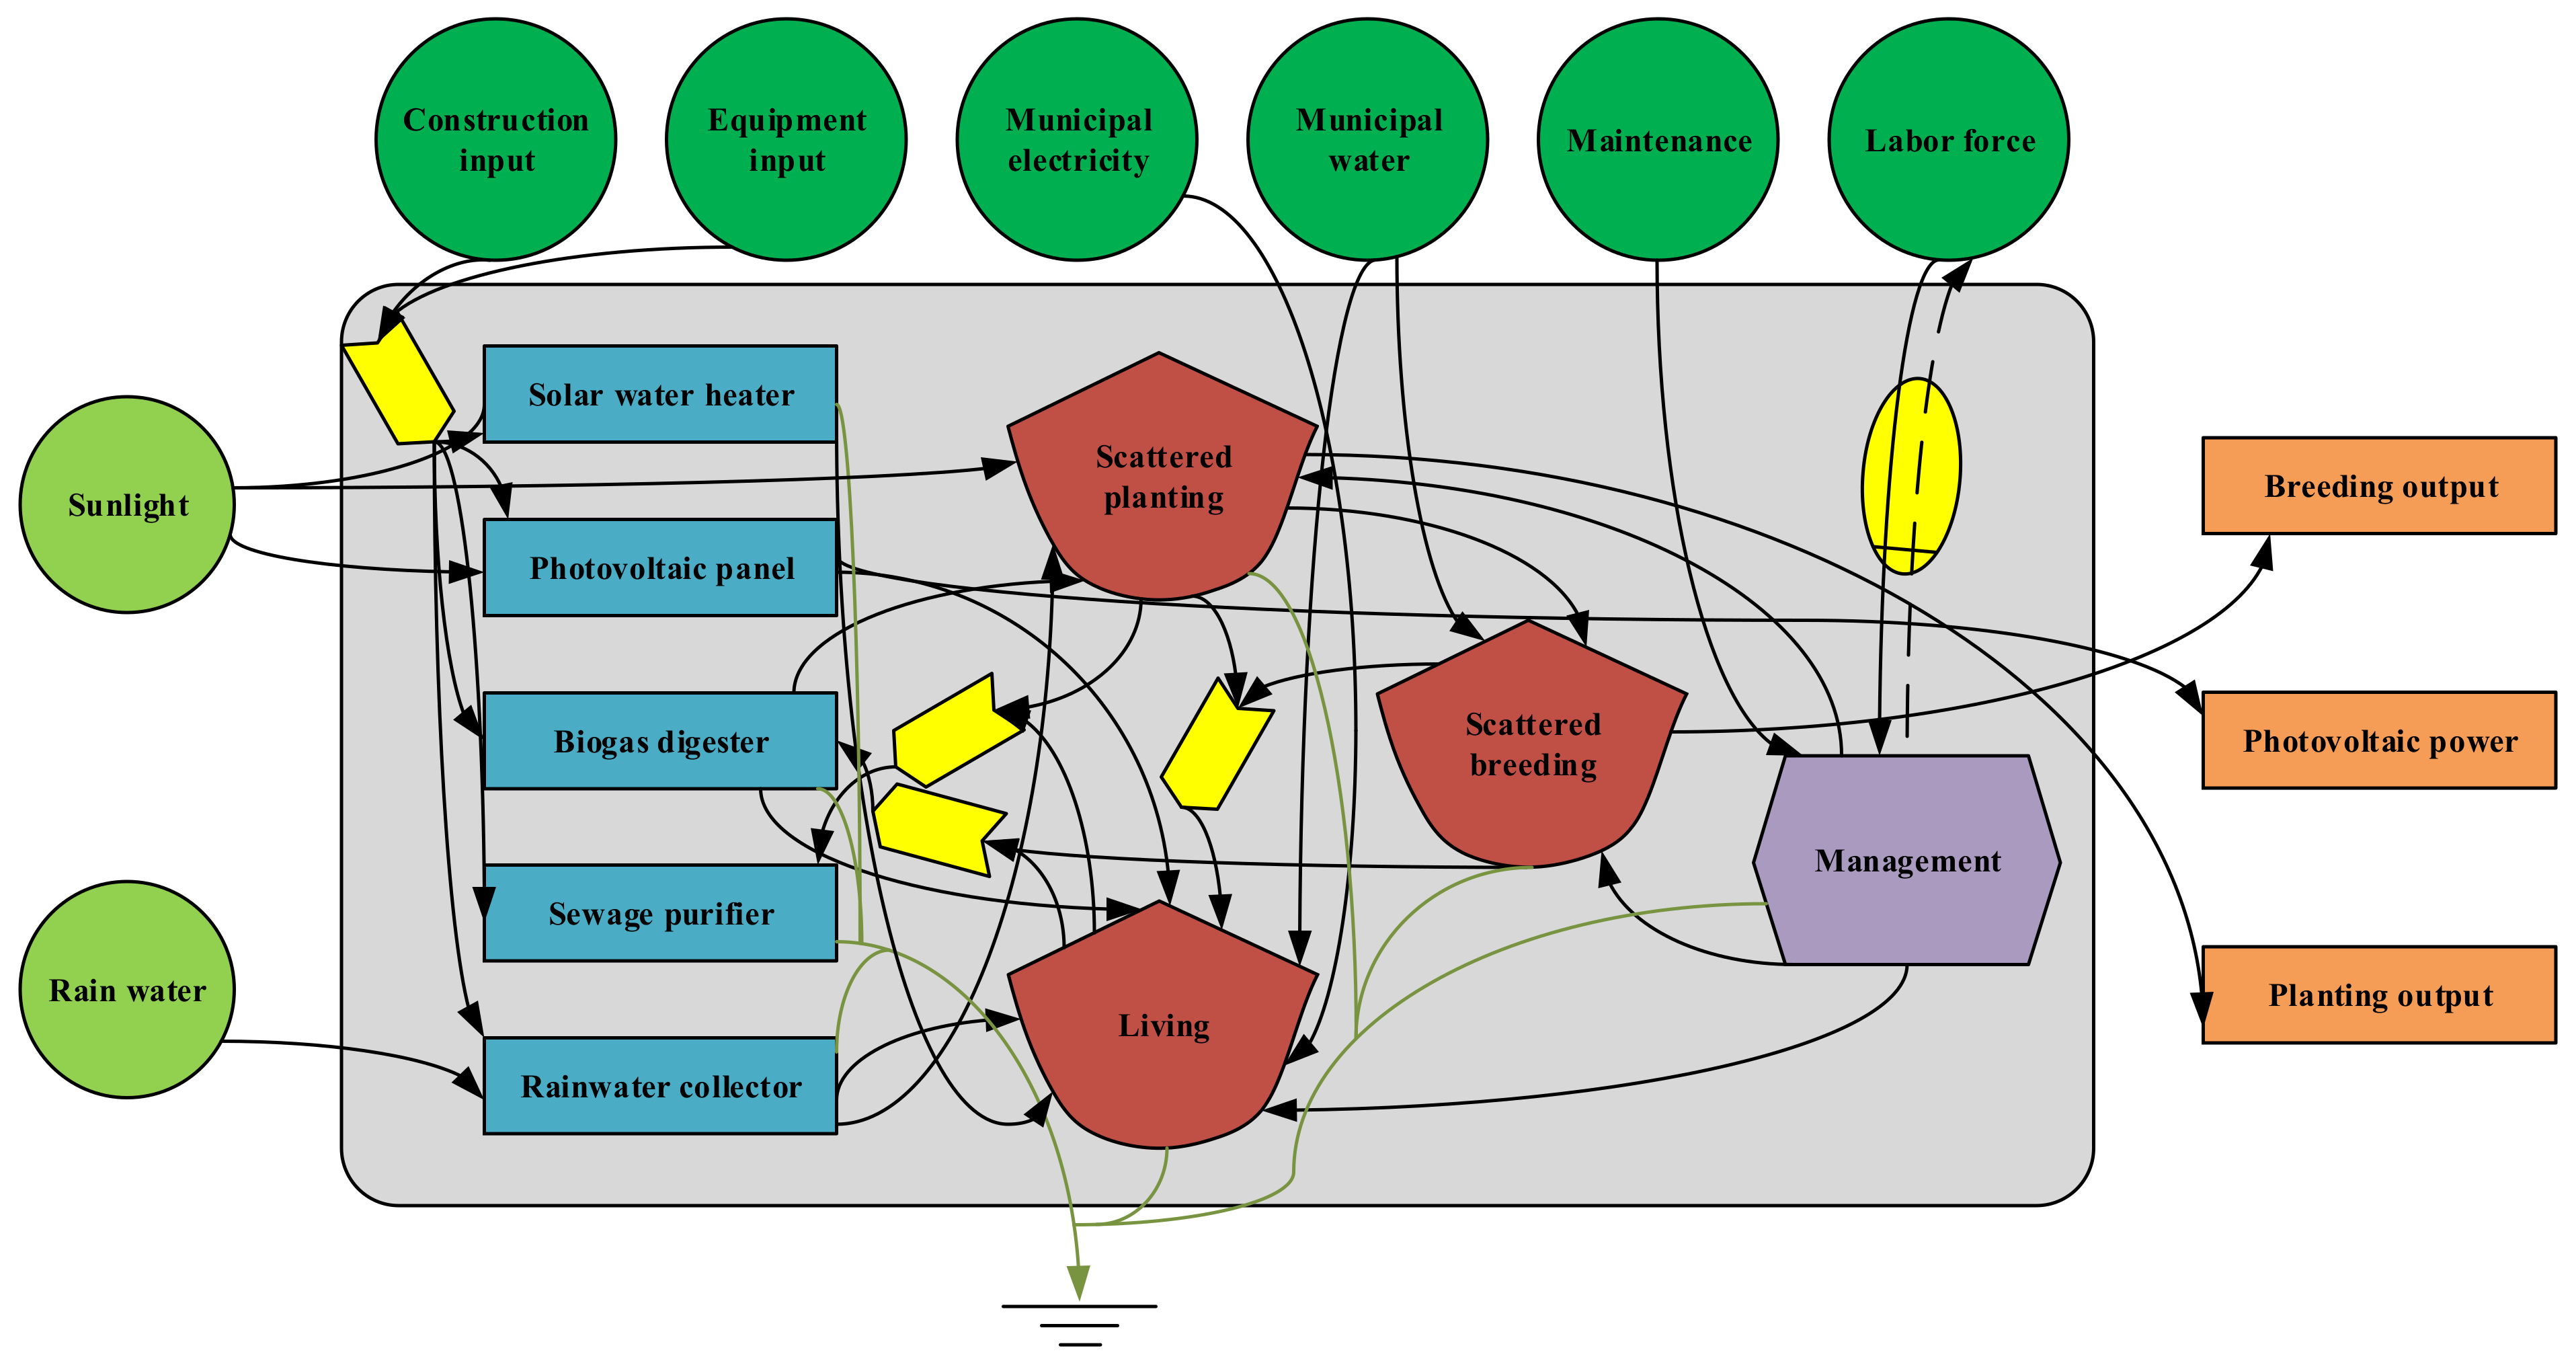
3.1.1. Static Emergy Analysis of the Courtyard Unit

(1) Emergy input and output of the courtyard unit
Table 2 shows the emergy input and output of the courtyard unit in 2020. The emergy input consisted of renewable natural resources (R), non-renewable purchased resources (P), and organic resources (O). The total emergy input value was 4.30 × 10¹⁶ sej, in which the R input, P input, and O input accounted for 53.67%, 33.80%, and 12.53%, respectively. The emergy output consisted of planting, breeding, and photovoltaic power. The total emergy output value was 5.77 × 10¹⁶ sej, in which the planting output, breeding output, and photovoltaic power output accounted for 30.94%, 66.03%, and 3.03%, respectively.
(2) Emergy evaluation index calculation of the courtyard unit
As can be seen from Table 3, the EIR value of the courtyard unit was 86.34%, indicating that the exploitation and utilization level of the natural resources of the unit at the microcosmic scale was comparatively low. The courtyard unit still depended on the construction and production facilities of urbanization and industry. Thus, the growth space of this evaluation index was relatively large in terms of ecological and self-sufficient development goals. The EYR value was 289.48%, which means that the emergy output of the unit itself was capable of compensating for the purchase of emergy and gaining emergy profit. Few manpower resources with high emergy value were invested in this unit except for the maintenance of buildings, equipment, and facilities, reflecting the acceptable production efficiency of the ecosystem. The ELR value was at an absolutely low level of 86.34%; the consumption of environmental resources and emission of wastes and pollutants were well regulated, and the environment loads lay in a secure range. The ESR value was 53.67%; on the one hand, the natural resources in this rural human settlement unit were relatively abundant, and the resource base and security level for economic development were comparatively high. On the other hand, this index also reflected the current situation of the insufficient emergy purchasing power of the recycling system under the goal of self-sufficiency. The ESI value was 3.35, with powerful renewability and the promising prospect of sustainable development.

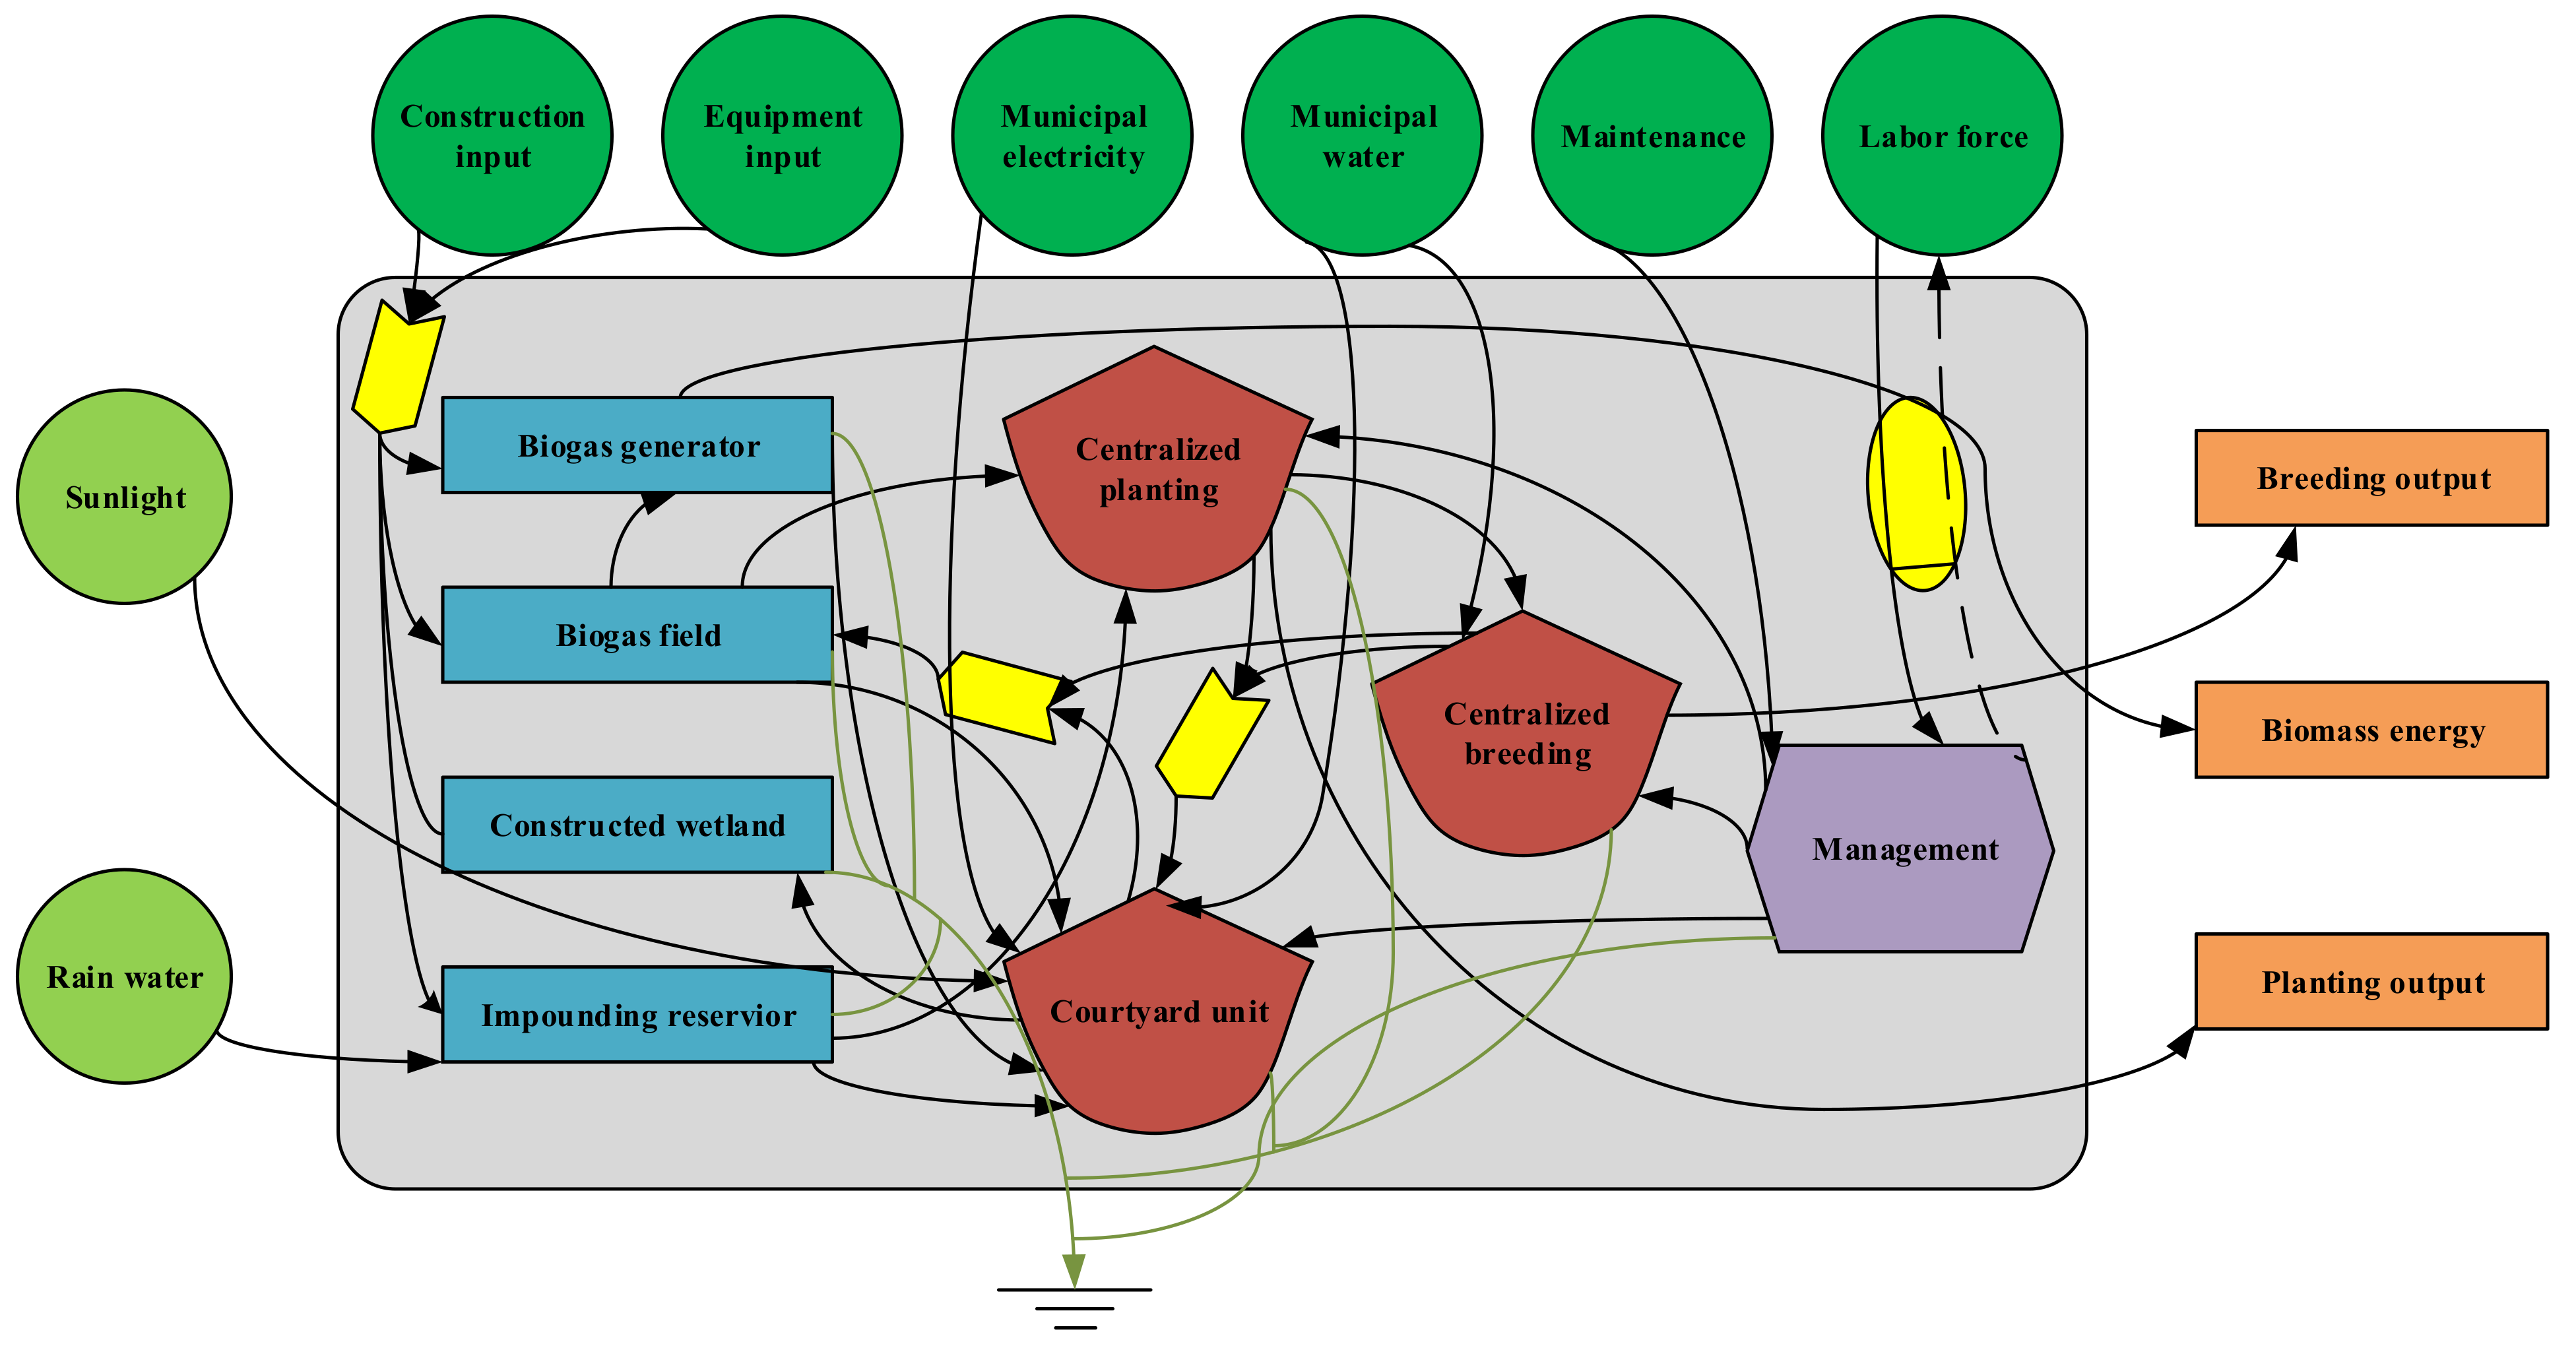
3.1.2. Static Emergy Analysis of the Cluster Unit

(1) Emergy input and output of the cluster unit
Table 4 shows the emergy input and output of the cluster unit in 2020. The emergy input consisted of renewable natural resources (R), non-renewable natural resources (N), non-renewable purchased resources (P), and organic resources (O). The total emergy input value was 1.34 × 10¹⁹ sej, in which the R input, N input, P input, and O input accounted for 36.57%, 0.97%, 45.82%, and 16.64%, respectively. The emergy output consisted of planting, breeding, and biogas energy. The total emergy output value was 1.81 × 10¹⁹ sej, in which the planting output, breeding output, and biogas energy output accounted for 53.59%, 41.26%, and 5.15%, respectively.
(2) Emergy evaluation index calculation of the cluster unit
As can be seen from Table 5, the EIR value of the cluster unit was 166.48%, indicating that the exploitation and utilization level of the natural resources of the unit at the mesoscale was distinctly higher than that of the unit at the microcosmic scale. Compared with the courtyard unit, the dependency and the quantity demanded of the external resources were lower. Generally speaking, the growth space of this evaluation index was still relatively large in terms of ecological and self-sufficient development goals. The EYR value was 215.76%, lower than that of the courtyard unit. More manpower resources with high emergy value were invested in this unit, mainly for the construction of the impounding reservoir and the maintenance of the wetland. The ELR value was 170.84%, higher than that of the courtyard unit. The consumption of environmental resources and emission of wastes and pollutants were both strengthened, and the secure range of the environmental loads was extruded. The ESR value was 37.53%, lower than that of the courtyard unit. On the one hand, this was a reflection of the reduction in the natural resource utilization in this rural human settlement unit; on the other hand, this index also indicated that in order to realize the goal of self-sufficiency, the unit needed the supplement of external resources. The ESI value was 1.26, which means that the renewability is lower than that of the courtyard unit, therefore, internal resource utilization for the purpose of sustainable development should be promoted.

3.1.3. Static Emergy Analysis of the Village Unit

(1) Emergy input and output of the village unit
Table 6 shows the emergy input and output of the village unit in 2020. The emergy input consisted of renewable natural resources (R), non-renewable natural resources (N), non-renewable purchased resources (P), and organic resources (O). The total emergy input value was 2.02 × 10²⁰ sej, in which the R input, N input, P input, and O input accounted for 31.99%, 0.87%, 49.27%, and 17.77%, respectively. The emergy output consisted of planting, breeding, biogas energy, processing product, and service. The total emergy output value was 2.37 × 10²⁰ sej, in which the planting output, breeding output, biogas energy output, processing product output, and service output accounted for 31.14%, 46.20%, 2.66%, 7.51%, and 12.49%, respectively.
(2) Emergy evaluation index calculation of the village unit
As can be seen from Table 7, the EIR value of the village unit was 204.16%, indicating that the exploitation and utilization level of the natural resources of the unit at a macroscopic scale continuously increased. Compared with the courtyard unit and cluster unit, the dependency and the quantity demanded of external resources continuously decreased. In other words, the growth space of this evaluation index was even larger in terms of ecological and self-sufficient development goals. The EYR value was 174.98%, lower than that of the courtyard unit and cluster unit. The proportion of manpower resources purchased continuously increased, mainly for the construction of manufacturing facilities and the management of tourism. The ELR value was 212.36%, higher than that of the courtyard unit and cluster unit. The environmental loads became heavier because of the increasing consumption of environmental resources and the emission of wastes and pollutants. The ESR value was 32.88%, lower than that of the courtyard unit and cluster unit, which indicates that it was impossible to realize the goal of self-sufficiency. Lastly, the ESI value was 0.82, which means the danger of unsustainability was emerging in this unit.

3.2. Dynamic Emergy Prediction of the Rural Human Settlement Unit

3.2.1. Dynamic Emergy Prediction Model Verification

This research adopted a historical data verification method for the dynamic emergy prediction model verification. The fractional error between the simulation value and the actual value was the validation criteria for whether the model passed the historical data verification. When the fractional error is smaller than 10%, the model can be considered as passing the verification. The fractional error is expressed as the following Equation (10):
δ t , k = S t , k A t , k A t , k
where δ denotes the fraction error; t denotes the year of the simulation; and k denotes the variable attributes. When k = 1, the variable is ESR; k = 2, the variable is EIR; k = 3, the variable is EYR; k = 4, the variable is ELR; k = 5, the variable is ESI; S denotes the simulation value; and A demotes the actual value.
Considering the availability of the historical data, the ESR, EIR, EYR, ELR, and ESI of 2017–2020, calculated from the emergy data, were selected as the historical data to be compared with the simulation data of the village unit for the verification of the prediction model (Table 8). The results showed that the maximum fractional error between the actual historical data and the simulation data of the village unit was 8.96%, which is within the acceptable range. In view of the scientific reliability of the prediction model certifiably passing the verification process, the dynamic emergy evaluation indices prediction was proven to be capable of reflecting the development tendency of the rural human settlement unit.

3.2.2. Dynamic Emergy Evaluation Index Prediction

The dynamic emergy evaluation indices prediction results of the rural human settlement are shown in Figure 7 (the village unit, for instance). The ESR values of the ecology-balanced design orientation of the rural human settlement unit were higher than those of the industry invigorative design orientation and lower than those of the environment-friendly design orientation. Because of the maximum avoidance of the external resource input from the manufacturing infrastructure, the initial ESR values of the environment-friendly design orientation were higher than those of the other two design orientations. The ESR values presented a decreasing tendency with the passage of time, indicating that the self-sufficiency abilities decreased with the gradual maturity of the development of tourism. In addition, the requirements for external resources and exchange activities with the external environment were also increasingly enhanced.
The EIR values of the environment-friendly design orientation of this unit were higher than those of the ecology-balanced design orientation and lower than those of the industry invigorative design orientation. The rural human settlement unit of the industry invigorative design orientation developed the internal resources for tourism and manufacturing infrastructure to the maximum so it was necessary to reinforce the monetary and manpower resource investment with regard to the investment attraction, publicity, and ancillary facility construction. According to the above reasons, the initial EIR values of the industry invigorative design orientation were higher than those of the other two design orientations. The EIR values basically presented an increasing tendency with the passage of time, indicating that with the increasingly enhanced emergy output abilities, the proportions for infrastructure construction, maintenance, and operation investments were also heightened.
The EYR values of the ecology-balanced design orientation of this unit were higher than those of the environment-friendly design orientation and lower than those of the industry invigorative design orientation. The currency revenue of the tourism and agricultural processing industry was the main emergy growth point, therefore the initial EYR values of the industry invigorative design orientation were higher than those of the other two design orientations. The EYR values basically presented an upward trend with the passage of time, indicating that with the development of society and the progress of technology, more efficient energy utilization modes and more reasonable spatial arrangements of the unit assisted the improvement of the capacity for emergy output.
The ELR values of the ecology-balanced design orientation of this unit were higher than those of the environment-friendly design orientation and lower than those of the industry invigorative design orientation. The damage to the external environment of the rural human settlement unit of the industry invigorative design orientation was mainly from the investment attraction and ancillary facilities construction in the full life cycle, so the initial ELR values were higher than those of the other two design orientations. The ELR values basically presented an increasing tendency with the passage of time, indicating that the external resources input in the early stage of development was the direct cause, resulting in the increase in the emergy emission to the external environment. The growth rates of the ELR values would decline from 2026 to 2031, which means that the construction pace in this period would have slowed down, releasing the external environmental pressure to a certain extent. The growth rates of the ELR values would then rise again after 2032, indicating that the production accumulation and external emergy output in the early stage of development, coupled with possible population growth and the improvement of living standards, would lead to the increase in pollutant emissions in the next stage. With the expansion of the industrial scale, the negative impact of the rural human settlement unit on the external environment would be continuously strengthened in the forecastable future.
The ESI values of the industry invigorative design orientation of this unit were higher than those of the environment-friendly design orientation and lower than those of the ecology-balanced design orientation. The ESI values basically presented a downward trend with the passage of time, and the curve roughly corresponded to the curve of the ELR. The decline rates of the ESI values would decrease from 2026 to 2031 and rise again after 2032. At the macroscopic scale of the rural human settlement unit, both the initial and final values of the ESI with different design orientations in the prediction interval were lower than the critical value (ESI = 1) of sustainable development. However, decreasing ESI values do not represent decreasing sustainability. Due to the constant improvement of the unit in the early stage, the internal emergy would accumulate continuously, which would become the intrinsic driving force for the sustainable development of the system. Although the ESI value would eventually approach zero in the forecastable future, the sustainable development capacity of the rural human settlement unit would not decrease, tending to dynamic equilibrium.
It is of great theoretical and practical significance to optimize and improve the design of rural human settlement units through system ecology analysis based on the emergy evaluation indices. Theoretically, this research proposed a new method for the design of rural human settlement units by adopting emergy as a common dimension in order to solve the problem of dimensionality disunity between environmental resource elements and society economy elements. Through the establishment of the static emergy analysis model and dynamic emergy prediction model, the qualitative and quantitative analysis approaches of the rural human settlement units were combined, expanding the application scope of system ecology and the emergy theory. In practice, the results of this study have important application value for the formulation and implementation of the ecological and sustainable rural development strategy in China. The evaluation method based on the emergy analysis of the technical strategies and spatial arrangements of the rural human settlement unit can provide data support for designing standards, planning guidelines, and creating constructional instructions for the rural living environment of China.

4. Conclusions

This study drew the following conclusions:
(1)
This research creatively proposed the concept of the rural human settlement unit of China, based on the ecological circulation characteristics of the rural living environment, which can be divided into three scales: the microcosmic scale (courtyard unit), mesoscale (cluster unit), and macroscopic scale (village unit). Three design orientations, namely, the industry invigorative, the environment-friendly, and the ecology-balanced, of the rural human settlement unit were provided, corresponding with the integration of production-living-ecology.
(2)
The results of the static emergy analysis indicated that the ESR, EYR, and ESI values of the rural human settlement units at a smaller scale were higher than those at a larger scale, while the EIR and ELR values of rural human settlement units at a smaller scale were lower than those at a larger scale.
(3)
The results of the dynamic emergy prediction indicated that the ESR values of the environment-friendly rural human settlement unit > those of the ecology-balanced unit > those of the industry invigorative unit; the EIR values of the industry invigorative unit > those of the environment-friendly unit > those of the ecology-balanced unit; the EYR values of the industry invigorative unit > those of the ecology-balanced unit > those of the environment-friendly unit; the ELR values of the industry invigorative unit > those of the ecology-balanced unit > those of the environment-friendly unit; and the ESI values of the ecology-balanced unit > those of the industry invigorative unit > those of the environment-friendly unit. In addition, the ESR and ESI values basically presented a decreasing tendency from 0.34 to 0.15 and from 0.76 to 0.57, respectively, with the passage of time; the EIR, EYR, and ELR values basically presented an increasing tendency from 2.13 to 2.78, from 1.66 to 2.12, and from 2.23 to 3.61, respectively, with the passage of time.

Author Contributions

Conceptualization, Y.C. and C.W.; methodology, G.G.; software, G.G.; validation, G.G.; formal analysis, Y.C. and T.M.; investigation, Y.X.; resources, Y.X.; data curation, Y.C.; writing—original draft preparation, Y.C.; writing—review and editing, G.G. and T.M.; visualization, C.W.; supervision, C.W.; project administration, C.W.; funding acquisition, G.G. All authors have read and agreed to the published version of the manuscript.

Funding

This research was funded by the National Natural Science Foundation of China (NSFC Grant No. 52278024) and the Doctoral Research Foundation of Shandong Jianzhu University (No. X18098Z).

Data Availability Statement

No new data were created or analyzed in this study. Data sharing is not applicable to this article.

Acknowledgments

Special thanks to the School of Thermal Engineering, Shandong Jianzhu University for supporting technical consultation.

Conflicts of Interest

The authors declare no conflict of interest. The funders had no role in the design of the study; in the collection, analyses, or interpretation of data; in the writing of the manuscript; or in the decision to publish the results.

Abbreviations

Emergy input of renewable natural resourcesR
Emergy input of non-renewable natural resourcesN
Total emergy input of natural resourcesI
Emergy of non-renewable purchased resourcesF
Emergy input of organic resourcesO
Total emergy input of auxiliary resourcesU
Emergy self-sufficiency ratioESR
Emergy investment ratioEIR
Net emergy yield ratioEYR
Environmental load ratioELR
Emergy sustainable indicesESI

References

  1. Zeng, X.; Zhao, Y.; Cheng, Z. Development and research of rural renewable energy management and ecological management information system under the background of beautiful rural revitalization strategy. Sustain. Comput. Inform. Syst. 2021, 30, 100553. [Google Scholar] [CrossRef]
  2. Wu, B.; Liu, L. Social capital for rural revitalization in China: A critical evaluation on the government’s new countryside programme in Chengdu. Land Use Policy 2020, 91, 104268. [Google Scholar] [CrossRef]
  3. Gao, J.; Wu, B. Revitalizing traditional villages through rural tourism: A case study of Yuanjia Village, Shaanxi Province, China. Tour. Manag. 2017, 63, 223–233. [Google Scholar] [CrossRef]
  4. Li, B.; You, L.; Zheng, M.; Wang, Y.; Wang, Z. Energy consumption pattern and indoor thermal environment of residential building in rural China. Energy Built Environ. 2020, 1, 327–336. [Google Scholar] [CrossRef]
  5. Meng, X.; Liang, W.; Ding, P.; Wang, S.; Li, Y.; Long, E. Survey research on living environment and energy consumption in the west rural areas of China. Procedia Eng. 2015, 121, 1044–1050. [Google Scholar] [CrossRef] [Green Version]
  6. Wang, Y.Y.; Zhang, Y.P.; Yang, G.F.; Cheng, X.M.; Wang, J.; Xu, B. Knowledge mapping analysis of the study of rural landscape ecosystem services. Buildings 2022, 12, 1517. [Google Scholar] [CrossRef]
  7. Luo, X.; Yang, J.; Sun, W.; He, B. Suitability of human settlements in mountainous areas from the perspective of ventilation: A case study of the main urban area of Chongqing. J. Clean. Prod. 2021, 310, 127467. [Google Scholar] [CrossRef]
  8. Tang, L.; Ruth, M.; He, Q.; Mirzaee, S. Comprehensive evaluation of trends in human settlements quality changes and spatial differentiation characteristics of 35 Chinese major cities. Habitat Int. 2017, 70, 81–90. [Google Scholar] [CrossRef]
  9. Xue, Q.; Yang, X.; Wu, F. A two-stage system analysis of real and pseudo urban human settlements in China. J. Clean. Prod. 2021, 293, 126272. [Google Scholar] [CrossRef]
  10. Musakwa, W. Data on strategically located land and spatially integrated urban human settlements in South Africa. Data Br. 2017, 15, 805–808. [Google Scholar] [CrossRef]
  11. Yang, R.; Xu, Q.; Long, H. Spatial distribution characteristics and optimized reconstruction analysis of China’s rural settlements during the process of rapid urbanization. J. Rural Stud. 2016, 47, 413–424. [Google Scholar] [CrossRef]
  12. Cao, Y.; Bai, Z.; Sun, Q.; Zhou, W. Rural settlement changes in compound land use areas: Characteristics and reasons of changes in a mixed mining-rural-settlement area in Shanxi Province, China. Habitat Int. 2017, 61, 9–21. [Google Scholar] [CrossRef]
  13. Cechin, A.; da Silva Araújo, V.; Amand, L. Exploring the synergy between Community Supported Agriculture and agroforestry: Institutional innovation from smallholders in a brazilian rural settlement. J. Rural Stud. 2021, 81, 246–258. [Google Scholar] [CrossRef]
  14. Zhao, X.; Sun, H.; Chen, B.; Xia, X.; Li, P. China’s rural human settlements: Qualitative evaluation, quantitative analysis and policy implications. Ecol. Indic. 2019, 105, 398–405. [Google Scholar] [CrossRef]
  15. Watts, J.D. Community living standards and rural household decision making. J. Rural Stud. 2020, 80, 23–33. [Google Scholar] [CrossRef]
  16. Wang, W.; Gong, H.; Yao, L.; Yu, L. Preference heterogeneity and payment willingness within rural households’ participation in rural human settlement improvement. J. Clean. Prod. 2021, 312, 127529. [Google Scholar] [CrossRef]
  17. Li, G.; Jiang, C.; Zhang, Y.; Jiang, G. Whether land greening in different geomorphic units are beneficial to water yield in the Yellow River Basin? Ecol. Indic. 2021, 120, 106926. [Google Scholar] [CrossRef]
  18. Zhou, D.; Xu, J.; Lin, Z. Conflict or coordination? Assessing land use multi-functionalization using production-living-ecology analysis. Sci. Total Environ. 2017, 577, 136–147. [Google Scholar] [CrossRef]
  19. Tian, F.; Li, M.; Han, X.; Liu, H.; Mo, B. A production–living–ecological space model for land-use optimisation: A case study of the core Tumen River region in China. Ecol. Model. 2020, 437, 109310. [Google Scholar] [CrossRef]
  20. Wu, J.; Zhang, D.; Wang, H.; Li, X. What is the future for production-living-ecological spaces in the Greater Bay Area? A multi-scenario perspective based on DEE. Ecol. Indic. 2021, 131, 108171. [Google Scholar] [CrossRef]
  21. Yang, Y.; Bao, W.; Liu, Y. Coupling coordination analysis of rural production-living-ecological space in the Beijing-Tianjin-Hebei region. Ecol. Indic. 2020, 117, 106512. [Google Scholar] [CrossRef]
  22. Xu, Q.; Song, W.; Zhang, Y. Forecast and optimal allocation of production, living and ecology water consumption in Zhangye, China. Phys. Chem. Earth. 2016, 96, 16–25. [Google Scholar] [CrossRef]
  23. Liao, T.; Li, D.; Wan, Q. Tradeoff of Exploitation-protection and Suitability Evaluation of Low-slope hilly from the perspective of “production-living-ecological” optimization. Phys. Chem. Earth. 2020, 120, 102943. [Google Scholar] [CrossRef]
  24. Zou, L.; Liu, Y.; Yang, J.; Yang, S.; Wang, Y.; Cao, z.; Hu, X. Quantitative identification and spatial analysis of land use ecological-production-living functions in rural areas on China’s southeast coast. Habitat Int. 2020, 100, 102182. [Google Scholar] [CrossRef]
  25. Yi, H.; Braham, W.W. Uncertainty characterization of building emergy analysis (BEmA). Build. Environ. 2015, 92, 538–558. [Google Scholar] [CrossRef]
  26. Yi, H.; Srinivasan, R.S.; Braham, W.W.; Tilley, D.R. An ecological understanding of net-zero energy building: Evaluation of sustainability based on emergy theory. J. Clean. Prod. 2017, 143, 654–671. [Google Scholar] [CrossRef]
  27. Andrić, I.; Pina, A.; Ferrão, P.; Lacarrière, B.; Le Corre, O. The impact of renovation measures on building environmental performance: An emergy approach. J. Clean. Prod. 2017, 162, 776–790. [Google Scholar] [CrossRef]
  28. Tilley, D.R. Dynamic accounting of emergy cycling. Ecol. Model. 2011, 222, 3734–3742. [Google Scholar] [CrossRef]
  29. Zhang, J.; Srinivasan, R.S.; Peng, C. A systematic approach to calculate unit emergy values of cement manufacturing in china using consumption quota of dry and wet raw materials. Buildings 2020, 10, 128. [Google Scholar] [CrossRef]
  30. Luo, Z.; Zhao, J.; Yao, R.; Shu, Z. Emergy-based sustainability assessment of different energy options for green buildings. Energy Convers. Manag. 2015, 100, 97–102. [Google Scholar] [CrossRef]
  31. Artuzo, F.D.; Allegretti, G.; Santos, O.I.B.; da Silva, L.X.; Talamini, E. Emergy unsustainability index for agricultural systems assessment: A proposal based on the laws of thermodynamics. Sci. Total Environ. 2021, 759, 143524. [Google Scholar] [CrossRef] [PubMed]
  32. Lewandowska-Czarnecka, A.; Buller, L.S.; Nienartowicz, A.; Piernik, A. Energy and emergy analysis for assessing changes in Polish agriculture since the accession to the European Union. Ecol. Model. 2019, 412, 108819. [Google Scholar] [CrossRef]
  33. Cristiano, S. Organic vegetables from community-supported agriculture in Italy: Emergy assessment and potential for sustainable, just, and resilient urban-rural local food production. J. Clean. Prod. 2021, 292, 126015. [Google Scholar] [CrossRef]
  34. Liu, Z.; Wang, S.; Xue, B.; Li, R.; Geng, Y.; Yang, T.; Li, Y.; Dong, H.; Luo, Z.; Tao, W.; et al. Emergy-based indicators of the environmental impacts and driving forces of non-point source pollution from crop production in China. Ecol. Indic. 2021, 121, 107023. [Google Scholar] [CrossRef]
  35. Xu, Q.; Yang, Y.; Hu, K.; Chen, J.; Djomo, S.N.; Yang, X.; Knudsen, M.T. Economic, environmental, and emergy analysis of China’s green tea production. Sustain. Prod. Consum. 2021, 28, 269–280. [Google Scholar] [CrossRef]
  36. Zhu, J.; Yuan, X.; Yuan, X.; Liu, S.; Guan, B.; Sun, J.; Chen, H. Evaluating the sustainability of rural complex ecosystems during the development of traditional farming villages into tourism destinations: A diachronic emergy approach. J. Rural Stud. 2021, 86, 473–484. [Google Scholar] [CrossRef]
  37. Falkowski, T.B.; Martinez-Bautista, I.; Diemont, S.A.W. How valuable could traditional ecological knowledge education be for a resource-limited future? An emergy evaluation in two Mexican villages. Ecol. Model. 2015, 300, 40–49. [Google Scholar] [CrossRef]
  38. Qu, Y.; Zhan, L.; Jiang, G.; Ma, W.; Dong, X. How to Address “Population Decline and Land Expansion (PDLE)” of rural residential areas in the process of Urbanization:A comparative regional analysis of human-land interaction in Shandong Province. Habitat. Int. 2021, 117, 102441. [Google Scholar] [CrossRef]
  39. Kong, X.; Liu, D.; Tian, Y.; Liu, Y. Multi-objective spatial reconstruction of rural settlements considering intervillage social connections. Rural Stud. 2021, 84, 254–264. [Google Scholar] [CrossRef]
  40. Qu, Y.; Jiang, G.; Ma, W.; Li, Z. How does the rural settlement transition contribute to shaping sustainable rural development? Evidence from Shandong, China. Rural Stud. 2021, 82, 279–293. [Google Scholar] [CrossRef]
  41. Gong, J.; Jian, Y.; Chen, W.; Liu, Y.; Hu, Y. Transitions in rural settlements and implications for rural revitalization in Guangdong Province. Rural Stud. 2022, 93, 359–366. [Google Scholar] [CrossRef]
  42. Li, G.; Fang, C.; Qi, W. Different effects of human settlements changes on landscape fragmentation in China: Evidence from grid cell. Ecol. Indic. 2021, 129, 107927. [Google Scholar] [CrossRef]
  43. Lu, Y.; Song, W.; Luy, Q. Assessing the effects of the new-type urbanization policy on rural settlement evolution using a multi-agent model. Habitat. Int. 2022, 127, 102622. [Google Scholar] [CrossRef]
  44. Cyriac, S.; Firoz, C.M. Dichotomous classification and implications in spatial planning: A case of the Rural-Urban Continuum settlements of Kerala, India. Land Use Policy 2022, 114, 105992. [Google Scholar] [CrossRef]
  45. Ji, Z.; Xu, Y.; Sun, M.; Liu, C.; Lu, L.; Huang, A.; Duan, Y.; Liu, L. Spatiotemporal characteristics and dynamic mechanism of rural settlements based on typical transects: A case study of Zhangjiakou City, China. Habitat. Int. 2022, 123, 102545. [Google Scholar] [CrossRef]
  46. Shi, Z.; Ma, L.; Zhang, W.; Gong, M. Differentiation and correlation of spatial pattern and multifunction in rural settlements considering topographic gradients: Evidence from Loess Hilly Region, China. J. Environ. Manag. 2022, 315, 115127. [Google Scholar] [CrossRef]
  47. Zhao, G.; Liang, R.; Li, K.; Wang, Y.; Pu, X. Study on the coupling model of urbanization and water environment with basin as a unit: A study on the Hanjiang Basin in China. Ecol. Indic. 2021, 131, 108130. [Google Scholar] [CrossRef]
  48. Couto, A.; Martins, P.; Sano, E.; Martins, E.; Vieira, L.; Salemi, L.; Vasconcelos, V. Data for: Terrain units, land use/cover, and gross primary productivity of the largest fluvial basin in the Brazilian Amazonia/Cerrado ecotone: The Araguaia River Basin. Data Br. 2021, 34, 106636. [Google Scholar] [CrossRef]
  49. Li, J.; Sun, W.; Li, M.; Linlin, M. Coupling coordination degree of production, living and ecological spaces and its influencing factors in the Yellow River Basin. J. Clean. Prod. 2021, 298, 126803. [Google Scholar] [CrossRef]
  50. Van Niekerk, A. A comparison of land unit delineation techniques for land evaluation in the Western Cape, South Africa. Land Use Policy 2010, 27, 937–945. [Google Scholar] [CrossRef] [Green Version]
  51. Hu, Q.; Wang, W. Quality evaluation and division of regional types of rural human settlements in China. Habitat. Int. 2020, 105, 102278. [Google Scholar] [CrossRef]
  52. Zhang, J.; Srinivasan, R.S.; Peng, C. Ecological assessment of clay brick manufacturing in china using emergy analysis. Buildings 2020, 10, 190. [Google Scholar] [CrossRef]
  53. Le Corre, O.; Truffet, L.; Lahlou, C. Odum-Tennenbaum-Brown calculus vs. emergy and co-emergy analysis. Ecol. Model. 2015, 302, 9–12. [Google Scholar] [CrossRef]
Figure 1. The technical framework of this research.
Buildings 13 00618 g001
Figure 3. Energetic flow diagram of the courtyard unit.
Buildings 13 00618 g003
Figure 4. Energetic flow diagram of the cluster unit.
Buildings 13 00618 g004
Figure 5. Energetic flow diagram of the village unit.
Buildings 13 00618 g005
Figure 6. System dynamics causal relationship diagram of the rural human settlement unit.
Buildings 13 00618 g006
Figure 7. Dynamic emergy evaluation indices prediction of the village unit. (a) ESR prediction; (b) EIR prediction; (c) EYR prediction; (d) ELR prediction; and (e) ESI prediction.
Buildings 13 00618 g007aBuildings 13 00618 g007b
Table 1. Existing methods for sustainability assessments with evaluation indicator comparisons.
Assessment OrientationsAssessment MethodsAssessment Goals
Agricultural production [38]System dynamics [39]Spatial planning and management [40]
Living habitat arrangement [41]Emergy analysis [42]Energy source utilization [43]
Ecological environment [44]Analytic hierarchy process [45]Cultural revitalization [46]
Table 2. Emergy input and output of the courtyard unit.
ItemRaw DataUnitTransformity
(sej/Unit)
Solar Emergy
(sej)
Renewable natural resources
(R)
Sunlight2.30 × 1016J12.30 × 1016
Rain chemical3.68 × 109J3.05 × 1041.12 × 1014
Rain potential4.77 × 107J4.70 × 1042.24 × 1012
Total2.31 × 1016
Non-renewable purchased resources (P)Construction3.50 × 103$3.40 × 10121.19 × 1016
Maintenance2.00 × 102$3.40 × 10126.80 × 1014
Equipment5.80 × 102$3.40 × 10121.97 × 1015
Municipal electricity60.40$3.40 × 10122.05 × 1013
Municipal water16.30$3.40 × 10125.54 × 1012
Total1.46 × 1016
Organic resources (O)Labor force7.45 × 108J7.24 × 1065.39 × 1015
Total input4.30 × 1016
Planting (Y)Bean5.49 × 109J6.90 × 1053.79 × 1015
Vegetable1.35 × 1011J8.30 × 1041.11 × 1016
Fruit2.54 × 109J5.30 × 1051.35 × 1015
Potato1.96 × 1010J8.30 × 1041.63 × 1015
Total1.79 × 1016
Breeding (Y)Pork6.38 × 109J4.00 × 1062.55 × 1016
Beef1.73 × 109J4.00 × 1066.92 × 1015
Poultry2.12 × 109J1.70 × 1063.60 × 1015
Dairy4.12 × 108J2.00 × 1068.24 × 1014
Egg6.31 × 108J2.00 × 1061.26 × 1015
Total3.81 × 1016
Others (Y)Photovoltaic power1.06 × 1010J1.65 × 1051.75 × 1015
Total output5.77 × 1016
Table 3. Emergy evaluation index calculation of the courtyard unit.
ItemValue
Emergy input of renewable natural resources (R)2.31 × 10¹⁶
Emergy input of non-renewable natural resources (N)——
Total emergy input of natural resources (I)2.31 × 10¹⁶
Emergy of non-renewable purchased resources (F)1.46 × 10¹⁶
Emergy input of organic resources (O)5.39 × 10¹⁵
Total emergy input of auxiliary resources (U)1.99 × 10¹⁶
Total emergy input (T)4.30 × 10¹⁶
Total emergy output (Y)5.77 × 10¹⁶
Emergy self-sufficiency ratio (ESR)53.67%
Emergy investment ratio (EIR)86.34%
Net emergy yield ratio (EYR)289.48%
Environmental load ratio (ELR)86.34%
Emergy sustainable indices (ESI)3.35
Table 4. Emergy input and output of the cluster unit.
ItemRaw DataUnitTransformity
(sej/Unit)
Solar Emergy
(sej)
Renewable natural resources (R)Sunlight4.84 × 1018J14.84 × 1018
Rain chemical2.01 × 1012J3.05 × 1046.13 × 1016
Rain potential4.23 × 1010J4.70 × 1041.99 × 1015
Total4.90 × 1018
Non-renewable natural resources (N)Net topsoil loss7.56 × 1011J1.7 × 1051.29 × 1017
Non-renewable
purchased resources (P)
Construction1.05 × 106$3.40 × 10123.58 × 1018
Maintenance7.31 × 104$3.40 × 10122.49 × 1017
Equipment6.80 × 105$3.40 × 10122.31 × 1018
Municipal electricity9.74 × 102$3.40 × 10123.31 × 1014
Municipal water5.82 × 102$3.40 × 10121.98 × 1014
Total6.14 × 1018
Organic resources (O)Labor force2.93 × 1011J7.24 × 1062.23 × 1018
Total input1.34 × 1019
Planting (Y)Bean4.78 × 1011J6.90 × 1053.30 × 1017
Vegetable6.52 × 1011J8.30 × 10195.41 × 1016
Fruit1.09 × 1011J5.30 × 1055.78 × 1016
Potato1.96 × 1012J8.30 × 1041.63 × 1017
Corn8.36 × 1012J4.90 × 1054.10 × 1018
Wheat9.73 × 1012J5.10 × 1054.96 × 1018
Oil plant5.14 × 1010J6.90 × 1053.55 × 1016
Total9.70 × 1018
Breeding (Y)Pork1.02 × 1012J4.00 × 1064.09 × 1018
Beef5.68 × 1011J4.00 × 1062.27 × 1018
Poultry4.35 × 1011J1.70 × 1067.40 × 1017
Dairy8.26 × 109J2.00 × 1061.65 × 1016
Egg1.77 × 1011J2.00 × 1063.54 × 1017
Total7.47 × 1018
Others (Y)Biogas energy5.65 × 1012J1.65 × 1059.32 × 1017
Total output1.81 × 1019
Table 5. Emergy evaluation index calculation of the cluster unit.
ItemValue
Emergy input of renewable natural resources (R)4.90 × 10¹⁸
Emergy input of non-renewable natural resources (N)1.29 × 10¹⁷
Total emergy input of natural resources (I)5.03 × 10¹⁸
Emergy of non-renewable purchased resources (F)6.14 × 10¹⁸
Emergy input of organic resources (O)2.23 × 10¹⁸
Total emergy input of auxiliary resources (U)8.37 × 10¹⁸
Total emergy input (T)1.34 × 10¹⁹
Total emergy output (Y)1.81 × 10¹⁹
Emergy self-sufficiency ratio (ESR)37.53%
Emergy investment ratio (EIR)166.48%
Net emergy yield ratio (EYR)215.76%
Environmental load ratio (ELR)170.84%
Emergy sustainable indices (ESI)1.26
Table 6. Emergy input and output of the village unit.
ItemRaw DataUnitTransformity (sej/Unit)Solar Emergy (sej)
Renewable natural resources (R)Sunlight6.36 × 1019J16.36 × 1019
Rain chemical3.32 × 1013J3.05 × 1041.01 × 1018
Rain potential4.64 × 1011J4.70 × 1042.18 × 1016
Total6.46 × 1019
Non-renewable natural resources (N)Net topsoil loss1.02 × 1013J1.70 × 1051.74 × 1018
Non-renewable purchased resources (P)Construction1.42 × 107$3.40 × 10124.84 × 1019
Maintenance8.95 × 105$3.40 × 10123.04 × 1018
Equipment8.40 × 106$3.40 × 10122.85 × 1019
Municipal electricity2.73 × 104$3.40 × 10129.28 × 1016
Municipal water7.48 × 103$3.40 × 10122.54 × 1016
Total9.95 × 1019
Organic resources (O)Labor force4.96 × 1012J7.24 × 1063.59 × 1019
Total input2.02 × 1020
Planting (Y)Bean6.57 × 1012J6.90 × 1054.53 × 1018
Vegetable8.05 × 1012J8.30 × 1046.68 × 1017
Fruit2.13 × 1012J5.30 × 1051.13 × 1018
Potato4.24 × 1013J4.90 × 1052.08 × 1019
Corn5.10 × 1012J1.48 × 1057.55 × 1017
Wheat8.67 × 1013J5.10 × 1054.42 × 1019
Oil plant2.03 × 1013J8.30 × 1041.68 × 1018
Total7.38 × 1019
Breeding (Y)Pork1.71 × 1013J4.00 × 1066.85 × 1019
Beef8.95 × 1012J4.00 × 1063.58 × 1019
Poultry4.35 × 1011J1.70 × 1067.40 × 1017
Dairy1.05 × 1011J2.00 × 1062.09 × 1017
Egg2.12 × 1012J2.00 × 1064.24 × 1018
Total1.09 × 1020
Others (Y)Biogas energy3.83 × 1013J1.65 × 1056.32 × 1018
Processing product5.24 × 106$3.40 × 10121.78 × 1019
Service8.71 × 106$3.40 × 10122.96 × 1019
Total5.37 × 1019
Total output2.37 × 1020
Table 7. Emergy evaluation index calculation of the village unit.
ItemValue
Emergy input of renewable natural resources (R)6.46 × 10¹⁹
Emergy input of non-renewable natural resources (N)1.74 × 10¹⁸
Total emergy input of natural resources (I)6.63 × 10¹⁹
Emergy of non-renewable purchased resources (F)9.95 × 10¹⁹
Emergy input of organic resources (O)3.59 × 10¹⁹
Total emergy input of auxiliary resources (U)1.35 × 10²⁰
Total emergy input (T)2.02 × 10²⁰
Total emergy output (Y)2.37 × 10²⁰
Emergy self-sufficiency ratio (ESR)32.88%
Emergy investment ratio (EIR)204.16%
Net emergy yield ratio (EYR)174.98%
Environmental load ratio (ELR)212.36%
Emergy sustainable indices (ESI)0.82
Table 8. Dynamic emergy prediction model verification.
ItemYearSimulation ValueActual ValueFractional Error
ESR20170.380.365.56%
20180.360.345.88%
20190.350.342.94%
20200.330.330%
EIR20171.971.922.60%
20182.021.953.59%
20192.052.011.99%
20202.082.041.96%
EYR20171.741.72.35%
20181.751.721.74%
20191.771.751.14%
20201.781.751.69%
ELR20171.991.866.99%
20182.051.988.59%
20192.142.073.38%
20202.312.128.96%
ESI20170.750.795.06%
20180.760.793.80%
20190.770.814.94%
20200.80.82.44%
Disclaimer/Publisher’s Note: The statements, opinions and data contained in all publications are solely those of the individual author(s) and contributor(s) and not of MDPI and/or the editor(s). MDPI and/or the editor(s) disclaim responsibility for any injury to people or property resulting from any ideas, methods, instructions or products referred to in the content.

