Article

Experimental Evidence of the Coupling between the Energy Charge–Discharge and Natural Ventilation in a Full-Scale Passive Building

1
University of Bordeaux, CNRS UMR 5295, Arts et Metiers Institute of Technology, Bordeaux INP, INRAE, I2M Bordeaux, 33400 Talence, France
2
GRECCAU, EA 7482, ENSAP Bordeaux, 33405 Talence, France
3
Faculty of Mechanical Engineering, Universidad Tecnologica de Panama, Panama City 0819, Panama
4
Centro de Estudios Multidisciplinarios en Ciencias, Ingeniería y Tecnología AIP (CEMCIT-AIP), Panama City 0819, Panama
5
Sistema Nacional de Investigación (SNI), Clayton 0816-02852, Panama
*
Author to whom correspondence should be addressed.
Buildings 2023, 13(3), 632; https://doi.org/10.3390/buildings13030632
Submission received: 21 January 2023 / Revised: 22 February 2023 / Accepted: 24 February 2023 / Published: 27 February 2023
(This article belongs to the Section Building Energy, Physics, Environment, and Systems)

Abstract

:
An experimental study was carried out on a full-scale passive building equipped with global and local instrumentation with the aim of characterizing the energy charge and discharge processes and their coupling to the outdoor thermal stresses, especially natural ventilation in the summertime. The characterization of both charge and discharge processes is necessary to understand the thermal behavior of a building. From the measurement campaigns, the coupling between the charge–discharge and natural ventilation was qualitatively highlighted by the dynamics of the convective heat flux at each instrumented surface of the envelope. From the analysis of the experimental data, during the charge process, the floor and ceiling play an essential role in the attenuation of the rising of the indoor air temperature, while the south-facing glazed facade contributes the most to the heating of the indoor air. During the discharge process, the floor surface also plays an important role in the discharge of the envelope elements since the floor is the colder surface of the envelope. A parametric analysis of the coupling was also performed and showed that it is necessary to consider the convective effects on the slab surface, the ceiling, and the glazed facade individually due to their behavior.

1. Introduction

The experimental study of the natural ventilation process and its coupling with thermal mass has not been much addressed in comparison to numerical studies, mostly because of the economic implications resulting from installing instruments in full-scale buildings and also due to the knowledge of such coupling that might be based upon analytical analysis alone. The experimental-based understanding of such coupling could help manage the building charge–discharge process. During such a process, in a 24-h day–night cycle in the summertime, the building is submitted to different thermal stresses that are specially presented in two separate periods: the daytime and nighttime. During the daytime, the building experiences a charge process in which the principal heat source is solar power, which manifests in the form of solar radiation (direct and diffuse) and is the leading cause of wind and the rising of the outdoor air temperature. During the nighttime, the solar power vanishes, causing a drop in the outdoor air temperature. The building experiences a discharge process, in which the building could evacuate the heat stored by opening the windows.
However, it seems that such knowledge, inherited from mathematical manipulation of conservation equations, has led to sufficient evidence of the understanding of such coupling [1,2,3,4,5,6], which relies mainly on three key elements: (i) heat transfer in the indoor air, (ii) heat transfer in the thermal mass, and (iii) ventilation airflow rate.
Zhou et al. [6] developed a simple tool to estimate the amount of internal thermal mass needed, i.e., furniture, in order to maintain a desirable indoor air temperature by increasing the time constant. Yam et al. [4] showed that the consideration of nonlinearity does not change the behavior of the indoor air temperature when a periodic (perfect) outdoor air temperature profile is considered. Yang and Guo [5] showed that the coupling between thermal mass and buoyancy inside a building could lead to multi-frequency (or anharmonic) fluctuation of natural ventilation. The phase shifts of the high-order indoor air temperature fluctuation terms (with respect to the 1st-order outdoor air temperature fluctuation term) can exceed π /2. Holford and Woods [2] concluded that the temperature fluctuation could only be concentrated at the surface for thermal mass with thick layers. However, the lumped-capacitance approximation is useful in fundamentally investigating the thermal balance in a naturally ventilated space.
The numerical study of the coupling heat and mass transfer in buildings has been of high interest in past years. Analyzing the behavior of heat and mass transfer from a numerical perspective opens several advantages because they are primarily based on fundamental equations, such as model-based analysis [1,2,4,5,6,7,8], dynamics thermal simulation [9,10,11], and computational fluid dynamics (CFD) [12,13,14,15]. From these studies, various disadvantages can be examined: (i) the difficulty in estimating airflow paths in such low velocities’ magnitudes (when considering thermal buoyancy effects only); (ii) the difficulty in accounting for pressure coefficients (when considering wind effects); (iii) the large amount of time and resources are dedicated to solving the equations; and (iv) the validation of such CFD-based models requires detailed local instrumentation, depending on the granularity of the models.
The experimental study of only the natural ventilation process has achieved and continues to be of high interest in different countries, despite the high instrumentation and equipment costs. In most cases, when it is performed, the experimental study mostly concerns the airflow characteristics of the building rather than its coupling with the thermal characteristics [16,17,18,19,20]. Caciolo et al. [16] also focused on the airflow rate characteristics for a single-sided natural ventilation strategy by placing various hot-wire anemometers at the openings. The particle image velocimetry (PIV) technique was also implemented to compare the airflow characteristics obtained from direct airspeed measurements. In Faggianelli et al. [17], the experiment included local airspeed and heat flux measurements. However, this experiment prioritized assessing the airflow rate in a cross-ventilation strategy rather than the thermal interactions between thermal mass and natural ventilation. To determine the airflow rate, several hot-wire anemometers were locally placed at one of the openings to assemble a grid. Each local measurement was later employed to estimate the airflow rate.
However, studies that aimed to obtain experimental evidence on coupling heat and mass transfer have generally implemented global instrumentation of the building [18,19,20,21,22,23]. Here, global instrumentation refers to a set of instruments dedicated to measuring global parameters, i.e., air change rate (e.g., airtightness tests, tracer gas methods) or one-point indoor air temperature measurement. In Omrani et al. [18], the experimental study in a 36-storey building focused on the natural ventilation effect regarding thermal comfort during summertime (13–15 January 2016) under the subtropical climate zone of Brisbane, Australia. Gagliano et al. [22], in Siracusa on Ortigia Island, performed an experimental study for 18 days during summertime in a university building and obtained actual evidence that ventilation (specifically nocturnal) indeed has an interaction with the thermal mass, which is manifested in the modification of the thermal lag in comparison when no natural ventilation is implemented. It was concluded that high thermal mass coupled with nocturnal ventilation indeed allows maintaining comfortable temperatures during nighttime but confirmed that such coupling is not enough to maintain comfort levels during daytime. These results show that a high thermal mass and implementing natural ventilation do not guarantee standard comfort levels [22] (Gagliano et al., 2015). Clearly, the latter is highly dependent on natural ventilation effectiveness associated with outdoor wind speed, and wind direction, among other things, inherent to the building architecture.
Thus, the present study aimed firstly to provide experimental evidence of the coupling between the natural ventilation (NV) and the energy charge–discharge by quantifying convective and radiative interactions with the thermal mass subjected to three NV scenarios at a full-scale passive building in summertime. Such evidence will enrich the extensive numerical studies in the literature. Secondly, the aim was to further provide reference information for simplifying modeling of the thermal behavior of passive buildings via parametric analyses. This understanding might help enhance and develop more efficient automated natural ventilation–thermal mass-coupled systems for the management of summer thermal comfort. Such management is achieved by controlling the moving parts of the envelope, via such features as solar protections (window blinds, shutters), and natural ventilation openings [24]. These moving parts allow controlling the radiative and convective interactions between the indoor and outdoor environments [25].

2. Materials and Methods

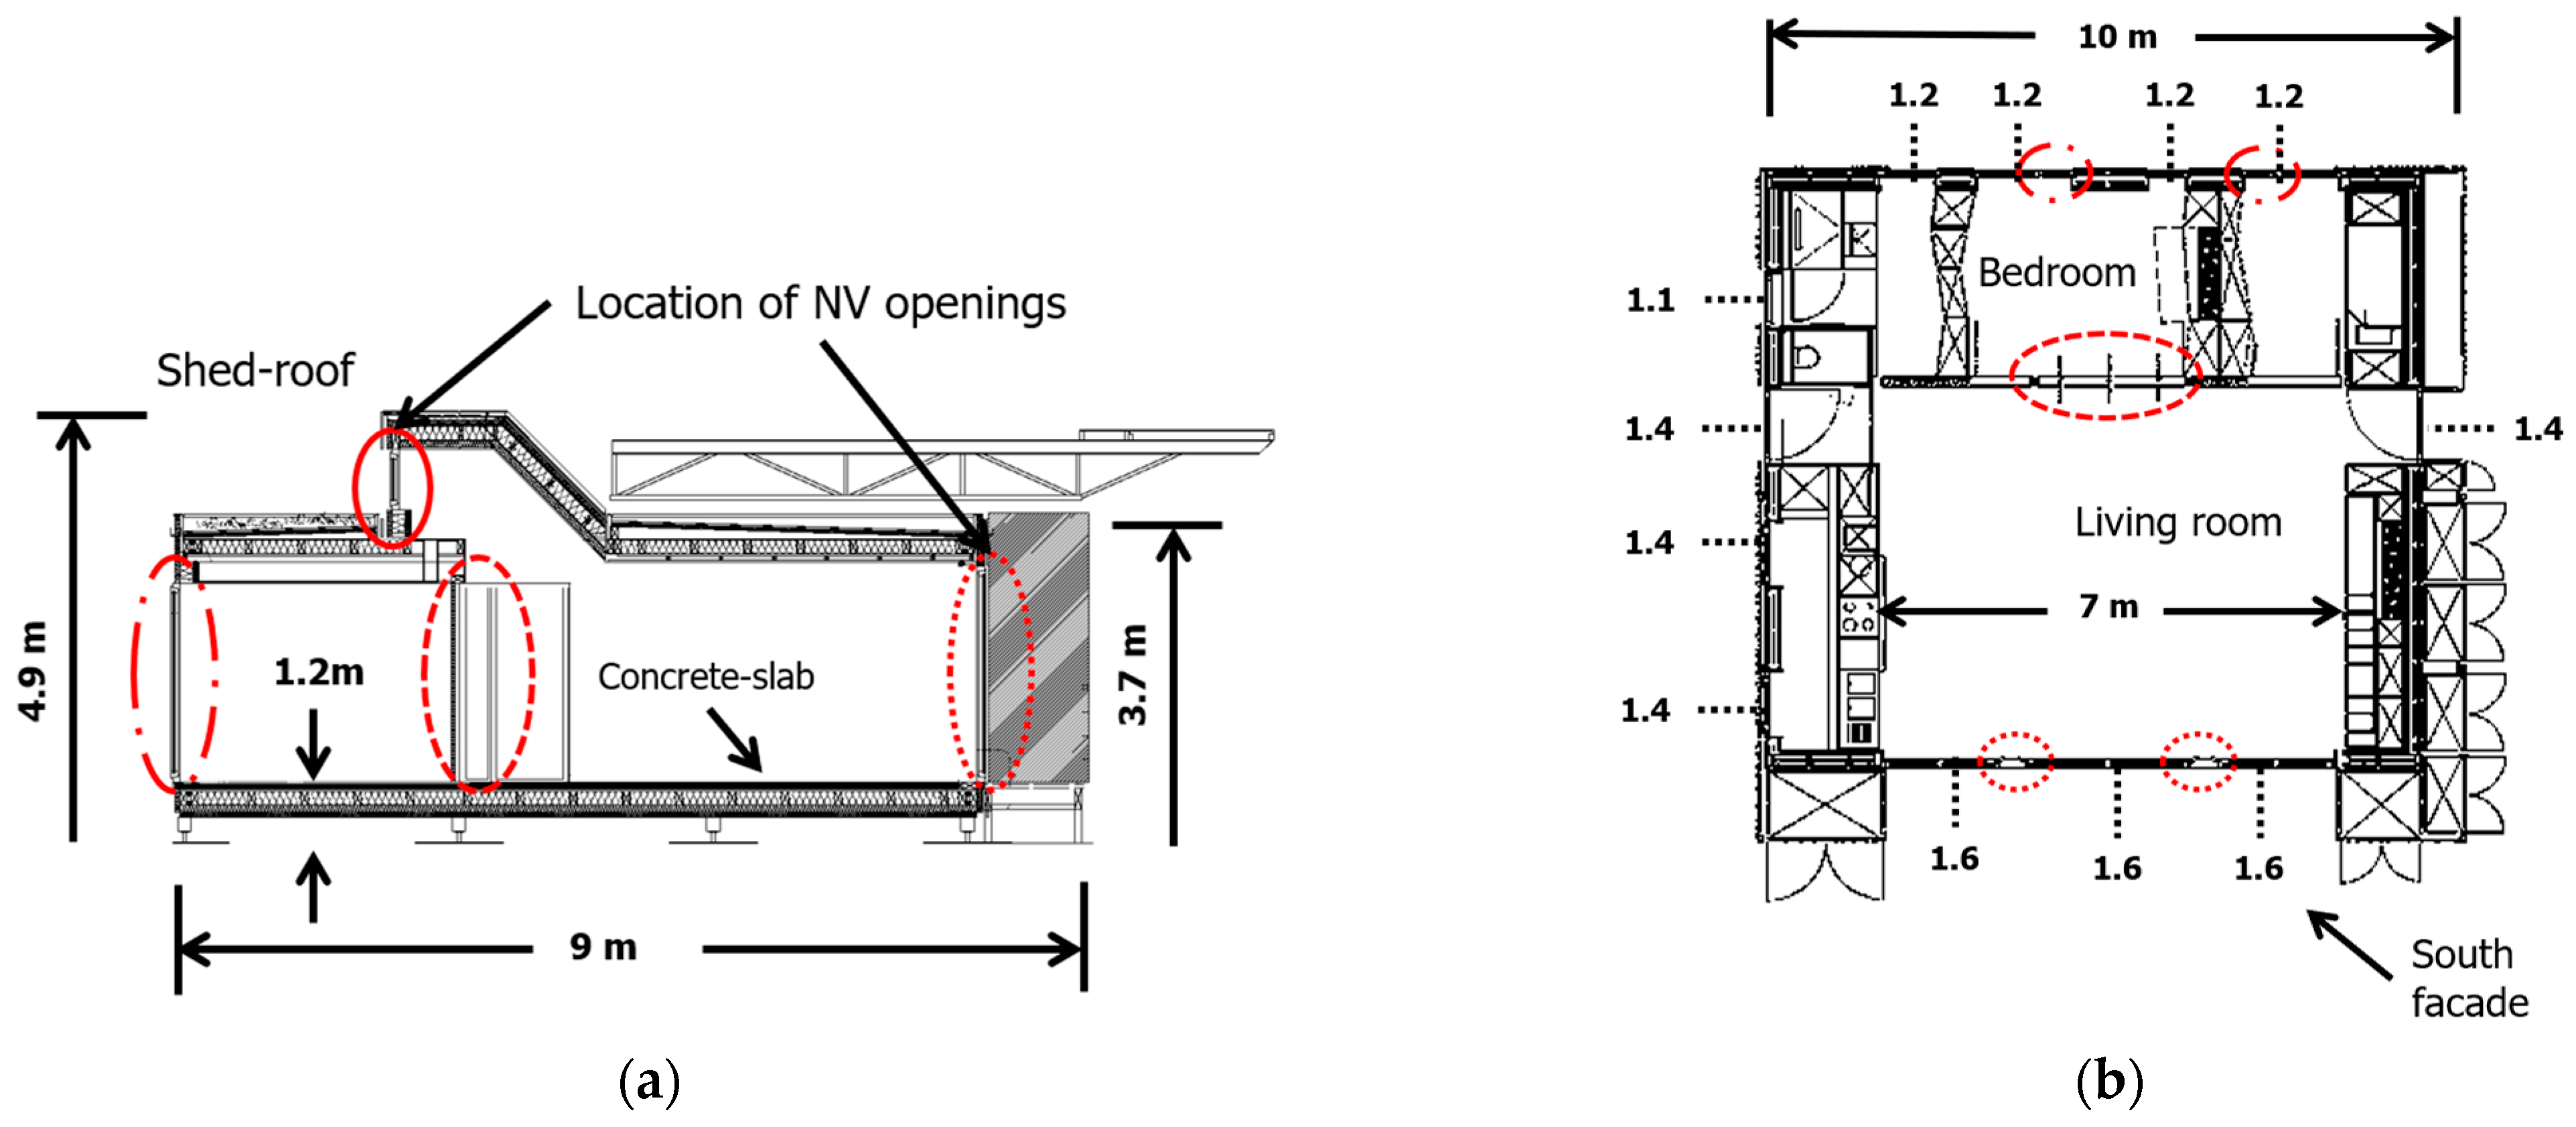
2.1. Description of the Building

The building employed for performing the experimental-based study was a positive energy house (PEH) prototype in Bordeaux, Southwest France (44°47′28.5″ N 0°36′22.0″ W), named Sumbiosi. As part of its participation in the Solar Decathlon Europe 2012 competition, this prototype was designed to promote passive energy storage in winter daytime and semi-passive energy discharge in summer nighttime.
The building consists of three main architectural features that aid in promoting the strategies of passive energy charge and semi-passive energy discharge, shown respectively, in Figure 1: a concrete slab behind the south-facing façade with large double-glazed windows (a); fixed and programmable solar shades (b)–(d); and programmable natural ventilation openings (PNVO) on the south and north facades, and the shed roof (red rectangles, (b)–(d)). In principle, these solar shades and PNVO allow the platform to control the heat loads in the form of radiative and convective heat exchanges with the outdoor environment.
The natural ventilation system of the platform, controlled by the home automation system, which allows automation of the opening–closing configurations of the natural ventilation openings, is equipped with ten programmable openings. These openings are of the type “horizontal axis-tilted window” (also known as tilt windows or bottom-hung windows) and are restricted to a maximum inwardly opening angle of 20° (Figure 1b,d). There are also three manual door-like openings located in an internal wall separating the living room and the bedroom, to promote cross-ventilation strategies (Figure 1d).
The southern facade has four natural ventilation openings of the same dimensions, being 1.20 × 0.35 m2 (Figure 1b), while the four openings in the north facade have different dimensions, all four being 1.10 × 0.43 m2 (Figure 1c). Finally, the shed roof contains two window openings, having dimensions of 0.55 × 2.20 m2 (Figure 1d). A schematic of the western façade and top views of the platform architectural plans, showing the location of the natural ventilation openings and the floor concrete slab, is shown in Figure 2.
The eastern and western facades were made of an external structure in maritime pine and an internal structure in wooden furnishes, with indoor and outdoor cabinets (Figure 2b). They served as thermal buffers. The internal structure of the north, east, and west facades, as well as the ceiling and floor, included a thermal insulation layer of about 32 cm.
The south and north facades included natural ventilation openings, and the area of the openings was 9.58 and 7.51%, respectively, of the façade surface. The platform envelope enclosed an air volume of about 211 m3, with an envelope surface of about 226 m2. The values of the global heat transfer coefficient for principal doors and windows, which were in direct contact with the indoor and outdoor environments, are presented in Figure 2b. Table 1 summarizes the thermal characteristics of the building envelope.
In the summer daytime the platform employed these architectural features to attenuate the incoming heat (charge in the form of convective and radiative heat exchanges due to solar gains, wind, and air temperature) by closing both the solar shades and the natural ventilation openings. In the summer nighttime, the platform configured its natural ventilation system to promote the releasing (or discharging) of the heat stored during the daytime, depending on the wind, air temperature, and rain. Given its characteristic and the intention of the platform design, the floor concrete slab played an important role in the energy charge–discharge process. Since this slab was the thermally heavier-weighted element in the platform envelope, it was considered the starting hypothesis that most of the thermal mass was concentrated in the concrete slab.

2.2. Experimental Approach

To study the energy charge and discharge processes experienced by the platform, resulting from the outdoor thermal stresses (inputs) reflected in the indoor environment, the platform was instrumented in terms of temperature, heat flux, and wind speed measurements. This experimental approach aimed to observe, comprehend, and quantify the thermal response of the platform and its floor concrete slab under different inputs, especially natural ventilation. These input–output relations are represented in Figure 3a, where the thermal behavior of the platform (building domain) can be studied by the following outputs: indoor air temperature, natural airflow rate, the heat stored in the indoor air, and mean radiant temperature.
Similarly, the thermal response of the floor concrete slab (thermal mass domain) (see Figure 3b) could be studied by focusing on the surface energy balance, SEB) between the building domain and the outdoor thermal stresses. Thus, its behavior could be studied by the following outputs (see Figure 3b): the floor concrete-slab surface temperature, the convective heat flux, the radiative heat flux, and the heat stored in the slab.
Finally, this level of instrumentation led to connecting the convective heat flux to the natural airflow and the radiative heat flux to the surrounding surfaces of the indoor environment through the mean radiant temperature (MRT). In addition, regarding the radiative heat transfer between the floor and surrounding surfaces, the ceiling and glazed-facade surfaces were also equipped with instruments to measure temperature and heat flux.

2.2.1. Experimental Setup

The instrumentation of the building consisted of implementing various couples of black and shiny thermoelectric modules as heat flux meters (sensitivity of 239 ± 3 μ Vm 2 / W ). Such a couple of heat flux meters allowed us a priori to measure the total heat flux (with the black coating) and the convective heat flux (with the shiny coating). This technique has been widely used by former researchers [26,27,28,29]. Using an analytical model based on the heat flux balance over each coated surface, the convective and radiative parts are estimated by the knowledge of both emissivity values [30,31]. These three surfaces (floor, ceiling, and glazed facade) were also instrumented in terms of air and surface temperatures using type T thermocouples (±0.48 °C).
Ten black-and-shiny couples were distributed all over the concrete-slab surface for the floor surface (see Figure 4). By installing more black-and-shiny couples, special attention was given to the areas between both natural ventilation openings.
For the ceiling and glazed-facade surfaces, only one black-and-shiny couple was installed at the center of each surface to monitor their thermal behavior. Moreover, the thermal behavior of all the remaining non-instrumented surfaces was monitored using an infrared camera (±2 °C) (see Figure 4) as viewed from the floor. The latter allowed us to measure the MRT as viewed from the floor.
The instrumentation of the building domain consisted of a meteorological station located at 1.8 km (location, 44°48′14.84″ N 0°36′08.10″ W) from the building site (solar radiation, air temperature, and wind speed and direction). The global behavior of the building was monitored by using a type T thermocouple (±0.48 °C, range of −67 to 40 °C) at the center of the indoor environment at 1.70 m above the floor. Table 2 presents details of the instruments used.

2.2.2. Measurement Campaigns and Protocol

To highlight and understand the energy charge and discharge processes of the platform submitted to the outdoor thermal stresses during the summertime, the experimental plan for the measurement campaign in 2016 and 2017 consisted of the following points:
  • All data from the instruments, except for the infrared (IR) camera FLIR A320, were collected continuously at a 1 min time step. The data from the IR camera were collected at a sample time of 30 min regarding the computer storage limit.
  • The window blinds were kept closed during the entire measurement campaign to filter most solar radiation. The natural ventilation openings were programmed with the home automation system: the openings opened whenever the outdoor air temperature became lower than the indoor air temperature. Openings were closed otherwise and when raining. Only the openings at the south facade and shed roof were functional due to technical problems; the openings at the north facade remained closed.
  • The platform was unoccupied during the entire measurement campaign, and the lights remained turned off. However, two computers remained operational: one for data collection and one for controlling the home automation system.
  • Since the inside of the platform was divided into four zones (the living room, bedroom, bathroom, and toilet), all doors dividing these zones were kept open to mix the air of all four zones.
Another measurement campaign was performed in the summertime of 2017. During this period, natural ventilation openings (NVO) were programmed to implement other configurations of the openings. NVO were always kept open and always closed. All measurement campaigns carried out during the summertime of 2016 and 2017 are summarized in Table 3. Due to unsuitable weather conditions during June–August, note here that the measurements were carried out in May and September, which are out of the summertime period. However, during these months in 2017, a heatwave affected western and central Europe [32]. This was an advantage for the study since weather similar to summertime was encountered. According to the French forecast, the temperature in May was between 2 and 10 °C higher than the seasonal normal.

2.3. Parametric Analysis of the Coupling
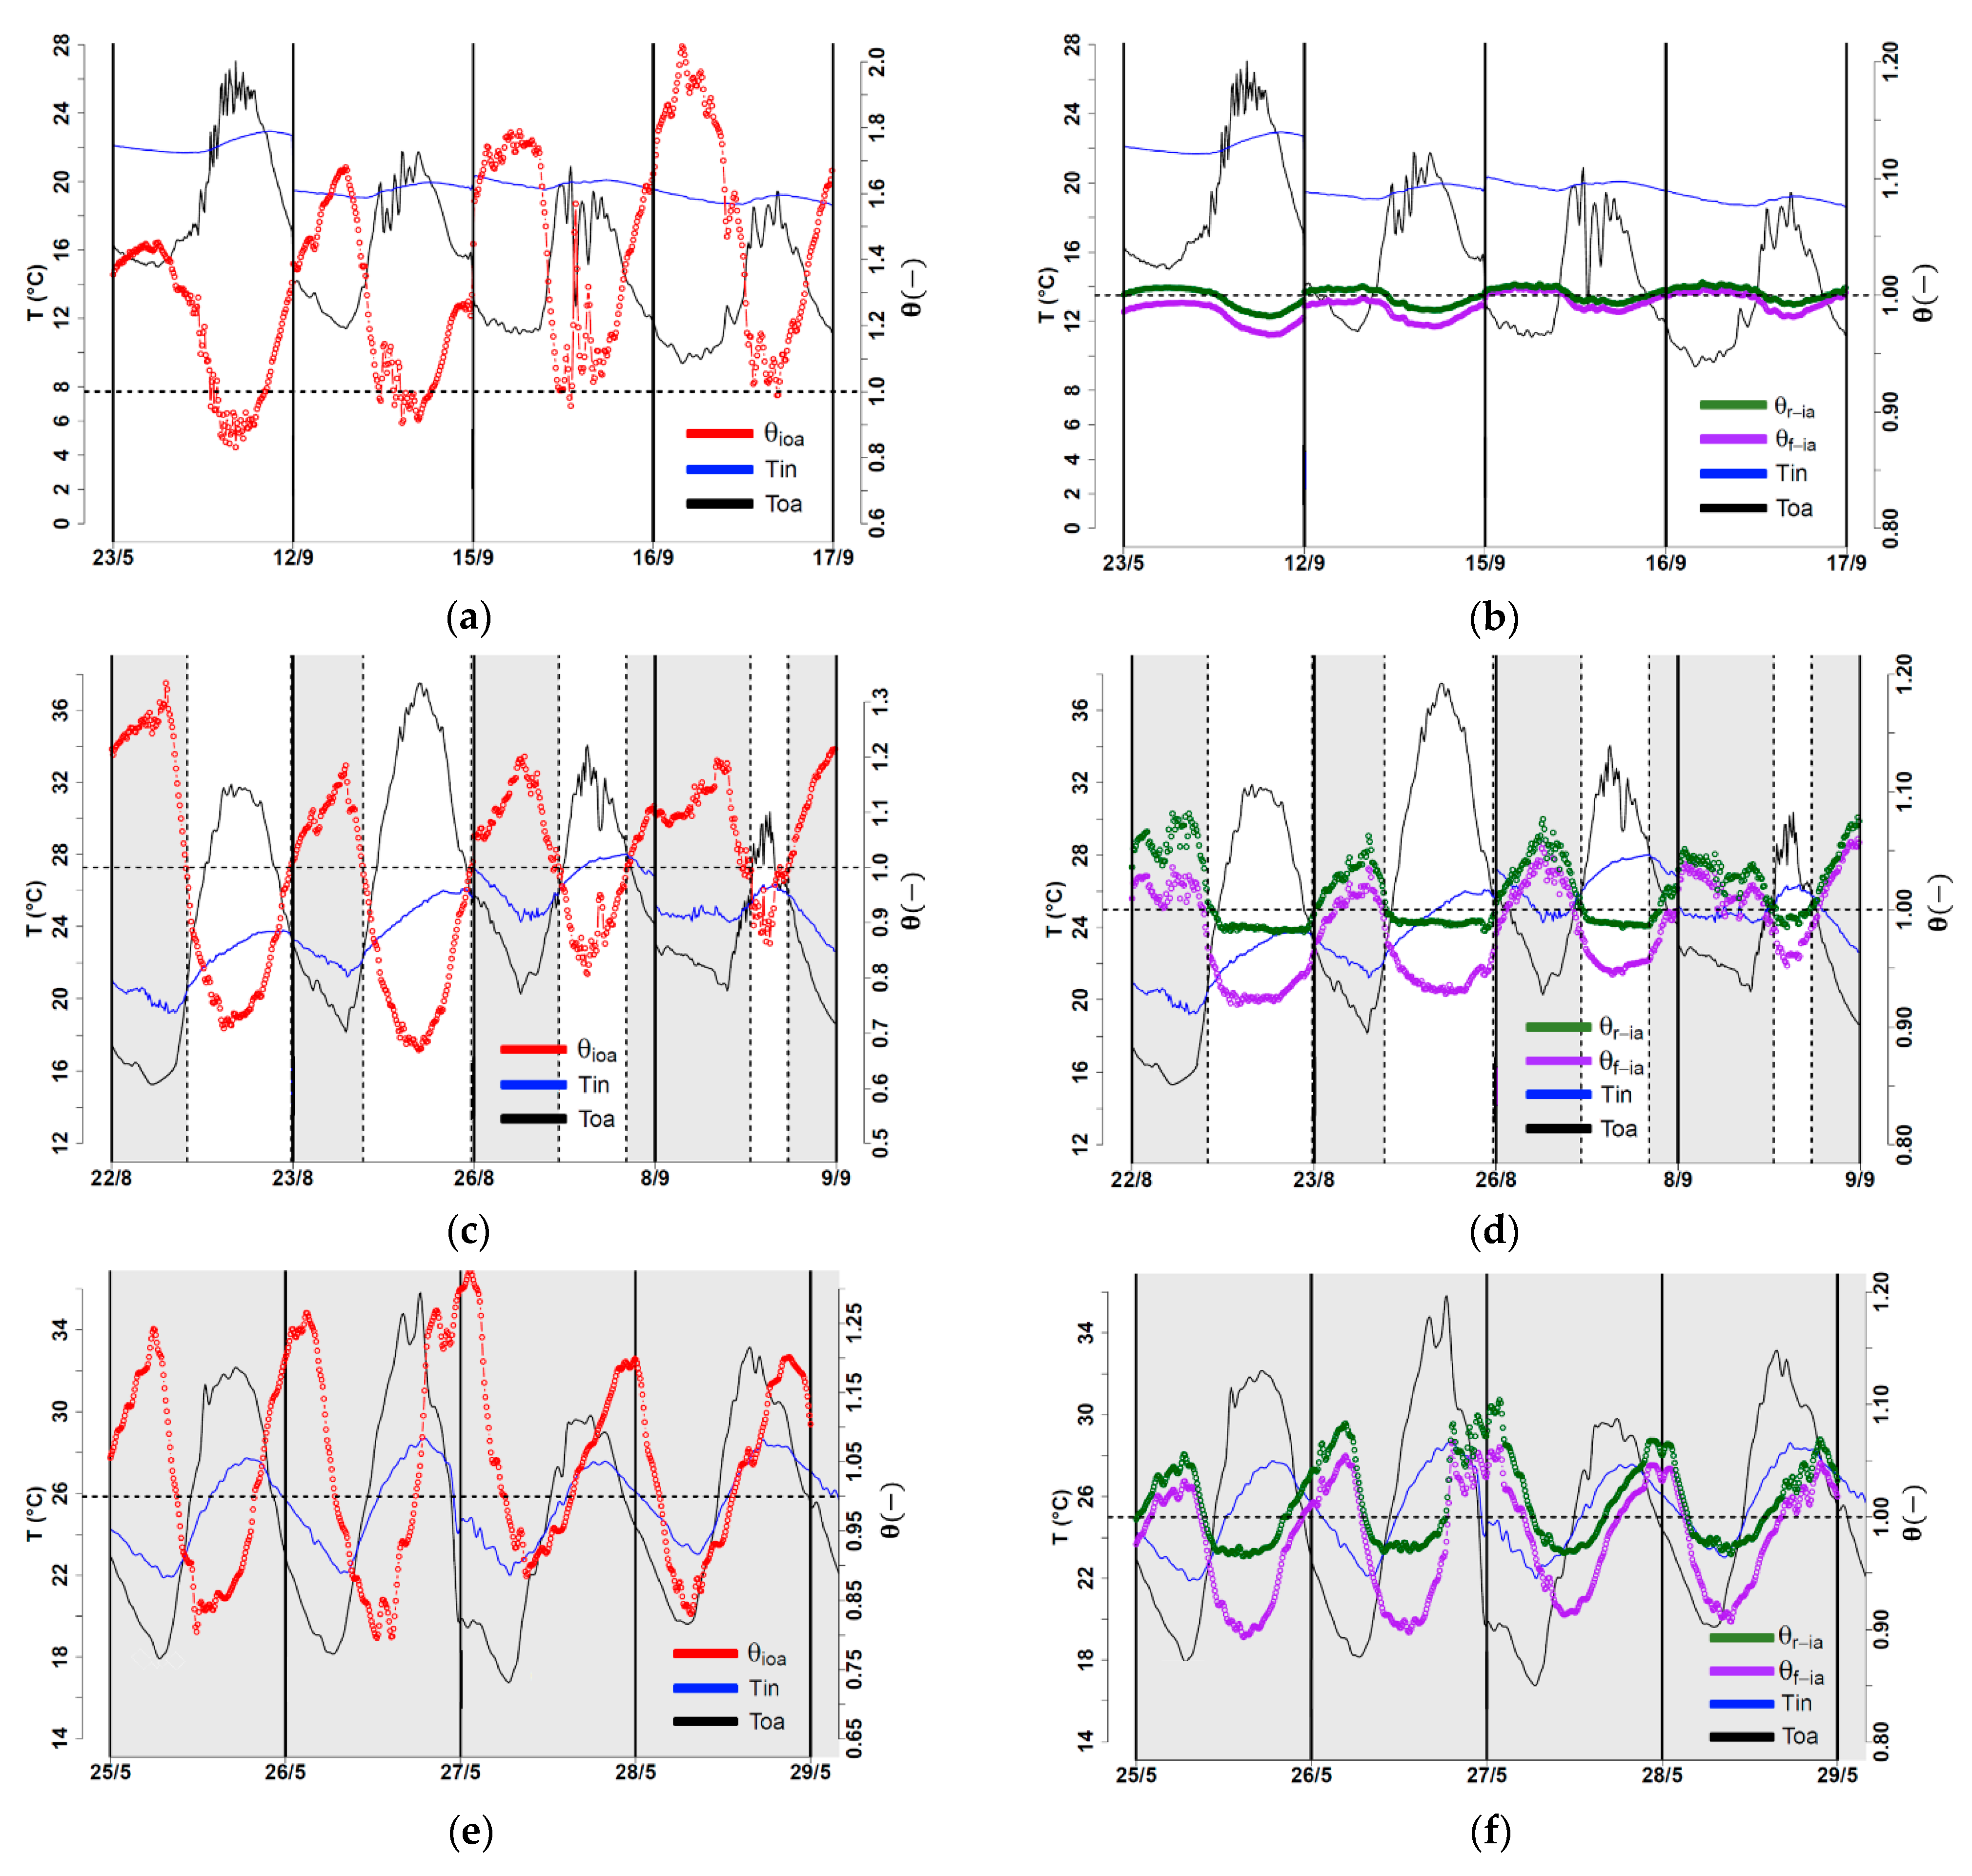
To further study the coupling between natural ventilation and the energy charge–discharge, a parametric analysis was performed based on the temperature measurements and, secondly, on the convective heat transfer coefficient. In this way, the relative natural ventilation potential and the contribution of each envelope element could be assessed. To perform this analysis, some dimensionless parameters were introduced, based on [4,5,6] (see Table 4).
The concept behind these two dimensionless parameters ( θ i o a and θ S i i a ) helps to characterize some attributes of the building as its thermal inertia and natural ventilation potential. The parameter θ i o a simply compares the magnitudes of both the indoor and outdoor air temperatures as T i n / T o a . Depending on the value this parameter takes, three interpretations can be drawn:
  • When θ i o a > 1 , indicates T i n > T o a . From the building point of view (a global perspective), there is an available natural ventilation potential in the form of cooling. In the summertime, this scenario occurs during the nighttime. The best strategy for the building is to activate its natural ventilation system (NVS) to take advantage of this free cooling potential. The greater the value of θ i o a , the higher the potential available. However, this potential depends on other variables, where the windspeed and direction play an important role and need to be known to give a close estimation of the cooling potential available completely.
  • When θ i o a < 1 , indicates T i n < T o a . In the summertime, this occurs normally during the daytime. The best strategy for the building is to close every moving part of the envelope to attenuate the incoming outdoor heat wave. In this case, the closer to zero is θ i o a , the more efficient the thermal inertia of the building.
  • When θ i o a   ~   1 , indicates T i n ~   T o a . A thermal equilibrium between the indoor and outdoor environments is being reached. During the nighttime, no free cooling potential is available, neither does any heat wave attenuation take place during the daytime. On the other hand, an aeration process might be available depending on wind speed and direction.
The parameter θ S i i a simply compares the magnitudes of both an inner thermal mass surface to the indoor air temperatures as T S i / T i n . Depending on the value this parameter takes, three interpretations can be drawn:
  • When θ S i i a > 1 , indicates T S i > T i n . A cooling process is taking place; the indoor air is discharging the heat from the internal thermal mass. The cooling potential withdrawal is yet to be quantified since it then strongly depends on the airflow available and the duration of the ventilation process (how long the windows could remain open).
  • When θ S i i a < 1 , indicates T S i < T i n . The indoor air is heating the internal thermal mass surfaces, and a strong thermal mass is needed. A charging process is taking place. This parameter gives indications about the efficiency of the building’s thermal mass, insulation, and the air infiltration rate in summer daytime.
  • When θ S i i a   ~   1 , indicates T S i   ~   T i n . A thermal equilibrium is occurring, and no cooling potential is available. Natural ventilation serves merely in the process of renewing the indoor air in terms of air quality (other than temperature).
Besides the temperature measurements, the last two parameters in Table 4 can also give more details and provide a better understanding of the building’s thermal mass and indoor convective heat exchanges due to natural ventilation. In this case, a convective heat transfer number   λ S i is introduced based on the analysis reported by [4]. This parameter equals h C S i A S i / ( ρ c p V a c h / 3600 ) and represents a measurement of the relative strength of convective heat transfer at the internal thermal mass surface due to natural ventilation [4]. As analyzed by the authors, this parameter can take values from 0 to infinity (around 1000), to which a physical meaning was given per range, as presented in Table 4.
Nevertheless, this parameter will be used here to compare the strengths of the internal thermal masses of the floor and ceiling separately during daytime and nighttime. This way, both envelope elements’ thermal roles can be assessed as h C S i (see Table 4), which was computed from the convective heat flux and temperature results. λ f and λ r for the floor and ceiling, respectively, were computed as follows:
  • When λ f / λ r > 1, the convective heat transfer at the floor is stronger than at the ceiling, which is expected to occur only during the nighttime or discharge period.
  • When λ f / λ r < 1, the convective heat transfer at the ceiling is stronger than at the floor, which is expected to occur only during the daytime or charge period.

3. Results Analysis and Discussion

The data collected from the measurement campaign in 2016 (summer period) were classified to analyze the thermal behavior of the indoor environment of the platform under different meteorological conditions. This classification organized the ongoing meteorological conditions in terms of wind (windy and not windy), and in terms of the sky state (clear and cloudy), in two different periods: (i) NVO are opened (during nighttime) and (ii) NVO are closed (during daytime) (Table 5).
Therefore, eight days presented as not-windy nighttime and only four presented as windy nighttime; two days of each group were chosen for further analysis. The most reasonable pair of days were those that presented typical summer weather conditions: sunny days and clear nights. On the other hand, the entire data collected from the measurement campaigns in 2017 were used for the analysis, since it was a short period.

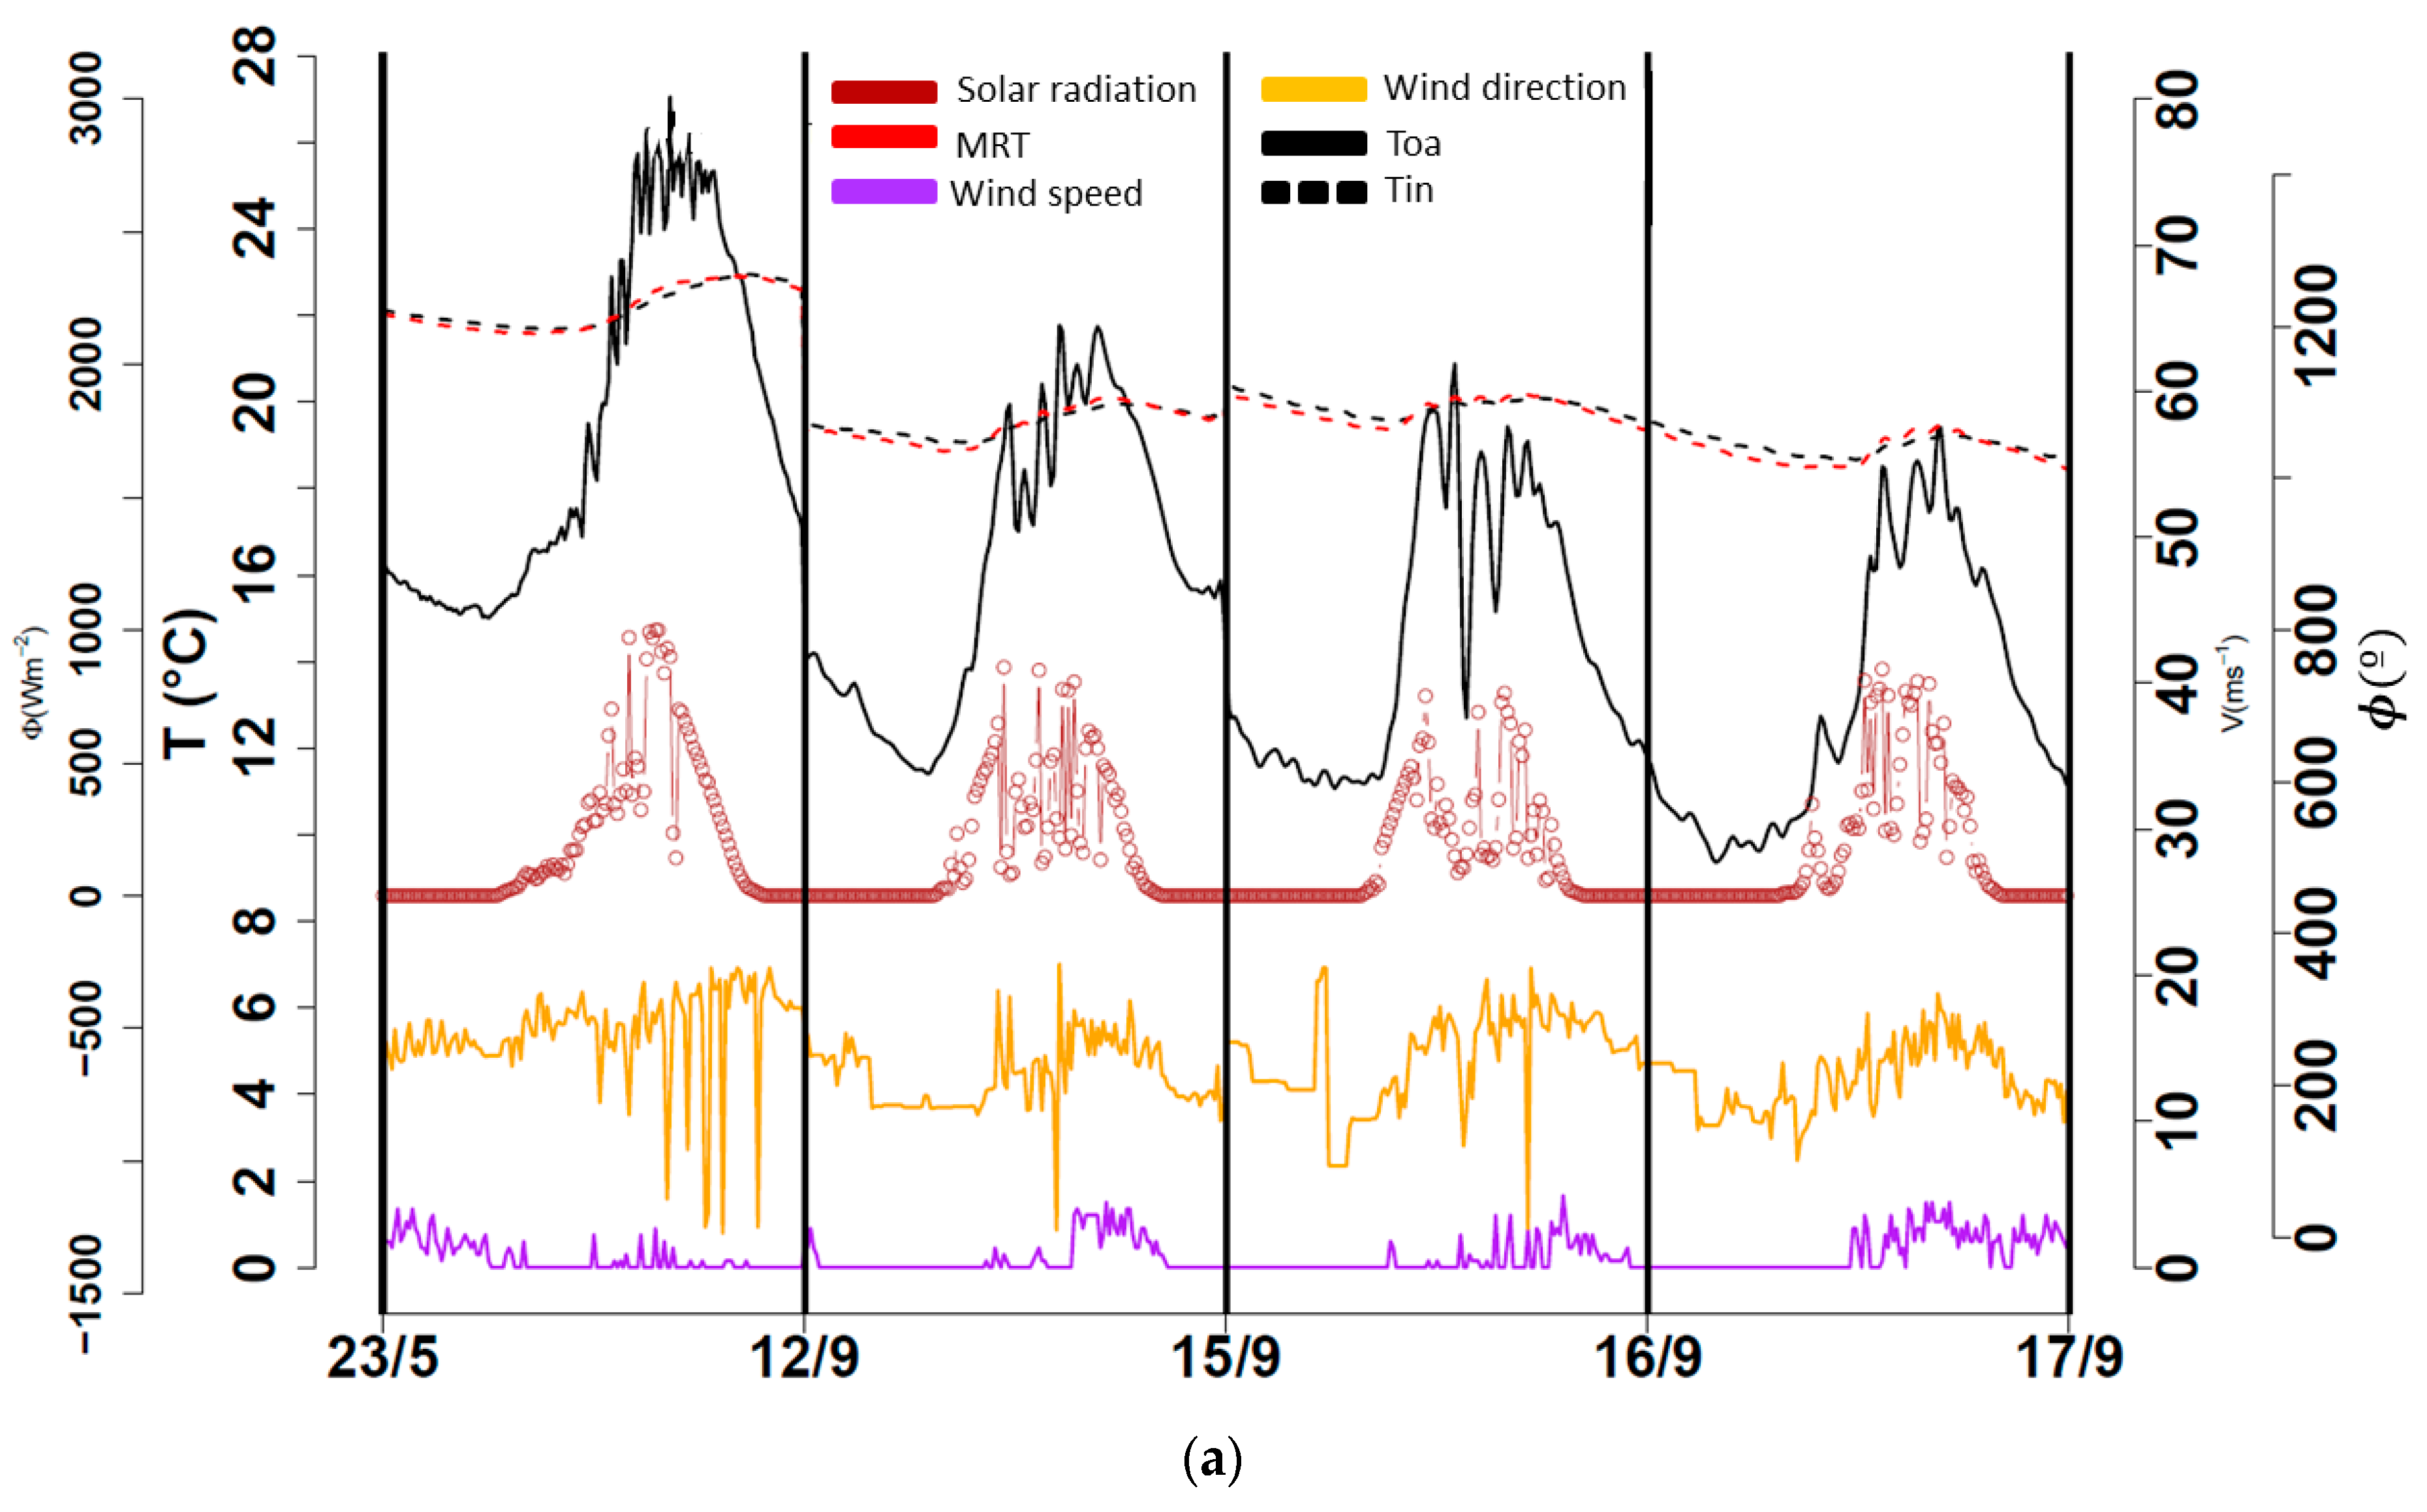
3.1. Evidence of the Coupling from a Global Perspective

The thermal behavior of the platform under different meteorological conditions during the measurement campaigns is presented and analyzed first for the configurations presented in Table 3. Figure 5 shows the indoor temperatures and weather results for configurations #1, #2, and #3, respectively.
Figure 5a shows the indoor temperatures and weather results for configuration #1, which comprised 23 May 12 September, and 15 to 16 September. Figure 5b shows the indoor temperatures and weather results for configuration #2, in which only two days with no windy nights (22 and 23 August) and two days with windy nights (26 August and 8 September) are presented. Figure 5c shows the indoor temperatures and weather results for configuration #3 from 25 to 28 May. The outdoor air temperature ( T o a ) and solar radiation ( Φ ) presented typical values as expected for the seasons. Wind speed ( V ) and wind direction ( ϕ ) presented anticyclonic behavior and low values, as also expected for these seasons.
Different behaviors of the indoor environment can be observed for each configuration. For instance, the lower day–night maximum indoor temperature gap was encountered for configuration #1 (see Figure 5a), which is also reasonable since both environments were, in principle, not allowed to interact with each other. Conversely, the higher day–night maximum indoor temperature gap was encountered during configuration #3 (see Figure 5c), which is reasonable since the indoor environment was permitted to interact the most with the outdoor environment.
Moreover, the mean radiant temperature ( M R T ) appeared to be very close to the indoor air temperature ( T i n ), which suggests that long wavelength (LWL) radiation heat transfer was weak in the indoor environment. Depending on the configuration, M R T appeared to be slightly higher or slightly lower than the indoor air temperature, as presented in Table 6.
In configuration #2, Tin appeared to be slightly colder than the surrounding surfaces during nighttime, as expected; during the daytime, the indoor air was hotter than the surrounding surfaces, as in agreement with configuration #1 for this period (see Figure 5a). In configuration #3, the indoor air was slightly colder than the surrounding surfaces during nighttime, which agrees with what has been encountered for configuration #2; the opposite was encountered during the daytime, as expected since the openings remained open (see Figure 5c).
These last three remarks are rendered moot when accounting for the uncertainties of our instruments in the temperature measurement since both temperatures became indistinguishable. Nevertheless, these remarks are worth noting since the results encountered agree with the expected behavior of both temperatures for each configuration.
Regarding the thermal inertia of the building (focusing on the indoor air temperature behavior), the indoor environment presented a higher thermal lag (or temporal phase shift) with respect to the outdoor air temperature during the daytime in increasing order as follows: configurations #2, #1, and #3. This behavior can be explained by the fact that the platform attenuated the outdoor thermal stresses when the openings and solar shades were closed (config. #1), and the platform attenuated them the most when its indoor environment cooled down the night before (config. #2). As the openings remained open during the day for configuration #3, the indoor environment of the platform opposed the least to the outdoor thermal stresses. This agrees with experimental results obtained by [22], which indicated that the interaction between ventilation and thermal mass manifested in the modification of the thermal lag in comparison when no natural ventilation was implemented.
On the other hand, during nighttime, the platform presented a thermal lag in decreasing order as follows: #1, #2, and #3 with slightly the same values, which was also expected. In summary, the previous analysis highlights the effects of the coupling between natural ventilation and the energy charge–discharge process by focusing only on the temperatures of the outdoor and indoor environment.

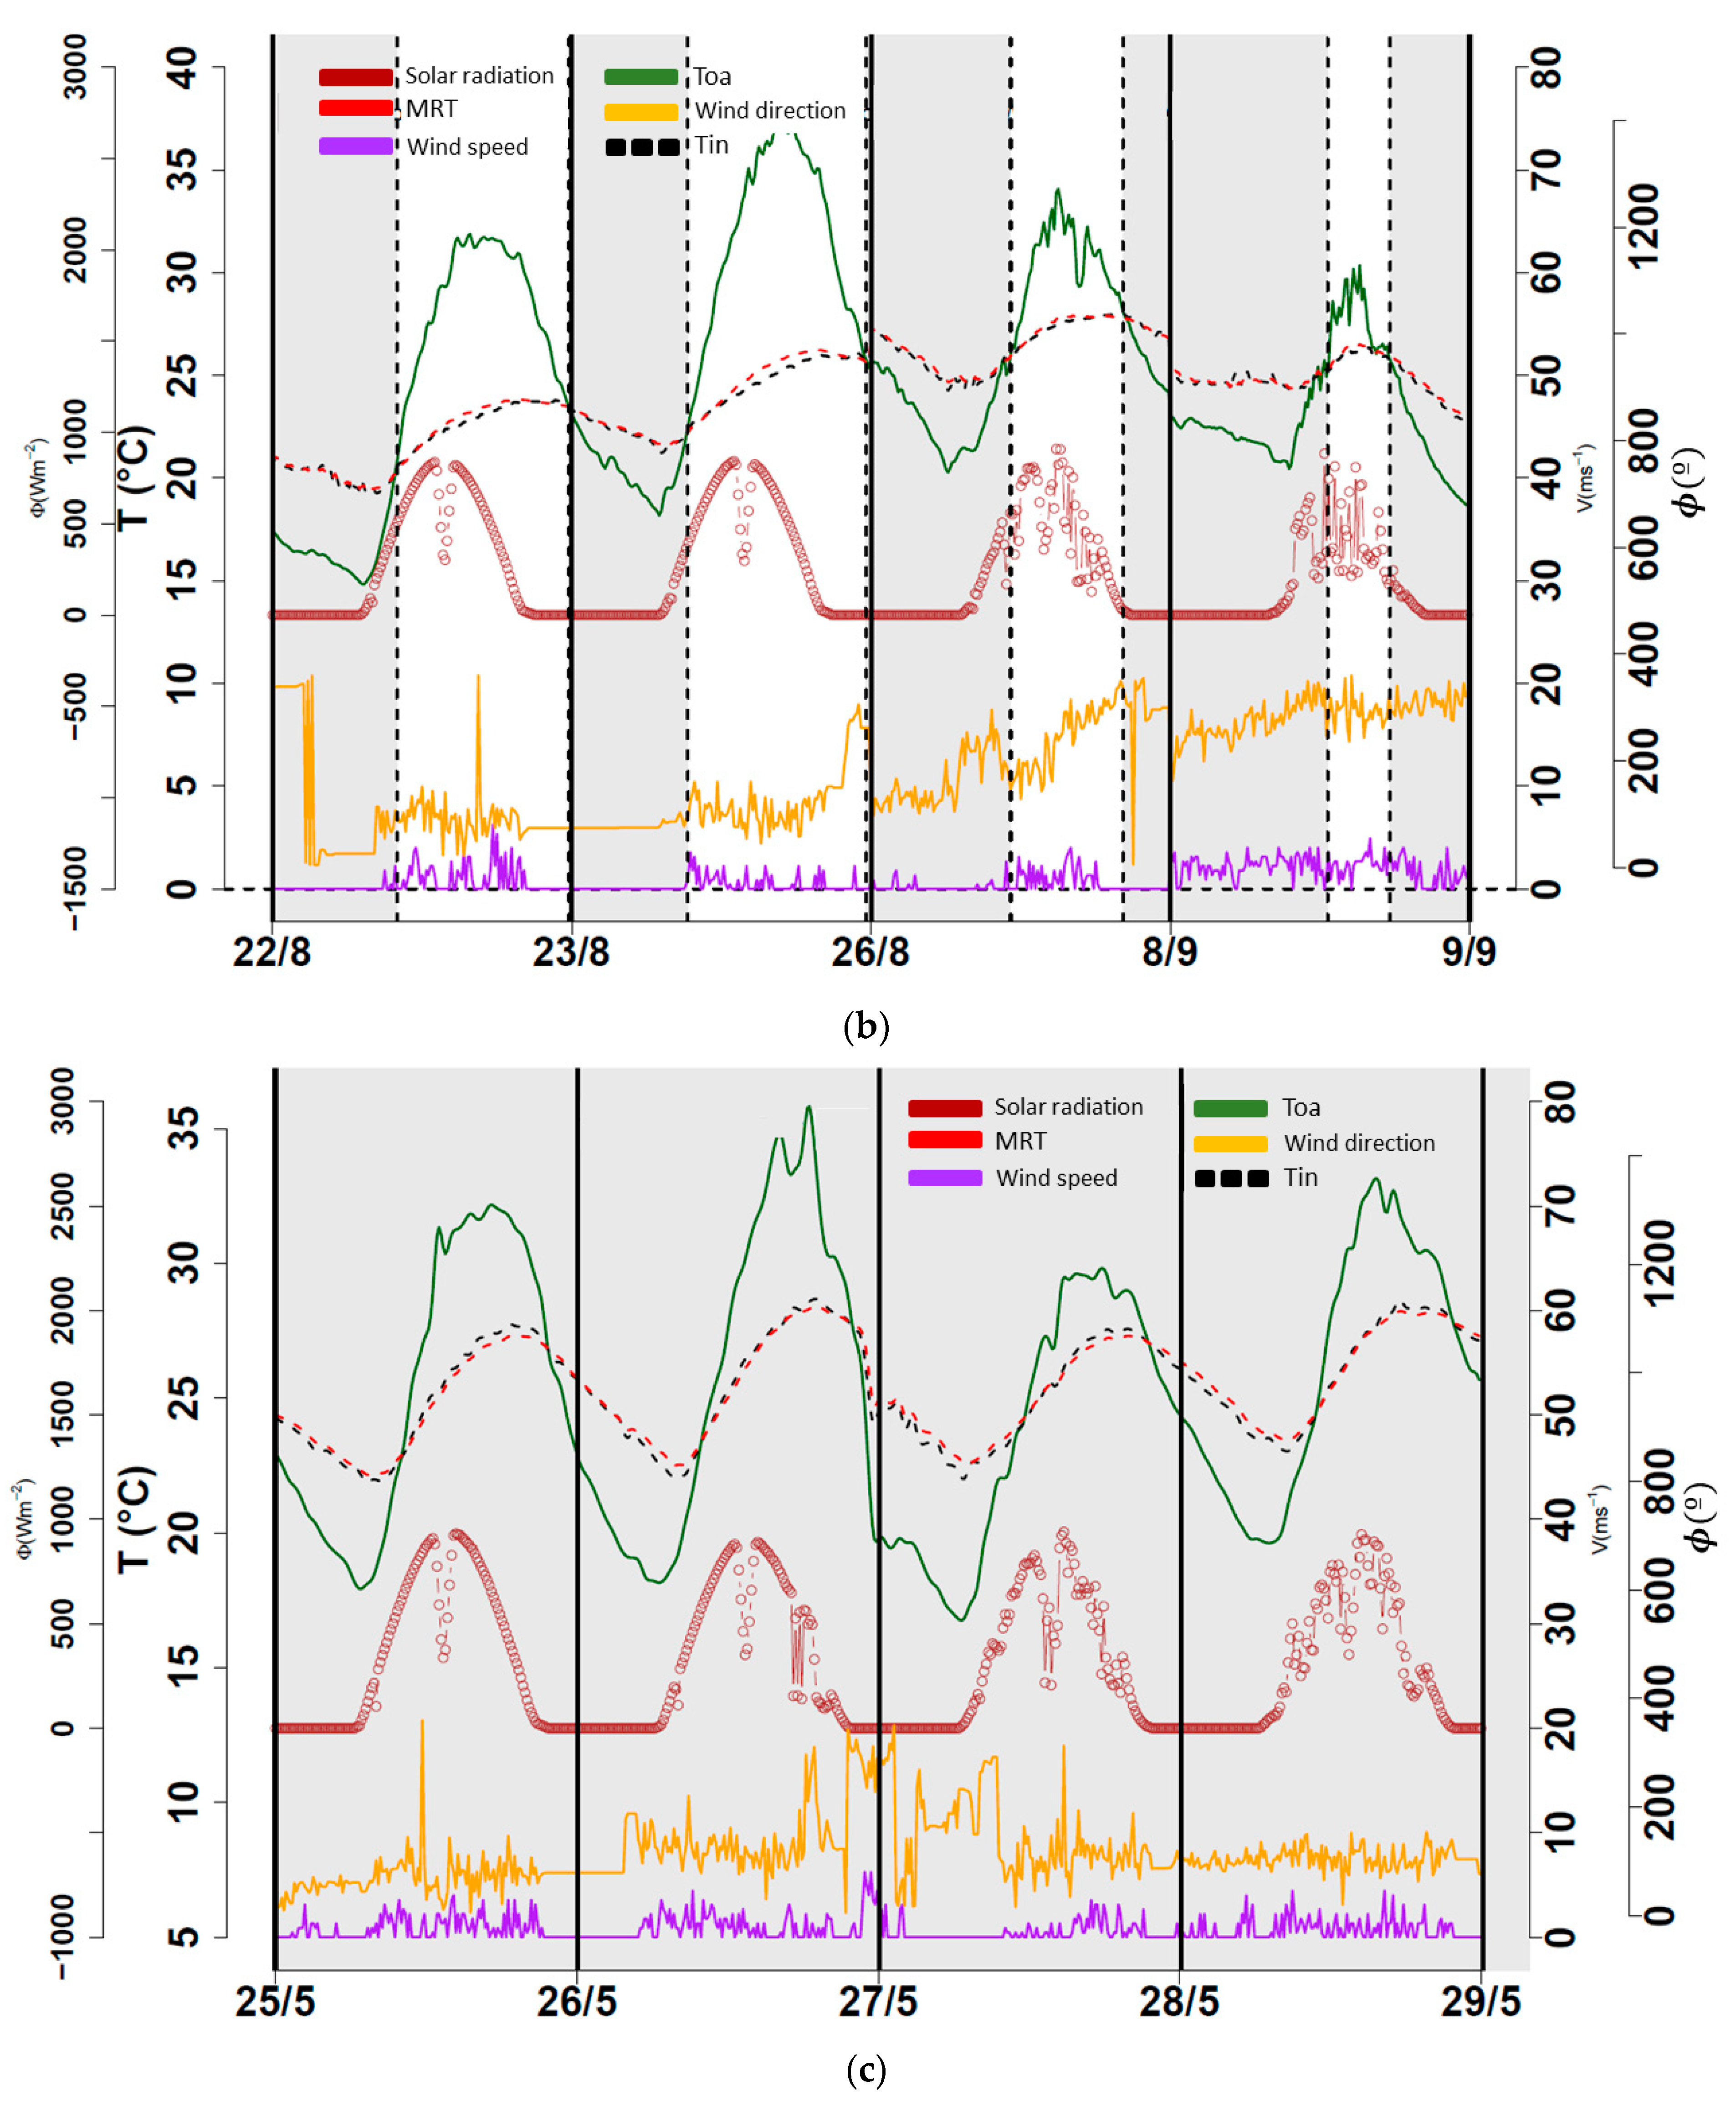
3.2. Evidence of the Coupling from a Local Perspective

In order to verify that the changes in the behavior of the convective heat flux were caused by the opening and closing of the natural ventilation openings, the behavior encountered in config. #1 is taken as a reference since the openings remained closed. In this way, when the convective heat flux reached significant values (with respect to config. #1), it was considered directly as a consequence of natural ventilation, thus, highlighting the coupling between the latter and the charge–discharge process in the form of convection. This charge–discharge process was analyzed individually by focusing first on the convective heat flux and after on the radiative heat flux. Additionally, sometimes it was more reasonable to refer to these processes as the charge and discharge period; thus, the reader is asked to note that both terms will be used interchangeably.

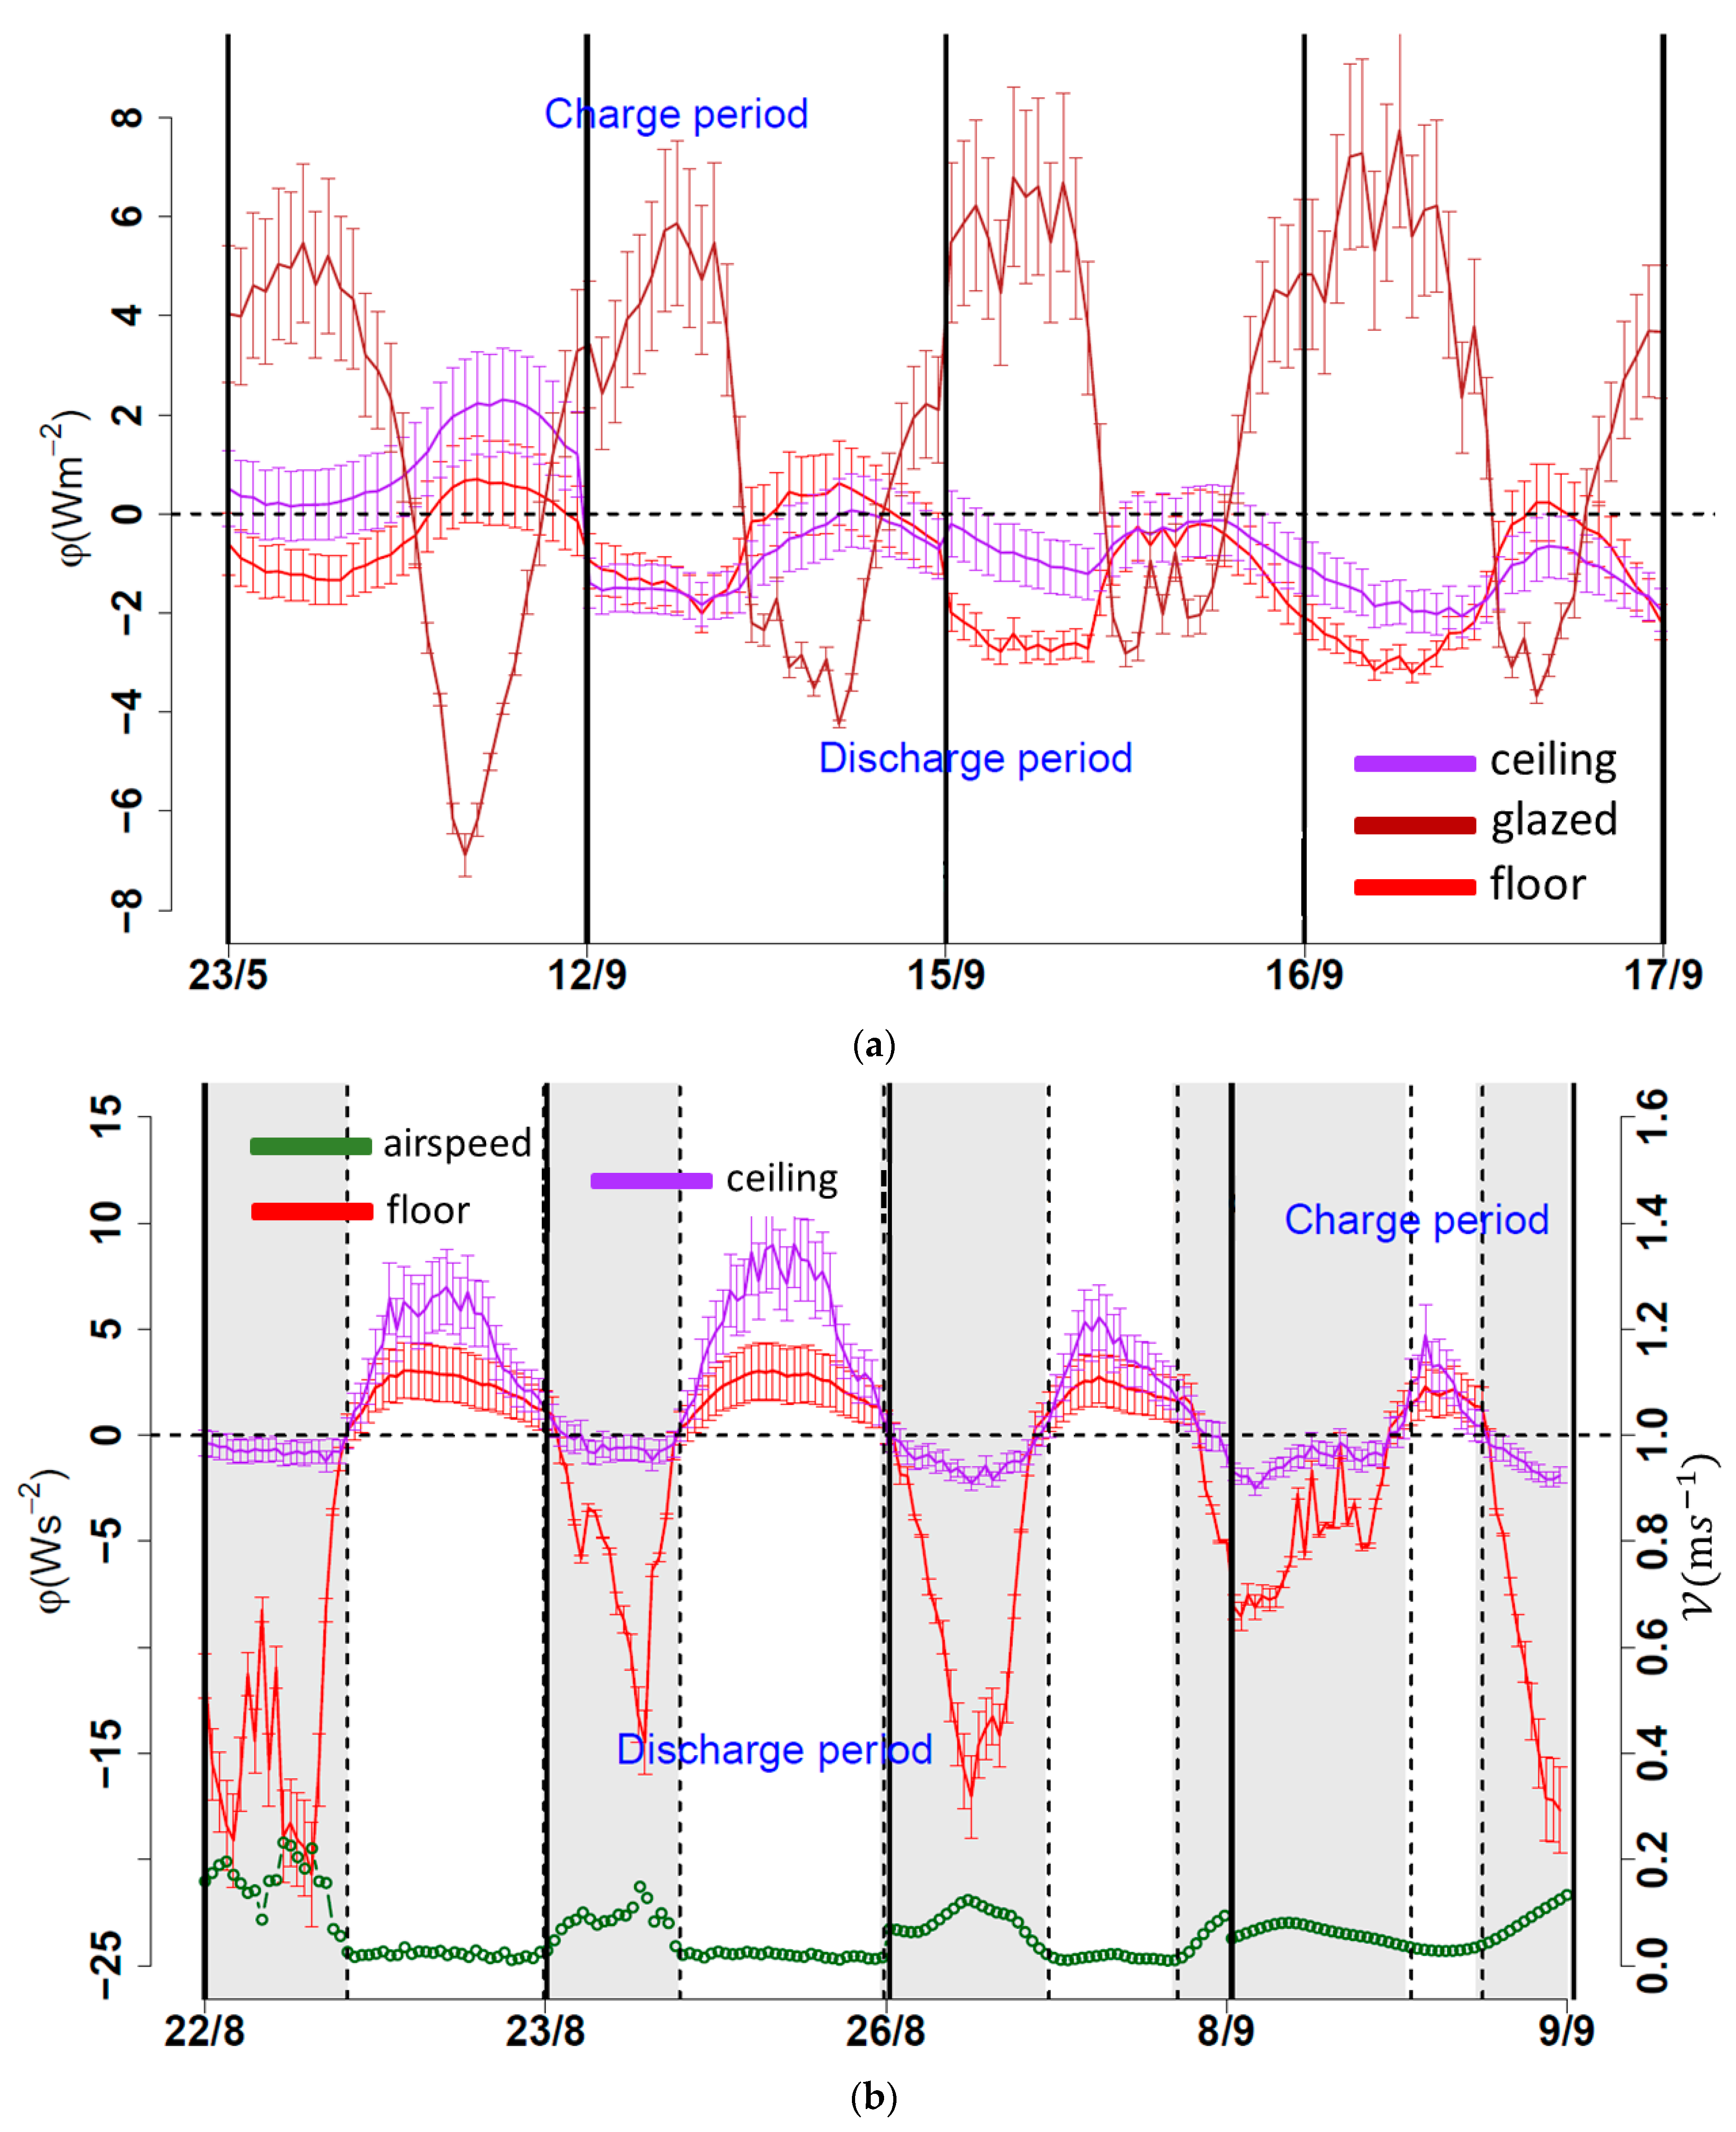
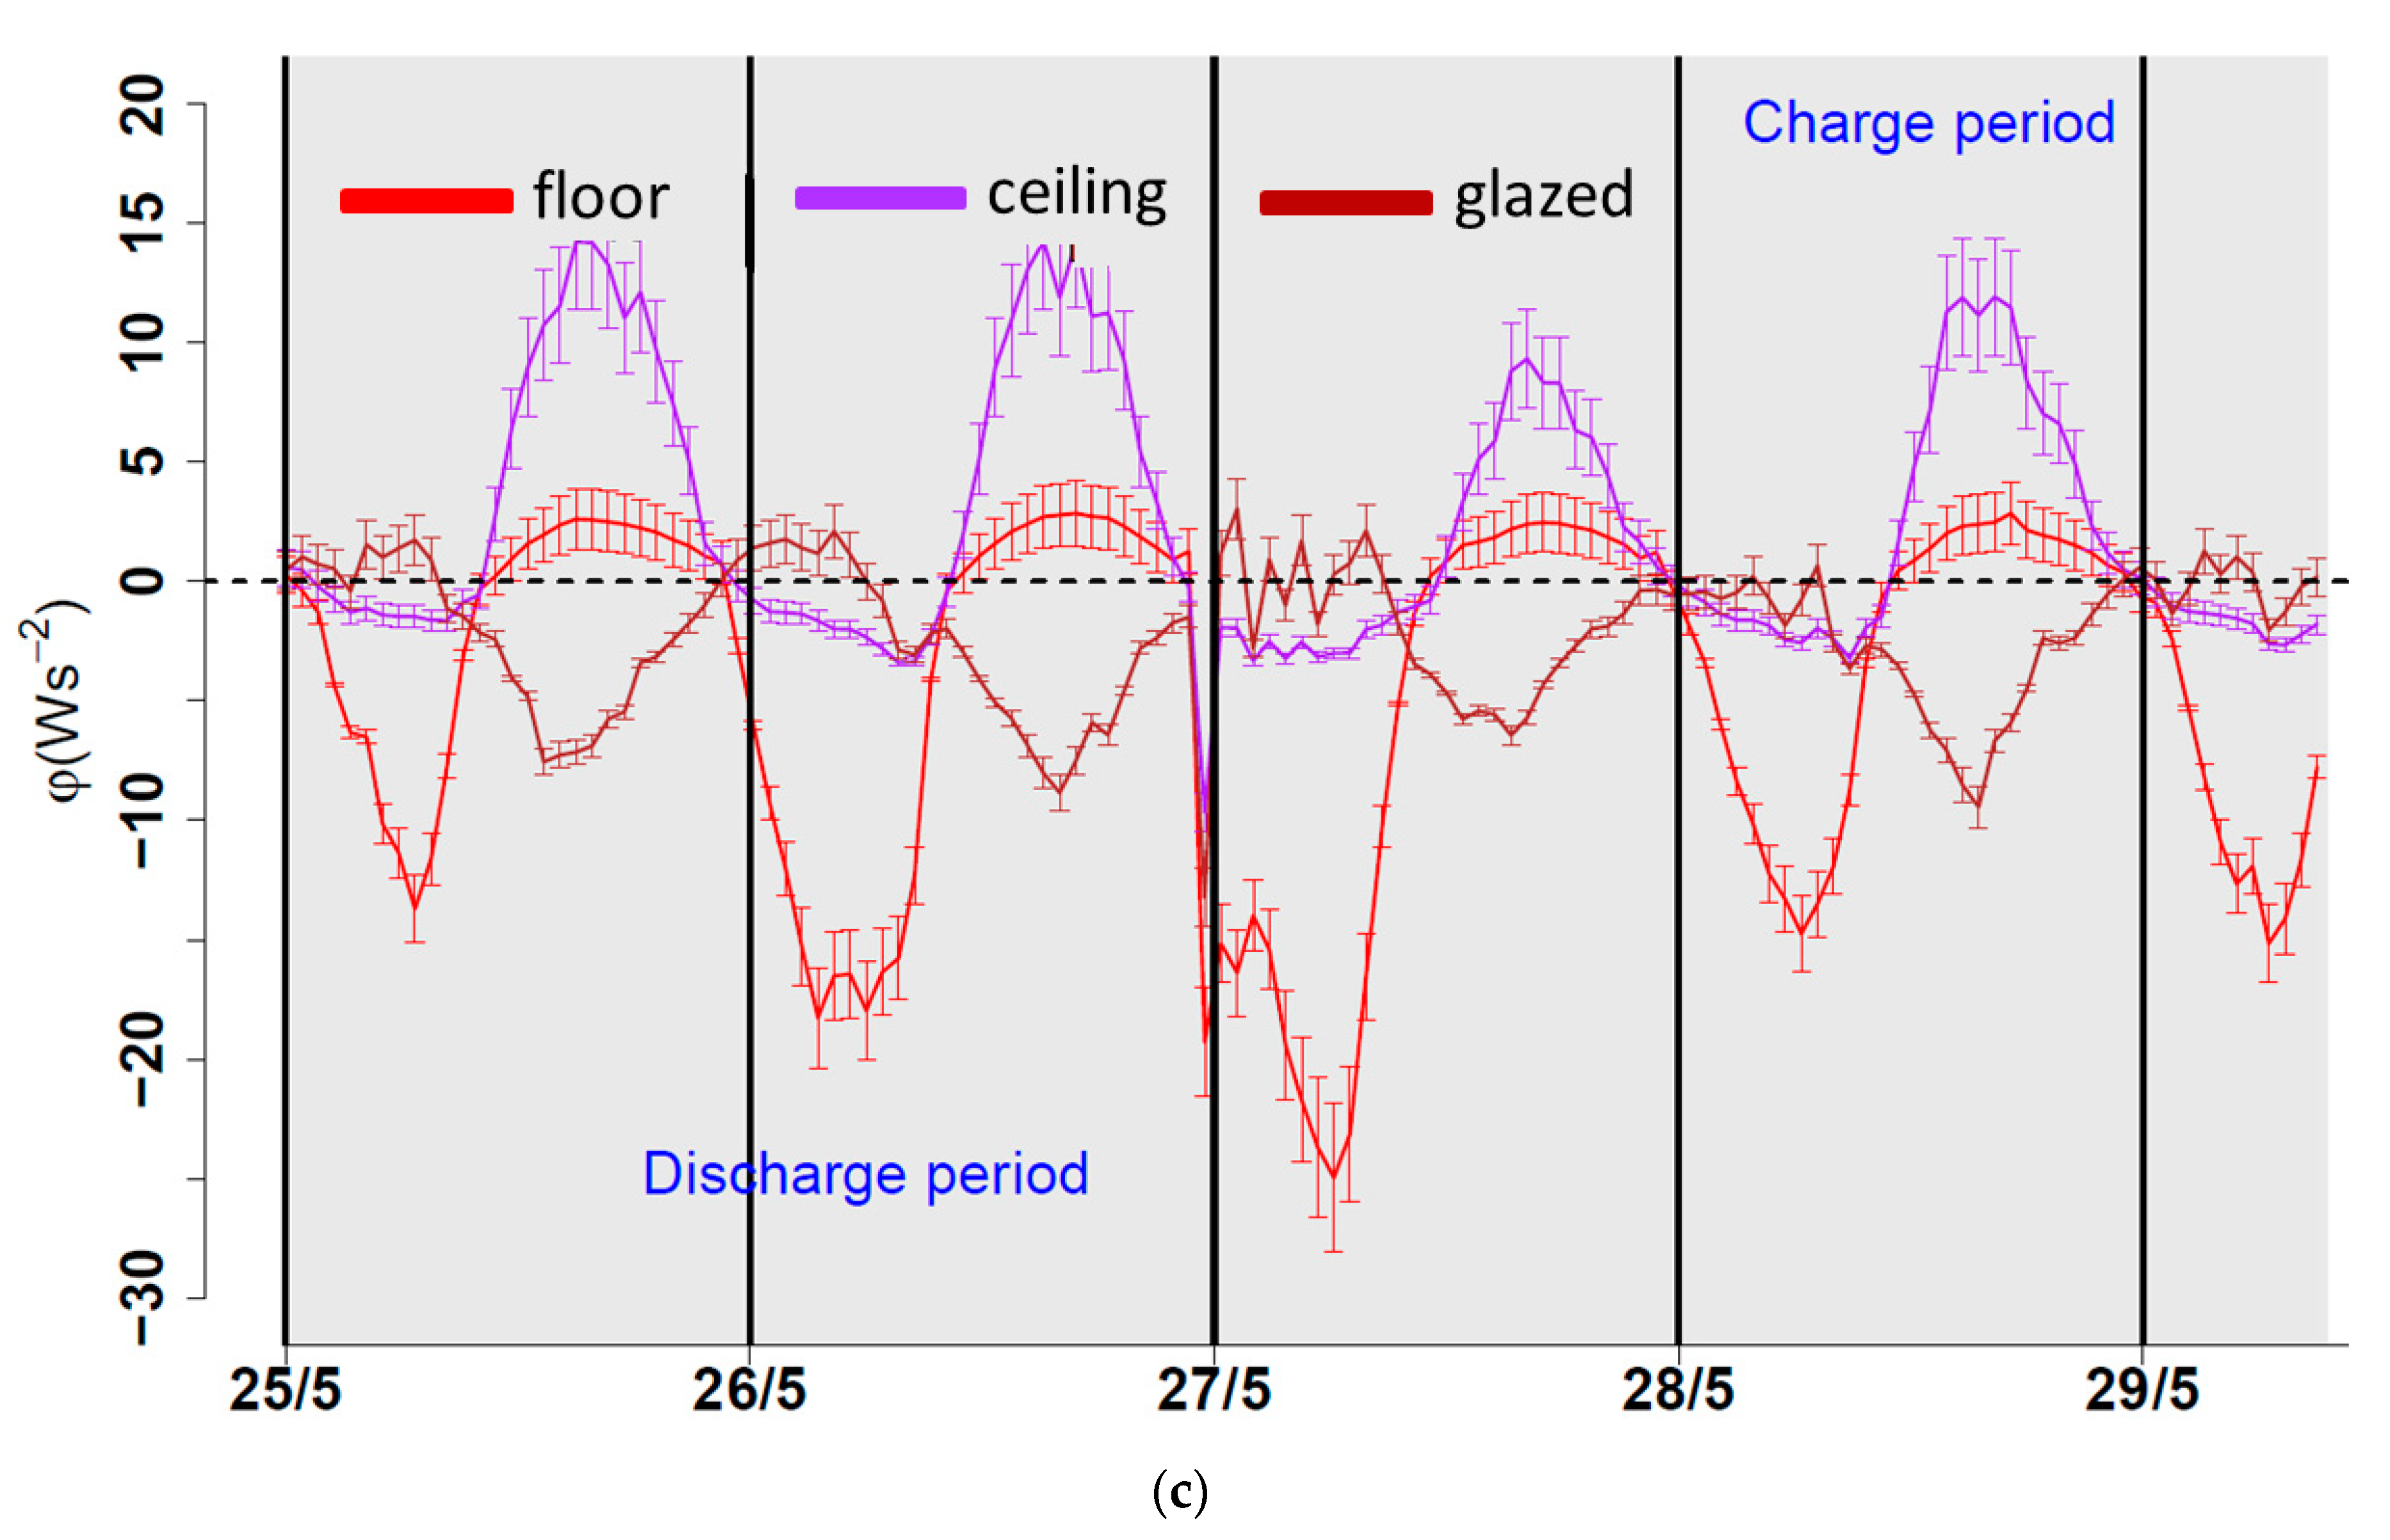
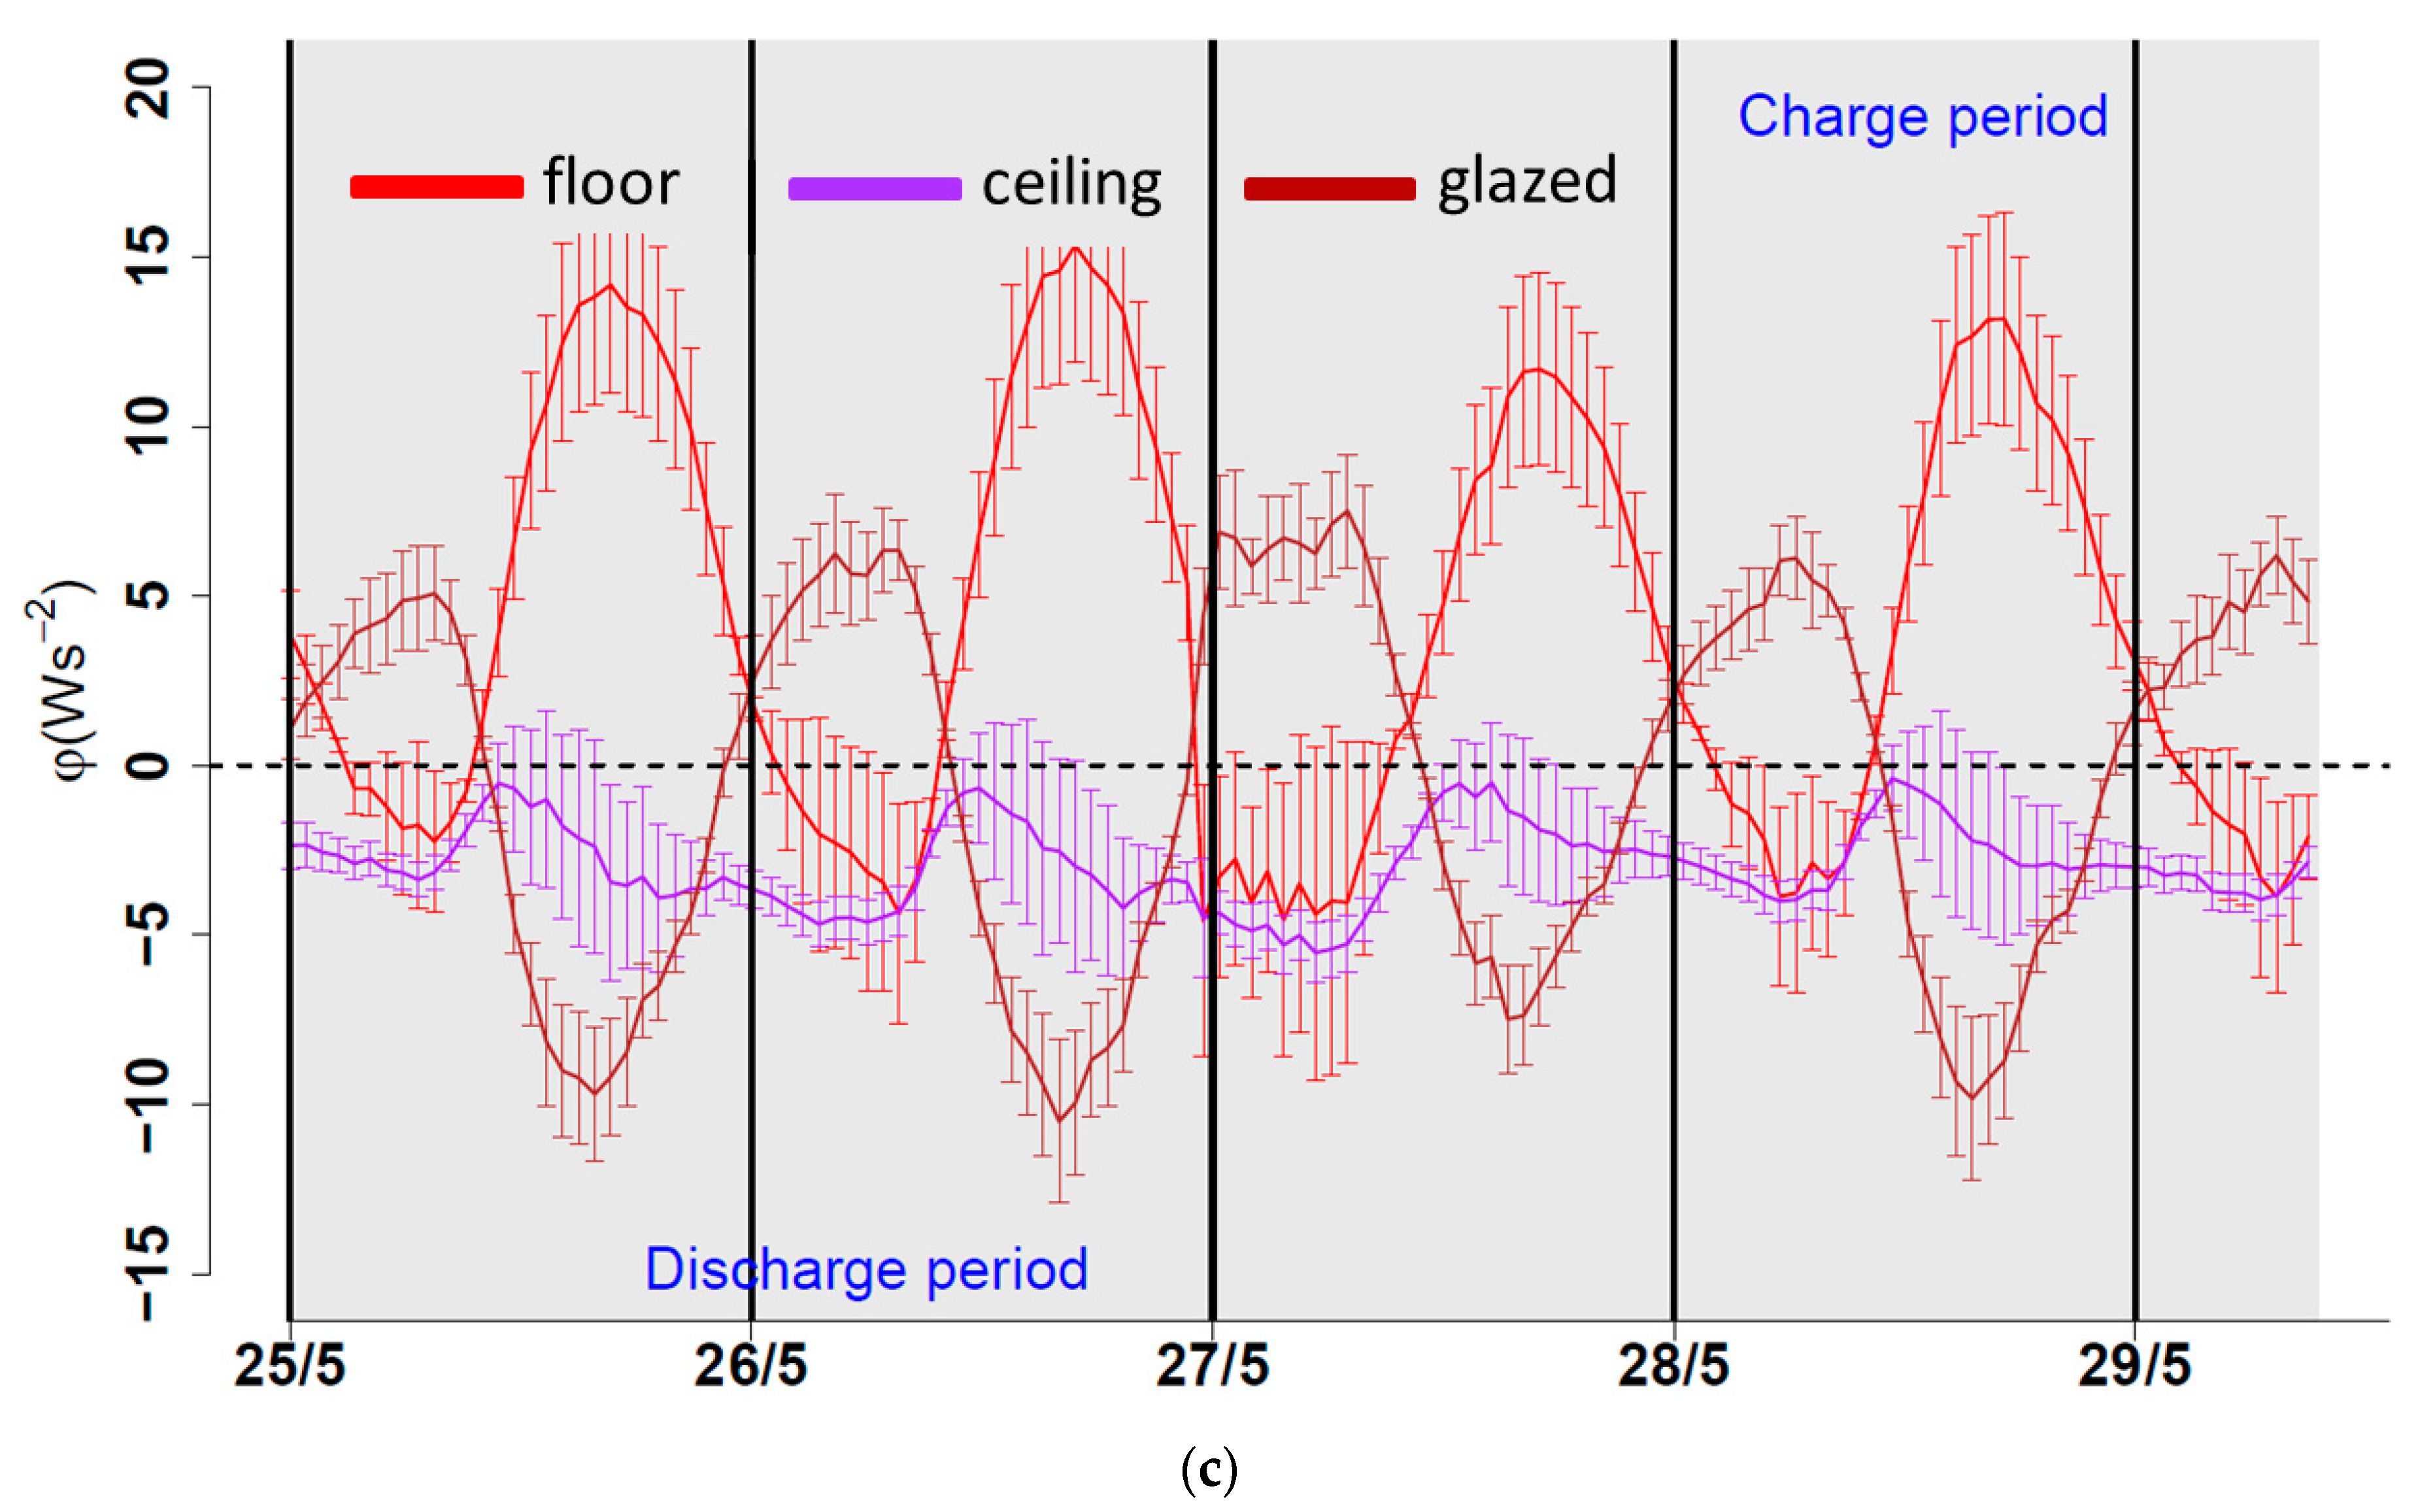
3.2.1. Charge and Discharge by Convection

The results of the convective heat flux, the corresponding air-surface temperatures, and the radiative heat flux, for configurations #1, #2, and #3 are presented in Figure 6, Figure 7 and Figure 8, respectively. For visual purposes, the uncertainties are only presented for convective heat flux since the temperature range was very narrow. Additionally, for the graphics where heat fluxes are presented, a horizontal dashed line was drawn on zero to separate the charge period, i.e., positive values (mostly during the daytime), and the discharge period, i.e., negative values (mostly during nighttime). These positive or negative values can also be regarded as if the heat flux was entering or leaving the surface respectively.
Note that, as a convective heat flux presenting positive values indicates that the surface was being charged (or heated), this also indicates that the air near this surface was undergoing a “discharging” process. Conversely, if the heat flux presented negative values (indicating that the surface is being discharged), the air near this surface was undergoing a “charging” process. With this in mind, during the charge period, the behavior observed in Figure 6a,c indicates that the glazed façade (brown line) contributed the most to the charging of the indoor air. On the other hand, in Figure 6a–c, the behavior of both the convective heat flux at the floor (red line) and ceiling (purple line) during the charge period indicates that they contributed to discharging the indoor air, while these two surfaces were being charged. This statement only appears to apply to the first day (23/5) in config. #1 (see Figure 6a), as expected, due to the outdoor conditions of the following days (see Figure 5a). The contributions of each surface are summarized in Table 7.
During the discharge period, the behavior of the convective heat flux at each surface indicated that its role in the charge–discharge process had changed. The glazed façade (brown line) contributed to the discharging of the indoor air, while the floor (red line) contributed to its charging. The magnitudes of the convective heat flux encountered when the openings remained open (gray zones) at the floor surface (see Figure 6b,c), with respect to the magnitude encountered for this surface when the openings remained closed (see Figure 6a), clearly indicate that the increment was caused by the opening of the NV openings, and thus, a consequence of natural ventilation. Moreover, the heat flux at the ceiling surface (purple line) appeared to not have a significant contribution either to the charging or the discharging of the indoor air during the discharge period, regardless of the opening configuration implemented (see Figure 6). Similar heat flux values for the ceiling, as in Figure 6c, during the charge period, were also reported by [34] when studying a naturally ventilated building via simulation under the Malaysian climate. Heat fluxes for ceiling, floor, and walls were reported by [35] and only for walls [36].
It seems that the magnitude of the convective heat flux on the floor surface was significantly higher when the openings were kept open (see Figure 6b, gray zones) than when they were kept closed. The same can be said for the airspeed measurements (brown circled lines). On the other hand, the magnitude of the convective heat flux on the ceiling surface appeared to be significantly lower (almost null) when the openings were kept open than when they were kept closed (white zones). This can be explained by the fact that when the openings remained open (mostly at nighttime), the outdoor air temperature was lower than the indoor air (see Figure 5a). Since cold air is denser than warm air, outdoor air entered the lower part of the platform through the lower openings, and thus air currents near the floor surface were stronger. The values and signs adopted by the convective heat flux on both surfaces imply that, during nighttime, the floor was vigorously discharged, while the ceiling presented a weak discharge or none at all.
Regarding the temperatures, it can be observed from Figure 7a,c that the glazed-façade surface (brown line) always presented the highest temperature of these three surfaces, and its behavior appeared to be synchronized with the behavior of the outdoor air temperature (no temporal phase shift appeared to be present between them). This was expected since the glazed façade had a weak heat capacity and might suggest that the influence of direct solar radiation in the heating of this surface can be neglected.
Finally, it can be observed that when the heat flux at the glazed façade was positive, i.e., a heat flux entering this surface (see Figure 6a, solid brown line), its temperature (see Figure 7a, brown line) appeared to be lower than that of the nearby air, which is measured at 0.1 m (see Figure 7a, brown circles). This indicates that the air near the surface was charging it. This last remark is worth mentioning since this behavior, as logical as it may seem, was encountered to correspond only between the temperatures of the surface and the air at 0.1 m, but not between this surface and the air temperature measured at 1.70 m (black dashed line). For instance, consider the first day (22/8) for configuration #2 in Figure 6b and the first day (25/5) for configuration #3 in Figure 6b, and let us concentrate on the convective heat flux at the floor surface (red line): at 0.10 m the exact moment when the heat flux changed from positive to negative values, the air temperature (see Figure 7b,c, black circles) went from being higher than the surface temperature (solid black line) to being lower. It can be observed that this did not apply if we performed the same exercise with the air temperature at 1.70 m.

3.2.2. Charge and Discharge by Radiation

The results of the radiative heat flux for configurations #1, #2, and #3 are presented in Figure 8a–c, respectively. During the charge period, the radiative heat flux at the glazed-façade surface (brown line) also presented a contrasting behavior with respect to the other surfaces (see Figure 8a,c), as seen earlier for the convective heat flux. Note that the magnitude and behavior of the convective and radiative heat fluxes at the glazed-façade surface appeared to have the same values.
On the other hand, during the charge period, the radiative heat flux at the ceiling surface (purple line) appeared weak, with negative values, compared with the other surfaces. This might imply that the surrounding surfaces (as viewed from the ceiling: floor, glazed façade, internal partitions, among others) were always at a temperature slightly lower than that of the ceiling surface. However, Figure 8a,c shows that the glazed façade always presented higher temperatures than the ceiling, and the floor surface always presented a lower temperature. It can be inferred from this that the radiative heat flux responded to the mean temperature of the surrounding surfaces (also depending on the corresponding view factors), as expected. Moreover, the radiative heat flux at the floor surface (red line) presented the largest values during this period. This implies that the floor surface was the coldest, and thus, all surrounding surfaces were discharged towards it, indicating that the floor helped to attenuate the temperature rise of the other elements of the envelope.
During the discharge period, comparing Figure 8a,b with Figure 8c, there appeared to be no significant changes in the radiative heat flux between configurations #1, #2, and #3, and therefore, the opening and closing of the natural ventilation openings do not seem to have had a direct and explicit effect on the radiative environment. However, it is clear that if the floor surface had been cooled down the night before (by leaving the openings opened), this surface experienced a stronger charging by radiation the following day than if it was not cooled down the night before. This seems fairly straightforward to conceive since the concrete slab could bear stronger heat loads the next daytime if it was cooled down enough the night before.
In summary, the coupling between the charge–discharge and natural ventilation was qualitatively highlighted by the behavior of the convective heat flux at each surface for each configuration. From the previous analysis, the following can be inferred:
  • The floor and ceiling played an essential role in the attenuation of the rising of the indoor air temperature, while the glazed façade contributed the most to the heating of the indoor air.
  • The role of the envelope elements appeared to change depending on the periods of charge and discharge and not on the opening configuration. The opening configuration only increased or decreased the impact of each element in each period.
  • The floor surface played an essential role in attenuating of the temperature rising of the envelope elements since these elements discharged by radiation towards the floor.
  • The opening and closing of the natural ventilation openings did not seem to directly affect the radiative environment.

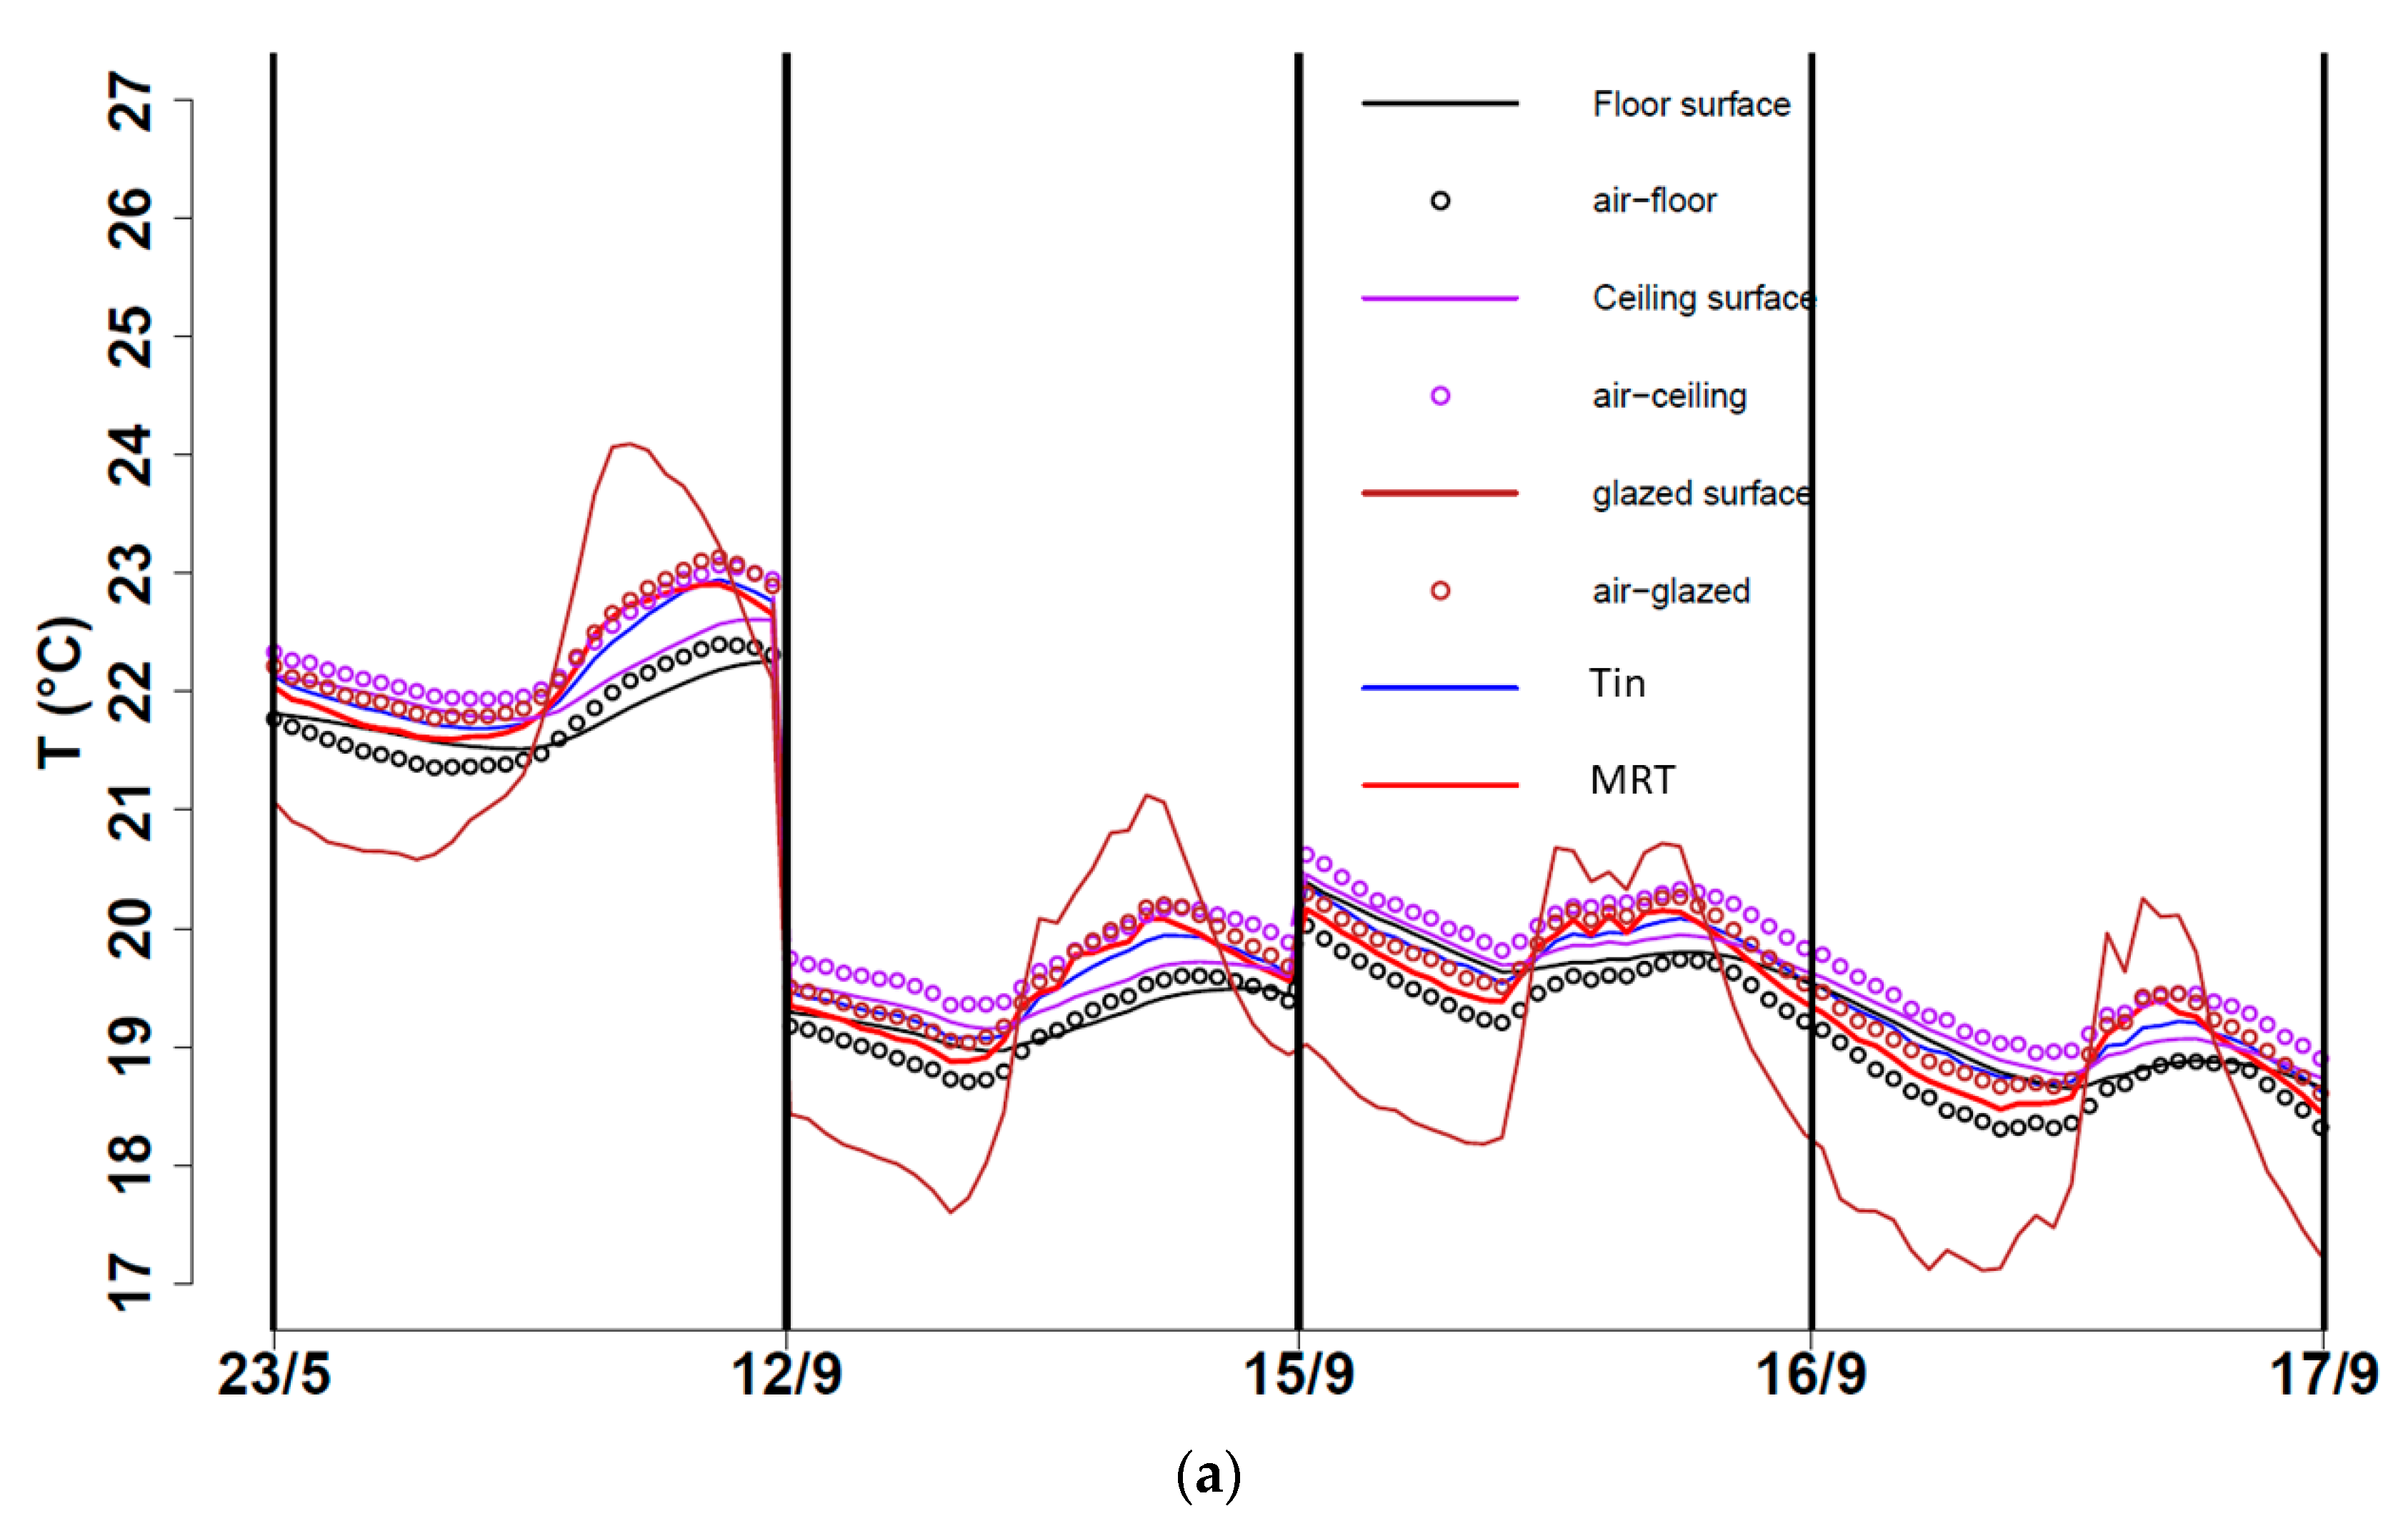
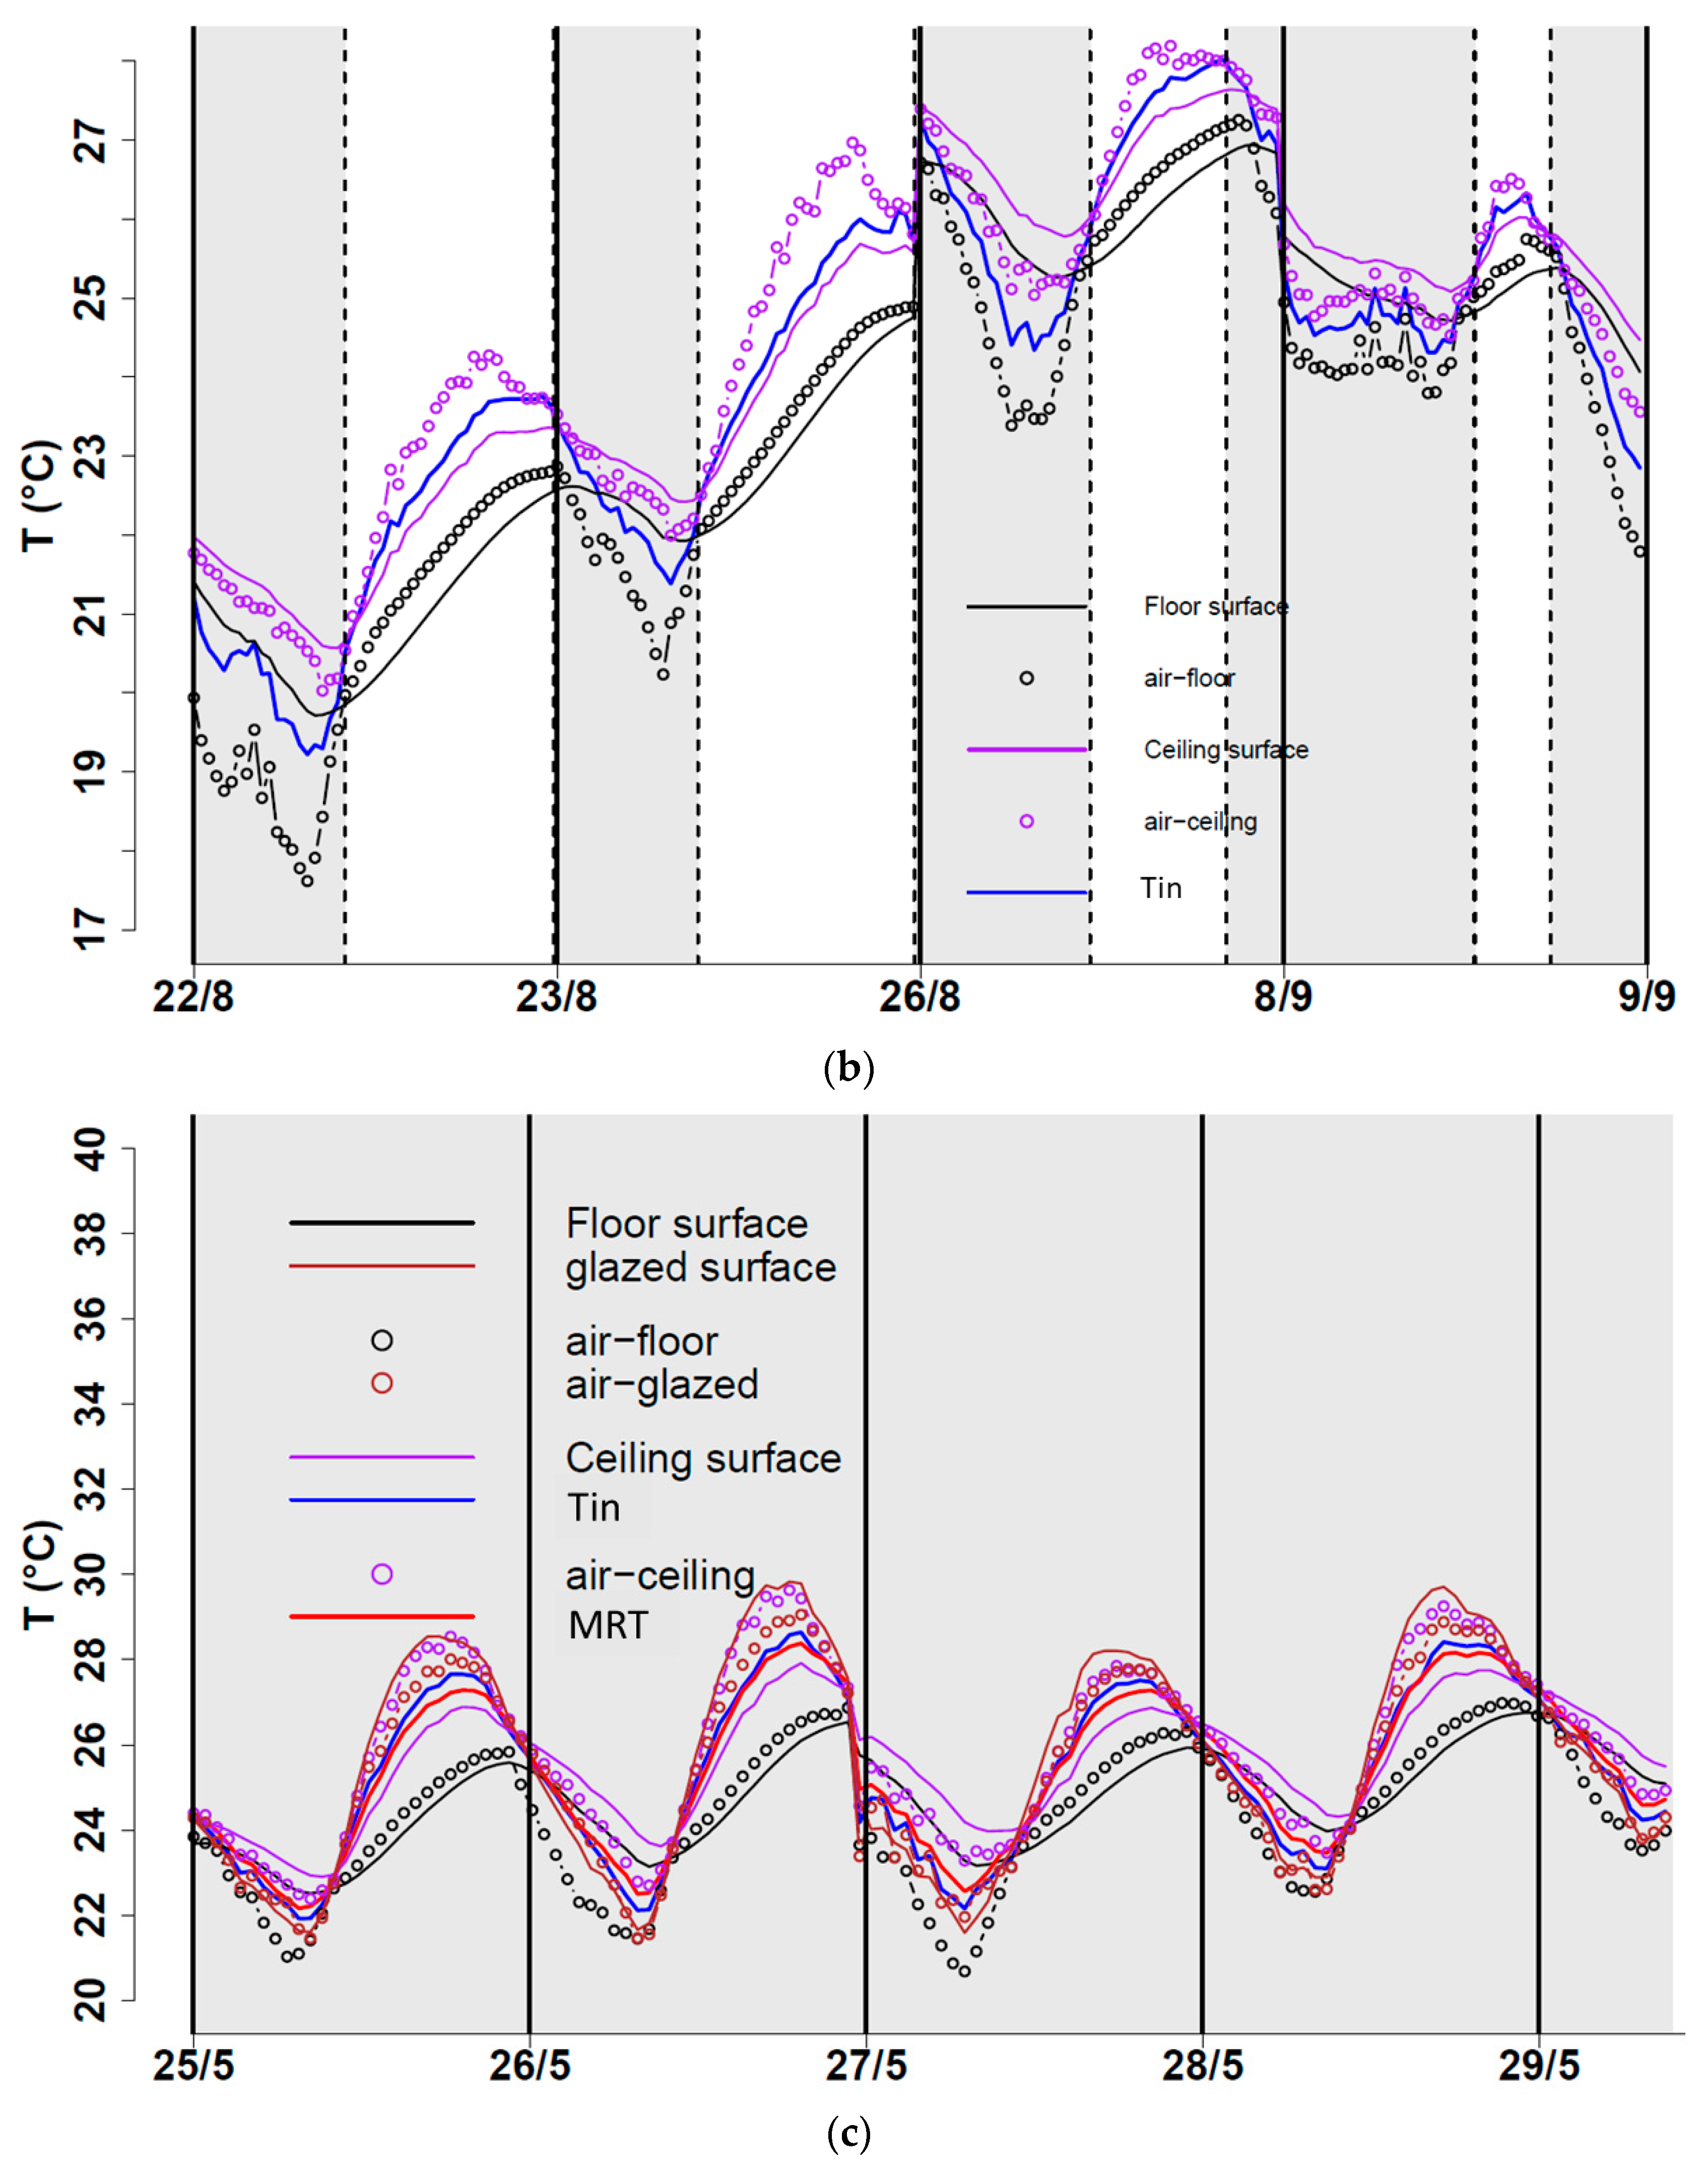
3.3. Parametric Analysis of the Coupling through Temperature Measurements

After computing the first two dimensionless parameters presented in Table 4, the results are presented in Figure 9. Figure 9a,c,e present results for θ i o a (red lines), and Figure 9b,d,f present results for θ f i a and θ r i a , which are the representative values for the floor (purple line) and the ceiling (green line), respectively.
The statement that θ i o a represents the available natural ventilation potential and θ S i i a the relative natural ventilation potential to the internal surface can be observed by the magnitude of both parameters in Figure 9. It can be observed that during the nighttime (or discharge period), the resulting relative cooling potential to the internal surfaces ( θ f i a , θ r i a ), always presents lower values (see Figure 9d,f, purple and green lines) than the available cooling potential θ i o a (see Figure 9c,e, red lines).
The effectiveness of applying a night natural ventilation strategy and its coupling with the thermal inertia of the building is evidenced by comparing the value of θ i o a during the daytime (white zones) in Figure 9c,e, with Figure 9a. θ i o a in the latter fluctuates around 1.3, making it difficult to reach values lower than 1 (an expected behavior since every opening is closed). In contrast, in Figure 9c,e, θ i o a , in the same period, reaches values lower than 1, and the lower values are presented in Figure 9c. The values of θ f i a and θ r i a , during the daytime helped us realize the floor is a key element of the heat attenuation during the charging process, compared to the ceiling. Thus, the stronger thermal mass should be concentrated in the floor. Thermal equilibrium is reached between the thermal mass and indoor air in Figure 9b ( θ f i a and θ r i a presents similar values close to 1) during both daytime and nighttime, evidencing the high thermal performance of the building. During the nighttime (gray zones), θ f i a and θ r i a present values higher than 1 (Figure 9d,f), highlighting evidence that the cooling or discharge process is occurring. The effectiveness of such a discharge process seemed to be higher for the floor than for the ceiling as   θ f i a reached lower values than θ r i a in each consecutive charge process (white zones).

3.4. Parametric Analysis of the Coupling through the Convective Heat Transfer Coefficients

At any given moment, the air change rate per hour a c h presents the same value, indistinguishable for either the floor or ceiling, since this is a globally estimated parameter. Thus, to compare both λ f and λ r , the ratio λ f / λ r is computed as h C f A f / h C r A r (see Figure 10).
Solid interpretations can be drawn from the resulting values of h C S i for each surface (floor, ceiling, and glazed facade). For configurations #2 and #3 (Figure 10c,e), a significant difference in the behavior of h C S i can be observed during daytime and nighttime periods. For instance, in Figure 10c, the values for the floor (black dots) are larger than the values for the ceiling (purple dots), and this is during nighttime (gray zones, openings opened). The opposite is observed during the daytime (white zones, openings closed). The same can be said for the daytime and nighttime in Figure 10e.
On the other hand, in Figure 10a,e, it can be observed that h C for the glazed facade (brown dots) presents similar behavior during the daytime and nighttime, and its values appear to be the same for each day. This leads us to state the following:
  • During the nighttime, when the openings are opened, h C f is large enough with respect to h C r , that the effect of the latter becomes imperceptible or even yet, negligible.
  • During the daytime, when the openings are either closed or opened, h C r is larger enough with respect to h C f , that the effect of the latter also becomes imperceptible or negligible.
These remarks corroborate physical phenomena reported in the literature [30,35,36]. However, for configuration #1 in Figure 10a, it seems that a similar note to those mentioned above regarding the behavior of the floor and ceiling can only be made for the first day (23 May) but not for the other days. This might be explained by the fact that the temperature levels encountered in mid-September were not of typical summertime temperature values; unfortunately, configuration #1 was not implemented at any other time. In contrast, the temperature of the glazed-facade surface is of interest because it always presented the highest temperature values in comparison with the floor and ceiling surfaces (see Figure 7).
In summary, it is necessary to account for the convective heat transfer individually for each surface: a vertical wall (the most important vertical wall seems to be the glazed facade due to its thermal behavior and contact with the indoor air), a horizontal wall at the bottom (floor), and a horizontal wall at the top (ceiling). This finding, regardless of the small number of studies related to the coupling, disagrees with numerical studies of coupling by researchers [1,2,3,4,5,6] who considered the thermal mass as a one internal element interacting with the indoor air (e.g., lumped-capacitance consideration). However, the lumped-capacitance consideration agrees with case studies where all walls were insulated, which confirms the decision on not instrumenting other walls in our test building based on the envelope characteristics (see Figure 2).
On the other hand, our results agree with [2], who stated that heat transfer occurs only between the active-superficial layer and the indoor air but goes beyond the fundamental understanding of such coupling [2], showing the importance of considering the heat transfer interaction between the thermal mass and indoor air individually (i.e., horizontal and vertical walls, considering their influence in the indoor air heat transfer) for the modeling of the coupling to assure refined simplified models.
Further assessments were addressed respecting the thermal behavior of the building studied here, such as the evaluation of the airflow rate [37] and the effects of architectural features on the indoor environment [38], but are not presented here.

4. Conclusions

The present study aimed firstly to provide experimental evidence of the coupling between the natural ventilation (NV) and the energy charge–discharge by quantifying convective and radiative interactions of the thermal mass subjected to three NV scenarios in a full-scale passive building located in Southwestern France. The experimental approach consisted of performing global and local measurements. Global measurements involved variables such as solar radiation, outdoor and indoor air temperatures, wind speed, and direction, which is a traditional approach. Local measurements involved variables such as convective and radiative heat fluxes, surface temperature, and air temperatures near the surface. Measuring such local variables revealed the contribution of each element in the envelope with the natural ventilation strategies. The experimental approach carried out has allowed characterizing the thermal aspects of the building, suggesting the following major points:
  • During the charge process, the floor and ceiling played an essential role in the attenuation of the rising of the indoor air temperature, while the south-facing glazed facade contributed the most to the heating of the indoor air.
  • During the discharge process, the floor surface also played an important role in the discharge of the envelope elements since the floor was the coldest surface.
  • Due to their behavior, it is necessary to consider the convective effects on the slab surface, the ceiling, and the glazed facade individually.
These findings have allowed us to highlight the key elements involved in the energy charge–discharge process in our building: the indoor air, the concrete slab (as thermal mass), the glazed facade, the airflow rate, and the ceiling. Considering the heat transfer associated with the exchanges in mass (air) between the indoor and outdoor environments is, of course, also needed. This consideration requires knowledge of the natural airflow rate and pathway within the platform when natural ventilation strategies are implemented; considering natural ventilation airflows through infiltration rates might not suffice. The latter may suffice when the building operates in a free-floating mode, i.e., all openings remain closed.
Among the limitations of this study, the following can be mentioned:
  • Only convective and radiative heat flux measurements on internal surfaces were considered, limiting the possibility of experimentally quantifying the heat load through the envelope.
  • The study was performed in seasons where passive cooling could be applied in case indoor thermal comfort was to be achieved, i.e., night natural ventilation.
  • The contributions of each envelope element to the indoor air and its relationship with the natural ventilation scenarios revealed in the study cannot be assumed to be the same for the winter season. Convective and radiative heat flux, as well as the convective heat coefficient behavior, might be different.
This study provides further reference information for simplifying modeling of the thermal behavior of passive buildings via parametric analyses. This understanding might help enhance and develop more efficient automated natural ventilation–thermal mass-coupled systems for the management of summer thermal comfort. Such management is possible by controlling the moving parts of the envelope, such as solar protection (window blinds, shutters) and natural ventilation openings. These moving parts control the radiative and convective interactions between the indoor and outdoor environments.
Finally, critical care must be given to thermal behavior modeling of a naturally ventilated building regarding the heat exchanges considered in the heat balance of the indoor environment. Various studies only consider the thermal mass convective heat exchanges, ignoring any radiation exchanges among the thermal mass and surfaces surrounding the indoor air. This leads to a lack of understanding of the physics behind indoor air fluctuations in transient conditions and the contributions of each envelope element. Each element does not contribute equally to the indoor environment; thus, implementing a constant value might not be suitable for modeling purposes to enhance prediction accuracy. Determining this coefficient as a function of other parameters might be necessary when it is desirable that the heat transfer phenomena involved is to be taken into account explicitly.

Author Contributions

Conceptualization, D.B., A.S. and L.M.; methodology, M.C.A., D.B., A.S. and L.M.; validation, M.C.A., D.B., A.S. and T.V.W.; formal analysis, M.C.A., D.B. and A.S.; resources, D.B., A.S., T.V.W. and L.M.; data curation, M.C.A.; writing—original draft preparation, M.C.A.; writing—review and editing, M.C.A., T.V.W., A.S. and R.B.; visualization, M.C.A. and R.B.; supervision, D.B., A.S., T.V.W. and L.M.; project administration, D.B., A.S., T.V.W. and L.M.; funding acquisition, D.B., A.S., T.V.W. and L.M. All authors have read and agreed to the published version of the manuscript.

Funding

This research was funded by Panamanian institutions: Formación y Aprovechamiento de Recursos Humanos (IFARHU), Sistema Nacional de Investigación (SNI) and the Secretaría Nacional de Ciencia, Tecnología e Innovación (SENACYT) under the project IDDS22-30.

Data Availability Statement

Data is available upon request.

Acknowledgments

We would like to acknowledge the crucial support given by the Institute de Mécanique et d’Ingénierie de Bordeaux (I2M), and Bordeaux University Institute of Technology (IUT). We also like to and extend our gratitude to the Faculty of Mechanical Engineering within the Universidad Tecnológica de Panamá.

Conflicts of Interest

The authors declare no conflict of interest.

Nomenclature

Latin letters
TemperatureT°C, K
Surface areaA, Sm2
Convective coefficient h C Wm−2 K−1
VolumeVm3
Specific heat capacity c p Jkg−1 K−1
Air change rate per hourachh−1
Wind speed V   ms−1
Greek letters
Decrement factor θ -
Measures the relative strength of convective heat transfer at the internal thermal mass surface due to natural ventilation λ -
Heat flux φ Wm−2
Density ρ kgm−3
Solar radiation Φ   Wm−2
Wind direction ϕ   °
Subscript and superscripts
Indoor airin
Outdoor airoa
Indoor to outdoor airioa
Element ii
Floorf
Ceiling-roofr
With respect to indoor air measurement location
Floor to the indoor airf-ia
Ceiling-roof to the indoor airr-ia

References

  1. Feuermann, D.; Hawthorne, W. On the potential and effectiveness of passive night ventilation cooling. In Proceedings of the 1991 Congress of ISES, Solar Energy for the 21st Century, Denver, CO, USA, 19–23 August 1991. [Google Scholar]
  2. Holford, J.M.; Woods, A.W. On the thermal buffering of naturally ventilated buildings through internal thermal mass. J. Fluid Mech. 2007, 580, 3–29. [Google Scholar] [CrossRef]
  3. Roucoult, J.-M.; Douzane, O.; Langlet, T. Incorporation of thermal inertia in the aim of installing a natural nighttime ventilation system in buildings. Energy Build. 1999, 29, 129–133. [Google Scholar] [CrossRef]
  4. Yam, J.; Li, Y.; Zheng, Z. Nonlinear coupling between thermal mass and natural ventilation in buildings. Int. J. Heat Mass Transf. 2003, 46, 1251–1264. [Google Scholar] [CrossRef]
  5. Yang, D.; Guo, Y. Fluctuation of natural ventilation induced by nonlinear coupling between buoyancy and thermal mass. Int. J. Heat Mass Transf. 2016, 96, 218–230. [Google Scholar] [CrossRef]
  6. Zhou, J.; Zhang, G.; Lin, Y.; Li, Y. Coupling of thermal mass and natural ventilation in buildings. Energy Build. 2008, 40, 979–986. [Google Scholar] [CrossRef]
  7. Antonopoulos, K.A.; Koronaki, E.P. Effect of indoor mass on the time constant and thermal delay of buildings. Int. J. Energy Res. 2000, 24, 391–402. [Google Scholar] [CrossRef]
  8. Deng, J.; Yao, R.; Yu, W.; Zhang, Q.; Li, B. Effectiveness of the thermal mass of external walls on residential buildings for part-time part-space heating and cooling using the state-space method. Energy Build. 2019, 190, 155–171. [Google Scholar] [CrossRef] [Green Version]
  9. Brambilla, A.; Bonvin, J.; Flourentzou, F.; Jusselme, T. On the Influence of Thermal Mass and Natural Ventilation on Overheating Risk in Offices. Buildings 2018, 8, 47. [Google Scholar] [CrossRef] [Green Version]
  10. Gagliano, A.; Nocera, F.; Patania, F.; Moschella, A.; Detommaso, M.; Evola, G. Synergic effects of thermal mass and natural ventilation on the thermal behaviour of traditional massive buildings. Int. J. Sustain. Energy 2016, 35, 411–428. [Google Scholar] [CrossRef]
  11. Lagesse, A.; Barthelmé, A.-F.; Jay, A.; Wurtz, E. Impact of thermal mass on summer comfort in building: A numerical approach leading to a decision support tool. In Proceedings of the BS2013, 13th Conference of International Building Performance Simulation Association, Chambéry, France, 25–28 August 2013. [Google Scholar]
  12. Caciolo, M.; Cui, S.; Stabat, P.; Marchio, D. Development of a new correlation for single-sided natural ventilation adapted to leeward conditions. Energy Build. 2013, 60, 372–382. [Google Scholar] [CrossRef]
  13. Geros, V.; Santamouris, M.; Karatasou, S.; Tsangrassoulis, A.; Papanikolaou, N. On the cooling potential of night ventilation techniques in the urban environment. Energy Build. 2005, 37, 243–257. [Google Scholar] [CrossRef]
  14. Porras-Amores, C.; Mazarrón, F.R.; Cañas, I.; Villoría Sáez, P. Natural ventilation analysis in an underground construction: CFD simulation and experimental validation. Tunn. Undergr. Space Technol. 2019, 90, 162–173. [Google Scholar] [CrossRef]
  15. Vitale, V.; Salerno, G. A numerical prediction of the passive cooling effects on thermal comfort for a historical building in Rome. Energy Build. 2017, 157, 1–10. [Google Scholar] [CrossRef]
  16. Caciolo, M.; Stabat, P.; Marchio, D. Full scale experimental study of single-sided ventilation: Analysis of stack and wind effects. Energy Build. 2011, 43, 1765–1773. [Google Scholar] [CrossRef]
  17. Faggianelli, G.A.; Brun, A.; Wurtz, E.; Muselli, M. Assessment of different airflow modeling approaches on a naturally ventilated Mediterranean building. Energy Build. 2015, 107, 345–354. [Google Scholar] [CrossRef]
  18. Omrani, S.; Garcia-Hansen, V.; Capra, B.R.; Drogemuller, R. Effect of natural ventilation mode on thermal comfort and ventilation performance: Full-scale measurement. Energy Build. 2017, 156, 1–16. [Google Scholar] [CrossRef] [Green Version]
  19. Dorizas, P.V.; Samuel, S.; Dejan, M.; Keqin, Y.; Dimitris, M.-M.; Tom, L. Performance of a natural ventilation system with heat recovery in UK classrooms: An experimental study. Energy Build. 2018, 179, 278–291. [Google Scholar] [CrossRef] [Green Version]
  20. Han, D.-H.; Kim, S.; Choi, J.H.; Kim, Y.S.; Chung, H.; Jeong, H.; Watjanatepin, N.; Ruangpattanawiwat, C.; Choi, S.-H. Experimental study on thermal buoyancy-induced natural ventilation. Energy Build. 2018, 177, 1–11. [Google Scholar] [CrossRef]
  21. Blondeau, P.; Spérandio, M.; Allard, F. Night ventilation for building cooling in summer. Sol. Energy 1997, 61, 327–335. [Google Scholar] [CrossRef]
  22. Gagliano, A.; Berardi, U.; Nocera, F.; Salerno, N. Influence of Natural Ventilation on the Thermal Behavior of a Massive Building. Energy Procedia 2015, 78, 1287–1292. [Google Scholar] [CrossRef] [Green Version]
  23. Kumar, S.; Singh, M.K.; Mathur, A.; Mathur, S.; Mathur, J. Thermal performance and comfort potential estimation in low-rise high thermal mass naturally ventilated office buildings in India: An experimental study. J. Build. Eng. 2018, 20, 569–584. [Google Scholar] [CrossRef]
  24. Colleu, A.; Olivier-Allibert, C. 12 solutions bioclimatiques pour l’habitat: Construire ou rénover: Climat et besoins énergétiques; Editions Eyrolles: Paris, France, 2016. [Google Scholar]
  25. Zürcher, C.; Frank, T. Physique du bâtiment—Construction et énergie; vdf Hochschulverlag AG and der ETH Zürich: Zürich, Switzerland, 2014. [Google Scholar]
  26. Cherif, Y.; Joulin, A.; Zalewski, L.; Lassue, S. Superficial heat transfer by forced convection and radiation in a horizontal channel. Int. J. Therm. Sci. 2009, 48, 1696–1706. [Google Scholar] [CrossRef]
  27. Lassue, S.; Duthoit, B.; Théry, P. A Convective and Radiative Flux Sensor for Designing Thermal Comfort Controllers. Indoor Environ. 1992, 1, 293–299. [Google Scholar] [CrossRef]
  28. Leephakpreeda, T. Applications of thermoelectric modules on heat flow detection. ISA Trans. 2012, 51, 345–350. [Google Scholar] [CrossRef]
  29. Wu, T.; Antczak, E.; Defer, D.; Chartier, T. Thermal characteristics in situ monitoring of detached house wall constituted by raw clay. Eur. J. Environ. Civ. Eng. 2010, 14, 653–667. [Google Scholar] [CrossRef]
  30. Chen Austin, M.; Bruneau, D.; Sempey, A.; Mora, L. Qualification of the Energy Charge-Discharge of a Concrete Slab in a Naturally Ventilated Building. In Proceedings of the 2019 7th International Engineering, Sciences and Technology Conference (IESTEC), Panama City, Panama, 9–11 October 2019; pp. 188–192. [Google Scholar] [CrossRef]
  31. Chen Austin, M.; Wu, T.V.; Sempey, A.; Sommier, A.; Dumoulin, J.; Bruneau, D.; Batsale, J.C.; Yang, Y. Investigation into the use of thermoelectric modules as an alternative to conventional fluxmeters: Application to convective and radiative heat flux in buildings. Int. J. Therm. Sci. 2021, 160, 106653. [Google Scholar] [CrossRef]
  32. Sánchez-Benítez, A.; García-Herrera, R.; Barriopedro, D.; Sousa, P.M.; Trigo, R.M. June 2017: The Earliest European Summer Mega-heatwave of Reanalysis Period. Geophys. Res. Lett. 2018, 45, 1955–1962. [Google Scholar] [CrossRef]
  33. Allard, F. Natural Ventilation in Buildings: A Design Handbook; James and James: London, UK, 1998. [Google Scholar]
  34. Morris, F.; Zakaria, N.Z.; Ahmed, A.Z. Heat Flux through Naturally Ventilated Building in Malaysian Climate. Appl. Mech. Mater. 2012, 204–208, 4384–4388. [Google Scholar] [CrossRef]
  35. Bruno, R.; Ferraro, V.; Bevilacqua, P.; Arcuri, N. On the assessment of the heat transfer coefficients on building components: A comparison between modeled and experimental data. Build. Environ. 2022, 216, 108995. [Google Scholar] [CrossRef]
  36. Michalak, P. Experimental and Theoretical Study on the Internal Convective and Radiative Heat Transfer Coefficients for a Vertical Wall in a Residential Building. Energies 2021, 14, 5953. [Google Scholar] [CrossRef]
  37. Chen Austin, M.; Bruneau, D.; Sempey, A.; Mora, L.; Sommier, A. Experimental Study of a natural ventilation strategy in a Full-Scale Enclosure Under Meteorological Conditions: A Buoyancy-Driven Approach. KEG 2018, 3, 657. [Google Scholar] [CrossRef] [Green Version]
  38. Chen Austin, M.; Bruneau, D.; Sempey, A.; Mora, L. Statistical Analysis of Architectural Features Effects on Indoor Environmental Conditions in a Plus Energy House Prototype; Passive and Low Energy Architecture (PLEA): Hong Kong, China, 2018. [Google Scholar]
Figure 1. Architectural features: (a) floor concrete slab, (b) programmable solar shades and natural ventilation openings (inside red squares) on the south glazed façade, (c) the north facade, (d) and the shed roof.
Buildings 13 00632 g001
Figure 2. Schematic of the architectural plan of the building: (a) western view and (b) top view. Values of the global heat transfer coefficients for external walls of the platform (dotted lines).
Buildings 13 00632 g002
Figure 3. Domains and variables for the experimental approach: (a) inputs and outputs studied regarding the building domain (in italic style); (b) inputs and outputs studied regarding the thermal mass domain (in red).
Buildings 13 00632 g003
Figure 4. Instrumentation over the concrete-slab surface.
Buildings 13 00632 g004
Figure 5. Weather data, along with the indoor air and mean radiant temperatures. (a) Configuration #1. (b) Configuration #2, moments where openings remained opened (gray zones). (c) Configuration #3, moments where openings remained opened (gray zones).
Buildings 13 00632 g005aBuildings 13 00632 g005b
Figure 6. Convective heat flux for: (a) config. #1, (b) config. #2, and (c) config. #3.
Buildings 13 00632 g006aBuildings 13 00632 g006b
Figure 7. Air and surface-air temperatures for: (a) config. #1, (b) config. #2, and (c) config. #3.
Buildings 13 00632 g007aBuildings 13 00632 g007b
Figure 8. Radiative heat flux for: (a) config. #1, (b) config. #2, and (c) config. #3.
Buildings 13 00632 g008aBuildings 13 00632 g008b
Figure 9. Results of the parametric analysis from temperature measurements for: Config. #1 (a,b), config. #2 (c,d), and config. #3 (e,f).
Buildings 13 00632 g009
Figure 10. Parametric results from convective heat transfer coefficients for: Config. #1 (a,b), config. #2 (c,d), and config. #3 (e,f).
Buildings 13 00632 g010
Table 1. Summary of the physical characteristics of the envelope elements.
Envelope Elements Material CompositionValue
External wallsNorthFermacell 13 mm, wooden fibers 45 mm, plywood 10 mm, wooden wool 205 mm, rainscreen1.2 Wm−2 K−1
SouthLarge double-layer windows1.6 Wm−2 K−1
East and westOssature wood, external and internal shelfs (act as buffers), insulation1.4 Wm−2 K−1
FloorConcrete 68 mm, plywood 20 mm, wooden wool 240 mm, wooden fibers 45 mm, plywood 10 mm, elevated from ground floor0.286 Wm−2 K−1
Ceiling-roofWaterproof sheet, plywood 22 mm, wooden fibers 45 mm, wooden wool 220 mm, anti-steam sheet, plywood 22 mm, air gap 53 mm, wooden ceiling 15 mm0.278 Wm−2 K−1
Infiltration rate (NF EN 12,831:2004)0.76 h−1
Table 2. Summary of the instruments’ characteristics implemented for local measurements.
Variable to Be MeasuredSensor/InstrumentAccuracy
Air and surface temperaturesThermocouples T±0.48 °C (−67 to 40 °C)
Mean radiant temperature (MRT)Infrared camera FLIR A320, crumbled aluminum foil, black foil±2 °C
Convective and radiative heat fluxesBlack-and-shiny thermoelectric modules [31] 239   ±   3   μ Vm 2   W 1
Table 3. Configurations of the openings on each measurement campaign.
Natural Ventilation Openings (NVO) Status
Config. T i n < T o a   T i n > T o a
DatesDuration
(Days)
NorthSouthShed RoofNorthSouthShed Roof
#123 May 2017,
12–17 Septiembre 2017
7CCCCCC
#227 July–12 September 201635CCCCOO
#325–29 May 20174COOCOO
C: Closed. O: Opened. Toa: Outdoor air temperature, Tin: Indoor air temperature.
Table 4. Variables and their physical meanings for the parametric analysis.
ParameterExpressionPhysical MeaningPossible RangesMeaning in Summertime
θ i o a T i n T o a Represents the decrement factor of the indoor air temperature with respect to the outdoor air temperature. Gives indications about the available natural ventilation potential *. θ i o a < 1 The building performs best in terms of thermal inertia.
θ i o a > 1 The natural ventilation potential is available *.
θ i o a ~ 1 No natural ventilation potential available *.
θ S i i a T S i T i n Measures the relative natural ventilation potential * from an indoor local perspective [33]. θ S i i a < 1 The element contributes best to the attenuation of the heat wave.
θ S i i a > 1 The natural ventilation potential increases *.
θ S i i a ~ 1 Indoor air in thermal equilibrium with internal thermal mass.
λ S i h C S i A S i ρ c p V a c h / 3600 Measures the relative strength of convective heat transfer at the internal thermal mass surface due to natural ventilation * [4]. 0.1 < λ S i < 1 “The fluctuation of the indoor air temperature becomes constant. This suggests that the convective heat transfer between the mass and nearby air is an important aspect in thermal mass design” [4].
λ S i > 1 Better convective exchanges at internal thermal mass surfaces. Weak indoor temperature fluctuations [4].
λ S i ~ 1 Good convective exchanges at internal thermal mass surfaces.
λ S i ~   0 The phase shift of the indoor air temperature is zero, and its fluctuation is exactly the same as that of the outdoor air temperature, no matter how large the thermal mass value is. No thermal interaction exists between the thermal mass and the indoor air [4].
h C S i φ C S i T i n T S i Computes the convective coefficient using the air temperature measured at 1.70 m above the surface S i .-
* Natural ventilation potential for cooling purposes, which is different from ventilation only for aeration purposes. It may be called “natural cooling potential availability”.
Table 5. Classification of the days studied during July to early September 2016. CW represents cloudy–windy period. CnW represents cloudy and not-windy period. CrW represents a clear and windy period. CrnW represents a clear and not-windy period. SW represents sunny and windy period.
DaysDaytimeNighttime
27 JulyCWCW
28 to 29 JulyCWCnW
15 to 16 AugustSWCnW
17 August CWCW
19 to 20 AugustCWCnW
22 to 23 AugustSWCrnW
26 August CnWCrW
8 September CWCrW
Table 6. Comparison of the damping between indoor envelope surface temperature and indoor air temperature. The mean radiant temperature ( M R T ). Indoor air temperature ( T i n ). Outdoor air temperature ( T o a ).
ConfigurationPeriod of the Day
Daytime (Toa > Tin)Nighttime (Toa < Tin)
#1Tin < MRTTin > MRT
#2Tin > MRTTin < MRT
#3Tin > MRTTin < MRT
Table 7. Contribution of different surfaces to the indoor air based on convective heat flux.
Conf. #Surface or ElementContribution to the Indoor Air
DaytimeNighttime
ChargingDischargingNeitherChargingDischargingNeither
1Glazed facadeX X
Floor XX
Ceiling XX
2Glazed facade
Floor X X
Ceiling X X
3Glazed facadeX X
Floor X X
Ceiling X X
Disclaimer/Publisher’s Note: The statements, opinions and data contained in all publications are solely those of the individual author(s) and contributor(s) and not of MDPI and/or the editor(s). MDPI and/or the editor(s) disclaim responsibility for any injury to people or property resulting from any ideas, methods, instructions or products referred to in the content.

