Article

Detection and Damage Evaluation of Hinge Joints in Hollow Slab Bridges Based on a Light-Load Field Test

1
School of Civil Engineering and Architecture, Wuhan University of Technology, Wuhan 430070, China
2
School of Civil Engineering and Architecture, Wuhan Institute of Technology, Wuhan 430074, China
3
Wuhan Zhonghe Engineering Technology Co. Ltd., Wuhan 430080, China
*
Author to whom correspondence should be addressed.
Buildings 2023, 13(3), 699; https://doi.org/10.3390/buildings13030699
Submission received: 22 January 2023 / Revised: 17 February 2023 / Accepted: 26 February 2023 / Published: 6 March 2023

Abstract

:
The hollow slab bridge is a widely used bridge type for urban bridges. The slabs are prefabricated in a factory and are assembled on site, and then the hinge joints are poured on site. Shallow hinge joints have been used in most existing hollow slab bridges, which commonly bring inadequate connection to the adjacent slabs and probably result in bridge damage. Traditional detection and test methods for hinge joints interrupt traffic, which is inconvenient for local commuters. In the present study, a light-load field test method for hinge joints was proposed. The principles and procedures of the light-load test were concluded and provided based on the test results of 96 spans. The theoretical and measured lateral load distribution ratios were calculated and compared based on hinge joint plate theory. The damage evaluation method and damage classification for hinge joints were defined based on the test results of 1100 hinge joints. Furthermore, the accuracy of the proposed method was verified by a destructive experiment. The research results indicate that the light-load field test and the damage evaluation method for hinge joints are indeed convenient, reliable, and economical, and deserve practical spread and repetition in this area.

1. Introduction

The hollow slab bridge is one of the most commonly used types of bridge. The advantages of this type of bridge include convenient and fast construction, environmental protection, low requirements for space, and low cost [1,2]. These advantages have made the hollow slab bridge a popular selection for urban bridges, in which the proportion of medium span and small span bridges is more than 90% [3].
For this type of bridge, the slabs are prefabricated in a factory and are assembled on site. Usually, the section height of a slab ranges from 80 cm to 120 cm, and the section width of a slab ranges from 80 cm to 150 cm [4,5,6], which makes it possible to transport slabs in crowded and busy city roads. Afterwards, the cementitious fills must be poured on site to fill the gaps between every two slabs. After the cementitious fills harden, they are called hinge joints. The hinge joints can ensure that the slabs connect to each other and bear loads together [7,8,9].
Recent investigations have found that shallow hinge joints are used in most existing hollow slab bridges [10,11], which can easily be damaged by continuously increasing traffic volume and overload trucks. For an increasing number of longitudinal cracks, water seepage and large deflection are found in bridge detection [12]. The sketches of hinge joints are shown in Figure 1a,b, where h represents the height of the joint and H represents the height of the slab. Generally, if h < 0.5 H , the joint is called a shallow hinge joint; if h 0.5 H , the joint is called a deep hinge joint. In the early stage of the appearance of a hollow slab bridge, the shallow hinge joint had a dominant place, but since the 1990s, the deep hinge joint began to take the place of the shallow hinge joint. Furthermore, it is difficult to use visual detection methods to detect the damage of the hinge joints. Because the pavement is above the hinge joints, the slabs surround the hinge joints, and even some waterproof cloth covers the bottom of the hinge joint. In other words, the hinge joints are enclosed by structural members. If the hinge joint loses its bonding ability to a large extent, a single slab will bear more load than it should, which may result in slab failure and greatly threaten human lives and properties [7,13].
Two examples of slab failure are shown in Figure 1c,d (taken from image.baidu.com accessed on 15 January 2023), both of which are commonly seen hollow slab bridges, using shallow hinge joints, located in urban roads, with a span of approximately 20 m. The immediate cause of slab failure was an overloaded truck moving on the bridge. The difference was that a limbic slab of the Qianjiang #3 Bridge fell off from the bridge on 15 July 2011, and a middle slab of the Changfeng Bridge fell off from the bridge on 16 March 2021.
Although overload is the immediate cause of slab failure, several indirect causes cannot be ignored, such as outdated design methods, incomplete or cursory routine inspection work, and insufficient durability of cementitious fills [14,15].
Currently, conventional methods to avoid bridge accidents are periodic inspection and load tests [16,17,18]. Implementing bridge inspection does not need to interrupt traffic, but implementing load tests in a traditional way always needs to interrupt traffic. In the traditional test, several trucks are moving on the bridge simultaneously. Hence, a professional analysis of whether heavy trucks can pass the bridge safely is needed in advance [19,20,21]. In other words, although the traditional load test has advantages including simulating the real load condition, being guided by mature specifications and being widely approved, it has disadvantages including requiring considerable analysis work, costing a lot of money, bringing great inconvenience to local folks, and making great traffic jams on local roads. For damage detection and identification, new methods such as nondestructive detection [22], vision-based measurements [3,23], mode shape-based methods [15,24], vibration-based methods [25], and other novel methods [26,27] have been proposed by some researchers in laboratories and model tests. However, some of these methods still need further verification and application. Therefore, new methods for bridge detection based on practical data need to be developed.
This paper proposes a simplified test method to evaluate hinge joints and defines a reasonable evaluation method to describe the damage status of hinge joints. In the proposed method, called the light-load field test, only one loading truck will move on the testing bridge without interrupting traffic. Compared with the traditional method, it is more convenient and economical, although the results may be vulnerable to the effects from other moving vehicles. However, by implementing the light-load field test in hollow slab bridges with the proposed disciplines, the accuracy of the method will be proved and approved. In total, 96 spans of hollow slab bridges were tested with a light-load field test, the theoretical and measured lateral load distribution ratio of each span was analyzed, and the damage classification of the hinge joint was defined. Furthermore, the accuracy of the detection and evaluation methods was verified by a destructive experiment.

2. Light-Load Field Test

2.1. Principles

This method, called the light-load field test, is a load test method that should follow the guidelines of the Load Test Methods for Highway Bridge (JTG/T J21-01-2015) [20]. However, this method aims to detect and evaluate the damage status of hinge joints without interrupted traffic, and the following rules should be executed.
(1)
The loading truck should be weightier than most moving vehicles, but lighter than the weight limit of the bridge to be tested. Generally, the loading truck should weigh approximately 40 tons.
(2)
The loading truck should move forward slowly, with a constant speed, along the center line of the lane. Generally, the loading truck’s speed is suggested to be lower than 30 km/h.
(3)
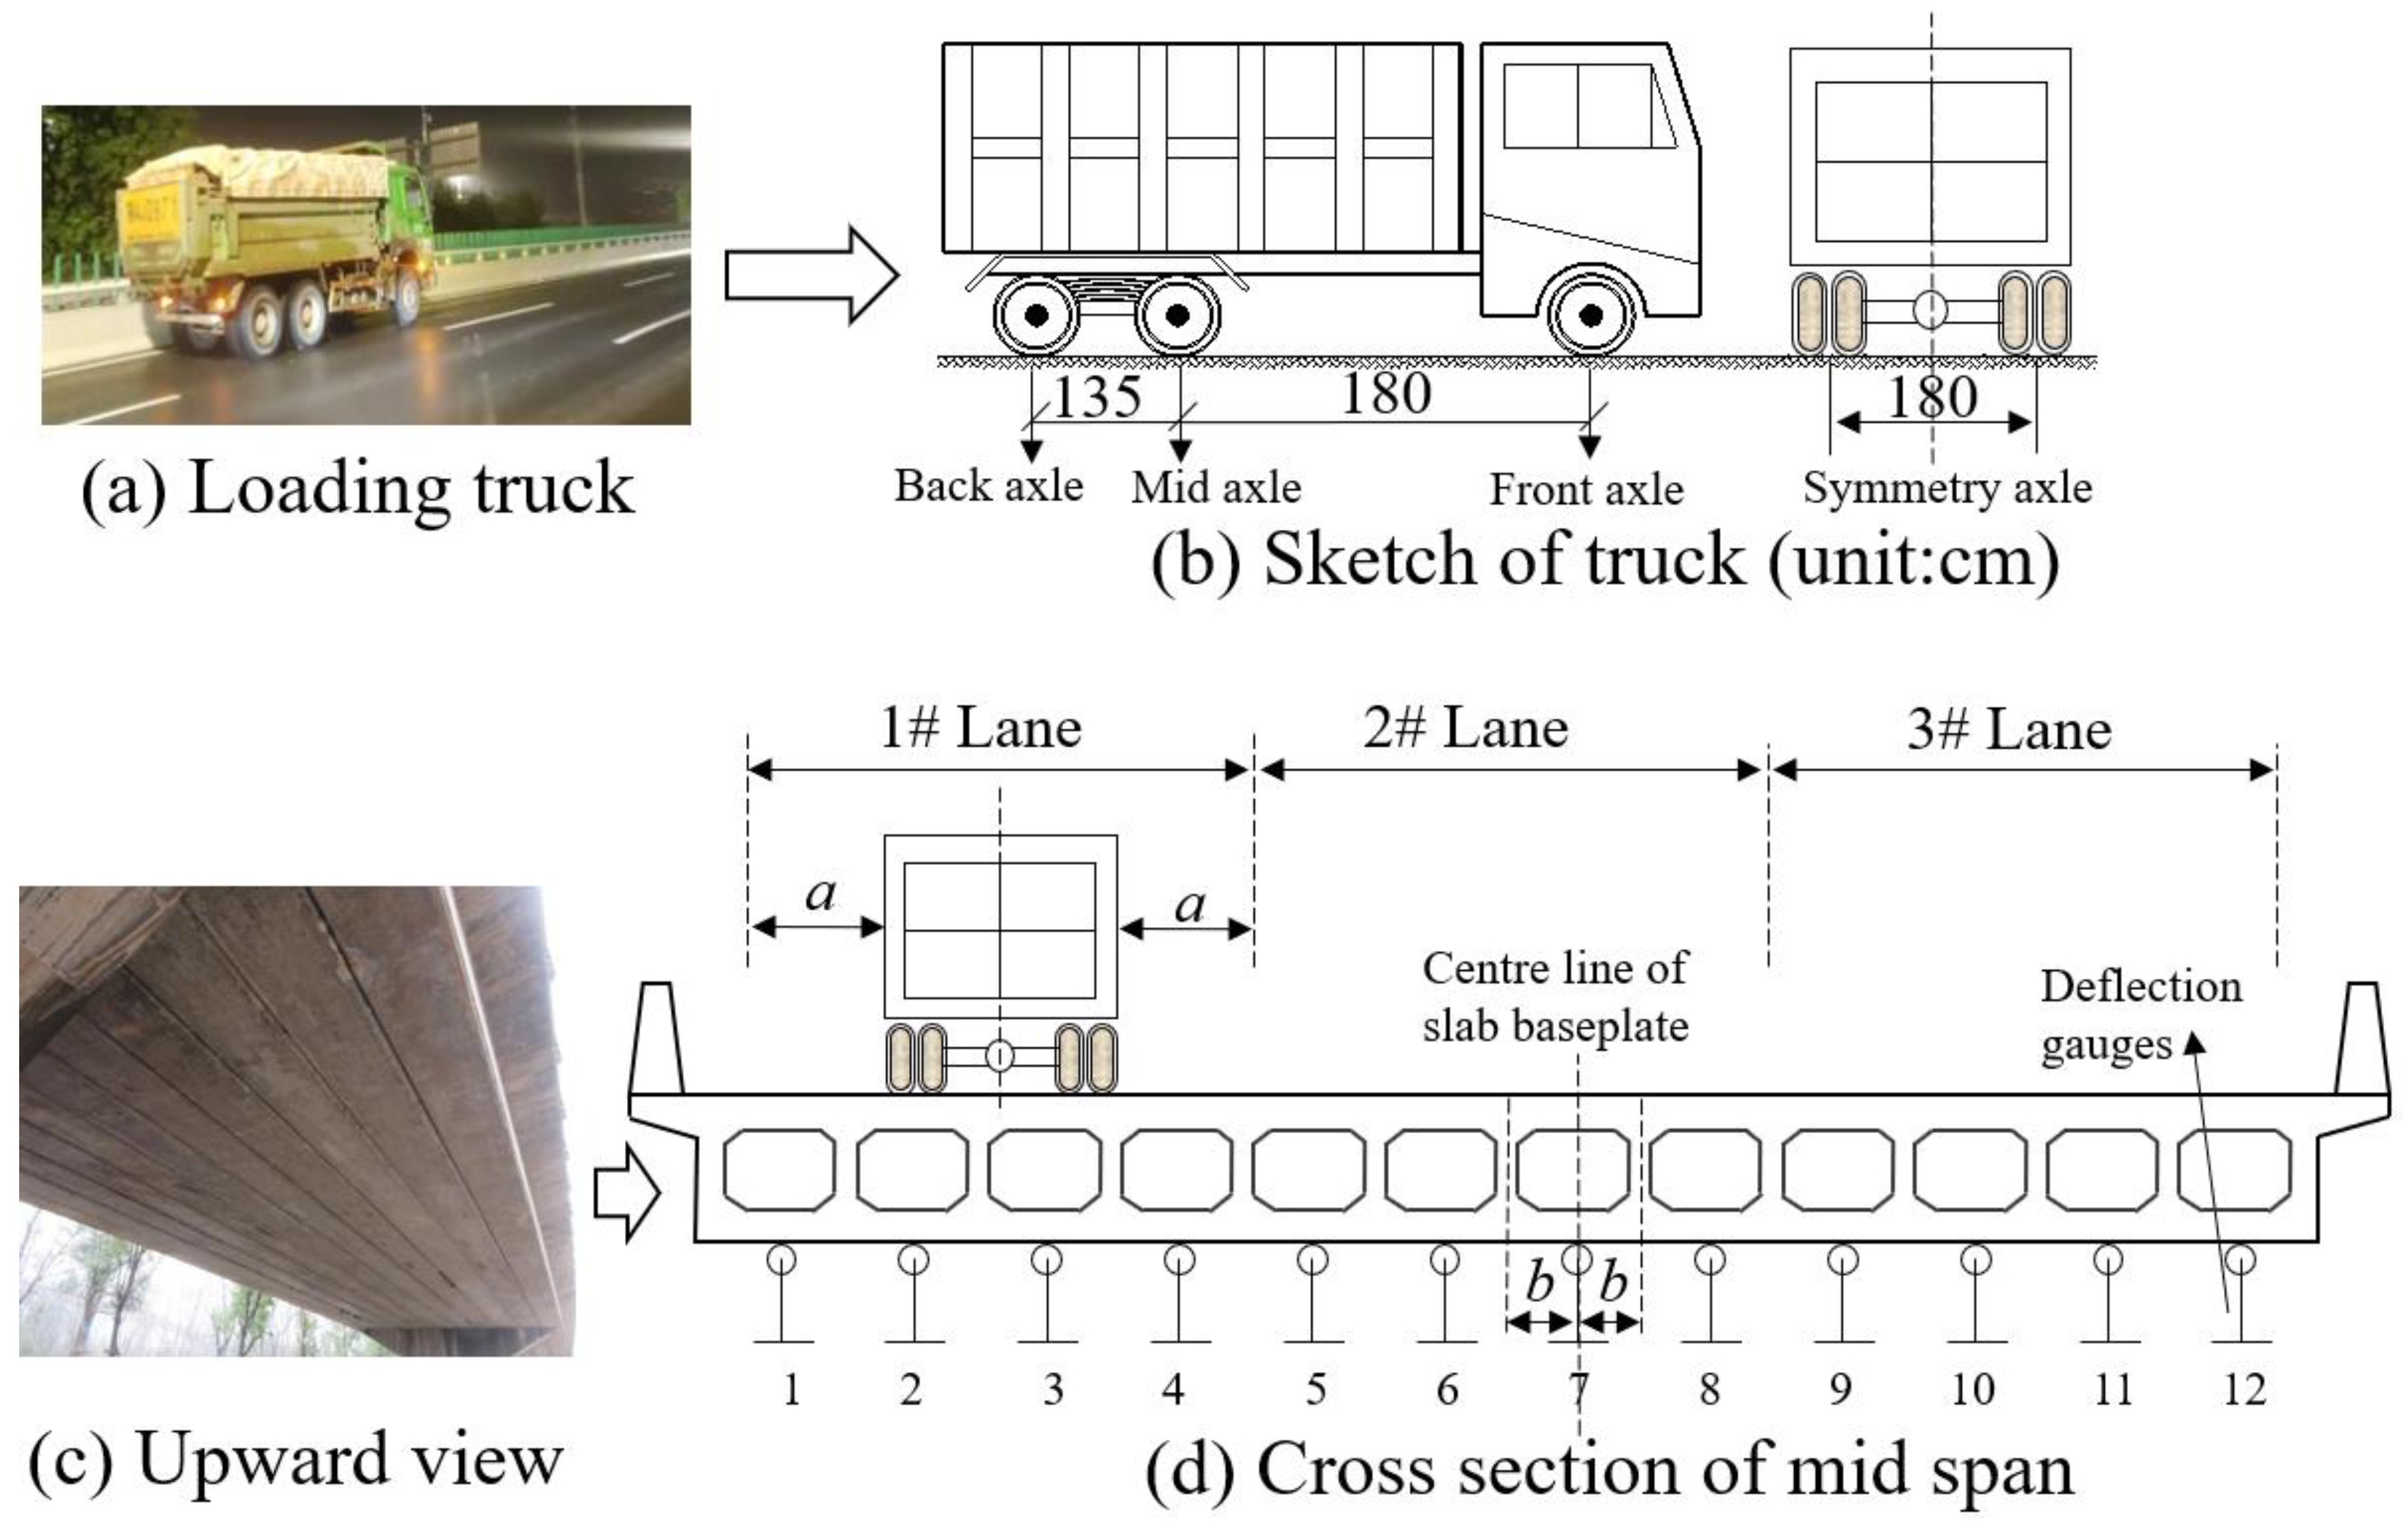
In each test condition, a lane should be ground by the truck in a single test condition, and the data of the mid 7 slabs (or mid 6 hinge joints) below the testing lane deserve analysis. For example, in test Condition 1, the truck is moving in the 1# Lane, the deflections of the #1~#7 slabs are needed for calculating the lateral load distribution ratio. In test Condition 2, the truck is moving in the 2# Lane, the deflections of the #3~#9 or #4~#10 or even #3~#10 slabs are studied. Similarly, in test Condition 3, the truck is moving in the 3# Lane, the deflections of #6~#12 slabs are studied.
(4)
Dynamic deflection measurement is needed, and the precision should be 0.01 mm.
(5)
To avoid redundant data, it is better to implement the light-load field test under light traffic volume or at night.
The lanes of Qingling #5 Bridge are shown in Figure 2, which works as a schematic template to exhibit the test principles and test conditions. The truck will move forward on the lanes in sequence. The symmetry axle of the truck will coincide with the center line of the lane, as shown in Figure 2d. The testing points are situated at the intersection points of the midspan line and the center line of the slabs’ baseplate. In the latest light-load field test conducted by our research team, a truck’s picture is shown in Figure 2a,b. It weighs 400.9 kN and the weights of the front axle, mid axle, and back axle were 60.4 kN, 170.2 kN, and 170.2 kN, respectively.

2.2. Procedures

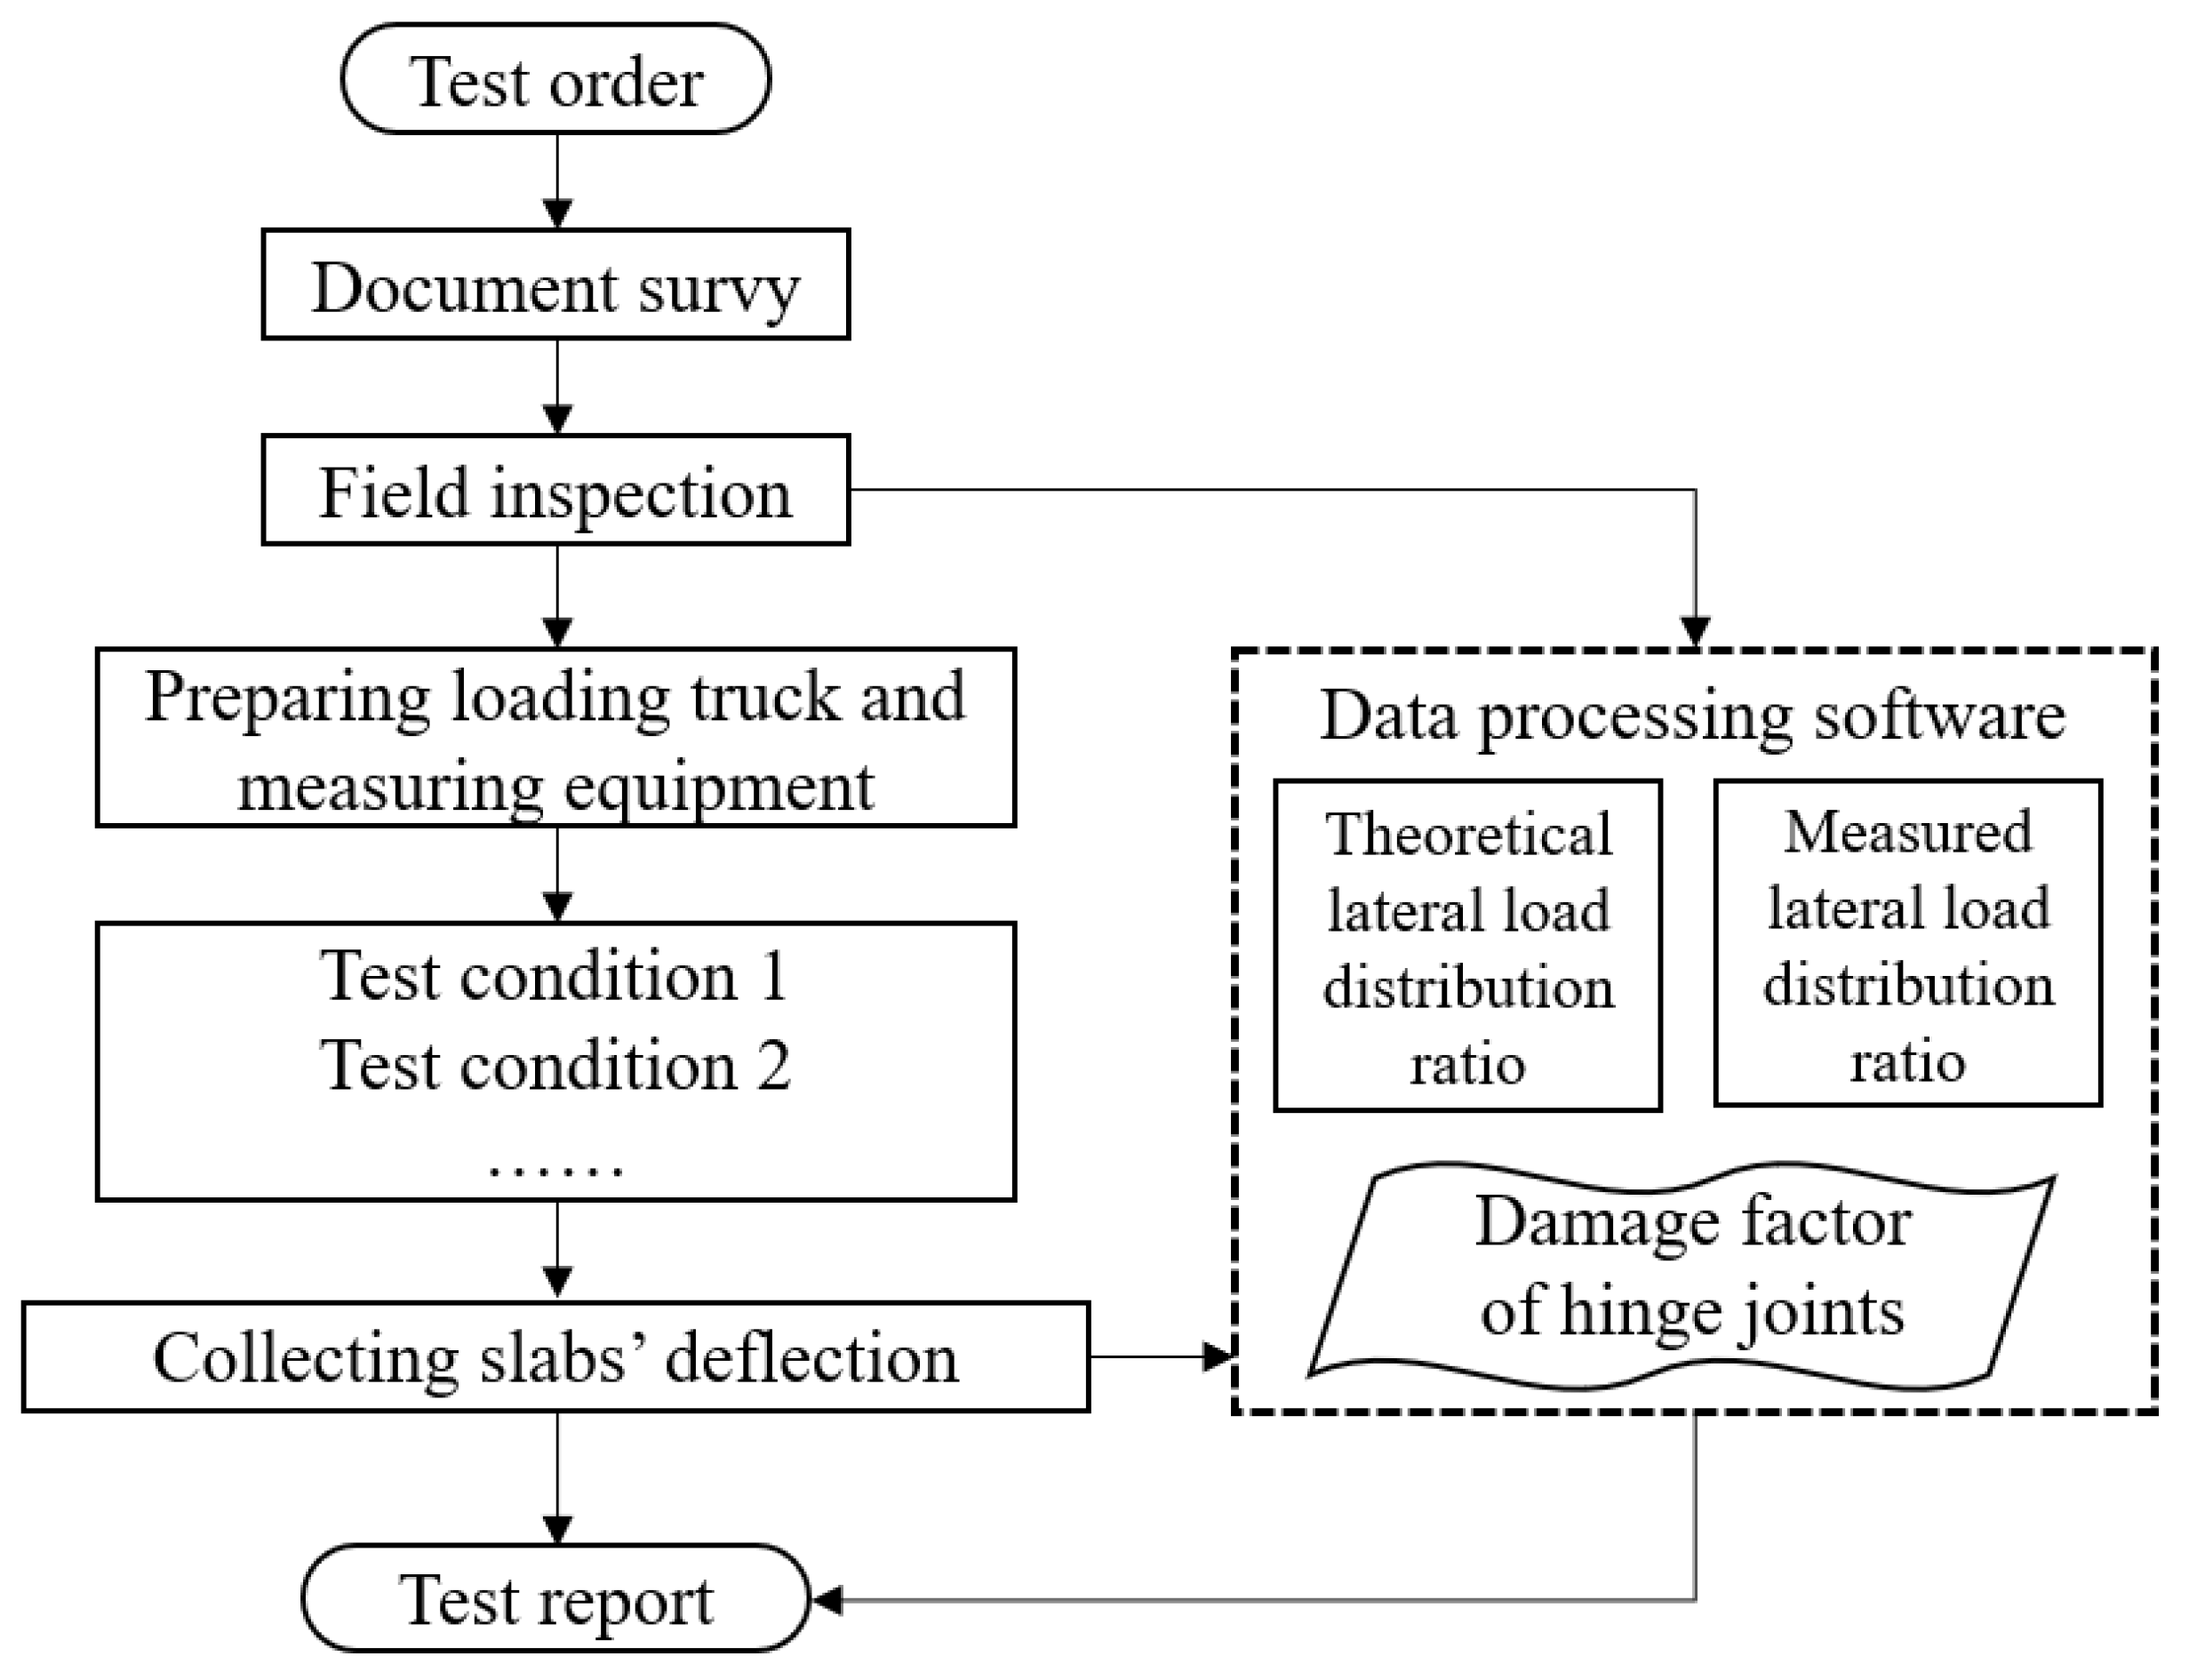
The purpose of the light-load field test is to evaluate the damage status of the hinge joints based on the lateral load distribution ratio, and then to help to make reasonable decisions for bridge maintenance. Data processing software based on hinge-joint plate theory has been developed according to a great deal of test experience. It has been applied in lots of bridge tests. The software can calculate and predict the lateral load distribution ratio of bridges and evaluate the damage status of the hinge joints after the criteria have been set up. The test procedures are shown in Figure 3. One of the most significant advantages of light-load field tests is avoiding interrupted traffic; another advantage is evaluating the hinge joints based on the determined data from the field tests instead of the subjective data from the appearance inspection.

2.3. Bridge Samples

Among the latest tested hollow slab bridges, 96 spans were chosen as bridge samples and were analyzed in this paper. All of the samples were urban bridges, simply supported bridges, their slabs were prefabricated and then assembled on-site, their hinge joints were shallow hinge joints and made from conventional materials (neither fiber reinforced nor steel bar reinforced). The profiles of these bridge samples are listed in Table 1. The length of the span ranged from 16 m to 25 m, the width of the span ranged from 8.5 m to 50 m, and the number of slabs ranged from 7 to 47, which almost covered all of the types of commonly seen hollow slab bridges. For each bridge, the number of lanes is also listed in Table 1, which reveals the total number of test conditions based on the principles in Section 2.1. That is to say, if there are three lanes on the bridge deck, there will be three test conditions. For a bridge with lots of lanes, such as Luojiagang Bridge and Donghu Bridge, four adjacent lanes were chosen to be tested.
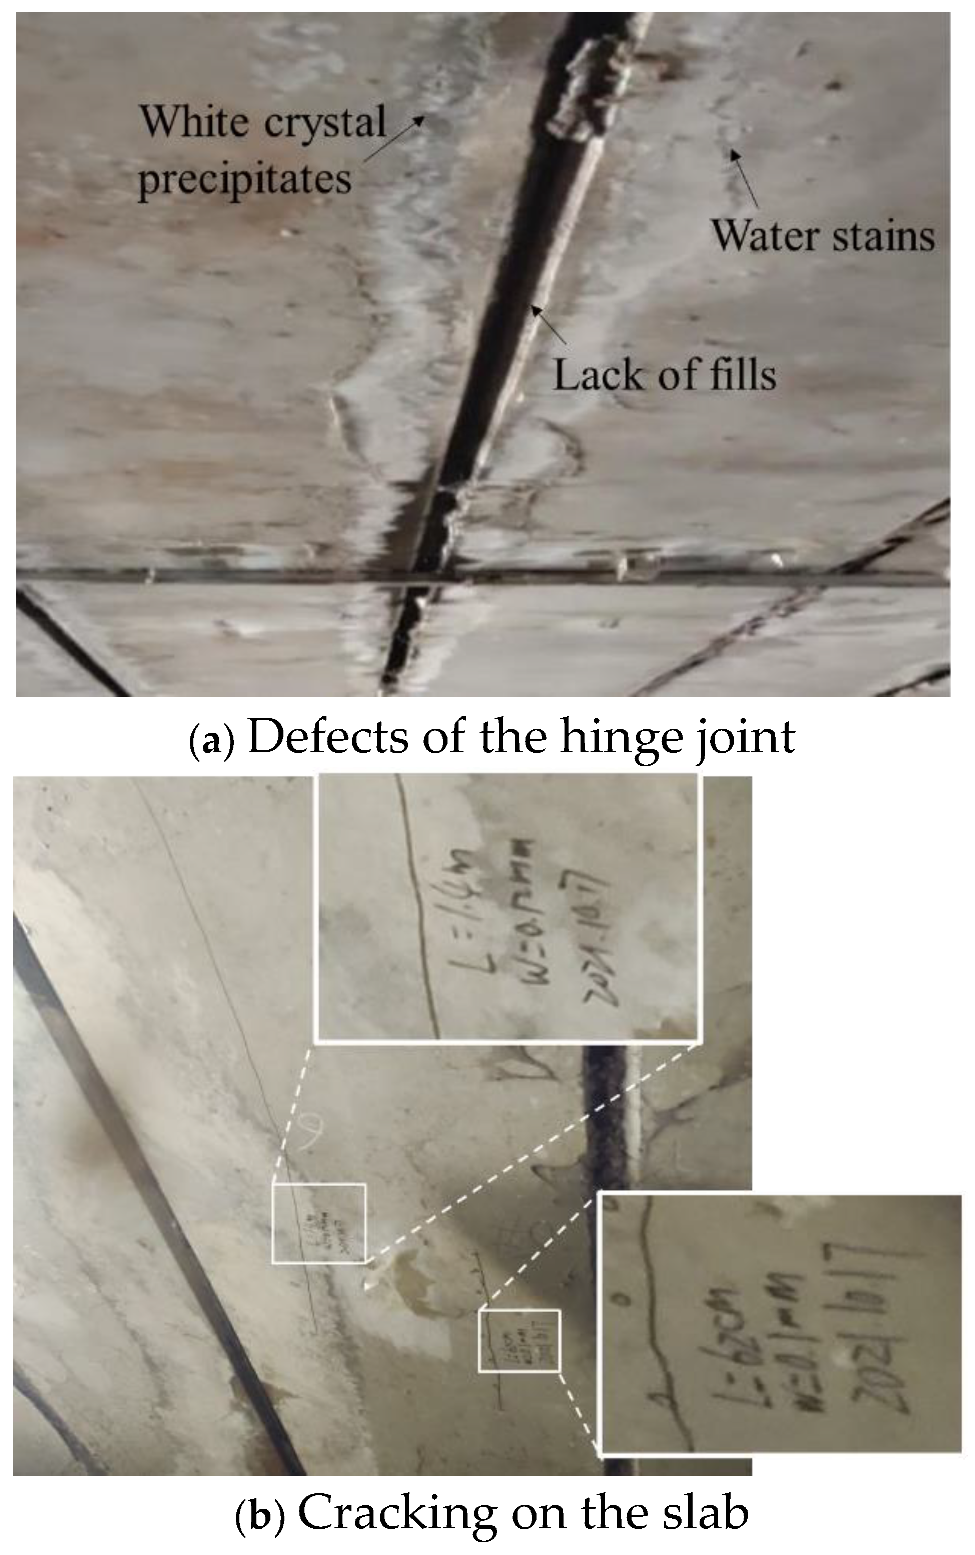
Generally, hollow slab bridges bearing urban traffic did not appear to have serious bridge damage. Almost all of the tested samples worked well based on their conventional maintenance record. Actually, they looked like newly built bridges when observed from the deck, even if there was some damage to the slab when observed below the bridge. One of the most commonly observed types of damage was the defect of the hinge joint, as shown in Figure 4a. Some fills had fallen off the joint, water leaked from the joint, and even some white crystal precipitates appeared near the joint. Another form of damage was cracking on the slab, as shown in Figure 4b. Two longitudinal cracks appeared on the bottom of the slab, the length of the crack was marked as “L”, the width of the crack was marked as “W”, and the day the cracks were found was also marked on the slab. It should be noted that cracking on the bottom of the slab is not a commonly seen defect, and only 4 out of 96 spans appeared with longitudinal cracks during the latest detection. Furthermore, no transverse crack was found on the bottom of the slab.
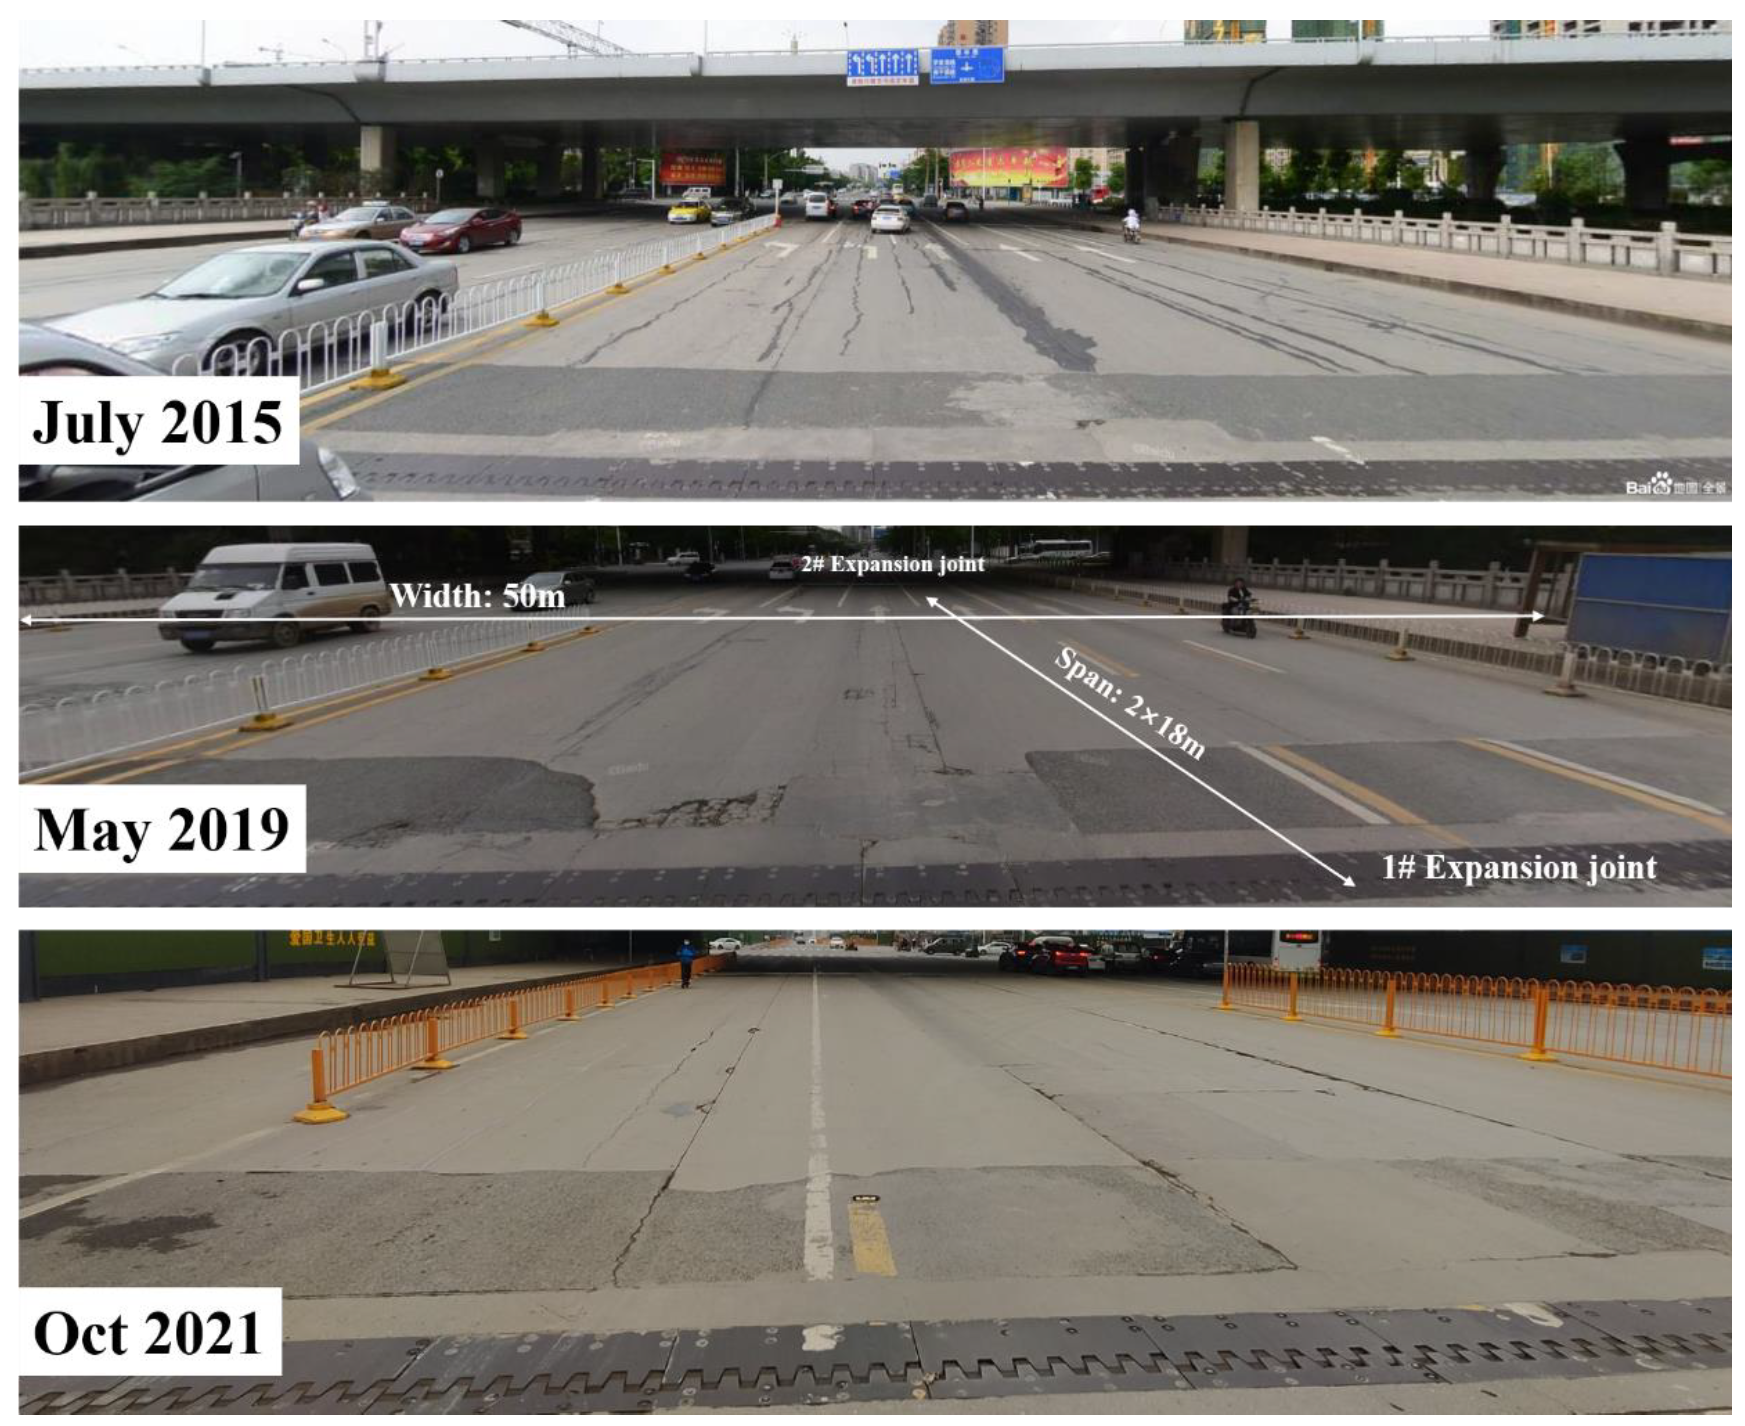
Among the latest detections, obvious damage such as cracking of the deck pavement appeared on only one bridge, called Luojiagang Bridge, as shown in Figure 5 (the upper two pictures were quoted from map.baidu.com/ accessed on 15 January 2023, and the third picture was taken by the research team). It is located on a busy traffic road and has two spans and 47 slabs. It was built and opened to traffic in 2003. The profiles of Luojiagang Bridge are listed in Table 1 and are marked in Figure 5. The longitudinal cracks on the deck pavement, as well as the stains of repairing measures were clear. Compared with its status in July 2015, May 2019, and October 2021, despite conventional maintenance, the pavement had been damaged again and again by busy traffic. This indicates that there may be some structural damage to the load-carrying members, and repairing the pavement in order to avoid further damage may make no sense. However, the longitudinal cracks expanding along with the hinge joints indicate that the slabs were no longer working together. This means that some hinge joints lost their function to some extent, making the slabs deform asynchronously.

2.4. Test Results

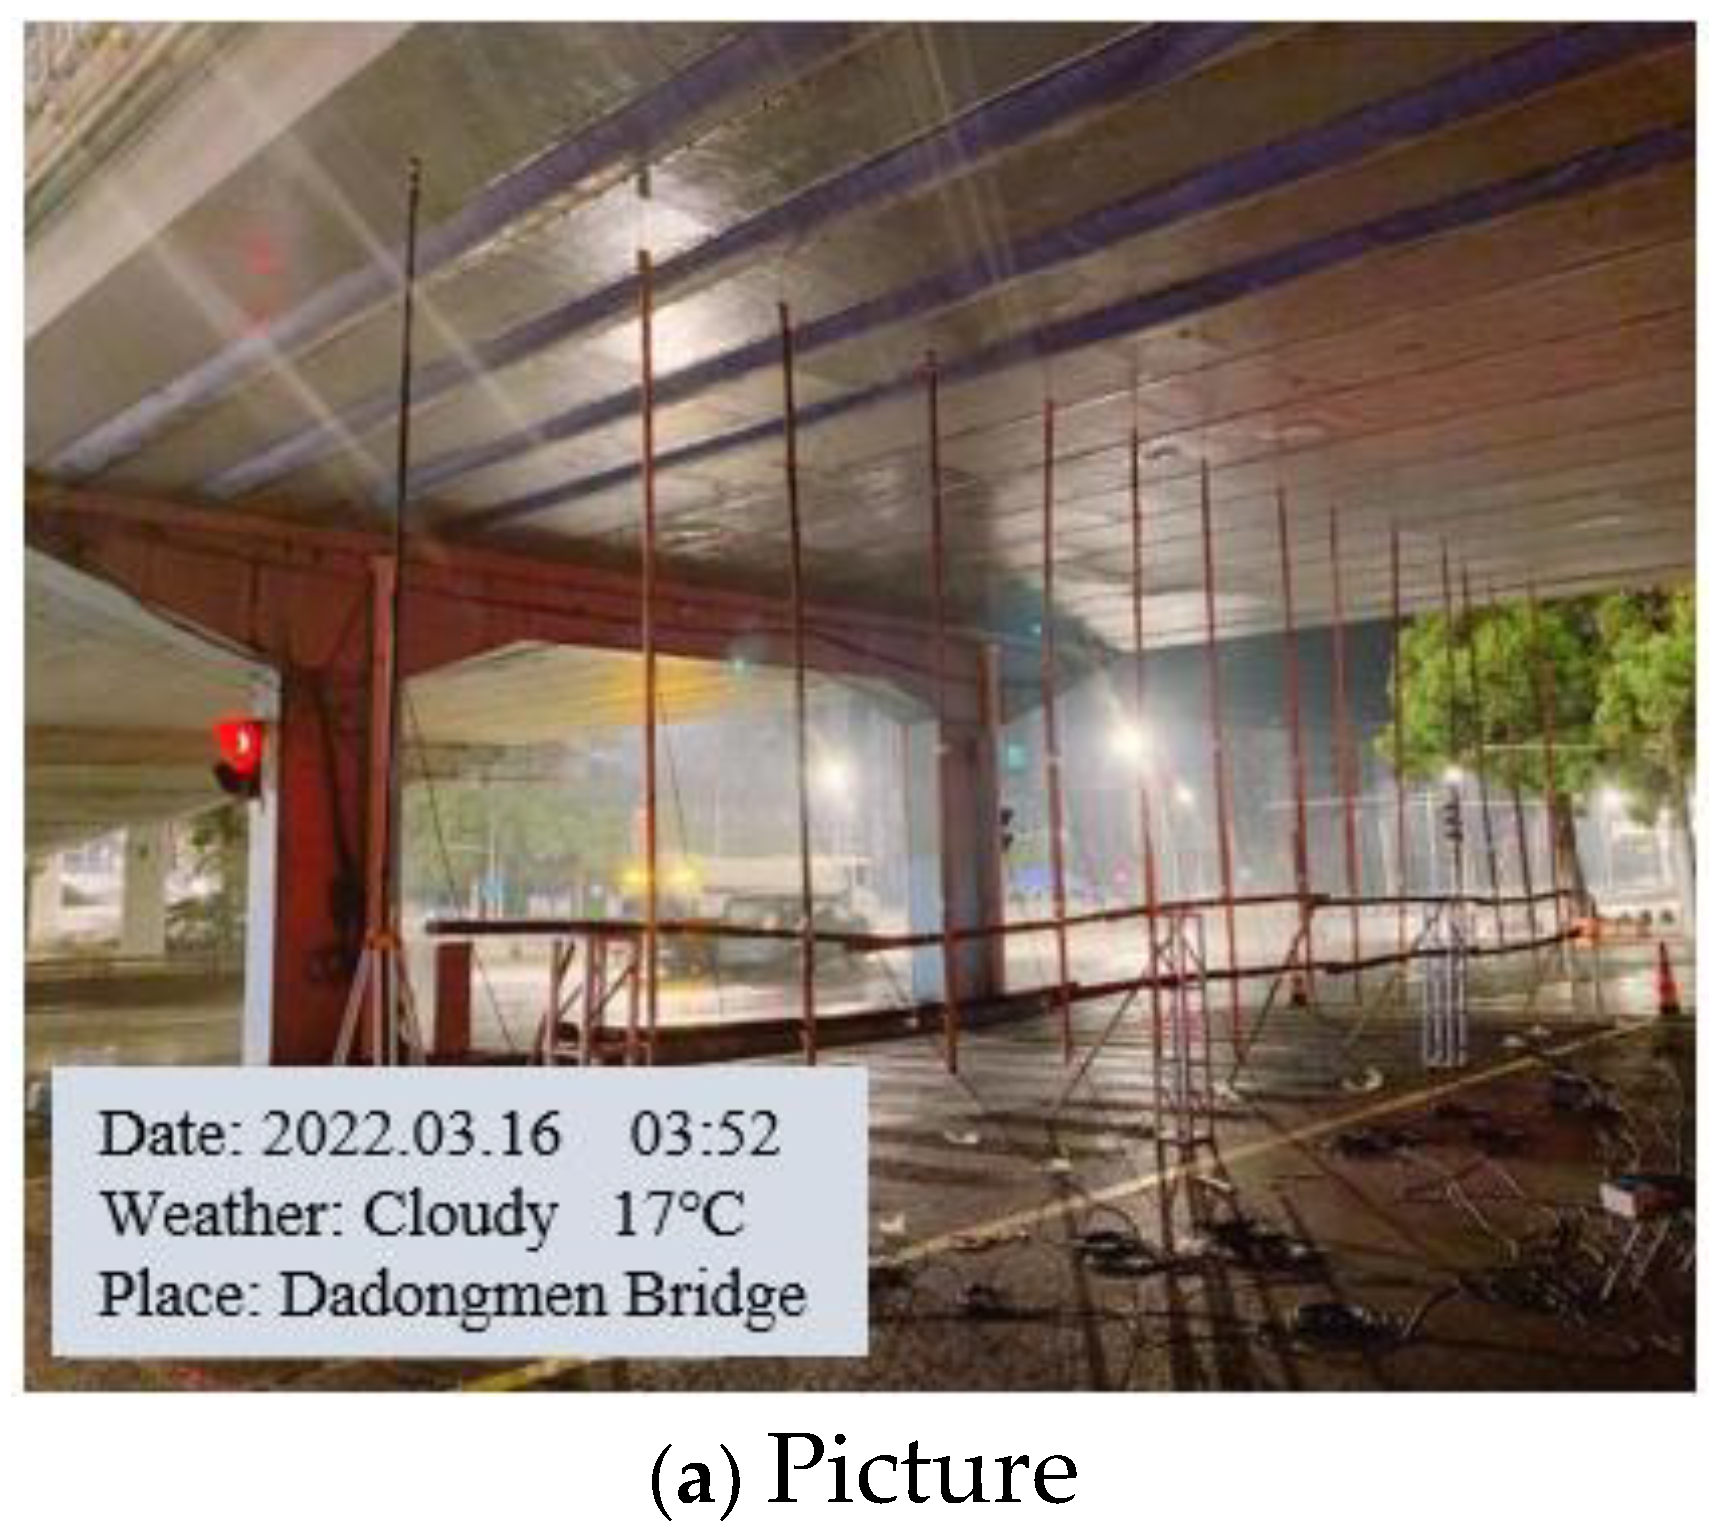
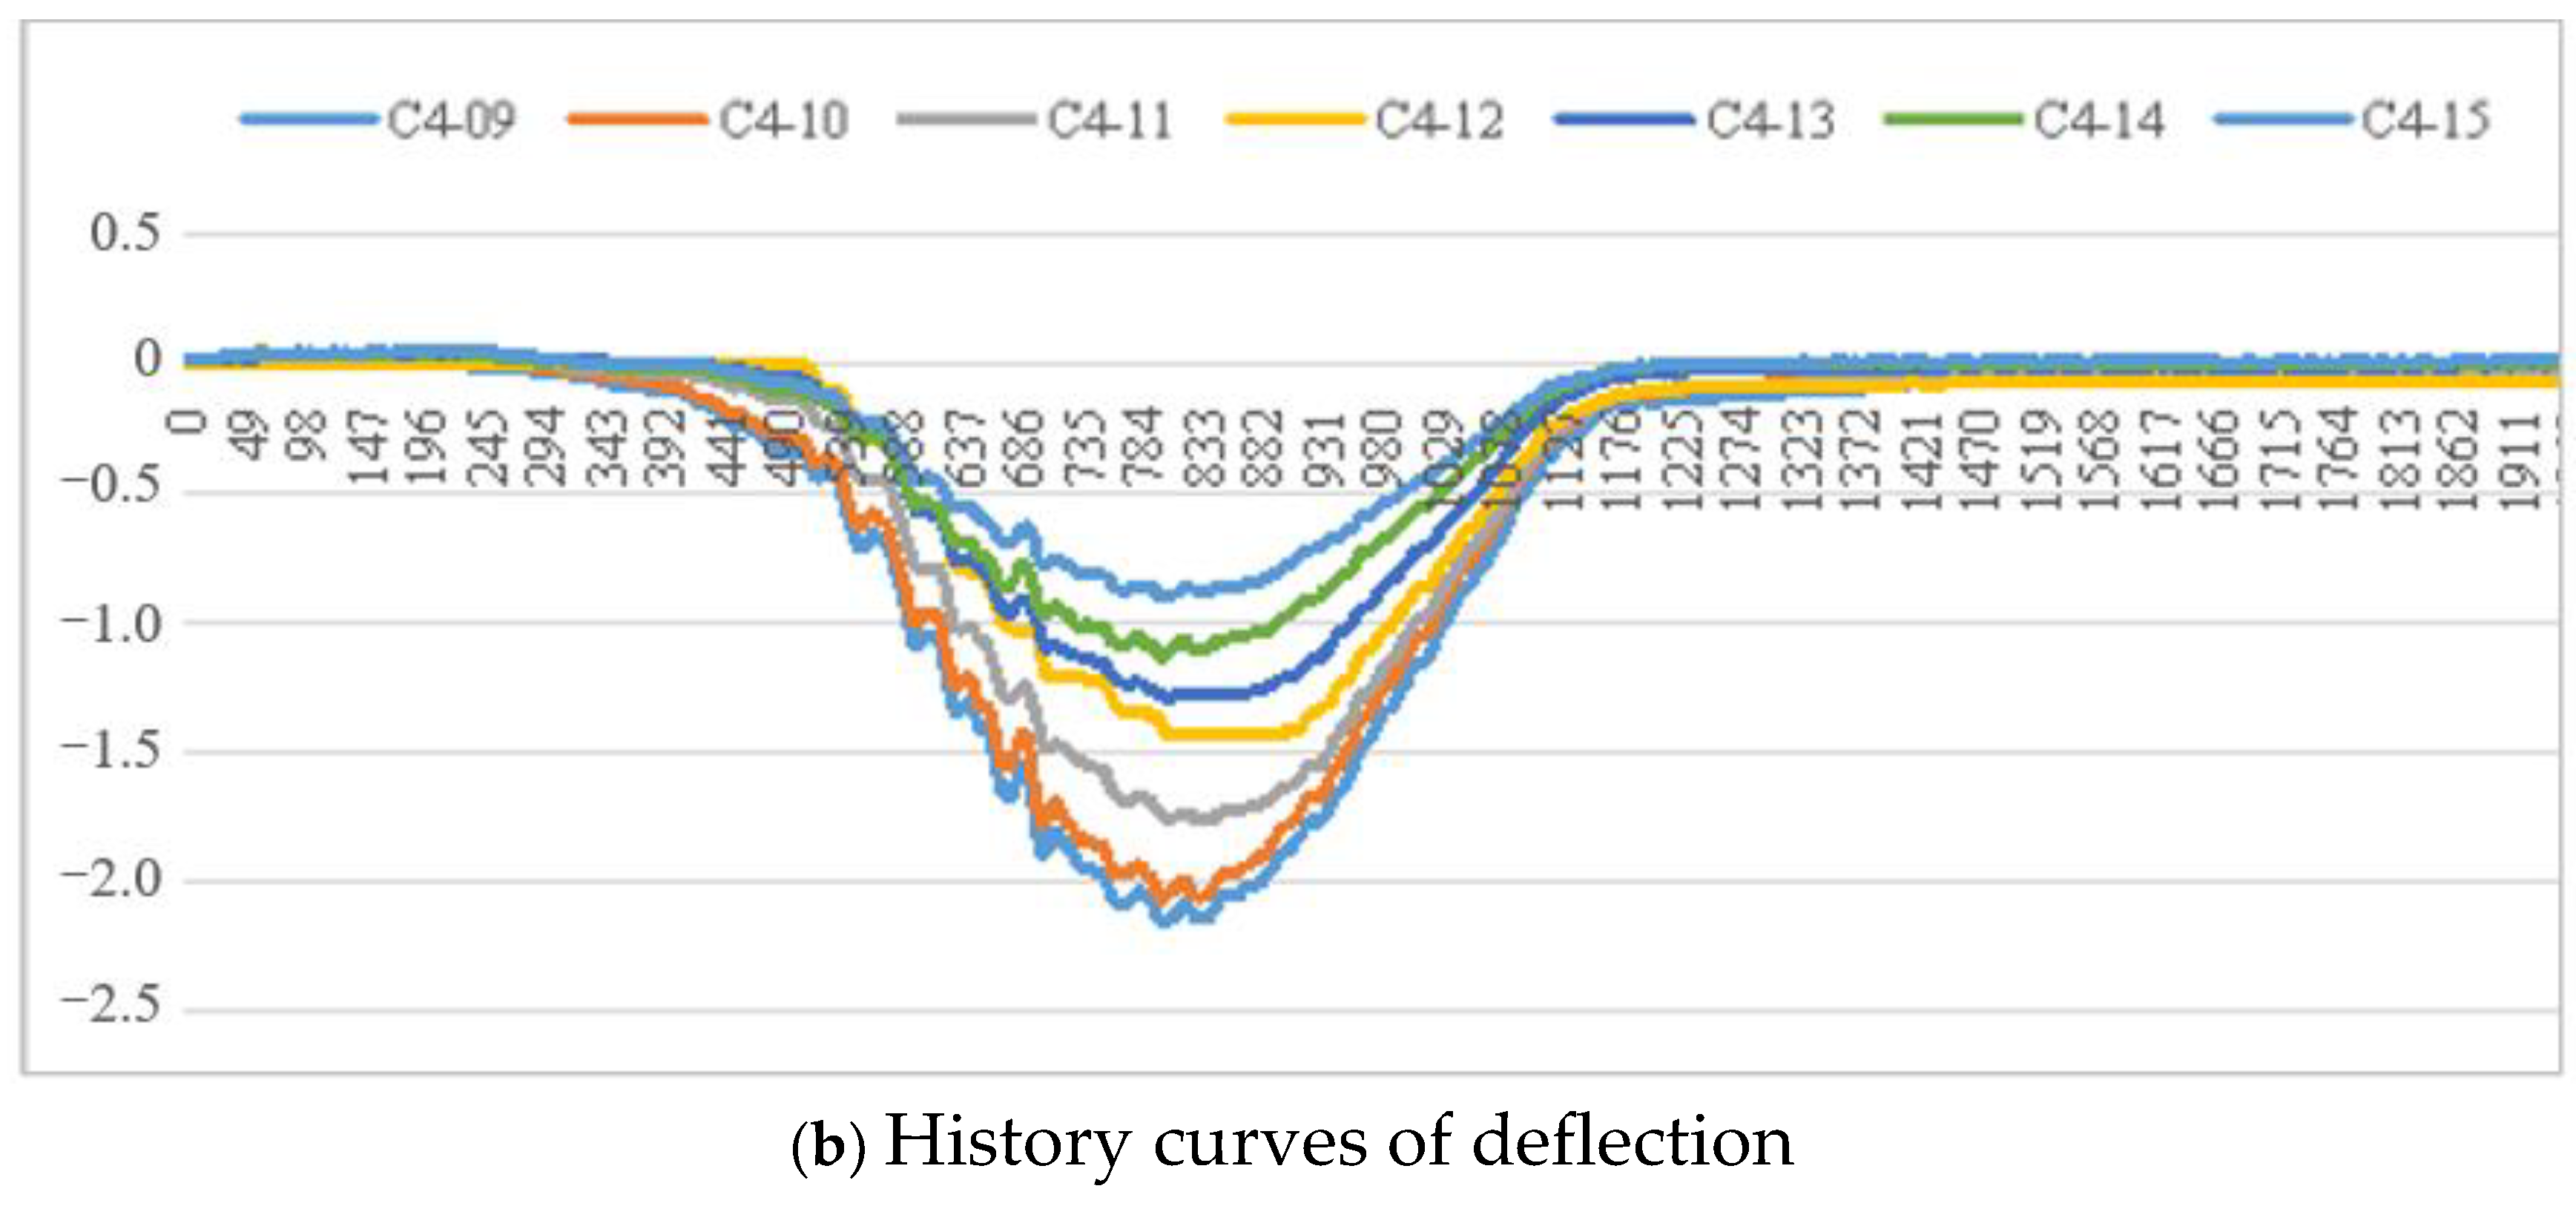
One of the most noteworthy advantages of the light-load field test is that the test will be implemented without interrupting traffic. Hence, the dynamic deflection of the slab needs to be recorded. In the latest detection, a system for recording and reading dynamic deflection gauges was used to measure the deflection, as shown in Figure 6. A deflection sensor (called a dial indicator) was installed at each testing point, as shown in Figure 6a. The deflection history of each slab was recorded and is shown in Figure 6b. The horizontal axis represents the time intervals, the record frequency is 50 Hz, and the vertical axis represents the deflection, the unit is millimeter. The peak value of the curve is the need data, which is treated as the deflection obtained from the static load test.
According to the measured deflections from the 287 slabs, the maximum value of dynamic deflection was 2.96 mm, and most values ranged from 1.00 mm to 2.00 mm. As an example, the measured deflections of the Qingling #5 Bridge are listed in Table 2. Qingling #5 Bridge opened to traffic in 2006, and no obvious visible damage to structural members was found. The theoretical deflections were calculated using the data processing software, and the measured deflections came from the peak values of the dynamic deflection curve.
In general, the measured deflections were slightly smaller than the theoretical deflections. This is mainly because the hinge joint was supposed to only transfer forces in the hinge joint plate theory, but the hinge joint could transfer forces and moments in the practical bridge. Furthermore, based on the analysis of all of these deflections, the better the performance in the appearance inspection, the better the agreement in the lateral load distribution ratio. Hence, a method for damage evaluation of the hinge joints has been proposed based on the lateral distribution ratio and will be clarified in the next section.

3. Damage Evaluation of Hinge Joints

3.1. Lateral Load Distribution Ratio

Based on a reference review [28,29,30,31], hinge joint plate theory is one of the most commonly used theories for the deflection analysis of assembled hollow slab bridges. It is supposed that the hinge joint between two adjacent slabs can only transfer shear force, which is perpendicular to the deck plane. The external vertical loads, which are perpendicular to the deck plane, can be distributed to each slab under the lateral distribution ratio. For a straight slab with an equal section, the deflection of the slab is directly proportional to the load carried in the elastic stage. Hence, the deflection of each slab can be calculated. In this paper, the lateral load distribution ratio can be calculated by M i / M i and T i / T i .
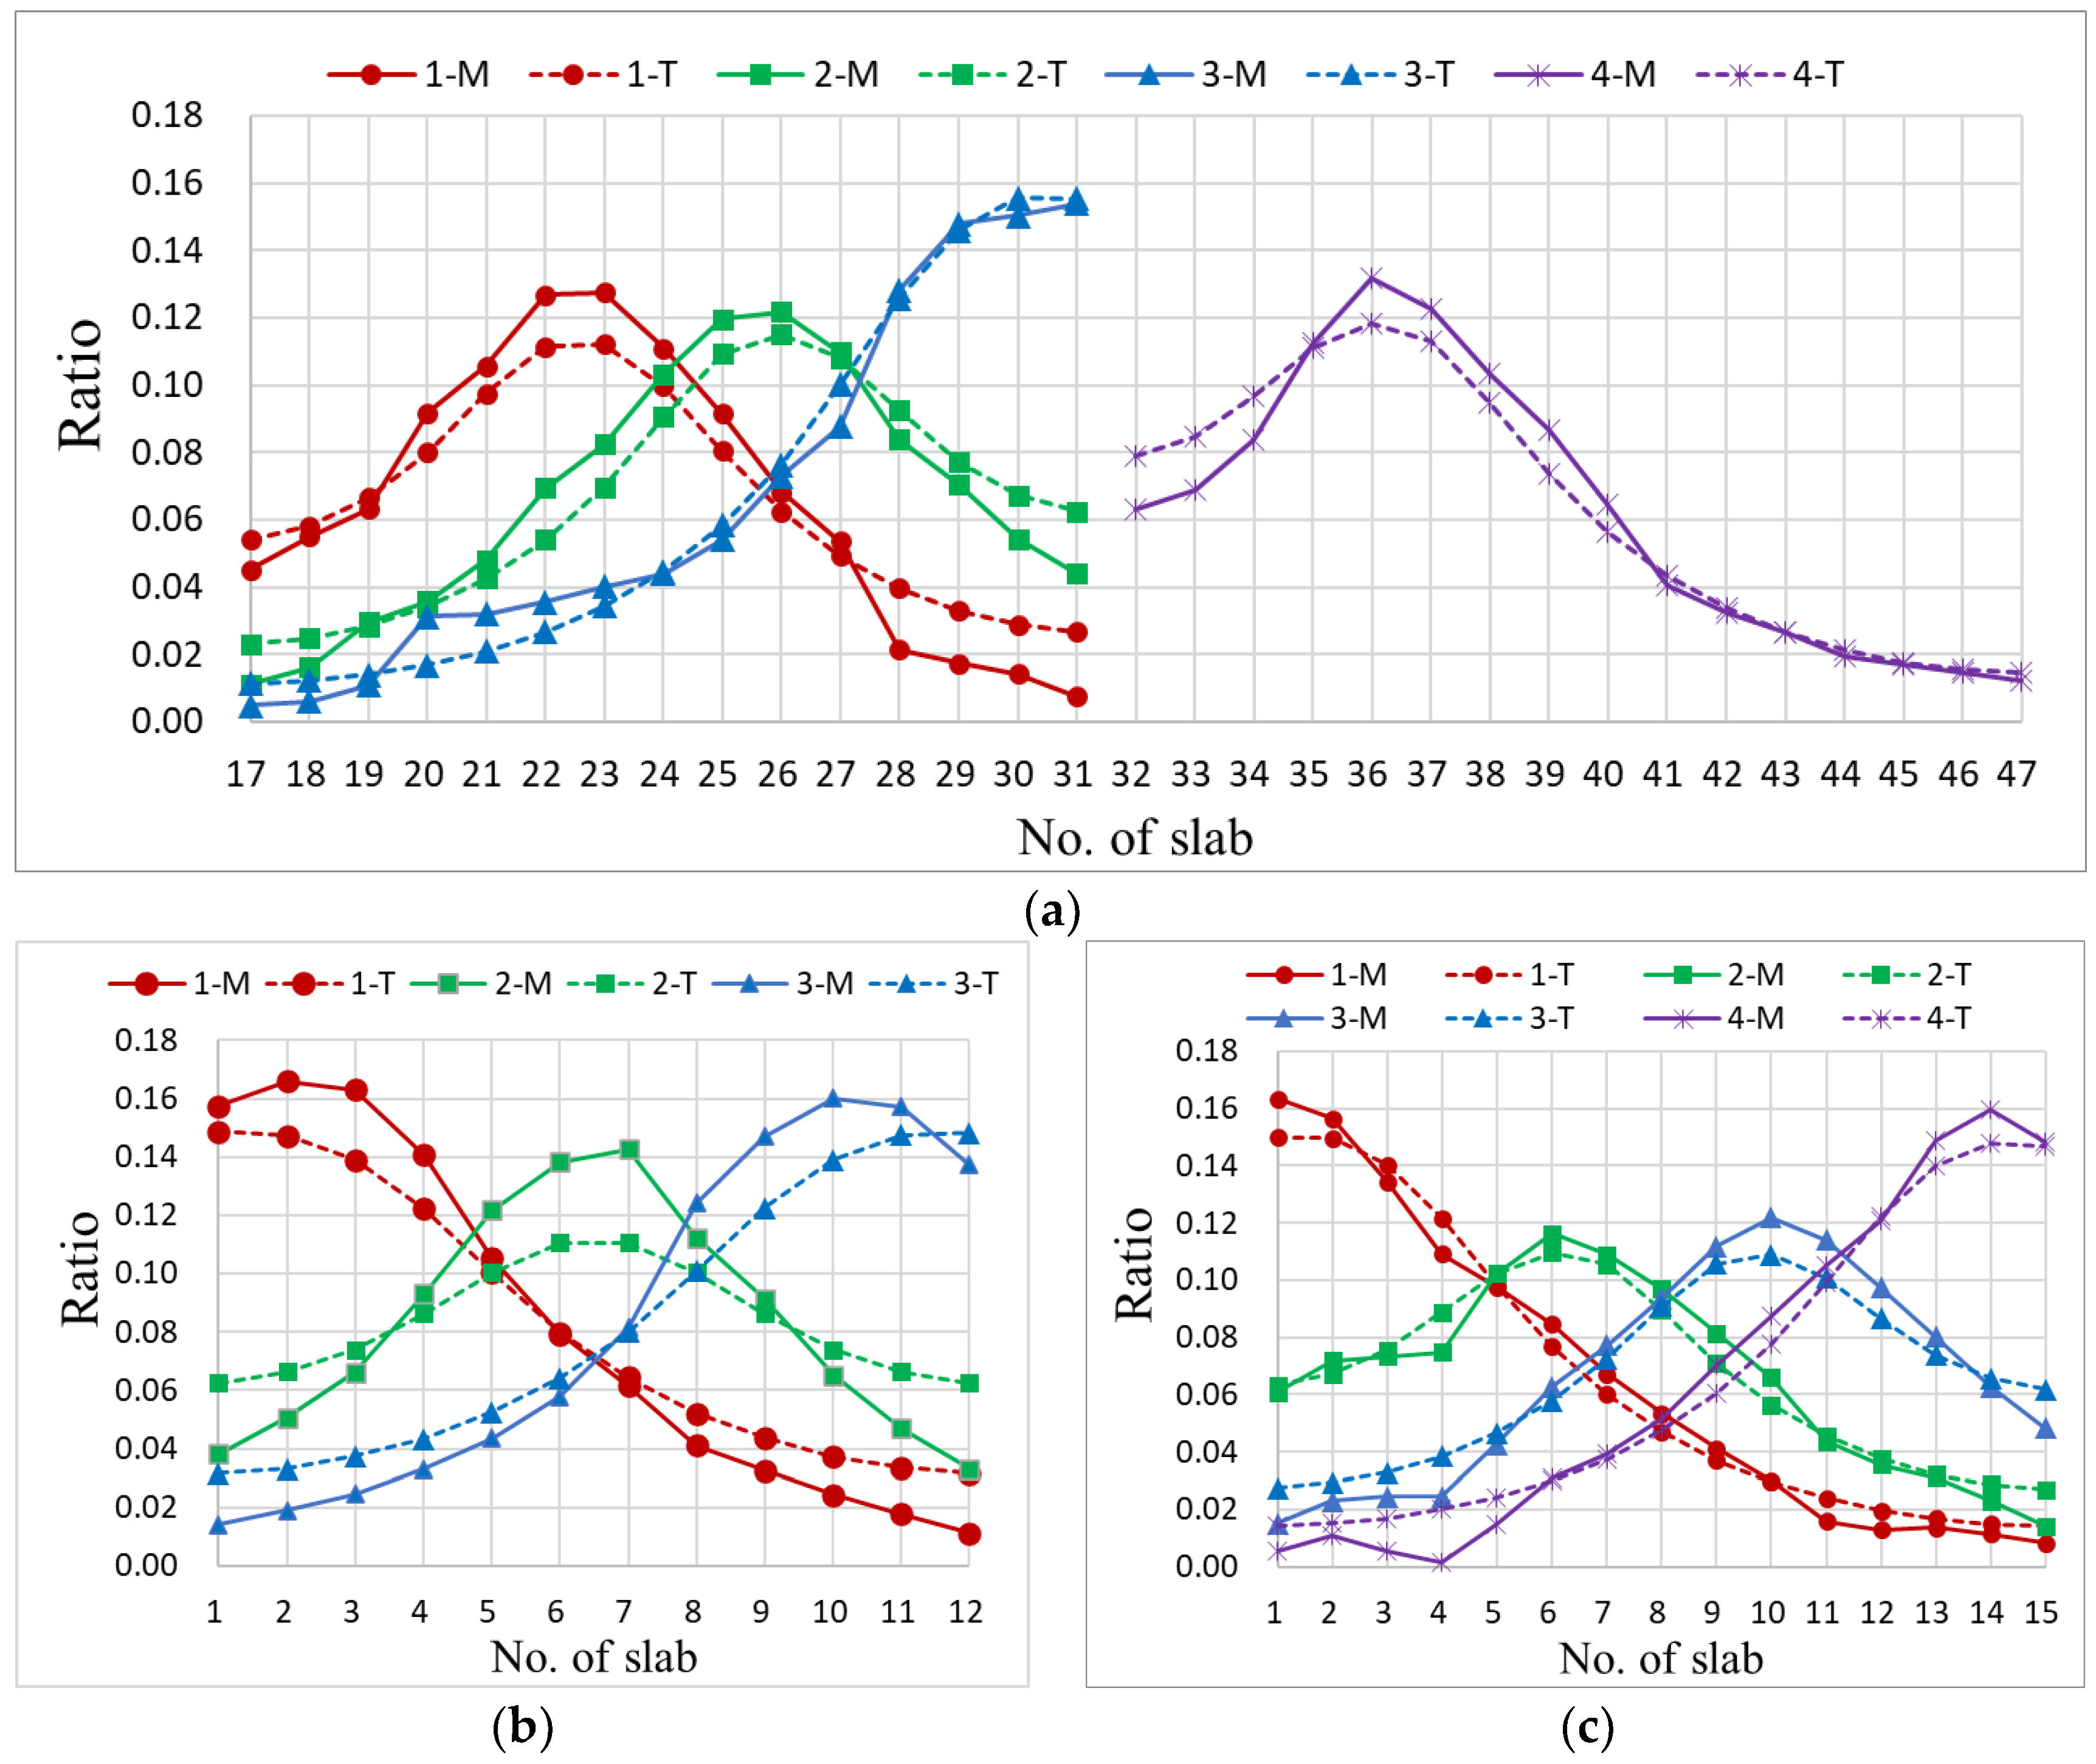
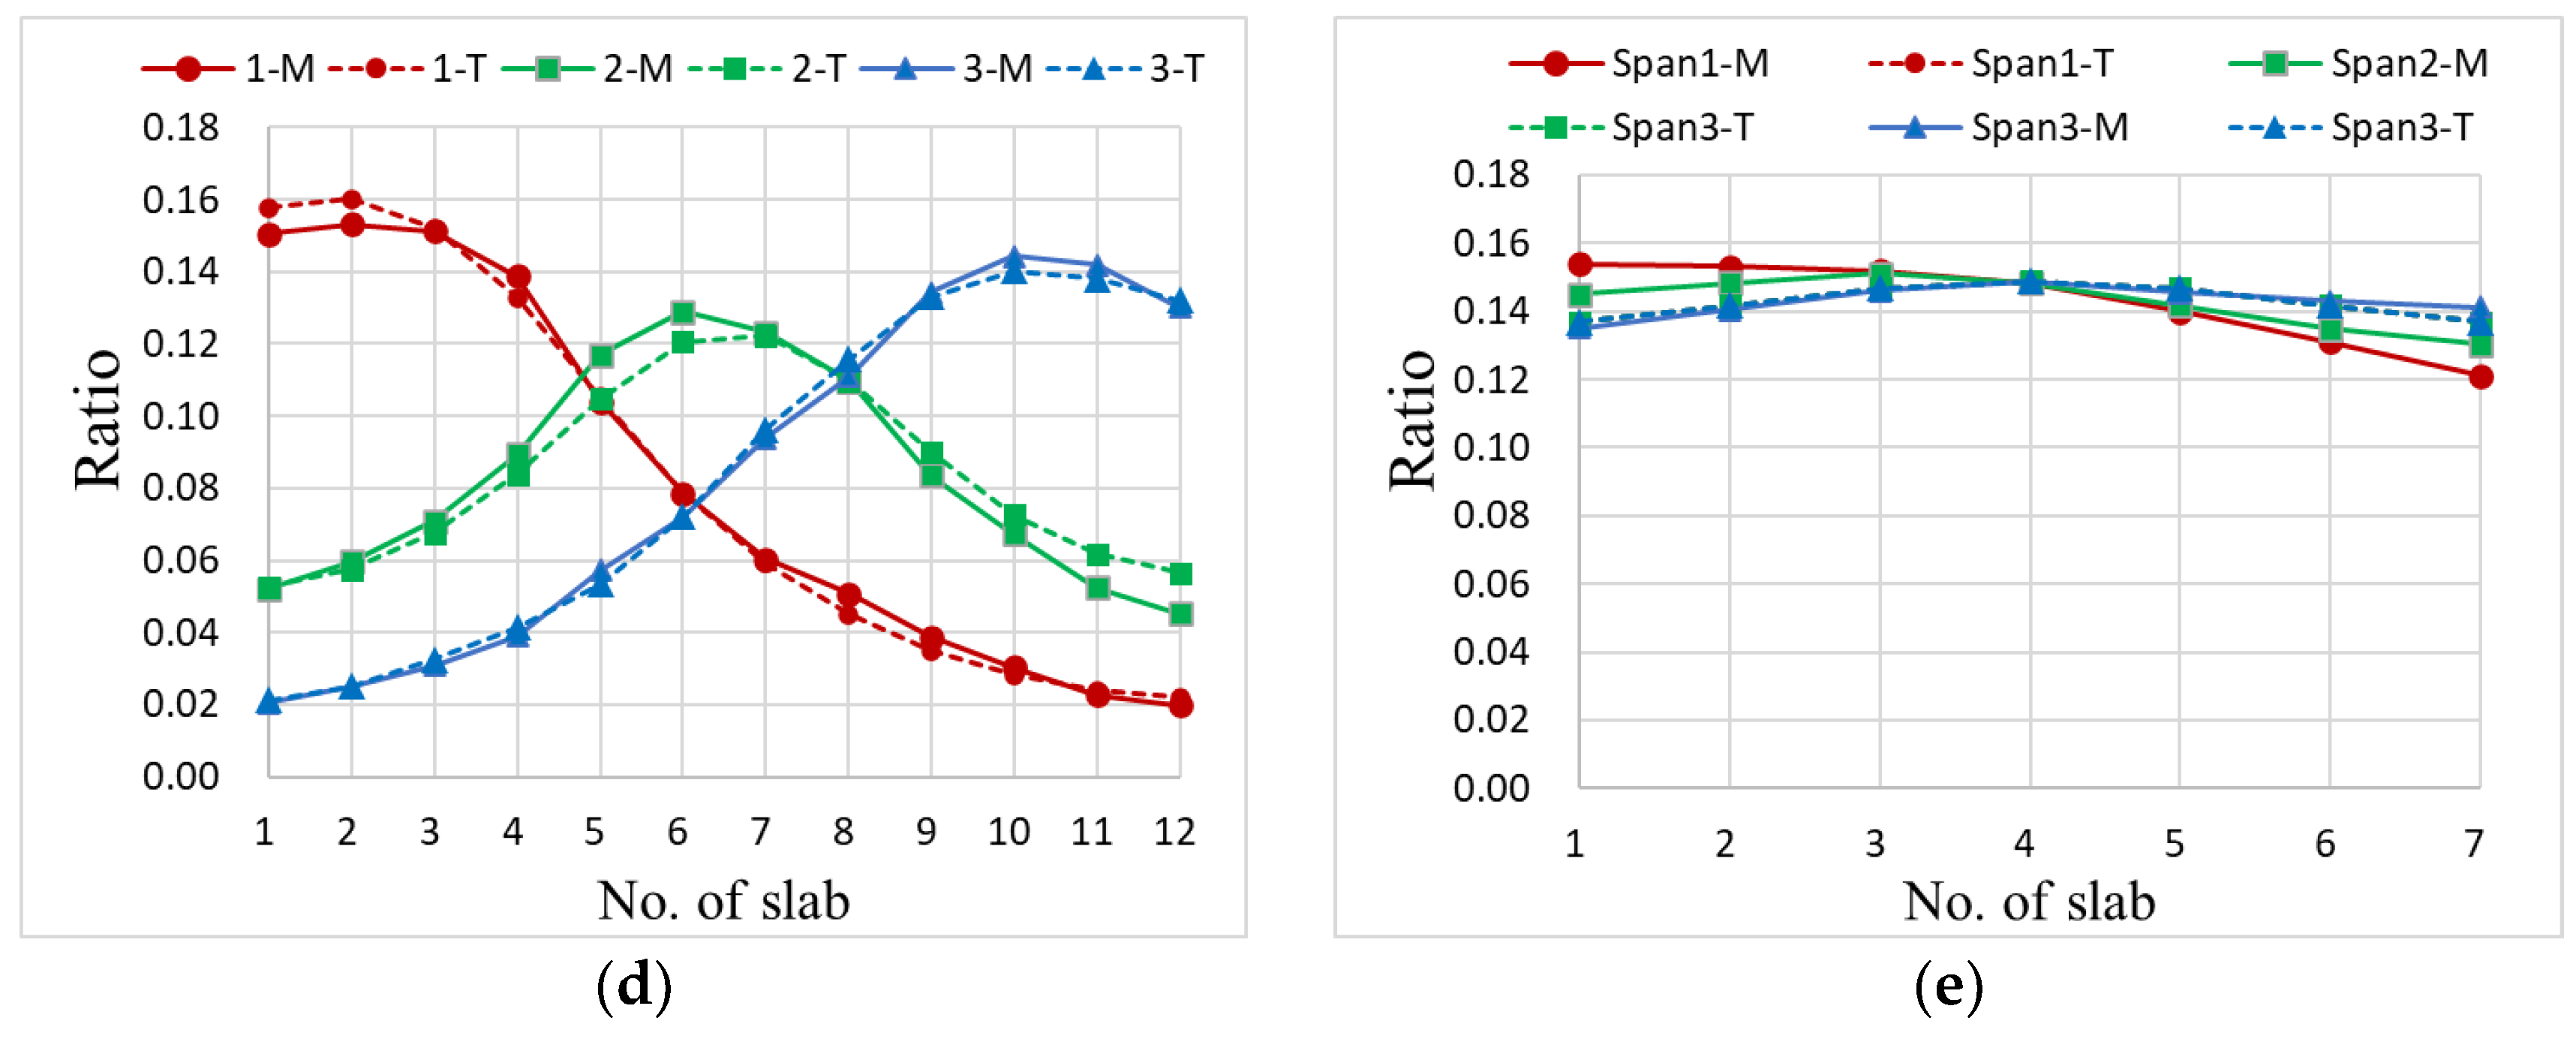
The values of the lateral load distribution ratio were calculated and are presented in Figure 7. In the legend, the number means the test condition; the solid line means the measured value and the dashed line means the theoretical value. In general, the bulge of the curve reflects the position of the lane that is ground by the loading truck. If the solid line is in accordance with the dashed line, it indicates that the tested slabs work cooperatively, as shown in Figure 7d,e. Otherwise, if some mutational slopes between two points occur to the solid line, this indicates that the slab near the mutational slope may bear more load than it was designed to, shown as segment 19#–20# in Figure 7a, segment 3#–4# and segment 7#–8# in Figure 7b, as well as segment 4#–5# in Figure 7c.

3.2. Damage Evaluation Method

The hinge joint between two slabs plays the role of a force delivery device. Taking Figure 7a as an example, in test Condition 1, the central line of the lane was above the 23rd slab, and the truck’s weight was first loaded to the 23rd slab, second delivered to the 22nd slab and 24th slab simultaneously, and then delivered to the 21st slab and 25th slab, respectively. In each step, the hinge joint did not deliver 100% of the load it obtained, and the delivery efficiency obeyed the lateral load distribution ratio. Hence, the attenuation factor of the hinge joint can be calculated by Equations (1)–(3).
β T = T i T j T i × 100 %
where β T is the attenuation factor of the hinge joint for the theoretical value, T i is the theoretical deflection of the ith slab, and T j is the theoretical deflection of the jth slab.
β M = M i M j M i × 100 %
where β M is the attenuation factor of the hinge joint for the measured value, M i is the measured deflection of the ith slab, and M j is the measured deflection of the jth slab.
β = β M β T
where β is the damage factor of the hinge joint.

3.3. Damage Classification

The damage factor of each hinge joint was calculated, and then all the damage factors were summarized. Among the 1100 hinge joints, 25 hinge joints were damaged by 10~15%, 7 hinge joints were damaged by 15~20%, 5 hinge joints were damaged by 20~25%, 2 hinge joints were damaged by 25~30%, and 4 hinge joints were damaged by more than 30%. All of the remaining hinge joints, accounting for 96.09% of the total hinge joints, were damaged by less than 10%. Actually, comparing the light-load field test results and the appearance inspection results, every time the damage factor exceeded 10%, either some damage was found in that hinge joint or that the hinge joint could not be observed visually.
Therefore, the critical value of the damage factor was defined as 10%. This suggests that conventional maintenance was needed for the hinge joint when β 10 % , repairing measurements were needed for the hinge joint when 10 % < β 30 % , and replacement and rebuilding may be needed for the hinge joint when β > 30 % .

4. Verification of Proposed Methods

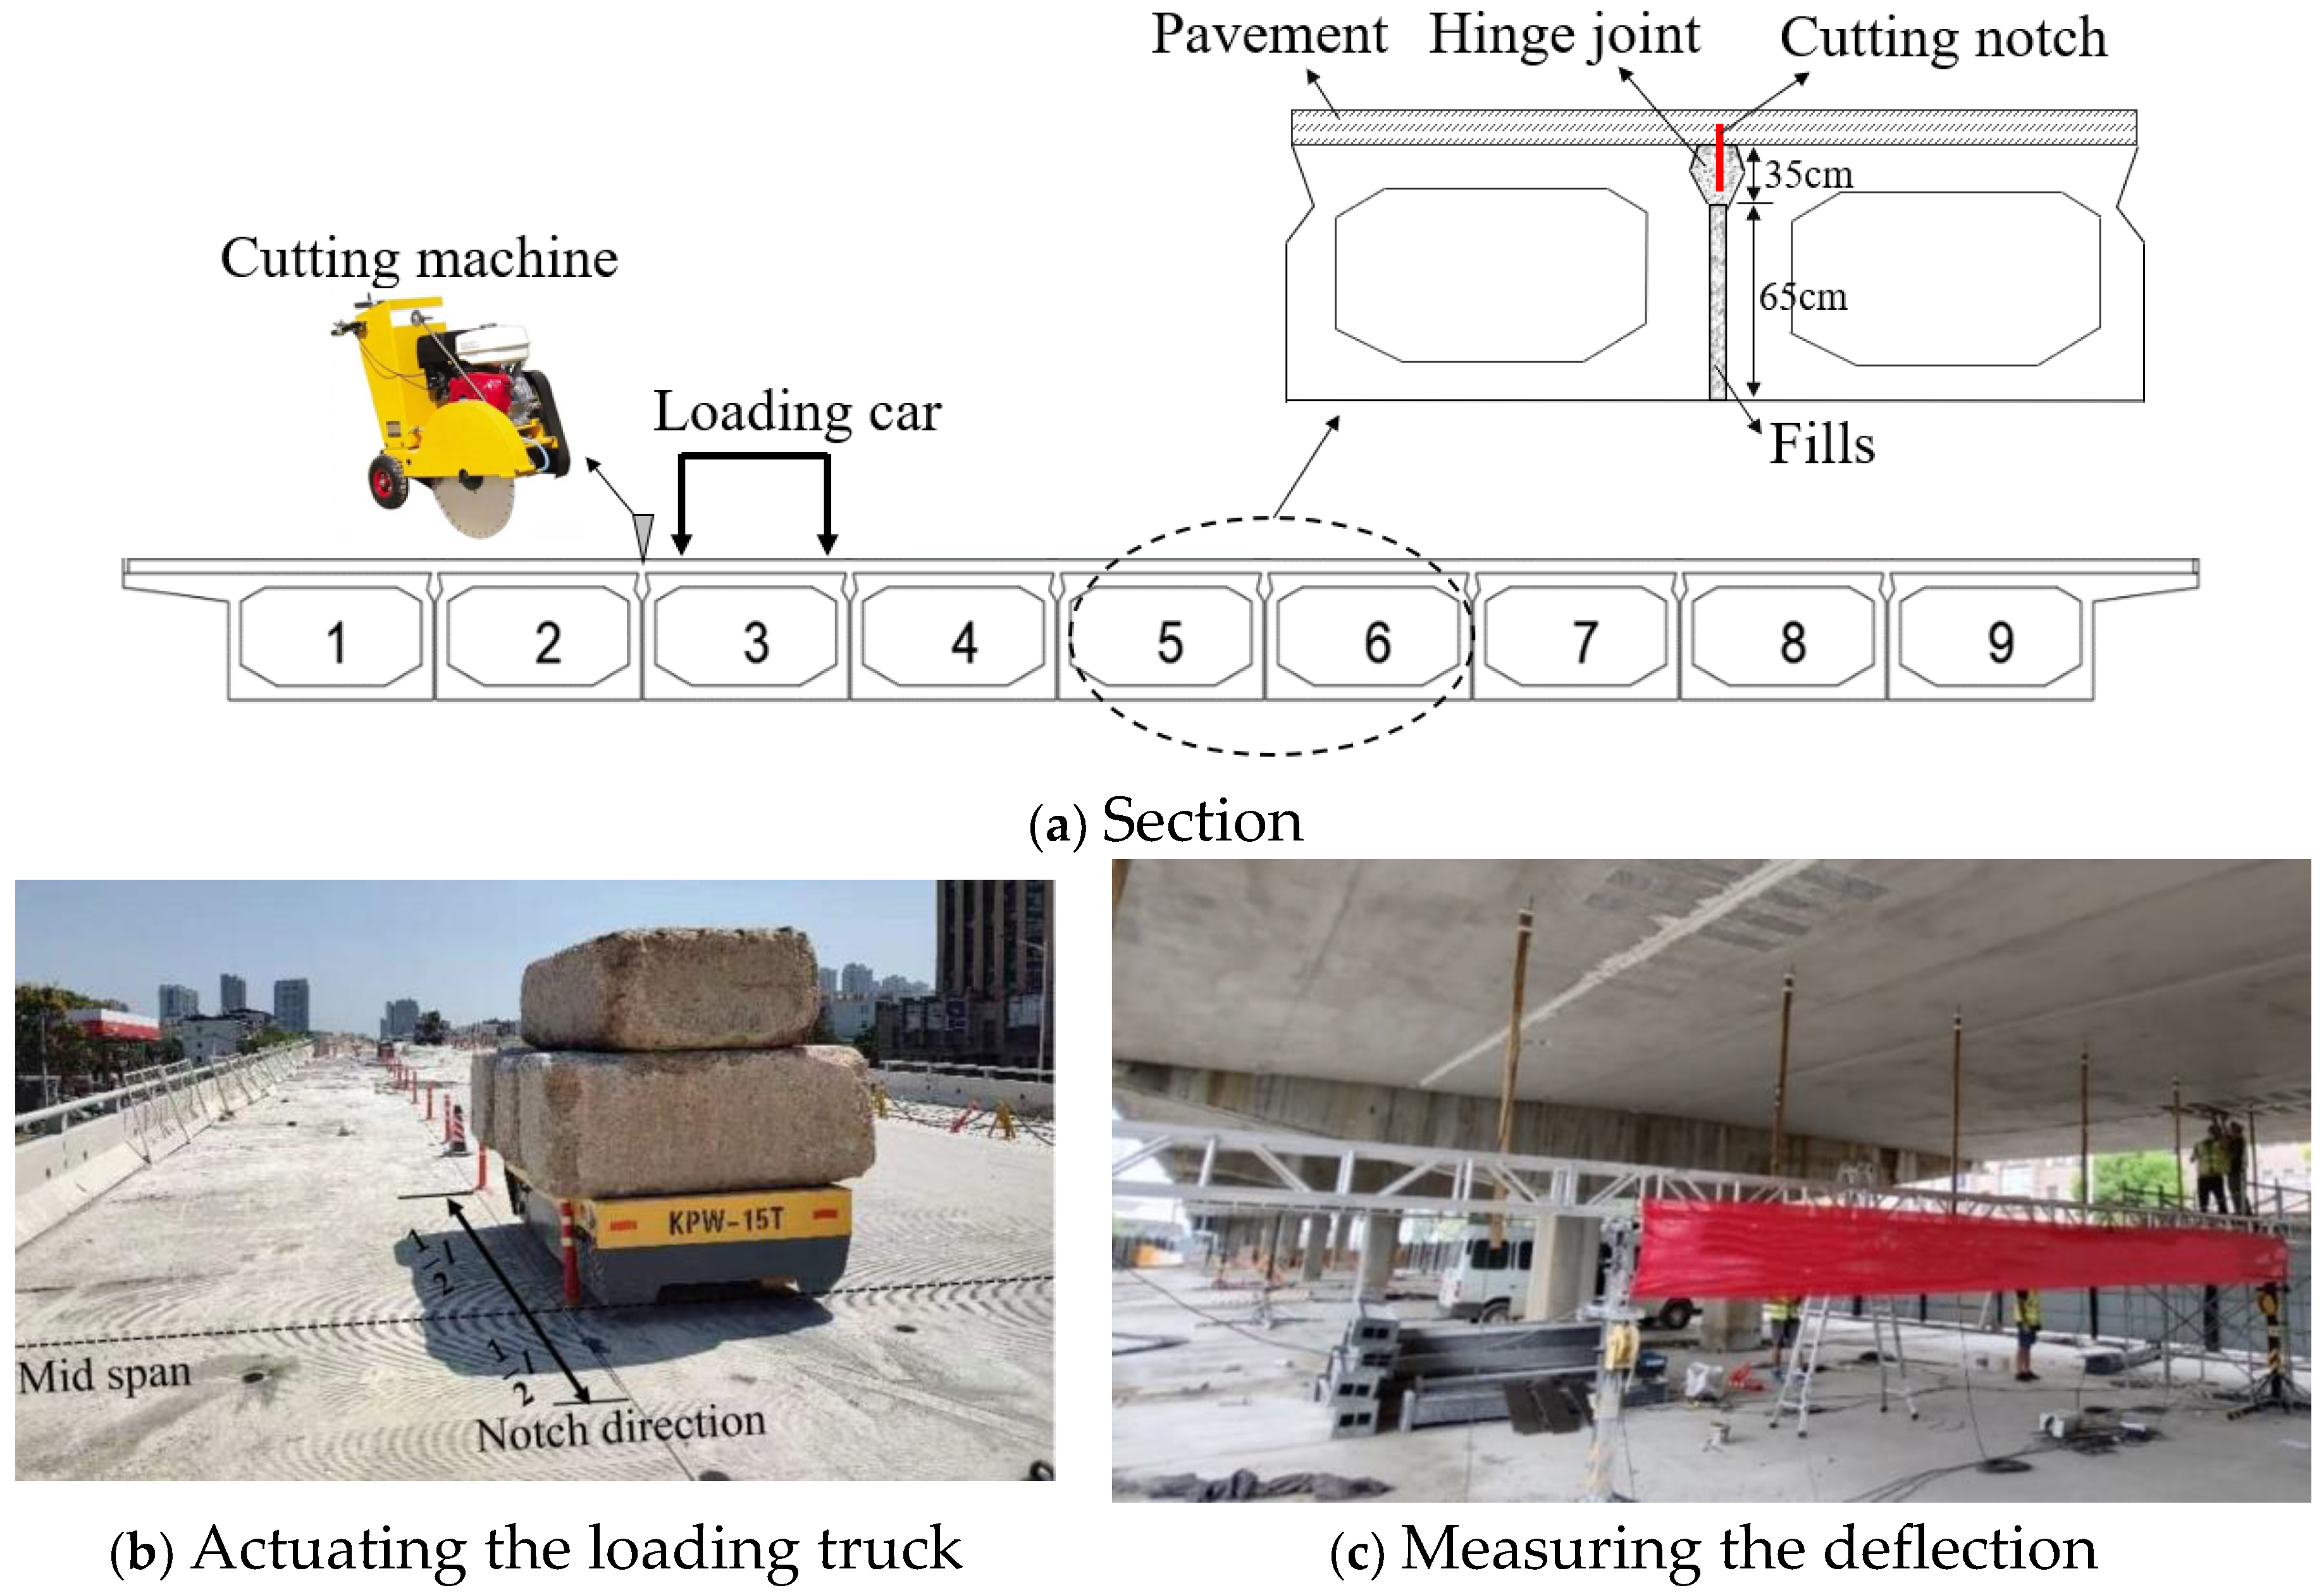
A destructive experiment was implemented on a bridge to verify the accuracy of the proposed method. This hollow slab bridge will be demolished in 2023, which provides us with a chance for this destructive experiment. The length of the span was 20 m, and the width of the span was 10 m. First, the pavement was wiped off. Second, the slabs were unclenched by cutting at the central line of the hinge joints. The second hinge joint was chosen to be destroyed, and its location and a detailed sketch are shown in Figure 8a. Third, the loading car, which weighed 15 tons, was actuated to the third slab, and its back axle was placed on the midspan, as shown in Figure 8b. Then, the deflections were collected, as shown in Figure 8c.
After the cutting machine was used, there was a notch left in the hinge joint, as shown in Figure 8b. The blade of the cutting machine was 0.2 cm; therefore, the thickness of the notch was 0.2 cm. The length of the notch was marked as “l”, and the depth of the notch was marked as “d”. Here, five test conditions were exhibited, and their results are listed in Table 3.
(1)
The original state for the loading car on the 3rd slab;
(2)
Cutting a notch with l = 500 cm and d = 35 cm;
(3)
Cutting a notch with l = 900 cm and d = 35 cm;
(4)
Cutting a notch with l = 1000 cm and d = 100 cm;
(5)
The control test, for the loading car travelling on the seventh slab.
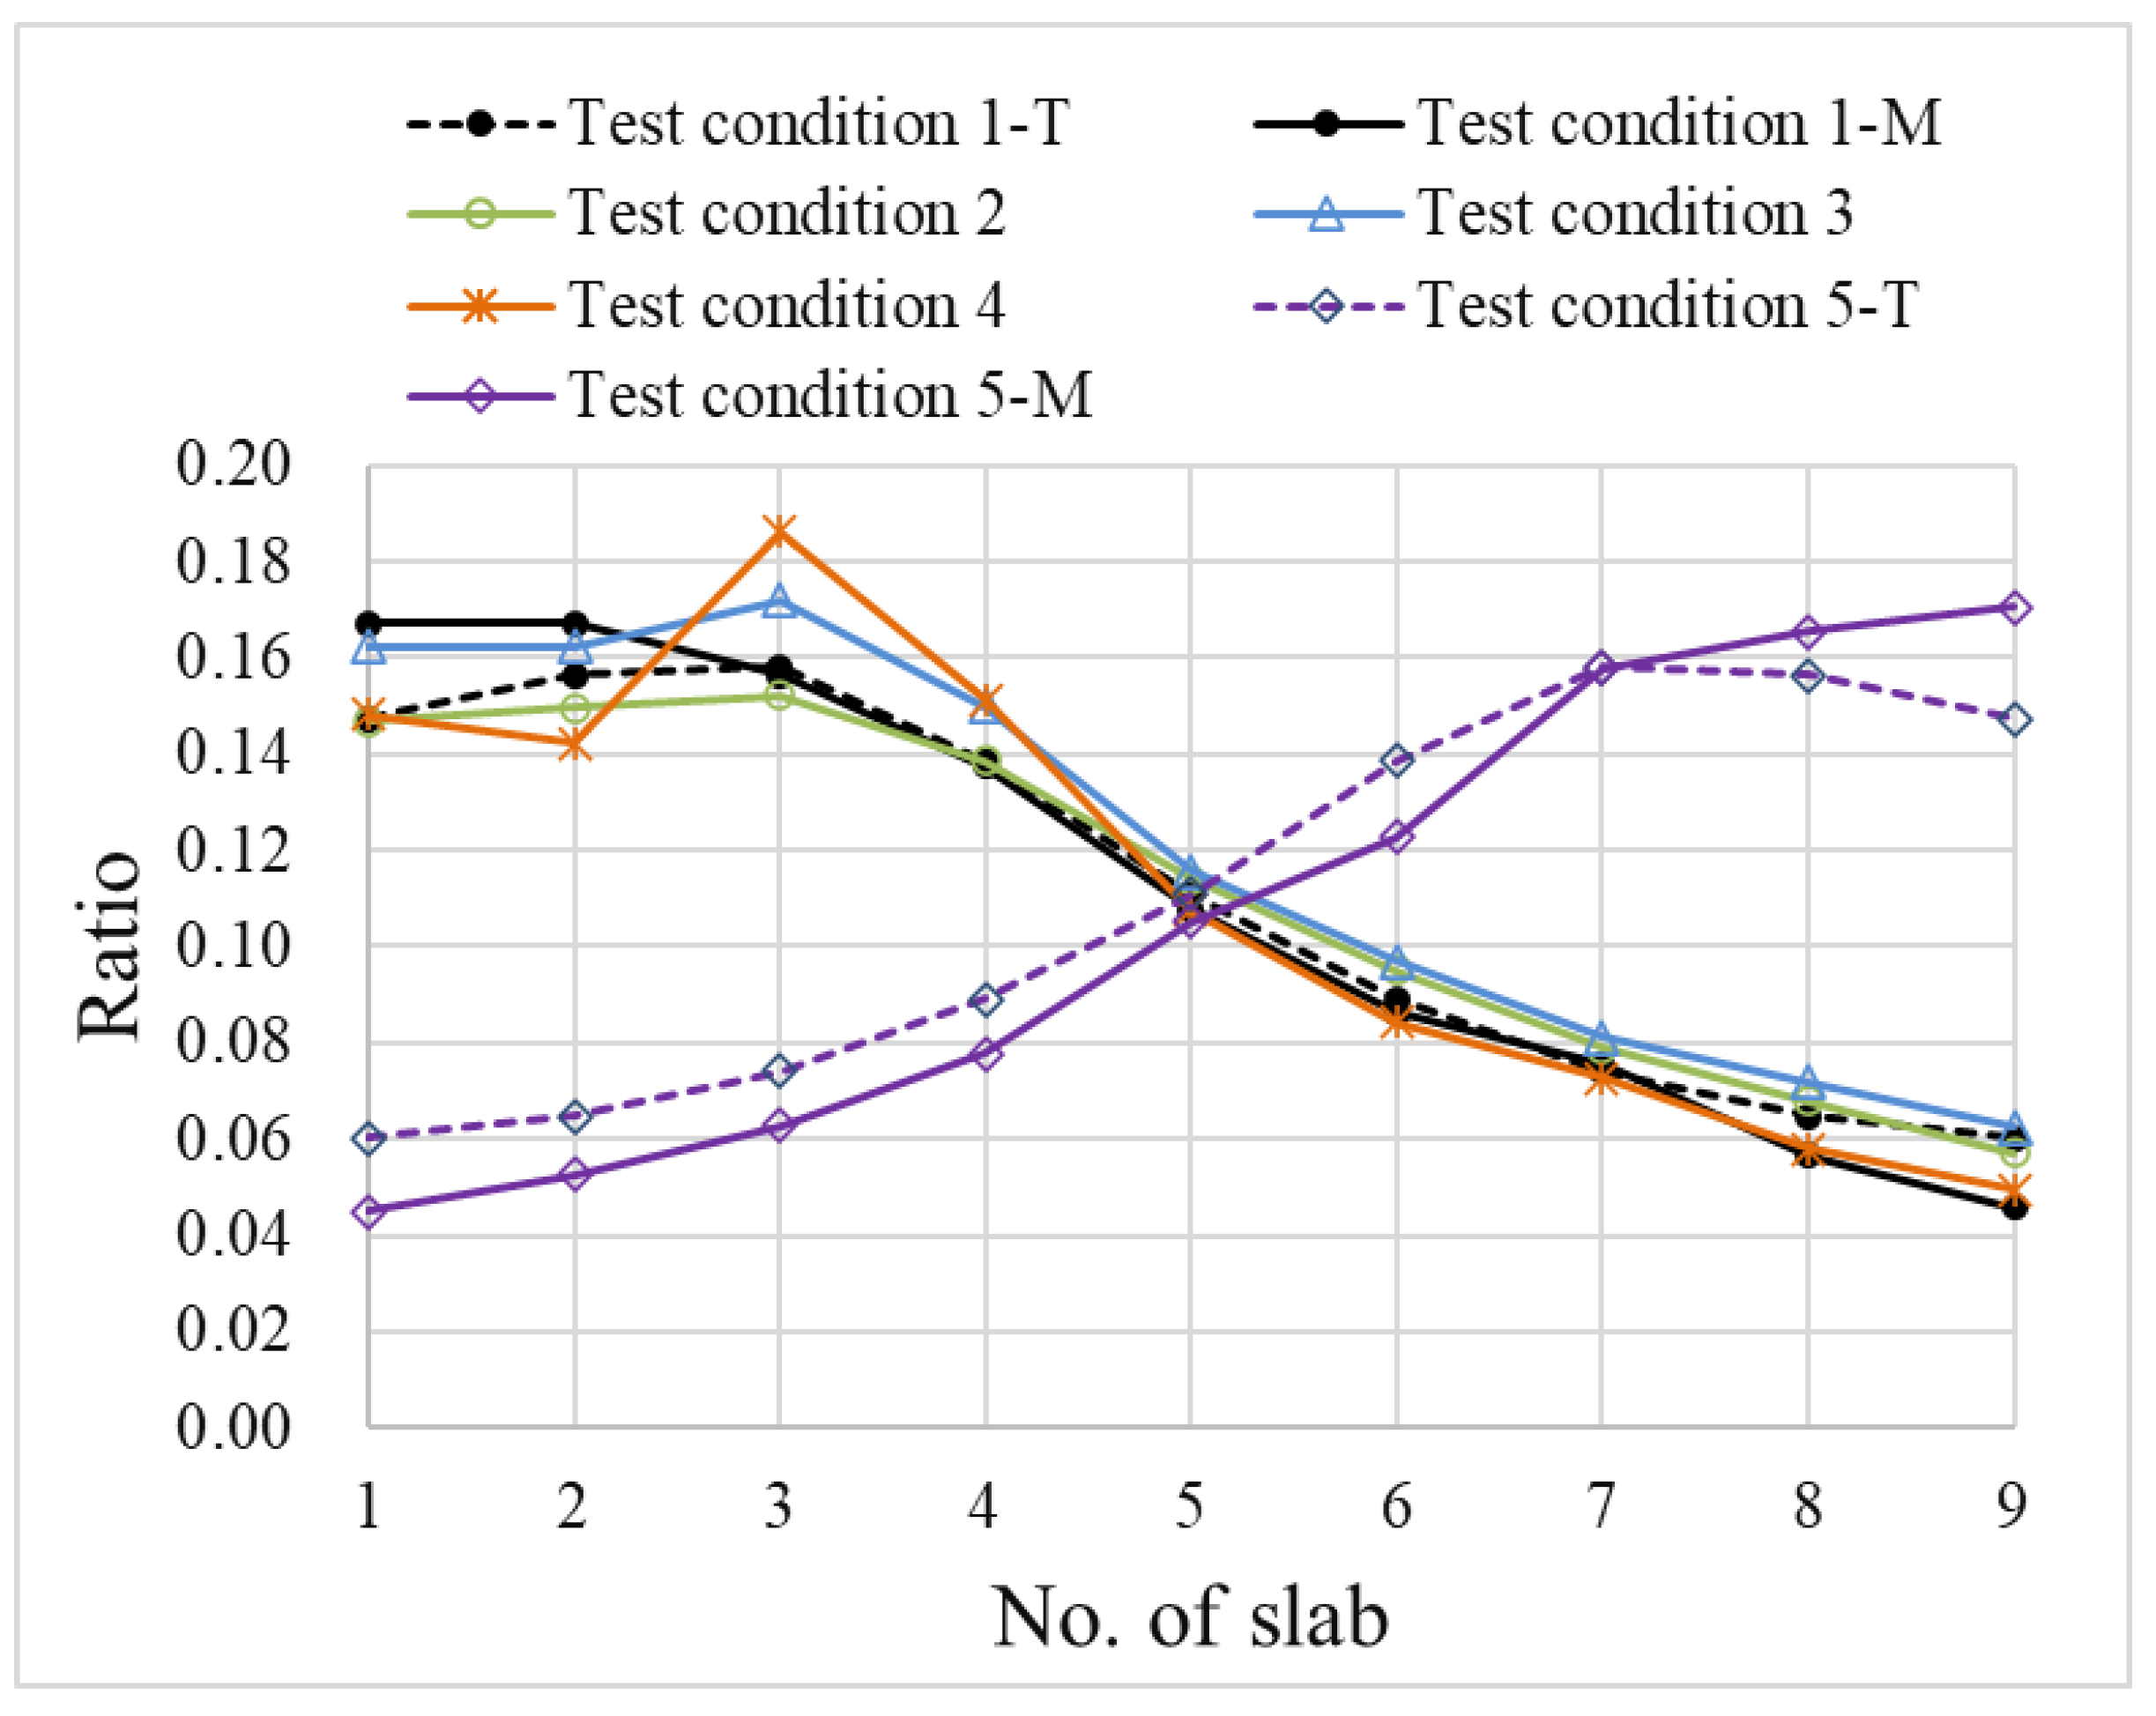
The lateral load distribution ratio of each condition was calculated and is shown in Figure 9. It is clear that the ratio of the third slab had the largest value, which indicates the location of the loading lane. In test Conditions 1 and 5, the test curves of the “no notch” showed good agreement with the theoretical curves. However, cutting a short shallow notch (test Condition 2) may not attenuate the bonding ability of the hinge joint. In test Condition 3, the ratio of the third slab was slightly larger than that in the theoretical curve, which means that cutting a longer notch, with a length that reached almost half of the total span, may have attenuated the bonding ability of the hinge joint by a small extent. In test Condition 4, the ratio of the third slab was obviously larger than that in the theoretical curve, which means that cutting a long deep notch indeed attenuated the bonding ability of the hinge joint.
The data and computing process are shown in Table 3. Theoretically, the loading car travelled on the third slab, the deflection of the third slab was the largest deflection, and the value of T 3 T i was the largest ratio.
In test Condition 1, the attenuation factor β T of the second hinge joint was calculated by 0.1582 0.1564 0.1582 × 100 % = 1.1 % ; the attenuation factor β T of the fourth hinge joint was calculated by 0.1582 0.1385 0.1582 × 100 % = 12.5 % . The attenuation factor β M of the second hinge joint was calculated by 0.1563 0.1671 0.1563 × 100 % = 6.9 % , and the damage factor β of the second hinge joint was calculated by 6.9 % 1.1 % = 8.0 % .
It has been mentioned in the test principles that the deflections of the central seven slabs under the testing lane deserve study. This is mainly because the results far away from the testing lane were easily affected by other vehicles. For example, in test Condition 1, although the values of the seventh and eighth hinge joints have been given, their damage factors were larger than 10%. However, in test Condition 5, the loading car grinded on the seventh slab, and the damage factors of the seventh and eighth hinge joints were smaller than 10%.
In test Conditions 2 and 3, the damage factors were smaller than 10%. This indicates that light damage in the hinge joint attenuated the bonding ability to a small extent. This was a result of the fills cementing the adjacent slabs, providing some bonding effect to the slabs. In particular, in some hollow slab bridges, staggered reinforcements have been used to enhance the bonding strength between the hinge joint and the slab. In that case, even some defects, such as fills falling off, water seepage, or cracking, were found at the appearance inspection, and no obvious difference in deflections was found in the load test.
In test Condition 4, the second hinge joint was deeply cut, and it was cut through the top to the bottom. The calculated damage factor of the second hinge joint was 22.28%, which was significantly larger than that of the other slabs. Furthermore, according to the damage classification, repair measurements were needed to restore the bonding ability of the hinge joint.
Test Condition 5 was a control test of Condition 1. From Figure 9 and Table 3, the theoretical values of the lateral load distribution ratio of test Condition 1 and test Condition 5 were in the mirror phase. For example, the value of T 7 T i was the largest ratio in test Condition 5, and it was equal to the value of T 3 T i in test Condition 1. The results of test Condition 5 also show the good original state of the bridge because the measured curve was in good agreement with the theoretical curve and the damage factors of the hinge joint were smaller than 10%.
In summary, the damage factors of the second hinge joint under the original state, cutting a short shallow notch, cutting a long shallow notch, and cutting a long deep notch were −8.0%, 0.6%, 4.3%, and 22.3%, respectively. This result indicates that cutting a perforating notch in the hinge joint brought more attenuation to the bonding ability.
Table 3. Test conditions and results.
Size
of Notch
No.
of Slab
T i T i M i M i β T β M β
Test 1:
No notch (Original
State)
10.14750.16715.7%0.0%−5.7%
20.15640.16711.2%−6.9%−8.0%
30.15820.1563---
40.13850.137512.5%12.0%−0.4%
50.11090.107819.9%21.6%1.7%
60.08920.086319.6%19.9%0.4%
70.07420.075516.8%12.5%−4.3%
80.06470.056612.7%25.0%12.3%
90.06020.04587.0%19.1%12.1%
Test 2:
t = 0.2 cm
l = 500 cm
d = 35 cm
10.14750.14675.7%0.3%−5.4%
20.15640.14951.2%1.8%0.6%
30.15820.1522---
40.13850.138612.5%8.9%−3.5%
50.11090.114119.9%17.7%−2.3%
60.08920.095119.6%16.7%−2.9%
70.07420.078816.8%17.1%0.3%
80.06470.067912.7%13.8%1.1%
90.06020.05717.0%15.9%8.9%
Test 3:
t = 0.2 cm
l = 900 cm
d = 35 cm
10.14750.16255.7%0.0%−5.7%
20.15640.16251.2%5.5%4.3%
30.15820.1719---
40.13850.150012.5%12.7%0.3%
50.11090.115619.9%22.9%3.0%
60.08920.096919.6%16.2%−3.4%
70.07420.081316.8%16.1%−0.7%
80.06470.071912.7%11.6%−1.1%
90.06020.06257.0%13.1%6.1%
Test 4:
t = 0.2 cm
l = 1000 cm
d = 100 cm
10.14750.14835.7%−4.1%−9.8%
20.15640.14241.2%23.4%22.3%
30.15820.1860---
40.13850.151212.5%18.7%6.2%
50.11090.107619.9%28.8%8.9%
60.08920.084319.6%21.7%2.1%
70.07420.072716.8%13.8%−3.1%
80.06470.058112.7%20.1%7.4%
90.06020.04947.0%15.0%8.0%
Test 5:
No notch,
Loading on 7th slab
10.06020.04517.0%14.3%7.3%
20.06470.052612.7%16.1%3.4%
30.07420.062716.8%19.3%2.5%
40.08920.077719.6%26.2%6.6%
50.11090.105319.9%14.3%−5.7%
60.13850.122812.5%22.2%9.8%
70.15820.1579---
80.15640.16551.2%−4.8%−6.0%
90.14750.17055.7%−3.0%−8.7%

5. Conclusions

After the light-load test was implemented on 96 spans of the hollow slab bridge, the test results of 1100 hinge joints were analyzed, and a destructive experiment was implemented to verify the accuracy of the proposed method. The following conclusions could be obtained:
(1)
The proposed light-load field test method belongs to the traditional load test method. It needs to follow the requirements of related standards. To implement the test without interrupting the traffic, the following principles must be followed: the weight of the truck should be approximately 40 tons, the speed of the truck should be smaller than 30 km/h, and the deflection precision should be 0.01 mm.
(2)
According to the measured deflections from the 287 slabs, in each test condition, the central seven slabs (or central 6 hinge joints) below the testing lane deserve to be analyzed. The maximum value of deflection was 2.96 mm, and most values ranged from 1.00 mm to 2.00 mm.
(3)
Among the 1100 hinge joints, 25 hinge joints were damaged by 10~15%, 7 hinge joints were damaged by 15~20%, 5 hinge joints were damaged by 20~25%, 2 hinge joints were damaged by 25~30%, and 4 hinge joints were damaged by more than 30%. All of the remaining hinge joints, accounting for 96.09% of the total hinge joints, were damaged by less than 10%.
(4)
In the destructive experiment, the second hinge joint was damaged in four different levels, the damage factor increased with the increase in the damage level. The hinge joint with a long perforating notch, which means it had been damaged seriously, was identified, and its damage factor was 22.3% and it was bigger than the critical value (10%). The results indicated that the damage status of the hinge joint could be detected by the proposed method.
(5)
Some of the research results have been adopted by a local standard called Standards for rapid detection and evaluation of hinge joints in hollow slab bridges, which will open to the public in the near future. Further research may focus on signal processing of the recorded dynamic deflection, to eliminate the effect from other vehicles. Hence, the testing data of all slabs can be used for analysis.

Author Contributions

Conceptualization, A.G.; methodology, A.G. and H.Z.; software, A.G. and A.J.; validation, H.Z.; formal analysis, H.Z.; investigation, A.J.; resources, A.J.; data curation, A.J.; writing—original draft preparation, H.Z.; writing—review and editing, A.G., H.Z. and A.J.; visualization, H.Z.; supervision, H.Z.; project administration, A.G.; funding acquisition, A.G. All authors have read and agreed to the published version of the manuscript.

Funding

This research was funded by the Scientific and Technological Innovation Projects of Wuhan Municipal Commission of Urban Management and Law Enforcement (grant no. 20211029-12), as well as Scientific and Technological Projects of Department of Housing and Urban-Rural Development of Hubei Province (contract no. 01104325X/2022-33932).

Data Availability Statement

The data used to support the findings of this study are available from the corresponding author upon request.

Conflicts of Interest

The authors declare no conflict of interest.

References

  1. Li, X.; Wu, G.; Popal, M.; Jiang, J. Experimental and numerical study of hollow core slabs strengthened with mounted steel bars and prestressed steel wire ropes. Constr. Build. Mater. 2018, 188, 456–469. [Google Scholar] [CrossRef]
  2. Hallmark, R.; White, H.; Collin, P. Prefabricated bridge construction across Europe and America. Pract. Period. Struct. Des. Constr. 2012, 17, 82–92. [Google Scholar] [CrossRef]
  3. Hu, H.; Wang, J.; Dong, C.; Chen, J.; Wang, T. A hybrid method for damage detection and condition assessment of hinge joints in hollow slab bridges sing physical models and vision-based measurements. Mech. Syst. Signal Process. 2023, 183, 109631. [Google Scholar] [CrossRef]
  4. Hu, Z.; Li, X.; Shah, Y. Simplified Method for Lateral Distribution Factor of the Live Load of Prefabricated Concrete Box-Girder Bridges with Transverse Post-tensioning. KSCE J. Civ. Eng. 2022, 26, 3460–3470. [Google Scholar] [CrossRef]
  5. Guo, K.; Liu, Z.; Bairan, J. Transfer Matrix Method for Calculating the Transverse Load Distribution of Articulated Slab Bridges. Buildings 2022, 12, 1610. [Google Scholar] [CrossRef]
  6. Terzioglu, T.; Hueste, M.B.D.; Mander, J.B. Live load distribution factors for spread slab beam bridges. J. Bridge Eng. 2017, 22, 04017067. [Google Scholar] [CrossRef]
  7. Barbieri, D.M.; Chen, Y.; Mazzarolo, E.; Briseghella, B.; Tarantino, A.M. Longitudinal Joint Performance of a Concrete Hollow Core Slab Bridge. Transp. Res. Rec. 2018, 2672, 196–206. [Google Scholar] [CrossRef]
  8. Yang, J.; Hou, P.; Pan, Y.; Zhang, H.; Yang, C.; Hong, W.; Li, K. Shear behaviors of hollow slab beam bridges strengthened with high-performance self-consolidating cementitious composites. Eng. Struct. 2021, 242, 112613. [Google Scholar] [CrossRef]
  9. Baran, E. Effects of cast-in-place concrete topping on flexural response of precast concrete hollow-core slabs. Eng. Struct. 2015, 98, 109–117. [Google Scholar] [CrossRef]
  10. Chen, A.; Fang, X.; Pan, Z.; Wang, D.; Pan, Y.; Peng, B. Engineering practices on surface damage inspection and performance evaluation of concrete bridges in China. Struct. Conc. 2022, 23, 16–31. [Google Scholar] [CrossRef]
  11. Di, J.; Sun, Y.; Yu, K.; Liu, L.; Qin, F. Experimental investigation of shear performance of existing PC hollow slab. Eng. Struct. 2020, 211, 110451. [Google Scholar] [CrossRef]
  12. Hu, H.; Dong, C.; Wang, J.; Chen, J. Experimental Study of the Fatigue Performance of the Bonding Surfaces and Load-Bearing Capacity of a Large-Scale Severely Damaged Hollow Slab Strengthened by CFRP. Sustainability 2021, 13, 12179. [Google Scholar] [CrossRef]
  13. Zhu, Z.; Li, Y. Damage modes and residual deflections of multi-beam hollow slab bridge under car explosions. Eng. Fail. Anal. 2022, 141, 106705. [Google Scholar] [CrossRef]
  14. Sajid, S.; Taras, A.; Chouinard, L. Defect detection in concrete plates with impulse-response test and statistical pattern recognition. Mech. Syst. Signal Process. 2021, 161, 107948. [Google Scholar] [CrossRef]
  15. Zhang, J.; Yi, T.; Qu, C.; Li, H. Detecting Hinge Joint Damage in Hollow Slab Bridges Using Mode Shapes Extracted from Vehicle Response. J. Perform. Constr. Facil. 2022, 36, 4021109. [Google Scholar] [CrossRef]
  16. Turksezer, Z.I.; Iavovino, C.; Giordano, P.F.; Limongelli, M.P. Development and Implementation of Indicators to Assess Bridge Inspection Practices. J. Constr. Eng. Manag. 2021, 147, 04021165. [Google Scholar] [CrossRef]
  17. Angelis, A.D.; Pecce, M.R. Model assessment of a bridge by load and dynamic tests. Eng. Struct. 2023, 275, 115282. [Google Scholar] [CrossRef]
  18. Sun, X.; Xin, Y.; Wang, Z.; Yuan, M.; Chen, H. Damage Detection of Steel Truss Bridges Based on Gaussian Bayesian Networks. Buildings 2022, 12, 1463. [Google Scholar] [CrossRef]
  19. AASHTO. AASHTO-LRFD Bridge Design Specifications, 8th ed.; American Association of State Highway and Transportation Officials: Washington, DC, USA, 2017. [Google Scholar]
  20. JTG/T J21-01-2015; Load Test Methods for Highway Bridge. Ministry of Transport of the People’s Republic of China: Beijing, China, 2015.
  21. Zhao, Y.; Cao, X.; Zhou, Y.; Wang, G.; Tian, R. Lateral Load Distribution for Hollow Slab Bridge: Field Test Investigation. Int. J. Concr. Struct. Mater. 2020, 22, 1–13. [Google Scholar] [CrossRef]
  22. Kilic, G.; Caner, A. Augmented reality for bridge condition assessment using advanced non-destructive techniques. Struct. Infrastruct. Eng. 2021, 17, 977–989. [Google Scholar] [CrossRef]
  23. Li, J.; Li, X.; Liu, K.; Yao, Z. Crack Identification for Bridge Structures Using an Unmanned Aerial Vehicle (UAV) Incorporating Image Geometric Correction. Buildings 2022, 12, 1869. [Google Scholar] [CrossRef]
  24. Zhang, J.; Yi, T.; Qu, C.; Li, H. Determining Orders of Modes Sensitive to Hinge Joint Damage in Assembled Hollow Slab Bridges. J. Bridge Eng. 2022, 27, 04022001. [Google Scholar] [CrossRef]
  25. Chung, W.; Liu, J.; Sotelino, E.D. Influence of Secondary Elements and Deck Cracking on the Lateral Load Distribution of Steel Girder Bridges. J. Bridge Eng. 2006, 11, 178–187. [Google Scholar] [CrossRef]
  26. Huang, M.; Gül, M.; Zhu, H. Vibration-Based Structural Samage Identification under Varying Temperature Effects. J. Aerosp. Eng. 2018, 31, 04018014. [Google Scholar] [CrossRef]
  27. Luo, J.; Huang, M.; Xiang, C.; Lei, Y. Bayesian damage identification based on autoregressive model and MH-PSO hybrid MCMC sampling method. J. Civ. Struct. Health Monit. 2022, 12, 361–390. [Google Scholar] [CrossRef]
  28. Luo, J.; Huang, M.; Xiang, C.; Lei, Y. A Novel Method for Damage Identification Base on Tuning-Free Strategy and Simple Population Metropolis-Hastings Algorithm. Int. J. Struct. Stab. Dyn. 2022, 9, 2350043. [Google Scholar]
  29. Harris, D.K.; Gheitasi, A. Implementation of an energy-based stiffened plate formulation for lateral load distribution characteristics of girder-type bridges. Eng. Struct. 2013, 54, 168–179. [Google Scholar] [CrossRef]
  30. Razzaq, M.K.; Sennah, K.; Ghrib, F. Live load distribution factors for simply-supported composite steel I-girder bridges. J. Construct. Steel Resear. 2021, 181, 106612. [Google Scholar] [CrossRef]
  31. Kong, S.; Zhuang, L.; Tao, M.; Fan, J. Load distribution factor for moment of composite bridges with multi-box girders. Eng. Struct. 2020, 215, 110716. [Google Scholar] [CrossRef]
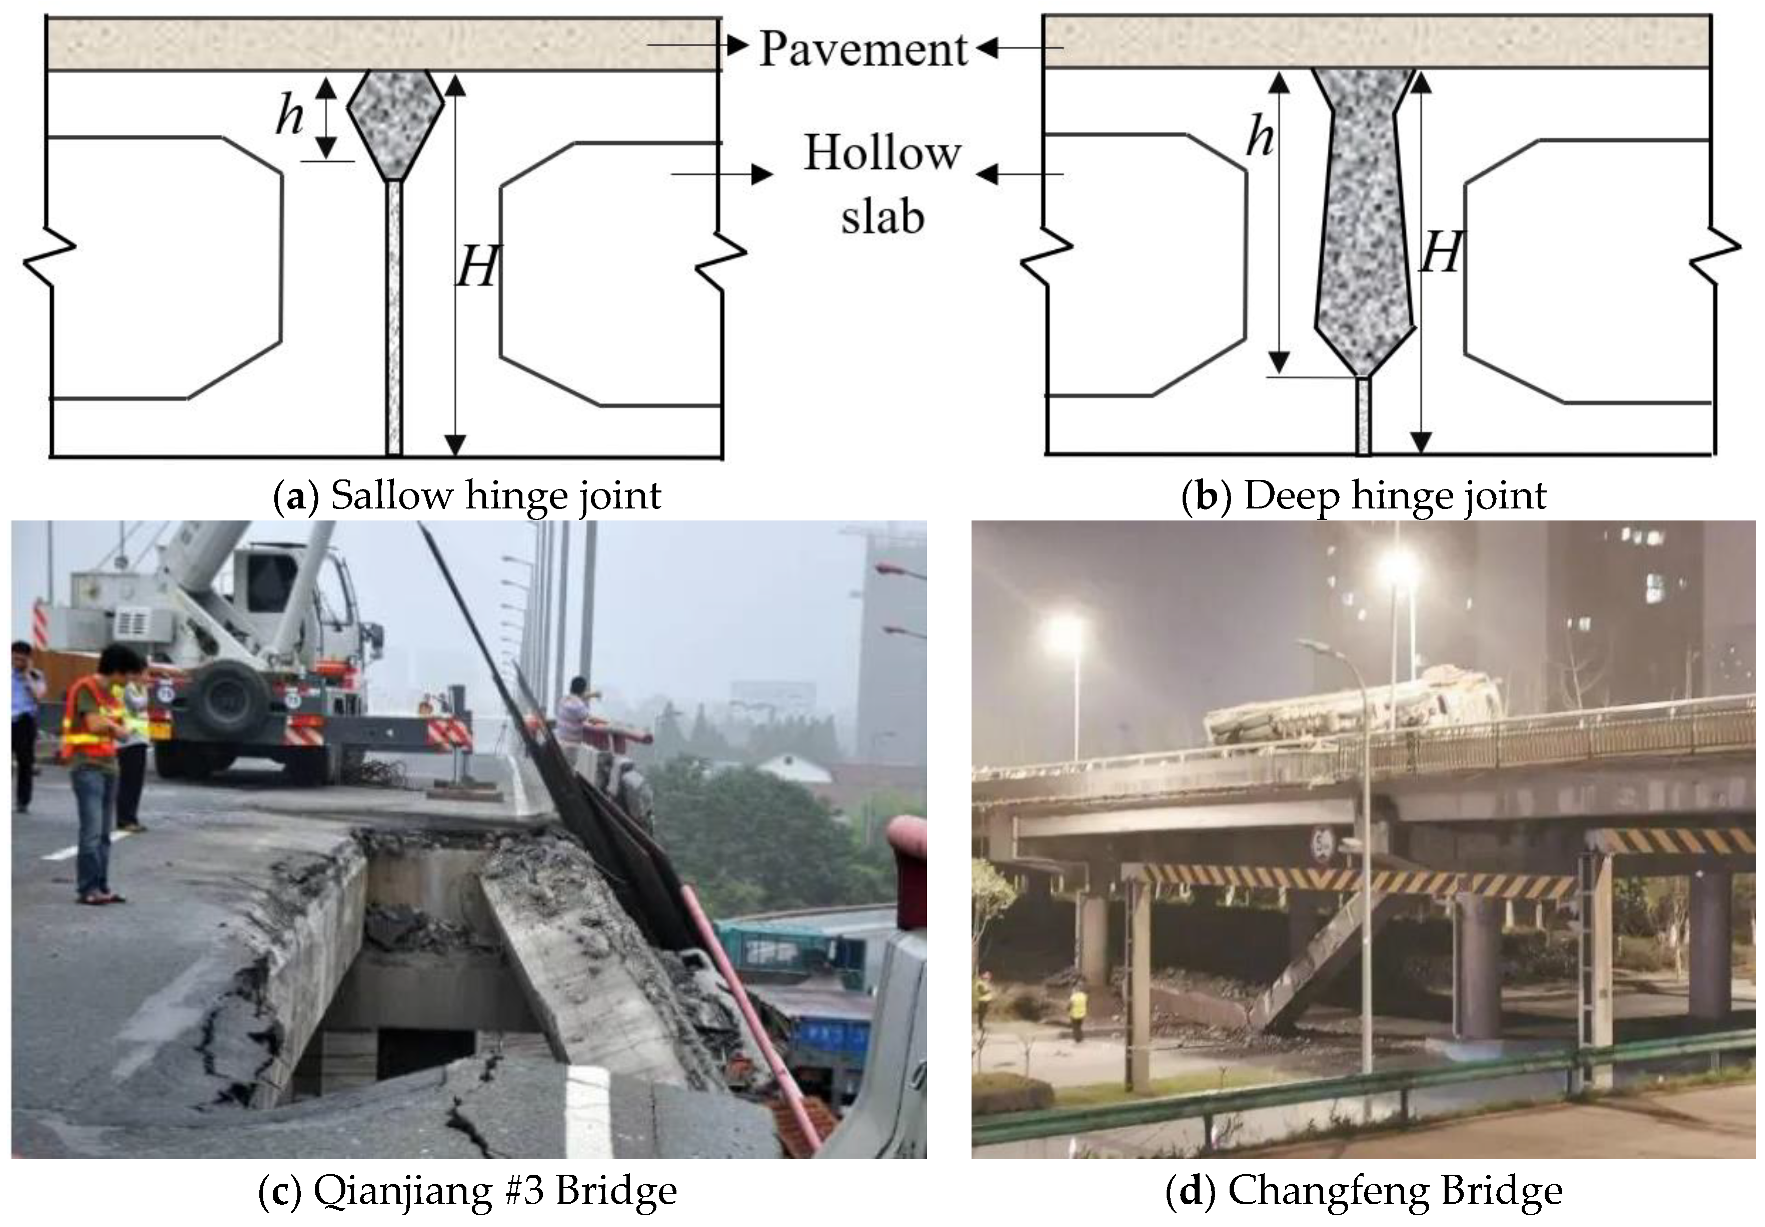
Figure 1. Pictures of slab failure.
Buildings 13 00699 g001
Figure 2. Schematic diagram of the test conditions for the light-load field test.
Buildings 13 00699 g002
Figure 3. Flow chart of the light-load field test.
Buildings 13 00699 g003
Figure 4. Damage status of the hollow slab bridge.
Buildings 13 00699 g004
Figure 5. Appearance of Luojiagang Bridge.
Buildings 13 00699 g005
Figure 6. Deflection measurement.
Buildings 13 00699 g006aBuildings 13 00699 g006b
Figure 7. Lateral load distribution ratio of different spans. (a) First span of Luojiagang Bridge. (b) First span of Qingling 5# Bridge. (c) First span of Dadongmen Bridge. (d) First span of Yezhi Bridge. (e) First, Second, and Third span of 8# Ramp Bridge.
Buildings 13 00699 g007aBuildings 13 00699 g007b
Figure 8. The destructive experiment.
Buildings 13 00699 g008
Figure 9. Load distribution ratio of different test conditions.
Buildings 13 00699 g009
Table 1. The profiles of bridges.
NameNo. of
Spans
Length of
Span (m)
Width of
Span (m)
No. of
Slabs
No. of
Hinge Joints
No. of
Lanes
Open Year
Luojiagang Bridge2185047467(4) *2003
Donghu Bridge21850474612(4)2018
Qingling 1# Bridge12013191832006
Qingling 2# Bridge12013181732006
Qingling 3# Bridge12013171632006
Dadongmen Bridge31616.5151441990
Qingling 4# Bridge12013151432006
Qingling 5# Bridge42013121132006
Guanggu Bridge122013121132005
Yezhi Bridge252512.5121132016
1# Ramp Bridge72512.5111022012
2# Ramp Bridge72512.5111022012
3# Ramp Bridge4251010922012
4# Ramp Bridge425109822012
5# Ramp Bridge525109822012
6# Ramp Bridge420109822012
7# Ramp Bridge6258.57612012
8# Ramp Bridge7258.57612012
Total number96 1196
Total number 1100
* The number out of the bracket indicates the total number of lanes, and the number in the bracket indicates the number of lanes to be tested.
Table 2. Measured deflection (Mi) and theoretical deflection (Ti) of Qingling #5 Bridge.
No.Mi
(mm)
Ti
(mm)
No.Mi
(mm)
Ti
(mm)
No.
Mi
(mm)
Ti
(mm)
Test Condition 1Test Condition 2Test Condition 3
* 1#1.692.311#0.440.971#0.150.44
2#1.782.292#0.581.032#0.200.46
3#1.752.163#0.761.153#0.260.52
4#1.511.904#1.071.344#0.350.60
5#1.131.565#1.401.565#0.460.73
6#0.851.246#1.591.726#0.610.89
7#0.661.007#1.641.727#0.861.11
8#0.440.818#1.291.568#1.311.40
9#0.350.689#1.051.349#1.551.70
10#0.260.5810#0.751.1510#1.691.93
11#0.190.5211#0.541.0311#1.662.05
12#0.120.4912#0.380.9712#1.452.06
* The data in boldface deserves study based on the principles.
Disclaimer/Publisher’s Note: The statements, opinions and data contained in all publications are solely those of the individual author(s) and contributor(s) and not of MDPI and/or the editor(s). MDPI and/or the editor(s) disclaim responsibility for any injury to people or property resulting from any ideas, methods, instructions or products referred to in the content.