Article

Stress Detection of Precast Pipe Piles Based on the Low-Loss Slotting Method

1
Jiangsu Southeast Special Technology Engineering Co., Ltd., Nanjing 210008, China
2
School of Civil Engineering, Southeast University, Nanjing 211189, China
3
National Engineering Research Center for Prestressing Technology, Nanjing 211189, China
*
Author to whom correspondence should be addressed.
Buildings 2023, 13(3), 648; https://doi.org/10.3390/buildings13030648
Submission received: 30 November 2022 / Revised: 20 February 2023 / Accepted: 27 February 2023 / Published: 28 February 2023

Abstract

:
Tilting of buildings due to uneven settlement, construction quality issues or other problems is one of the critical accidents threatening the safety of buildings. In order to determine a reasonable solution with respect to the rectification of the tilting building, detection of the stresses of the substructure is necessary. In this study, a stress release method to test the stress of prefabricated pipe pile under loading is studied by combining experimental research and finite element numerical simulation. Based on various measurements, such as traditional strain gauges, vibrating wire strain gauges, and three-dimensional digital image correlation (DIC) tests, the relationship between local residual stress and actual stress of the slotted area at different load levels is determined. Meanwhile, the stress release process in slotted precast pipe pile was numerically simulated with ABAQUS to investigate the influence of the slotting dimension parameters on the stress release rate at different load levels. Based on 1042 sets of finite element modeling results of multi-parameter combination, the quantitative relationship between slot width, depth, spacing, prestress level and stress release rate is studied. An explicit prediction model of the stress release rate is given by regression analysis of combined test results and simulation data. With the prediction model, the stress condition of a loaded precast pipe pile can be accurately predicted based on low-loss slotting. Compared to the traditional stress release method, the proposed method has better controllability and applicability, less damage to the structure, and stronger anti-disturbance ability.

1. Introduction

Building tilting caused by uneven settlement, construction quality issues or other problems severely threatens the safety of buildings. In projects involving rectification and reinforcement of tilting buildings, accurate detection of the servicing stress of structural members could provide effective assurance for the efficiency of rectification and reinforcement and provide economic benefits as well. The problem of pile stress is of particular concern [1].
Concrete stress detection techniques are mainly divided into nondestructive and local damage-testing techniques [2]. Nondestructive testing techniques refer to the use of sound, light, electricity, electromagnetism, and wave media to probe the interior of concrete without damaging the concrete structure itself, thus corresponding to the stress condition inside the concrete [3,4,5]. Nondestructive testing techniques [6,7,8] are mainly applied to detect the defects and strength of concrete elements and cannot make an accurate determination of the internal stresses of concrete structures. However, a local damage-testing method can reasonably detect the stress condition of structural members by stripping, drilling blind holes or slotting in the local areas of structural members [9,10,11]. The basic principle is to calculate the released stress of the component by recording the variation of the strain on the gauge length before and after conducting local damage. This kind of testing method can be uniformly named as the stress release method. In civil engineering, geotechnical engineering, metallurgy and other fields, the stress release method has become a common method to detect structural working stress due to its simple construction, strong anti-interference ability, and high reliability of test results [12,13,14].
Among several stress release methods, the slotting method has the simplest operation, and the experimental and theoretical studies are relatively mature. Liu et al. [15] simulated the effect of the change in cutting spacing on the stress release rate of ordinary reinforced concrete column members. Kral’ovanec [16,17] tested the stress and prestress levels of a precast prestressed bridge by applying the slotting method. Scholars have also conducted studies on the stress release process of T-beam structures, the accuracy of stress release by the slotting method, and the search for the complete stress release depth by numerical models [18,19,20,21]. However, the traditional slotting methods usually require complete stress release of the slotted area, resulting in deep slots or local volume loss of the members, which is destructive to the members. In addition, rare literatures were found to use the slotting method for the stress detection of precast pipe piles.
In this paper, the stress detection problem of prefabricated prestressed concrete pipe piles is studied by combining experimental research and finite element numerical simulation, giving an explicit prediction model of the stress release rate by regression. A low-damage stress detection method based on the prediction model is proposed.

2. Precast Pipe Pile Slotted Stress Release Test

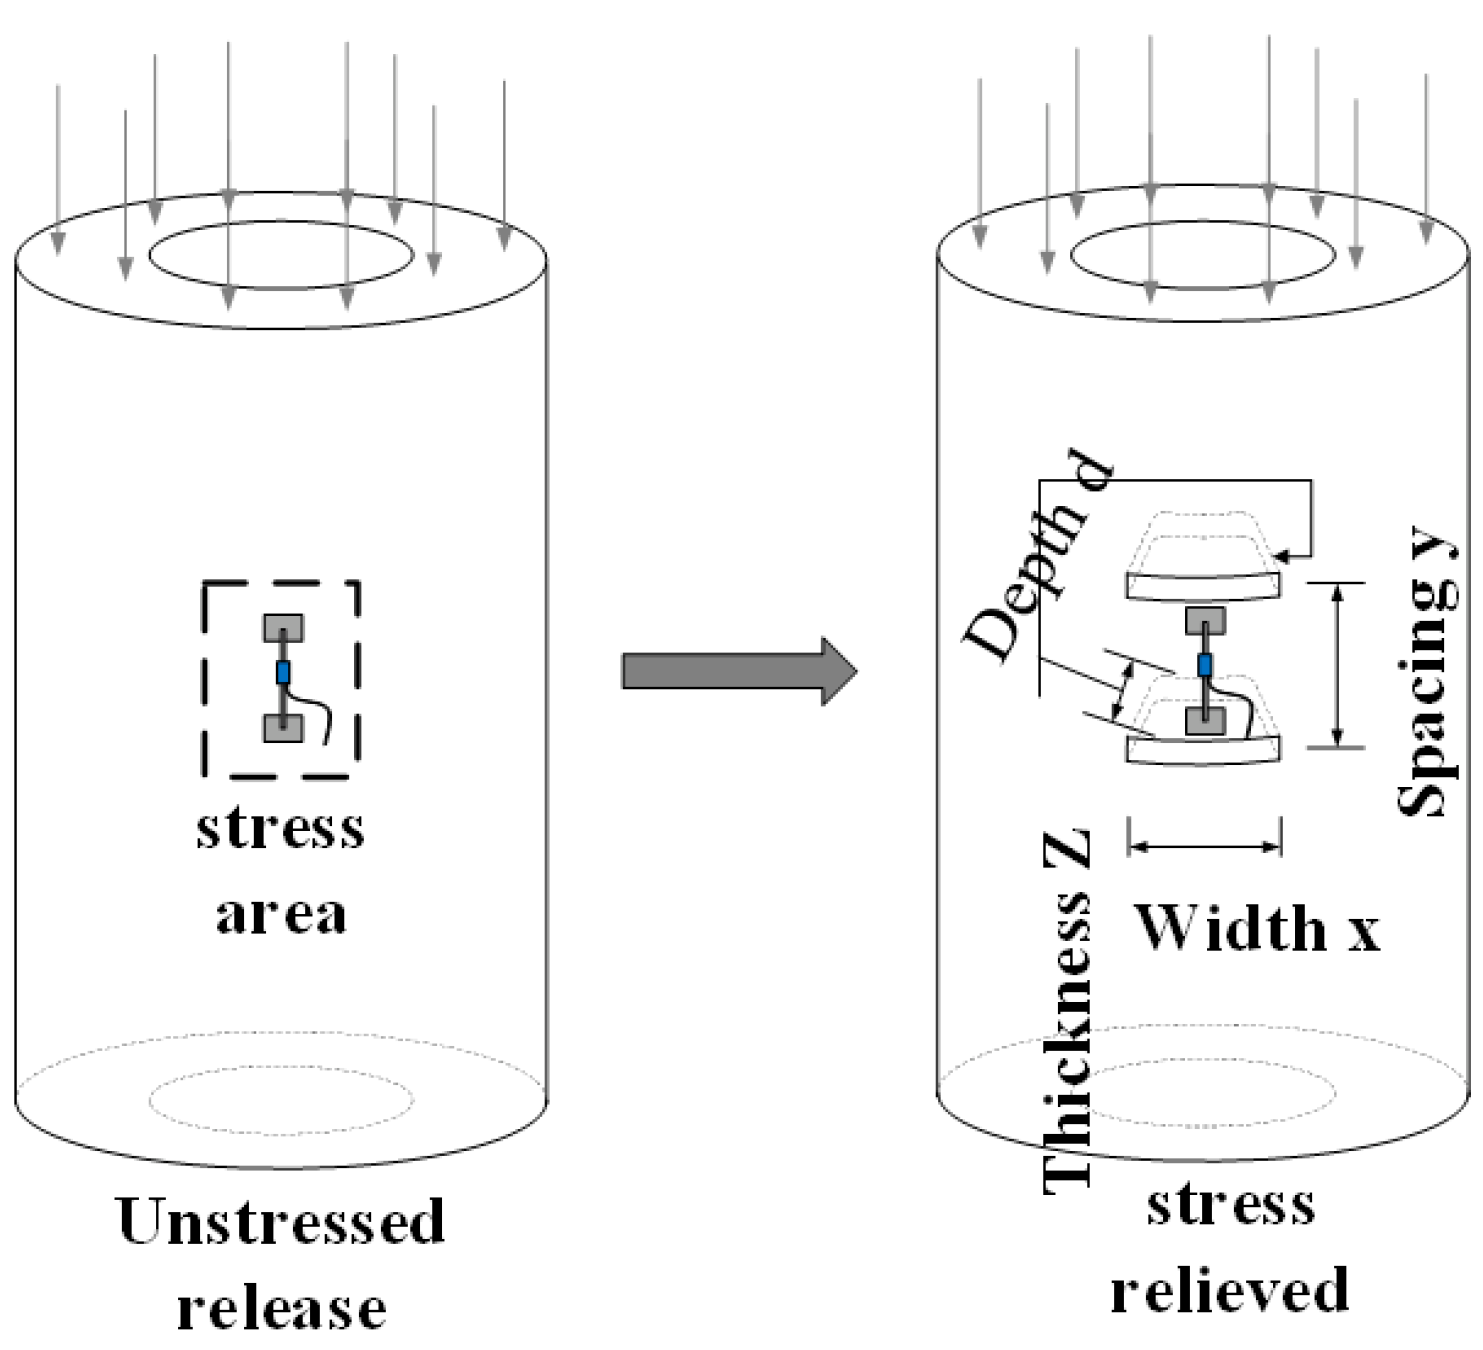
2.1. Experimental Principle

The stress release method is a method to measure the strain before and after cutting the measurement point of a component and then derive its overall working stress state with the help of mechanical equations. The specific ideas are as follows: (1) to cut or drill the stress measurement area of the structure by equipment so that the measurement area part is changed from the stressed state to the free or semi-free state; (2) to measure the strain difference before and after the stress release; and (3) to obtain the stress of the part by converting the elastic calculation of Equation (1). In this paper, we adopt the method of opening horizontal straight grooves above and below to release the concrete stress, and a schematic representation of the cutting method and grooving characteristics is shown in Figure 1.
σ = E · ε
In this experiment, the upper load is less than the bearing capacity of the pile, and the stress level in the pile is also significantly less than the compressive strength of concrete in practical use, so it is assumed that the Young’s modulus of concrete is a constant. The stress release rate is defined as the ratio of the difference in stress change before and after grooving to the initial stress before grooving (see Equation (2)) and is denoted as η . The stress release rate is also the ratio of the difference in strain change before and after grooving to the initial strain before grooving, as derived from the elastodynamic equation.
η = Δ σ σ = Δ ε ε  
  • Δ σ is the stress change difference, MPa.
  • σ   is the initial stress in the measurement zone, MPa.
  • Δ ε is the strain variation difference, με.
  • ε   is the initial strain in the measurement area, με.

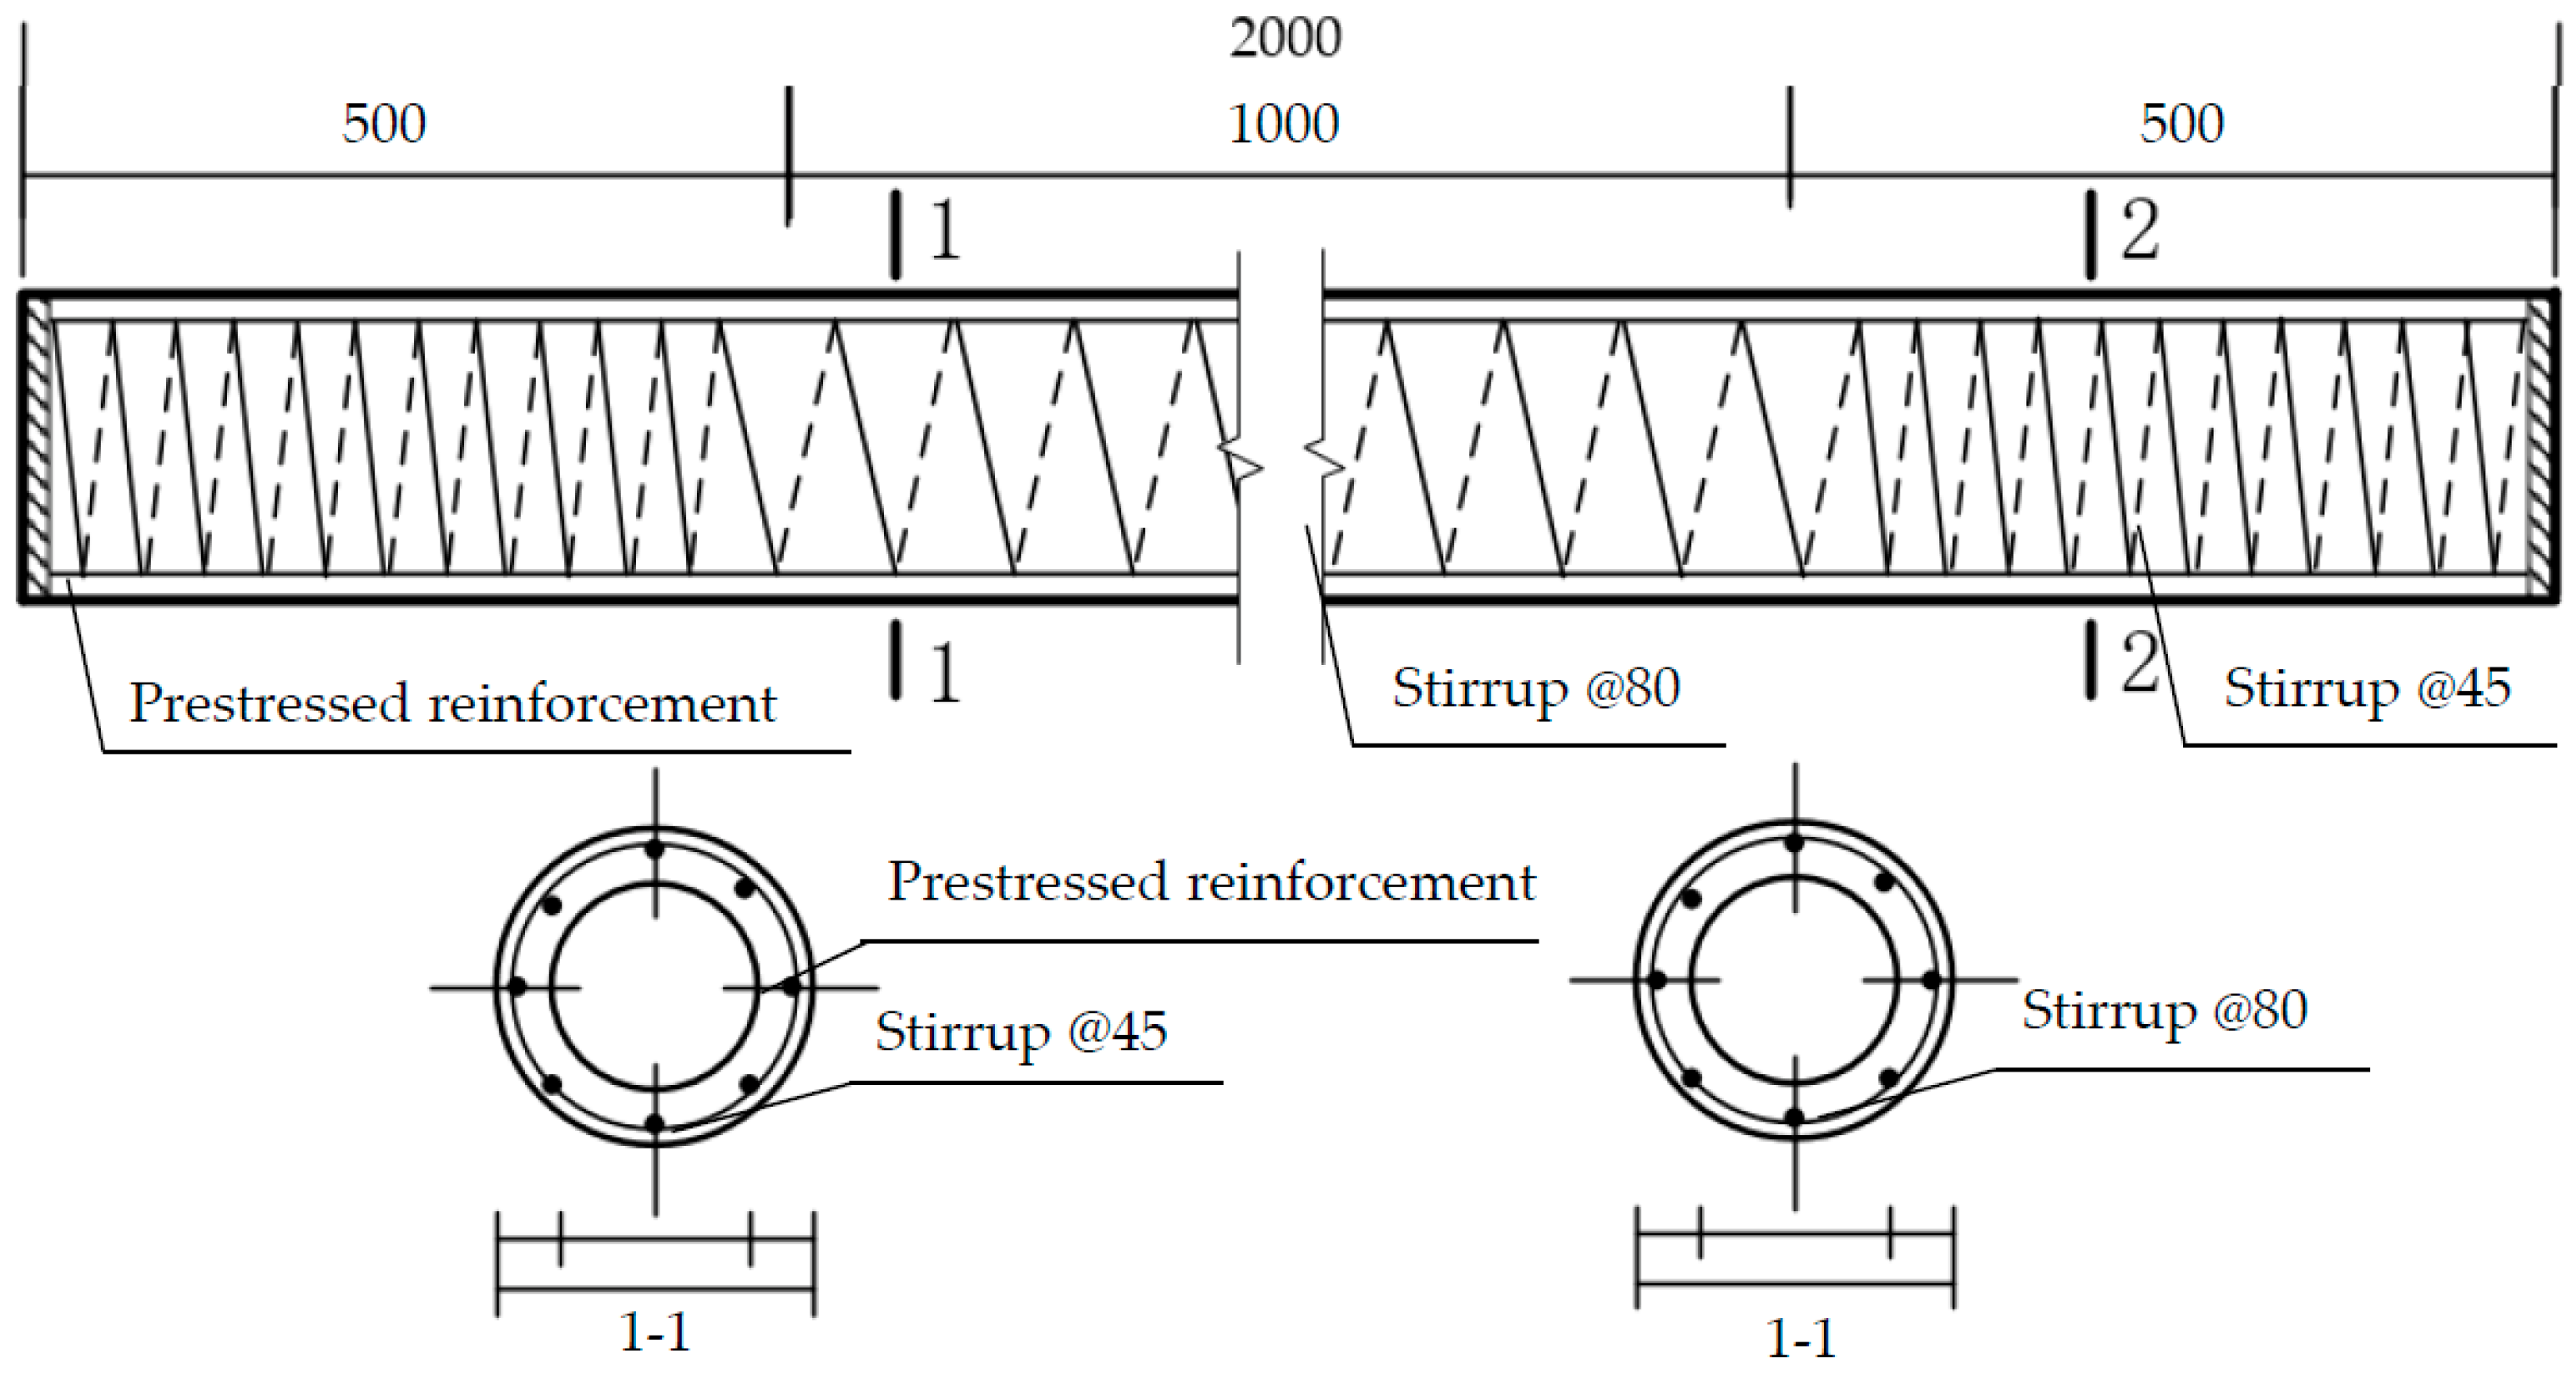
2.2. Test Parameters

A PHC500(125)-AB precast pile is used as the test object with the following parameters: outer diameter is 500 mm, inner diameter is 375 mm, protective layer thickness is 50 mm, pile length is two meters, prestressing steel specification is φ10.7, spiral hoop specification is φb 5, hoop encryption zone spacing is 45 mm, middle section spacing is 80 mm, and pile vertical bearing capacity design value is 4190 kN, as shown in Figure 2.

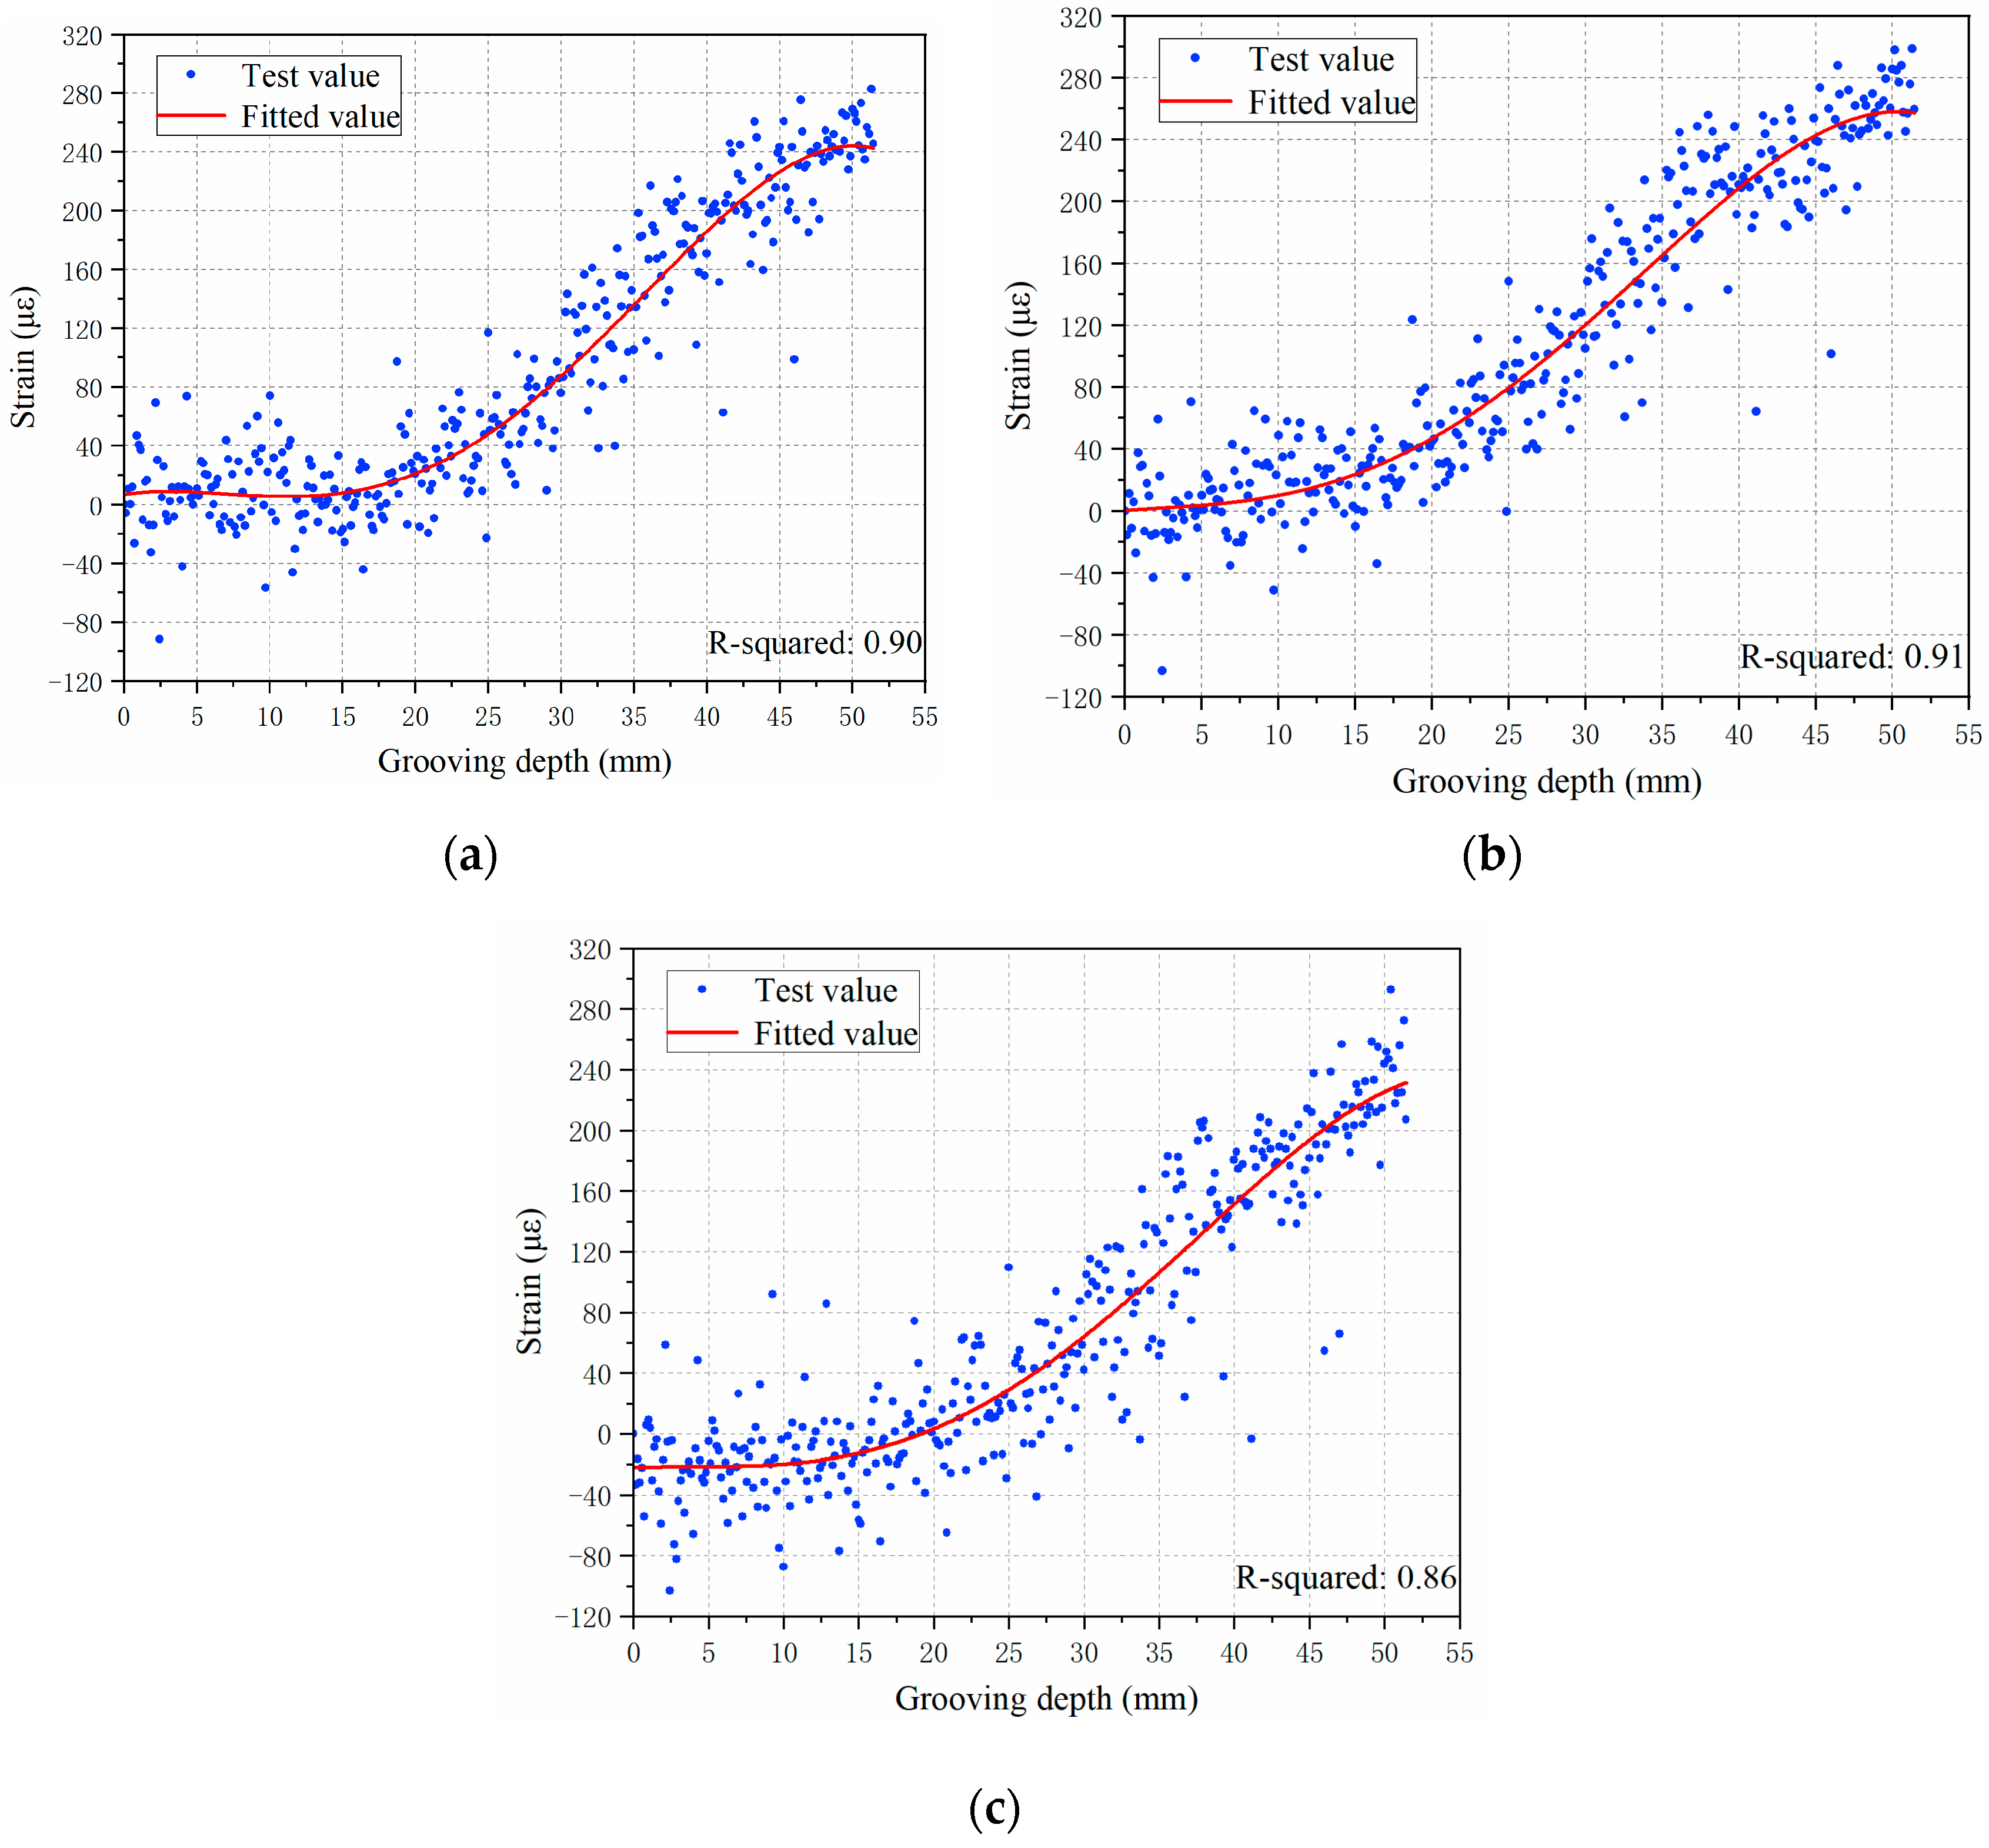
2.3. Experimental Results and Analysis

2.3.1. Analysis of the Measurement Results of the Oscillating Strain Gauge

Figure 3 shows the stress-release relationship curves of Z1-1, Z2-1 and Z3-1. For example, Z1-1 represents the test result of test area 1 on test piece No. 1. The characteristic parameters of the Z1-1, Z2-1 and Z3-1 grooves are as follows: the load in the measurement area is 2000 kN, the groove spacing is 200 mm, the length of the slot is 200 mm and the slot width is 5 mm. When the groove appeared on the surface, the surface strain began to be released. The strain changes maintained an upward trend, and the strain change rate showed a law of increasing and then decreasing. When the groove depth was between 35 and 45 mm, the strain was completely released, and then the concrete surface compressive strain was changed into tensile strain and continued to grow.
In the stress release of the test pile using the slotting method, the strain of the test pile varies with the depth of the slotting in a roughly S-shaped distribution. According to the characteristics of strain variation with slotting depth, the stress release process can be divided into three stages.
In the first stage (slow stage), when the grooving depth is within 10 mm, the change in strain is small, and 10% of the change in strain throughout the stress release process occurs in this stage.
In the second stage (rapid stage), the slotting depth exceeds 10 mm, and then the rapid stage is entered. The strain drop rate becomes faster and more than 70% of the strain changes in this stage.
In the third stage (slowing down stage), the strain change starts to slow down when the grooving depth exceeds 40 mm (10 mm from the protective layer), and approximately 15% of the strain change occurs in this stage.
The concrete grooving is subject to the joint action of eccentric stress, stress diffusion and reinforcement precompression stress in the grooved section. In the slow change phase, the strain measurement area is closer to the compressive zone and farther from the prestressing tendon, which is mainly affected by the diffusion compressive stress in the compressive zone. In the rapid change phase, the distance of the strain measurement area from the compressive zone increases, and the compressive stress in the compressive zone increases, which is mainly affected by the eccentric action. In the slow change phase, it is very close to the protective layer. In the slowing down phase, the eccentricity is curbed by the pre-compressive stress of the reinforcement, resulting in a slowdown of the strain.
Figure 4 shows the relationship between strain and slotting depth under different loads. The initial strains of the pile under each load case have large differences; with the increase in the grooving depth, the differences in the strains in each curve gradually decrease and finally converge when they are close to the protective layer. The trends of the four curves still have considerable regularity; all maintain the three-stage variation law of slow–quick–slow. The larger the initial strain is, the more strain is released accordingly. The strain changes from 315.21 με to 282.21 με in the slow-slotting stage with only 10.47% released (using the initial stress as the control). 89.33% is released in the quick-slotting stage, and the strain turns to positive change in the slow-slotting stage with 15.29%. Figure 5 shows the relationship between the slot width and stress release rate for different slot depths. From the figure, it can be seen that the stress release rate varies with the slot width under different slotting depths with the same pattern; the stress release rate increases with increasing slotting width. Figure 6 shows the relationship between the slotting spacing and stress release rate for different slotting depths. From the figure, it can be seen that the overall stress release rate decreases with increasing slotting spacing.

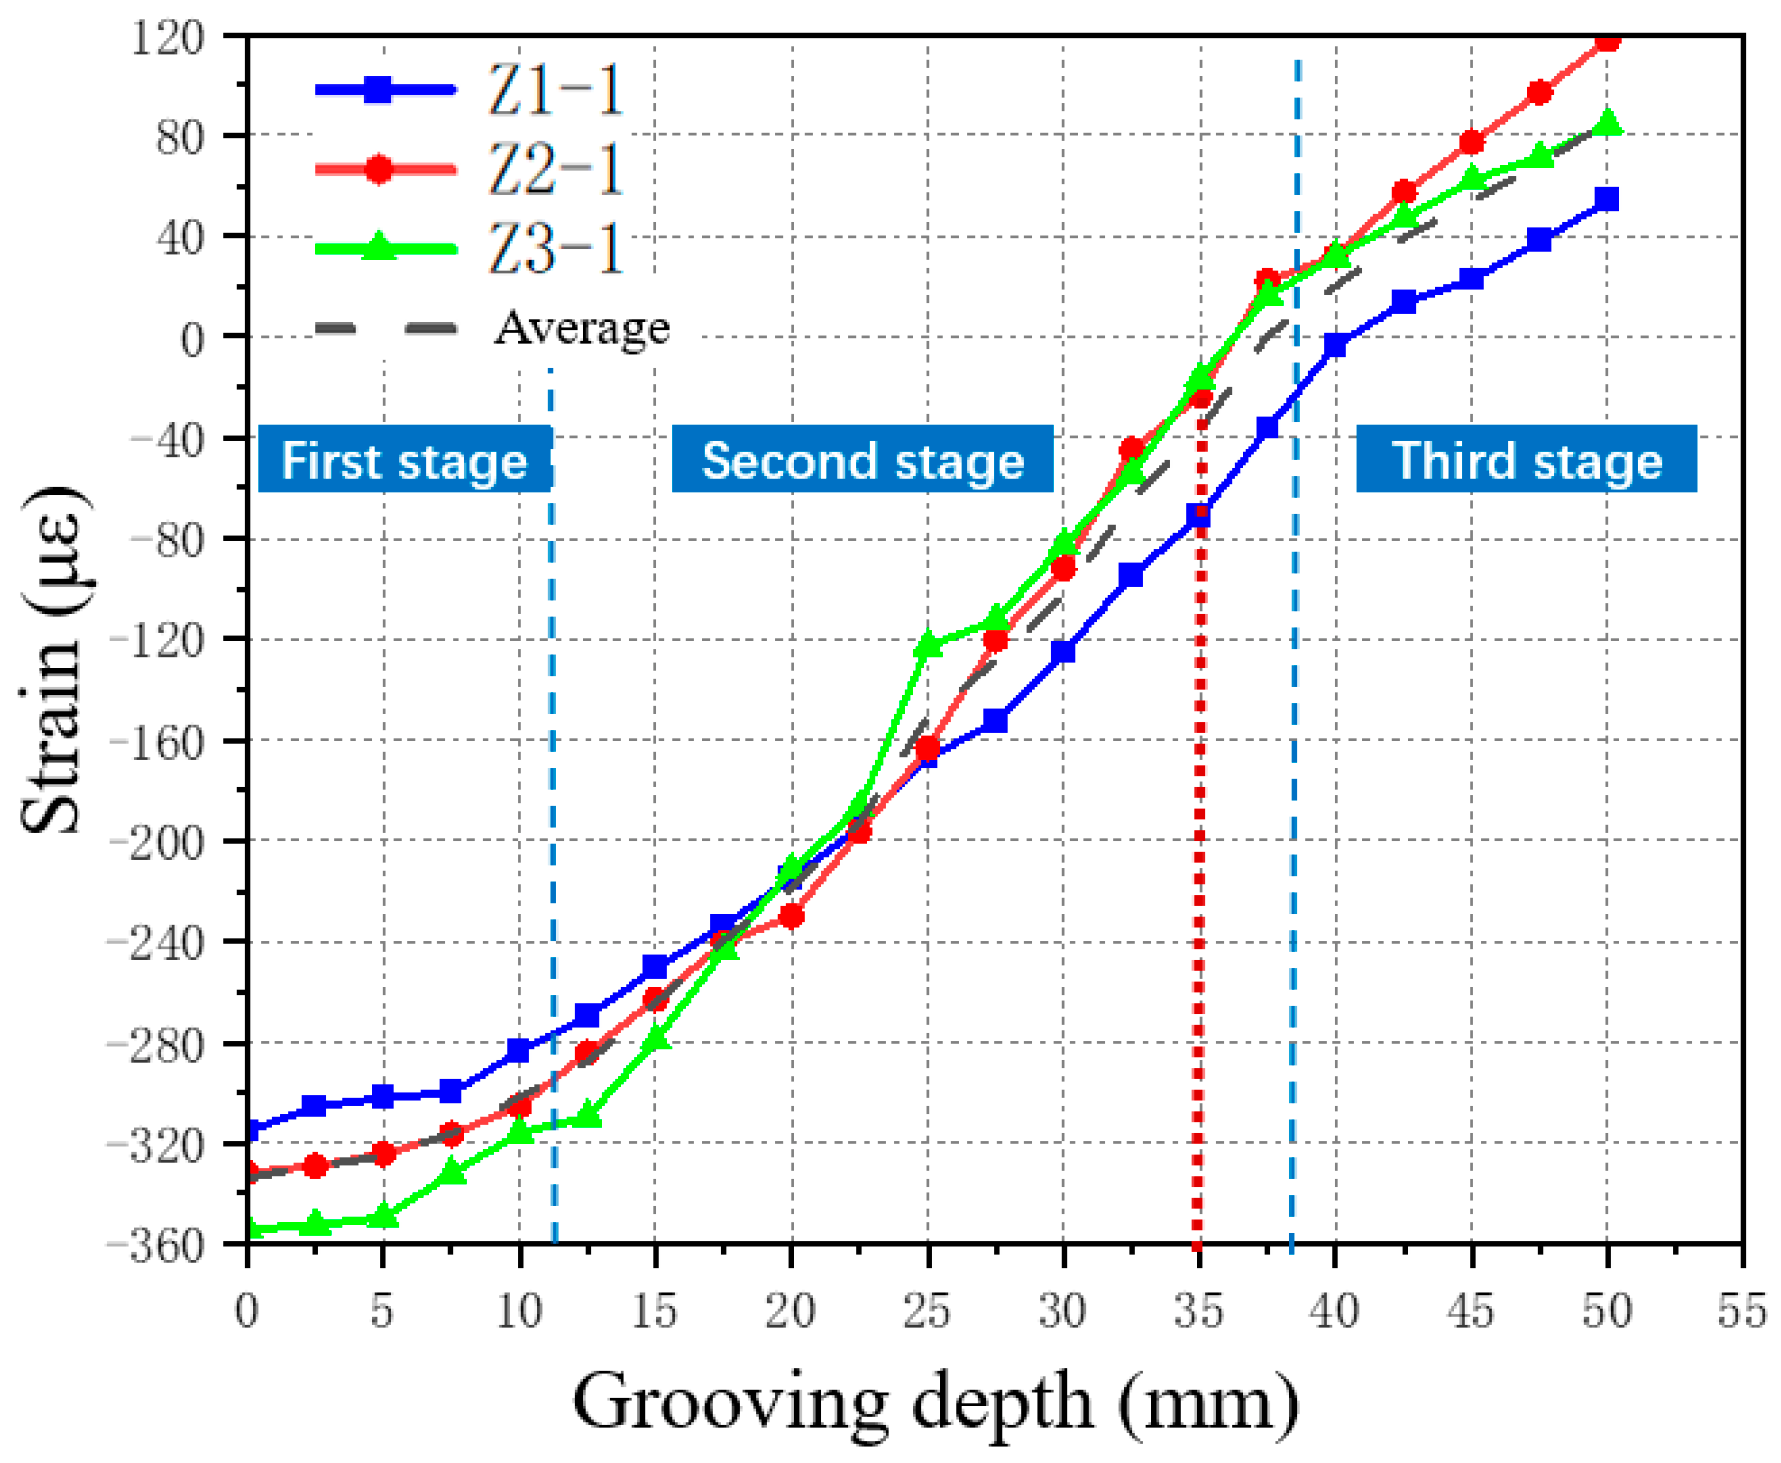
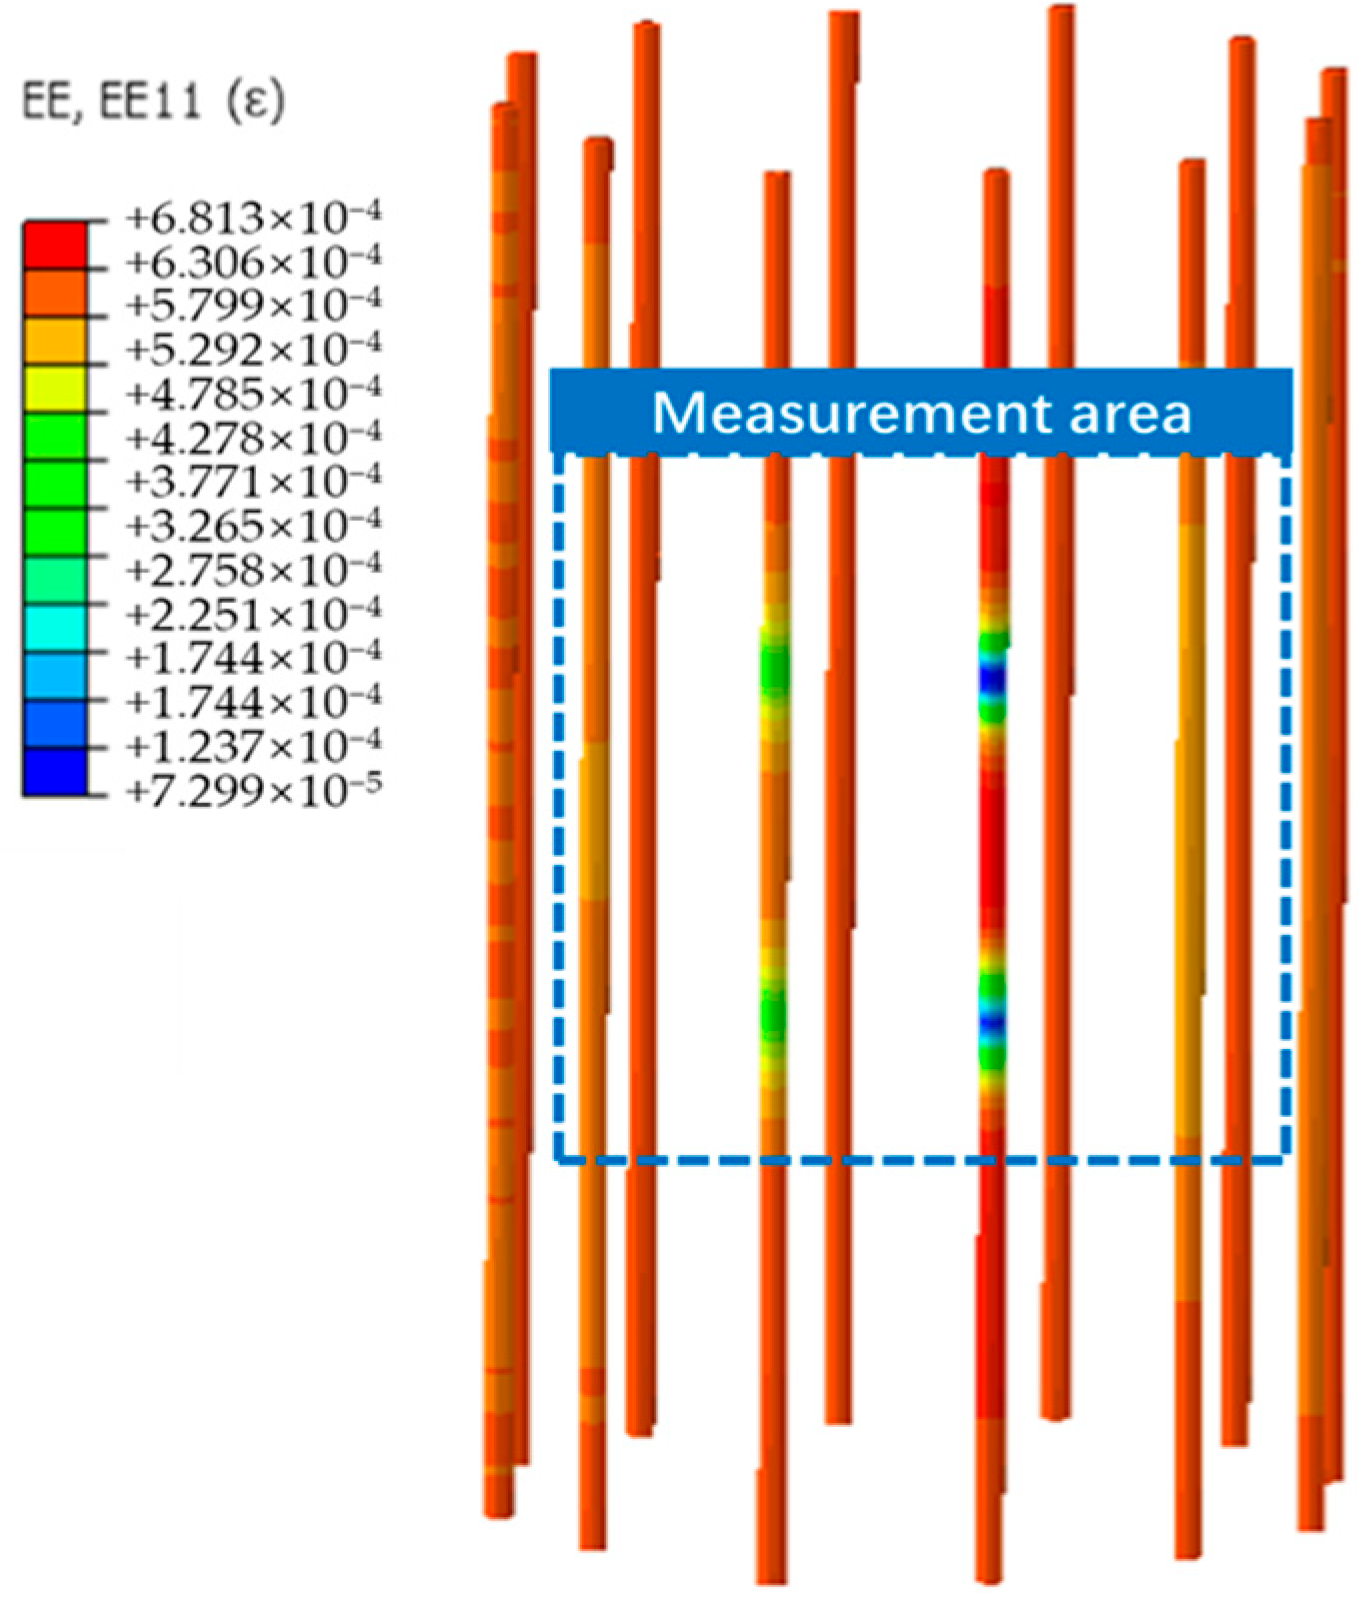
2.3.2. Analysis of Strain Changes in Reinforcing Steel during Cutting

In the test, the stress/strain suddenly increases at the moment of cutting, and then decreases immediately after finishing cutting, and finally stabilizes after holding for a period of time. To eliminate this fluctuation and visualize the trend of reinforcement strain, the outer envelope of the reinforcement strain-slotting process curve was extracted as the test result when processing the data. It should be noted that since some of the experimental data about the strain of the reinforcement after slotting missed, the reinforcement strain after slotting is not systematically analyzed.
Figure 7 shows a typical rebar strain–time curve. As seen from the figure, there is no significant change in the rebar strain in the early stage, indicating that the rebar does not play a significant role in the grooving process during the slow-change phase. When the slotting enters the rapid-change phase, fluctuations were observed during the cutting process, indicating that the reinforcement starts to intervene in the stress-release process. It can be observed that the strain of the reinforcement always increases steeply after slotting and then decreases immediately and stabilizes after holding for a while. It is because the reinforcing bars provide a restraining effect on the stress/strain release of the concrete surface. A trend line of the stabilized rebar strain values shows that the stabilized rebar strain is approximately squared with the slotting process. The grooving depth is close to the protective layer thickness, which corresponds to the third stage of stress release, where the reinforcement strain changes more intensely. A similar phenomenon of strain changes was observed in the prestressing tendons.

2.3.3. Analysis of Measurement Results of DIC Method

In order to prove the reliability of the experimental results, the DIC test method is used to further calibrate the strain variation trend, and various detection methods have certain limitations. The strain gauge can only detect the change of strain at two fixed points, and DIC can detect the change of the whole strain in the test area, but it fluctuates greatly in the experiment, and the initial range is not consistent with the strain gauge. The test is based on the theory of binocular stereo vision correlation for the 3D digital image correlation (DIC) measurement of the test pile. The method is based on the digital image correlation (DIC) method, which is based on the theory of binocular stereo vision. Figure 8 is a schematic diagram of binocular stereo vision, in which the left image and right image are the optical centers of the left and right cameras, respectively. The points of any point in the space on the left camera imaging plane and the points on the right camera imaging plane are known. The basic principle of binocular vision is to obtain the three-dimensional coordinates of point Q (XW, YW, ZW) in the world coordinate system by determining the position of the point sum.
The video extensometer measurement method is used in the DIC to measure the line strain between two points of the specimen, which enables the calculation of the strain between any two points in the strain field, as shown in Figure 9.
When processing the strain–notch depth curve obtained from DIC, fluctuations in the strain data were found. To eliminate this fluctuation and visualize the trend of the surface strain in the measured area, the smoothed curve of the strain-slotted depth curve was extracted as the test result using the local weighted average method. Figure 10 shows the plots of the strain-slotting depth curves for different piles obtained by DIC. From the figure, the strain variations at different measurement zones and different lead distances are very similar, and the overall pattern is consistent with the strain gauge measurement results, which all follow the S-shaped variation trend.

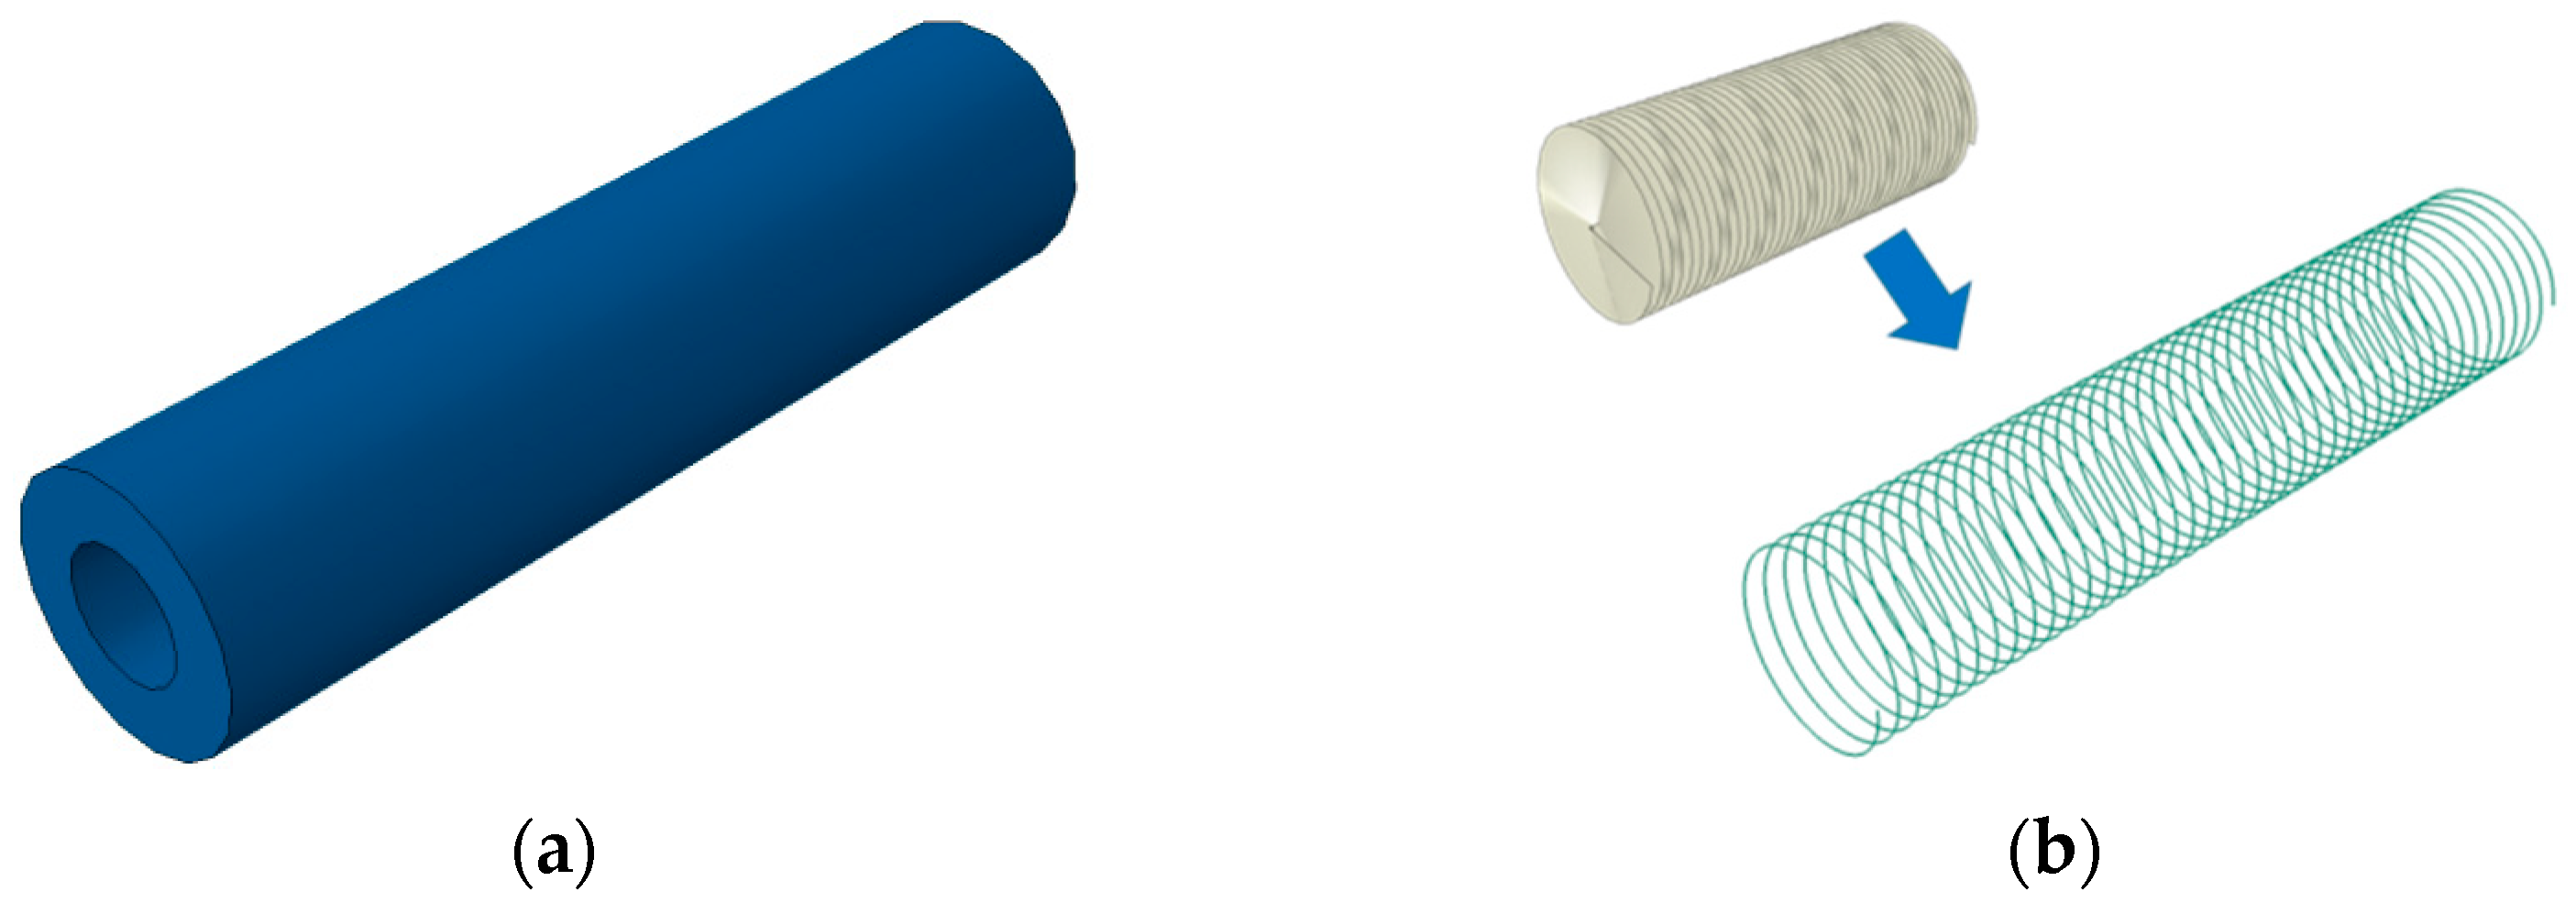
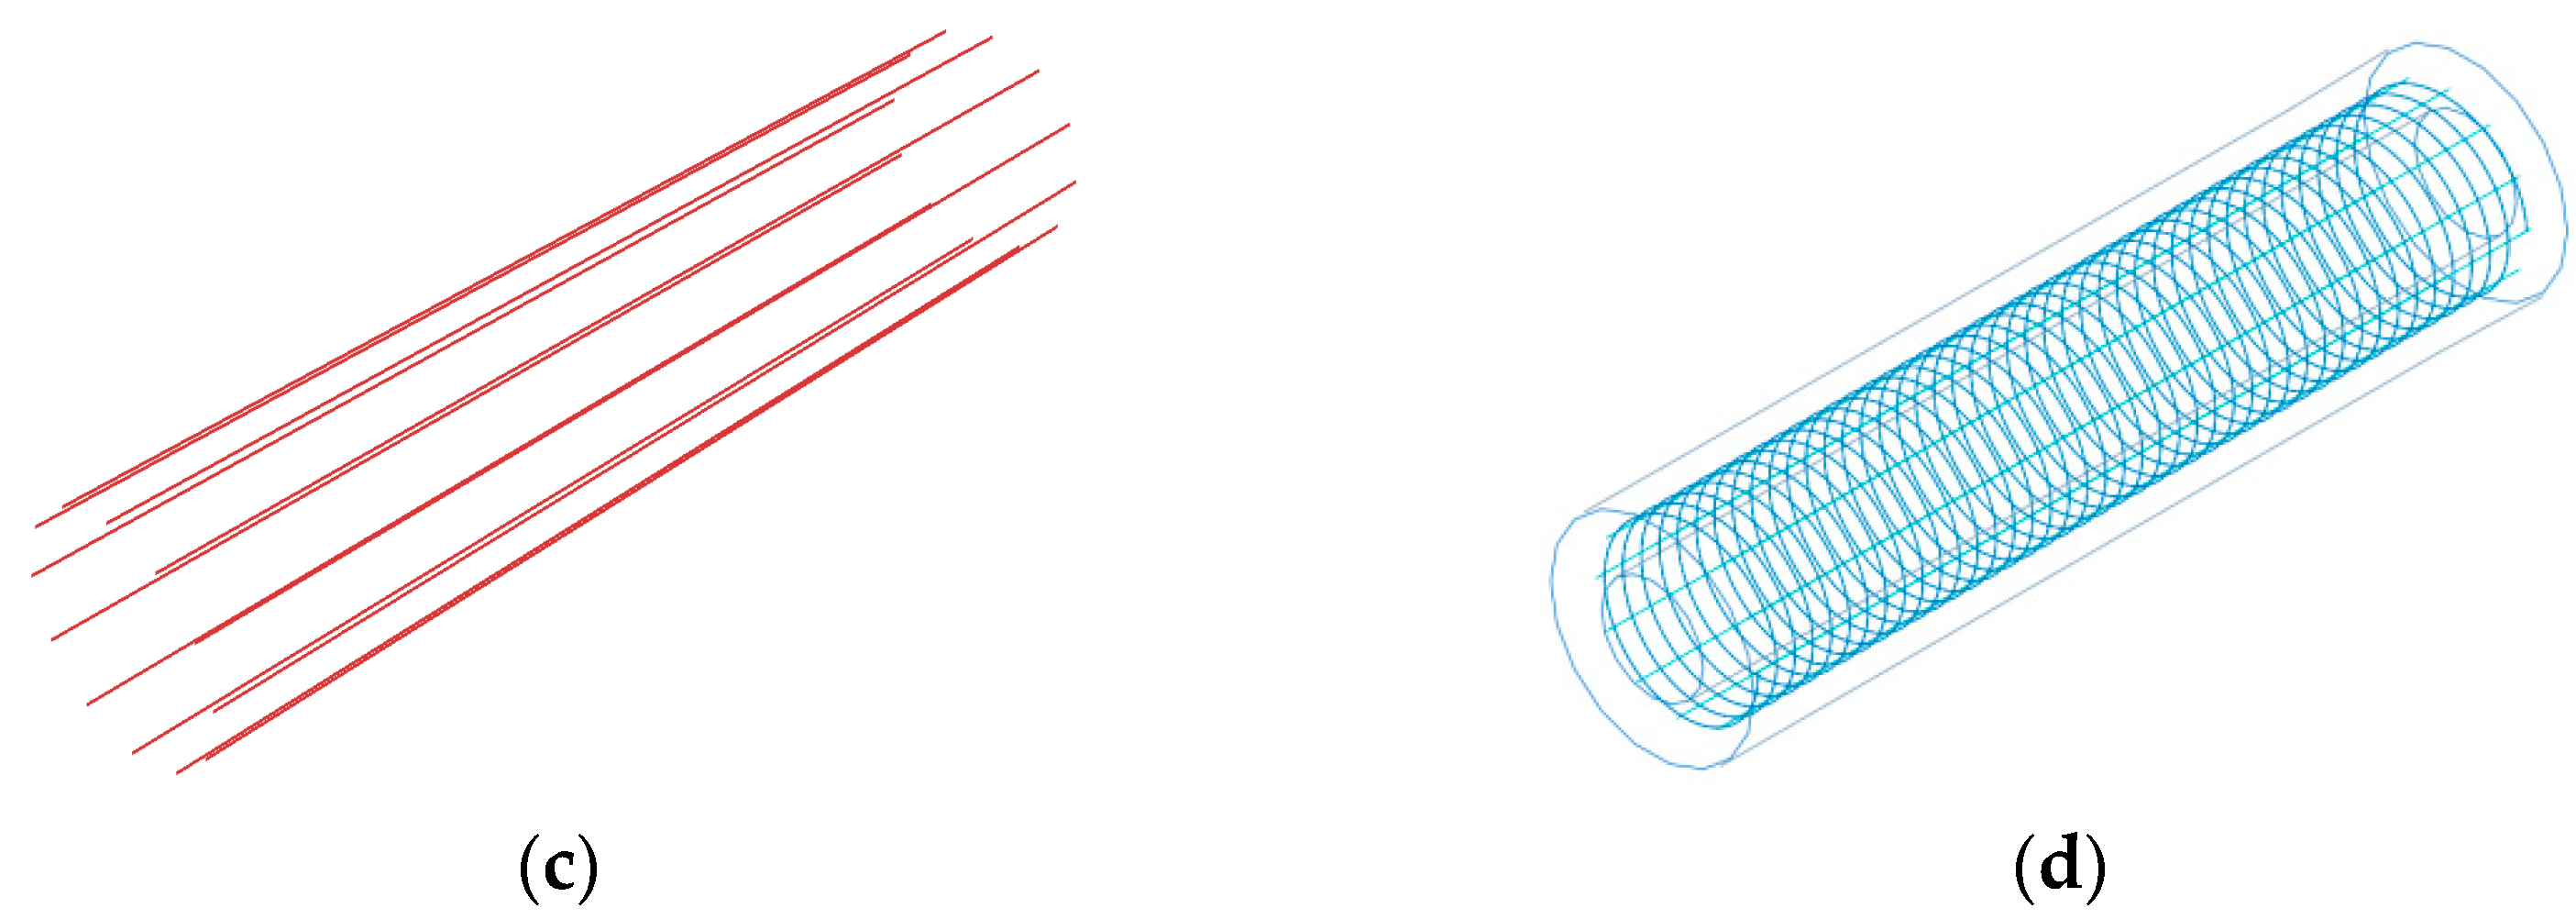
3. Numerical Simulation of Stress Release Process in Slotted Precast Pipe Pile

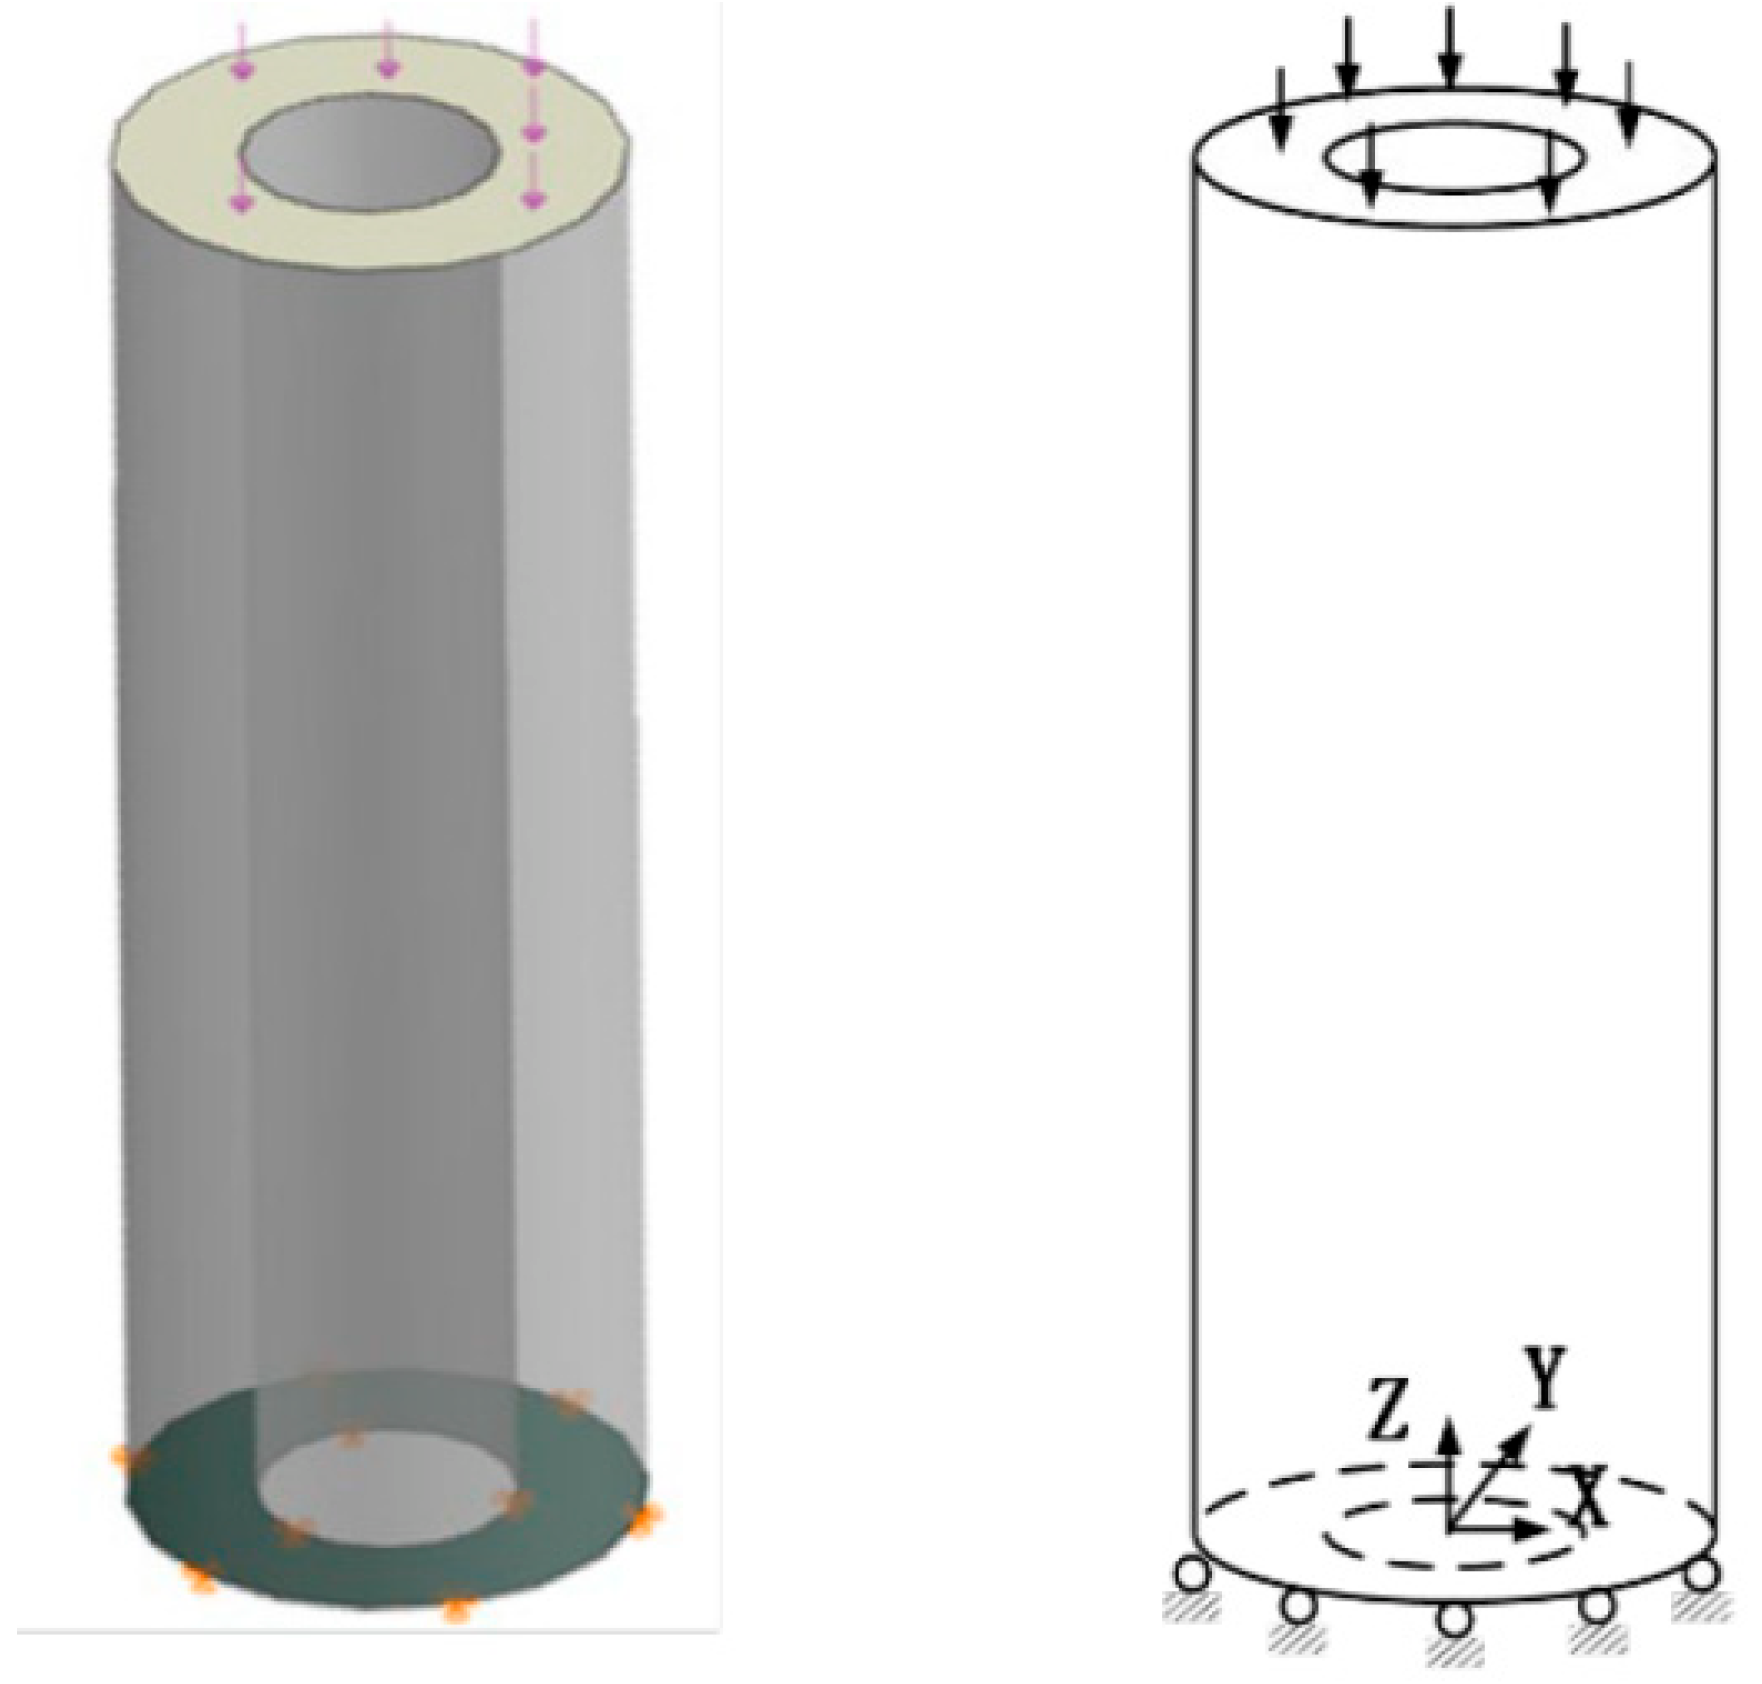
3.1. Finite Element Modeling of the Prestressed Pipe Pile Stress Release Process

The finite element model was created with reference to the component information in Section 2.2 for the three components of the circumferential hoop, prestressing strand, and concrete pile body and assembled in the assembly module (the full model can be seen in Figure 11d). C3D8R is used for concrete element, T3D2 is used for reinforcement element, and embedded constraint is used for connection between reinforcement and concrete.
Assuming that the concrete is always in a state of elastic stress, the density of concrete ρ is taken to be 2500 kg/m3, Poisson’s ratio is taken to be 0.2, and the modulus of elasticity EC is 3.6 × 10⁴ MPa. The steel strand is assumed to be an elastic material with a modulus of elasticity of 3.8 GPa, and the prestress on the concrete were applied by the prestressing tendons using an equivalent temperature reduction. In the finite element model, a simple support constraint is applied at the bottom of the component, and a vertical downward load is applied at the top of the component, as shown in Figure 12.
By the life and death element method [22], the process of pile cutting and slotting is simulated, i.e., by “activating” and “killing” the elements in the slotting area to simulate the state of the pile before and after cutting and slotting. In addition, the parameters, such as the modulus of elasticity, are calibrated with the experimental results, to ensure the accuracy of the finite element models.

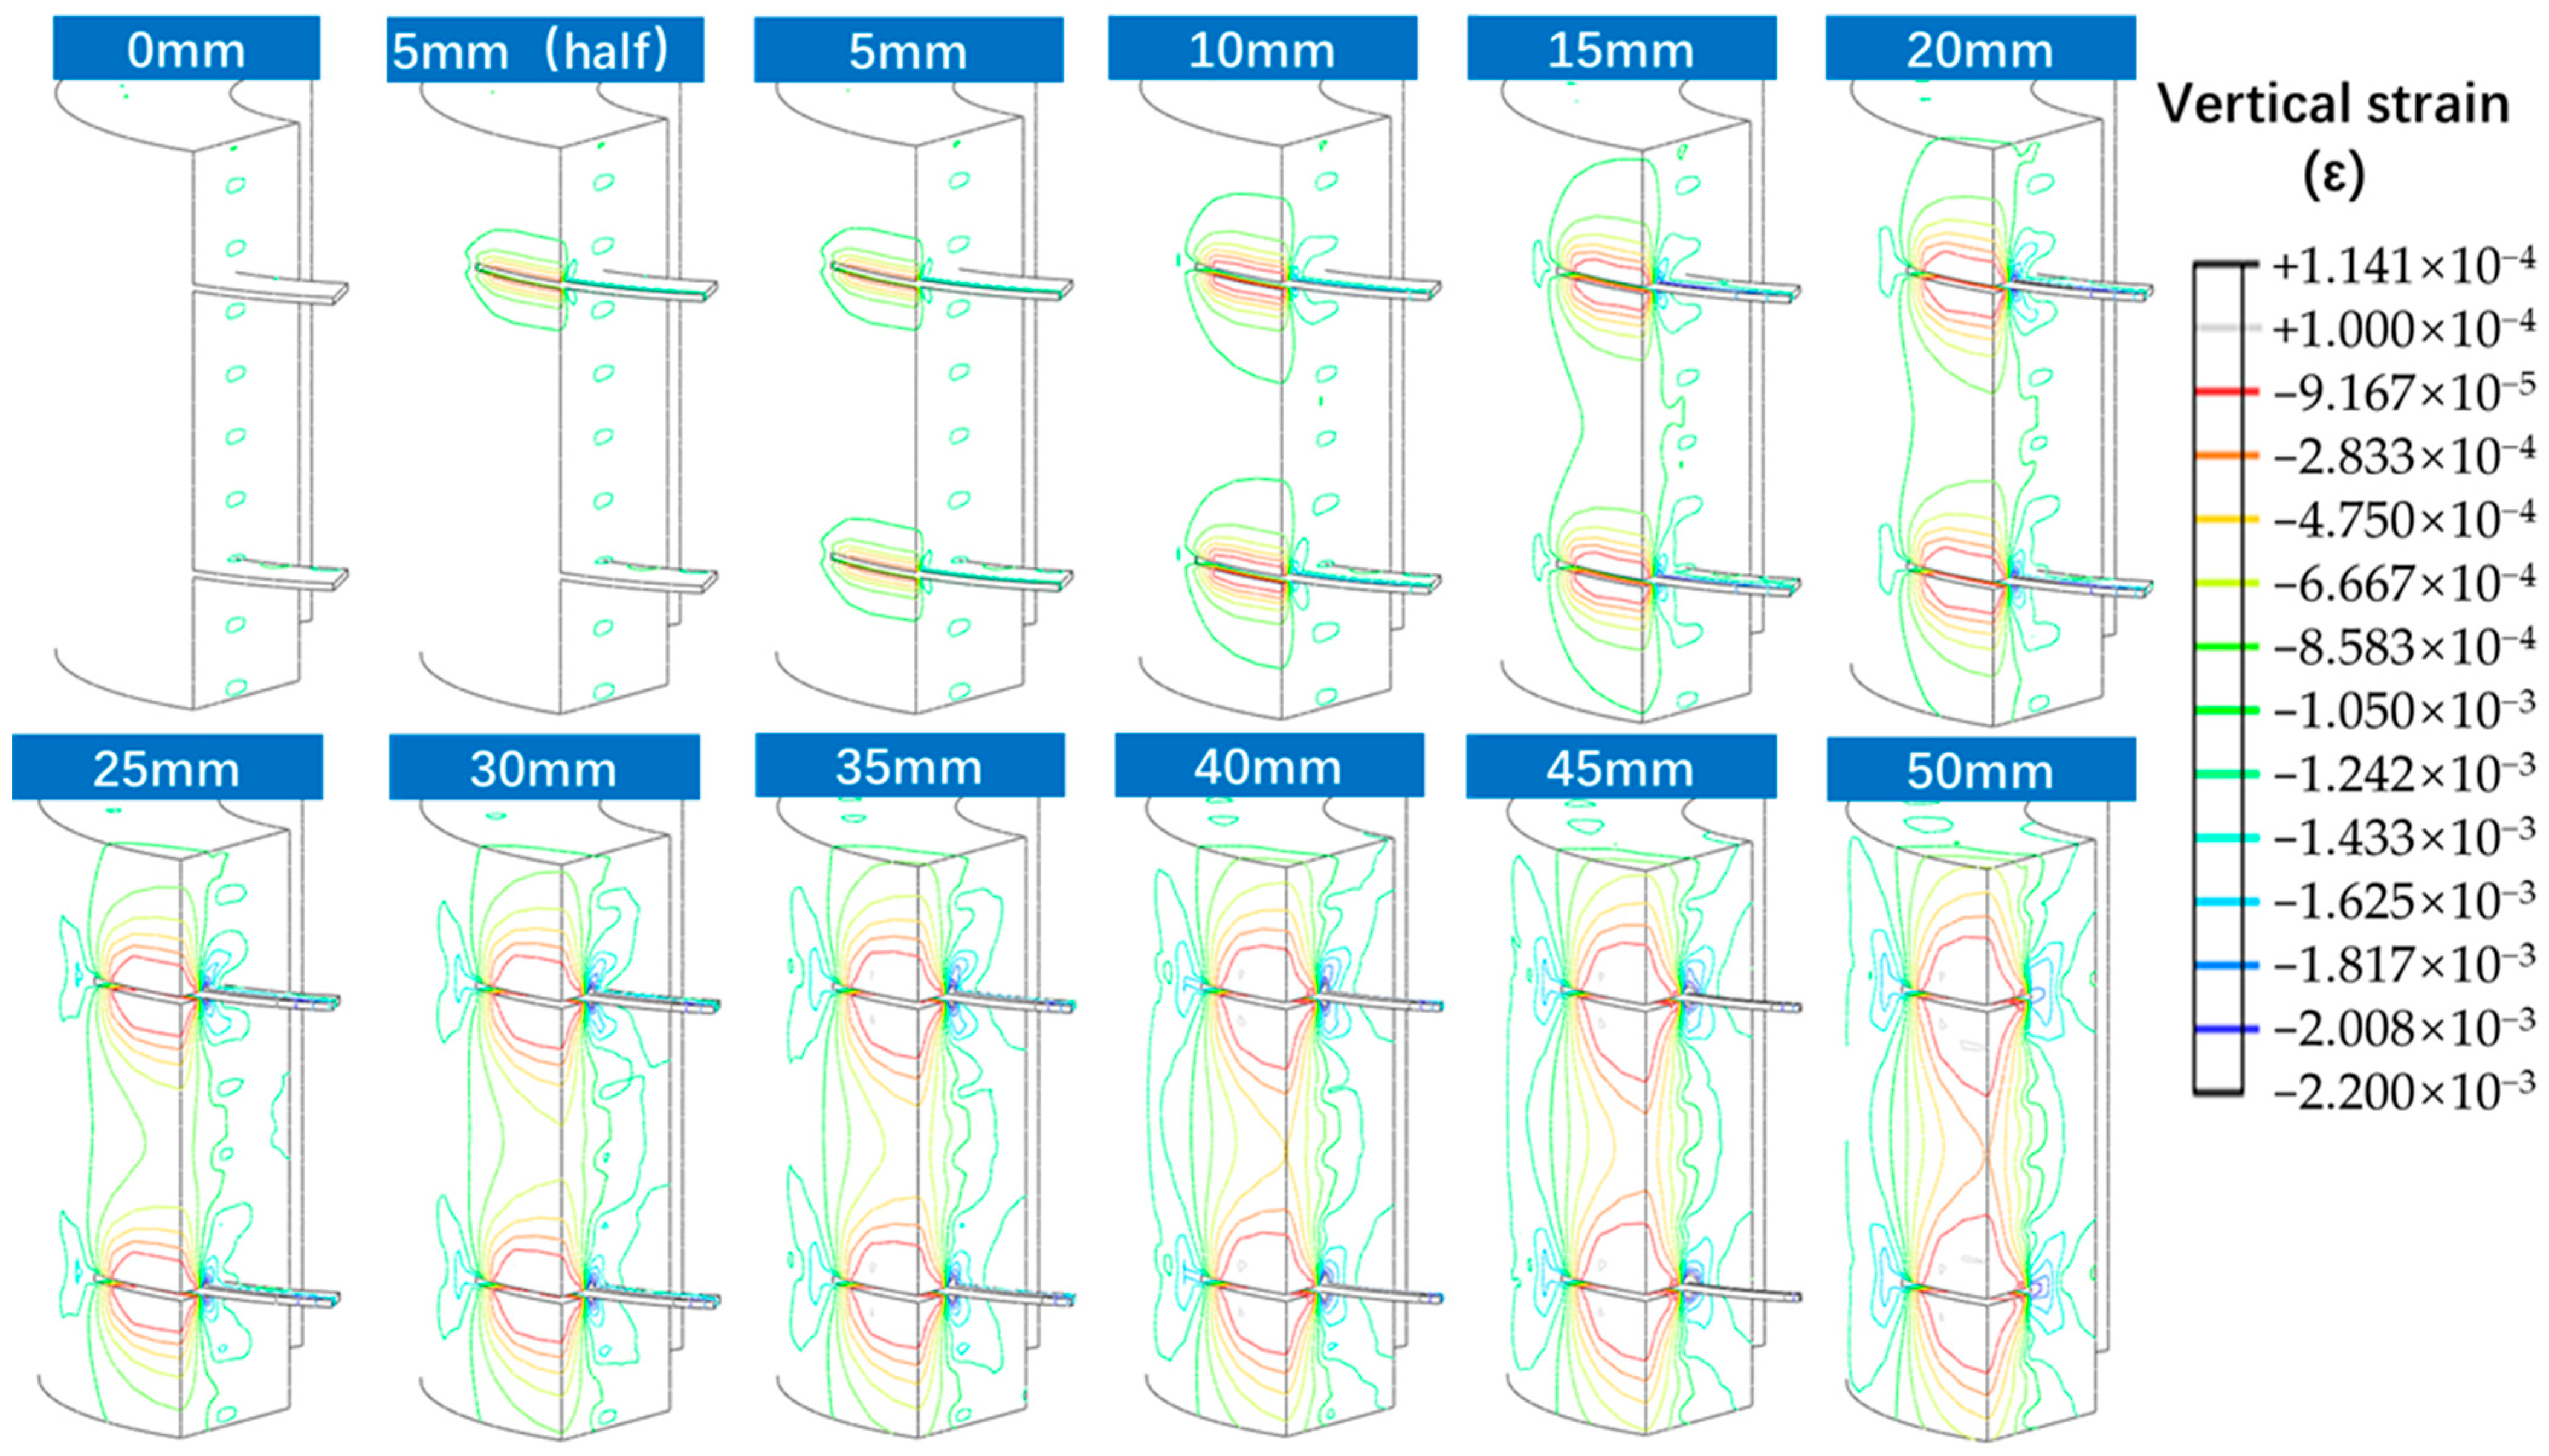
3.2. Analysis of Numerical Simulation Results

The numerical analysis parameters include the slotting depth, slotting width, slot width, slotting spacing, longitudinal prestressing size, and pile top load size. The control model were set as follows: the upper load was 2000 kN, the slotting width was 200 mm, the slotting spacing was 200 mm, and the slot width was 5 mm.
Figure 13 shows a typical contour diagram of concrete strain development during slotting of the control model pile. The blue labels represent the depth of slotting, and the cloud diagram shows the vertical strain variation of the pile body during slotting. From the figure, there is a certain regularity in the strain change of the model pile during slotting. The vertical strain of the pile unit is very uniform without slotting, and there are only some differences around the reinforcement. When the concrete region of the model pile is slotted, the strain value near the slotted area changes and the pile stress is released. With the increase of the slotting depth, the area affected by the concrete strain release gradually increases, in which the strain change in the vertical area is right in the slotted position. The strain change in the vertical area in the middle of the slotted area is the greatest; comparing the 5 mm upper slotted area with the 5 mm upper and lower slotted area, it can be found that the simultaneous slotting of the upper and lower area causes further stress release around the first slot (strain contours are expanded). The strain contours are densest at the depth where the longitudinal reinforcement is located (50 mm), i.e., the strain in the concrete changes intensely and steeply near the development to the reinforcement, which indicates that the pre-compressive stress of the prestressing longitudinal reinforcement on the concrete plays a role in restraining the strain release process of the concrete.
Figure 14 shows the strain diagrams of the reinforcement after trenching of the control pile, and all the reinforcement in the figure is compressive strain. From the figure, the strain in the stress-release measurement area changes significantly, with a minimum strain of 72.99 με. Meanwhile, the strain in other areas not affected by the stress release is approximately 630.6 με. This indicates that the stress released by the concrete is transmitted to the reinforcement, and at the same time, the reinforcement acts as a convergence inhibitor against the stress release of the concrete.

3.3. Analysis of the Effect of Each Parameter on the Stress Release Rate

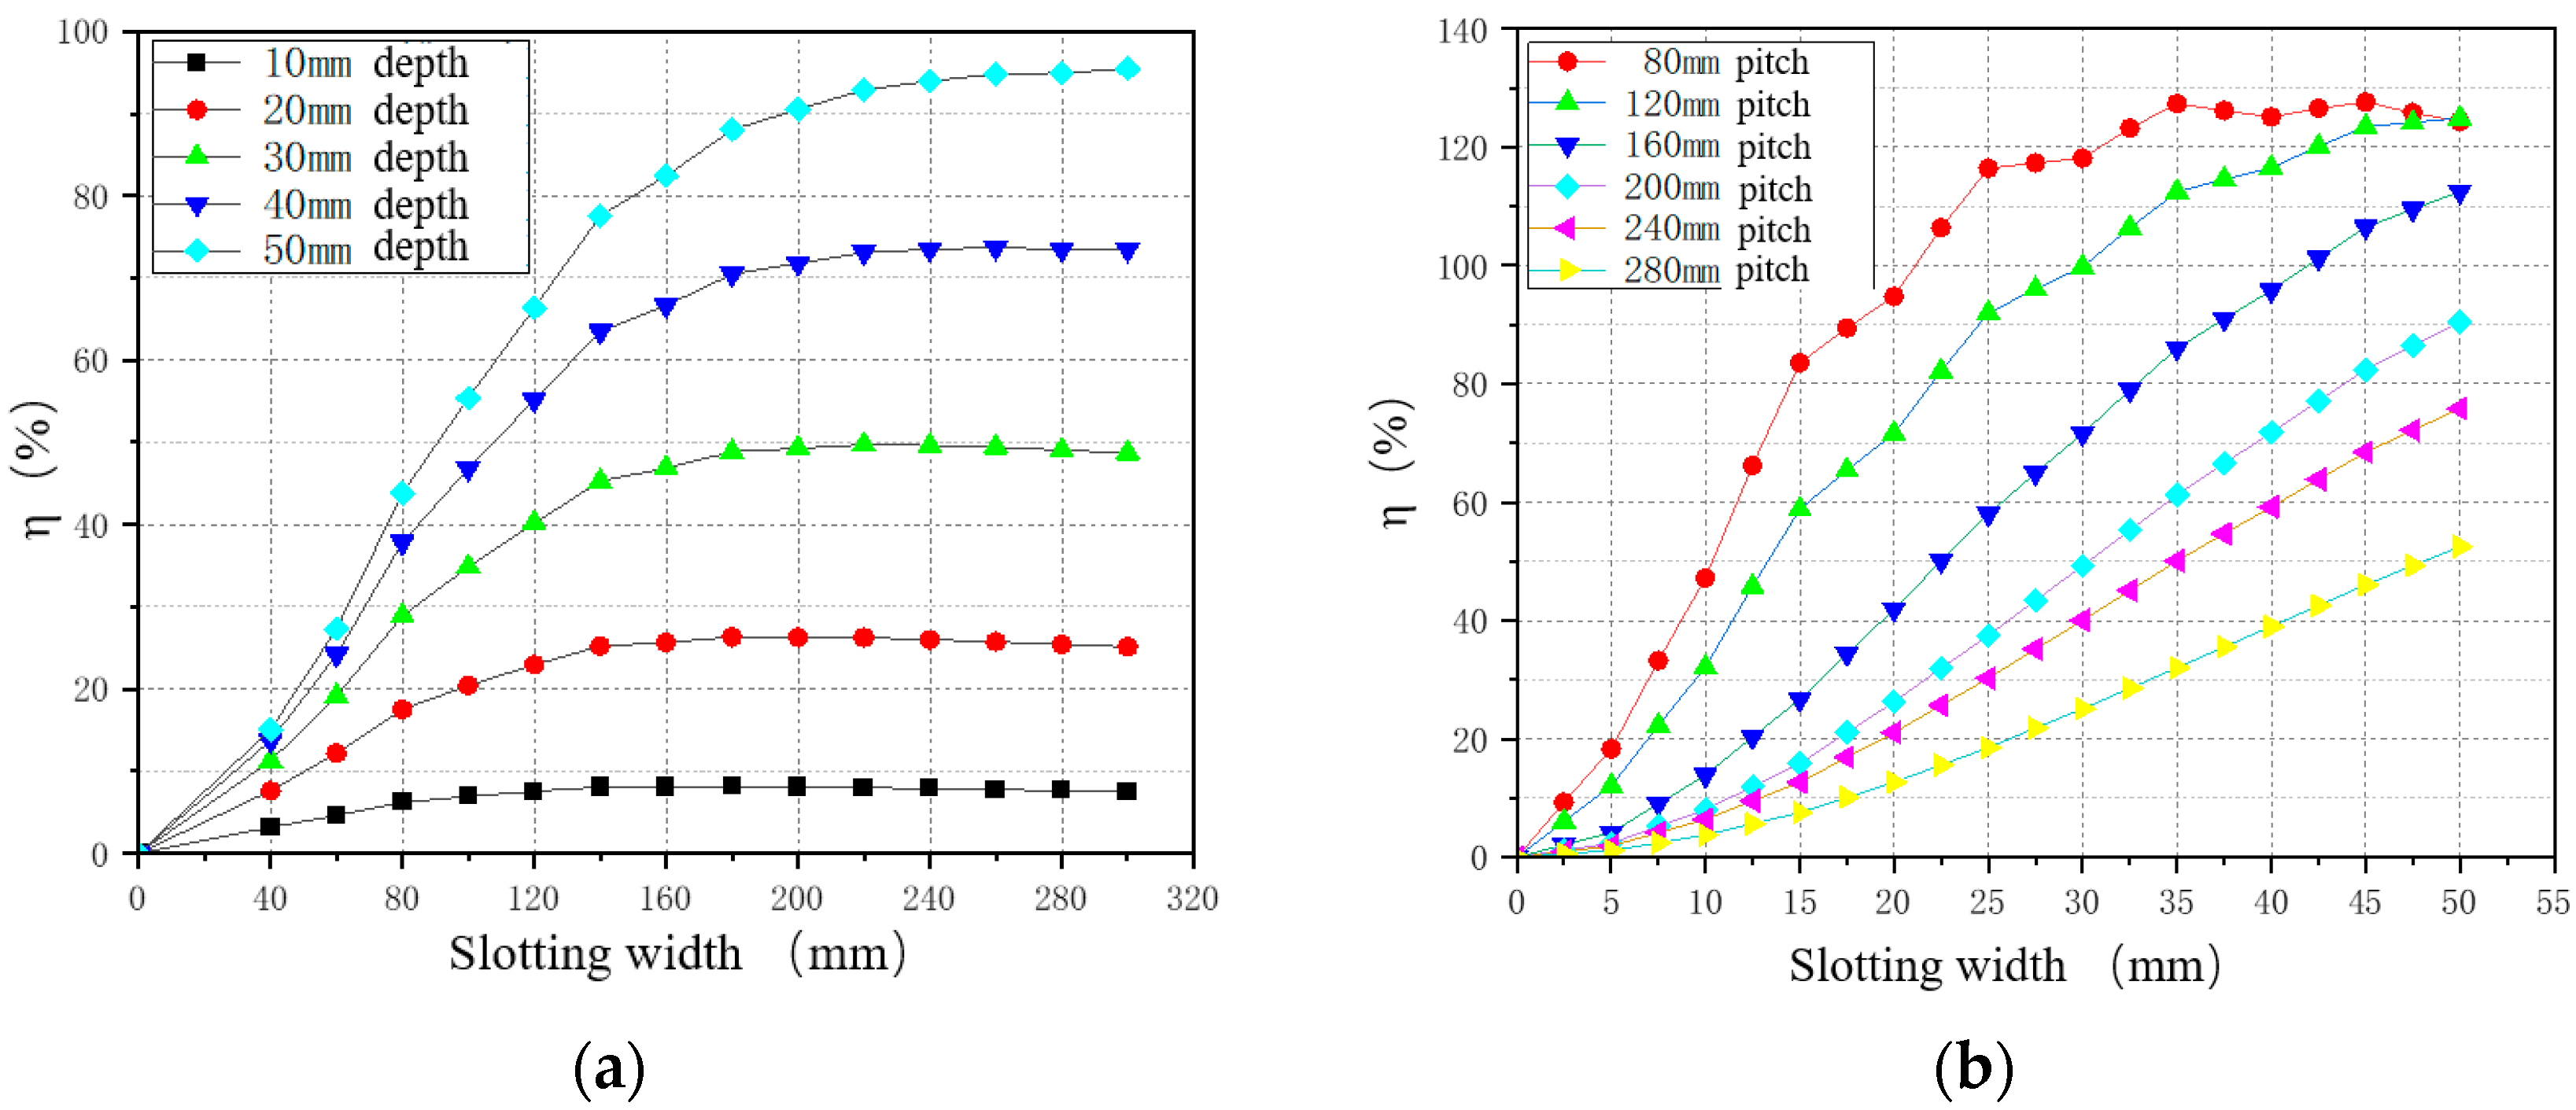
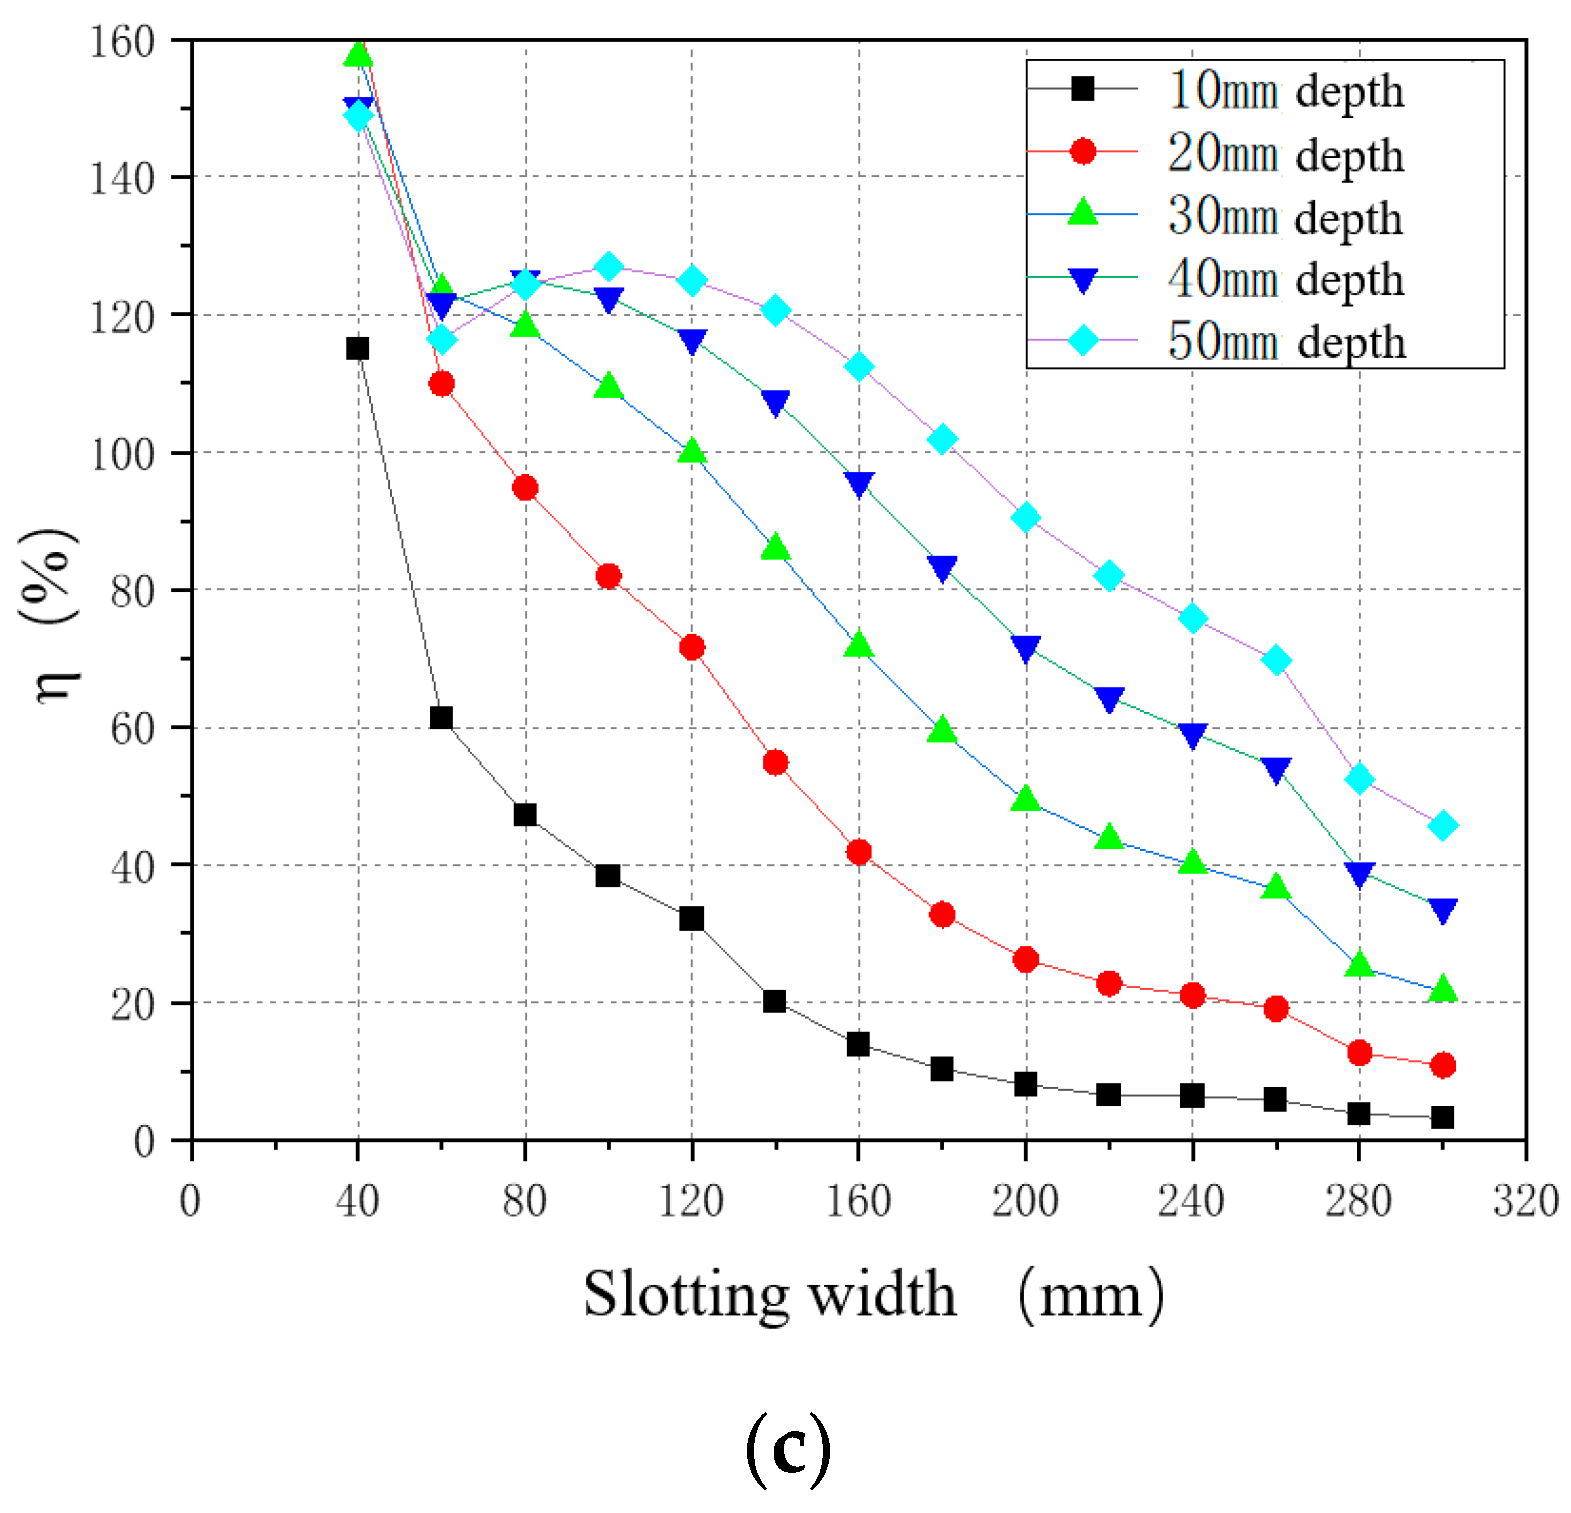
3.3.1. Effect of Slotting Characteristics on the Stress Release Rate

The slotting dimension parameters for the stress release process include the slotting width, depth, length, and spacing. Figure 15 shows the relationship between the stress release rate and each slotting dimension parameter.
Figure 15a shows the graph of the stress release rate with slotting width. When the slotted width is smaller than the slotted spacing, the larger the slotted width is, the higher the stress release rate is. When the slotted width is not smaller than the slotted spacing, the slotted width has no effect on the stress release, which is consistent with the experimental conclusion. In the practical application of the stress release method, setting the slotting width to not less than the slotting spacing can reduce the influence of measurement error.
The relationship between the stress release rate and slotting spacing is more complicated. Figure 15b shows the relationship between the stress release rate and slotting depth under different slotting spacings, and Figure 15c shows the relationship between the stress release rate and slotting spacing under different slotting depths. From the graphs, the stress release rate decreases with increasing slotting spacing, and the change rate varies from high to low, which is consistent with the experimental data.

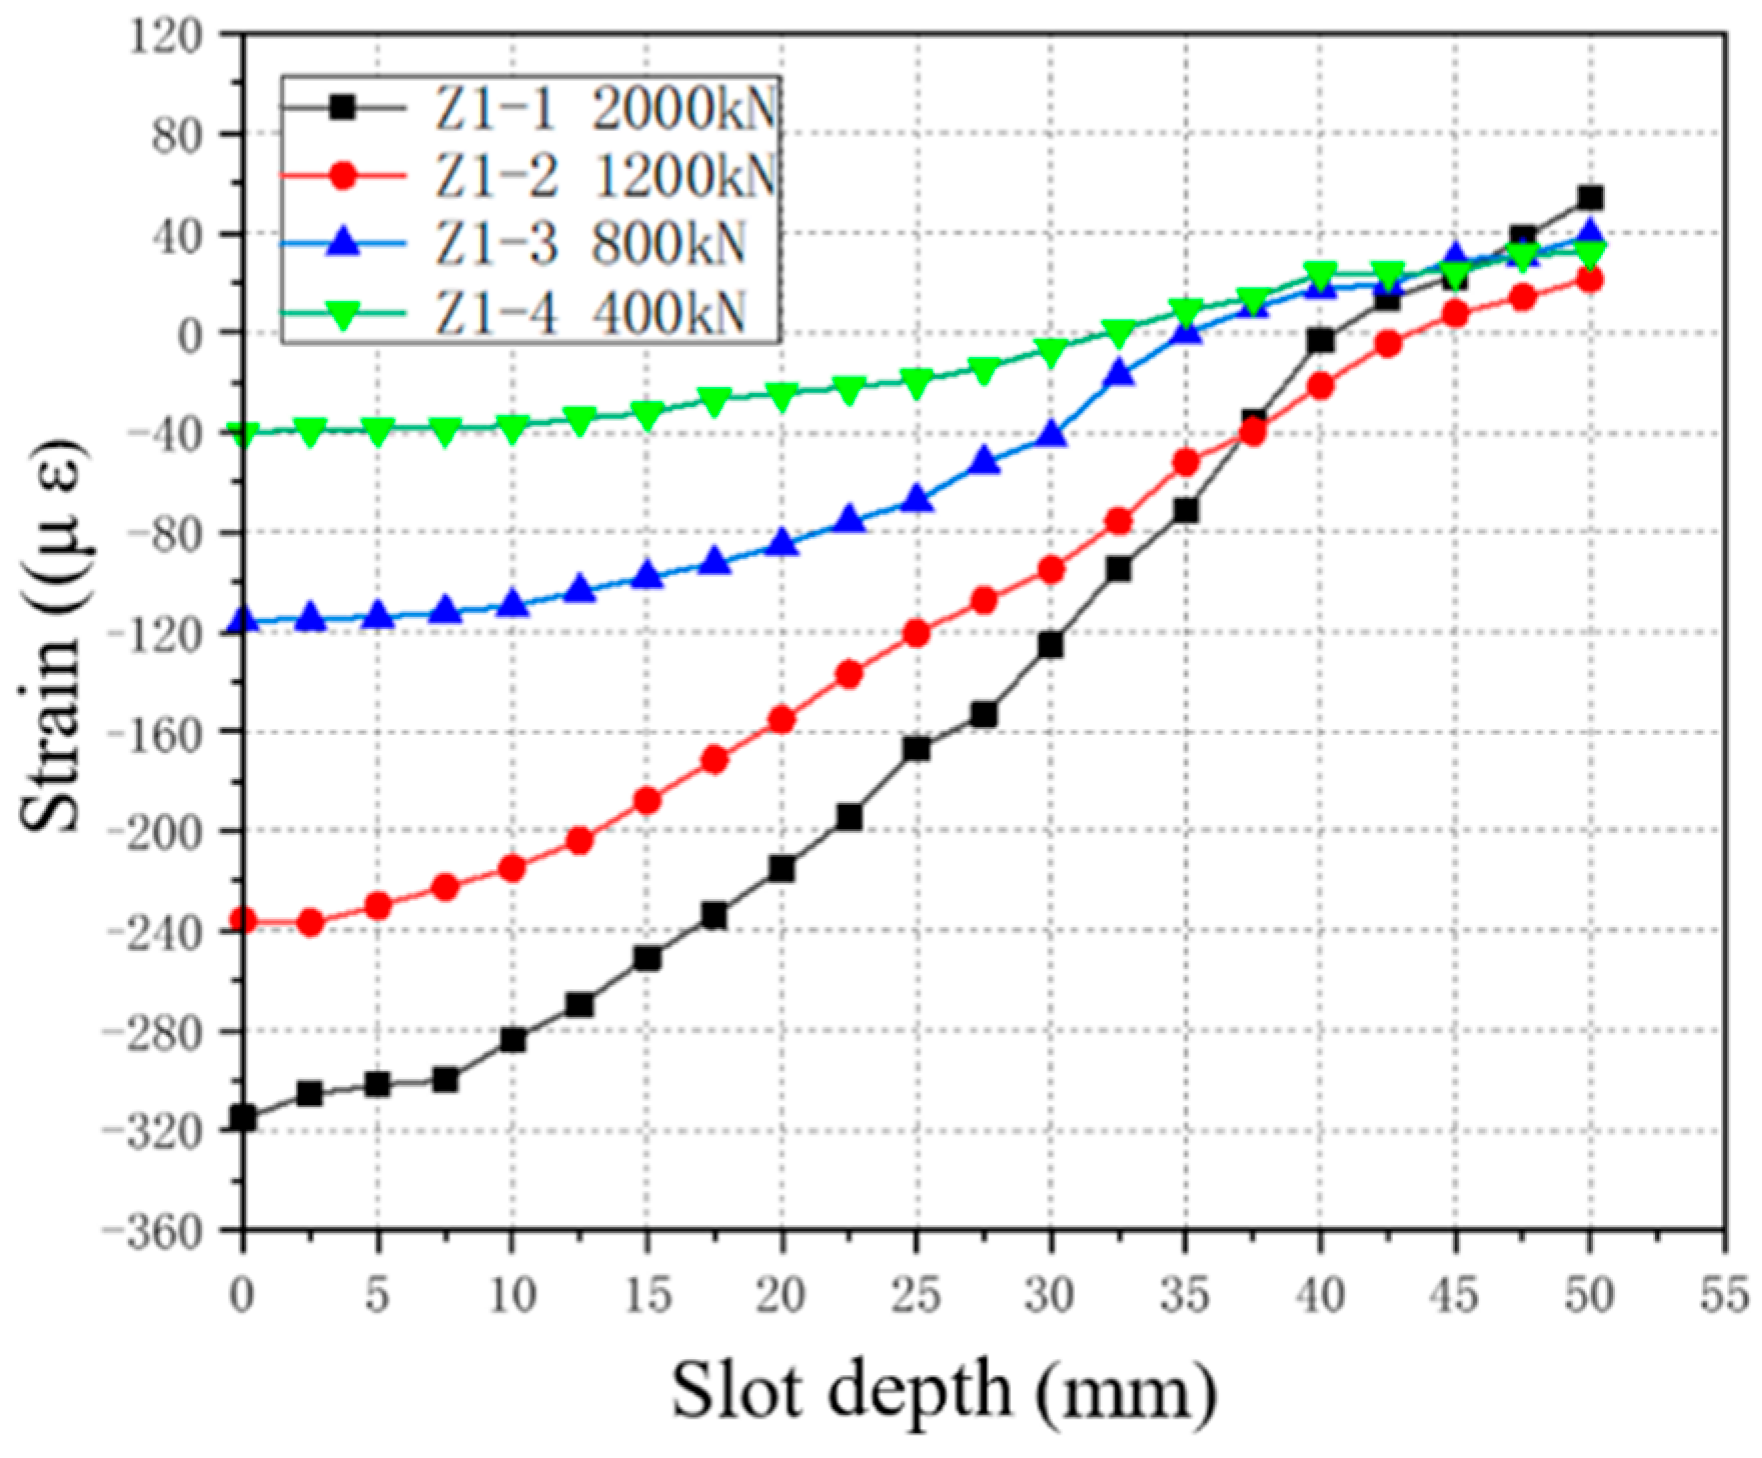
3.3.2. Effect of Load Level on Stress Release Rate

The load parameters of the stress release process include the pile top load and the magnitude of the longitudinal prestress. Figure 16 shows the graph of the relationship between the stress release rate and the load parameters.
The relationship between the stress release rate and the pile top load is shown in Figure 16a. All the curves in the figure demonstrate the law that the stress release rate decreases slightly with increasing pile top load and eventually levels off. The relationship between the stress release rate and prestressing force is shown in Figure 16b, where the stress release rate increases linearly with the increase in the prestressing force of the longitudinal bars.

4. Stress Release Rate Prediction Model

4.1. Regression Analysis Based on Numerical Model Data

Multivariate data regression was performed on 1042 data sets using Origin software, and the prediction model equation of stress release rate applicable to PHC500(125)-AB precast pile was established. Since the pile size and reinforcement ratios are kept constant in the regression analysis, the prediction model is only applicable to PHC500(125)-AB precast pile theoretically. However, the authors think that the effect of pile size can be neglectable if the size of the slots is far less than that of the pile. In addition, the reinforcement ratio of the piles is not very high (about 0.7%) and may not affect the stress release rate significantly when the loaded pile is still in the elastic stage. Therefore, the prediction model can be also applicable to the piles whose sizes are larger than PHC500(125)-AB and reinforcement ratios are not very high, if the piles are still at elastic stage. The specific prediction model is shown in the following equation.
η = A 4500 + 0.978 × [ 300.867 · e d y d x 5.702 308.16 ]
where η is the prediction of the stress release rate based on the finite element model.
  • A is the magnitude of the prestress in the longitudinal reinforcement, MPa.
  • d is the depth of slotting by the stress release method, mm.
  • x is the slotted width of the stress release method, mm.
  • y is the stress release method slotting spacing, mm.

4.2. Model Correction Based on Experimental Data

Some of the test data were selected to make coefficient corrections to the prediction model equations. The correction effect can be seen in schematic Figure 17, and the modified stress release rate prediction model is as follows.
η = 1.381 × A 4500 + 0.978 × [ 300.867 e d y + d x 5.702 308.16 ]  
where η is the predicted result of the modified stress release rate.

4.3. Error Analysis

Figure 18 shows the error diagram between the experimental and predicted values of the stress release rate. It can be seen that controlling the slotting depth between 25 mm and 40 mm can reduce the error in the measurement and calculation process for the following reasons: when the slotting depth is between 10 mm and 40 mm, the stress release process is in the fast-varying stage, and the stress release rate in the measured area of the pile body is more stable with depth at this stage; when the slotting depth is more than 25 mm, the larger stress release rate can reduce the relative error in the prediction. The relative error of the prediction results can be reduced by the larger change in the stress release rate when the slotting depth exceeds 25 mm.

5. Conclusions

This paper is dedicated to the stress detection of prefabricated pipe piles based on the low-loss slotting method, and the conclusions are as follows.
(1) The stress release method test is conducted for the prefabricated prestressed concrete pipe pile, and the influence of the factors such as the slot spacing, width, depth, and slot type on the stress release method is quantitatively studied. It is found that the slot depth has the greatest influence on the slot results, and the strain of the pile is roughly S-shaped with the change of the slot depth.
(2) ABAQUS was used to establish a 3D solid refined finite element model of prestressed concrete piles. the stress release process under different conditions were simulated with FE model, and the effects of slotting characteristics, load level and material properties on the stress release rate were analyzed.
(3) On the basis of the finite element modeling results of 1042 sets of multiparameter combinations, the quantitative relationships between the factors of slotting width, depth, spacing and prestress level and stress release rate were investigated, and an explicit prediction model of the stress release rate was given by regression analysis using the combined test and simulation data.
(4) The explicit prediction model was verified with the experimental results. It is indicated that the proposed stress detecting method can predict the stress of the structural members with reasonable accuracy, even if the local stress on the member is not completely released. In this case, the stress of a servicing prefabricated prestressed concrete pipe pile can be predicted with low-loss slotting.

Author Contributions

Conceptualization, methodology, writing—original draft preparation, writing—review and editing, J.L.; formal analysis, resources, validation, B.L.; investigation, methodology, writing—original draft preparation, D.C.; writing—review and editing, investigation, funding acquisition, C.W.; writing—review and editing, supervision, H.Z. All authors have read and agreed to the published version of the manuscript.

Funding

This research was funded by the National Natural Science Foundation of China (No. 52108119) and Natural Science Foundation of Jiangsu Province (No. BK20200376).

Data Availability Statement

The data presented in this study are available on request from the corresponding authors.

Conflicts of Interest

The authors declare no conflict of interest.

References

  1. Al-Jeznawi, D.; Jais, I.B.M.; Albusoda, B.S.; Alzabeebee, S.; Keawsawasvong, S.; Khalid, N. Numerical Study of the Seismic Response of Closed-Ended Pipe Pile in Cohesionless Soils. Transp. Infrastruct. Geotechnol. 2023, 10, 1–27. [Google Scholar] [CrossRef]
  2. Xie, F.; Ding, P.; Chen, X.; Zhao, W.; Ji, B. Characteristics of defects in expressway plate bridges based on maintenance data. J. Chongqing Jiaotong Univ. Nat. Sci. 2018, 37, 8–15. (In Chinese) [Google Scholar]
  3. Massoudi, N.; Teffera, W. Non-destructive testing of piles using the low strain integrity method. In Proceedings of the Fifth International Conference on Case Histories in Geotechnical Engineering, New York, NY, USA, 13–17 April 2004; Volume 1. [Google Scholar]
  4. Ramadan, S.; Gaillet, L.; Tessier, C.; Idrissi, H. Detection of stress corrosion cracking of high-strength steel used in prestressed concrete structures by acoustic emission technique. Appl. Surf. Sci. 2008, 254, 2255–2261. [Google Scholar] [CrossRef]
  5. Chen, H.; Nie, X.; Gan, S.; Zhao, Y.; Qiu, H. Interfacial imperfection detection for steel-concrete composite structures using NDT techniques: A state-of-the-art review. Eng. Struct. 2021, 245, 112778. [Google Scholar] [CrossRef]
  6. Xu, S.; Wang, X.; Zhu, R.; Wang, D. Uncertainty Analysis of Inverse Problem of Resistivity Model in Internal Defects Detection of Buildings. Buildings 2022, 12, 622. [Google Scholar] [CrossRef]
  7. Hafiz, A.; Schumacher, T. Monitoring of stresses in concrete using ultrasonic coda wave comparison technique. J. Nondestruct. Eval. 2018, 37, 73. [Google Scholar] [CrossRef]
  8. Teng, S.; Liu, Z.; Li, X. Improved YOLOv3-Based Bridge Surface Defect Detection by Combining High-and Low-Resolution Feature Images. Buildings 2022, 12, 1225. [Google Scholar] [CrossRef]
  9. Sandifer, J.P.; Bowie, G.E. Residual stress by blind-hole method with off-center hole. Exp. Mech. 1978, 18, 173–179. [Google Scholar] [CrossRef]
  10. Jing, Z. Technical Research on Testing Existing Stresses in Prestressed Small Box Girders Using Borehole Stress Release Method; South China University of Technology: Guangzhou, China, 2012. (In Chinese) [Google Scholar]
  11. Zhuang, C.; Zhang, J.; Jiang, H. Review of concrete stress testing technologies. J. Highw. Transp. Res. Dev. 2016, 33, 43–51. (In Chinese) [Google Scholar]
  12. Cao, W.; Li, X.; Tao, M.; Zhou, Z. Vibrations induced by high initial stress release during underground excavations. Tunn. Undergr. Space Technol. 2016, 53, 78–95. (In Chinese) [Google Scholar] [CrossRef]
  13. Abdel-Jaber, H.; Glisic, B. Monitoring of prestressing forces in prestressed concrete structures—An overview. Struct. Control. Health Monit. 2019, 26, e2374. [Google Scholar] [CrossRef] [Green Version]
  14. Taheri, S. A review on five key sensors for monitoring of concrete structures. Constr. Build. Mater. 2019, 204, 492–509. [Google Scholar] [CrossRef]
  15. Liu, Y. Experimental Study on the Working Stress of Concrete Tested by the Annular Hole Method. Master’s Thesis, Zhejiang University, Hangzhou, China, 2006. (In Chinese). [Google Scholar]
  16. Kral’ovanec, J.; Moravčík, M.; Bujňáková, P.; Jošt, J. Indirect determination of residual prestressing force in post-tensioned concrete beam. Materials 2021, 14, 1338. [Google Scholar] [CrossRef] [PubMed]
  17. Kral’ovanec, J.; Moravčík, M.; Koteš, P. Parametric Study of Saw-Cut Method. In Proceedings of the International Conference on Russian-Polish-Slovak Seminar Theoretical Foundation of Civil Engineering, Moscow, Russia, 13–18 September 2021; pp. 10–19. [Google Scholar]
  18. Cárdenas-García, J.F. The hole drilling method in photoelasticity application of an optimisation approach. Strain 2000, 36, 9–15. [Google Scholar] [CrossRef]
  19. Luo, J. Further Research on the Detection of Existing Stresses in Prestressed Small Box Girders Based on the Borehole Stress Relief Method. Master’s Thesis, South China University of Technology, Guangzhou, China, 2013. (In Chinese). [Google Scholar]
  20. Kusák, I.; Lunak, M.; Chobola, Z. Non-Destructive Tracking of Structural Changes of Concrete Mixtures during Thermal Stress. Appl. Mech. Mater. 2014, 617, 152–155. [Google Scholar] [CrossRef]
  21. Zhang, K.; Zhang, J.; Jin, W.; Mao, J.; Long, J. Stiffness degradation for fatigue of reinforced concrete beams after electrochemical rehabilitation. Constr. Build. Mater. 2020, 260, 120455. [Google Scholar] [CrossRef]
  22. Ma, J.; Andrus, P.; Condoor, S.; Lei, S. Numerical investigation of effects of cutting conditions and cooling schemes on tool performance in up milling of Ti-6AL-4V alloy. Int. J. Adv. Manuf. Technol. 2015, 78, 361–383. [Google Scholar] [CrossRef]
Figure 1. Schematic diagram of stress release.
Buildings 13 00648 g001
Figure 2. Structural reinforcement of pipe pile. This test aims to study the elastic stress release of prestressed concrete pipe piles under working stress conditions. Therefore, the loading force of the specimen is set at 2000 kN, which is 0.42 times the design value of the axial compressive bearing capacity. The test was carried out by hydraulic press for axial loading of the pipe pile without a lateral limit. The stress release process of prestressed concrete pipe piles may be affected by the following factors: load level, slotting characteristics, material properties, etc. A total of eight piles were slotted for stress release in this test, and the parameters included pile top load, concrete strength grade, slotting spacing, slotting width, slotting depth, and slot width.
Buildings 13 00648 g002
Figure 3. Typical relationship of stress release: In legend Zi-j, i represents the component, and j represents the survey area on the component.
Buildings 13 00648 g003
Figure 4. Strain-slotting depth relationship under different loads: The load legend represents the load applied to the corresponding member.
Buildings 13 00648 g004
Figure 5. Slotting width–stress release rate relationship.
Buildings 13 00648 g005
Figure 6. Slot spacing–stress release rate relationship under different loads.
Buildings 13 00648 g006
Figure 7. Strain–time curve of the reinforcement.
Buildings 13 00648 g007
Figure 8. Experimental reality and binocular stereo vision schematic.
Buildings 13 00648 g008
Figure 9. Schematic diagram of the derivation meter distance measurement.
Buildings 13 00648 g009
Figure 10. Strain-slotting depth relationship diagram: (a) #1 measuring area; (b) #2 measuring area; (c) #3 measuring area.
Buildings 13 00648 g010
Figure 11. Schematic diagram of the finite element model: (a) pile body; (b) circumferential hoops; (c) prestressing tendons; (d) overall model.
Buildings 13 00648 g011aBuildings 13 00648 g011b
Figure 12. Schematic diagram of boundary conditions and loads.
Buildings 13 00648 g012
Figure 13. Typical cloud diagram of concrete strain development during slotting: The number in the picture indicates the groove depth.
Buildings 13 00648 g013
Figure 14. Strain diagram of the reinforcement after slotting.
Buildings 13 00648 g014
Figure 15. Stress release rate-slotting characteristics relationship: (a) slotting width; (b) slotting depth; (c) slotting spacing.
Buildings 13 00648 g015aBuildings 13 00648 g015b
Figure 16. Stress release rate-load parameter relationship: (a) Pile top load; (b) Prestress size.
Buildings 13 00648 g016
Figure 17. Schematic diagram of the correction effect.
Buildings 13 00648 g017
Figure 18. Error diagram of prediction results.
Buildings 13 00648 g018
Disclaimer/Publisher’s Note: The statements, opinions and data contained in all publications are solely those of the individual author(s) and contributor(s) and not of MDPI and/or the editor(s). MDPI and/or the editor(s) disclaim responsibility for any injury to people or property resulting from any ideas, methods, instructions or products referred to in the content.

