
Detection and Damage Evaluation of Hinge Joints in Hollow Slab Bridges Based on a Light-Load Field Test

Abstract
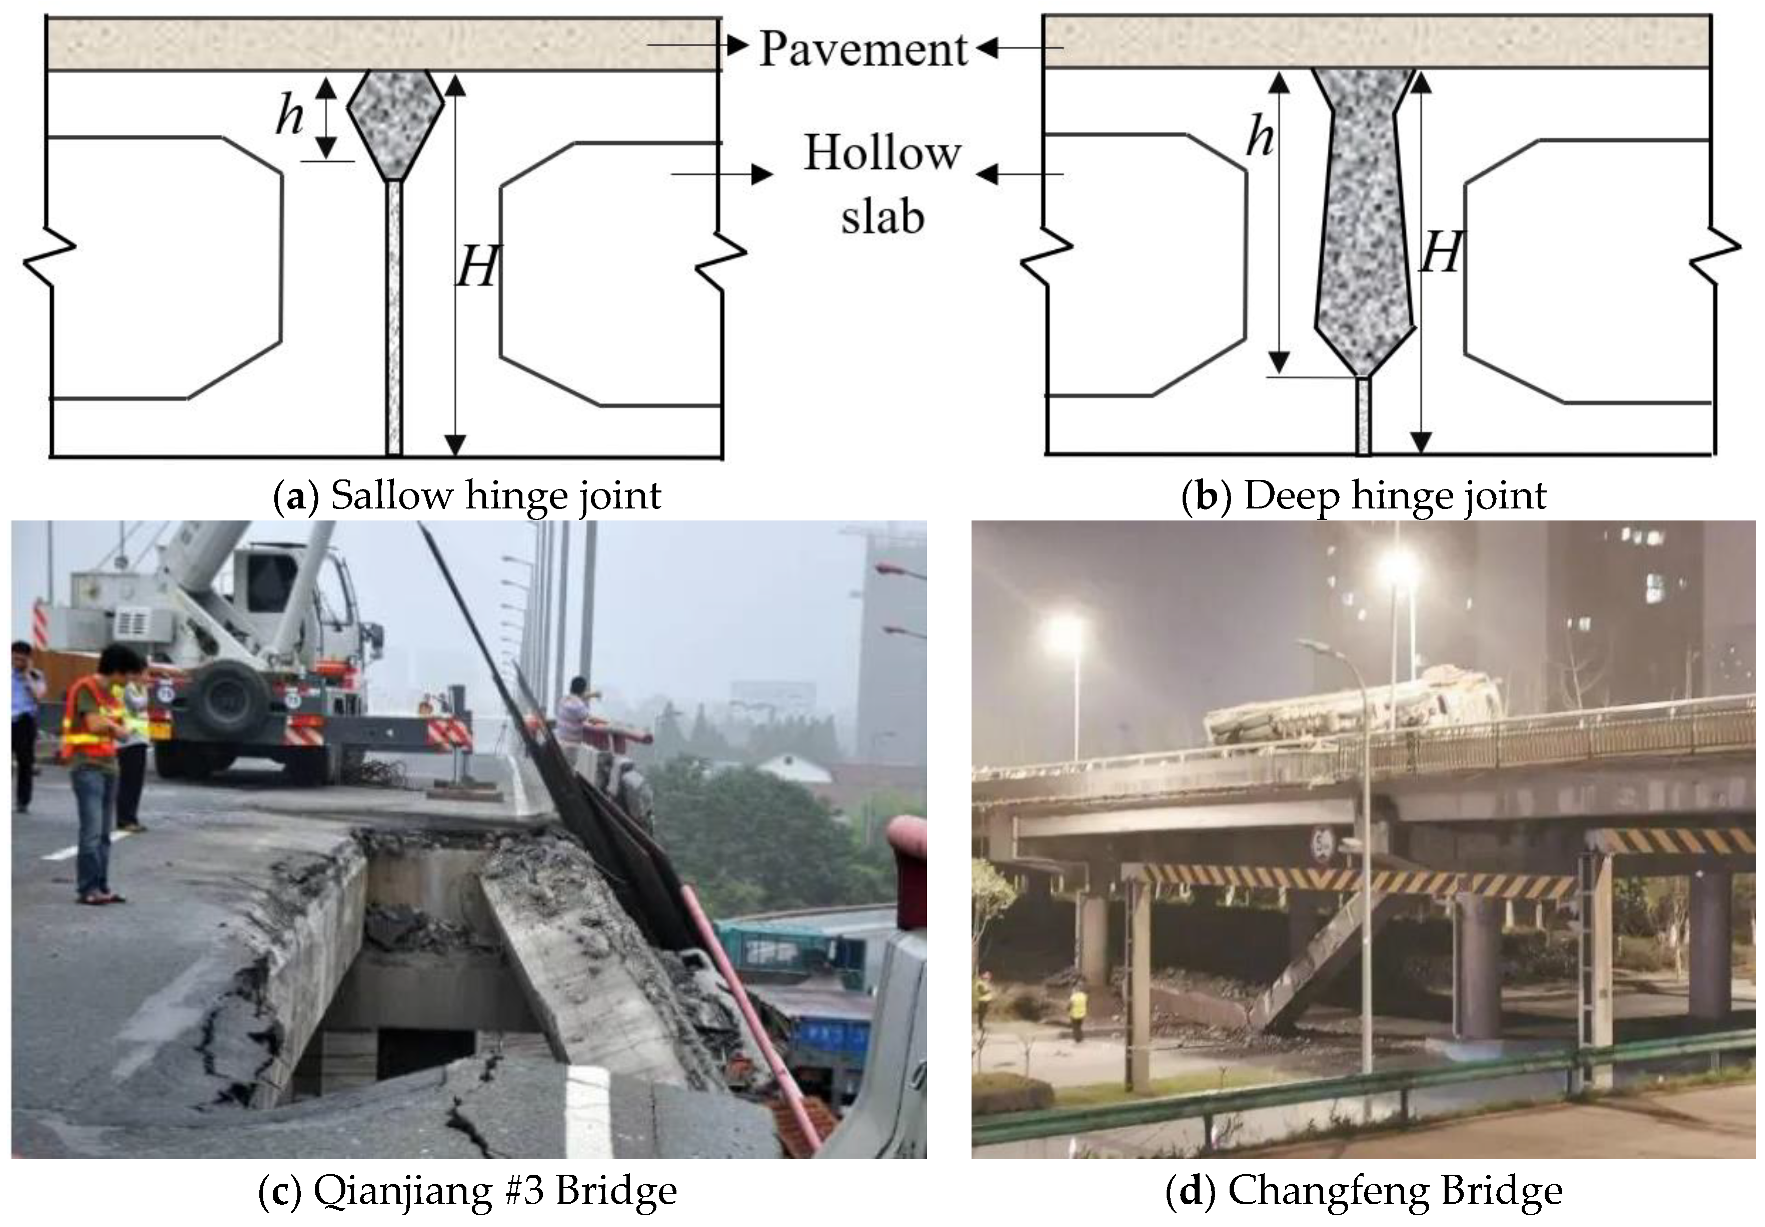
:1. Introduction
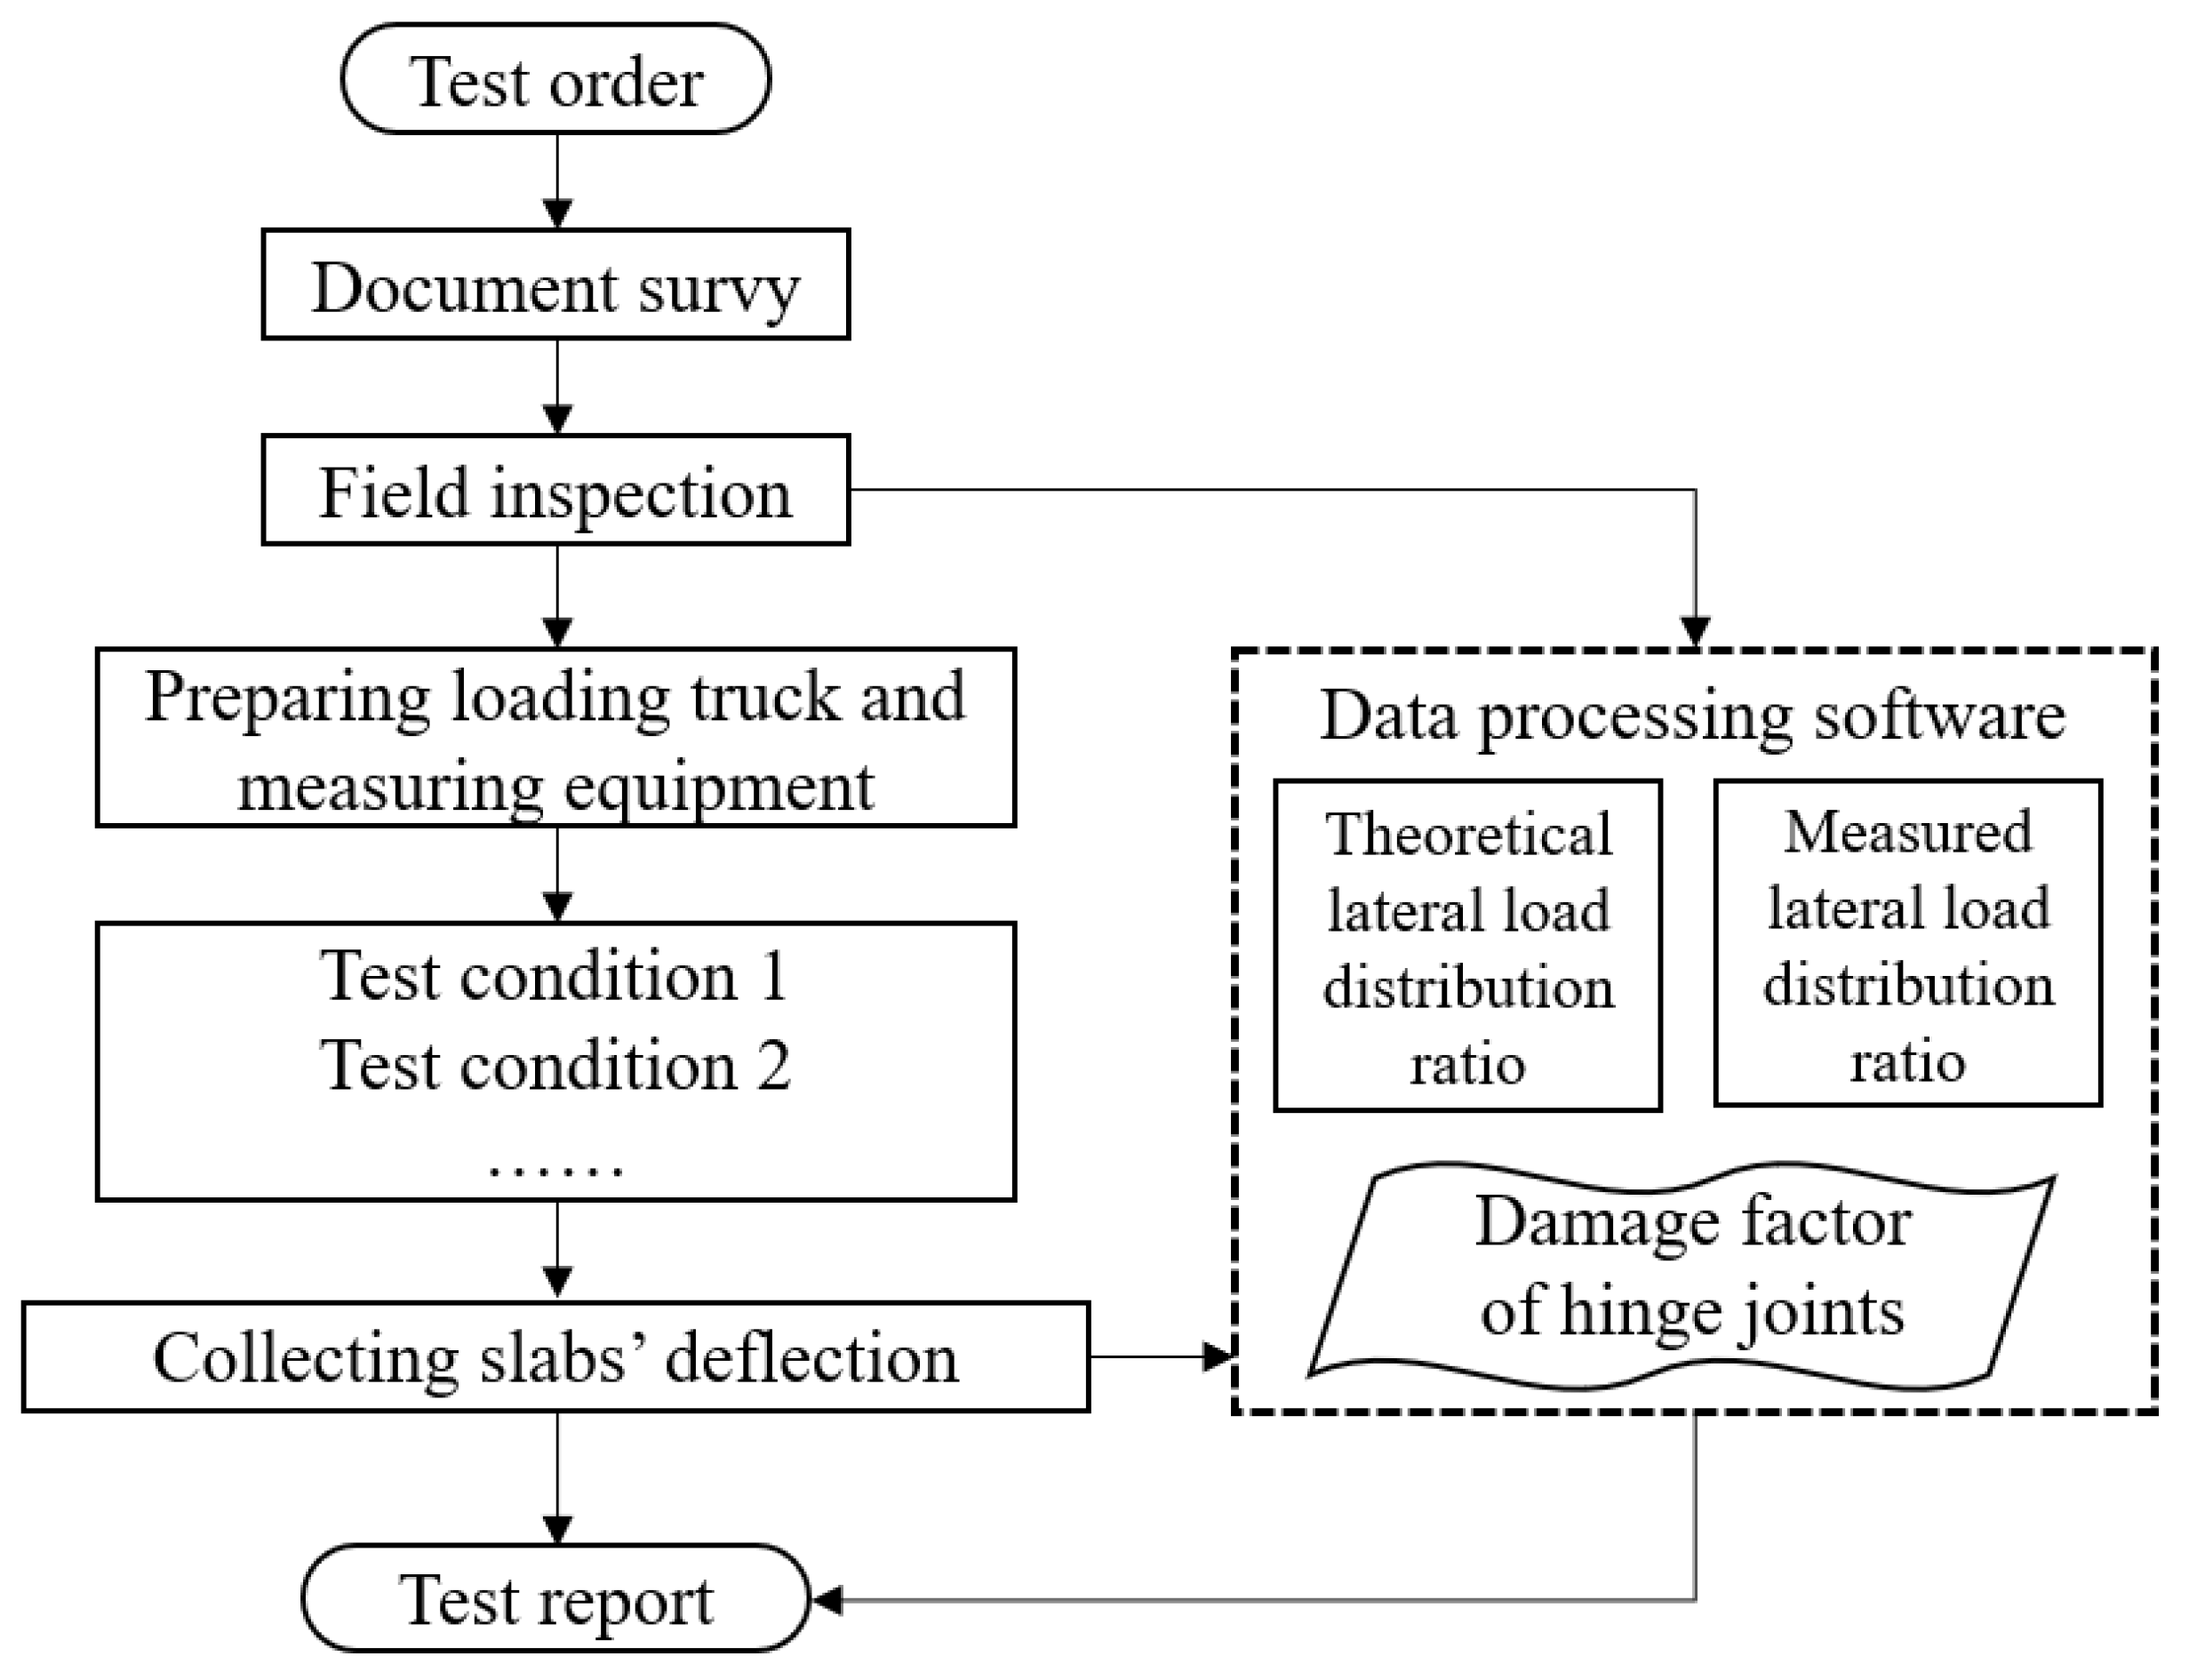
2. Light-Load Field Test
2.1. Principles
- (1)
- The loading truck should be weightier than most moving vehicles, but lighter than the weight limit of the bridge to be tested. Generally, the loading truck should weigh approximately 40 tons.
- (2)
- The loading truck should move forward slowly, with a constant speed, along the center line of the lane. Generally, the loading truck’s speed is suggested to be lower than 30 km/h.
- (3)
- In each test condition, a lane should be ground by the truck in a single test condition, and the data of the mid 7 slabs (or mid 6 hinge joints) below the testing lane deserve analysis. For example, in test Condition 1, the truck is moving in the 1# Lane, the deflections of the #1~#7 slabs are needed for calculating the lateral load distribution ratio. In test Condition 2, the truck is moving in the 2# Lane, the deflections of the #3~#9 or #4~#10 or even #3~#10 slabs are studied. Similarly, in test Condition 3, the truck is moving in the 3# Lane, the deflections of #6~#12 slabs are studied.
- (4)
- Dynamic deflection measurement is needed, and the precision should be 0.01 mm.
- (5)
- To avoid redundant data, it is better to implement the light-load field test under light traffic volume or at night.
2.2. Procedures
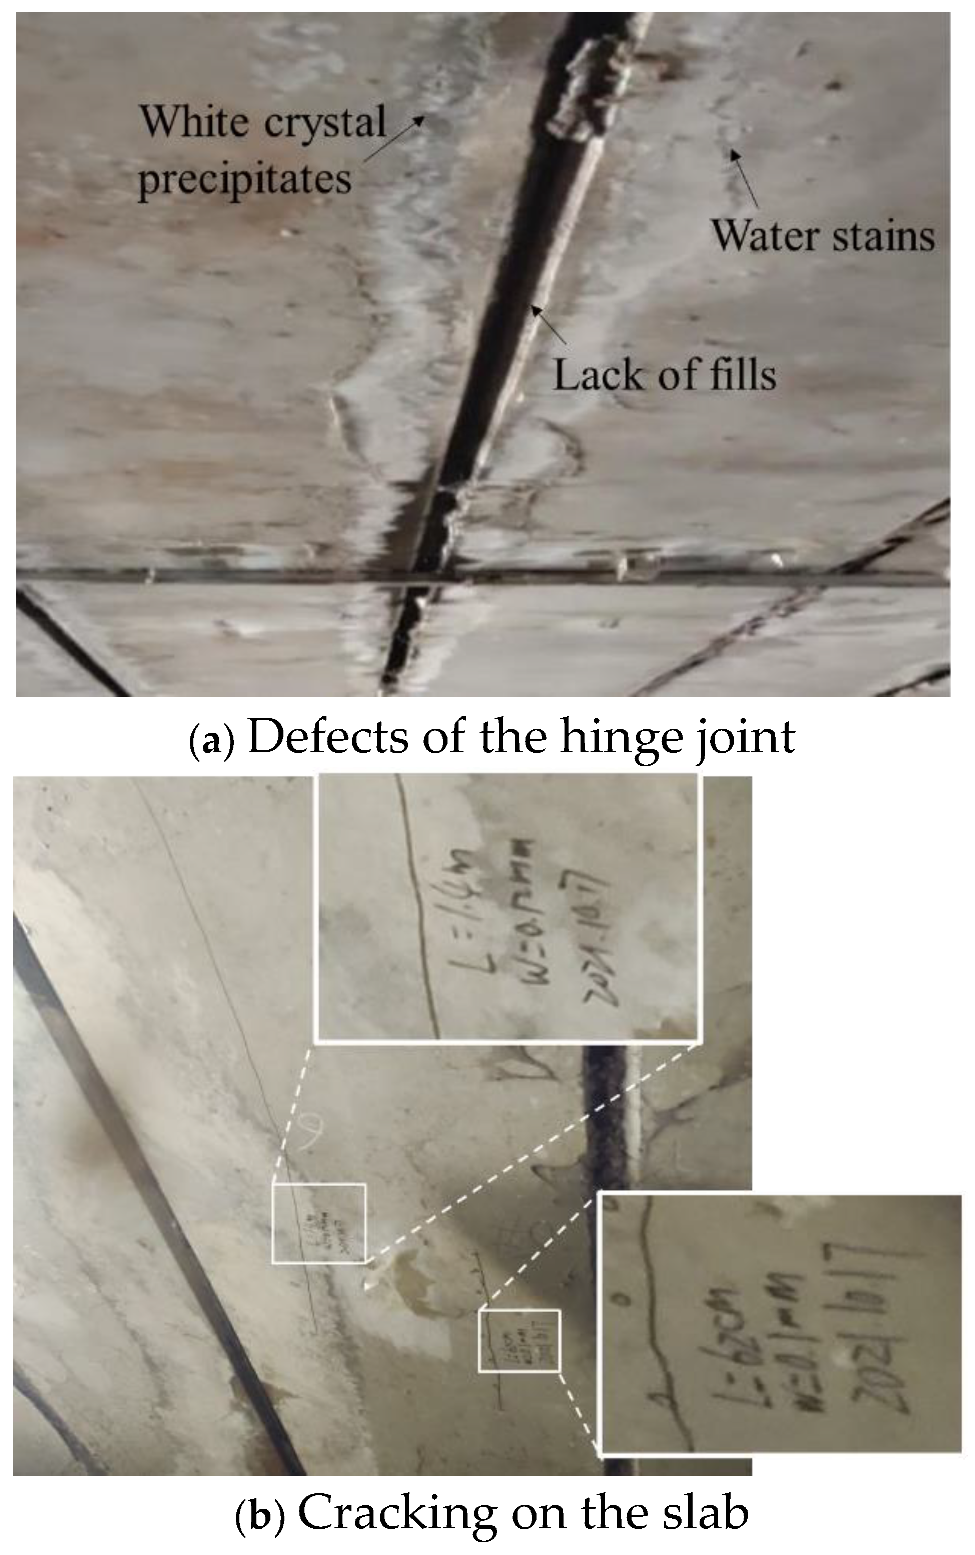
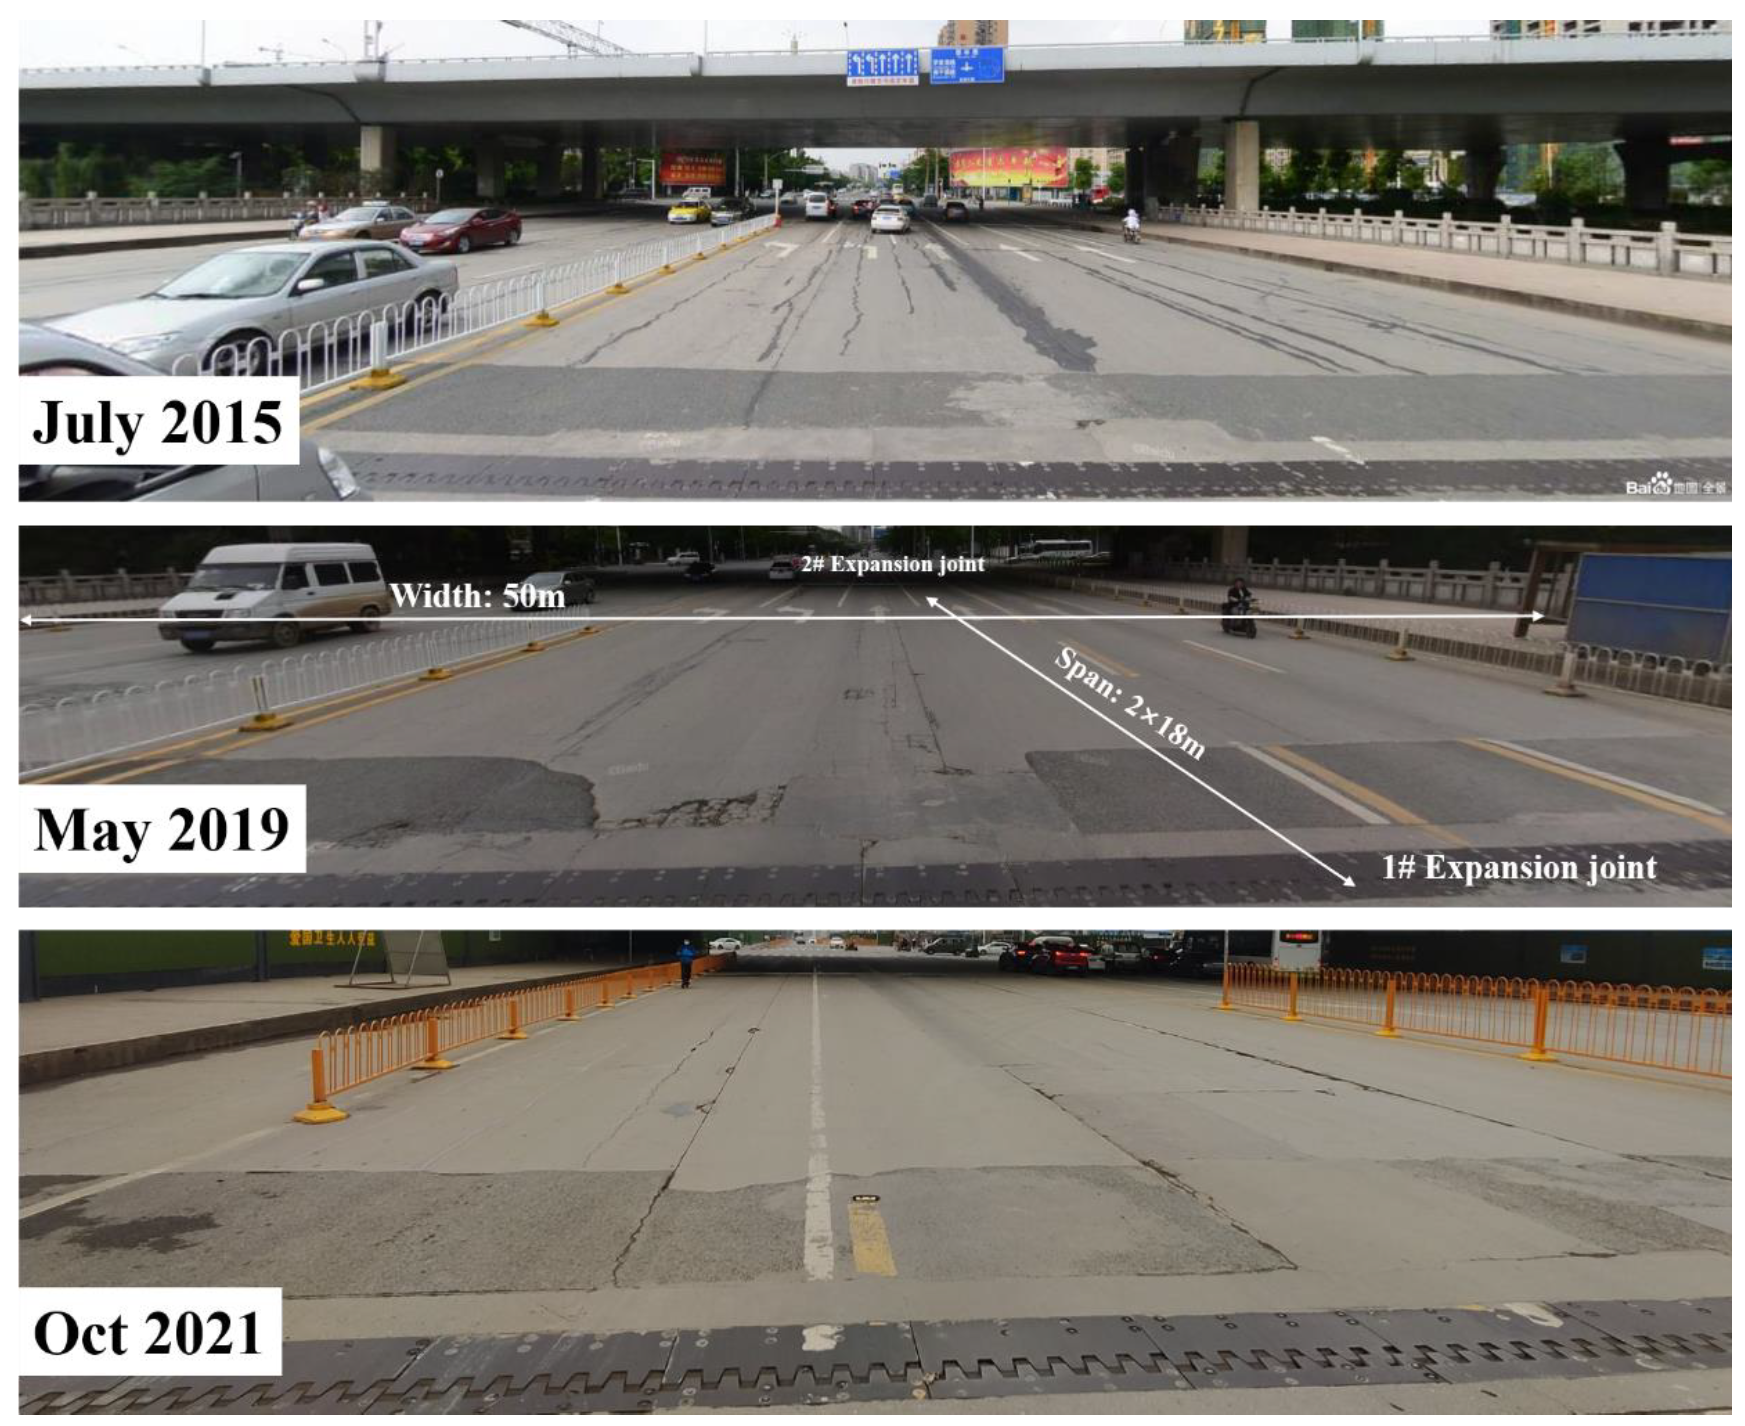
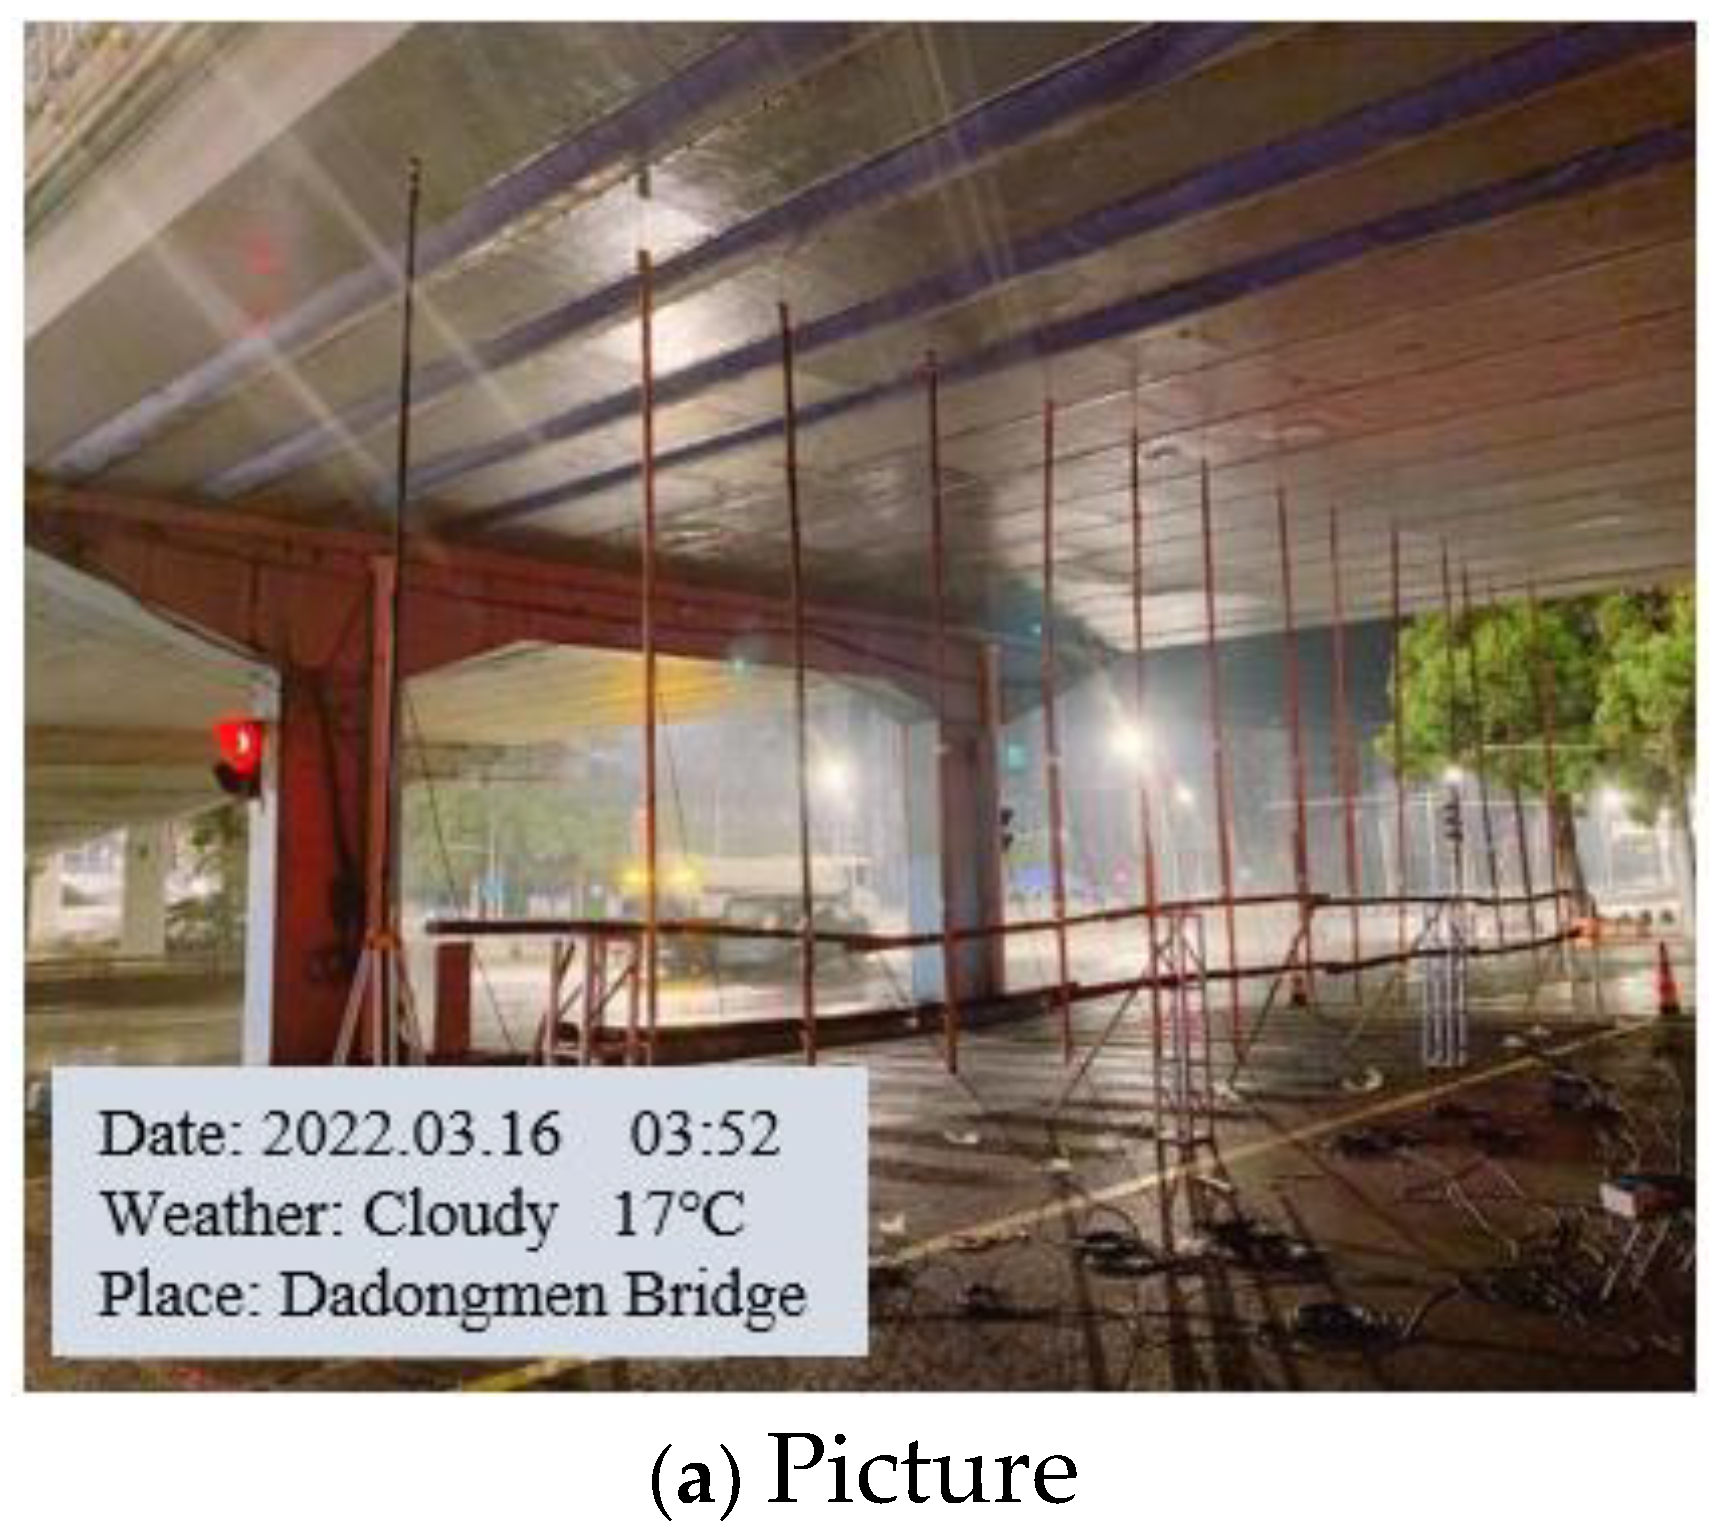
2.3. Bridge Samples
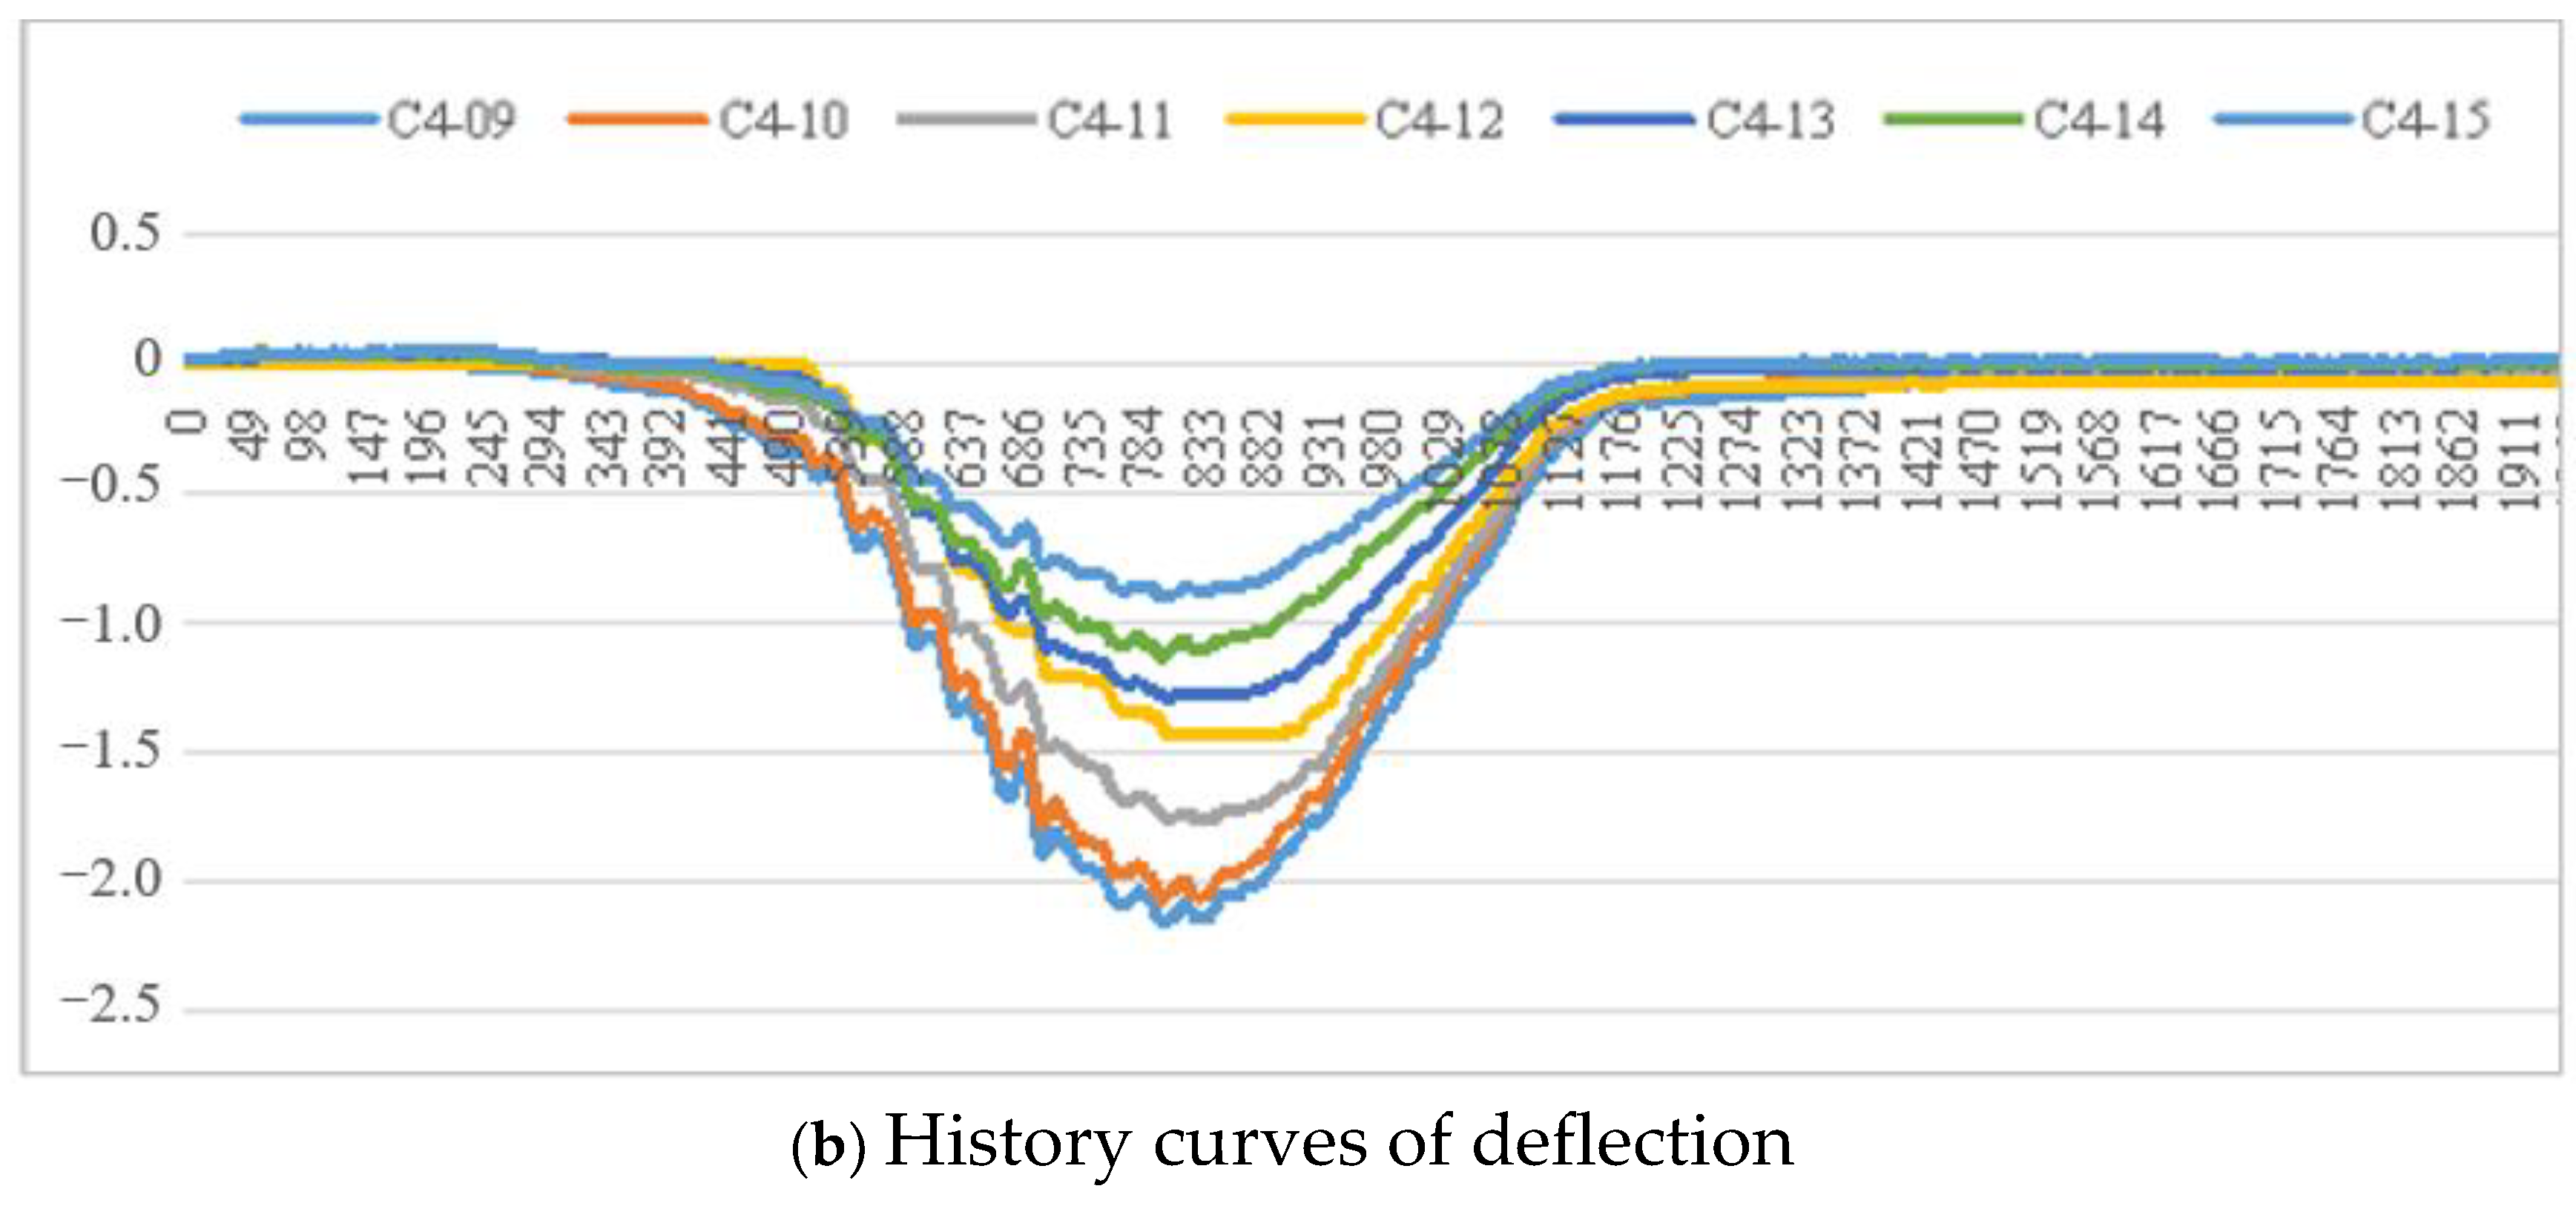
2.4. Test Results
3. Damage Evaluation of Hinge Joints
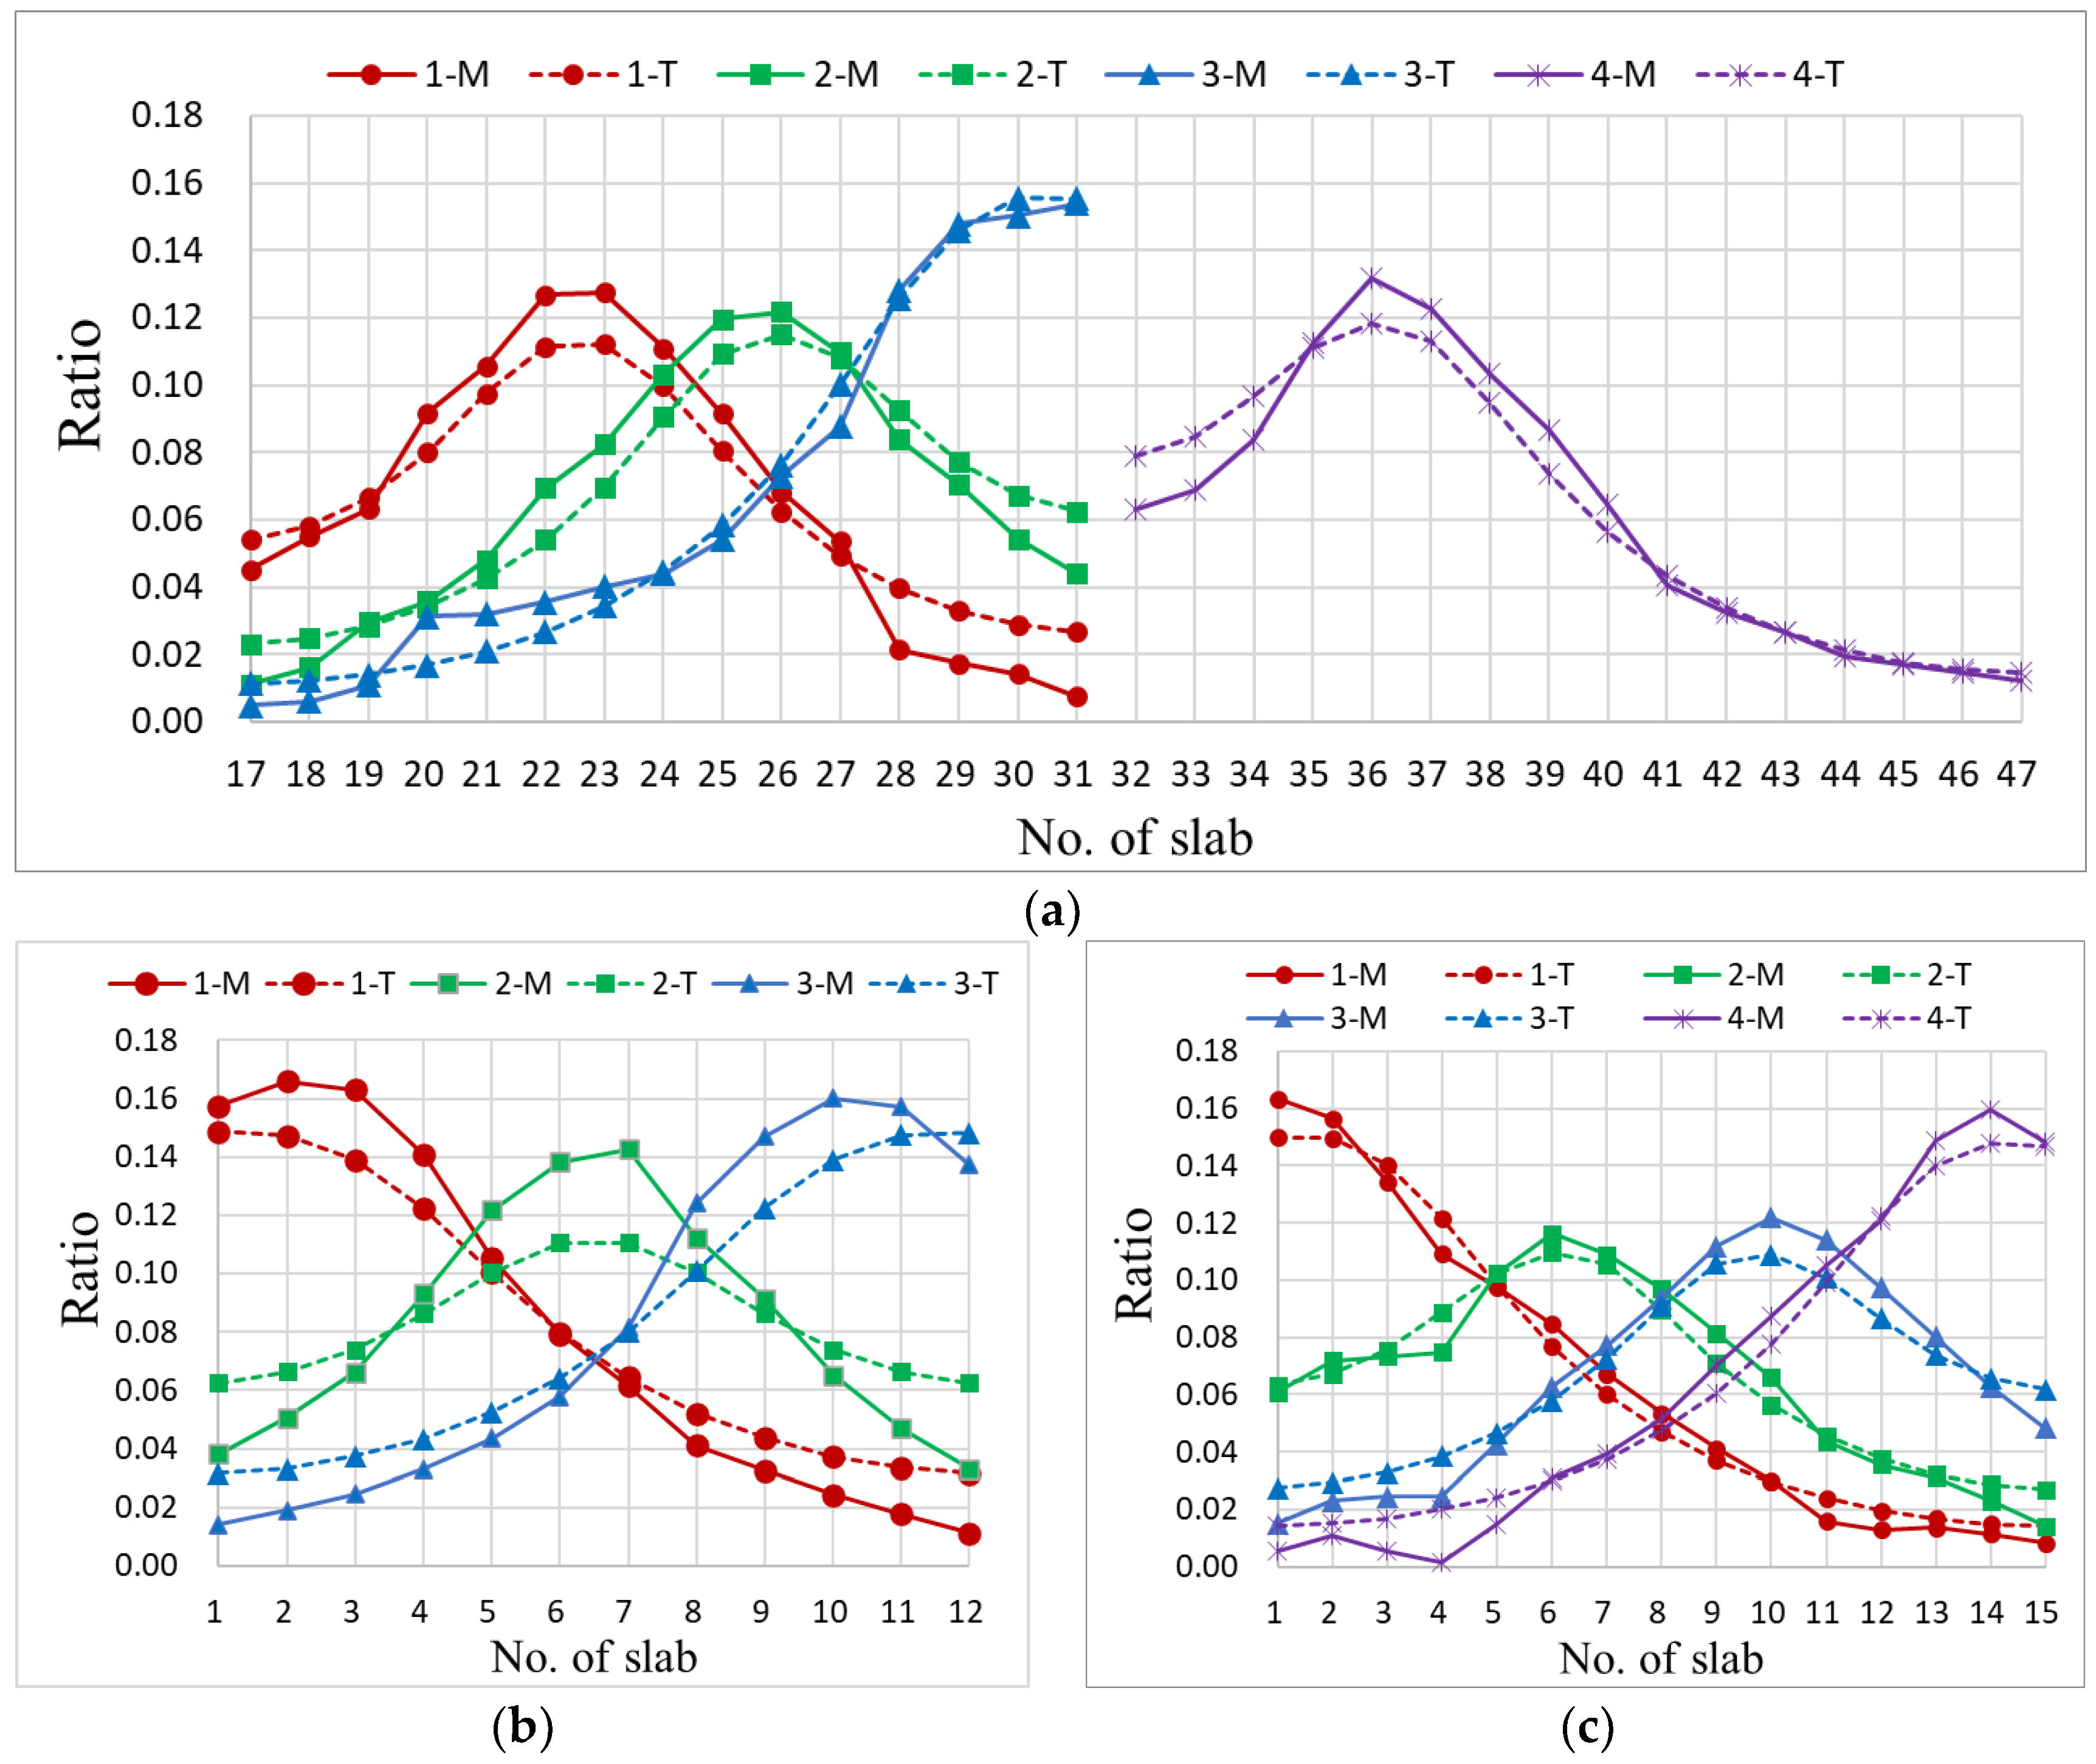
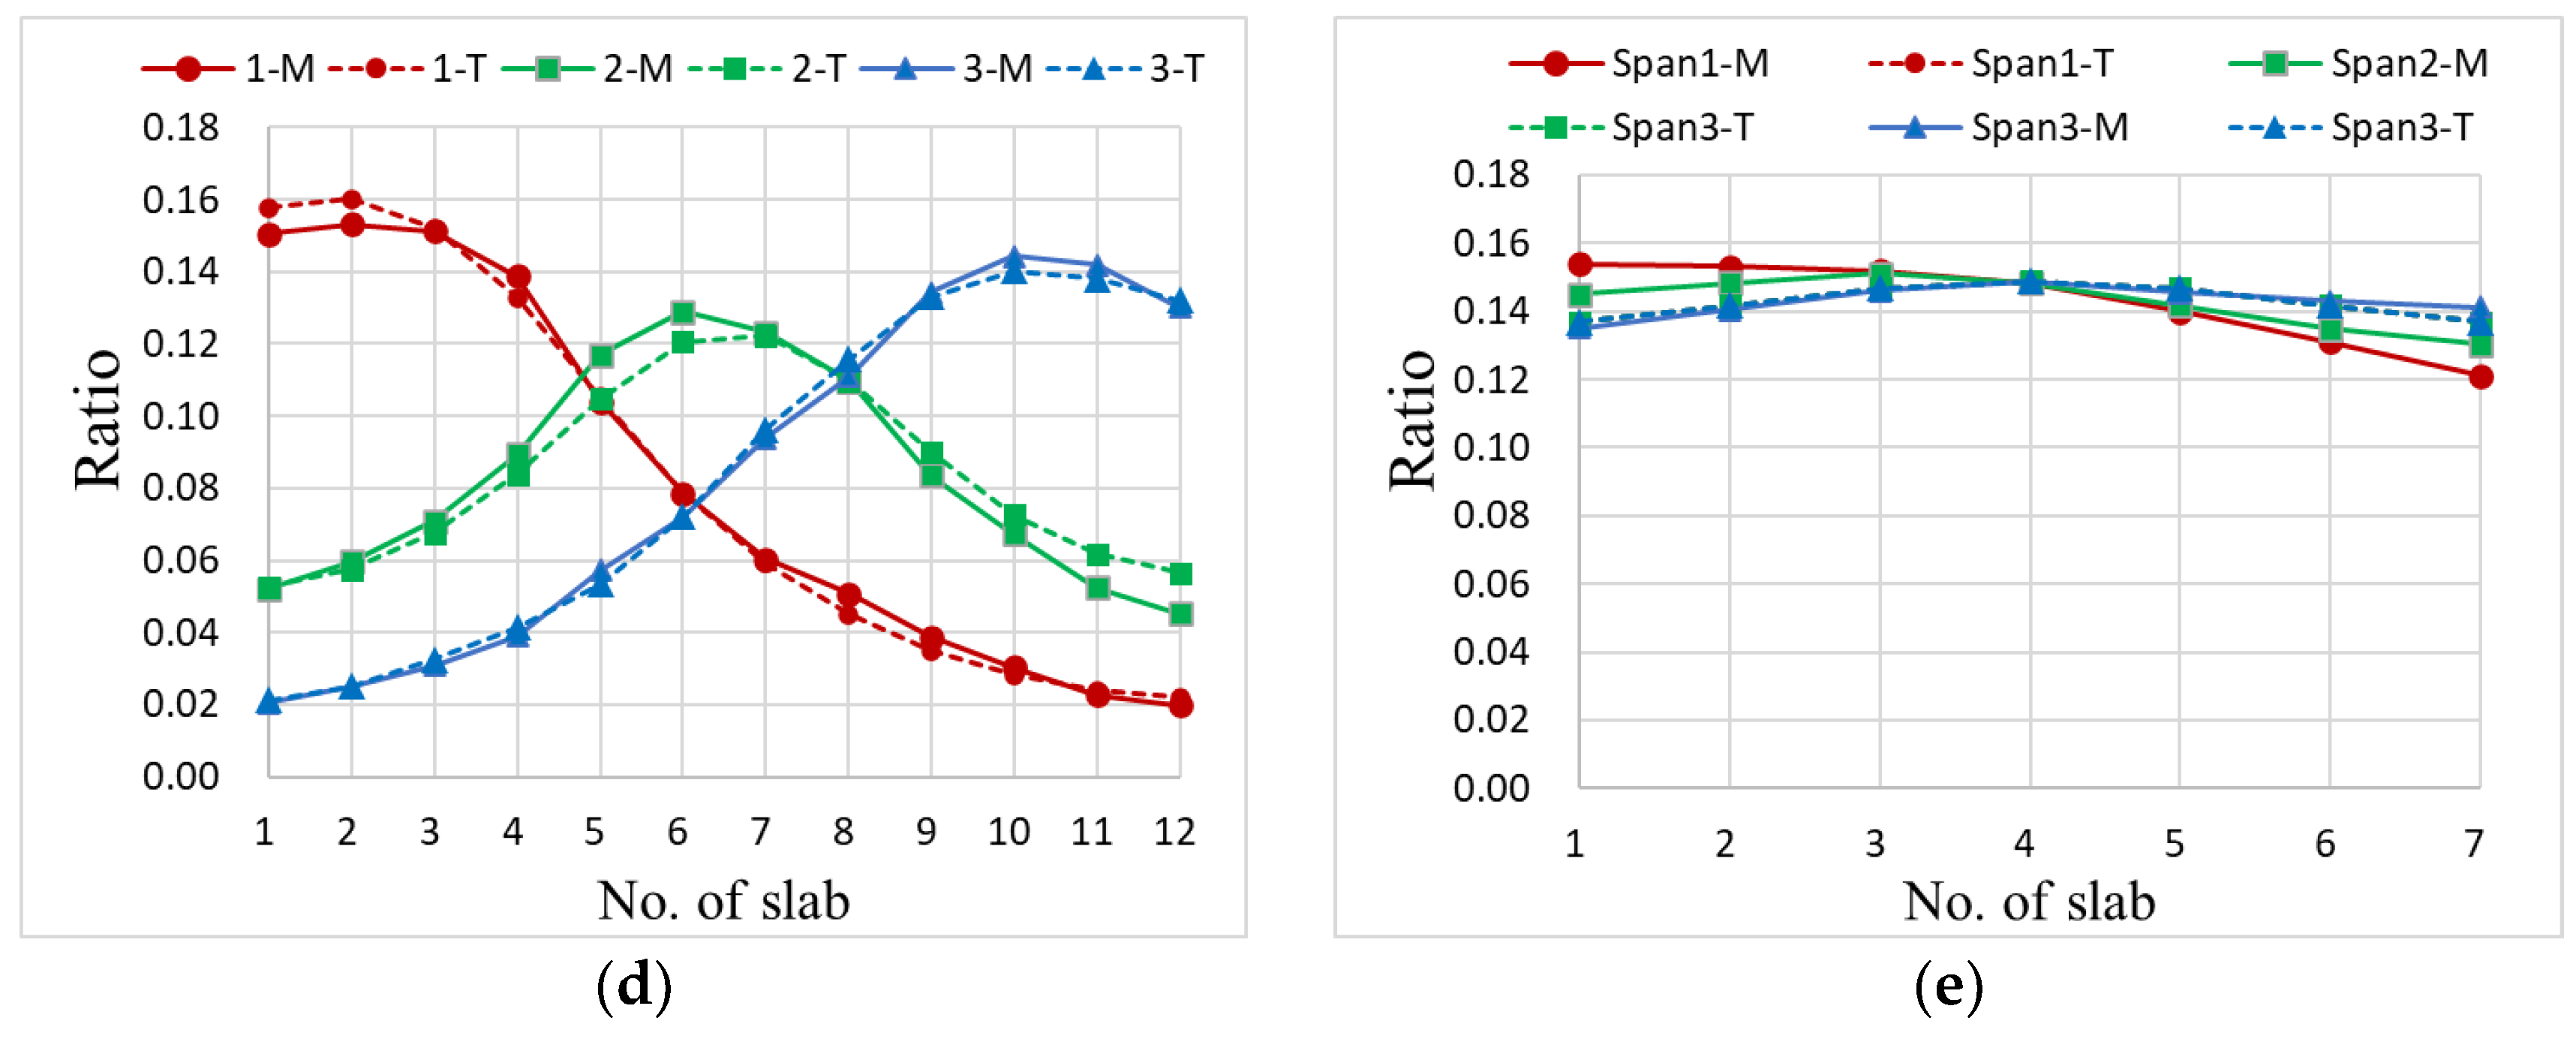
3.1. Lateral Load Distribution Ratio
3.2. Damage Evaluation Method
3.3. Damage Classification
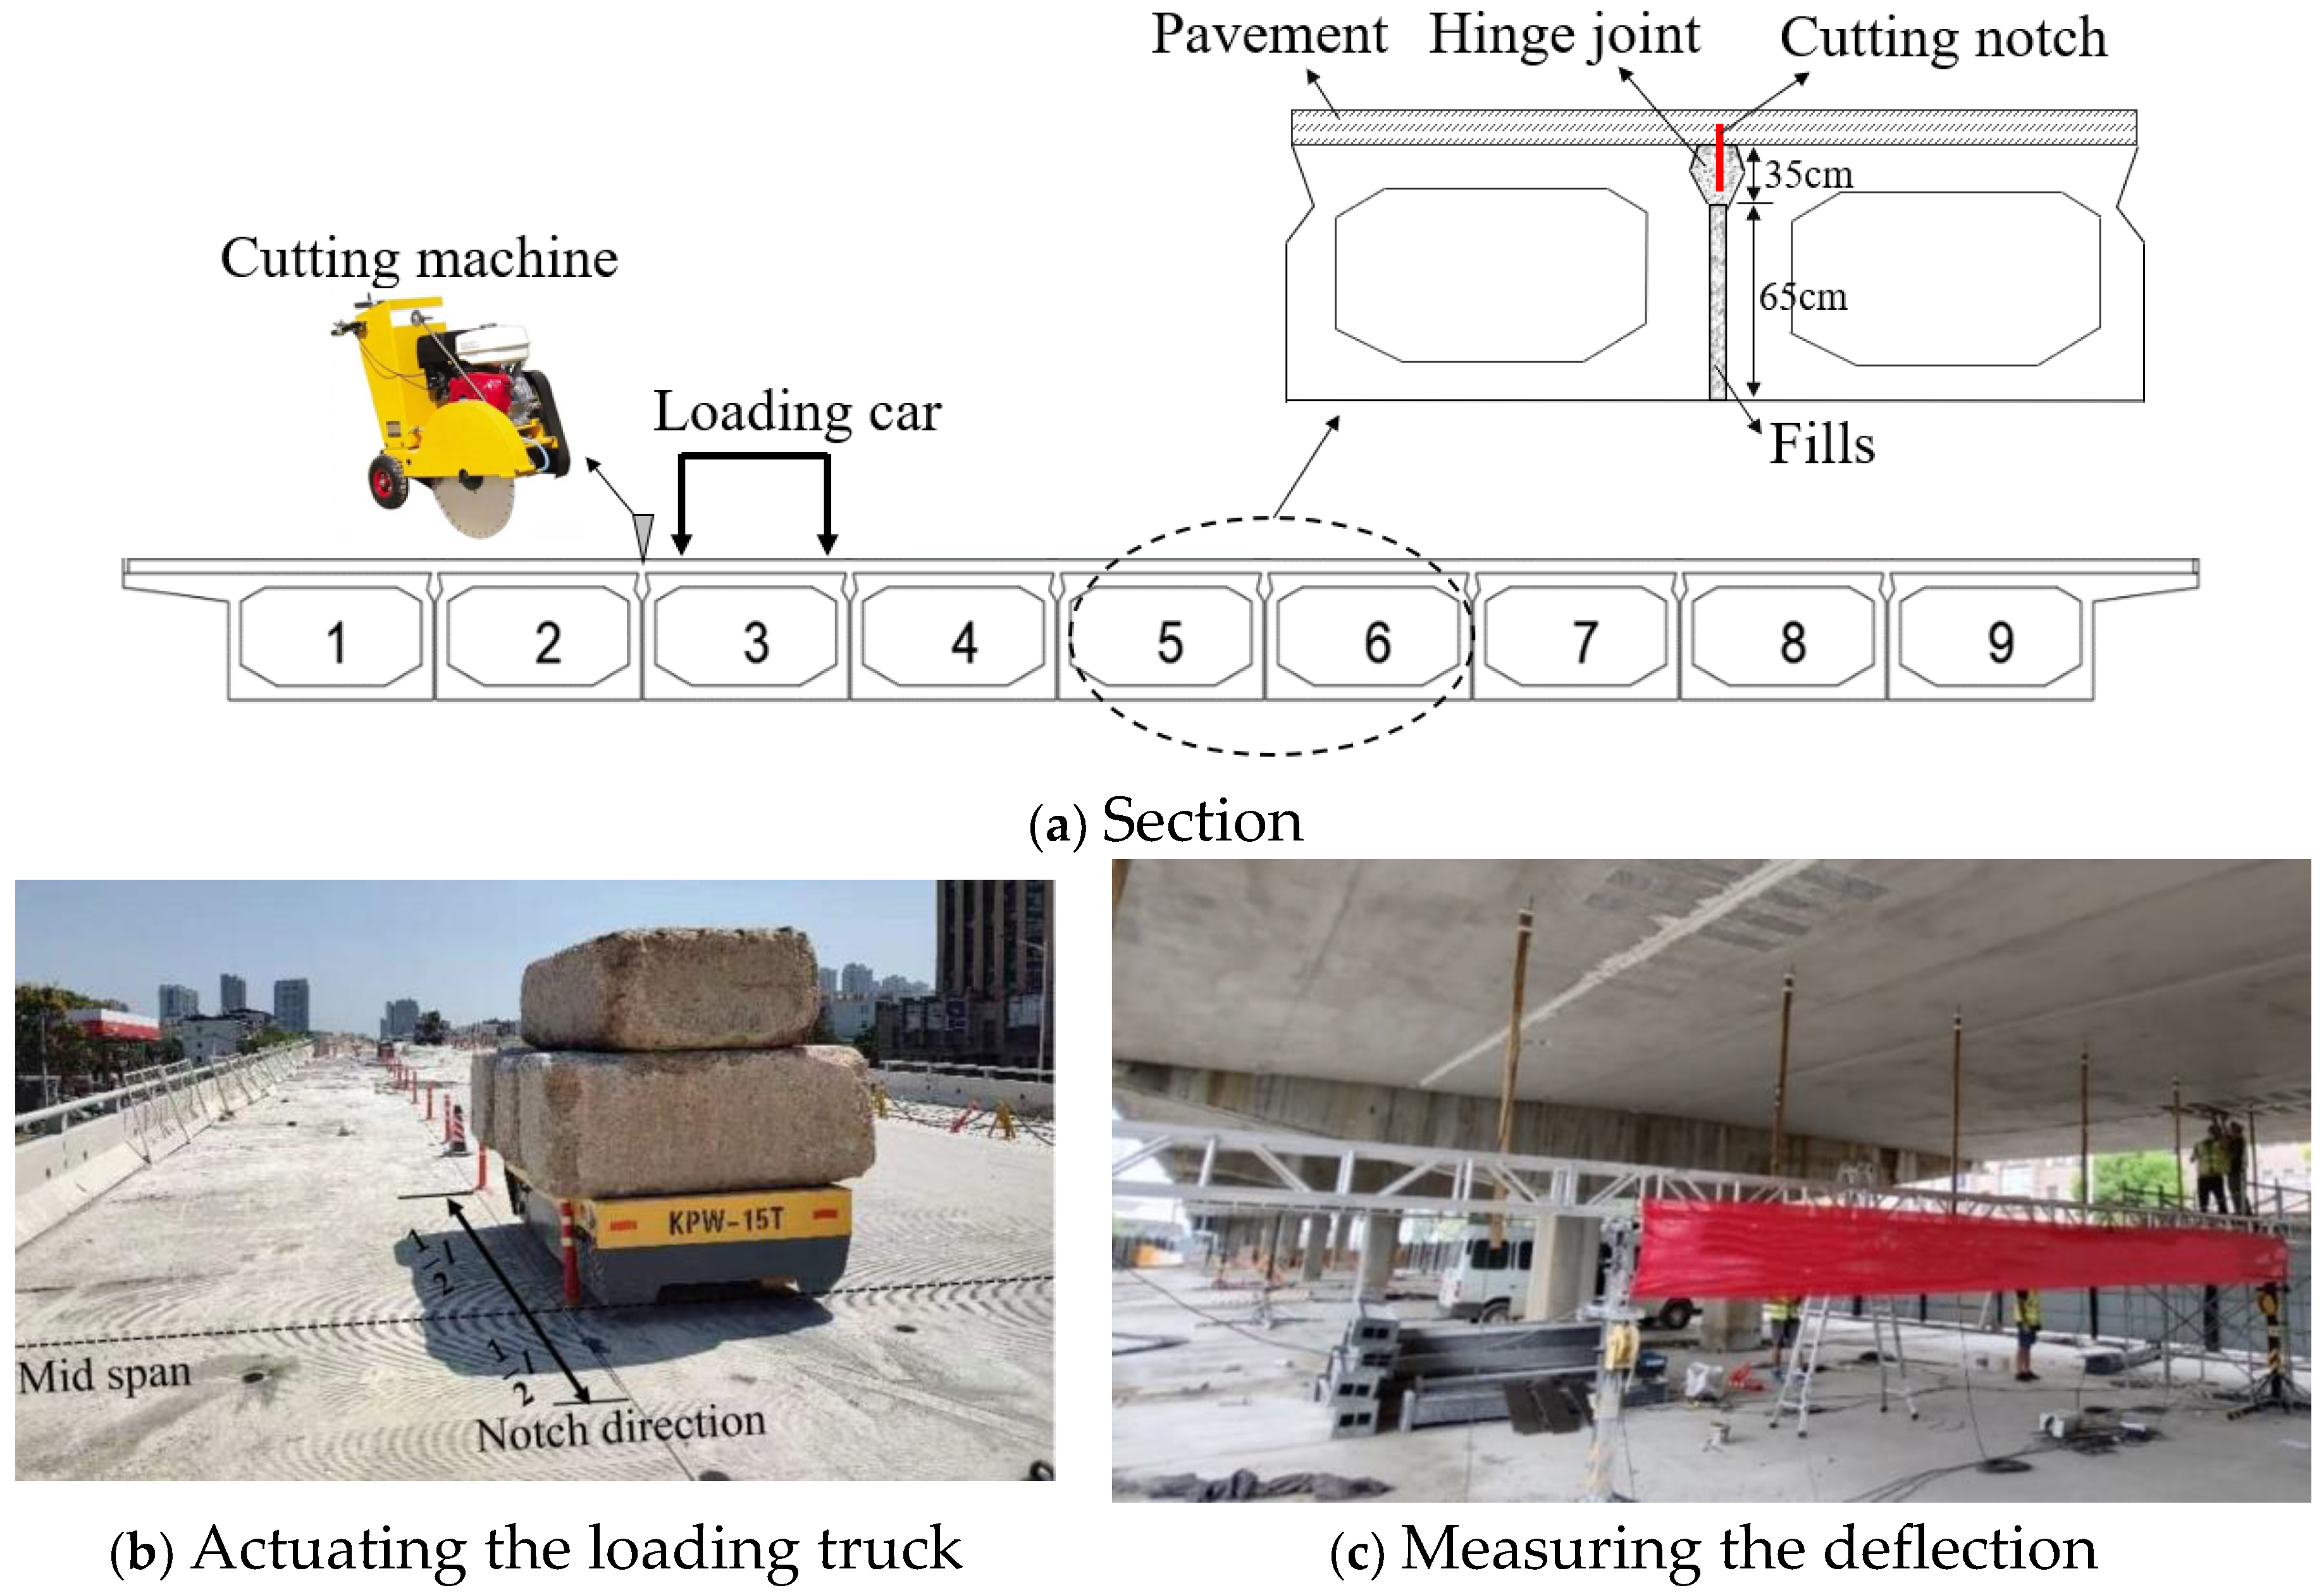
4. Verification of Proposed Methods
- (1)
- The original state for the loading car on the 3rd slab;
- (2)
- Cutting a notch with l = 500 cm and d = 35 cm;
- (3)
- Cutting a notch with l = 900 cm and d = 35 cm;
- (4)
- Cutting a notch with l = 1000 cm and d = 100 cm;
- (5)
- The control test, for the loading car travelling on the seventh slab.

| Size of Notch | No. of Slab | |||||
|---|---|---|---|---|---|---|
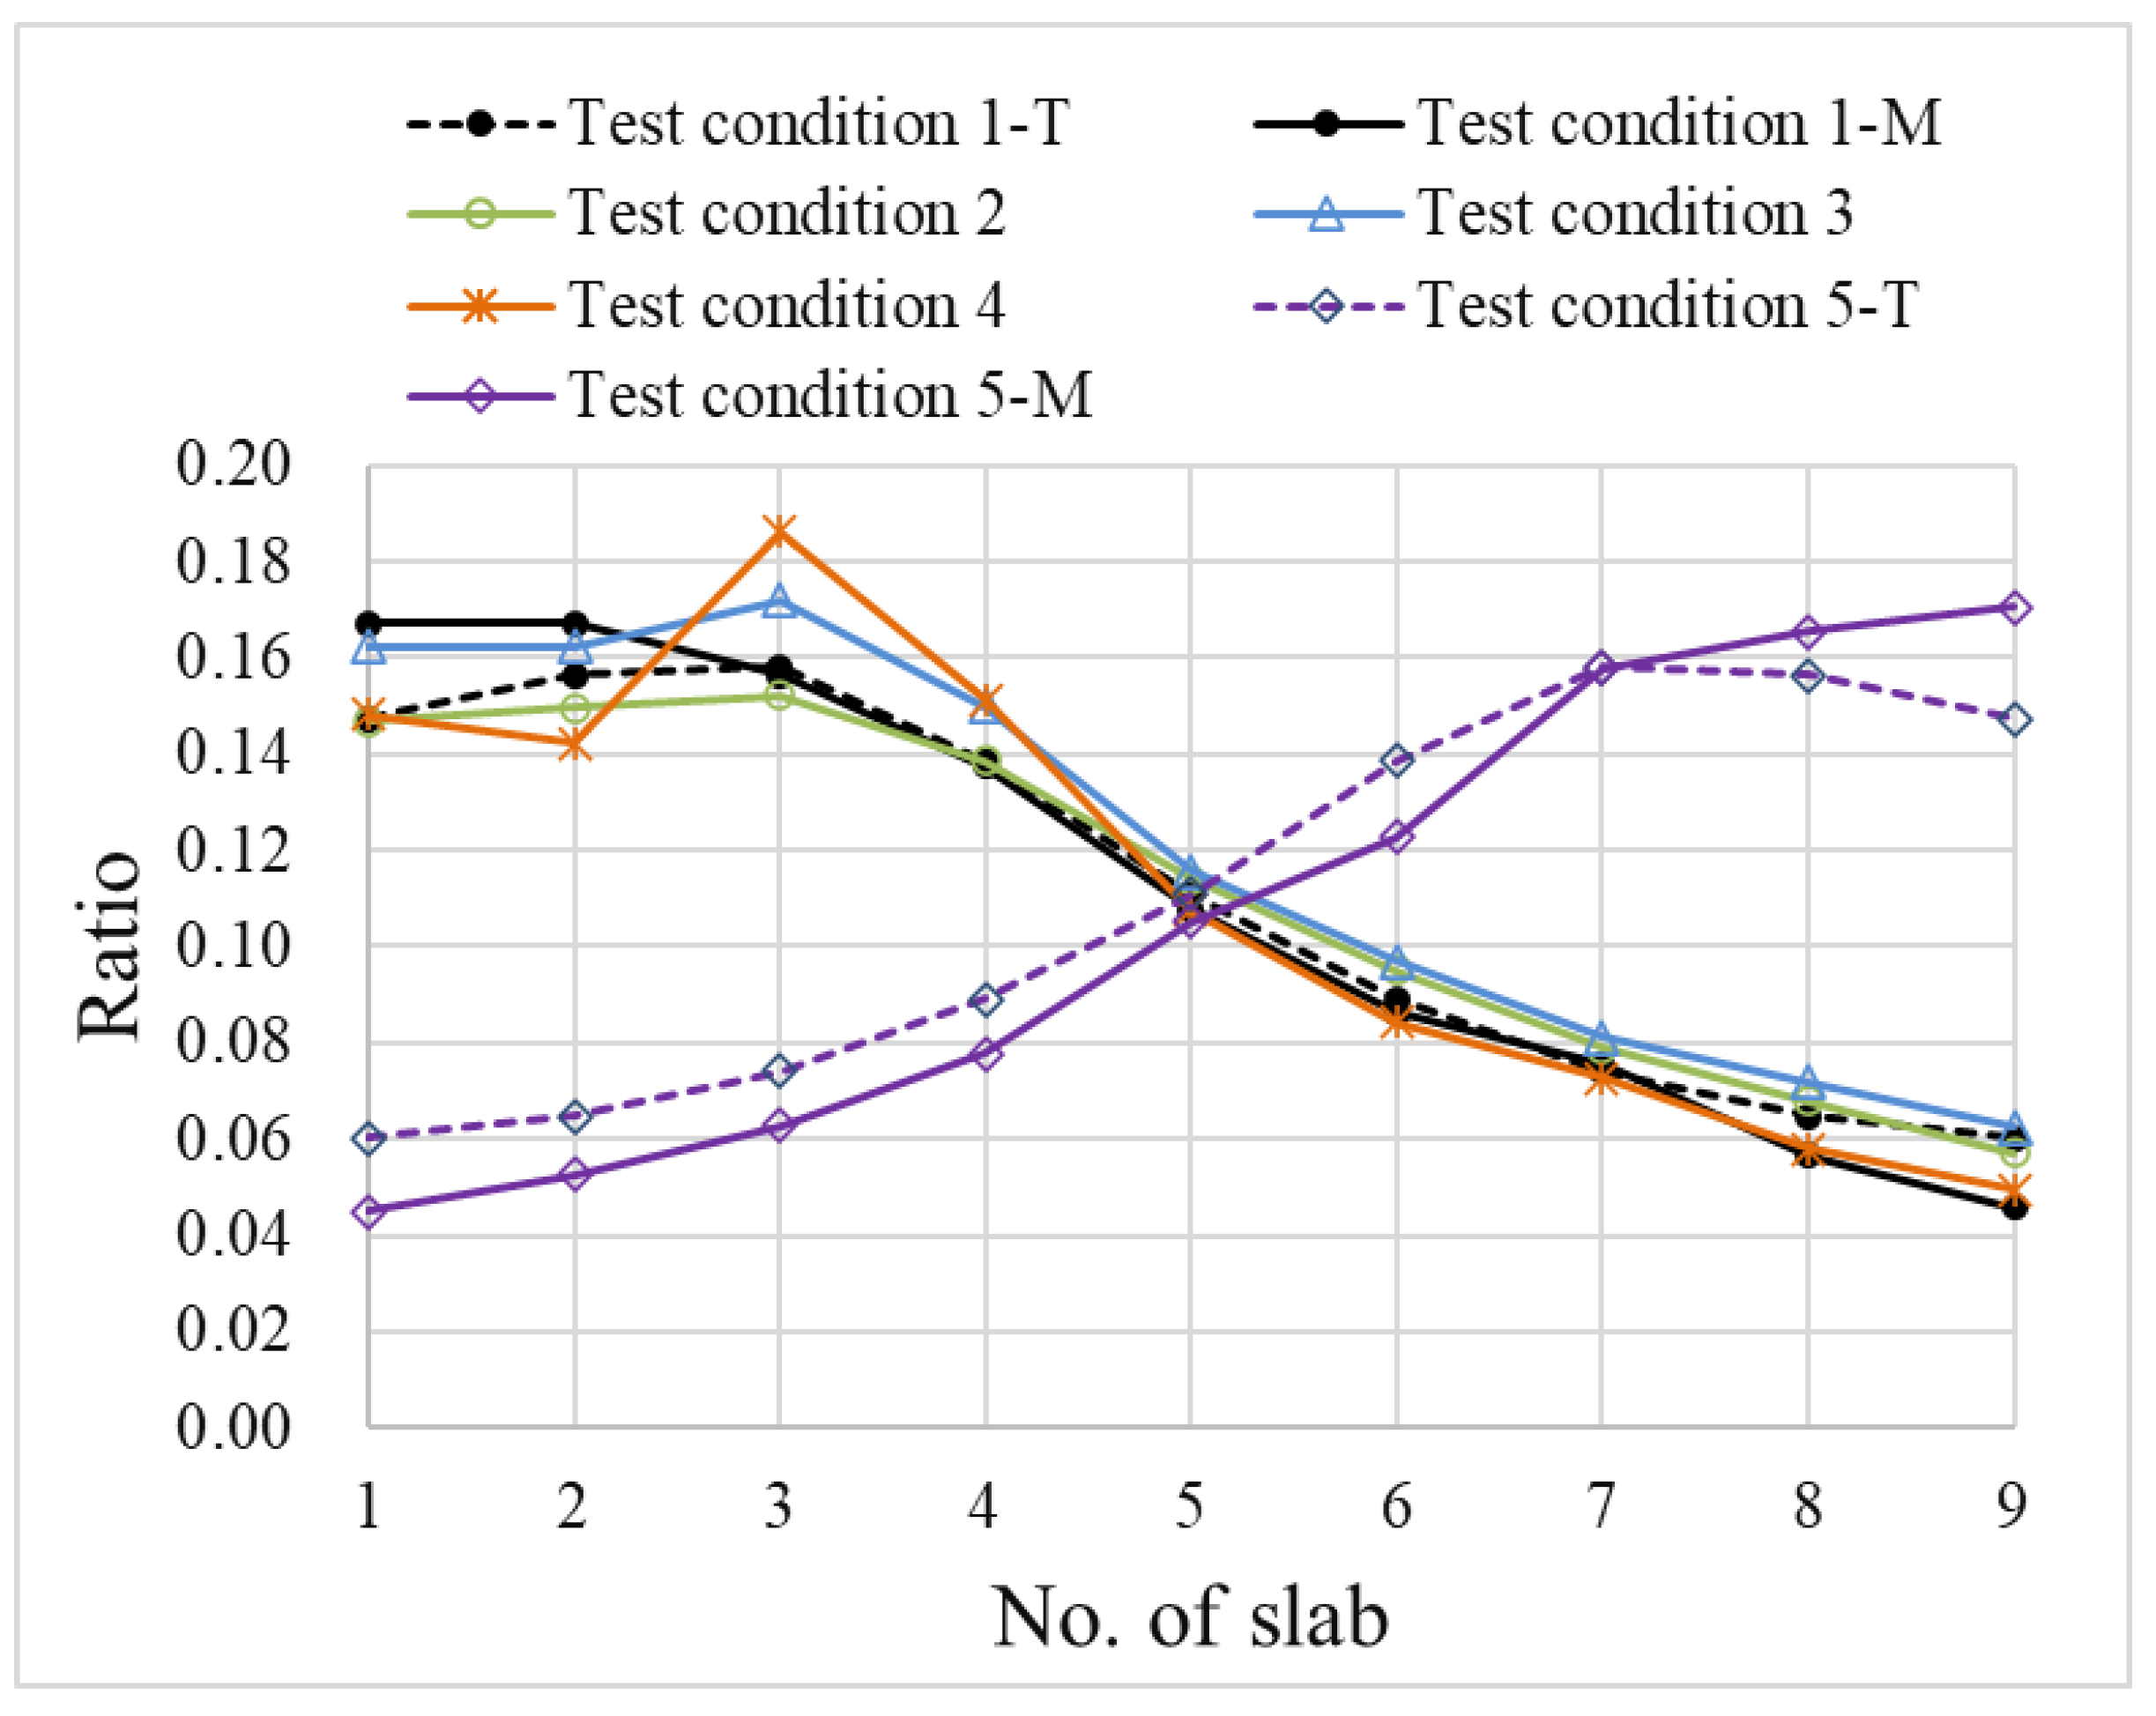
| Test 1: No notch (Original State) | 1 | 0.1475 | 0.1671 | 5.7% | 0.0% | −5.7% |
| 2 | 0.1564 | 0.1671 | 1.2% | −6.9% | −8.0% | |
| 3 | 0.1582 | 0.1563 | - | - | - | |
| 4 | 0.1385 | 0.1375 | 12.5% | 12.0% | −0.4% | |
| 5 | 0.1109 | 0.1078 | 19.9% | 21.6% | 1.7% | |
| 6 | 0.0892 | 0.0863 | 19.6% | 19.9% | 0.4% | |
| 7 | 0.0742 | 0.0755 | 16.8% | 12.5% | −4.3% | |
| 8 | 0.0647 | 0.0566 | 12.7% | 25.0% | 12.3% | |
| 9 | 0.0602 | 0.0458 | 7.0% | 19.1% | 12.1% | |
| Test 2: t = 0.2 cm l = 500 cm d = 35 cm | 1 | 0.1475 | 0.1467 | 5.7% | 0.3% | −5.4% |
| 2 | 0.1564 | 0.1495 | 1.2% | 1.8% | 0.6% | |
| 3 | 0.1582 | 0.1522 | - | - | - | |
| 4 | 0.1385 | 0.1386 | 12.5% | 8.9% | −3.5% | |
| 5 | 0.1109 | 0.1141 | 19.9% | 17.7% | −2.3% | |
| 6 | 0.0892 | 0.0951 | 19.6% | 16.7% | −2.9% | |
| 7 | 0.0742 | 0.0788 | 16.8% | 17.1% | 0.3% | |
| 8 | 0.0647 | 0.0679 | 12.7% | 13.8% | 1.1% | |
| 9 | 0.0602 | 0.0571 | 7.0% | 15.9% | 8.9% | |
| Test 3: t = 0.2 cm l = 900 cm d = 35 cm | 1 | 0.1475 | 0.1625 | 5.7% | 0.0% | −5.7% |
| 2 | 0.1564 | 0.1625 | 1.2% | 5.5% | 4.3% | |
| 3 | 0.1582 | 0.1719 | - | - | - | |
| 4 | 0.1385 | 0.1500 | 12.5% | 12.7% | 0.3% | |
| 5 | 0.1109 | 0.1156 | 19.9% | 22.9% | 3.0% | |
| 6 | 0.0892 | 0.0969 | 19.6% | 16.2% | −3.4% | |
| 7 | 0.0742 | 0.0813 | 16.8% | 16.1% | −0.7% | |
| 8 | 0.0647 | 0.0719 | 12.7% | 11.6% | −1.1% | |
| 9 | 0.0602 | 0.0625 | 7.0% | 13.1% | 6.1% | |
| Test 4: t = 0.2 cm l = 1000 cm d = 100 cm | 1 | 0.1475 | 0.1483 | 5.7% | −4.1% | −9.8% |
| 2 | 0.1564 | 0.1424 | 1.2% | 23.4% | 22.3% | |
| 3 | 0.1582 | 0.1860 | - | - | - | |
| 4 | 0.1385 | 0.1512 | 12.5% | 18.7% | 6.2% | |
| 5 | 0.1109 | 0.1076 | 19.9% | 28.8% | 8.9% | |
| 6 | 0.0892 | 0.0843 | 19.6% | 21.7% | 2.1% | |
| 7 | 0.0742 | 0.0727 | 16.8% | 13.8% | −3.1% | |
| 8 | 0.0647 | 0.0581 | 12.7% | 20.1% | 7.4% | |
| 9 | 0.0602 | 0.0494 | 7.0% | 15.0% | 8.0% | |
| Test 5: No notch, Loading on 7th slab | 1 | 0.0602 | 0.0451 | 7.0% | 14.3% | 7.3% |
| 2 | 0.0647 | 0.0526 | 12.7% | 16.1% | 3.4% | |
| 3 | 0.0742 | 0.0627 | 16.8% | 19.3% | 2.5% | |
| 4 | 0.0892 | 0.0777 | 19.6% | 26.2% | 6.6% | |
| 5 | 0.1109 | 0.1053 | 19.9% | 14.3% | −5.7% | |
| 6 | 0.1385 | 0.1228 | 12.5% | 22.2% | 9.8% | |
| 7 | 0.1582 | 0.1579 | - | - | - | |
| 8 | 0.1564 | 0.1655 | 1.2% | −4.8% | −6.0% | |
| 9 | 0.1475 | 0.1705 | 5.7% | −3.0% | −8.7% |
5. Conclusions
- (1)
- The proposed light-load field test method belongs to the traditional load test method. It needs to follow the requirements of related standards. To implement the test without interrupting the traffic, the following principles must be followed: the weight of the truck should be approximately 40 tons, the speed of the truck should be smaller than 30 km/h, and the deflection precision should be 0.01 mm.
- (2)
- According to the measured deflections from the 287 slabs, in each test condition, the central seven slabs (or central 6 hinge joints) below the testing lane deserve to be analyzed. The maximum value of deflection was 2.96 mm, and most values ranged from 1.00 mm to 2.00 mm.
- (3)
- Among the 1100 hinge joints, 25 hinge joints were damaged by 10~15%, 7 hinge joints were damaged by 15~20%, 5 hinge joints were damaged by 20~25%, 2 hinge joints were damaged by 25~30%, and 4 hinge joints were damaged by more than 30%. All of the remaining hinge joints, accounting for 96.09% of the total hinge joints, were damaged by less than 10%.
- (4)
- In the destructive experiment, the second hinge joint was damaged in four different levels, the damage factor increased with the increase in the damage level. The hinge joint with a long perforating notch, which means it had been damaged seriously, was identified, and its damage factor was 22.3% and it was bigger than the critical value (10%). The results indicated that the damage status of the hinge joint could be detected by the proposed method.
- (5)
- Some of the research results have been adopted by a local standard called Standards for rapid detection and evaluation of hinge joints in hollow slab bridges, which will open to the public in the near future. Further research may focus on signal processing of the recorded dynamic deflection, to eliminate the effect from other vehicles. Hence, the testing data of all slabs can be used for analysis.
Author Contributions
Funding
Data Availability Statement
Conflicts of Interest
References
- Li, X.; Wu, G.; Popal, M.; Jiang, J. Experimental and numerical study of hollow core slabs strengthened with mounted steel bars and prestressed steel wire ropes. Constr. Build. Mater. 2018, 188, 456–469. [Google Scholar] [CrossRef]
- Hallmark, R.; White, H.; Collin, P. Prefabricated bridge construction across Europe and America. Pract. Period. Struct. Des. Constr. 2012, 17, 82–92. [Google Scholar] [CrossRef]
- Hu, H.; Wang, J.; Dong, C.; Chen, J.; Wang, T. A hybrid method for damage detection and condition assessment of hinge joints in hollow slab bridges sing physical models and vision-based measurements. Mech. Syst. Signal Process. 2023, 183, 109631. [Google Scholar] [CrossRef]
- Hu, Z.; Li, X.; Shah, Y. Simplified Method for Lateral Distribution Factor of the Live Load of Prefabricated Concrete Box-Girder Bridges with Transverse Post-tensioning. KSCE J. Civ. Eng. 2022, 26, 3460–3470. [Google Scholar] [CrossRef]
- Guo, K.; Liu, Z.; Bairan, J. Transfer Matrix Method for Calculating the Transverse Load Distribution of Articulated Slab Bridges. Buildings 2022, 12, 1610. [Google Scholar] [CrossRef]
- Terzioglu, T.; Hueste, M.B.D.; Mander, J.B. Live load distribution factors for spread slab beam bridges. J. Bridge Eng. 2017, 22, 04017067. [Google Scholar] [CrossRef]
- Barbieri, D.M.; Chen, Y.; Mazzarolo, E.; Briseghella, B.; Tarantino, A.M. Longitudinal Joint Performance of a Concrete Hollow Core Slab Bridge. Transp. Res. Rec. 2018, 2672, 196–206. [Google Scholar] [CrossRef]
- Yang, J.; Hou, P.; Pan, Y.; Zhang, H.; Yang, C.; Hong, W.; Li, K. Shear behaviors of hollow slab beam bridges strengthened with high-performance self-consolidating cementitious composites. Eng. Struct. 2021, 242, 112613. [Google Scholar] [CrossRef]
- Baran, E. Effects of cast-in-place concrete topping on flexural response of precast concrete hollow-core slabs. Eng. Struct. 2015, 98, 109–117. [Google Scholar] [CrossRef]
- Chen, A.; Fang, X.; Pan, Z.; Wang, D.; Pan, Y.; Peng, B. Engineering practices on surface damage inspection and performance evaluation of concrete bridges in China. Struct. Conc. 2022, 23, 16–31. [Google Scholar] [CrossRef]
- Di, J.; Sun, Y.; Yu, K.; Liu, L.; Qin, F. Experimental investigation of shear performance of existing PC hollow slab. Eng. Struct. 2020, 211, 110451. [Google Scholar] [CrossRef]
- Hu, H.; Dong, C.; Wang, J.; Chen, J. Experimental Study of the Fatigue Performance of the Bonding Surfaces and Load-Bearing Capacity of a Large-Scale Severely Damaged Hollow Slab Strengthened by CFRP. Sustainability 2021, 13, 12179. [Google Scholar] [CrossRef]
- Zhu, Z.; Li, Y. Damage modes and residual deflections of multi-beam hollow slab bridge under car explosions. Eng. Fail. Anal. 2022, 141, 106705. [Google Scholar] [CrossRef]
- Sajid, S.; Taras, A.; Chouinard, L. Defect detection in concrete plates with impulse-response test and statistical pattern recognition. Mech. Syst. Signal Process. 2021, 161, 107948. [Google Scholar] [CrossRef]
- Zhang, J.; Yi, T.; Qu, C.; Li, H. Detecting Hinge Joint Damage in Hollow Slab Bridges Using Mode Shapes Extracted from Vehicle Response. J. Perform. Constr. Facil. 2022, 36, 4021109. [Google Scholar] [CrossRef]
- Turksezer, Z.I.; Iavovino, C.; Giordano, P.F.; Limongelli, M.P. Development and Implementation of Indicators to Assess Bridge Inspection Practices. J. Constr. Eng. Manag. 2021, 147, 04021165. [Google Scholar] [CrossRef]
- Angelis, A.D.; Pecce, M.R. Model assessment of a bridge by load and dynamic tests. Eng. Struct. 2023, 275, 115282. [Google Scholar] [CrossRef]
- Sun, X.; Xin, Y.; Wang, Z.; Yuan, M.; Chen, H. Damage Detection of Steel Truss Bridges Based on Gaussian Bayesian Networks. Buildings 2022, 12, 1463. [Google Scholar] [CrossRef]
- AASHTO. AASHTO-LRFD Bridge Design Specifications, 8th ed.; American Association of State Highway and Transportation Officials: Washington, DC, USA, 2017. [Google Scholar]
- JTG/T J21-01-2015; Load Test Methods for Highway Bridge. Ministry of Transport of the People’s Republic of China: Beijing, China, 2015.
- Zhao, Y.; Cao, X.; Zhou, Y.; Wang, G.; Tian, R. Lateral Load Distribution for Hollow Slab Bridge: Field Test Investigation. Int. J. Concr. Struct. Mater. 2020, 22, 1–13. [Google Scholar] [CrossRef]
- Kilic, G.; Caner, A. Augmented reality for bridge condition assessment using advanced non-destructive techniques. Struct. Infrastruct. Eng. 2021, 17, 977–989. [Google Scholar] [CrossRef]
- Li, J.; Li, X.; Liu, K.; Yao, Z. Crack Identification for Bridge Structures Using an Unmanned Aerial Vehicle (UAV) Incorporating Image Geometric Correction. Buildings 2022, 12, 1869. [Google Scholar] [CrossRef]
- Zhang, J.; Yi, T.; Qu, C.; Li, H. Determining Orders of Modes Sensitive to Hinge Joint Damage in Assembled Hollow Slab Bridges. J. Bridge Eng. 2022, 27, 04022001. [Google Scholar] [CrossRef]
- Chung, W.; Liu, J.; Sotelino, E.D. Influence of Secondary Elements and Deck Cracking on the Lateral Load Distribution of Steel Girder Bridges. J. Bridge Eng. 2006, 11, 178–187. [Google Scholar] [CrossRef]
- Huang, M.; Gül, M.; Zhu, H. Vibration-Based Structural Samage Identification under Varying Temperature Effects. J. Aerosp. Eng. 2018, 31, 04018014. [Google Scholar] [CrossRef]
- Luo, J.; Huang, M.; Xiang, C.; Lei, Y. Bayesian damage identification based on autoregressive model and MH-PSO hybrid MCMC sampling method. J. Civ. Struct. Health Monit. 2022, 12, 361–390. [Google Scholar] [CrossRef]
- Luo, J.; Huang, M.; Xiang, C.; Lei, Y. A Novel Method for Damage Identification Base on Tuning-Free Strategy and Simple Population Metropolis-Hastings Algorithm. Int. J. Struct. Stab. Dyn. 2022, 9, 2350043. [Google Scholar]
- Harris, D.K.; Gheitasi, A. Implementation of an energy-based stiffened plate formulation for lateral load distribution characteristics of girder-type bridges. Eng. Struct. 2013, 54, 168–179. [Google Scholar] [CrossRef]
- Razzaq, M.K.; Sennah, K.; Ghrib, F. Live load distribution factors for simply-supported composite steel I-girder bridges. J. Construct. Steel Resear. 2021, 181, 106612. [Google Scholar] [CrossRef]
- Kong, S.; Zhuang, L.; Tao, M.; Fan, J. Load distribution factor for moment of composite bridges with multi-box girders. Eng. Struct. 2020, 215, 110716. [Google Scholar] [CrossRef]

| Name | No. of Spans | Length of Span (m) | Width of Span (m) | No. of Slabs | No. of Hinge Joints | No. of Lanes | Open Year |
|---|---|---|---|---|---|---|---|
| Luojiagang Bridge | 2 | 18 | 50 | 47 | 46 | 7(4) * | 2003 |
| Donghu Bridge | 2 | 18 | 50 | 47 | 46 | 12(4) | 2018 |
| Qingling 1# Bridge | 1 | 20 | 13 | 19 | 18 | 3 | 2006 |
| Qingling 2# Bridge | 1 | 20 | 13 | 18 | 17 | 3 | 2006 |
| Qingling 3# Bridge | 1 | 20 | 13 | 17 | 16 | 3 | 2006 |
| Dadongmen Bridge | 3 | 16 | 16.5 | 15 | 14 | 4 | 1990 |
| Qingling 4# Bridge | 1 | 20 | 13 | 15 | 14 | 3 | 2006 |
| Qingling 5# Bridge | 4 | 20 | 13 | 12 | 11 | 3 | 2006 |
| Guanggu Bridge | 12 | 20 | 13 | 12 | 11 | 3 | 2005 |
| Yezhi Bridge | 25 | 25 | 12.5 | 12 | 11 | 3 | 2016 |
| 1# Ramp Bridge | 7 | 25 | 12.5 | 11 | 10 | 2 | 2012 |
| 2# Ramp Bridge | 7 | 25 | 12.5 | 11 | 10 | 2 | 2012 |
| 3# Ramp Bridge | 4 | 25 | 10 | 10 | 9 | 2 | 2012 |
| 4# Ramp Bridge | 4 | 25 | 10 | 9 | 8 | 2 | 2012 |
| 5# Ramp Bridge | 5 | 25 | 10 | 9 | 8 | 2 | 2012 |
| 6# Ramp Bridge | 4 | 20 | 10 | 9 | 8 | 2 | 2012 |
| 7# Ramp Bridge | 6 | 25 | 8.5 | 7 | 6 | 1 | 2012 |
| 8# Ramp Bridge | 7 | 25 | 8.5 | 7 | 6 | 1 | 2012 |
| Total number | 96 | 1196 | |||||
| Total number | 1100 |
| No. | Mi (mm) | Ti (mm) | No. | Mi (mm) | Ti (mm) | No. | Mi (mm) | Ti (mm) |
|---|---|---|---|---|---|---|---|---|
| Test Condition 1 | Test Condition 2 | Test Condition 3 | ||||||
| * 1# | 1.69 | 2.31 | 1# | 0.44 | 0.97 | 1# | 0.15 | 0.44 |
| 2# | 1.78 | 2.29 | 2# | 0.58 | 1.03 | 2# | 0.20 | 0.46 |
| 3# | 1.75 | 2.16 | 3# | 0.76 | 1.15 | 3# | 0.26 | 0.52 |
| 4# | 1.51 | 1.90 | 4# | 1.07 | 1.34 | 4# | 0.35 | 0.60 |
| 5# | 1.13 | 1.56 | 5# | 1.40 | 1.56 | 5# | 0.46 | 0.73 |
| 6# | 0.85 | 1.24 | 6# | 1.59 | 1.72 | 6# | 0.61 | 0.89 |
| 7# | 0.66 | 1.00 | 7# | 1.64 | 1.72 | 7# | 0.86 | 1.11 |
| 8# | 0.44 | 0.81 | 8# | 1.29 | 1.56 | 8# | 1.31 | 1.40 |
| 9# | 0.35 | 0.68 | 9# | 1.05 | 1.34 | 9# | 1.55 | 1.70 |
| 10# | 0.26 | 0.58 | 10# | 0.75 | 1.15 | 10# | 1.69 | 1.93 |
| 11# | 0.19 | 0.52 | 11# | 0.54 | 1.03 | 11# | 1.66 | 2.05 |
| 12# | 0.12 | 0.49 | 12# | 0.38 | 0.97 | 12# | 1.45 | 2.06 |
Disclaimer/Publisher’s Note: The statements, opinions and data contained in all publications are solely those of the individual author(s) and contributor(s) and not of MDPI and/or the editor(s). MDPI and/or the editor(s) disclaim responsibility for any injury to people or property resulting from any ideas, methods, instructions or products referred to in the content. |
© 2023 by the authors. Licensee MDPI, Basel, Switzerland. This article is an open access article distributed under the terms and conditions of the Creative Commons Attribution (CC BY) license (https://creativecommons.org/licenses/by/4.0/).
Share and Cite
Guo, A.; Zhu, H.; Jiang, A. Detection and Damage Evaluation of Hinge Joints in Hollow Slab Bridges Based on a Light-Load Field Test. Buildings 2023, 13, 699. https://doi.org/10.3390/buildings13030699
Guo A, Zhu H, Jiang A. Detection and Damage Evaluation of Hinge Joints in Hollow Slab Bridges Based on a Light-Load Field Test. Buildings. 2023; 13(3):699. https://doi.org/10.3390/buildings13030699
Chicago/Turabian StyleGuo, Aiping, Haiqing Zhu, and Ajuan Jiang. 2023. "Detection and Damage Evaluation of Hinge Joints in Hollow Slab Bridges Based on a Light-Load Field Test" Buildings 13, no. 3: 699. https://doi.org/10.3390/buildings13030699
APA StyleGuo, A., Zhu, H., & Jiang, A. (2023). Detection and Damage Evaluation of Hinge Joints in Hollow Slab Bridges Based on a Light-Load Field Test. Buildings, 13(3), 699. https://doi.org/10.3390/buildings13030699