Article

Experimental Study of Envelope Airtightness in New Egyptian Residential Dwellings

Department of Architecture, The American University in Cairo, New Cairo 11835, Egypt
*
Author to whom correspondence should be addressed.
Buildings 2023, 13(3), 728; https://doi.org/10.3390/buildings13030728
Submission received: 30 January 2023 / Revised: 1 March 2023 / Accepted: 7 March 2023 / Published: 9 March 2023
(This article belongs to the Topic Building Energy Efficiency)

Abstract

:
In residential buildings, air infiltration impacts energy, indoor air quality, and thermal comfort considerably. While air infiltration in residential buildings has been the focus of many studies, most published field-testing results pertain to developed countries, with little or no data on air infiltration in developing nations. This paper presents the results of one of the first field investigations into envelope infiltration in the residential buildings of the hot-arid climatic area of Egypt. To analyze the air permeability of the building envelope, the fan pressurization method, often known as the blower door test (BDT), is used, following ISO 9772. The study focuses on 20 residential dwellings built with heavy construction materials and subjects them to extensive characterization and testing. The average air leakage and the air permeability rate for the tested sample were 6.14 h−1 and 17.3 m3/(h∙m2), respectively. However, significant variations in airtightness were observed across the dwelling, leading the team to test several building-related parameters statistically to study their impact on airtightness. Fenestration quality appeared to be a critical factor in determining air infiltration, showing a strong correlation with the air change and leakage. A further investigation underscored that the specific aperture factor and the fenestration quality can predict the infiltration rates to a large degree. Thus, we recommend further investigation of these characteristics in heavy construction material building. Finally, we strongly recommend that building codes in developing countries such as Egypt include minimum performance requirements for fenestration.

1. Introduction

The building envelope’s resistance to airflow, or its airtightness, is the determining factor in avoiding uncontrolled air movement in spaces [1]. Airtightness affects a range of building-related performance metrics, including a building’s hygrothermal performance, energy consumption, ventilation performance, fire resistance, noise levels, and the thermal comfort and health of its occupants [2]. In locations that experience extreme hot or cold weather conditions, reducing air infiltration and exfiltration through the building envelope decreases the heating and cooling energy needed to maintain indoor comfort. On the other hand, creating extremely airtight buildings may deteriorate indoor air quality if the appropriate supply of fresh air through mechanical ventilation is not guaranteed.
Given the importance of building envelope airtightness, many countries and jurisdictions incorporate airtightness into their energy performance calculation and building commissioning procedures. For this purpose, international standards for measuring air leakage in building envelopes have been developed [3], with ISO 9972 [4] and ASTM E779 [5] being the most widely used. Both the ISO 9972 and ASTM E779 standards are used to quantify, through field tests, the air permeability of a building or enclosed spaces. The test mainly entailed pressurizing or depressurizing the space mechanically using a fan, commonly using the blower door test (BDT) apparatus, after the test location had been prepared. By ensuring that all air moving into or out of the space happens through its building envelope and its components, the fan is used to induce pressure to create a pressure difference in reference to the outdoors, and the airflow through the fan would equate to the flow through the envelope.
While ASTM E779 offers one standard test method, the ISO 9972 is distinct in that it provides three distinct BDT methods: (1) Method A, to test a building in use (i.e., during the cooling or heating season); (2) Method B, to test the building envelope (i.e., in which any intentional opening is closed or sealed); (3) Method C, to test a building in use (i.e., automatically regulating, externally mounted air transfer devices are sealed, other openings are handled in the same way as for Method A). Air terminal devices of mechanical ventilation or air conditioning systems are sealed. Other ventilation openings (for example, openings for natural ventilation) are closed for Method A and sealed for Method B. As for building components preparation, the entire building or part of it to be tested is configured to respond to pressurization as a single zone. Furthermore, all interconnecting doors (except for cupboards and closets, which should be closed) in the part of the building to be tested are opened so that uniform pressure is maintained within a range of less than 10% of the measured inside/outside pressure difference. As for heating, ventilation, and air conditioning systems, heating systems with indoor air intake are turned off. Open fireplaces are cleared of ashes, and mechanical ventilation and air conditioning systems are turned off. Many published works, especially in Europe, have resorted to using the ISO standard in their field tests.
With infiltration being a determining factor in buildings’ environmental and energy performance, research on air leakage has continued to garner interest in academic and practitioner circles. The current research presents new data for quantifying air infiltration for different construction types and locations. The literature also proposes new assessment and testing methods and statistical prediction models to correlate infiltration with other heat and moisture transfer phenomena in buildings [6]. Recently, new research has started to study infiltration more extensively in regions where airtightness data is scarce, including in developing countries and hot climatic regions. Filling these data gaps is essential for addressing energy demand in the built environment, which is now increasingly perceived as a global and internationally connected issue.
Alfano et al. [7] evaluated the airtightness of twenty residential buildings in southern Italy. They discovered that the average air change rate (n50) value was reasonably high and that the most crucial causes of this excess infiltration were windows and chimneys, which were not tight or were not sealed correctly, as well as air movement through the mechanical ventilation systems. Papaglastra et al. [8] conducted a similar study that analyzed 1094 air change rates at 50 Pa obtained from field tests in seven European countries: Belgium, Greece, The Netherlands, France, Norway, Finland, and Germany. They found that house airtightness data fit into a theoretical Weibull distribution, with significant asymmetry in distribution for all countries except Greece and Norway. In Spain, the results obtained in a study on the infiltration rate of detached houses concluded that air infiltration through the building envelope has a significant energy impact, in the range of 2.43 to 19.07 kWh/(m2∙y) [9].
Sfakianaki et al. [10] measured airtightness and infiltration in twenty houses in Attica, Greece. They categorized the dwellings based on ISO 13790′s [11] envelope tightness level categorization at a pressure difference of 50 Pa (standard is now revised: ISO 52016-1:2017 [12]): high (10 h−1 and above), medium (4 to 10 h−1), and low (below 4 h−1). They discovered that structures with medium and high envelope tightness levels are statistically uneven, showing high standard deviations in their infiltration rates and the conditions of their building parameters. They thus highlighted the need for redefining each category’s range of values or developing new categories that could be added to ISO 13790 [11]. Stabile et al. [13] measured air permeability and indoor pollutant concentrations in schools in central Italy, and the pressurization tests revealed that infiltration from classroom leakages alone is insufficient to meet the ventilation requirements in most of the classrooms tested. They estimated the average air exchange rate to be 0.12 h−1. They found that air infiltration positively impacts indoor air quality during the spring season, with significant reductions in CO2 and radon concentrations. However, they reported that the classroom’s air quality was inadequate throughout the fall and winter seasons despite the high infiltration rates.
Kalamees [14] conducted a field measurement study of the airtightness and air leakages of thirty-two detached houses in Estonia, where little or no infiltration data has previously been published. They also used an infrared image camera and smoke to discover the most prominent air leakage paths (ALPs). The average air leakage rate and air change rate in the entire database at a pressure difference of 50 Pa were 4.2 m3/(h∙m2) and 4.9 h−1, respectively. In Spain, Feijó-Muñoz et al. [15] identified envelope ALPs using thermal imaging and found that they are mainly concentrated around windows, pipe and duct paths, and construction joints. Rolling shutters, a widespread element in this area, were seen to create a discontinuity in the envelope and were identified as an especially relevant leakage path. Based on the available work, leakage from exterior openings (i.e., windows and exterior doors) is the most significant component for regions that use heavy construction, including some Mediterranean nations, as seen in a study conducted in Greece, Spain, and Italy [10].
The building construction year has been previously reported as a critical factor influencing air leakage in buildings for several reasons. First, materials and joints deteriorate over time. For example, Jesus et al. [15] estimated an up to 10–15% increase in the infiltration rate every ten years. Second, the continuous improvement in construction systems has reduced infiltration. Third, the year of construction is linked to the regulations in force at each moment, which establish the requirements and conditions of the construction systems. However, it is essential to mention that the latter reason is less applicable in locations with no air infiltration regulations, including developing nations such as Egypt.
Another study was conducted by Yonghang et al. [16] to analyze the influence of construction age on air infiltration. A significant positive relationship between air permeability and the construction age was seen, but some of this reflects varying maintenance levels by building management companies. The significant negative relationship between air permeability and total length of penetration path/envelope area is a characteristic of residential buildings, so they suggested involving regular checks of sealing and obvious gaps, especially at the kitchen drain, windows, and door frames.
Valdas et al. [17] analyzed building construction materials to determine the change in heat loss of end units in terraced houses (townhouses) in Lithuania due to various factors, leading to uneven airtightness of the building envelope. The non-destructive assessment of building airtightness was implemented through combined methods, namely the blower door test (around 200 measurements) and infrared thermography. They stated that hollow clay unit masonry showed ca. 7–11% less airtightness than the sand–lime block masonry structure. The end units were up to 20% less airtight compared to the inside units.
Researchers have also explored how various building parameters affect infiltration rates. For example, in multi-unit building testing, Feijó-Muñoz et al. [18] investigated, among other factors, how the position of dwellings within a building affects their infiltration leakage rates in the field tests they conducted in Spain. They found that dwellings placed in an intermediate position are more airtight than the ones placed in an extreme position. Sfakianaki et al. [10] used statistical tests to study the correlation between airtightness and the total frame length (FL) and confirmed that the FL significantly influenced each house’s air leakage rates, highlighting exterior envelope window and door frames as a key predictor of infiltration.
Another area of interest is the study of infiltration in multi-unit residential buildings. In a recent study, Lozinsky and Touchie [19] investigated twelve newly constructed multi-unit residential buildings to study inter-zonal infiltration. They found that, on average, most of the infiltration (i.e., more than 60%) happens through the exterior envelope components and that most inter-zonal infiltration happens through the corridor. They specifically identified that this unit-to-corridor infiltration happens since the partitions are made of steel studs rather than concrete or heavy construction, which separates the different units. Thus. in locations where heavy building materials are used in all interior compartments, such as Egypt, it is safe to posit that most of the air infiltration in multi-unit residential buildings should happen through their exterior envelope and its components.
As seen from the above overview, the findings obtained from field tests have provided essential data for the forecast of building air leakage, which can then be used to assess the thermal performance of buildings, predict energy consumption and demand for new and existing construction, and study the comfort and well-being of its occupants. The field tests’ results can also provide crucial information to policymakers and designers, allowing them to make more informed policy-related decisions and better detect energy and environmental issues during building audits. However, to predict air infiltration at an accurate level, large data sets are needed, which is the case in the United States, Canada, China, and some European nations.
Based on the research of Dickerhoff et al. [20] and Harrje and Born [21], ASHRAE [22] determined the percentage distribution of infiltration air leakage from building components. The distribution indicates that the most significant components are walls, ceiling details, forced-air heating and/or cooling systems, windows, doors, fireplaces, exhaust vents for conditioned spaces, and diffusion through walls and ceilings. Using the air leakage characteristics of almost 70,000 US houses, Chan et al. [21] developed a multivariate regression model to estimate the effective leakage area (ELA) distribution of the single-family detached dwellings building stock in the United States. The ELA is defined as the area of a special nozzle-shaped hole that would leak the same amount of air as the building does at a pressure of 4 Pa and is used in infiltration models to predict the air exchange rate as a function of wind speed and indoor–outdoor temperature difference. Thus, using Chan et al.’s model, a leakage area distribution for any single-family residence in the United States might be obtained based on the attributes obtained from the American Housing Survey.
The performance of six different airtightness materials is applied and compared in another study in the UAE [23], a country that shares Egypt’s climate zone, in order to improve air tightness. The blower door method was employed both before and after the sealants were applied. The airflow at 10 Pa, Q10 (m3/h), and 50 Pa, Q10 (m3/h) were decreased by 70.15% and 67.95%, respectively, by the foam, proving that it was the best sealant. This resulted in a 3% decrease in energy use over one year.
For this level of accurate infiltration and leakage area prediction to be obtained, many field tests must be conducted, verified, and made available for analysis. Despite the availability of studies conducted throughout the world, including tens of thousands of significant airtightness test results, the cross-application of field results in different locations and countries is not possible. This is because various elements, including construction technology and quality, craftsmanship, and building materials and components, among others, influence envelope airtightness.
This underscores the need for new research to continue collecting and publishing field-testing results from locations where infiltration data is scarce or unavailable. Thus, while the published research on air infiltration in residential buildings is rich, to the best of the authors’ knowledge, there have been no studies on the airtightness of residential buildings in Egypt, a developing country with a hot and arid climate. Moreover, due to the use of heavy construction materials, such as concrete and brick walls, and non-standardized window and door systems in the Egyptian construction industry, the airtightness performance of Egyptian residential buildings may differ significantly from that of other countries. Given the scarcity of airtightness measurements in Egypt, a set of tests on residential buildings is necessary.
This study assessed and analyzed the airtightness of twenty dwellings in the newly developed New Cairo (Cairo, Egypt) area using the blower door test (BDT). Following this introduction and background section, the paper presents the methodology of the research, including an overview of the fundamental laws that govern the phenomenon of air infiltration in buildings, a detailed description of the tested dwellings and test protocols followed, as well as the method of analysis of the collected field data. The results section presents and discusses the findings from the field experiment and statistical analysis. Finally, the paper highlights the study’s key contributions and proposes recommendations for estimating air infiltration in Egyptian dwellings and reducing their air leakage, as well as a series of suggestions for facilitating the BDT in similar conditions.

2. Methodology

2.1. Fundamentals of Air Infiltration through Building Envelopes

The airflow as a function of the pressure gradient across the building envelope is represented using the power law equation (Equation (1)) [5].
Q = C L   ( Δ P ) n
where Q is the airflow through the building envelope (m3/h); CL is the air leakage coefficient (m3/(h∙Pan)), which is a function of the size and conditions of the leakage paths; ∆P is the pressure difference (Pa) between interior (reference pressure) and exterior (baseline pressure); and n is the flow exponent that characterizes the flow and is usually in the range from 0.5 to 1 for fully developed turbulent and laminar flow, respectively (a reference value of 0.65 is commonly used). The parameters that constitute Equation (1) must be extracted from all infiltration tests in order to estimate the air leakage quantity and characteristics.
In order to compare different envelopes’ performance, airflow, Q, is normalized according to ISO [4], using the following building parameters: exterior envelope surface area (AE in m2), net floor surface area (AF in m2), and internal volume (V in m3). The resulting infiltration parameters are detailed in Table 1. Other building parameters previously used in the literature to compare infiltration include the total frame length (FL in m), the total frame area (FA in m2), and other ratios derived from the building parameters presented. In this research, we use n50pre to denote the air change rate at 50 Pa during the pressurization and n50dep to denote the air change rate at 50 Pa during the depressurization testing.

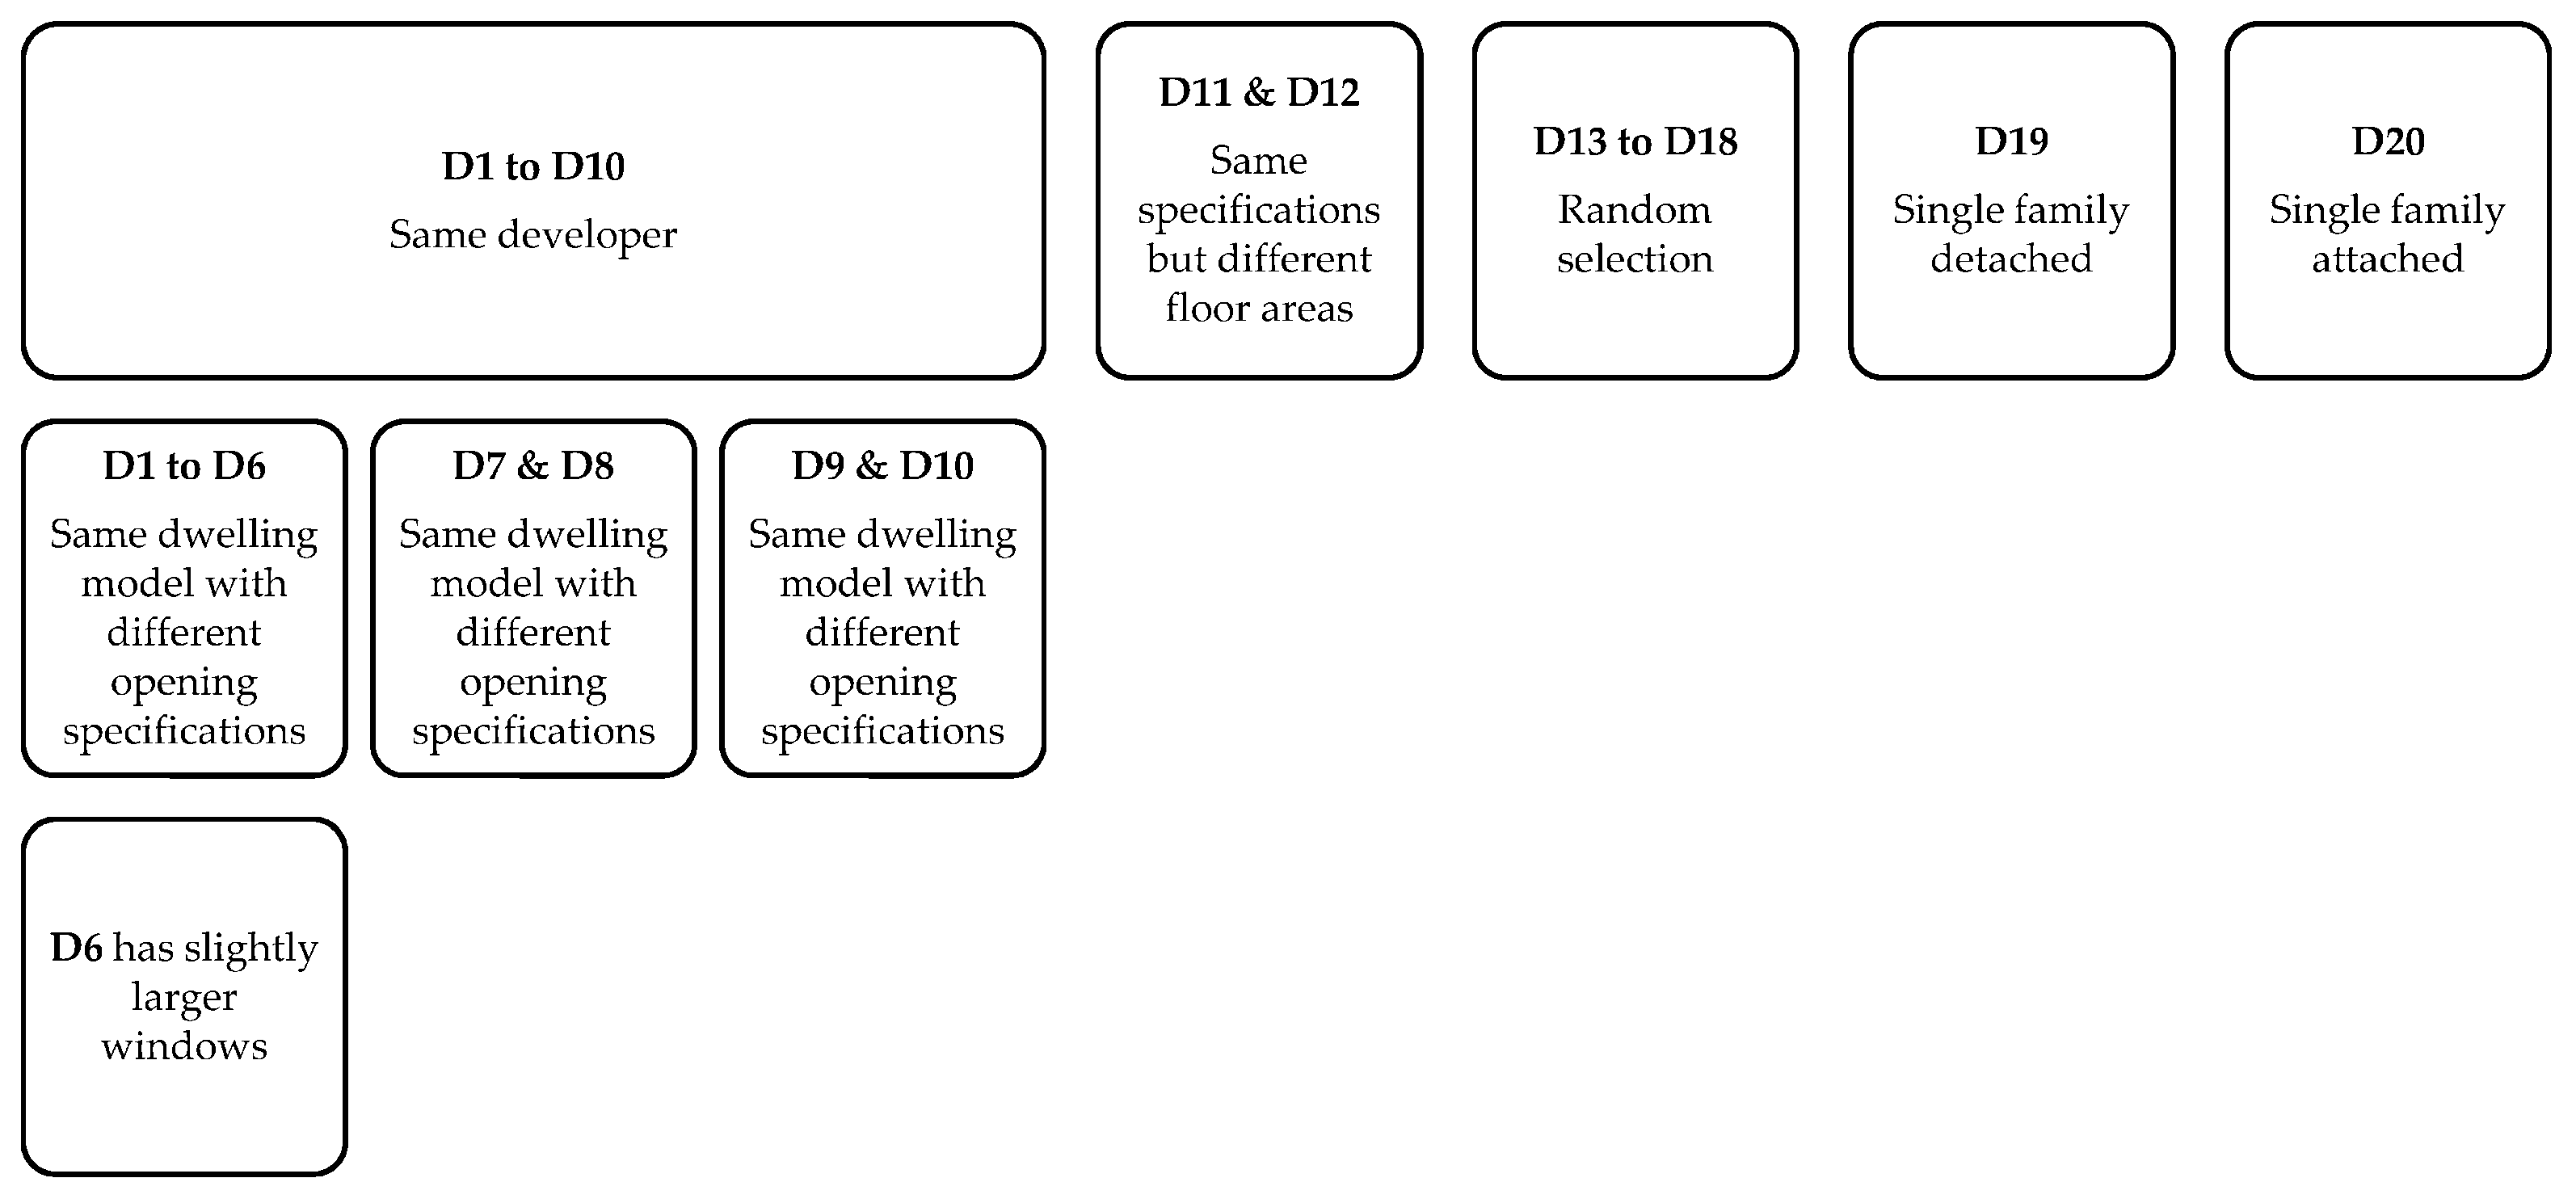
2.2. Description of Tested Dwellings

All the examined dwellings in this study are in New Cairo in Cairo, Egypt. The New Cairo area was established in the late 1990s and is one of the new satellite suburbs built around the old city of Cairo. The area is considered part of a hot-arid climate type of Bwh according to the Köppen Geiger categorization [24]. Multi-unit residential buildings are the most common typology in this area, with construction mainly driven by private developers, either of large or small scale. The municipality sets standard rules and guidelines that limit several design parameters such as setbacks, building heights, built-up area ratio to the net area, and sometimes the exterior construction and finishing materials. While Egypt has a building energy code, the code is not binding and is not readily applied in the industry.
Overall, 20 dwellings were selected for testing. The researchers intended to select a random group of newly constructed dwellings in New Cairo that represent the typical characteristics of the available residential stock in this location. The sample was chosen to feature dwellings in the same development projects, others completed by the same contractors in different locations, and a group of randomly selected dwellings with different finishing qualities and properties. The specific characteristics of each of the tested dwellings are specified in Table 2. Figure 1 illustrates the sample of tested dwellings, and Figure 2 shows a sample of the floor plans.
D1 to D18 are dwellings in multistorey buildings. All multistory buildings have four stories on top of the ground floor (the ground floor is labeled 0 in Table 2). The height of the dwellings is determined by the New Cairo area’s building regulations, which dictate a five-story limit, including the ground floor. The following is the description of the dwellings:
-
Ten dwellings (D1 to D10) are located in the same development.
D1 to D6 are the same dwelling model but feature different opening specifications, with D6 featuring slightly larger windows (modified by the current occupant).
D7–D8 and D9–D10 are two pairs of similar dwelling models with different opening specifications.
-
Two dwellings (D11 and D12) were constructed by the same contractor and featured the same specifications, including the same windows but with slightly different floor areas.
-
Six dwellings (D13 to D18) were selected randomly; they were completed by different contractors and feature different finishing qualities and opening specifications.
-
D19 is a single-family detached dwelling.
-
D20 is a single-family attached dwelling.
The last two building types are the least common in the New Cairo market due to their high prices, which makes them only accessible to higher-income users. D19 and D20 only have one story on top of the ground floor. In all the tests, the window locations varied in each dwelling based on their location in the building.
The tested dwellings were already furnished and occupied during this study. Thus, all units’ electric, network, and communication systems were already installed, and their exterior doors and windows were installed and functional. Additionally, all the check valves were installed at the inlets of the discharged flow and exhaust airway in the houses. The required project acceptance and commissioning procedures were completed for all the tested dwellings according to local laws and regulations.
All the tested dwellings had cast-in-situ reinforced concrete structures using a traditional column, beam, or flat slab system. The exterior and interior walls are primarily built using hollow red bricks and plastered with a layer of mortar on both sides. Exterior walls are traditionally built with two layers of bricks (i.e., they are almost double the thickness of interior partition walls). Multiple coats of paint are the primary interior finishing material for all walls and ceilings. Exterior wall finishes varied between exterior paints and other surface finishes. The floors were mainly finished using tiles installed using cement mortar and sand. Roofs and wet areas (i.e., kitchens and bathrooms) featured a layer of a modified-polymer bituminous membrane as a water-resisting layer. Figure 3 presents the typical details of these building elements.
The dwellings’ internal clear height ranged between 2.6 and 3 m. All the tested dwellings featured aluminum- or unplasticized polyvinyl chloride (uPVC)-framed windows and exterior doors. All the exterior openings in the dwellings consisted of sliding windows and window-doors with single or double glass panes. No mechanical ventilation systems were installed in any of the dwellings examined (i.e., the units did not have any HVAC ducts or diffusers), typical of the Egyptian residential building stock. Thus, the fresh air for these dwellings is provided by opening the exterior windows or envelope air infiltration. The dwellings included split unit wall-mounted air conditioning systems in some rooms, commonly used for cooling, cooling, and heating. It is important to note that none of the tested dwellings featured any light structure walls (i.e., metal studs or other) and that no openings or paths existed between the dwellings and their adjacent spaces, such as other units or corridors. It is also important to note that construction specifications and documents were not readily available for all testing units. Thus, the research team had to infer some building characteristics by inspection during the testing.
By inspection, there were apparent differences between the quality and specifications of the units examined. Specifically, the exterior windows and window-doors varied significantly, featuring different aluminum or uPVC window and door profiles, variations in the installation and maintenance quality, and deviations in the quality of their integration in the envelope. Previous research has highlighted that exterior windows and doors are key ALPs [10], so the team recorded the overall fenestration quality for each unit. They were then organized into three distinct categories based on the profiles’ quality, whether or not they had any faults and the quality of their fitting in the envelope. The three categories are as follows:
-
Below average (0): Low-quality aluminum window or door profiles with apparent construction, mechanism, and installation faults. Gaps between the frame and wall are visible and identifiable, with missing caulking and weather strips.
-
Average (1): Acceptable quality aluminum window or door profiles with apparent construction, mechanism, and installation faults. No or minor gaps between the frame and wall can be identified, and most caulking and weather strips are in place.
-
Above average (2): High-quality aluminum window or door profiles with no visible construction, mechanism, and installation faults. No gaps between the frame and wall can be identified, and all caulking and weather strips are in place.
The details of the tested dwellings are displayed in Table 2.

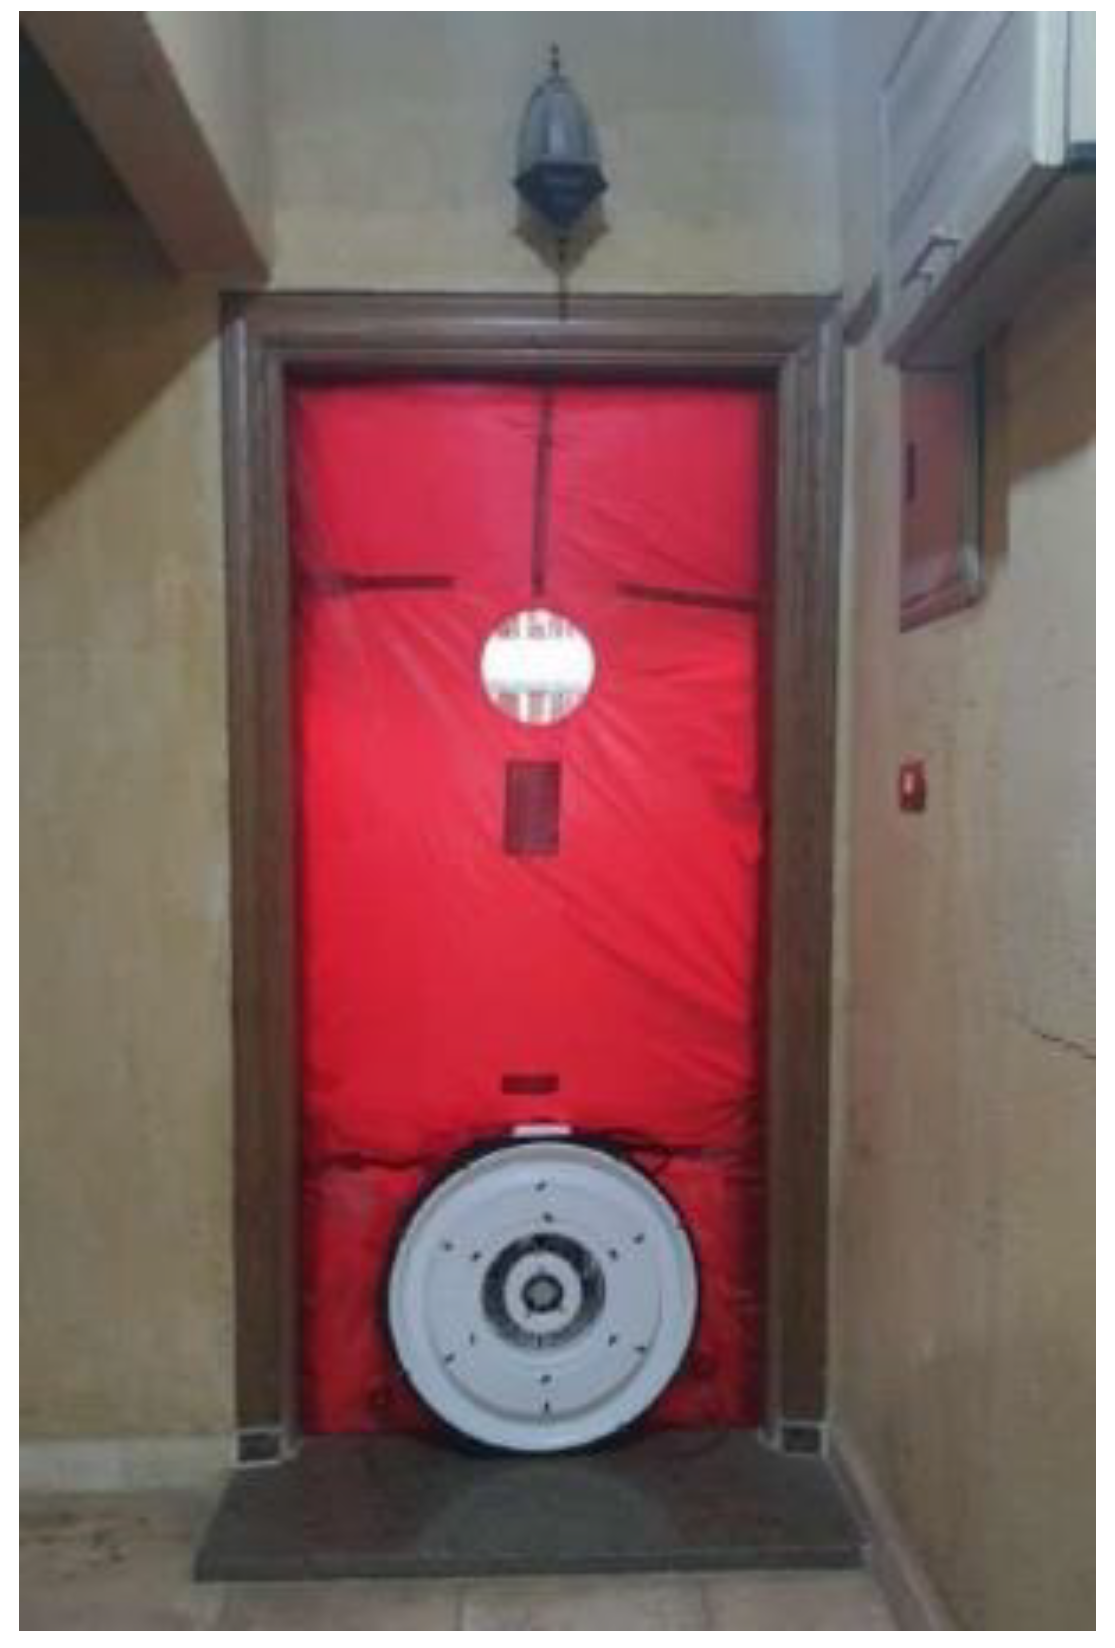
2.3. Air Infiltration Measurements

The tests were conducted between January 2022 and April 2022, according to ISO 9772. During the field testing, the locations’ ambient temperature, wind speed, and wind direction were recorded based on measurements conducted on the site at the tested dwellings’ level. The external dry bulb temperature, atmospheric pressure, and wind speed were measured at the main entrance door level. The indoor dry bulb temperature was measured in the geometric center of the space. A thermal image camera, FLIR E8-XT, was used to capture images to help identify the key leakage pathways. It is conceivable that the meteorological conditions in Egypt during the testing period did not significantly influence the testing results.
All airtightness measurements for the dwellings were carried out following Method B in ISO 9972, using the BDT. The Model 3 Minneapolis Blower Door (220 V) with the DG-1000 pressure and flow gauge test system was used in this procedure [25]. The fan is equipped with a ¾ hp motor, with a maximum flow of 8495 m3/h at 75 Pa and a minimum flow of 145 m3/h, with the appropriate flow rings installed. The pressure and flow gauge have a differential pressure range of −2500 to +2500 Pa (−10 to +10 in. H2O), a display resolution of 0.1 Pa for readings in the range of 0–999.9 Pa, and an accuracy of 0.9% of pressure reading or 0.12 Pa, whichever is greater. The flow reading accuracy is ±3%. The equipment used was recently calibrated by the manufacturer (The Energy Conservatory, Minneapolis, MN, USA). Figure 4 shows the Minneapolis Blower Door system in use.
The researchers ensured that the blower door assembly could convey air into the conditioned or unconditioned compartment at the appropriate airflow rates during the testing. The digital pressure and flow gauges were used to record the pressure difference across the building envelope and the airflow rates. The average exterior pressure was measured using more than one tap since the units had multiple façades. Two sets of tests were completed: one to record measurements under pressurization and the other under depressurization. During the tests, the applied pressure difference over the building envelope was adjusted in ten-point increments (at 10 to 15 Pa intervals), starting at 10 Pa and ending at 75 Pa, for both pressurization and depressurization. Flow and pressure readings were averaged over 30 s, and the fans were covered before and after the tests to measure the baseline pressure over 60 s.
The airtightness test results highly depend on how the dwellings were prepared. Method B in ISO 9972 standard was followed in preparing the tested dwellings. Specifically, the exterior windows and doors were all closed during the test, while the internal doors were all open. The drainage traps in toilets, sinks, and showers were filled with water before the test. Since the buildings tested had no intended natural ventilation holes or mechanical ventilation systems, no preparations were needed for HVAC systems. Knowing the primary causes of infiltration is critical for proposing efficient solutions to improve the airtightness of existing structures. Thus, during the depressurization stage, the primary ALPs were detected using thermal imaging when there was a sufficient temperature differential between the indoor and outdoor conditions, as shown in Figure 5.

2.4. Data Validation and Analysis

All the tests reported in this study meet the requirements of ISO 9972 [4]. Namely, (1) the indoor–outdoor temperature differential multiplied by the building height was less than 250 mK; (2) the wind speed near the ground was lower than 3.0 m/s during the time of the testing; (3) the correlation coefficient between ΔP and the airflow was greater than 0.96 when determining the airflow coefficient C and airflow exponent n using a least squares technique; and (4) the airflow exponent ranged between 0.5 and 1.0. The first two conditions were checked by means of the ambient condition measurements completed for each test. To check Conditions 3 and 4, the corrections for zero flow pressure difference, actual and observed airflow through the fan, and internal/external air density differences were applied to the measured pressure differences and airflow rates. Then, the corrected airflow rate through the building envelope was plotted on a log–log plot against the corresponding pressure difference. Figure 6 shows an example of the graphs produced with a correlation coefficient of 0.999.
The most significant difference recorded between the indoor and outdoor air temperature was 3.78 °C, and the product of building height and indoor–outdoor temperature difference ranged between 6.3 mK and 52 mK. Additionally, the corresponding correlation coefficients from the least squares technique for the tests ranged between 0.96 and 0.98. In conclusion, all the measurements fulfill the corresponding requirements in ISO 9972, and thus the test results were considered valid.
In addition to reporting the direct infiltration and air leakage test results (i.e., Q50), and the standardized parameters (i.e., n50, q50, and w50), the study statistically analyzes the findings to understand correlations between specific building parameters and the infiltration rates. Precisely, and based on the results reported by recent literature in areas with similar construction conditions, the study investigates how the air infiltration results correlate with the following building parameters: FL, FA, AF, V, and AE. Other building parameters derived from these primary parameters were also examined, as presented in Table 3.

3. Results and Discussion

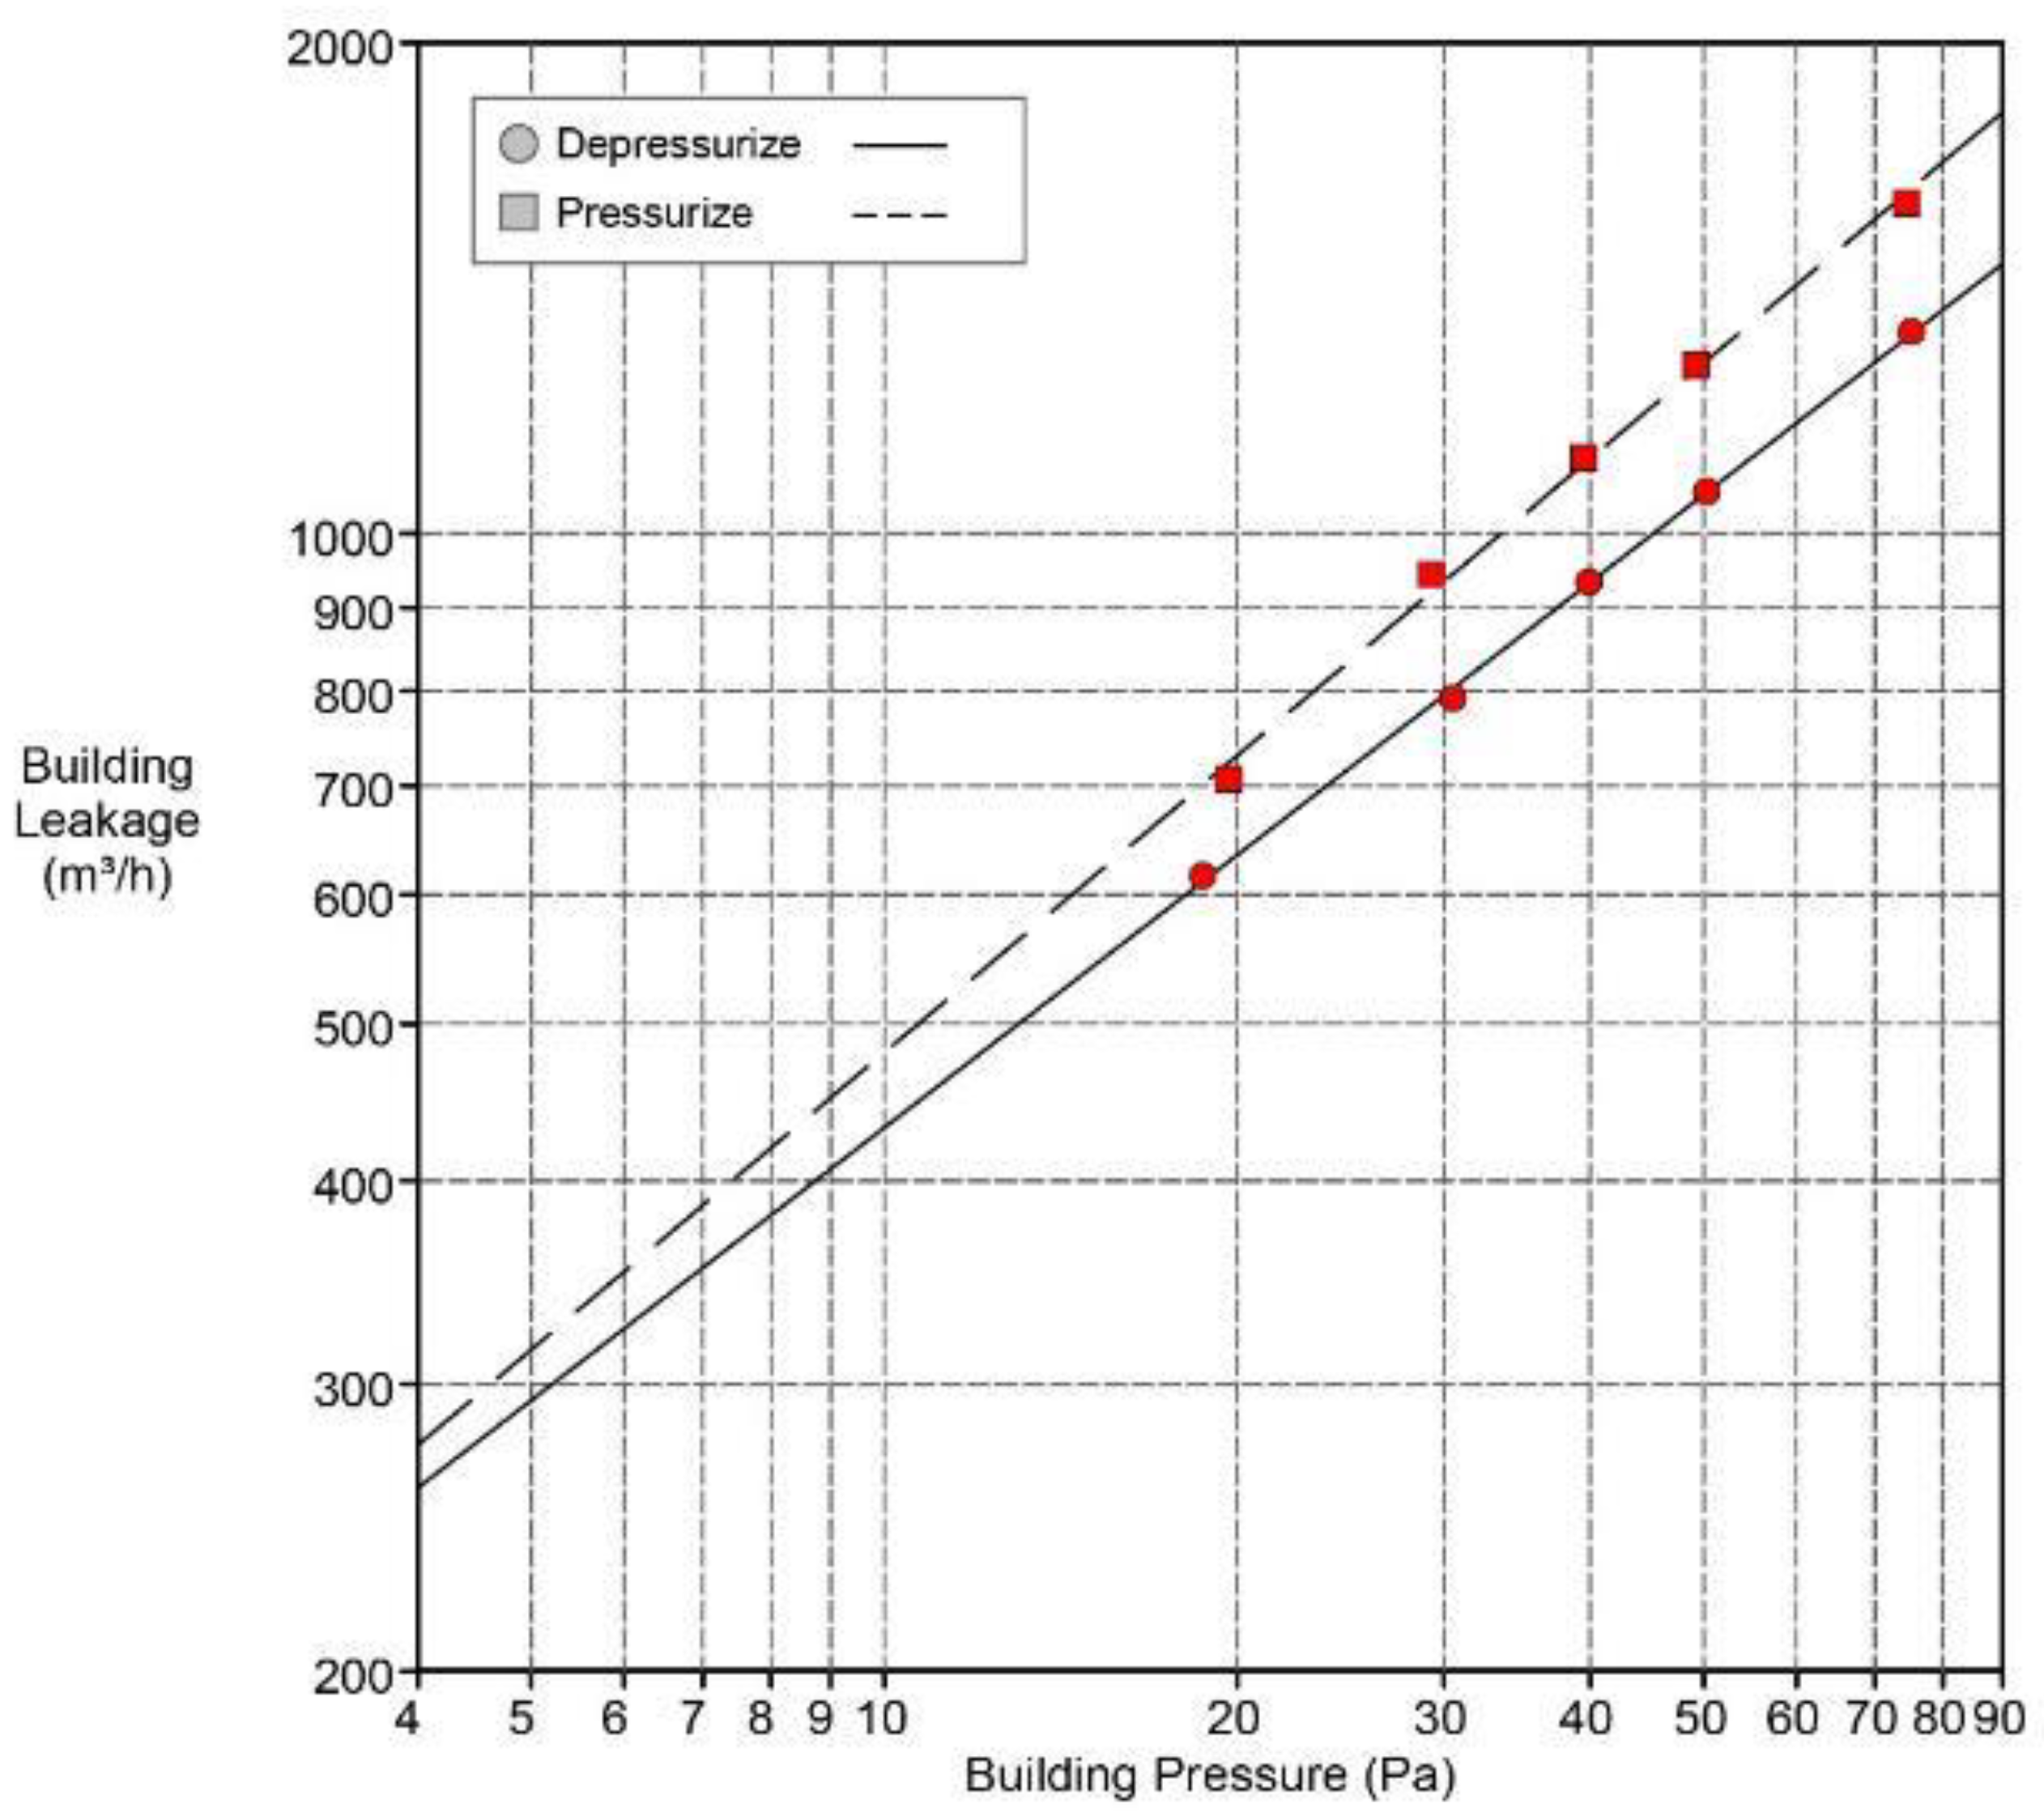
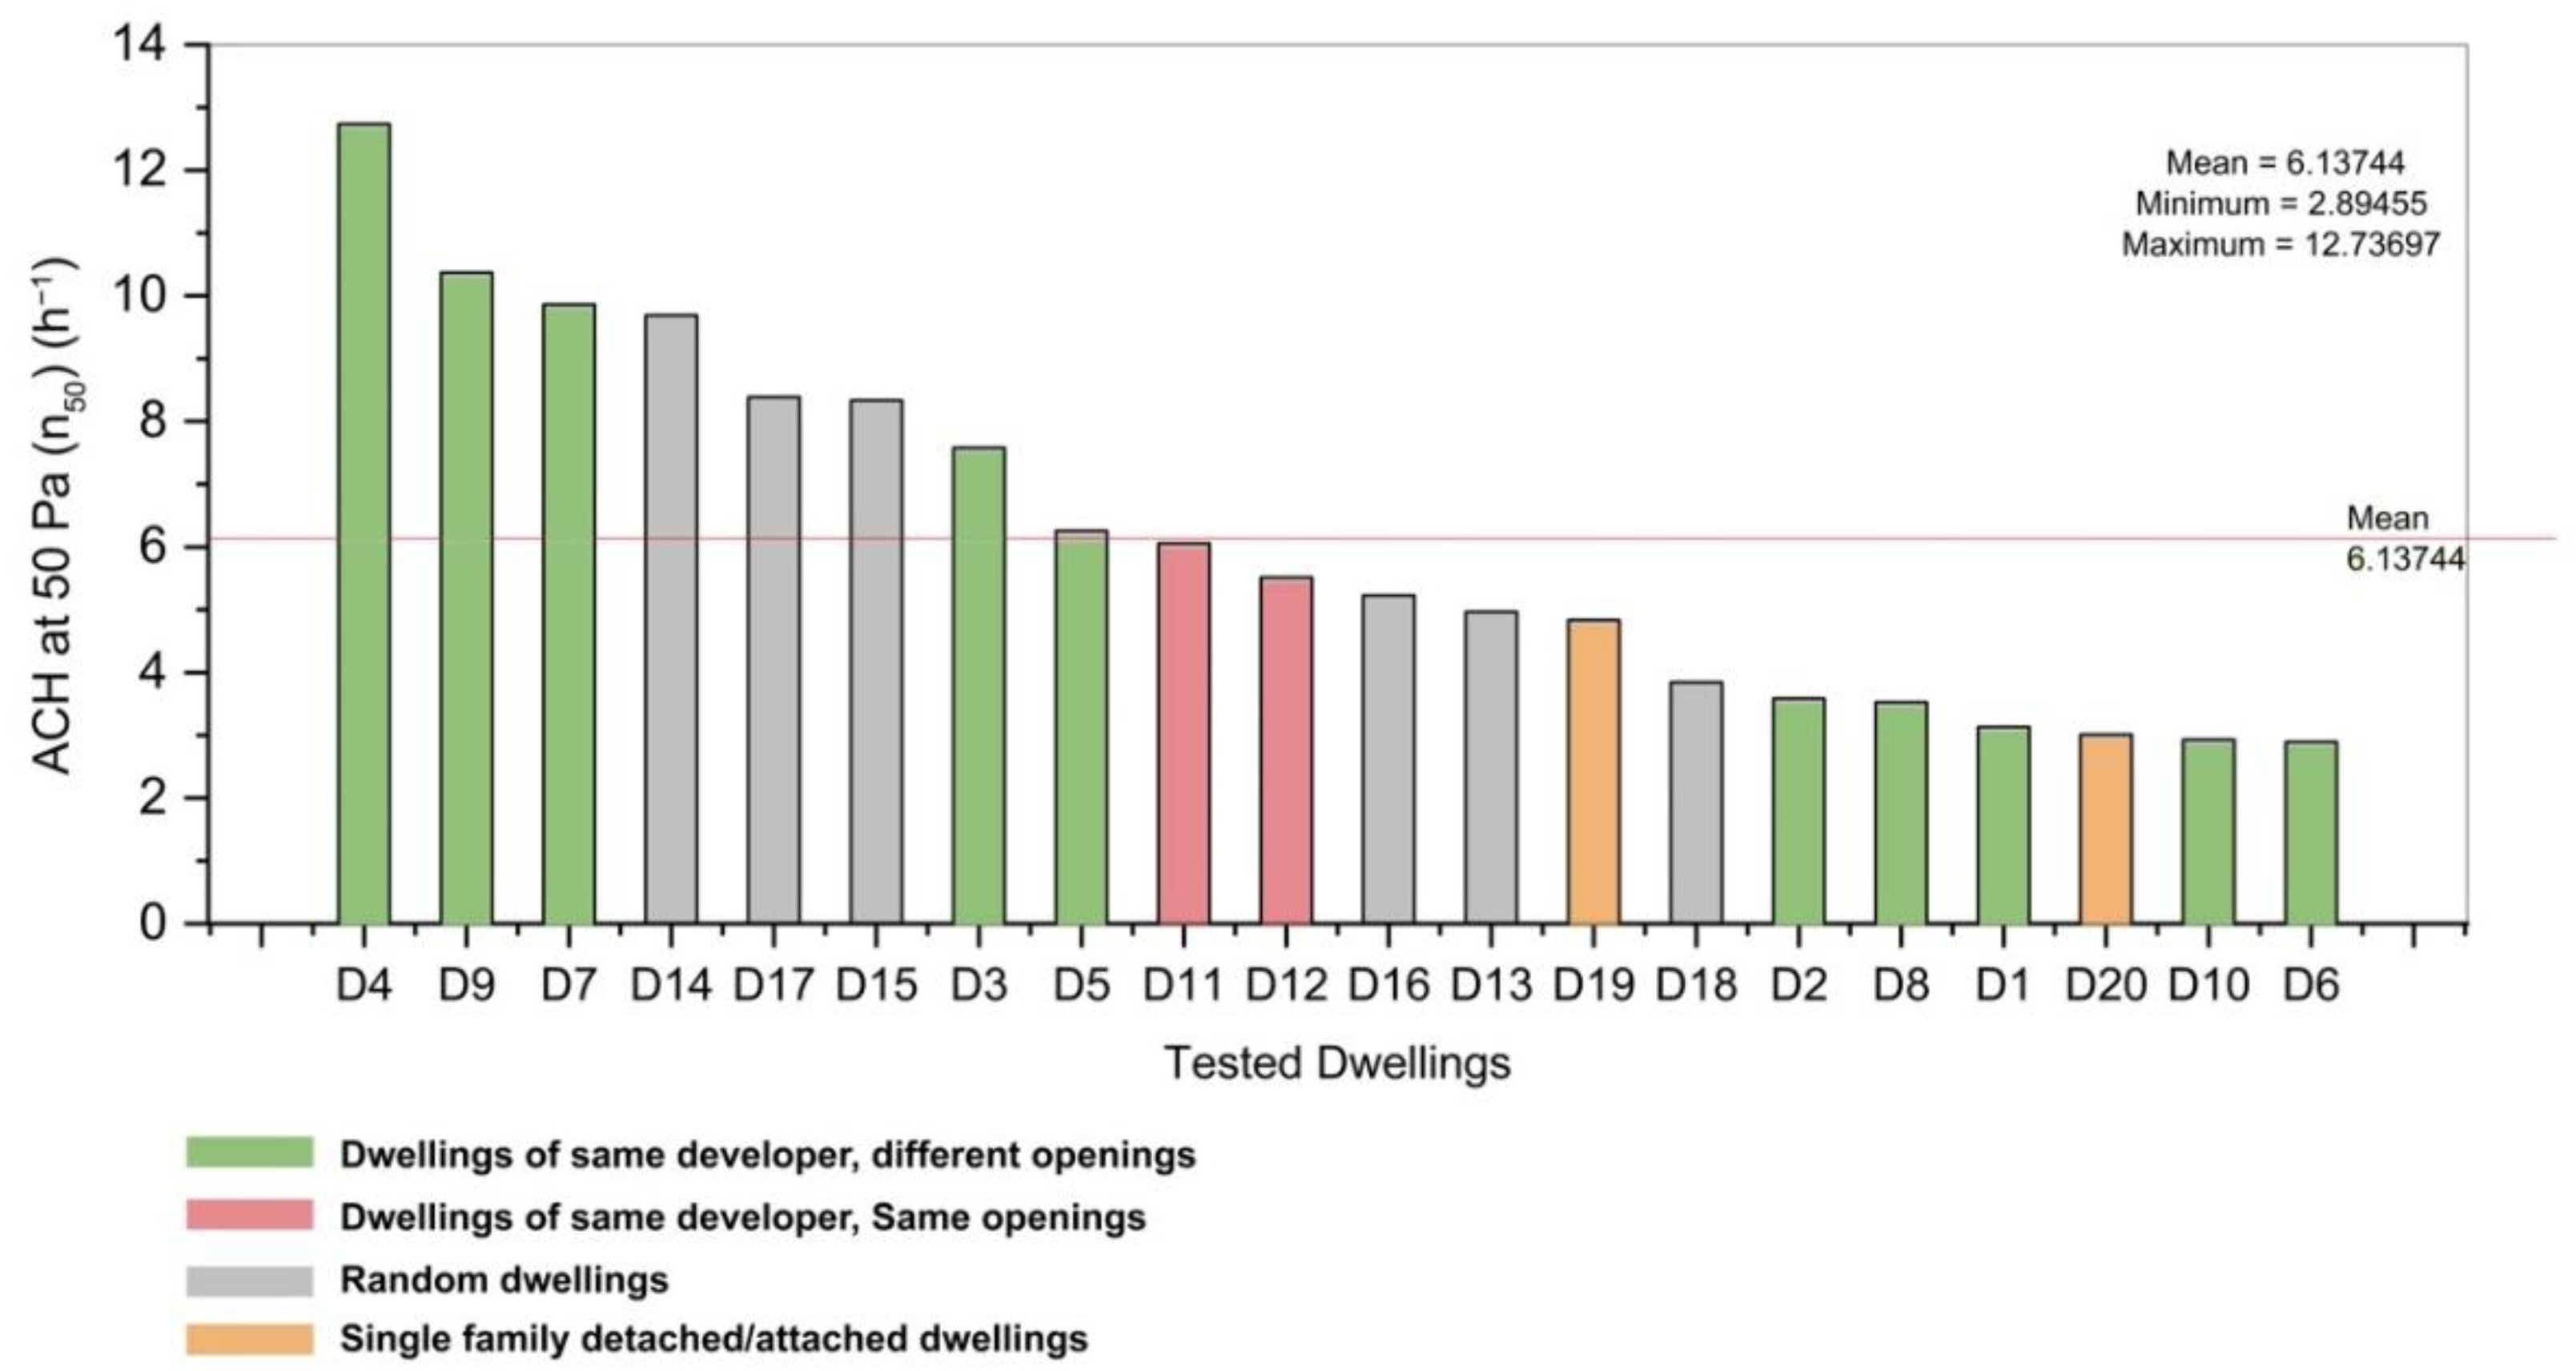
3.1. Airtightness Results Using the Fan Pressurization Method

Table 4 and Figure 7 show the airtightness performance of the 20 tested dwellings. Under a pressure differential of 50 Pa, the air change rate (n50) ranges from 2.89 h−1 to 12.74 h−1, with an average of 6.14 h−1 and a standard deviation of (2.92 h−1). Most of the dwellings tested fell within the medium airtightness category as per ISO 52016-1:2017 [12]. The buildings’ air permeability rate (q50) ranged from 5.75 m3/(h∙m2) to 85.87 m3/(h∙m2) with a standard deviation of 20.63 m3/(h∙m2), and the specific leakage rate (w50) ranged between 7.96 m3/(h∙m2) and 35.02 m3/(h∙m2) with a standard deviation of 8.05 m3/(h∙m2). The results highlight the significant variations among the air tightness indicators in the dwellings tested.
As expected and seen in previous research [1], n50pre was larger than the n50dep for most of the evaluated dwellings (only two dwellings had n50dep equal to or larger than n50pre). This result demonstrates that most tested dwellings are leakier under the pressurization test mode, indicating that some ALPs tend to close or tighten when air moves from the outdoor to the indoor. This observation could be explained by the fact that various building components in the tested dwellings open toward the outside, such as windows, doors, and check valves. Thus, when under pressure, these ALPs components become less airtight.
The dwellings’ leakage assessment or rank varied significantly when using different standardized airtightness parameters. For example, when n50 is used, D4 ranks as the leakiest, and D6 is the most airtight. However, when using q50, D20 is the most airtight, and D4 is the leakiest. This contradicts the expected linear correlation between infiltration and specific building parameters, such as volume and envelope area, in residential dwellings reported by Jokisalo et al. [2]. This variation implies that the building characteristics of the dwellings tested in New Cairo significantly differ from those tested in other locations.
Other studies have found similar variations in their test results and resolved them by investigating correlations between the infiltration and different building parameters. For example, in Greece, Sfakianaki et al. [10] used the standard n50, air change rate, to study its correlation with different building parameters and found that the FLF was the most significant building parameter in predicting infiltration. Additionally, in China, Ji et al. [1] used n50, but found that the shape coefficient was the most significant building parameter in predicting infiltration. However, it is essential to highlight that the correlations with n50, the average flow rate over the volume, could be misleading since both FLF and the shape coefficient depend on the building volume in their calculation.
However, it is clear that the standardized airtightness parameters, n50 and q50, alone are insufficient for comparing infiltration results in situations with significant variations in building conditions. Thus, investigating the infiltration or building parameter best describes the airtightness of a region’s dwellings is critical. As a result, we examined the data further to understand the effect of various building parameters on the airtightness of the dwellings.
We first investigate the effect of background conditions of the dwellings, namely, their position in the building (following Feijó-Muñoz et al. [18]), their year of construction (following Ji et al. [1]), the number of exposed façades, and the observed fenestration quality. We use n50, which is determined by the net volume of the tested space, and q50, which is determined by the envelope area. Following this analysis, we conducted a multi-parameter correlation between the airtightness and building parameters to identify the most significant in predicting the infiltration in the sample.

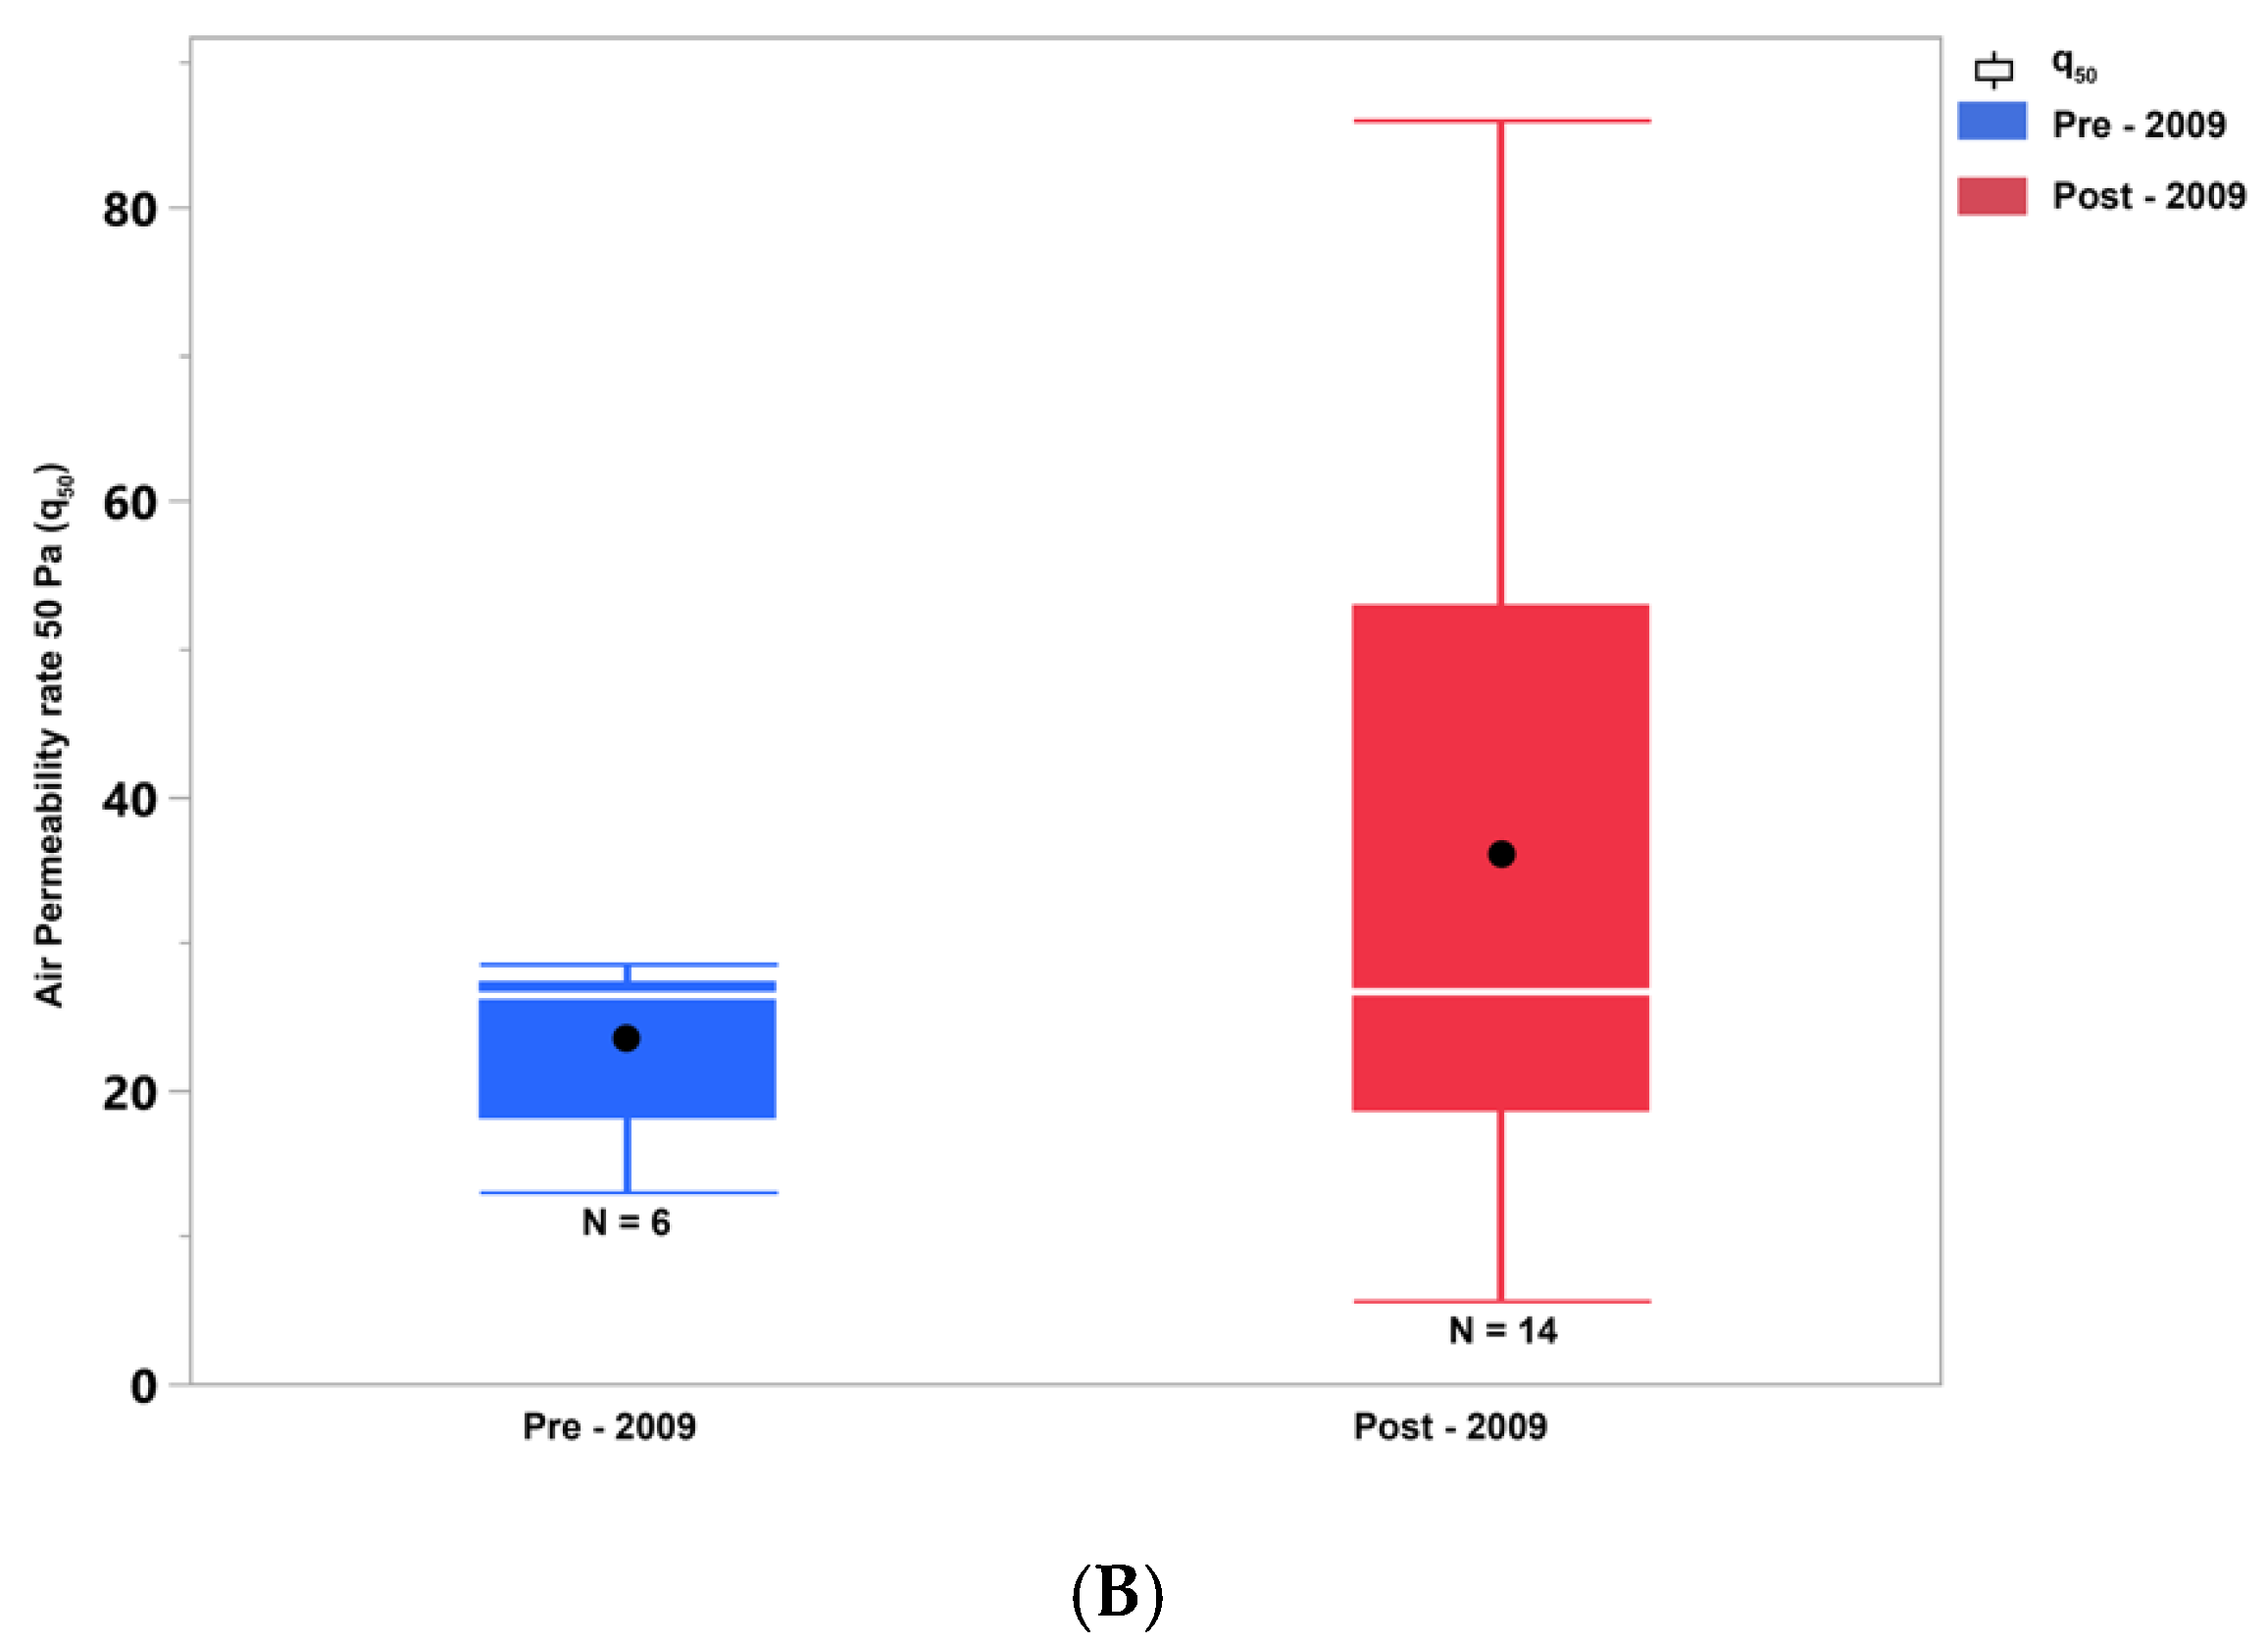
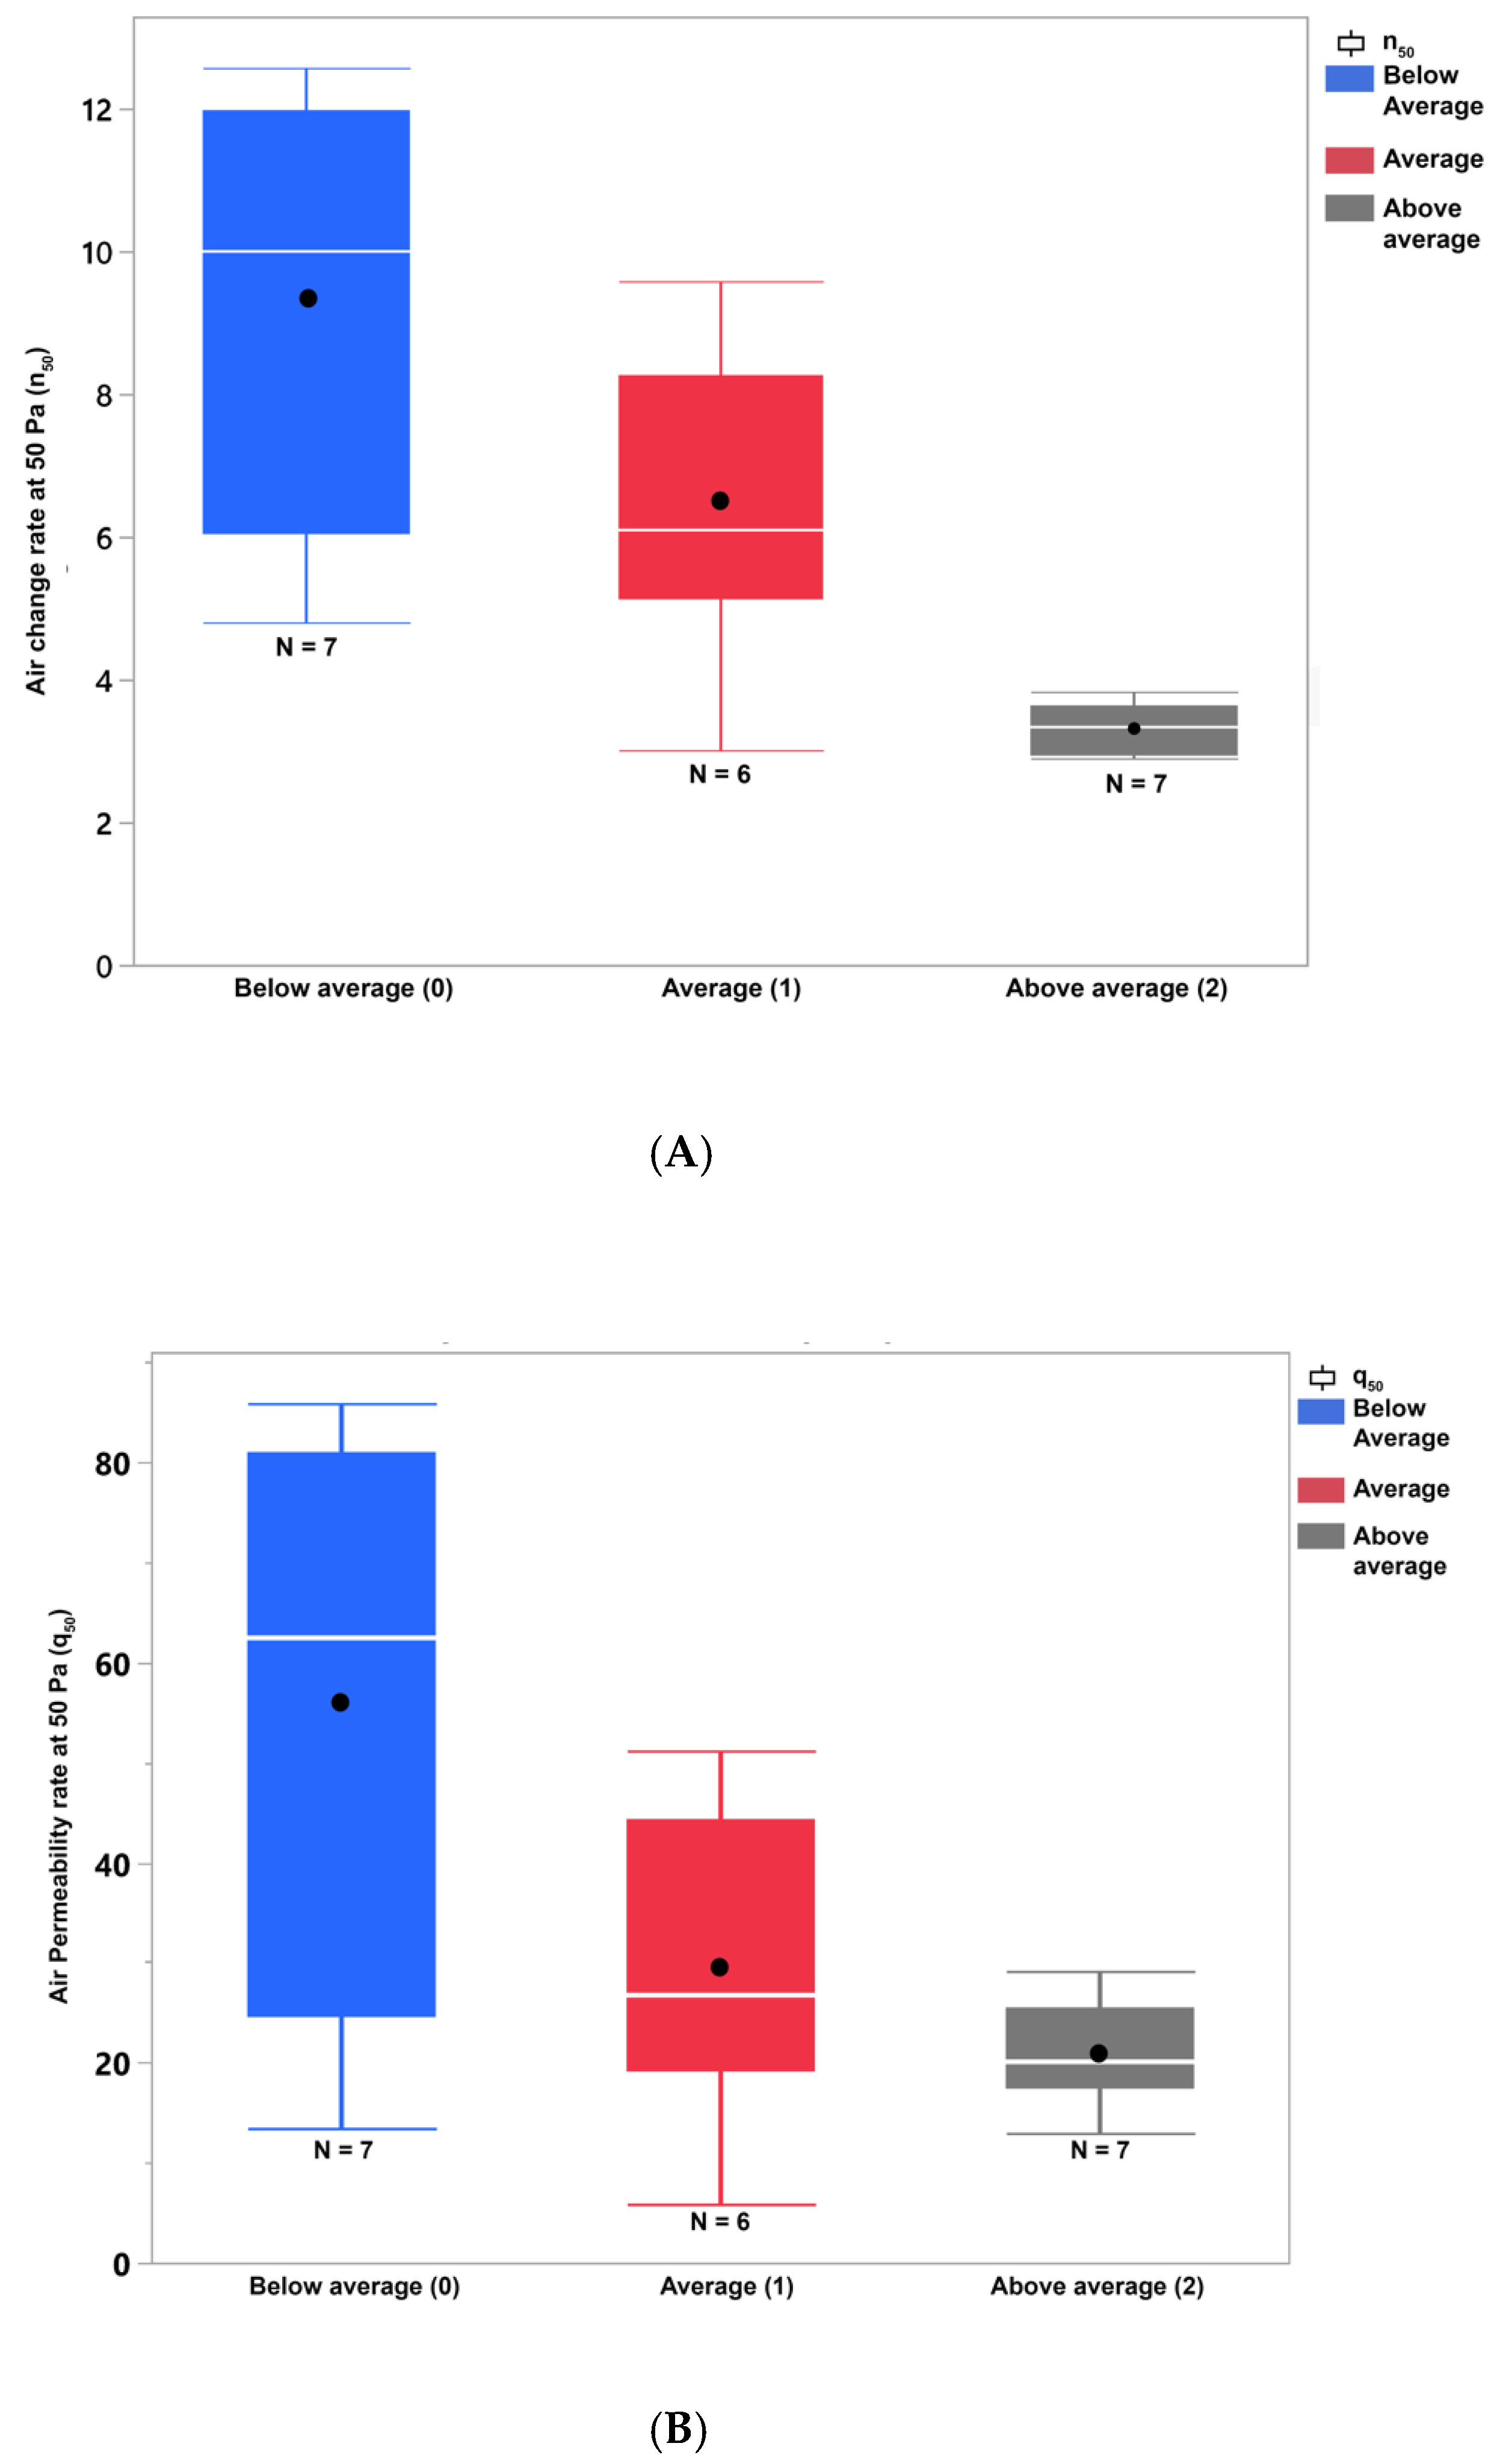
3.2. Investigation of the Effect of the Background Conditions of the Dwellings on Airtightness

The Shapiro–Wilk test of normality revealed that all building parameters (namely: FL, FA, AF, V, AE, FLF, AE/V, FL/AE, FL/AF, and FA/AF) depart from normality (p < 0.005) except for the envelope area (AE) and shape coefficient (AE/V). For the airtightness parameters, the test reveals that the air permeability rate (q50) departs from normality but that n50 and w50 follow a normal distribution (p < 0.005). Thus, we used non-parametric tests to investigate the data set run correlations across these two categories.
We first investigate the effect of the dwelling position in the building on air tightness. For this investigation, only dwellings in multi-unit residential buildings are considered (N = 18). The dwellings in extreme positions (i.e., ground and top floors, N = 9) are compared to the units in intermediate positions (N = 9). It is worth noting that all of the dwellings consisted of only four stories on top of the ground floor.
There are slight differences in the mean n50: 7.11 h−1 for the dwellings in an extreme position and 5.72 h−1 for the dwellings in intermediate positions; and mean q50 values: 36.46 m3/(h∙m2) for dwellings in an extreme position and 32.99 m3/(h∙m2) for dwellings in intermediate positions. However, the Mann–Whitney U Test shows no significant difference between the two samples at p < 0.05 in either of these metrics. This contradicts the findings of Feijó-Muñoz et al. [26], who concluded that dwellings in an extreme position had significantly more infiltration than those in an intermediate position. Figure 8 illustrates these findings. It is important to note that the lack of statistical significance could be due to the small sample size. Additionally, the fact that all the buildings have only five floors poses another limitation since the effect of the position could be better measured in buildings with different heights.
We then investigate the construction year. We divide the sample into two groups, pre-2009 (N = 6) and post-2009 (N = 14). The year 2008 saw the publication of new construction laws in Egypt, with the publication of the Unified Law for Constructions [27] and its executive regulations published, which were published in 2009 [28]. As seen in Figure 9, in the pre-2009 sample, the average q50 is 23.44 m3/(h∙m2) and 35.97 m3/(h∙m2) for the post-2009 group. However, the n50 indicates that the post-2009 dwellings have almost equivalent ACH to those constructed pre-2009 (with an average of 6.24 h−1 and 6.21 h−1, respectively). The Mann–Whitney U Test confirms no significant differences between the airtightness metrics of the two samples at p < 0.05. This is justified, given that the executive regulations of the unified building law [28] set some regulations on the sizes and orientation of the openings and also set minimum window-to-wall ratios in residential buildings but do not include air infiltration or window quality within the regulations. Thus, the year of construction did not affect the infiltration values. This is in contrast to the expected findings in other countries where changes in the building regulations usually entailed more stringent infiltration limits, such as various European nations and North America [18,29,30]. It is important to note that the test results are also limited due to the large spread of the sample dwellings’ construction date and the small sample size. We recommend that more tests be conducted to specifically target buildings constructed prior to and after 2009 in the same location to further test the effect of the new building regulations on infiltration.
Even though the mean values for n50 and q50 did not change significantly, the ranges of the values post-regulation are much more expansive, which shows the indirect effect of having other regulations, such as minimum WWR, on air infiltration. It is important to emphasize that the focus of the significance test is not to see the direct impact of the year of construction on infiltration, as the changes in construction techniques and materials among the tested dwellings are subtle due to the range of years included. However, the intent is to observe the effect of changing regulations on infiltration and compare it to other regulations in European countries, for example.
We then investigated the effect of façade exposure on airtightness. We divided the sample into two groups: dwellings with two or fewer exposed façades (N = 11) and dwellings with more than two façades (N = 9). As seen in Figure 10, dwellings with two or fewer exposed façades are leakier than those with more than two exposed façades, with an average n50 of 6.67 h−1 and an average q50 of 38.69 m3/(h∙m2) for dwellings with two or fewer exposed façades compared to an average n50 of 5.54 h−1 and an average q50 of 24.29 m3/(h∙m2) for dwellings with more than two façades.
The Mann–Whitney U Test shows no significant difference between the n50 of the two samples at p < 0.05. However, the test returns a significant difference between the values of q50 (at p < 0.05). This finding is in line with the results reported by Gomes in their study of Portuguese multi-unit residential buildings [31], which explained the higher leakage in less-exposed façades by differences in wind pressures and the dwelling directions. In this study, this finding could be because dwellings with more than two exposed façades had larger floors, volumes, and envelope areas, leading to smaller air tightness metrics. However, due to the small sample size, further investigation is required to determine the reasons for the significant differences in q50 between the two groups.
Finally, we investigated the effect of the observed fenestration quality on airtightness. While fenestration quality has not been directly investigated in previous work, other researchers have resorted to studying how regulation changes affect infiltration. These building regulations often include minimum specifications for windows and exterior doors, as well as stringent commissioning guidelines for fenestration finishes and installation. We compare the three groups, Below Average (N = 7), Average (N = 6), and Above Average (N = 7). The box and whisker plots in Figure 11 show differences in the n50 and q50 between the three groups, with below-average quality fenestration group having an average of 9.42 h−1 and 54.42 m3/(h∙m2), the average group 6.61 h−1 and 24.72 m3/(h∙m2), and above-average group 3.48 h−1 and 16.42 m3/(h∙m2). We compare the three groups using the Mann–Whitney U Test, which shows a significant difference in n50 and q50 at p < 0.05 between the above-average and average fenestration quality groups, and between the average and below-average fenestration quality groups. This indicates that the observed fenestration quality was a major determining factor in the air leakage characteristics of the dwelling.

3.3. Correlation between Air Tightness Measurements and the Dwelling Background Conditions

We employed Spearman’s correlation analysis to investigate the potential relationship between various building and airtightness parameters. Specifically, we focused on the building parameters discussed in Section 3.2 and assessed their potential impact on air infiltration. Table 5 shows that the year of construction, number of exposed façades, and floor position did not demonstrate a statistically significant correlation with air infiltration, despite observed variation in the data. However, we identified a significant correlation (at p < 0.001) between fenestration quality and both n50 and q50 as shown in Table 5, indicating that the quality of windows and doors can play a critical role in air tightness.

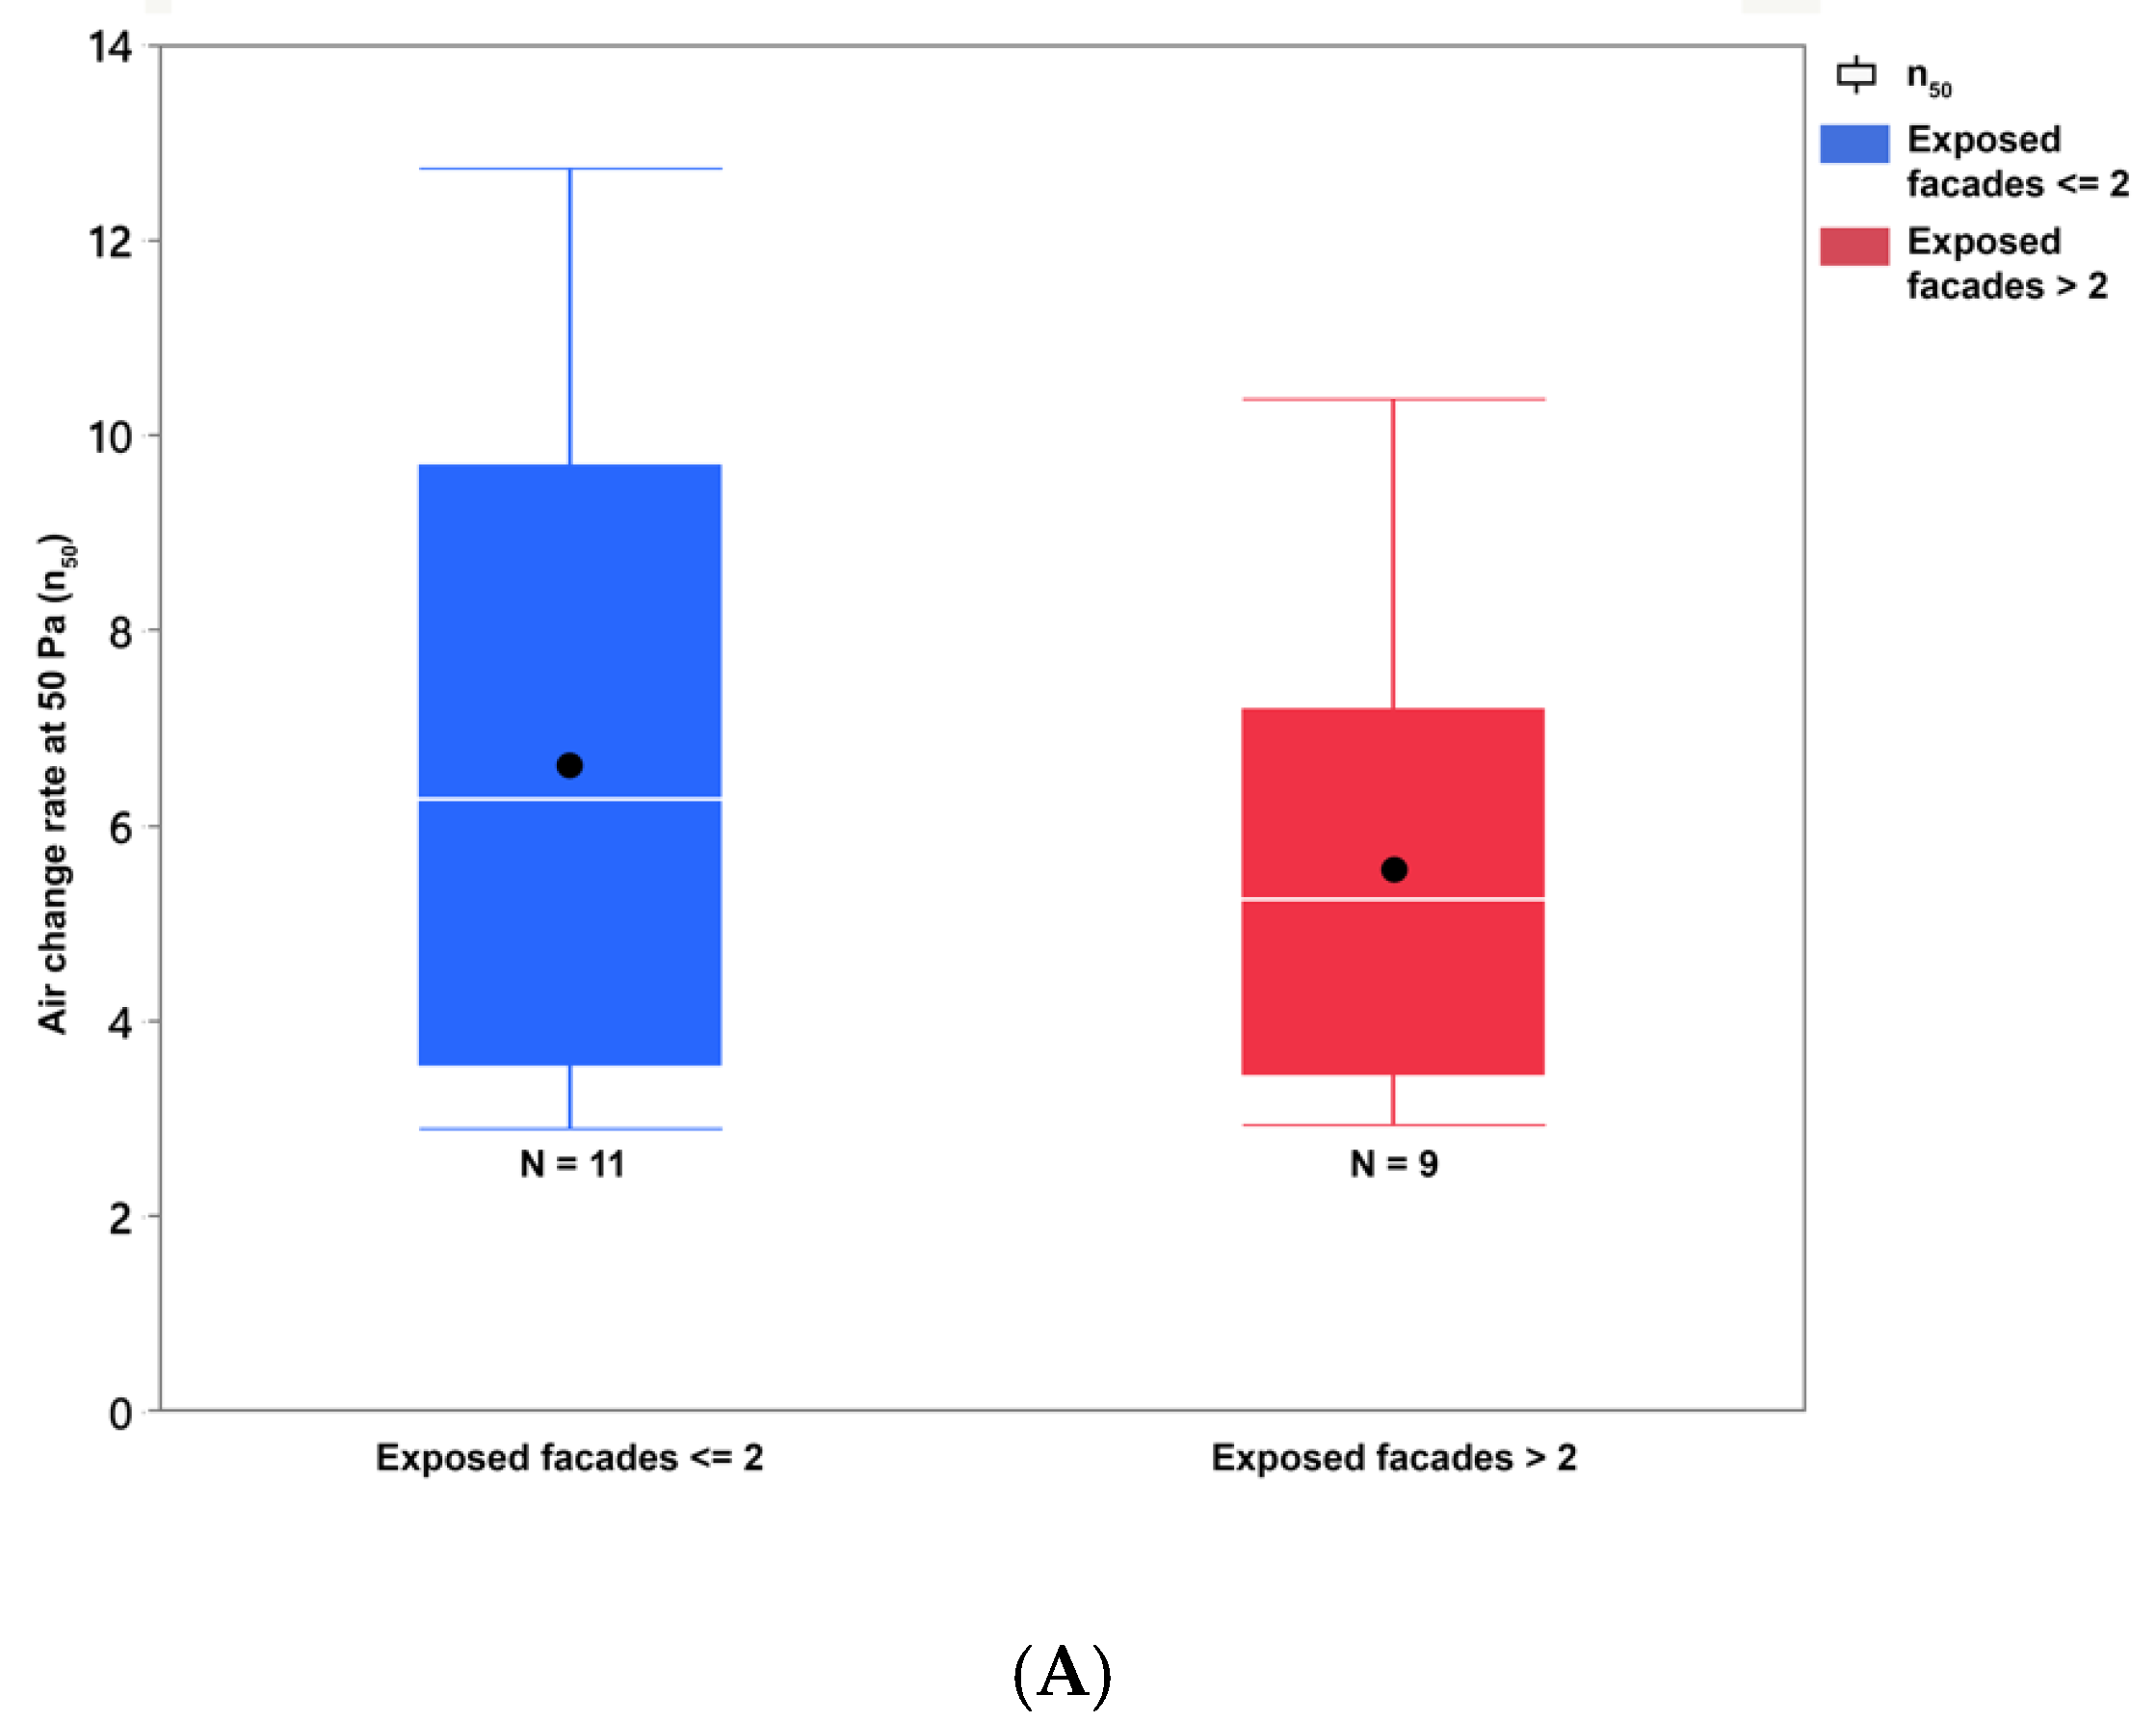
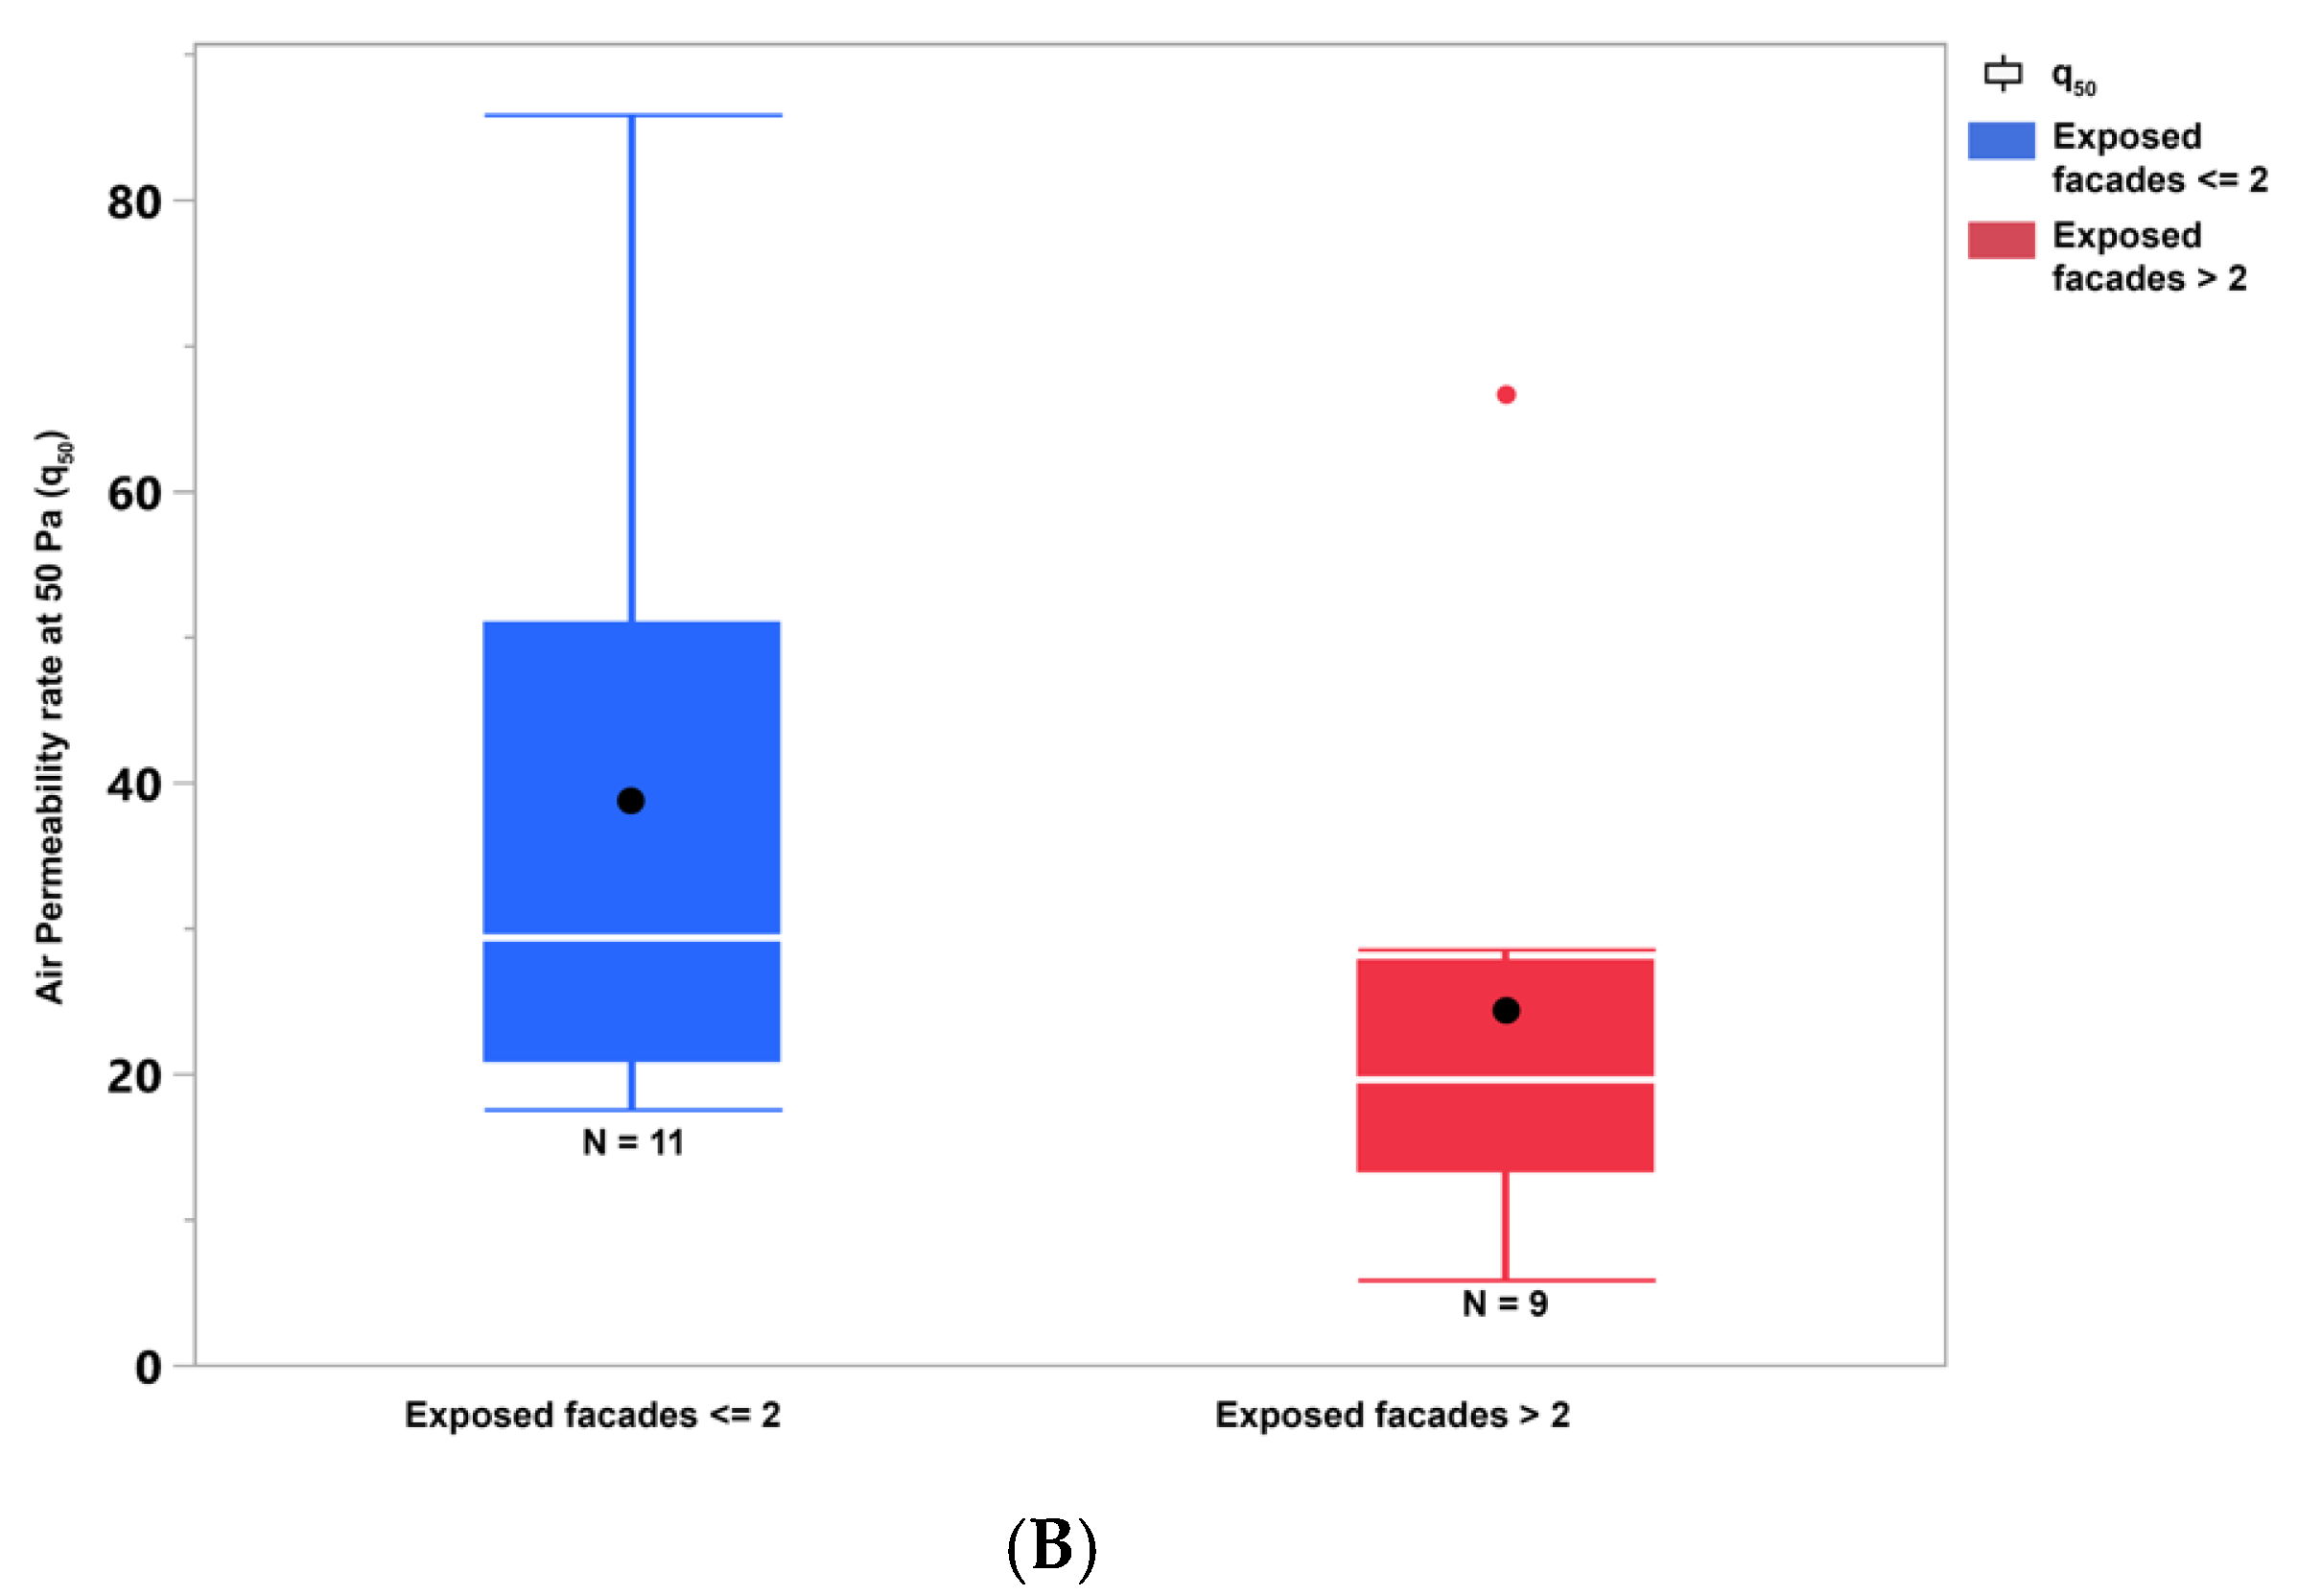
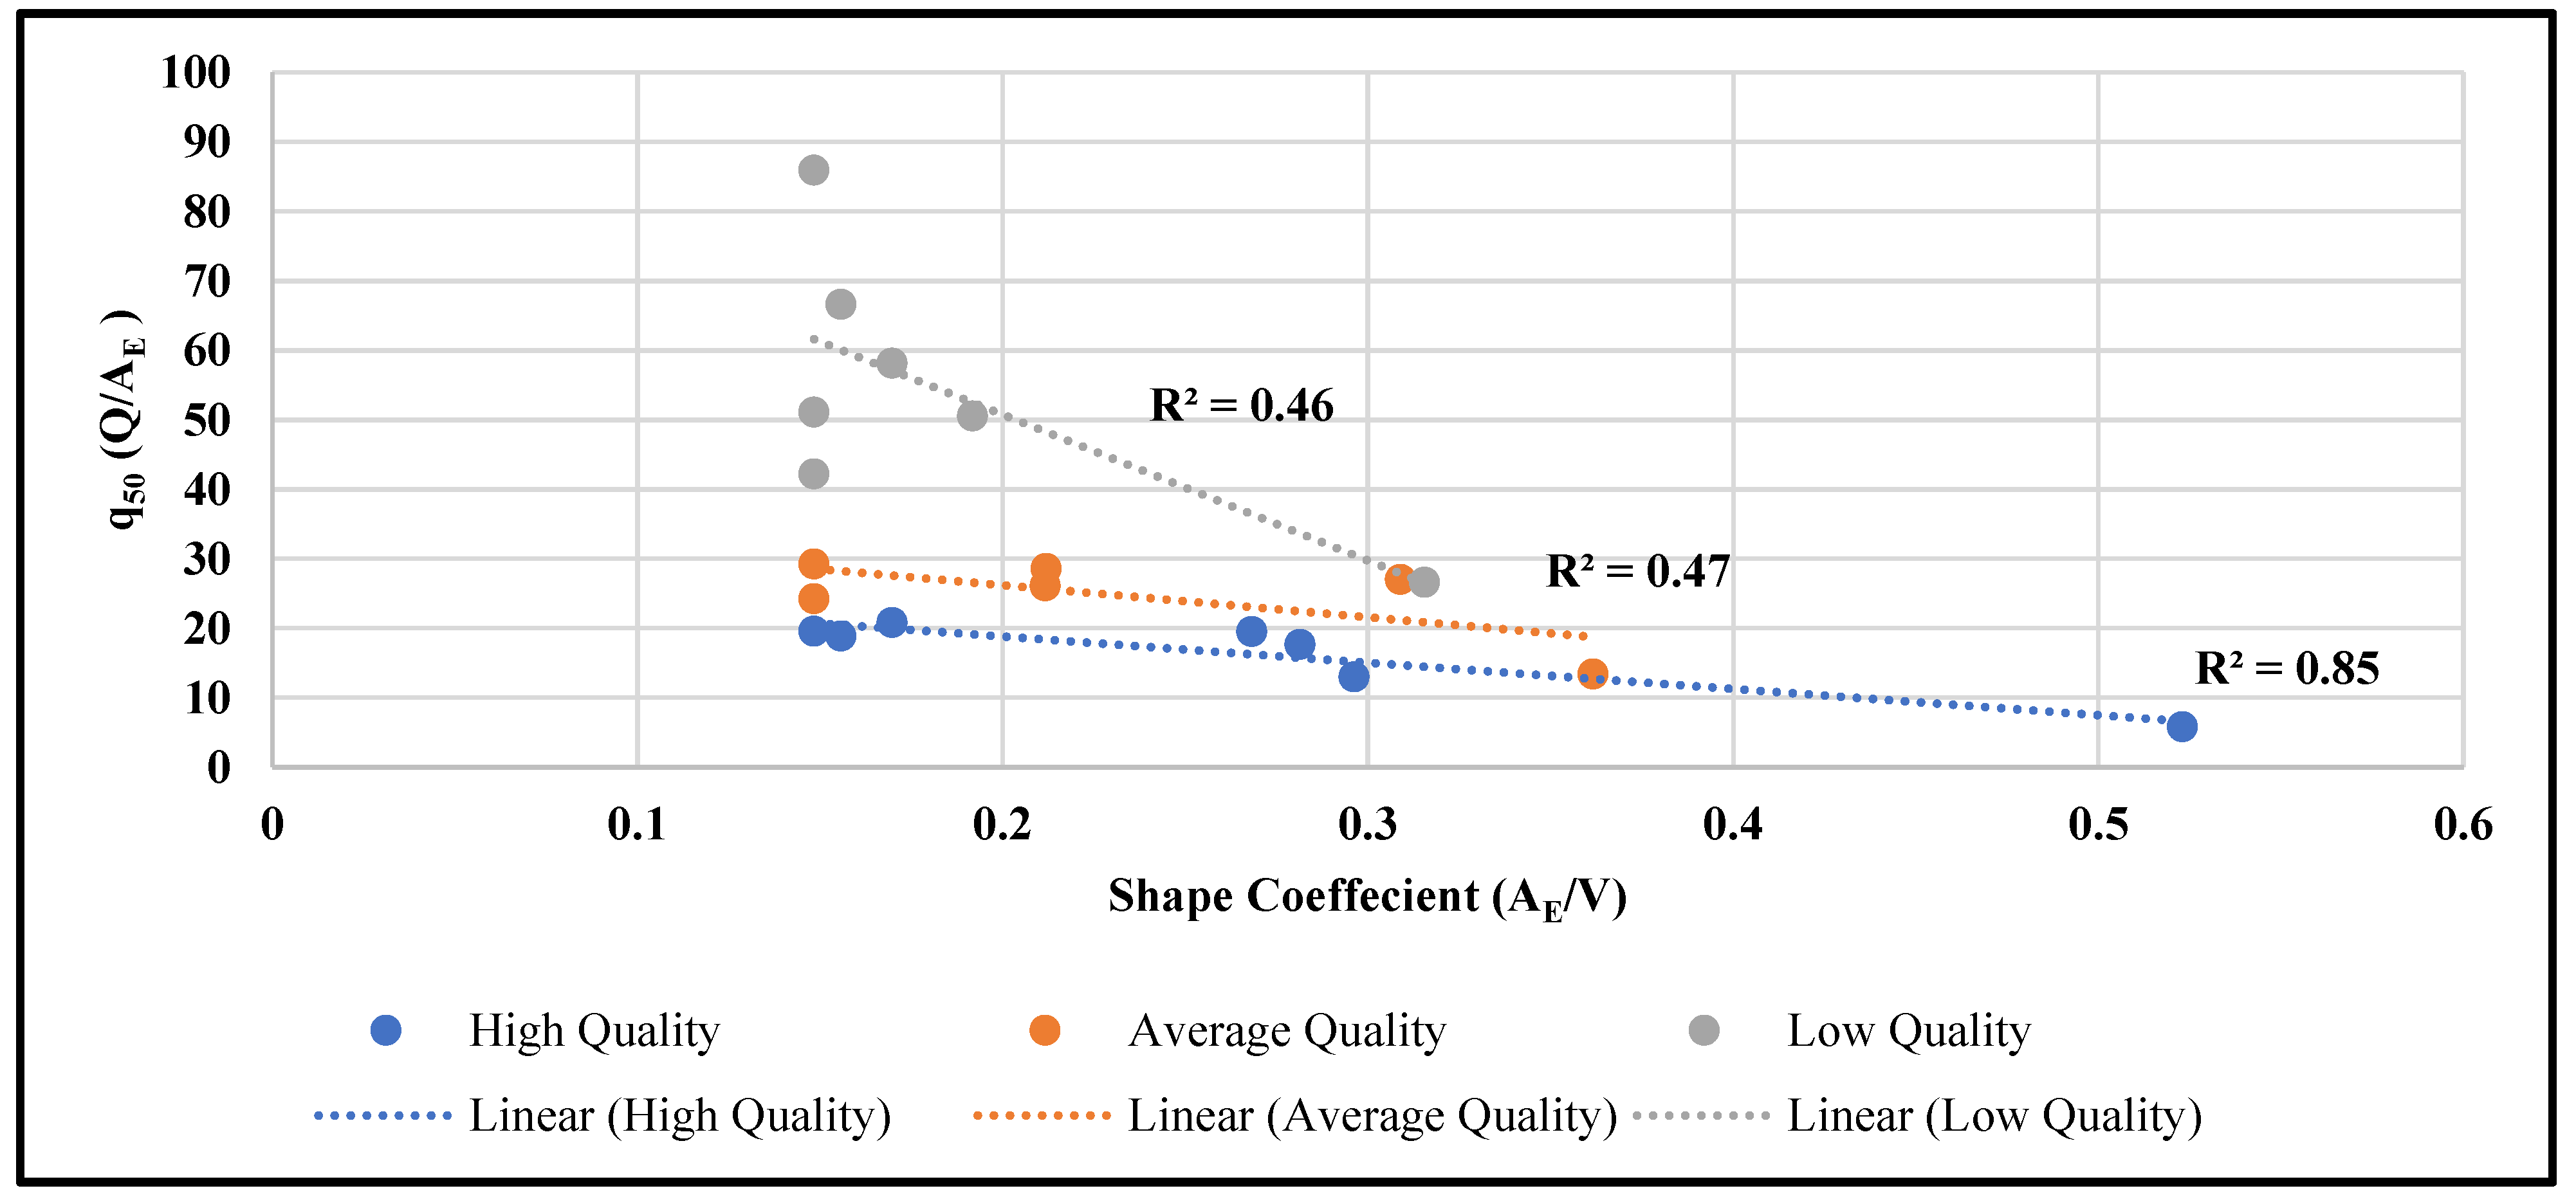
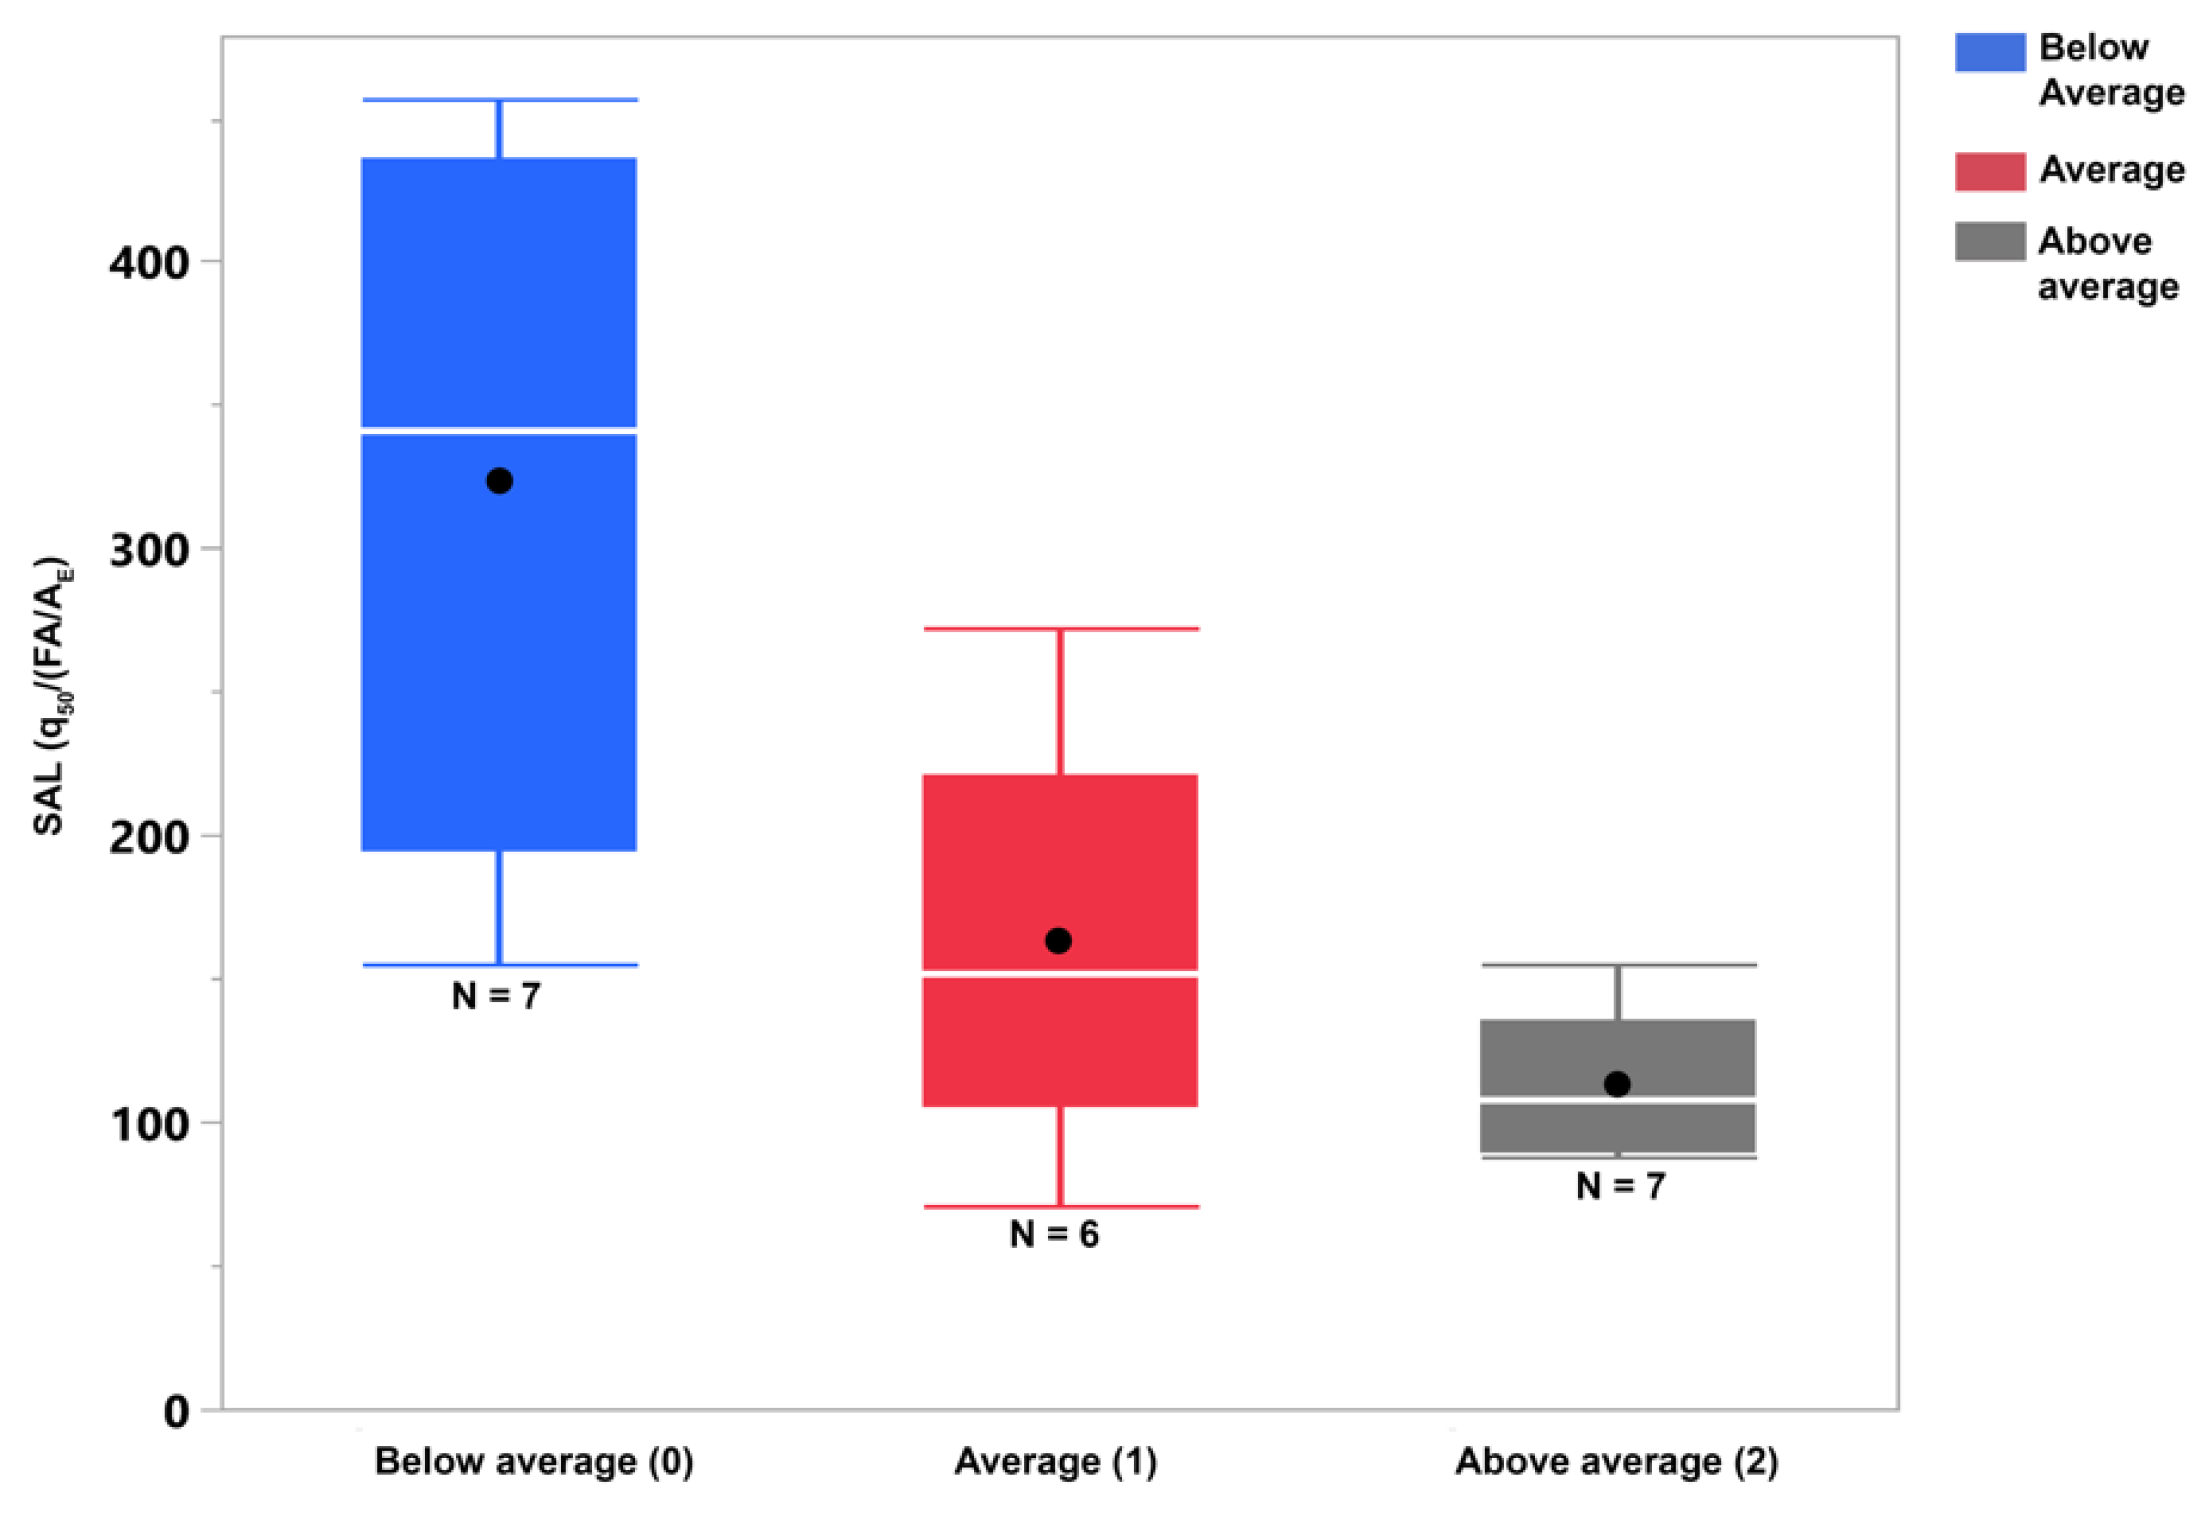
3.4. Correlation between Air Tightness Measurements and Different Building Parameters

To expand our investigation, we measured additional building parameters including floor area, volume, envelope area, frame length, and frame area, and conducted a correlation analysis with different air infiltration parameters. As shown in Table 6, we found no significant correlations at p < 0.001. However, we found that the q50 is correlated with the shape coefficient (AE/V) and FL/AE (at p < 0.01), while AE, and FA/AE (at p < 0.05). These correlations confirm that the overall infiltration depends on the dwelling’s envelope and fenestration characteristics. What is important to highlight is that n50 and w50 are not correlated with any building parameters. This contradicts previous research findings and highlights that the ACH or n50 value is not an effective parameter for predicting and comparing the tested dwellings’ airtightness.
Considering that both the n50 and q50 differed significantly based on the observed fenestration quality, we re-ran Spearman’s rank-order correlation conditional on the observed fenestration quality. Table 7 shows the result of this correlation. We found three significant correlations at p < 0.01. Namely, the correlations between q50, the shape coefficient at −0.625, and the specific aperture at 0.605. This finding is similar to that of Ji et al. [1], whereby they also found that the shape coefficient was the most significant parameter in predicting infiltration in their test sample.
We plotted the linear correlation between the q50 and the shape coefficient (Figure 12) and the q50 and the specific aperture (Figure 13) based on each of the three fenestration categories (i.e., below average, average, and above average). We found the linear correlation between q50 and the specific aperture more robust and coherent. This is in line with the work of Sfakianak et al. [8,10,32], where they found that window-related parameters, such as FLF, tend to provide more accurate predictions of leakage in tighter dwellings based on the testing they conducted in dwellings built with heavy construction materials.
As seen in Figure 13, the group of dwellings with an average fenestration quality, the linear trend line has an R2 value of above 0.89 for the above-average quality fenestration group, an R2 value of 0.79 for the average quality fenestration group, and an R2 value of 0.16 for the below-average fenestration quality group. The bigger variations in the quality of those cases explain the decreasing correlation trend.
Thus, in the dwellings tested, which use heavy construction materials and have no mechanical ventilation systems, the number of openings (i.e., the ratio of exterior openings to the envelope area) and the quality of these fenestrations are the two critical determinants of infiltration. The specific aperture, q50/(FA/AE), could be considered an effective measure to understand and compare infiltration in these dwellings. We propose the specific aperture leakage rate (SAL), defined as the quantity of air envelope leakage rate in m3/(h∙m2) at 50 Pa in reference to the percent of exterior openings in the envelope. This directly links the predicted infiltration rates to the window-to-wall ratio, a widely used parameter in environmental design and assessment. Figure 14 shows the SAL distribution across the three observed fenestration quality categories.

4. Conclusions

Airtightness is a critical factor in determining the energy performance of buildings and the comfort and well-being of their occupants. Air infiltration has been extensively studied through field tests over the last decades, yet significant data gaps in infiltration data in developing nations still exist. The cross-applicability of the available field data in different locations is not possible due to the different construction standards, materials, technologies, and significant differences in airtightness regulations. In recent years, researchers have started to collect and publish airtightness data from locations with limited or no existing data available.
Against this backdrop, this study presented the first effort to collect and analyze data pertaining to new residential buildings in New Cairo, Egypt. Twenty dwellings were selected based on a clear sampling criterion, and were tested following Method B in ISO 9972, using the BDT, in which all ventilation and air conditioning systems in the dwellings were sealed, and any natural ventilation openings were closed. All the sample units were built using the same building materials and techniques, and the sample featured different residential typologies. However, significant variations were observed in the quality of the fenestration, ranging from low-quality profiles with major installation faults to high-quality profiles that are well-installed.
Most of the tested units fell within the medium category of airtightness as per ISO 52016-1:2017 [12], and their n50 ranged from 2.89 h−1 to 12.74 h−1, with an average value of 6.14 h−1. The large variations in the airtightness parameters underscore the significant difference in the tested dwellings’ building parameters and construction quality. Thus, we investigate how the dwellings’ basic characteristics affect the infiltration. For the position of the dwelling within the building, for the dwellings in extreme positions, the mean n50 q50 values were found to be 7.11 h−1 and 36.46 m3/(h∙m2) respectively, and for dwellings in intermediate positions, the mean n50 q50 values were found to be 5.72 h−1 32.99 m3/(h∙m2), respectively. When comparing the mean value of n50 (and q50) for pre-2009 regulation dwellings to those built after 2009, we found it to be 6.24 h−1 and 6.21 h−1 (23.44 m3/(h∙m2) and 35.97 m3/(h∙m2)), respectively. Finally, buildings with two or fewer exposed façades showed a mean n50 of 6.67 h−1 and a mean q50 of 38.69 m3/(h∙m2), compared to 5.54 h−1 and 24.29 m3/(h∙m2) for dwellings with more than two façades. While the differences in the position of the dwelling within the building, the year of construction, and the number of exposed façades were found not statistically significant, this could be attributed to the small sample size.
On the other hand, the observed fenestration quality was significant in predicting infiltration rates and air change rates. Based on this, further examinations confirmed that the air permeability leakage rate (q50) is strongly correlated with the specific aperture factor. The linear correlation between q50 and the aperture factor confirmed this, showing an R2 of 0.89, 0.78, and 0.16 for the above-average, average, and below-average fenestration quality groups. The study concludes that the quality and quantity of the fenestrations are key parameters in predicting infiltration in the tested dwellings.
We propose the specific aperture leakage rate (SAL) as a valuable metric for comparing dwellings with properties like that of this study’s sample, including new residential buildings in the city of Cairo, and to estimate the leakage in dwellings based on their window-to-wall ratio, which is a building parameter commonly used to assess other environmental performance metrics.
We recommend further research to conduct additional testing on units with similar characteristics and use published data, such as those found in southern Europe [9,10,27,33,34], to validate this conclusion further and overcome the limitations posed by the relatively small sample examined in this study. Thus, this study could be considered an initial investigation for a more considerable effort to collect and analyze infiltration detail in Egypt, the Middle East, and North Africa. Finally, based on the reported finding, we recommend that countries with no energy codes for buildings, such as Egypt, include basic regulations and commissioning requirements for windows and fenestration in their general building codes to control infiltration in newly constructed dwellings.

Author Contributions

Conceptualization, R.R. and S.G.; methodology, R.R.; software, R.R. and A.M.; validation, R.R. and S.G.; formal analysis, R.R., A.M. and S.G.; investigation, R.R.; data curation, R.R. and A.M.; writing—original draft preparation, R.R.; writing—review and editing, A.M. and S.G.; visualization, R.R. and A.M.; supervision, S.G.; project administration, S.G.; funding acquisition, S.G. All authors have read and agreed to the published version of the manuscript.

Funding

This research was funded by the Office of the Associate Provost Research, Innovation and Creatively (APRIC) at the American University in Cairo.

Institutional Review Board Statement

Not applicable.

Informed Consent Statement

Not applicable.

Data Availability Statement

All collected data are enclosed within the manuscript.

Acknowledgments

The authors would like to acknowledge the internal funding from the American University in Cairo’s Office of the Associate Provost for Research Innovation and Creativity, and Dean of Graduate Studies, without which this work could not have been completed. The authors would also like to thank Khaled Tarabieh for his technical support and Basil Kamel for his managerial support. Finally, the authors would like to acknowledge the excellent copyediting and revision support from Laila ElRefaie.

Conflicts of Interest

The authors declare no conflict of interest.

Abbreviations

PPressure differencePa (Pascals)
AEEnvelope surface aream2
AFNet floor surface aream2
FATotal exterior opening frame aream2
FLTotal exterior opening frame lengthm
FLFFrame length factorm−2
n50 (ACH50)Air change rate at 50 Pah−1
Q50Airflow rate at 50 Pam3/h
q50Air permeability rate at 50 Pam3/(m2∙h)
SCShape coefficientm−1
VNet building or space volumem3
w50Specific leakage rate at 50 Pam3/(m2∙h)
ALPAir leakage path
ASHRAEThe American Society of Heating, Refrigerating and Air-Conditioning Engineers
ASTMAmerican Society for Testing and Materials
BDTBlower door test-
ELAEffective leakage area distribution
ISOInternational Organization for Standardization

References

  1. Ji, Y.; Duanmu, L. Airtightness Field Tests of Residential Buildings in Dalian, China. Build. Environ. 2017, 119, 20–30. [Google Scholar] [CrossRef]
  2. Jokisalo, J.; Kurnitski, J.; Korpi, M.; Kalamees, T.; Vinha, J. Building Leakage, Infiltration, and Energy Performance Analyses for Finnish Detached Houses. Build. Environ. 2009, 44, 377–387. [Google Scholar] [CrossRef]
  3. Erhorn-Kluttig, H.; Erhorn, H.; Lahmidi, H. Airtightness Requirements for High Performance Building Envelopes. EPBD Build. Platf. 2009, 157, 1–6. [Google Scholar]
  4. ISO 9972:2015; Thermal Performance of Buildings—Determination of Air Permeability of Buildings—Fan Pressurization Method, ISO/TC 163/SC 1. International Organization for Standardization (ISO): Geneva, Switzerland, 2015.
  5. ASTM E779-19; Standard Test Method for Determining Air Leakage Rate by Fan Pressurization, E06.41. ASTM International: West Conshohocken, PA, USA, 2019.
  6. Younes, C.; Shdid, C.A.; Bitsuamlak, G. Air Infiltration through Building Envelopes: A Review. J. Build. Phys. 2012, 35, 267–302. [Google Scholar] [CrossRef]
  7. Alfano, D.F.R.; Dell’Isola, M.; Ficco, G.; Tassini, F. Experimental Analysis of Air Tightness in Mediterranean Buildings Using the Fan Pressurization Method. Build. Environ. 2012, 53, 16–25. [Google Scholar] [CrossRef]
  8. Papaglastra, M.; Leivada, I.; Sfakianaki, K.; Carrié, F.R.; Santamouris, M. International Comparison of Envelope Airtightness Measurements. In Proceedings of the 3rd European Blower Door Symposium, Kassel, Germany, 16–17 March 2008. [Google Scholar]
  9. Poza-Casado, I.; Meiss, A.; Padilla-Marcos, M.Á.; Feijó-Muñoz, J. Airtightness and Energy Impact of Air Infiltration in Residential Buildings in Spain. Int. J. Vent. 2021, 20, 258–264. [Google Scholar] [CrossRef]
  10. Sfakianaki, A.; Pavlou, K.; Santamouris, M.; Livada, I.; Assimakopoulos, M.-N.N.; Mantas, P.; Christakopoulos, A. Air Tightness Measurements of Residential Houses in Athens, Greece. Build. Environ. 2008, 43, 398–405. [Google Scholar] [CrossRef]
  11. ISO 13790:2008; Energy Performance of Buildings—Calculation of Energy Use for Space Heating and Cooling, ISO/TC 163/SC 2. International Organization for Standardization (ISO): Geneva, Switzerland, 2008.
  12. ISO 52016-1:2017; Energy Performance of Buildings—Energy Needs for Heating and Cooling, Internal Temperatures and Sensible and Latent Heat Loads—Part 1: Calculation Procedures, ISO/TC 163/SC 2. International Organization for Standardization (ISO): Geneva, Switzerland, 2017.
  13. Stabile, L.; Dell’Isola, M.; Frattolillo, A.; Massimo, A.; Russi, A. Effect of Natural Ventilation and Manual Airing on Indoor Air Quality in Naturally Ventilated Italian Classrooms. Build. Environ. 2016, 98, 180–189. [Google Scholar] [CrossRef]
  14. Kalamees, T. Air Tightness and Air Leakages of New Lightweight Single-Family Detached Houses in Estonia. Build. Environ. 2007, 42, 2369–2377. [Google Scholar] [CrossRef]
  15. Jesús, F.M.; Irene, P.C.; Alonso, G.L.R.; Cristina, P.; Víctor, E.; De Larriva Rafael, A.; Jesica, F.A.; Jesús, D.V.M.; José, D.C.D.V.; Manuel, M.C.; et al. Methodology for the Study of the Envelope Airtightness of Residential Buildings in Spain: A Case Study. Energies 2018, 11, 704. [Google Scholar] [CrossRef] [Green Version]
  16. Lai, Y.; Ridley, I.A.; Brimblecombe, P. Air Change in Low and High-Rise Apartments. Urban Sci. 2020, 4, 25. [Google Scholar] [CrossRef]
  17. Paukštys, V.; Cinelis, G.; Mockienė, J.; Daukšys, M. Airtightness and Heat Energy Loss of Mid-Size Terraced Houses Built of Different Construction Materials. Energies 2021, 14, 6367. [Google Scholar] [CrossRef]
  18. Feijó-Muñoz, J.; González-Lezcano, R.A.; Poza-Casado, I.; Padilla-Marcos, M.Á.; Meiss, A. Airtightness of Residential Buildings in the Continental Area of Spain. Build. Environ. 2019, 148, 299–308. [Google Scholar] [CrossRef]
  19. Lozinsky, C.H.; Touchie, M.F. Suite-Level Air Tightness and Compartmentalization in Multi-Unit Residential Buildings: How Do We Achieve Our Intended Goals? Build. Environ. 2021, 192, 107600. [Google Scholar] [CrossRef]
  20. Dickerhoff, D.J.; Grimsrud, D.T.; Lipschutz, R.D. Component Leakage Testing in Residential Buildings; Lawrence Berkeley Laboratory: Berkeley, CA, USA, 1982. [Google Scholar]
  21. Harrje, D.T.; Born, G.J. Cataloguing Air Leakage Components in Houses; American Council for an Energy-Efficient Economy: Washington, DC, USA, 1982. [Google Scholar]
  22. ASHRAE. ASHRAE Handbook: Fundamentals; ASHRAE: Atlanta, GA, USA, 2021. [Google Scholar]
  23. Taleb, H.M. Experimental Assessment of Different Sealing Methods for Windows to Improve Building Airtightness in UAE Residential Buildings. Sustainability 2022, 14, 14760. [Google Scholar] [CrossRef]
  24. Kottek, M.; Grieser, J.; Beck, C.; Rudolf, B.; Rubel, F. World Map of the Köppen-Geiger Climate Classification Updated. Meteorol. Z. 2006, 15, 259–263. [Google Scholar] [CrossRef] [PubMed]
  25. The Energy Conservatory (TEC). Model 3 Minneapolis Blower Door Kit; The Energy Conservatory (TEC): Minneapolis, MN, USA, 1999. [Google Scholar]
  26. Feijó-Muñoz, J.; Pardal, C.; Echarri, V.; Fernández-Agüera, J.; Assiego de Larriva, R.; Montesdeoca Calderín, M.; Poza-Casado, I.; Padilla-Marcos, M.Á.; Meiss, A. Energy Impact of the Air Infiltration in Residential Buildings in the Mediterranean Area of Spain and the Canary Islands. Energy Build. 2019, 188–189, 226–238. [Google Scholar] [CrossRef]
  27. Egypt’s Government. Building Law No. 119 of 2008; Egypt’s Government: Cairo, Egypt, 2008. [Google Scholar]
  28. Egypt’s Government. Executive Regulations of Building Law No. 119 of 2008; Egypt’s Government: Cairo, Egypt, 2009. [Google Scholar]
  29. Almeida, R.M.S.F.; Ramos, N.M.M.; Pereira, P.F. A Contribution for the Quantification of the Influence of Windows on the Airtightness of Southern European Buildings. Energy Build. 2017, 139, 174–185. [Google Scholar] [CrossRef]
  30. Chan, W.R.; Nazaroff, W.W.; Price, P.N.; Sohn, M.D.; Gadgil, A.J. Analyzing a Database of Residential Air Leakage in the United States. Atmos. Environ. 2005, 39, 3445–3455. [Google Scholar] [CrossRef] [Green Version]
  31. Gomes, M.R.; da Silva, M.G.; Simoes, N. Assessment of Air Infiltration Rates in Residential Buildings in Portugal. In Proceedings of the CLIMA 2013, Prague, Czech Republic, 16–19 June 2013. [Google Scholar]
  32. Sfakianaki, K.; Pavlou, K.; Assimakopoulos, M.N.; Santamouris, M.; Leivada, I.; Karkoulias, N.; Mamouras, J. Analyzing Airtightness Measurements Using Fan Pressurization Method on Forty Residential Houses in Athens, Greece. In Proceedings of the 2nd PALENC Conference, Crete Island, Greece, 27–29 September 2007; Volume 2, pp. 946–949. [Google Scholar]
  33. Fernández-Agüera, J.; Domínguez-Amarillo, S.; Sendra, J.J.; Suárez, R.; Oteiza, I. Social Housing Airtightness in Southern Europe. Energy Build. 2019, 183, 377–391. [Google Scholar] [CrossRef]
  34. Tiberio, A.J.; Branchi, P. A Study of Air Leakage in Residential Buildings. In Proceedings of the 2013 International Conference on New Concepts in Smart Cities: Fostering Public and Private Alliances (SmartMILE), Gijon, Spain, 11–13 December 2013; Volume 50. [Google Scholar] [CrossRef]
Figure 1. Visualization for the sample of tested dwellings.
Buildings 13 00728 g001
Figure 2. Floor plan example for (A) apartment dwelling and (B) single-family dwelling.
Buildings 13 00728 g002
Figure 3. The typical sections for building components’ materials.
Buildings 13 00728 g003
Figure 4. Minneapolis Blower Door system during the testing.
Buildings 13 00728 g004
Figure 5. Example of a thermal image used to identify typical air leakage paths: showing air movement around a window.
Buildings 13 00728 g005
Figure 6. Example of pressurization and depressurization test graph.
Buildings 13 00728 g006
Figure 7. Air change rate at 50 Pa and n50 for the tested dwellings (categorized as per Figure 1).
Buildings 13 00728 g007
Figure 8. Box and whisker plots showing the distribution of (A) n50 and (B) q50 for dwellings in extreme and intermediate positions (black dots show the mean value).
Buildings 13 00728 g008
Figure 9. Box and whisker plots showing the distribution of (A) n50 and (B) q50 for dwellings constructed before and after 2009 (black dots show the mean value).
Buildings 13 00728 g009aBuildings 13 00728 g009b
Figure 10. Box and whisker plots showing the distribution of (A) n50 and (B) q50 for dwellings with two or less, and more than two exposed façades (black dots show the mean value).
Buildings 13 00728 g010aBuildings 13 00728 g010b
Figure 11. Box and whisker plots showing the distribution of (A) n50 and (B) q50 based on the different observed fenestration quality (dots show the mean value).
Buildings 13 00728 g011
Figure 12. Linear correlation between q50 and shape coefficient across the three different observed categories of observed fenestration quality.
Buildings 13 00728 g012
Figure 13. Linear correlation between q50 and specific aperture across the three different observed categories of observed fenestration quality.
Buildings 13 00728 g013
Figure 14. Box and whisker plots showing the distribution of SAL (q50/(FA/AE)) across the three observed fenestration quality categories (dots show the mean value).
Buildings 13 00728 g014
Table 1. Standardized airtightness parameters.
ParameterDescriptionEquationUnit
Q50Average airflow rate at 50 PaCL (50)nm3/h
n50Air change rate at 50 Pa (ACH50)Q50/Vh−1
w50Specific leakage rate at 50 PaQ50/AFm3/(h∙m2)
q50Air permeability rate at 50 PaQ50/AEm3/(h∙m2)
Table 2. Details of the tested dwellings.
Construction
Year
AF
(m2)
V
(m3)
AE
(m2)
FL
(m)
FA
(m2)
No. of
Exposed
Facades
Position
(Floor)
Fenestration
Quality
Level
D12010135.00371.2555.06530.110.3422nd 1
D22010135.00371.2555.06530.110.3422nd 1
D32010135.00371.2555.06530.110.3421st 0
D42010135.00371.2555.06530.110.3421st 0
D52010135.00371.2555.06530.110.34200
D6 2010135.00371.2555.06536.2612.2721st 2
D72010118.00324.5055.06530.110.34200
D82010118.00324.5055.06530.110.34202
D92010270.00742.50115.6360.220.69300
D102010270.00742.50115.6360.220.69302
D112007233.00699.00148.1174.832.9832nd1
D122007271.00813.00172.1179.233.9632nd1
D132021140.00378.00106.3839.817.85202
D142018130.00357.5068.55342.115.6923rd0
D152000280.00840.00259.5118.840.90401
D162006330.00924.00247.8102.246.3242nd2
D17200090.00238.5075.2627.29.9223rd0
D182004110.00319.0094.537.413.5532nd2
D192020276.50829.5030071.225.8740 + 1st1
D202017230.00621.00324.862.626.4730 + 1st2
D1 to D18 are dwellings in multistorey buildings. All multistory buildings have four stories above the ground floor (the ground floor is labeled 0 in the table), and D19 and D20 only have one story above the ground floor.
Table 3. Derived building parameters used in the statistical analysis of results.
ParameterEquationUnit
Shape coefficientAE/Vm−1
Frame length factor (FLF)FL/Vm−2
Specific aperture factorFA/AEUnitless
Table 4. The standardized airtightness parameters for the tested dwellings.
(n50)(q50)(w50)(Q50)
D13.1321.138.621164.00
D23.5024.189.801332.00
D37.5051.0920.842813.40
D412.7385.8735.004728.60
D56.2542.1617.202322.00
D62.8919.517.961074.60
D79.8658.1227.123200.40
D83.5020.789.701144.80
D910.3766.5928.507700.40
D102.9018.828.062176.20
D116.0528.5818.164233.60
D125.5026.0516.544483.80
D134.9017.6413.411877.40
D149.6050.5126.643463.20
D158.3026.9825.007002.00
D165.2219.4914.644831.20
D178.3826.5722.222000.00
D183.8012.9711.151226.50
D194.8013.3714.504012.20
D203.015.758.131870.20
Mean6.1431.8117.163132.82
Median5.3725.1215.592567.70
Standard deviation2.9220.638.051922.96
Table 5. The Spearman’s Rho test results show the correlations between the dwelling background conditions and airtightness parameters (n50 and q50).
Construction
Year
Number of
Exposed
Façades
Position
(Floor)
Fenestration
Quality
Level
N20201820
n50−0.175−0.096−0.020.824 ***
q50−0.138−0.364−0.080.871 ***
*** p < 0.001.
Table 6. The Spearman’s Rho test results show the correlations between building and airtightness parameters (n50, q50, and w50).
n50q50w50
AF−0.074−0.206−0.029
V−0.074−0.206−0.029
AE−0.089−0.499 *−0.05
FL−0.098−0.35−0.042
FA−0.125−0.381−0.075
Shape coefficient −0.042−0.566 **−0.023
FLF0.045−0.3340.057
Specific aperture0.1190.509 *0.124
* p < 0.05, ** p < 0.01.
Table 7. Spearman’s rank-order correlation between building and air tightness parameters, conditional on observed fenestration quality.
n50q50w50
AF0.2750.0230.348
V0.2750.0230.348
AE0.408−0.4260.466 *
FL0.465 *−0.0480.553 *
FA0.492 *−0.0360.571 *
Shape Coefficient0.433−0.625 **0.45
FLF0.531 *−0.2150.533 *
Specific Aperture−0.170.605 **−0.15
* p < 0.05, ** p < 0.01.
Disclaimer/Publisher’s Note: The statements, opinions and data contained in all publications are solely those of the individual author(s) and contributor(s) and not of MDPI and/or the editor(s). MDPI and/or the editor(s) disclaim responsibility for any injury to people or property resulting from any ideas, methods, instructions or products referred to in the content.

