Article

Fluid Flow Characteristics for Four Lattice Settings in Brick Tunnel Kiln: CFD Simulations

by
Hassanein A. Refaey
1,*,
Mathkar A. Alharthi
2,
Ali A. Abdel-Aziz
3,
Hassan F. Elattar
4,
Bandar Awadh Almohammadi
1,
Hany E. Abdelrahman
3,
Mohamed A. Karali
5,
El-Awady Attia
6 and
Mamdouh W. Al-Dosoky
3
1
Department of Mechanical Engineering, College of Engineering at Yanbu, Taibah University, Yanbu Al-Bahr 41911, Saudi Arabia
2
Department of Chemical Engineering, College of Engineering at Yanbu, Taibah University, Yanbu Al-Bahr 41911, Saudi Arabia
3
Department of Mechanical Engineering, Faculty of Engineering at Shoubra, Benha University, Cairo 11629, Egypt
4
Department of Mechanical and Materials Engineering, Faculty of Engineering, University of Jeddah, Jeddah 21589, Saudi Arabia
5
Department of Mechanical Engineering, Faculty of Engineering and Technology, Future University in Egypt, 90 St., New Cairo 11835, Egypt
6
Industrial Engineering Department, College of Engineering, Prince Sattam Bin Abdulaziz University, Al-Kharj 11942, Saudi Arabia
*
Author to whom correspondence should be addressed.
Buildings 2023, 13(3), 733; https://doi.org/10.3390/buildings13030733
Submission received: 1 February 2023 / Revised: 22 February 2023 / Accepted: 3 March 2023 / Published: 10 March 2023
(This article belongs to the Section Building Energy, Physics, Environment, and Systems)

Abstract

:
The higher the process efficiency, the lower the fuel consumption, and the less impact carbon emissions have on the environment. The flow characteristics around brick settings are an important field of investigation to acquire control over the energy intake and production process. The current work is a numerical CFD investigation to demonstrate fluid flow characterization inside the cooling zone in a brick tunnel kiln for lattice settings (the number of bricks in each layer is identical). Four different lattice settings were examined, and three were validated with published experimental data (settings 1, 2 and 3). In the current study, the BSL κ-ω turbulent model agrees well with the published experimental results. The numerical investigation presents the flow characteristics through four different lattice brick settings (e.g., velocity vectors, velocity contours and streamlines) that could not be measured experimentally. The investigation also looks at the flow zones of the vortex formation upstream, downstream and through the brick column. It was discovered that for settings 1 and 11, the quick air flow in the wall channels is much greater than in the column channels. Setting 3 has a larger vortex formation region, whereas setting 1 has a weaker vortex than the other settings. The cooling of the lattice bricks in Setting 3 is superior to the cooling in the other settings.

1. Introduction

Tunnel kilns are long structure furnaces primarily used in ceramics manufacturing, particularly brick manufacturing. The solids and gases along the whole kiln zone are considered to be in counterflow heat exchangers, where solids move counter-currently with the air or gas flow [1]. Great attention has been focused on energy savings in such kilns. Therefore, various mathematical and numerical studies have been carried out on tunnel kilns. Tehzeeb et al. [2] used natural gas injected into tunnel kiln roofs to study their performance. The results revealed that the gaps between two consecutive brick stacks should also be reduced to 200 mm instead of the initially assumed 400 mm spacing.
The heat transmission phenomenon in a brick tunnel kiln was analysed by Dugwell and Oakley [3]. Its primary flaw was that each brick column was counted as a single unit. Refaey and Specht [4] reported the results of a 3D numerical analysis conducted in Fluent to fire sanitaryware goods. The results showed that increasing the radial velocity of the burner or nozzle was necessary to improve the heat transfer efficiency. A quantitative heat transfer and fluid flow model for the tunnel kiln cooling zone was presented by Kaya et al. [5]. Two suction flows and two blowing types were optimal for achieving a minimal pressure drop over the cooling zone. Combustion gas flow and heat transport were studied statistically by Naccache et al. [6] in tunnel kilns running on natural gas. The findings demonstrated that natural gas might be used in tunnel kilns.
A numerical computational fluid dynamics simulation of a brick tunnel kiln was presented by Al-Hasnawi et al. [7]. Researchers looked at how injecting air along walls affected gas flow. According to the findings, increasing the vertical distance between two opposite air injections improved the mixing process. Two separate experimental studies were presented by Refaey et al. [8,9] on tunnel kilns with two guiding vanes: a side vane and a U-shaped vane at varying angles. The findings were summarized as empirical relationships for the average Nusselt number as functions of the many factors under investigation.
Furthermore, they showed that the convective heat transfer was highly sensitive to factors including the arrangement of settings, the attack angle of the guide vanes and the type of guide vanes used. Refaey et al. [10] developed a mathematical model using ordinary differential equations to transport heat in the kiln’s preheating and firing zones for vitrified clay pipes. This research identified two processes, convection and radiation, for further examination. The results showed that a Stanton number of more than 4 and an excess air number of less than 1.7 resulted in decreased energy use.
Almutairi et al. demonstrated [11] how fluid channels affect flow homogeneity in a lattice brick setting loaded in a tunnel kiln. Experiment data were used to confirm the results using quantitative and qualitative analyses. An experimental CFD model of a biogas-powered clay brick kiln was provided by Beyene et al. [12]. As expected, the results showed that bricks closer to the burner experienced higher temperatures, affecting the firing time. According to the findings, the highest air velocity was 90 m/s at the burner’s output cone. Gomez et al. [13] provided a transient heat transport study of a ceramic kiln’s heating and cooling processes with intermittent operation. Pilot-scale kiln experiments confirmed the findings. The results showed that a lot of heat was lost as radiation via the side walls of the apparatus.
The convective heat transmission in a brick tunnel kiln was recently studied numerically by CFD, as given by Refaey et al. [14]. There was a new brick environment that was introduced. As the brick spacing increased, the results showed a maximum rise of around 15.3% in the longitudinal brick. In a nutshell, most of the existing experimental or numerical studies centre on the temperature field. In addition, they focus on niche applications of certain brick tunnel kiln designs. As a tool for kiln designers, CFD has come a long way, and it takes a lot of work to comprehend the flow field when using it to make a better tunnel kiln. The transitory burning of clay bricks in a conventional kiln was studied quantitatively by Ngom et al. [15]. They used the standard turbulence kinetic energy (k) and Eddy Dissipation to model turbulence and combustion processes. It was clear from the data that the target temperature of 900 °C was successfully reached. As a result, combustion was developed. The data also demonstrated that the maximum O2 mass fraction occurred near the kiln’s intake and decreased gradually farther within. Refaey et al. [16] recently introduced a transient experimental study for brick tunnel kilns using guide vanes as turbulence generators. Setting 7 in their published work with a vane angle θ = 135° resulted in a maximum enhancement of 48%. All these efforts are introduced to gas flow within tunnel kilns to save energy consumption and fossil oil.
The flow characteristics around brick settings are a critical parameter to investigate and calculate energy consumptions throughout the manufacturing process. Whereas higher process efficiency leads to lower fuel consumption and, as a result, lower carbon emissions and a lower environmental impact. In such a complicated setup, it is crucial to understand the specifics of the flow type. Because of this, the primary goal of the current work is to investigate the flow field in four distinct lattice brick configurations to demonstrate the flow’s diversity in complex structures and provide a clear picture of it. The first part of the results regarding convective heat transfer was presented in [14]. The current work aims to yield useful information on the flow to aid kiln designers in designing settings for such kilns. The current effort also aspires to facilitate the improvement of gas flow or air within tunnel kilns, with the ultimate goal of reducing energy usage. ANSYS-CFD produces accurate findings that agree with experimental ones where the bricks’ actual characteristics were implemented in the Fluent software. Several parameters, such as the arrangement of the bricks and the distance between the columns, were analysed in this study.

2. Model Description

Numerical simulation is crucial for complicated geometries such as tunnel kilns. Thus, ANSYS-FLUENT CFD models flow characteristics and convective heat transfer in a brick tunnel kiln. Computational fluid dynamics provides faster solutions, greater mesh capability and high-quality post-processing. This work uses a personal PC with these specs: Intel Core TM i7 eight-core, 32 GB RAM, 2.8 GHz. The CFD algorithm implements brick characteristics for accurate results. The cartesian coordinate system solves the governing equations for temperature, flow field and pressure drop in the tunnel kiln [4,7,14].
x i ( ρ U i ) = 0
x i ( ρ U j U i ) = x i ( µ U i x i ) P x i
x i ( ρ C p U j T ) = x i ( k T x i )
Ui is the average velocity vector with components in the x, y and z directions. µ is the fluid flow density; p is the static pressure and dynamic viscosity.
The friction factor is calculated as shown in [8,9] as follows:
f = 2 Δ P   D h L   ρ   U 2
The solution is converged for accurate results when continuity, momentum and energy residuals are less than 10–4, 10–4 and 10–6, respectively.
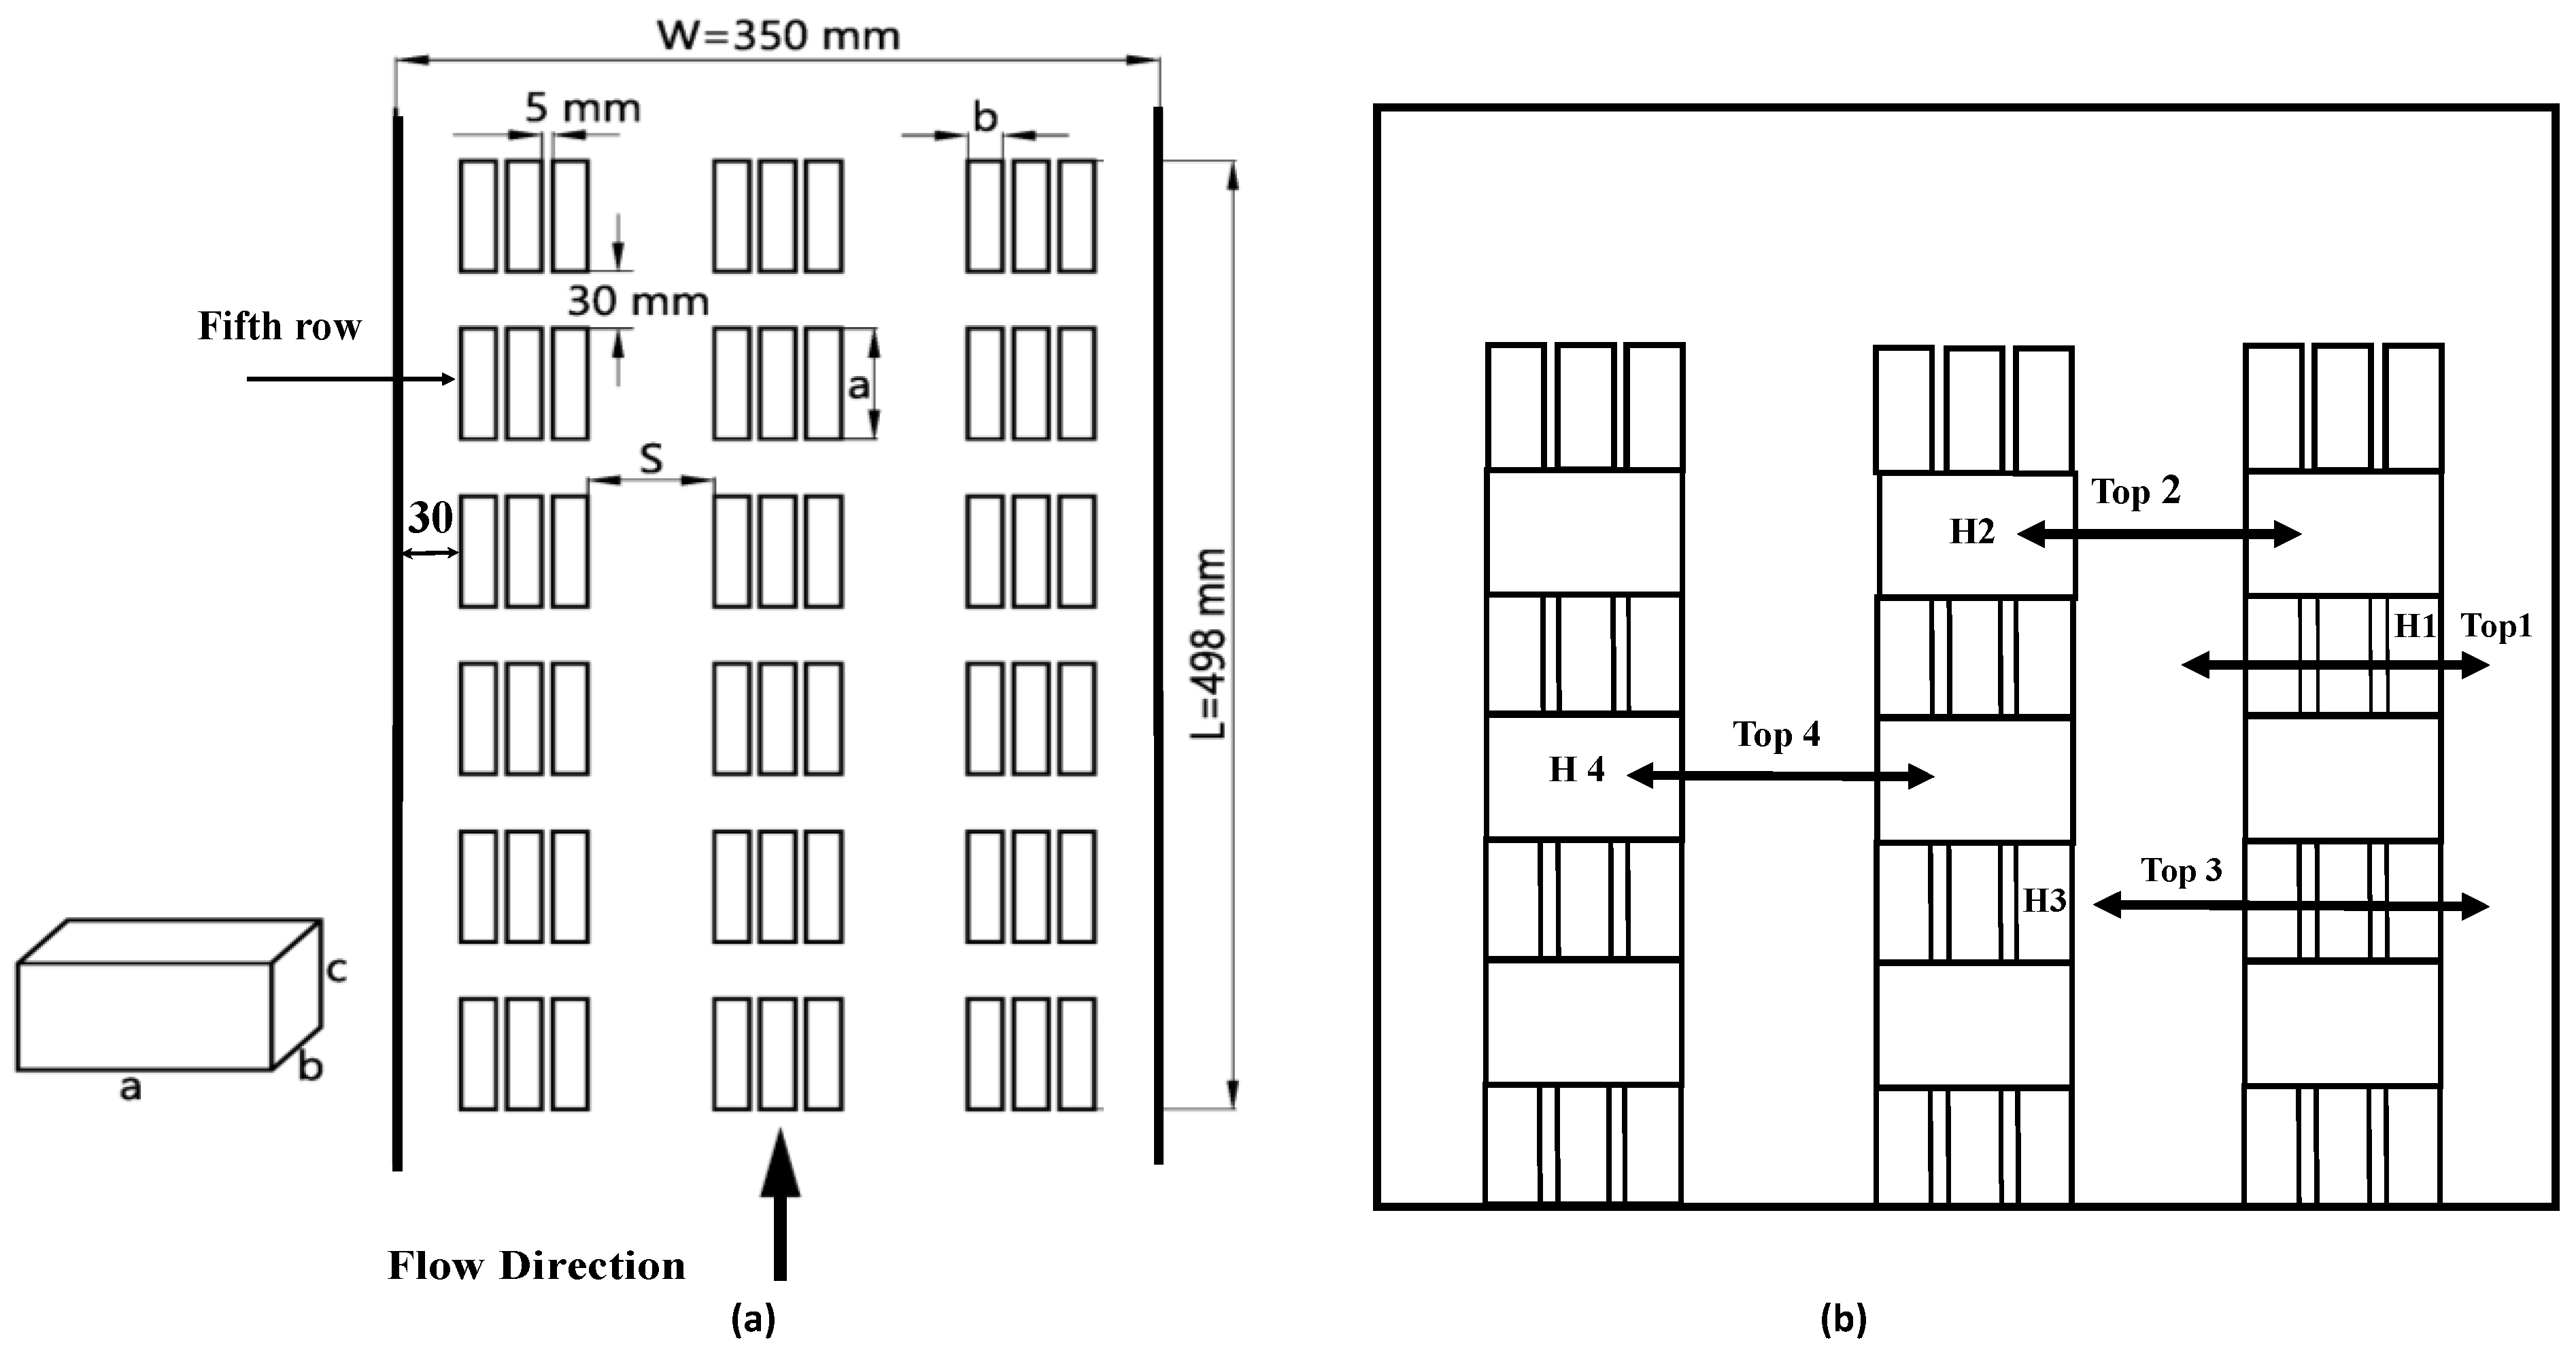
Figure 1 shows the major features of one row (the fifth row) in each of the four CFD modelling settings (Set 1, Set 2, Set 3 and Set 11) for the tunnel kiln. Each setting has three primary parameters. Layers, rows and columns are the major distinguishing factors in each setup, according to Refaey et al. [8]. Furthermore, the boundary conditions employed in the current numerical simulations for the first three settings are described based on the published experimental findings in [9]. Table 1 shows the current physical domain dimensions. Simulations are intentional inside Reynolds’ numbers 13,609–27,634.
Additionally, as a sample, Figure 2 displays the typical details of setting 2 used in both experimental and CFD simulations. Figure 2b presents the locations of the top planes through the four heating elements of a typical brick model in setting 2. Each heater has a heat generation related to the experimental work range of 8 × 10⁵ to 8.8 × 10⁵ W/m3. The main parameters that classify each setting are represented in Figure 1 and Figure 2.
The conditions used in the first three settings are presented in the experimental work by Refaey et al. [10]. Furthermore, the characteristics of setting 11 were represented in [14]. The inlet mass flow rates used in the present simulation work for the four settings are shown in Table 2. In the study, kiln walls are considered adiabatic.
A mesh study has great importance in ensuring precise numerical simulation results. To obtain reliable results around the heating elements, the element size in bricks (quad-structured mesh as shown in Figure 3b) and around them (non-uniformly structured hexahedral) is set to be very small. Independence studies have been performed for the four settings studied. Figure 3 presents two mesh studies from the four settings as an example. The following mesh elements were used for settings 1, 2, 3 and 11: 9,451,554, 7,877,942, 7,158,518 and 9,281,522, respectively [14].
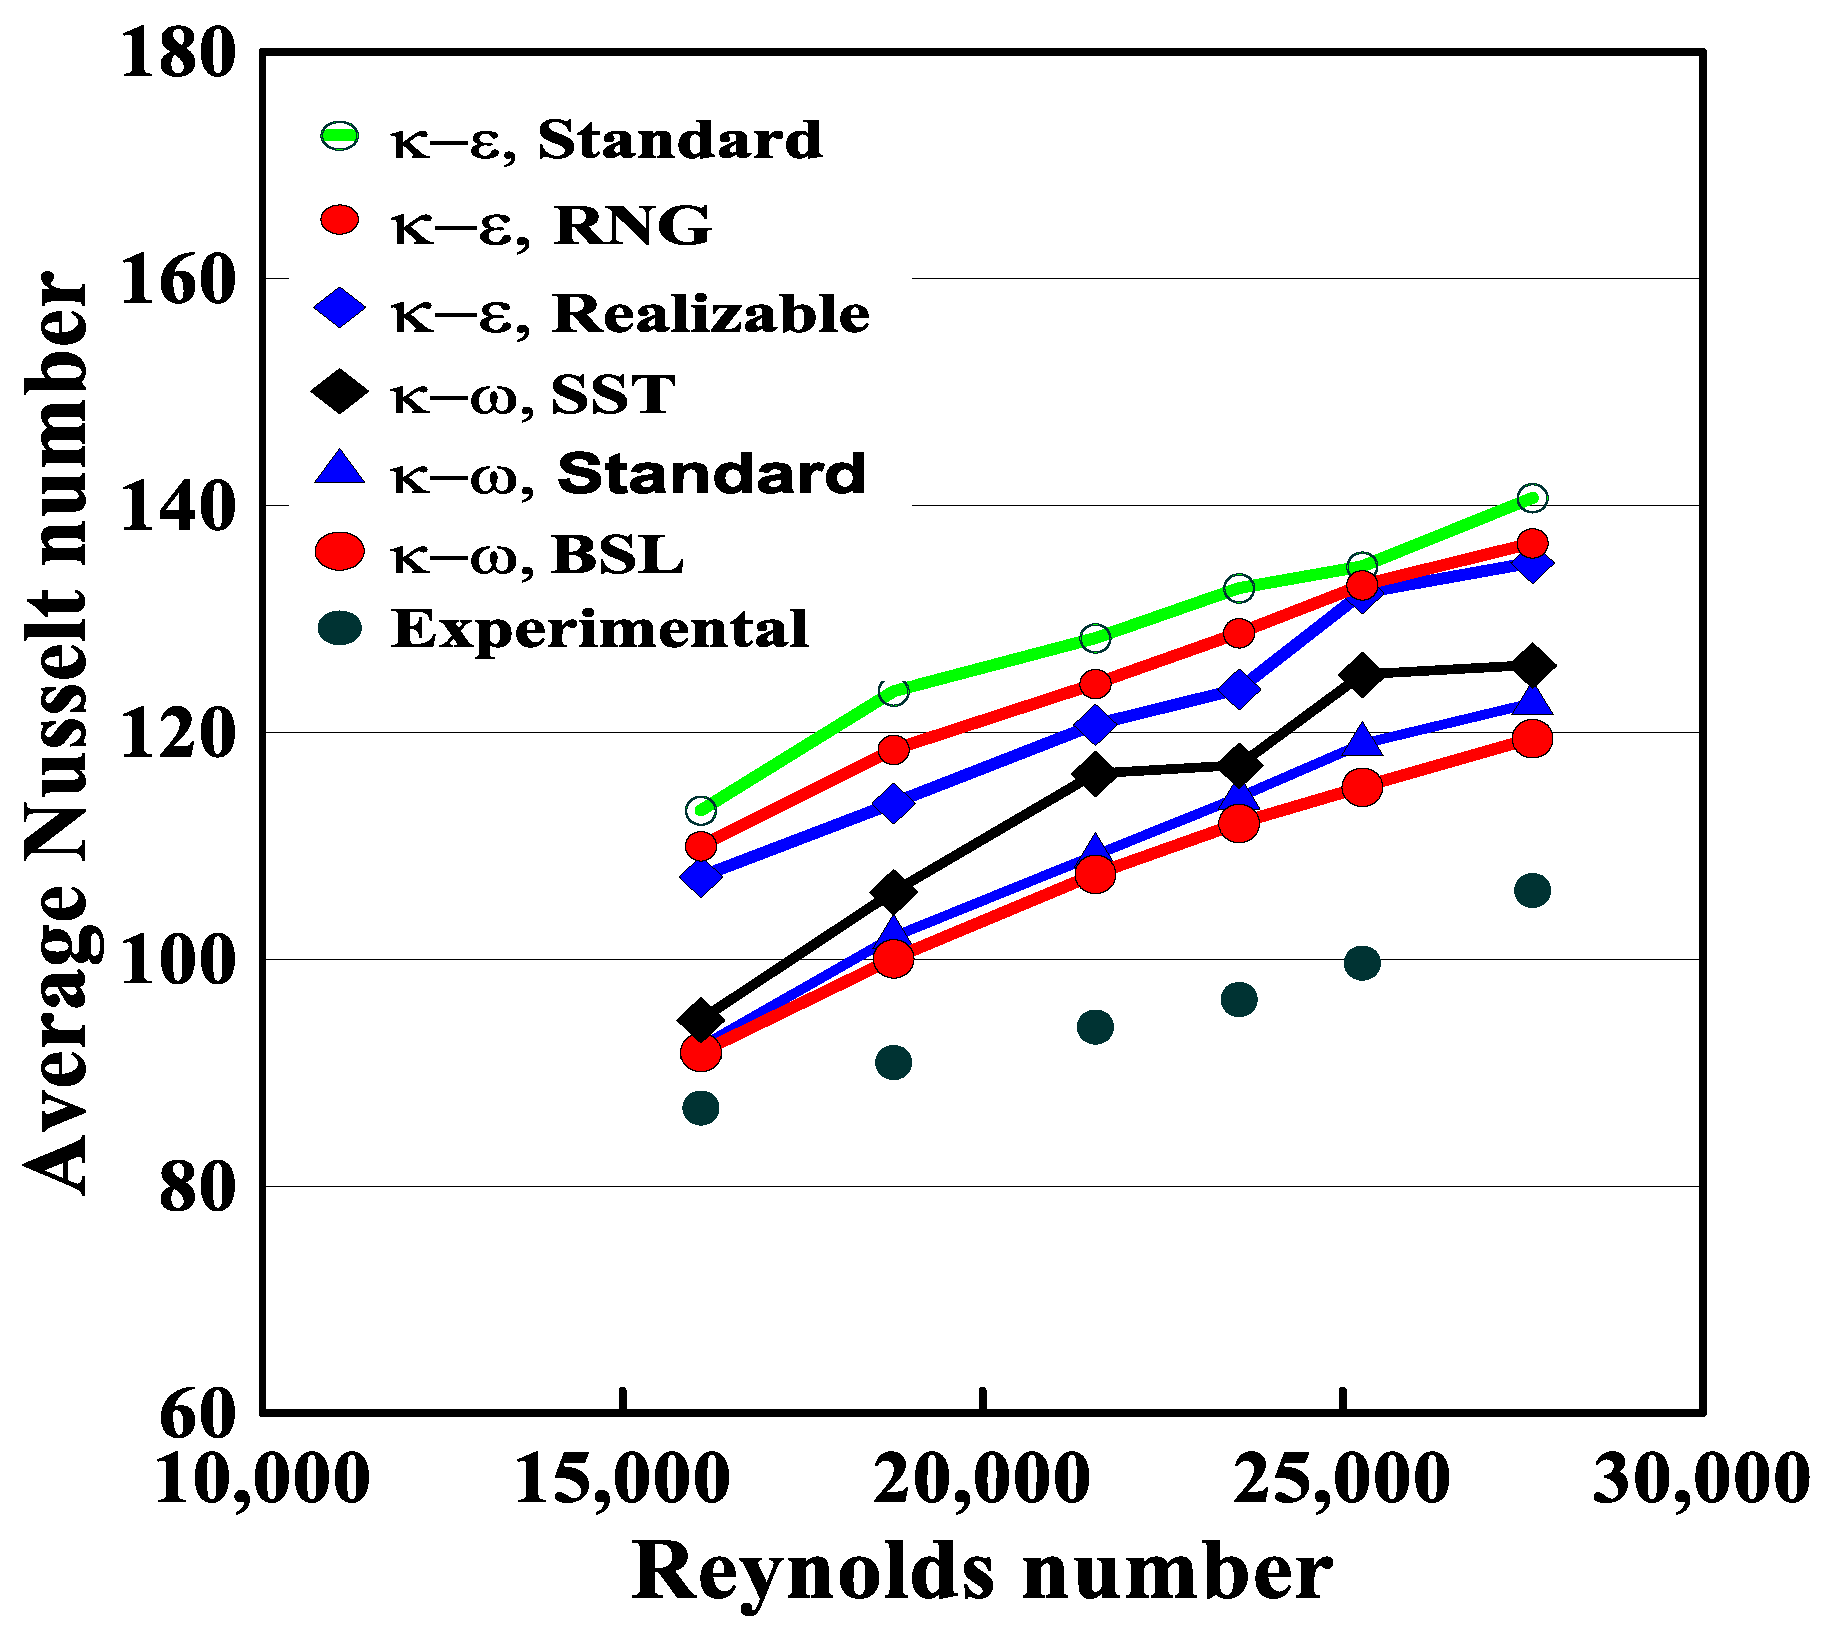
The k-ω BSL turbulent model is considered in the current study as illustrated in Figure 4. The numerical results of Setting 3 have been validated by published experimental work by Refaey et al. [9]. Because of its accuracy and reliability, ANSYS-FLUENT CFD software (version 17.2) is employed as a simulation tool in these intricate geometric models. As a result, the modelling of the properties of the flow field in actual brick contexts was incorporated into the current study. A thorough description of the current physical model was given by Refaey et al. [14]. Using a computer and actual brick attributes in the CFD code yields great results that mirror real-world conditions.

3. Results and Discussion

Actually, the CFD simulations were executed for both heat transfer and fluid flow to demonstrate the dual effects of heat transfer and flow field interactions. However, according to the numerous results (654 graphs) that were obtained from the study of the four lattice settings, it was very difficult to present all the results in one paper. As a result, one of our strategies was to divide the results into two categories (parts). The first was convective heat transfer, which was published by Refaey et al. [14], and the second (the present work) was the flow field characteristics. In addition, there were four different cases: three of them (settings 1, 2 and 3) were validated with published experimental data presented by Refaey et al. [9], and the fourth one (setting 11) was a new setting that had no previous experimental work. Furthermore, former researchers’ previous published work in the literature was only for one setting. Therefore, the plan of the current paper was to show more than one setting to be more valuable for the reader and kiln designer. Therefore, our thinking during the simulations was concentrated on illustrating the flow field, which was affected by brick settings and the heat released from the heaters.
The current numerical steady state represents flow field characterization for the four brick settings. The results are represented in terms of velocity contours, velocity vectors and streamlines in different planes through the four settings. Top planes (Figure 2), longitudinal (L) and transversal (T) planes are illustrated through each setting in many different locations, as shown in Figure 5. In addition, Figure 5 represents the position of the three sectional plans (as examples) used during the presentation of the results obtained from the current work. Moreover, many results were obtained from the CFD simulations at all studied Reynolds numbers, as in the experimental work [9] for settings 1, 2 and 3. Furthermore, the new setting 11 numerical results are also obtained and illustrated in the current study. But only some cases from the studied Reynolds number were selected for the following discussion.

3.1. Effect of Brick Setting Arrangement (Solid Mass Effect) on the Flow Field

The influence of the lattice brick setting arrangement on the flow field has great importance. The CFD visualization gives a good vision of the flow through the four studied lattice brick settings. Therefore, the upcoming figures represent the velocity vectors, contours and streamlines to show the nature of the flow between bricks. Two pairs are compared together: one pair has four columns (setting 1 and setting 11) and the second has three columns (setting 2 and setting 3). For each setting, six inlet mass flow rates, as presented in the experimental work, are simulated to have a clear vision of the flow field in the present CFD work.

3.1.1. Effect of the Number of Bricks

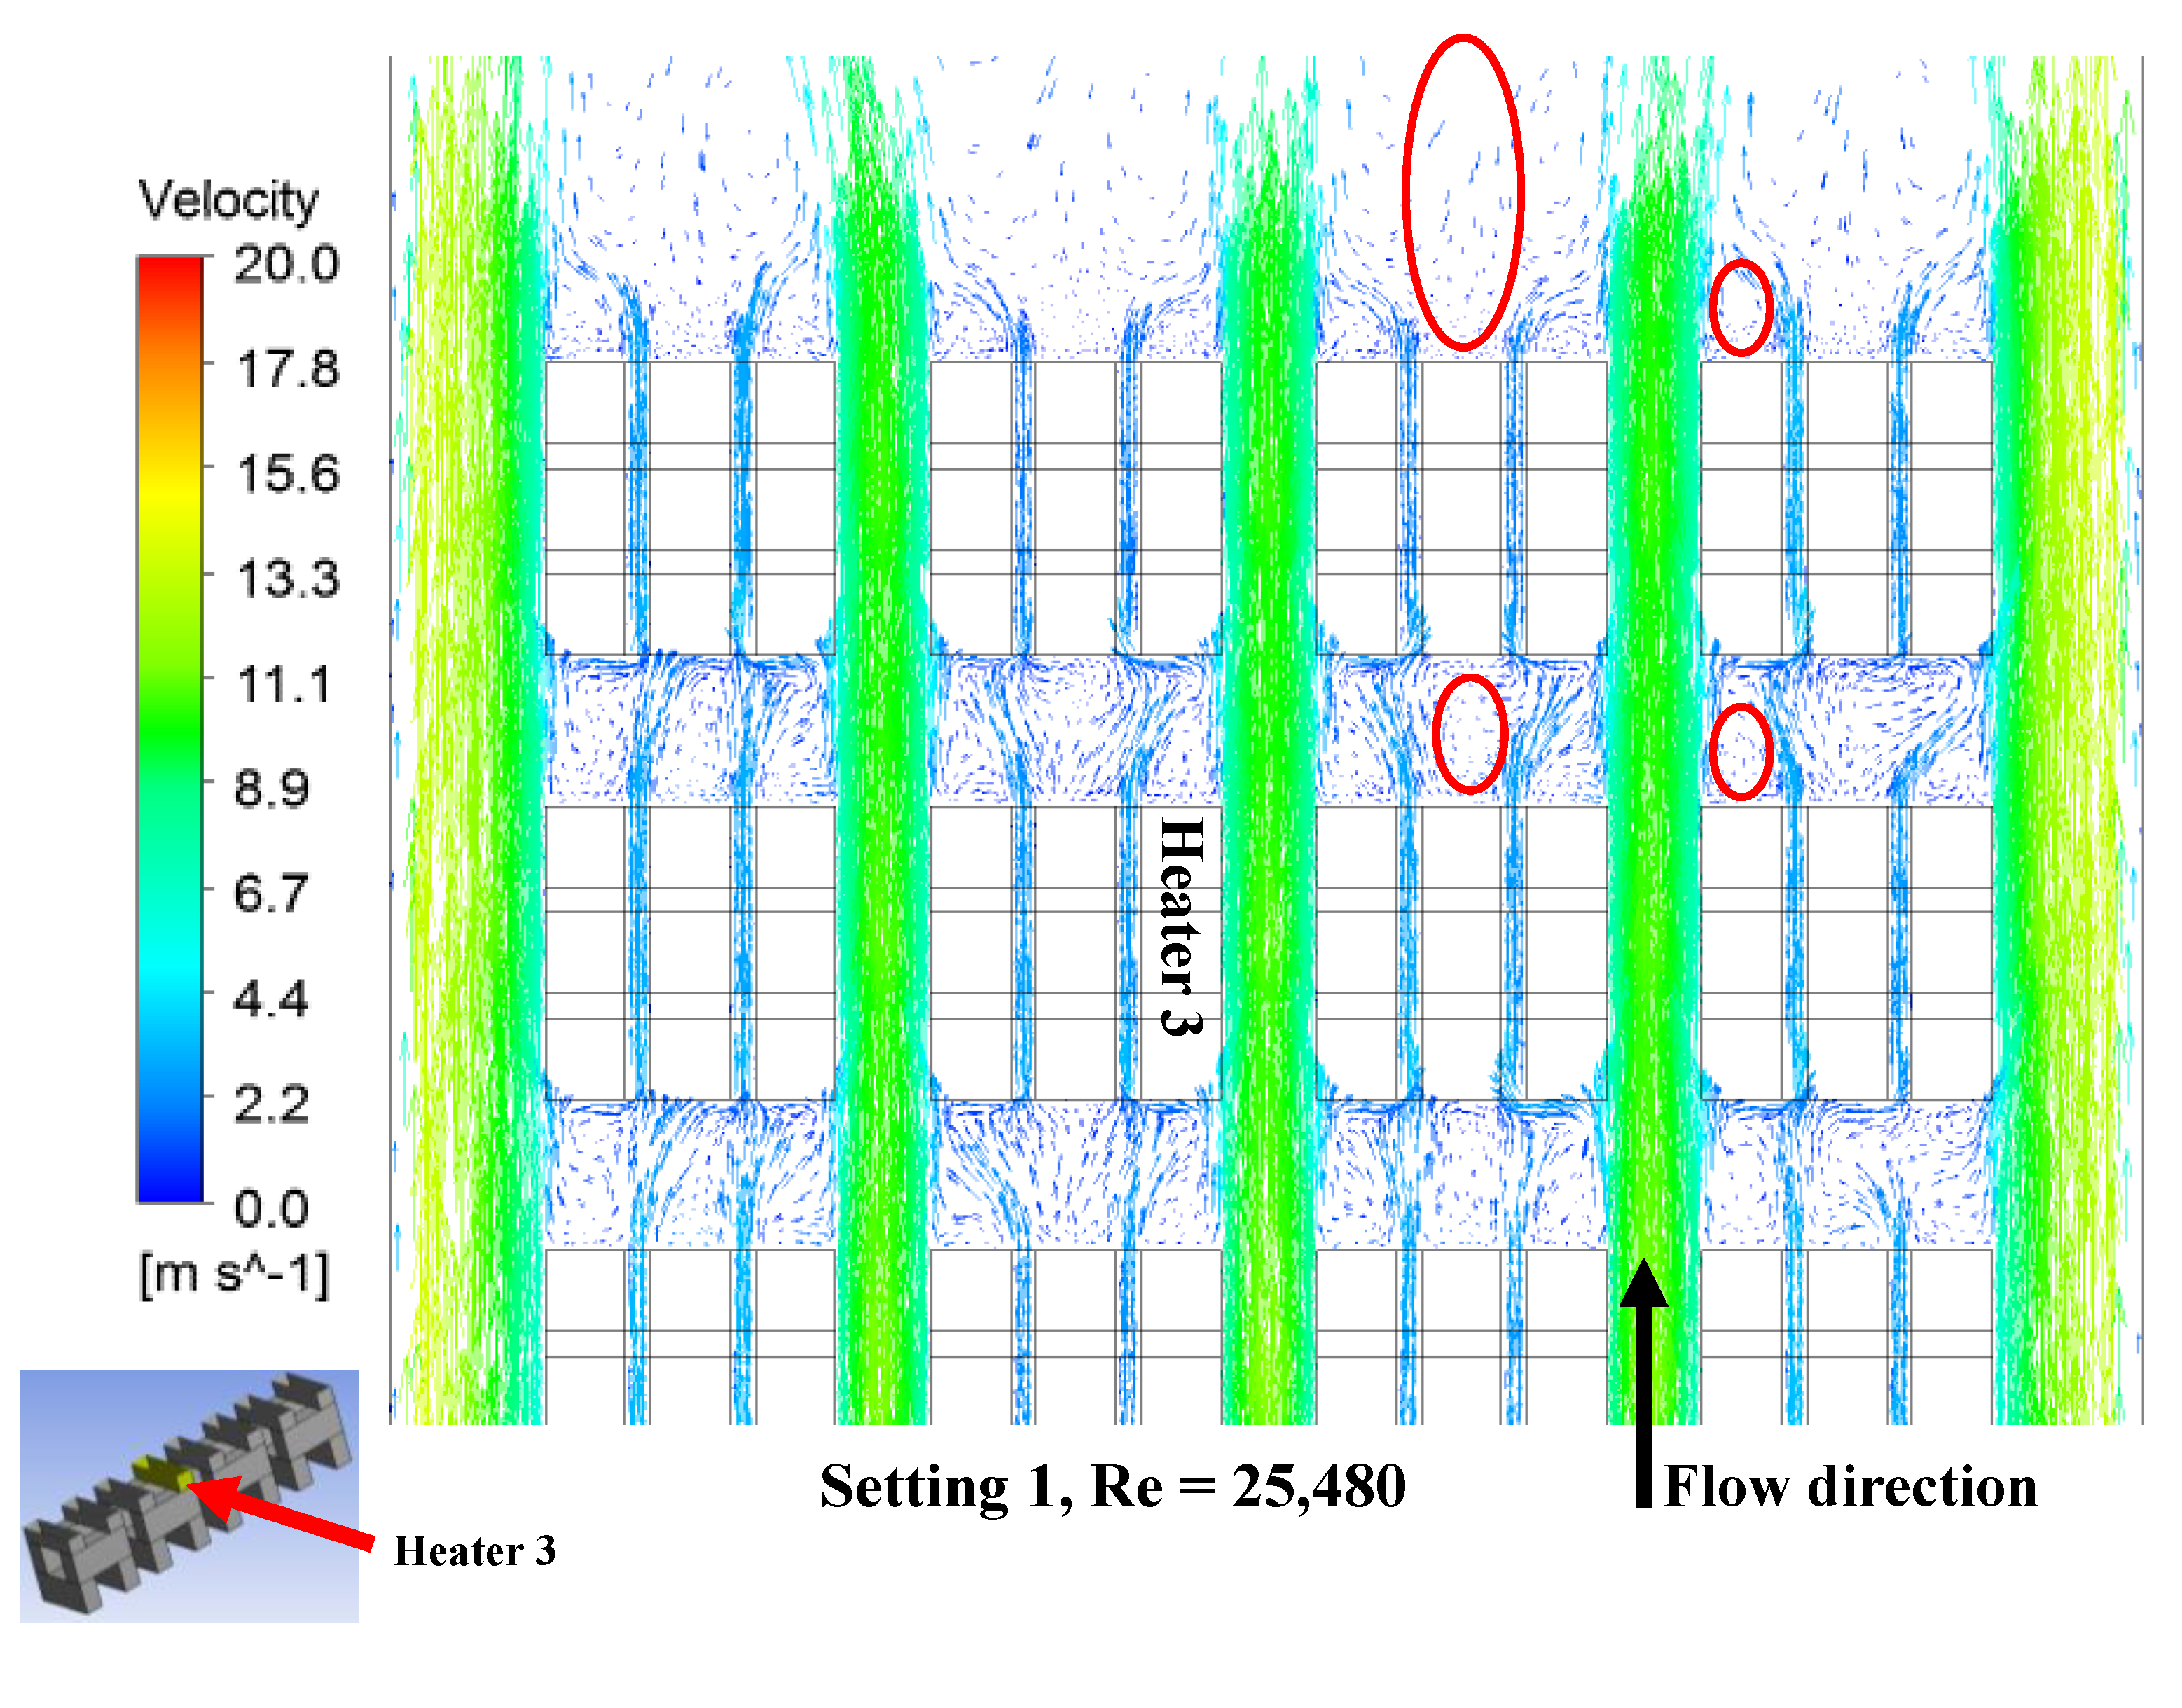
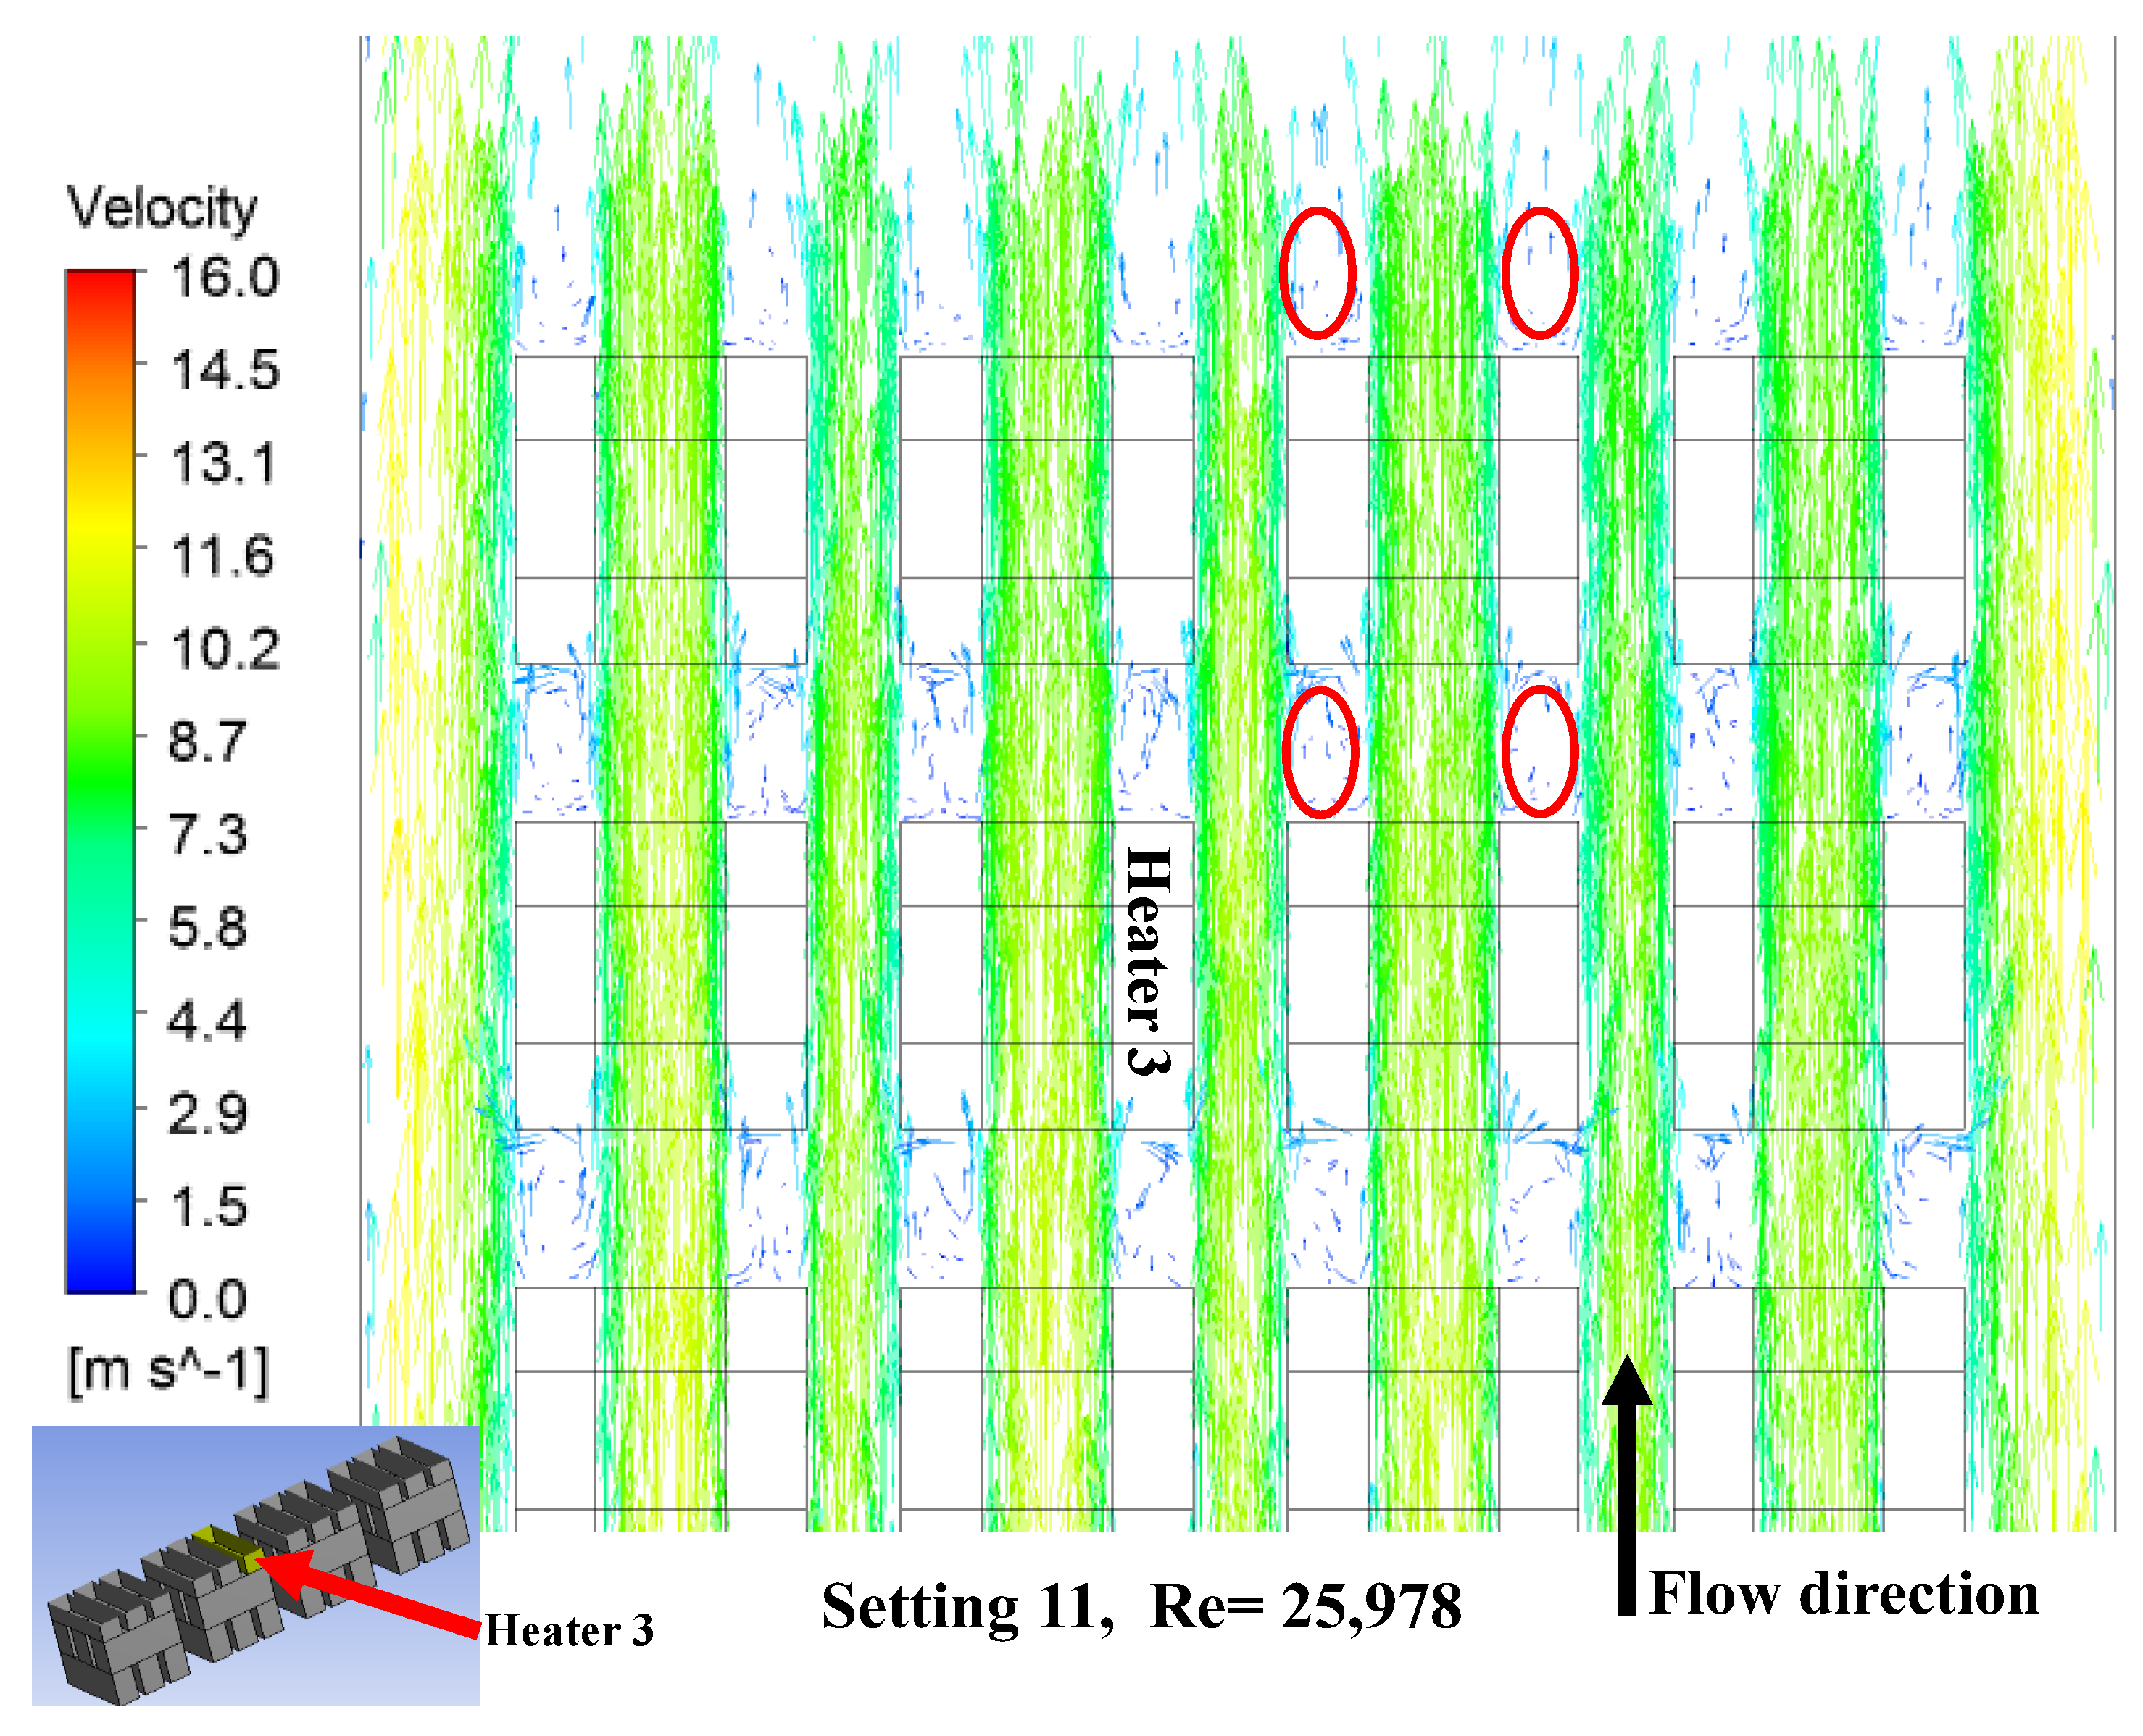
Figure 6 represents the flow field for two studied settings (setting 1 and setting 11) at the top plane (Top 3) that passes through the longitudinal heater 3 (H3) at maximum inlet mass flow rate (Table 1). The figure demonstrates the plane’s velocity vectors, streamlines and contours at Reynolds numbers 25,480 and 25,978 for settings 1 and 11, respectively. Generally, the two settings have flow separation zones behind the sixth row. The number of separation zones after the sixth row depends on the number of columns and bricks in the layer. For setting 1 (the high brick density setting), there are eight small separation zones and four bigger zones, as seen in Figure 6i. It can be noticed from the whole of Figure 6 for both settings (1 and 11) that the flow passing in the wall channels is much higher than that passing through the column channels, as can be noticed from the colour map. The velocity contours demonstrate that several separation zones vary between the two settings. Furthermore, the red circles demonstrate the volume of the separation zones. This variation is related to the number of bricks in the layer. Setting 1 has three bricks in each layer and setting 11 has only two bricks. This structure of bricks affects the flow separation after each row in both settings. For setting 1, Figure 6i, two small jets exiting from brick channels appear after each row. This creates small separation zones behind each longitudinal brick, as in velocity contours and streamlines. These separation zones are small due to the thicker jets (higher exit velocities in the brick channel) after the first two rows. Then, the jet thickness decreases.
Consequently, the area of the zones increases after the following rows. This is attributed to the higher inlet velocity, and then the velocity decreases in the longitudinal flow direction. Furthermore, the separation zone is enlarged according to the column channel’s higher flow speed, as shown in the red circle in Figure 6i(c). Additionally, the streamlines show two condensed separation zones after the two middle columns. These two zones appear in the layer direction. They start from the base of the kiln up to the seventh layer. This means that there is no flow uniformity in the layer direction.
Regarding setting 11, there are eight similar zones with moderate size, as illustrated in Figure 6ii(f). Consequently, according to its structure, two bricks in the layer, the channel flows are mixed after the sixth row from all channels: wall, columns and brick channels. Therefore, it can be seen from the velocity vectors, velocity contours and streamlines that a continuous jet starts from the beginning when the flow hits the brick structure in this setting. Consequently, this reduces the area of the flow separation zones in between rows and after the sixth row. Moreover, the streamlines in Figure 6ii(f) show two small separation zones after the two middle columns compared to setting 1. These two zones appear in the layer direction as before. They can be attributed to the difference in the number of bricks in the layer.
Figure 7 presents a close-up zoomed view between the fifth and sixth rows to represent the velocity vectors in the longitudinal direction (Top 3) for settings 1 and 11. The figure shows the jets exiting from the bricks’ channels. It can be noticed from Figure 7, setting 1, that the jets formed in the brick channels make separation zones. They differ in their area according to the existing row; i.e., the area of the zone is small when it exists between two rows (fifth and sixth), and it is enlarged after the sixth row. This is due to the flow resistance between rows, which, according to the setting, diminishes after the last row. Consequently, the separation zone area is enlarged.
Regarding setting 11, it can be noticed that the continuously formed jet makes a small and repetitive separation zone between the rows and behind each longitudinal brick, as shown in Figure 7. This is because of how the setting is built, which makes the space between the bricks bigger. These channels reduce the flow resistance and form flow separation zones. In addition, a small amount of the flow will be mixed in behind each longitudinal brick.
Figure 8 demonstrates velocity vectors between the fifth and sixth rows in a close-up, zoomed view. The plane (Top 4) passes through the transversal heater 4 (H4) for the two settings 1 and 11, at the highest Reynolds number illustrated in Figure 8. The figure shows several vortices between rows for setting 1. There are two counter-rotating vortices for the two middle columns; for columns near-wall, nearly one vortex is formed before the fifth row. This can be attributed to the difference in flow resistance in the middle and near the wall. In addition, a small amount of flow passes between bricks in the transversal direction. This is due to the high resistance to flow in a direction perpendicular to the streamwise direction.
On the other hand, for setting 11, due to its structure, the flow resistance in the transversal direction is small compared to setting 1. Therefore, several vortices are formed in the transversal channels between rows and bricks. This allows a good flow of mixing around the bricks.
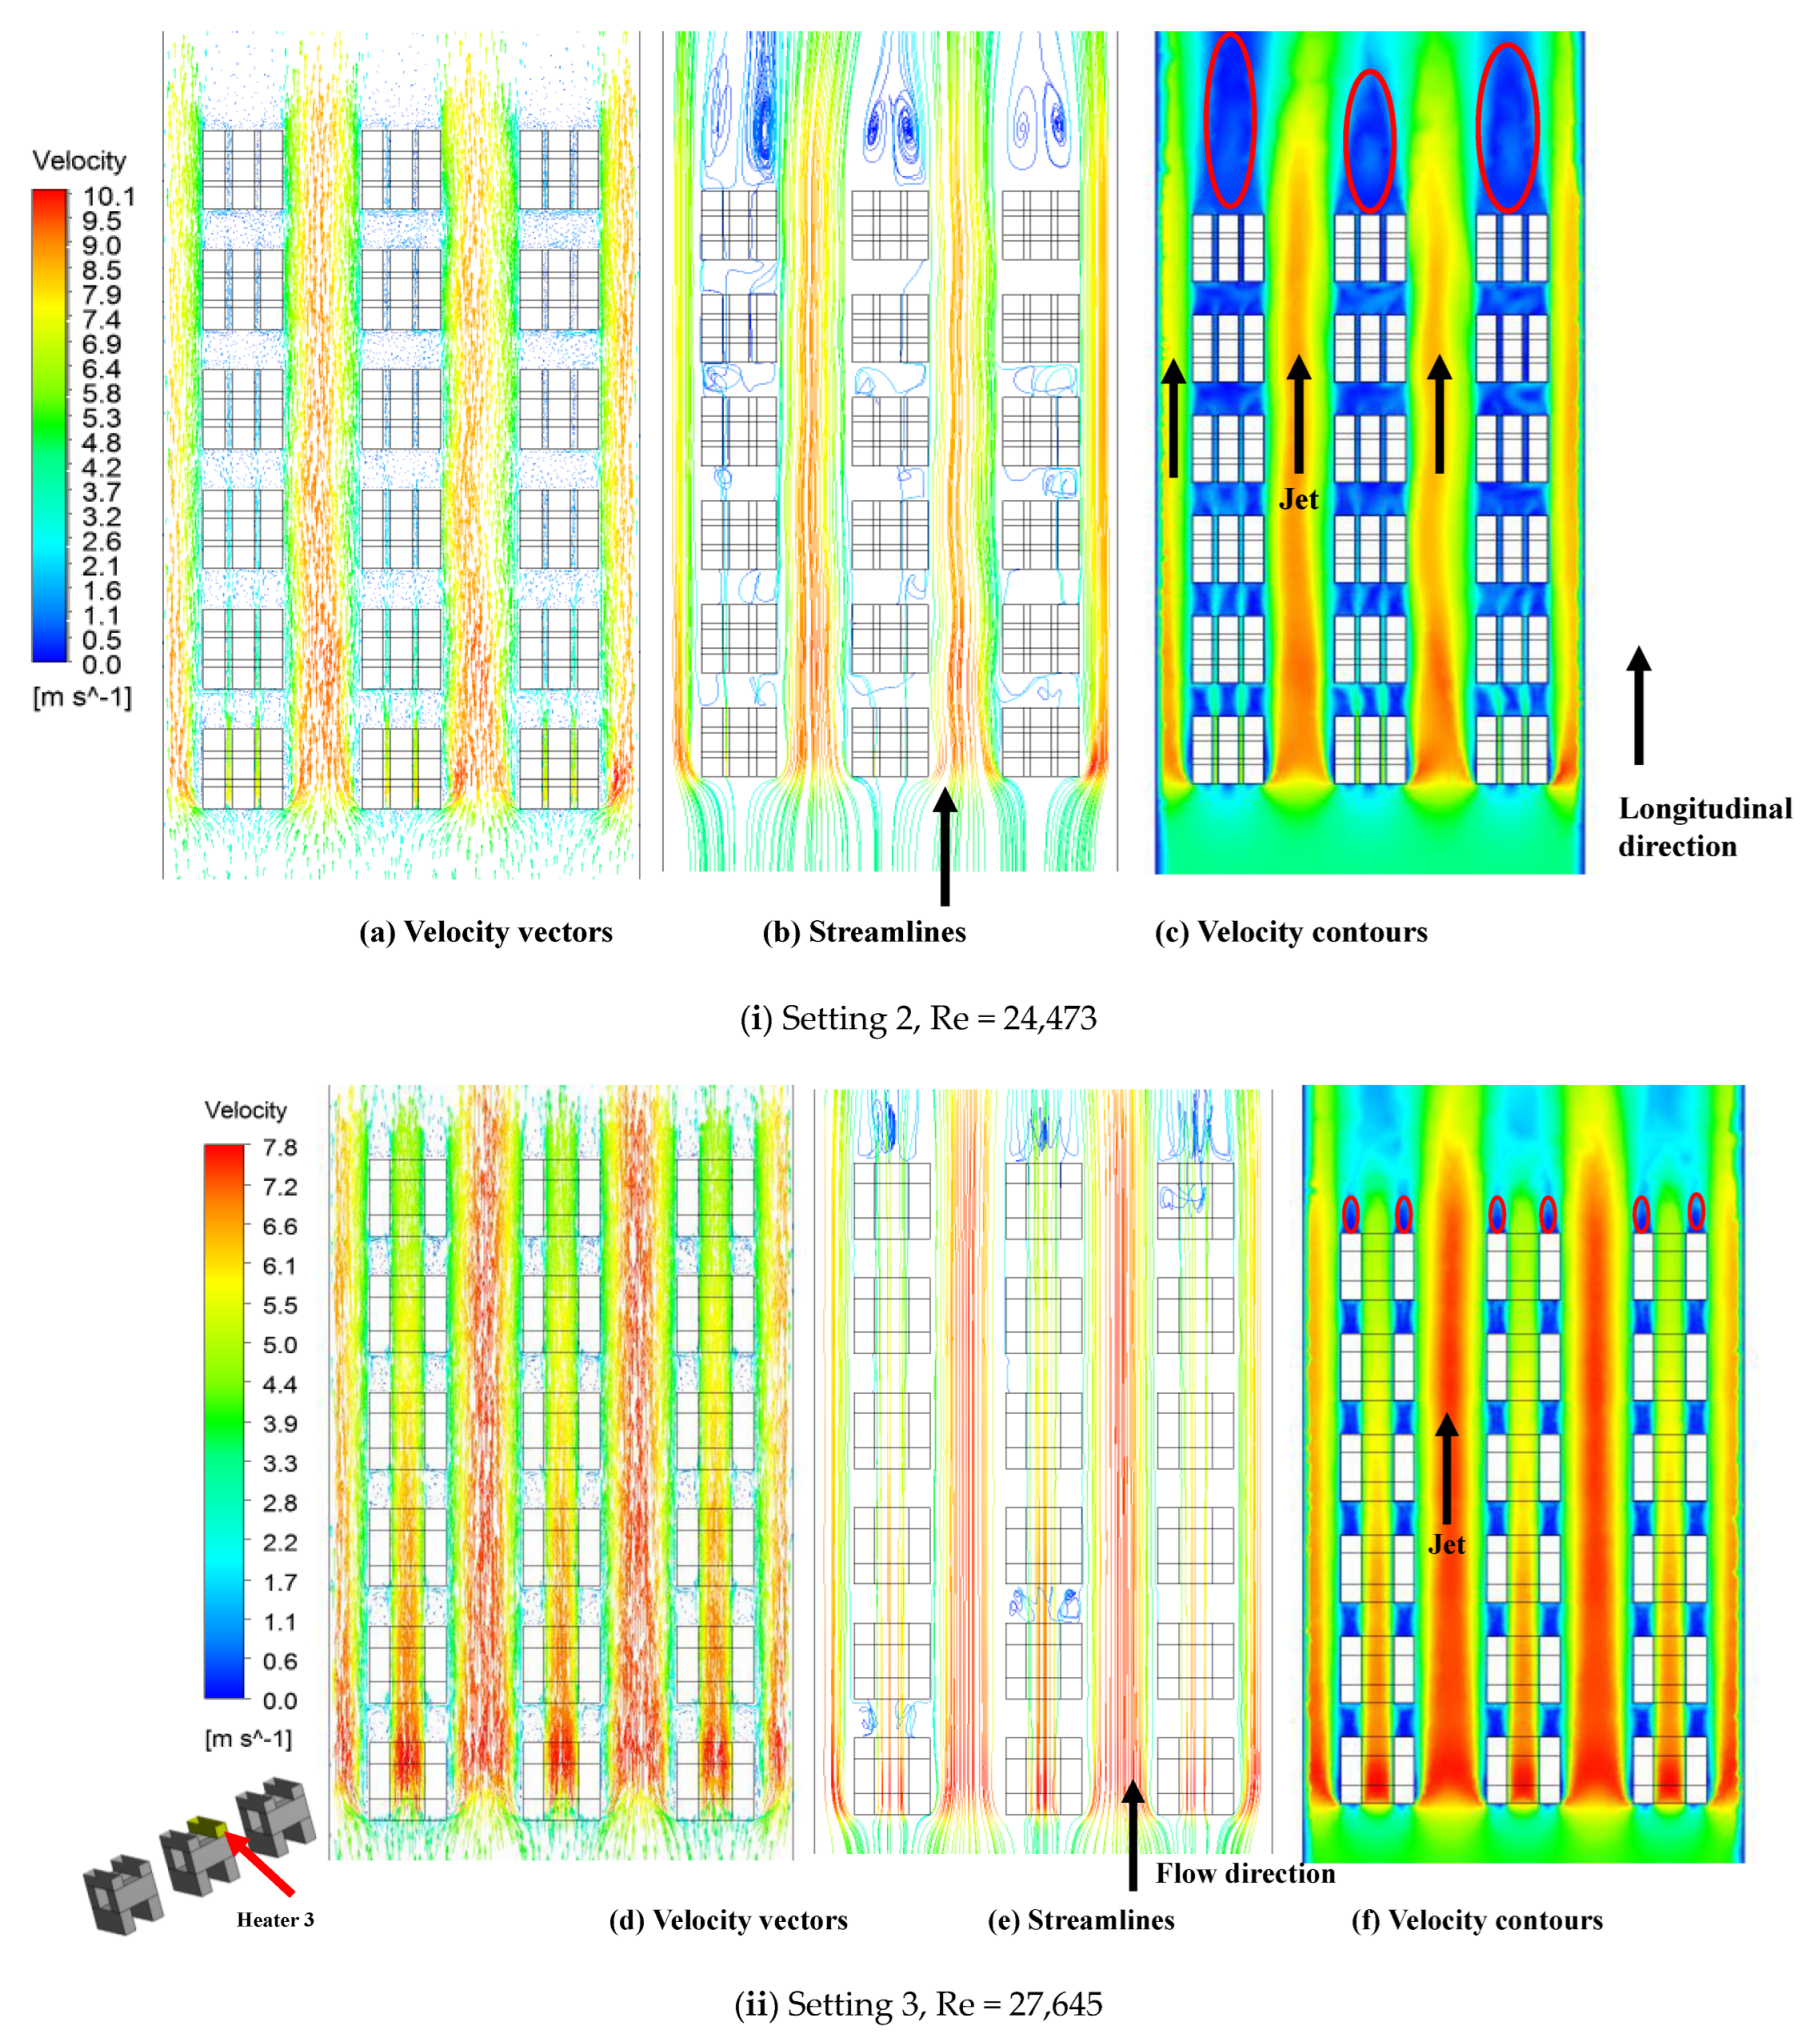
Figure 9 represents the flow field for the second pair of settings (setting 2 and setting 3), which has three columns. The plane (Top 3) passes through the longitudinal heater 3 (H3) at Reynolds numbers 24,473 and 27,645 for settings 2 and 3, respectively. These Reynolds numbers correspond to the maximum inlet mass flow rate (Table 1). The figure shows the velocity vectors, streamlines and velocity contours. Generally, four main jets are formed for the two settings. The two biggest jets are formed in the middle channels between columns. At the same time, the other two jets near the wall are thinner than the middle ones. This can be attributed to the flow resistance, which is smaller in the channel between columns and much higher near the walls. For setting 2, three main separation zones form behind the bricks after the sixth row.
Moreover, there are small jets in between the bricks. This is obvious after the first two rows and greatly diminished afterward. This can be noticed in all figures, velocity vectors, streamlines and velocity contours.
The flow contours, vectors, streamlines and wake region give an overview of the investigated flow field characteristics around the bricks at different settings and Reynolds numbers. The flow fields differ for settings 2 and 3, especially at the wake zone formation and separation zone. Two main vortices are noticed, and the downstream wake region is thicker and longer for setting 2 than setting 3. The number of columns seems to significantly affect the flow field and wake zone behind each brick setting. For setting 2, the path line length in the wake region is bigger, and the velocity values are lower, covering a wide area through the column channels.
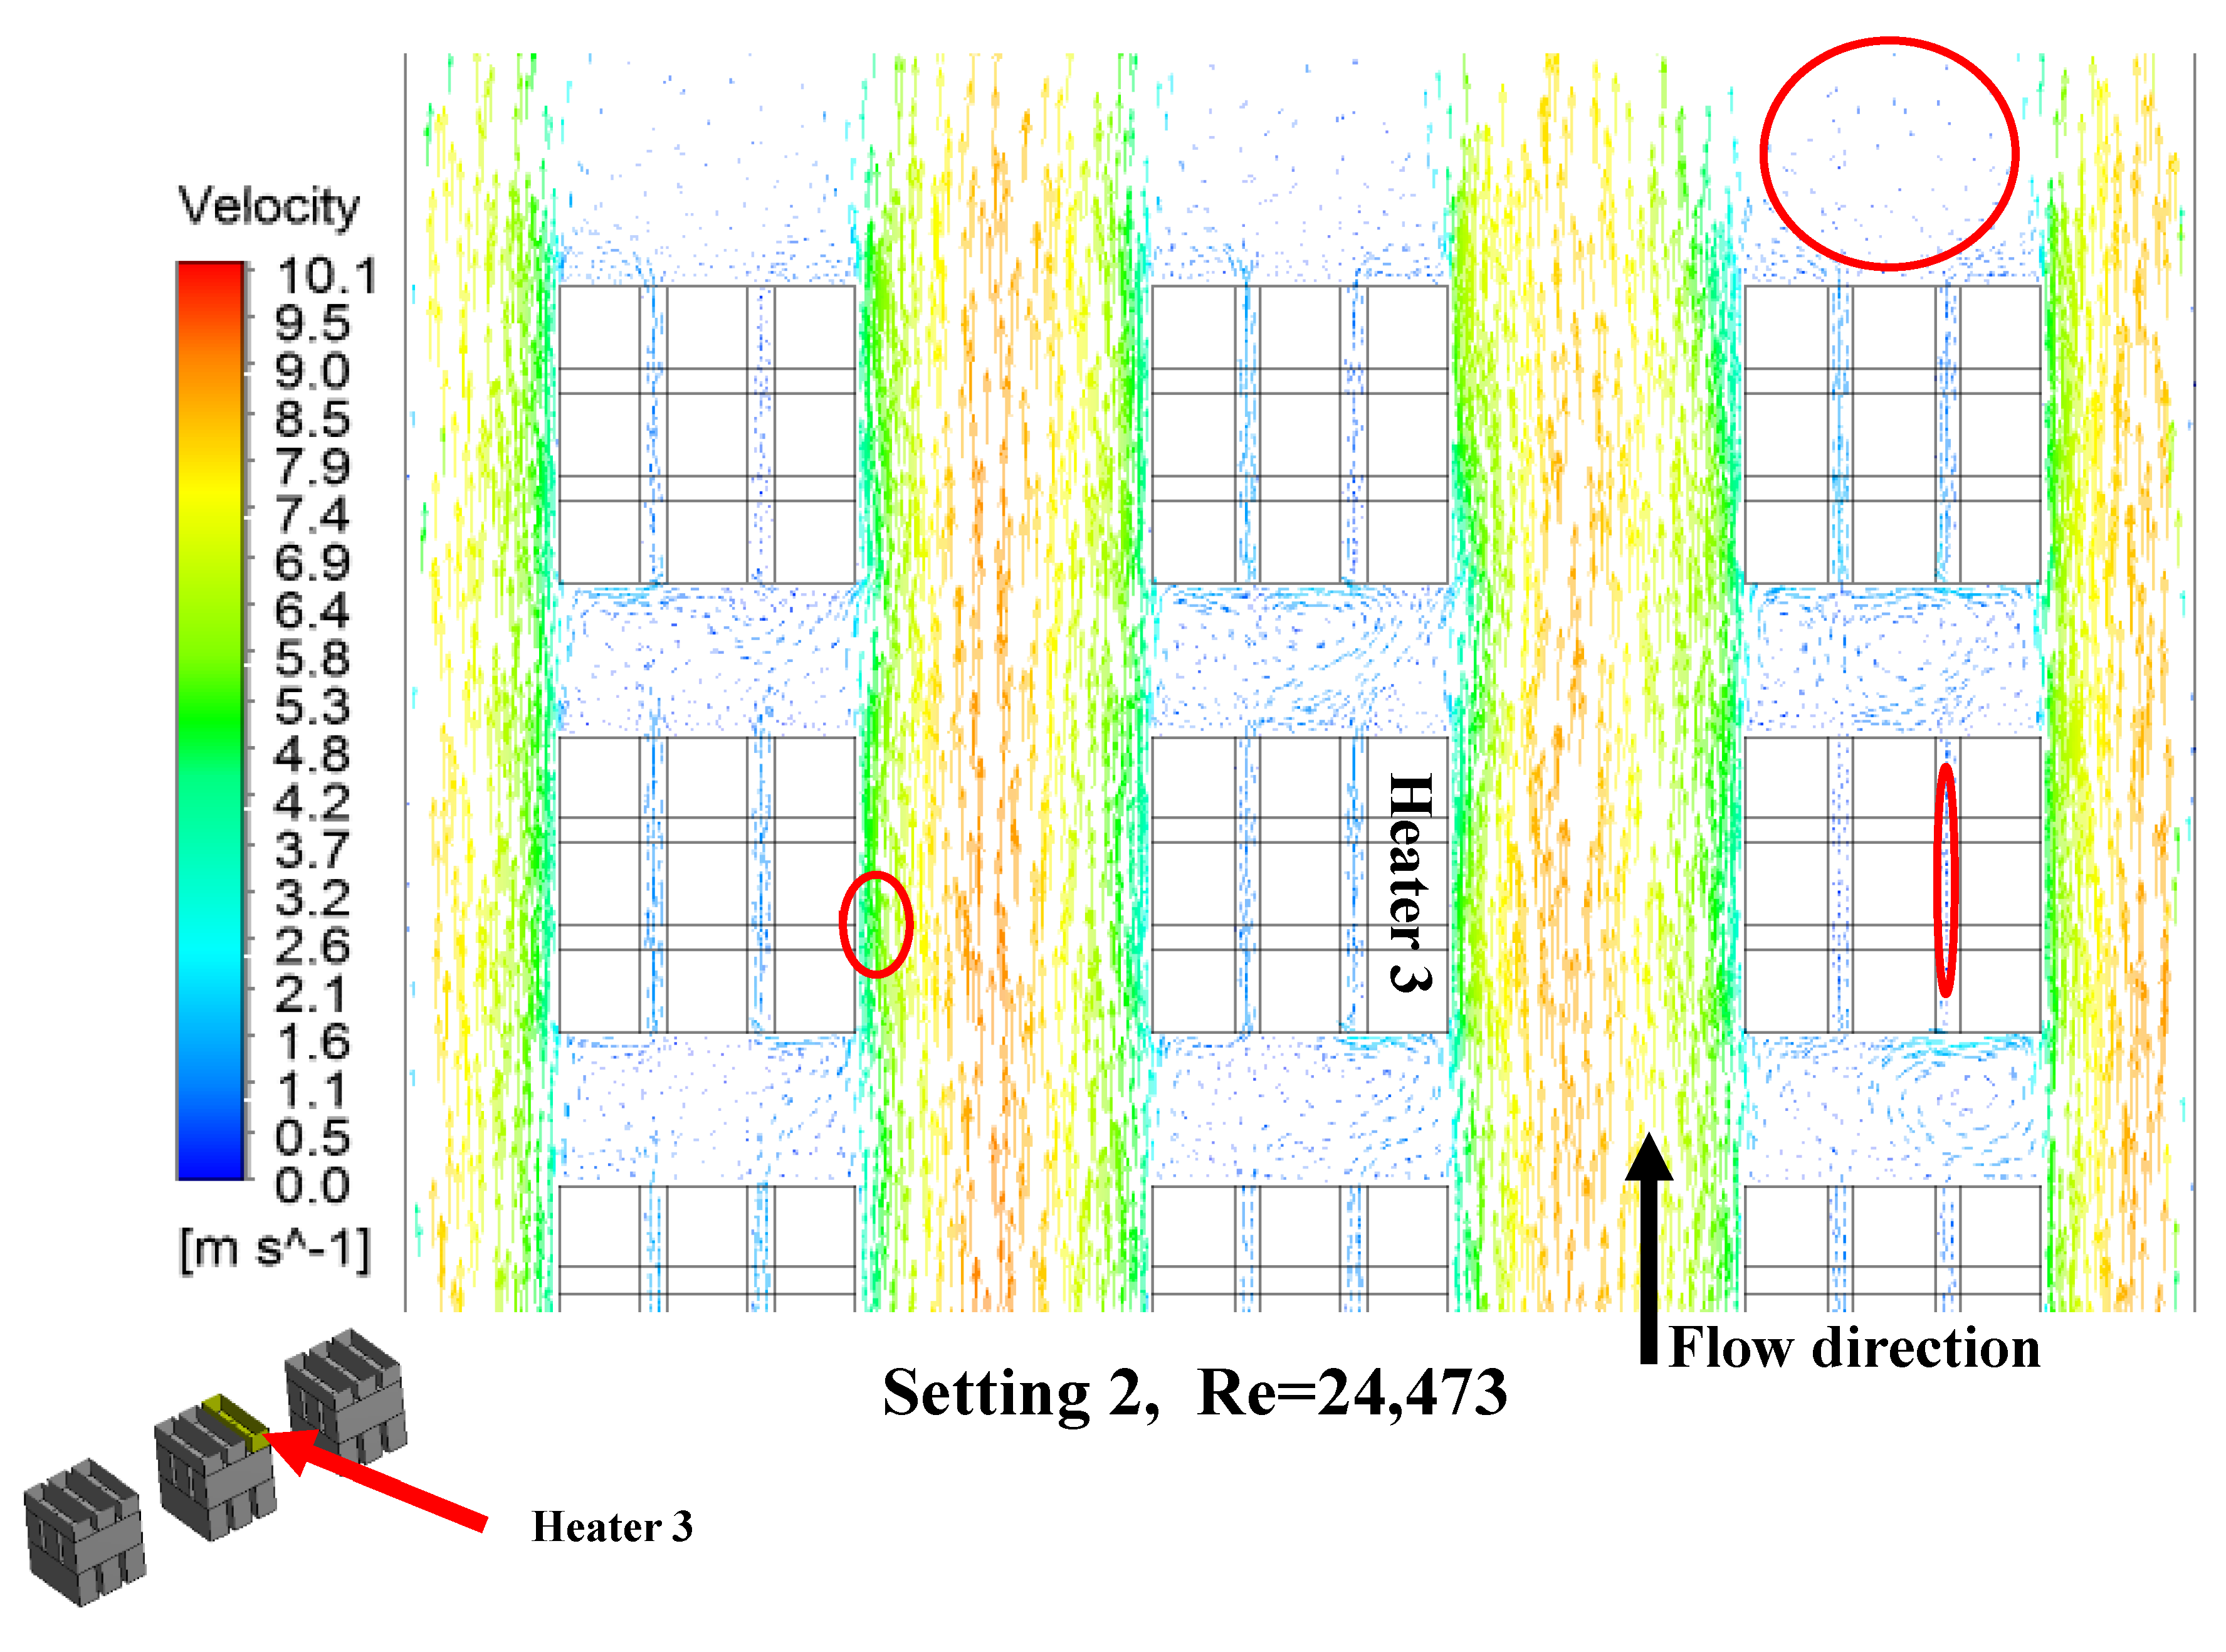
Figure 10 shows a zoom-in 2D cross-section between the fifth and sixth rows for settings 2 and 3 for the velocity vectors plotted for the longitudinal heater 3 (H3). The vortex structure in the two settings is different, where a big wake zone is formed downstream of the longitudinal brick in setting 2. Downstream of the jet, a wake region develops, while upstream of the jet, a sharp velocity gradient, resulting in a temperature gradient. These flow field patterns of the fluid flow significantly influence the heat transfer process between the longitudinal brick in the wall channels and column channels. The low-velocity region in the wake region between the longitudinal brick and the high-velocity region in the jet flow pattern is observed. In setting 3, a good local cooling effect is produced due to the higher velocity in column channels, and a higher convective heat transfer is expected. The map of the velocity vector in setting 2 shows that the wake zone of low velocity is produced behind the columns compared to setting 3.
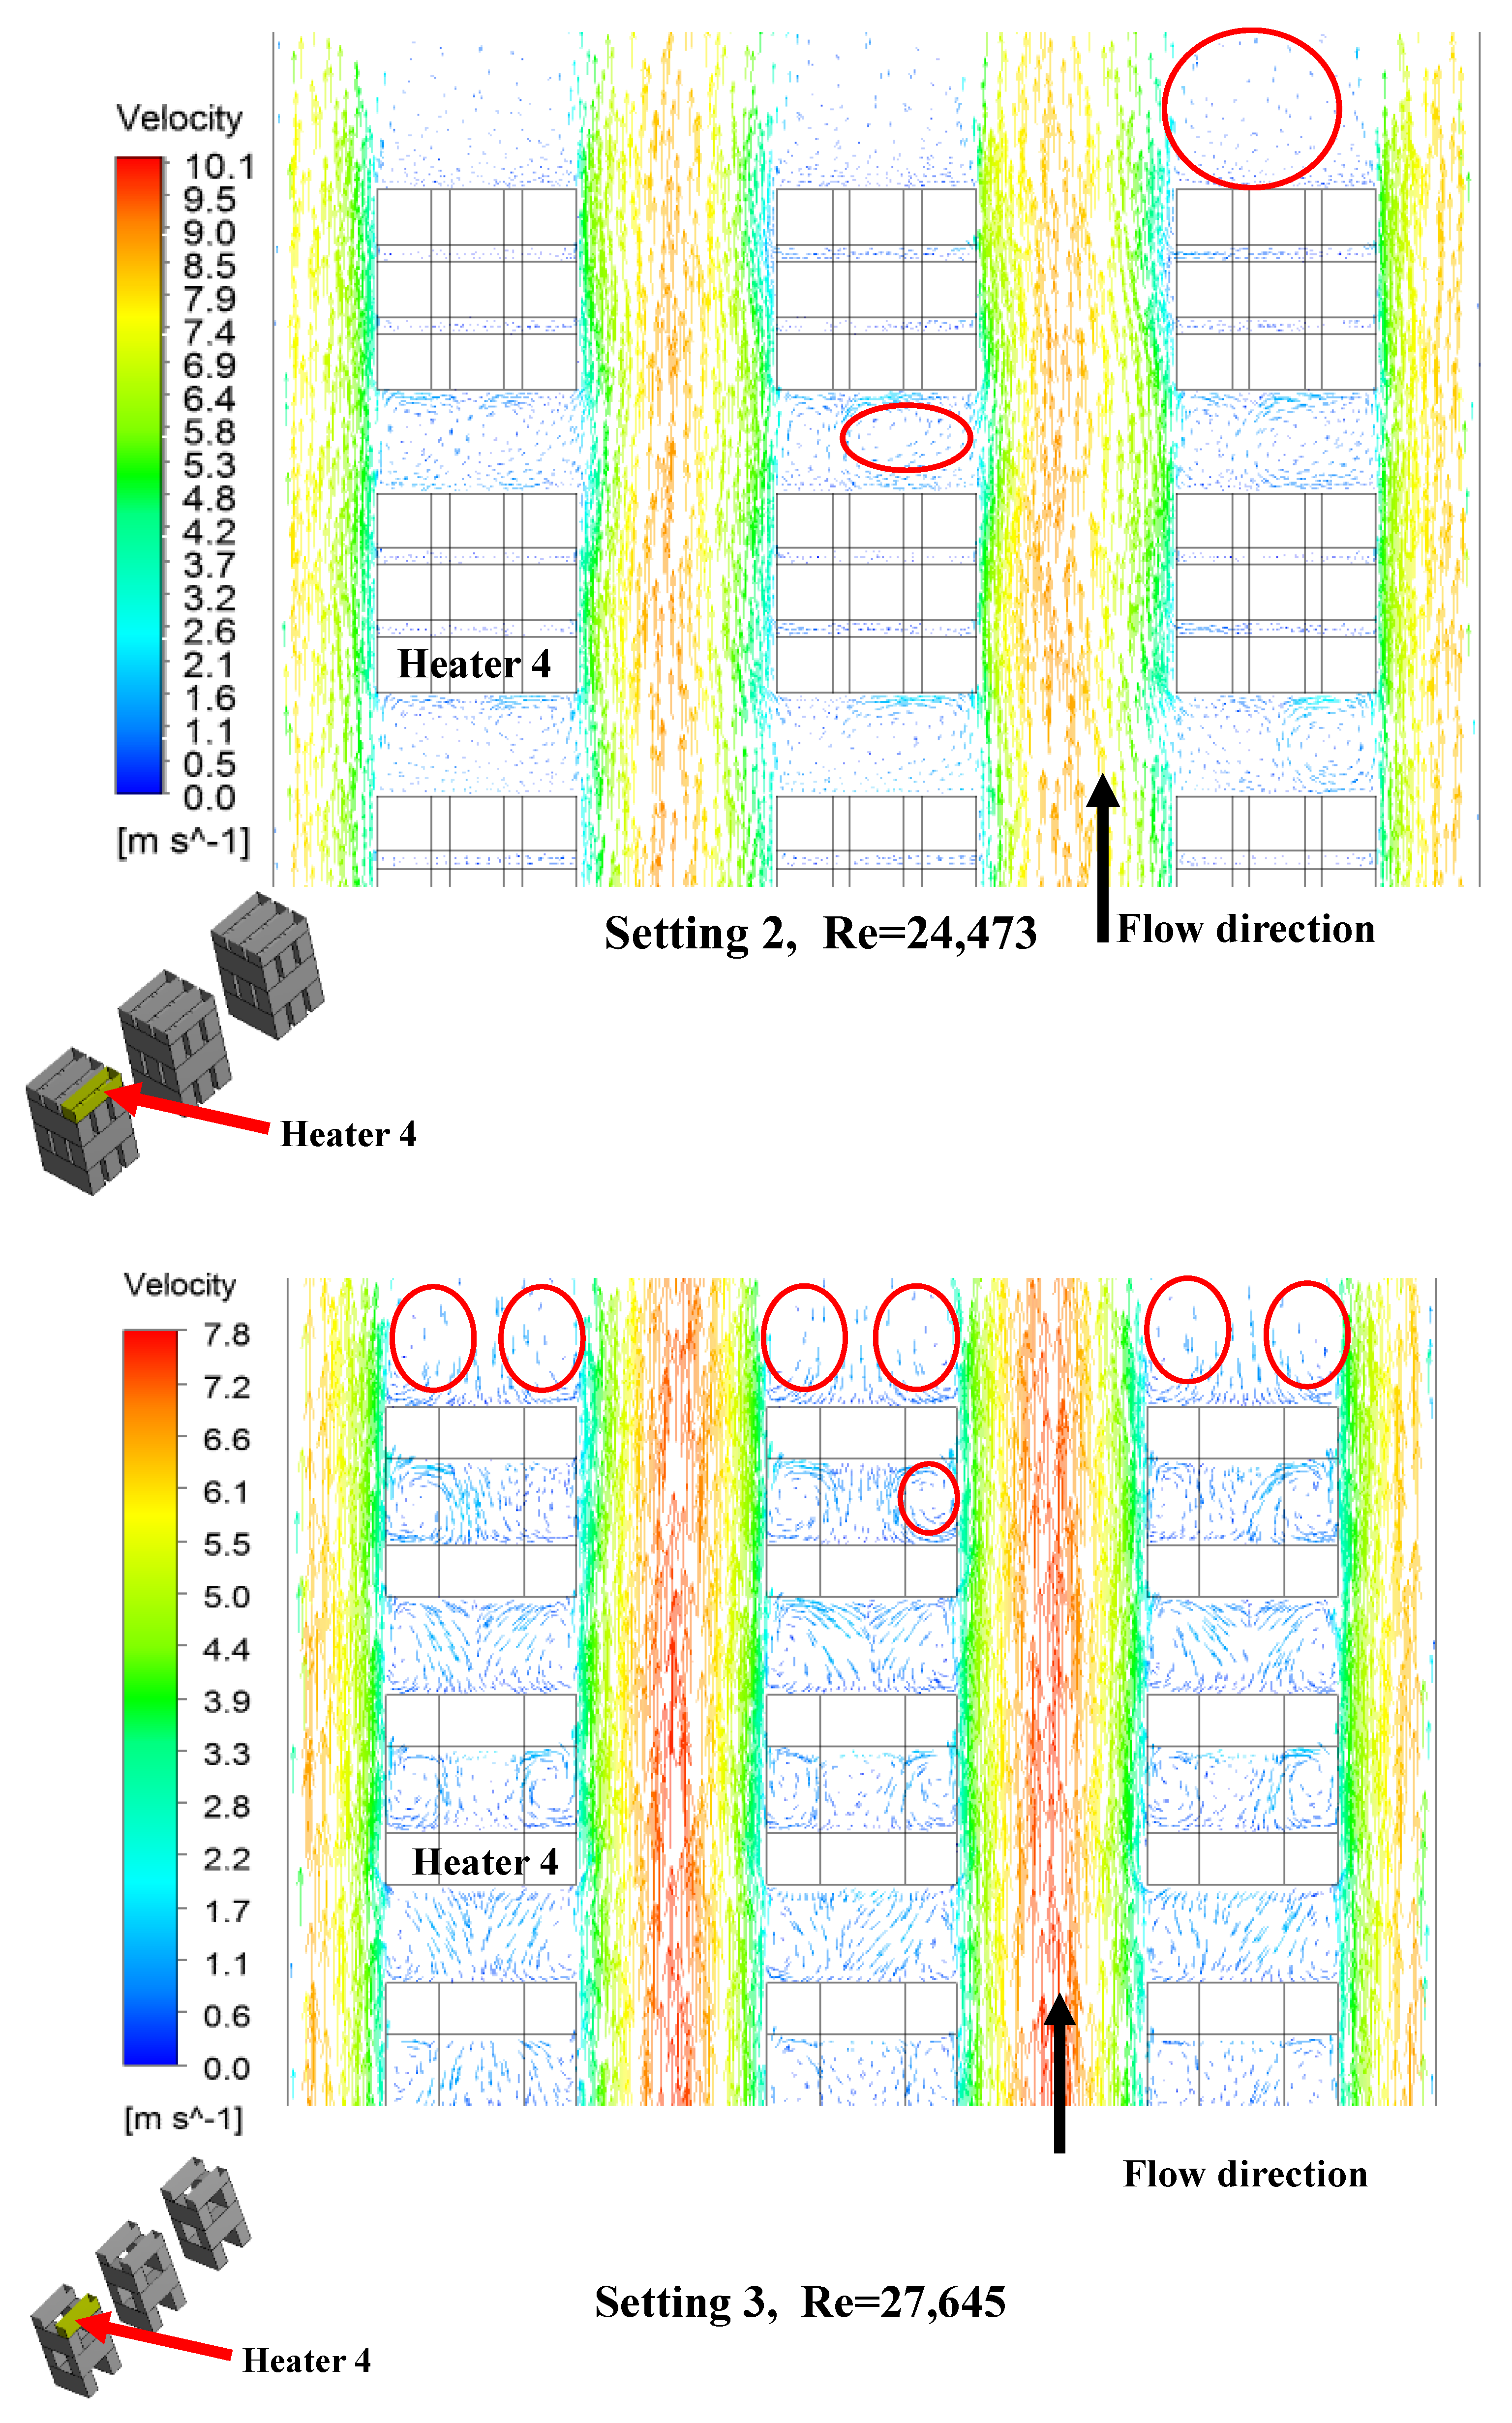
Figure 11 gives the same velocity vectors, presented in Figure 10, between the fifth and sixth rows for settings 2 and 3 for transversal heater 4 (H4). The maximum relative velocity occurs at the wall channels and in the channel between the brick columns. The low velocity with negative values in the wake region downstream of the brick column is different from that in Figure 10. Also, a small wake region with relatively low velocity is also formed in the column channels. The wake region in Figure 11 is greater than that in Figure 10, which means that the wake region formation depends on the columns’ setting. Two pairs of streamwise vortices are formed behind the column bricks. The streamwise vortices are attached to the brick surfaces, and the vortex pair being shed is stronger.

3.1.2. Effect of the Number of Columns

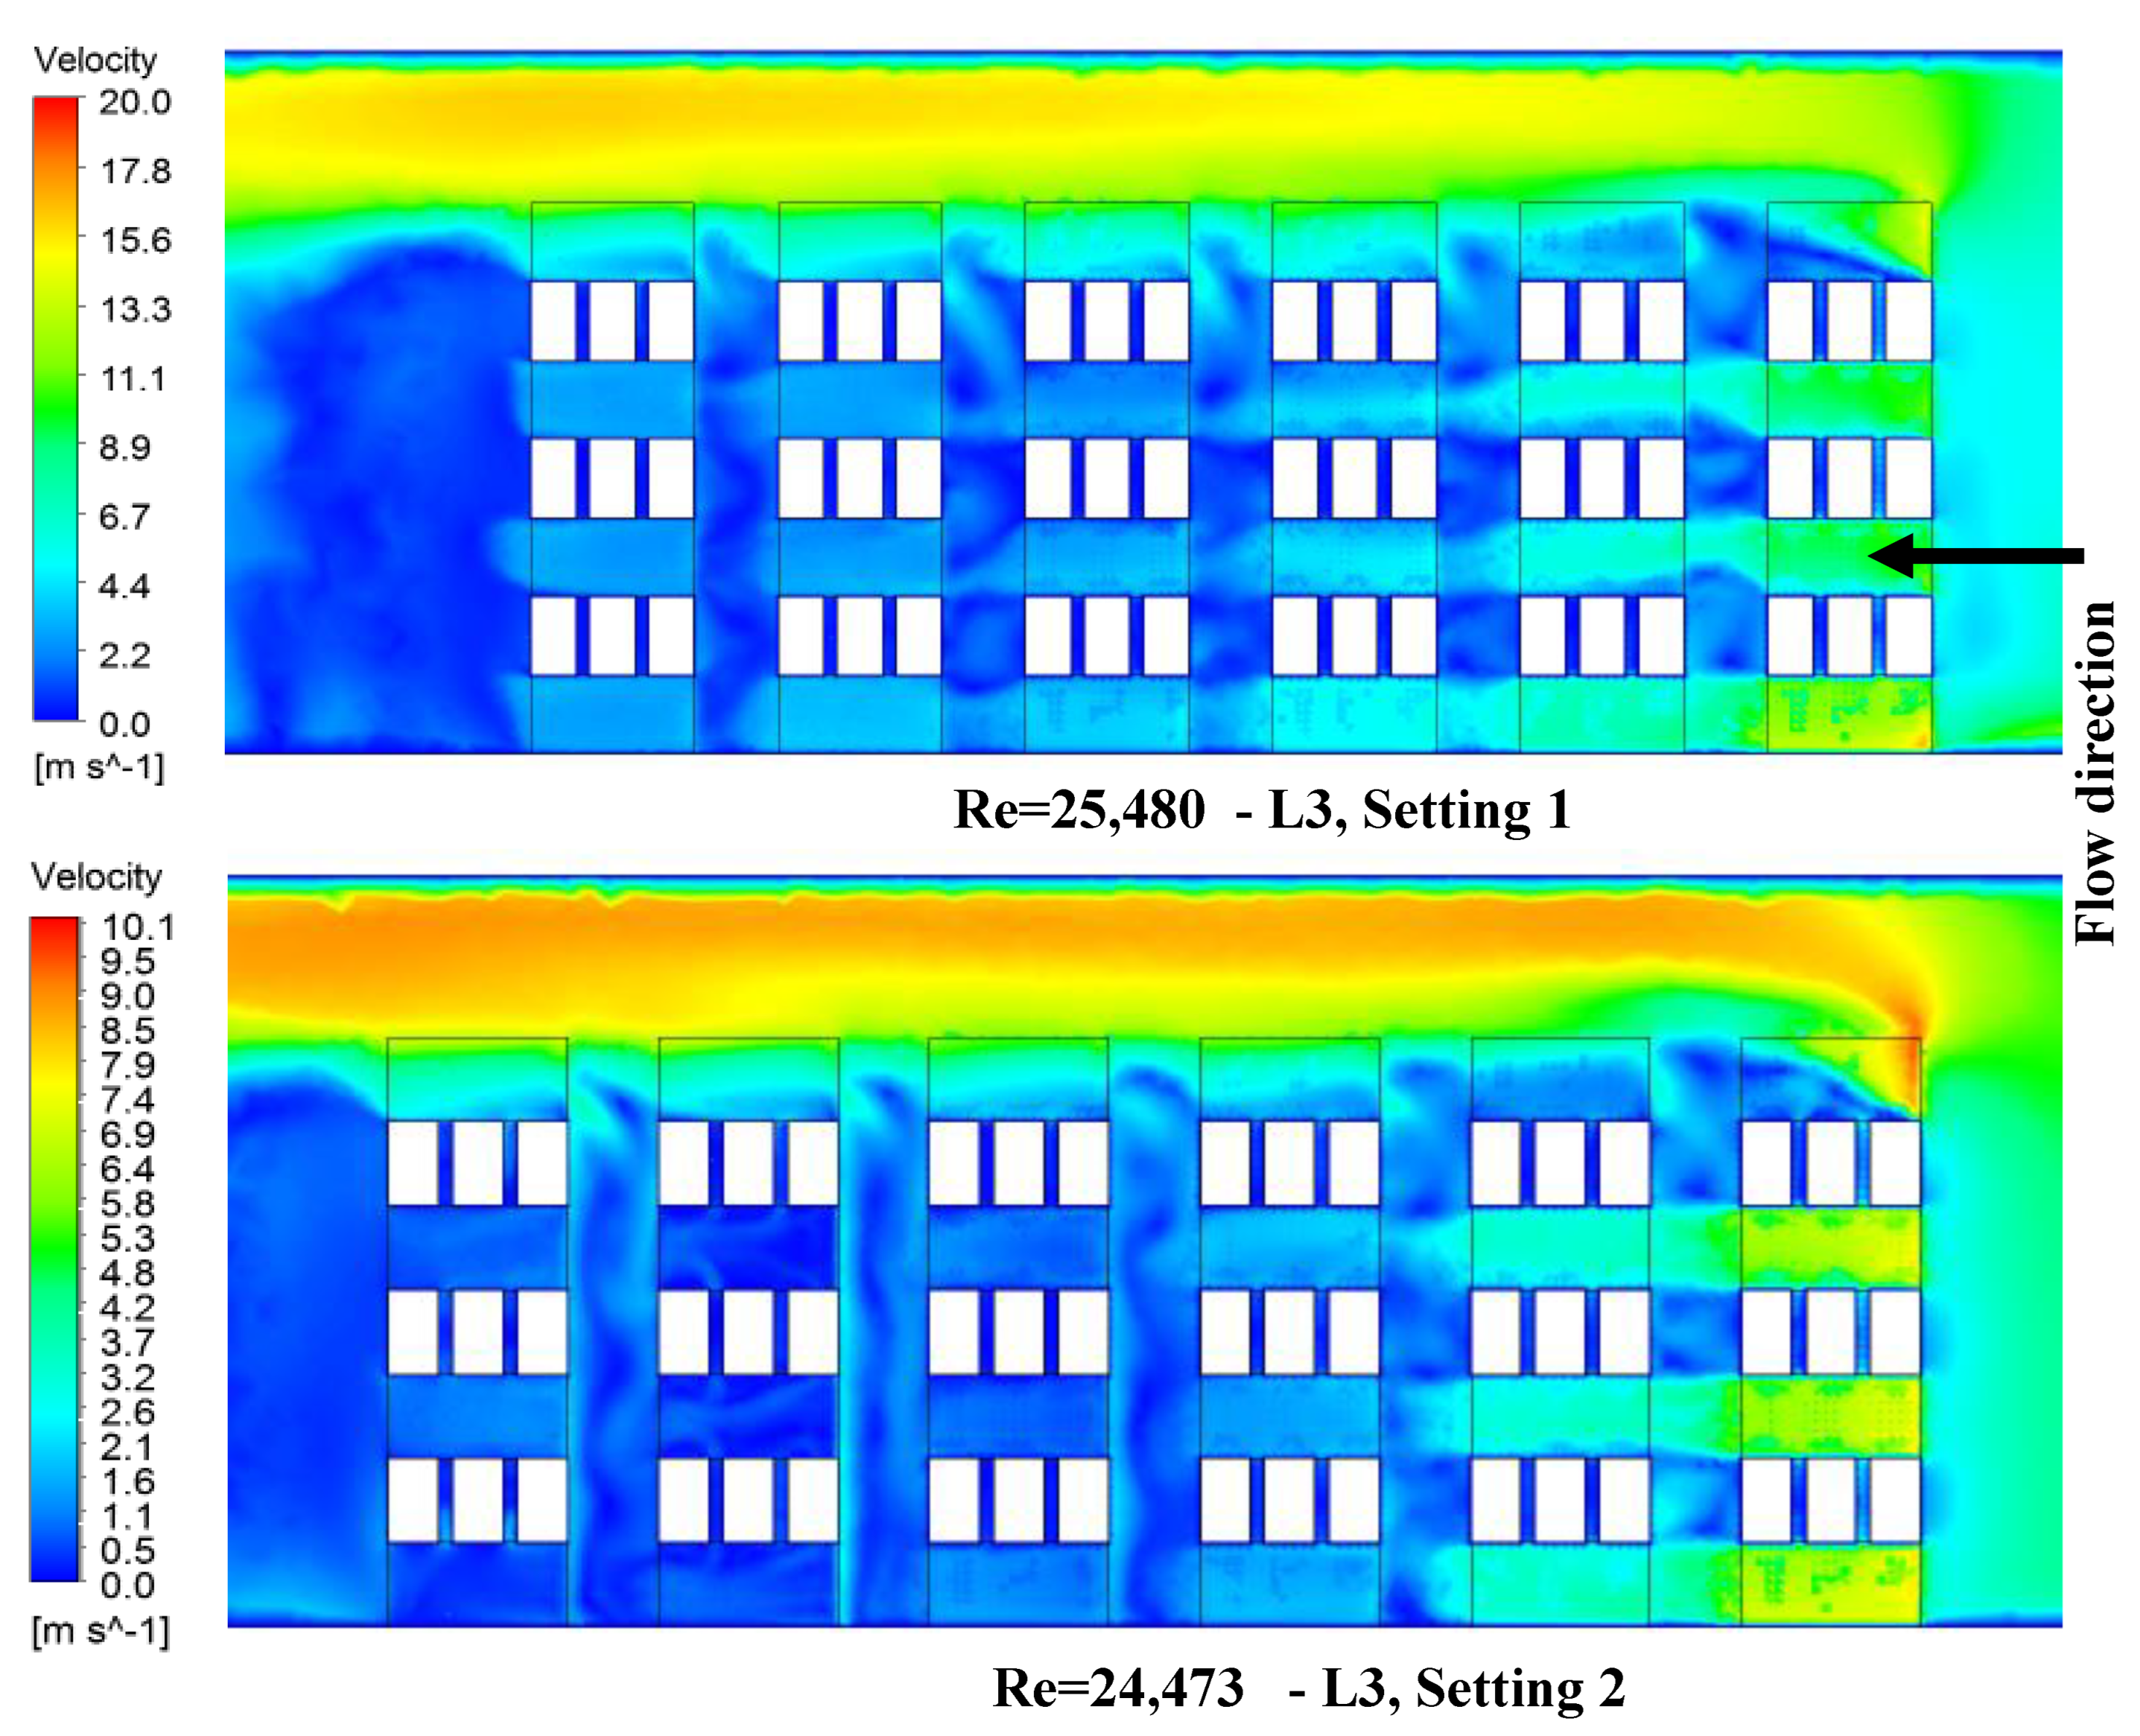
The effects of the number of columns must be determined to reduce or enhance the heat transfer characteristics. The velocity vectors are illustrated in Figure 12 for the plane (L3), which is in the longitudinal channel between bricks in the first brick column. For the two settings, 1 and 2, the wake region may be noticed starting from the separation point and extending alongside the mean flow to touch the front walls of the next row. However, for both settings, the size of the wake region increases in the flow direction where the size of the recirculation zone extends. The maximum velocity is always observed at the first column and in the flow passages between the adjacent wall and bricks in the longitudinal direction. Because of this, the heat transfer rate is high through the first column and the other downstream columns.
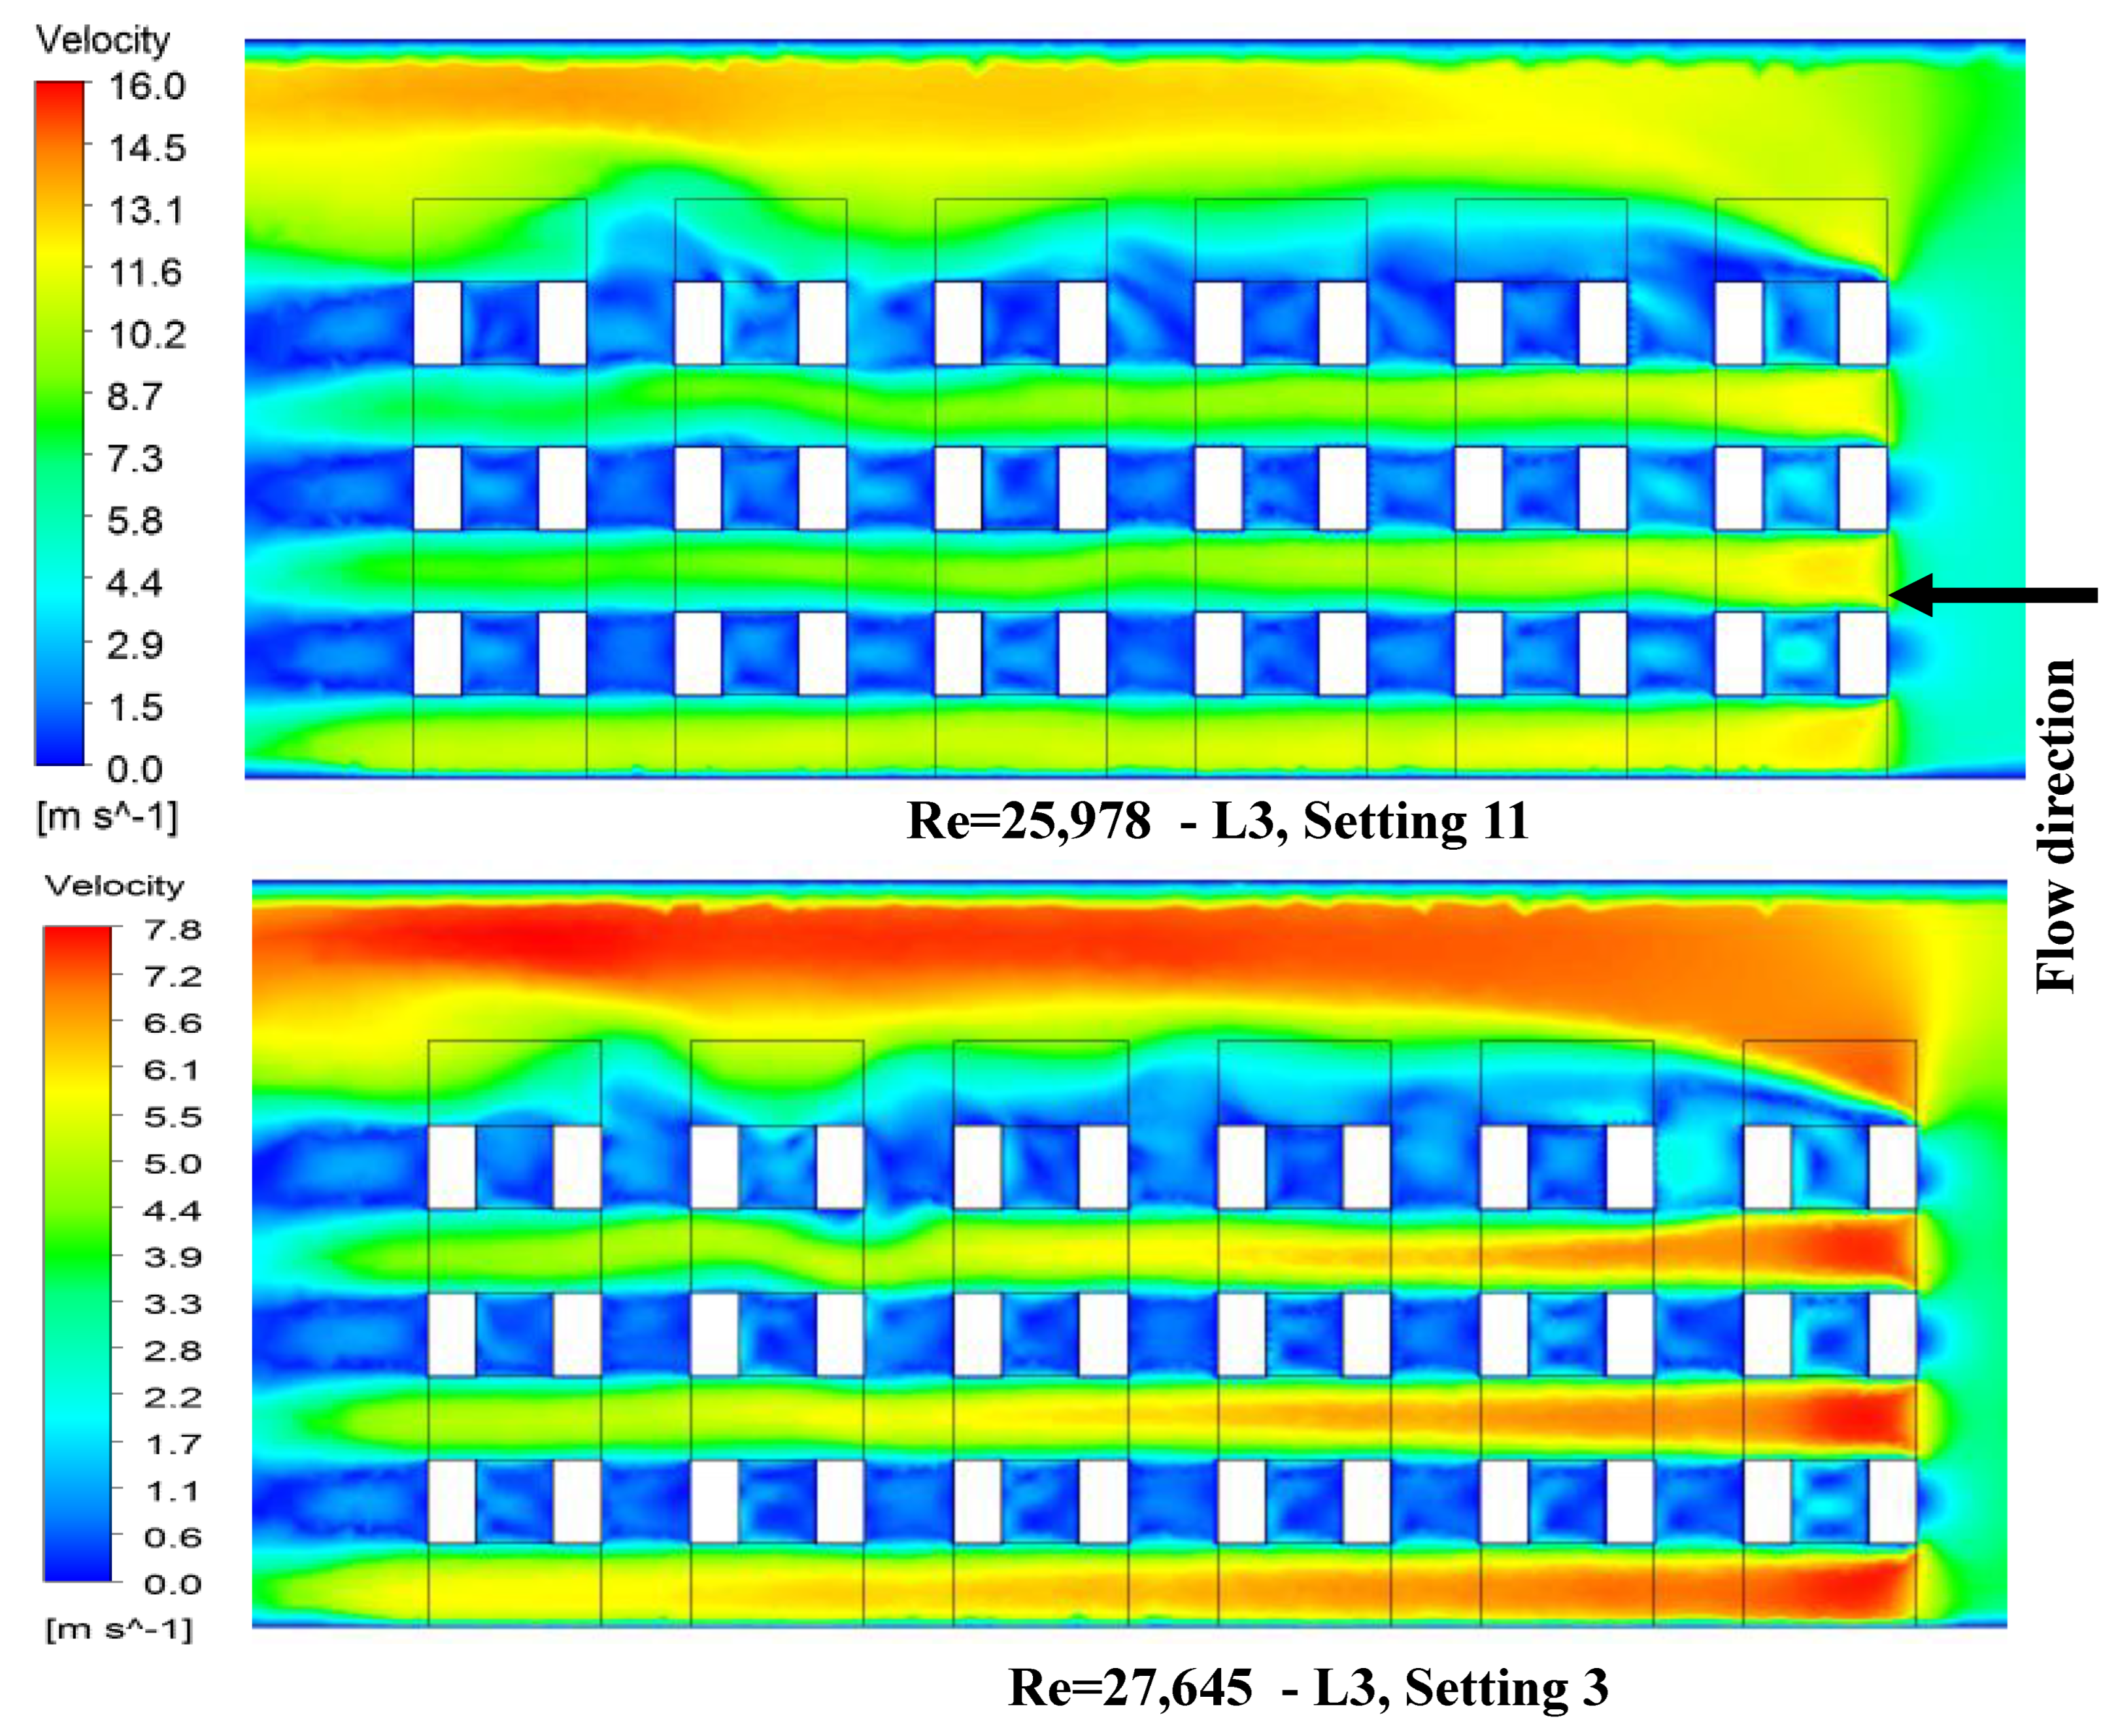
Figure 13 illustrates that settings 11 and 3 have similar velocity curves. The longitudinal velocity between the neighbouring wall and bricks is higher than in the mid-plane flow tunnels. Flow separation in the first column reduces velocity downstream of the bricks. Setting 3 has greater mid-plane velocity than setting 11 in the longitudinal direction. Figure 12 and Figure 13 demonstrate that the primary flow streams in settings 1 and 2 are forced onto a smaller proportion of brick contact than in settings 11 and 3, and a comparatively bigger wake zone has arisen in Figure 12. The second column has a lower velocity than the first row.

3.2. Wall Effects on the Flow Field

Figure 14 shows the airflow velocity vectors along the longitudinal plane, which pass through the brick (L2) for settings 1 and 11. In this figure, the airflow separation is observed in the upstream region of the first column, and only the first column is exposed to the main flow. A large recirculation zone (dead zone) is formed in setting 11 and reversed flow patterns are found upstream of the deeper columns. Since the recirculating flow appears to have a low velocity, a low heat transfer rate is expected in the wake region due to the existing bricks in the flow direction.

3.3. Flow Uniformity through the Fifth Row

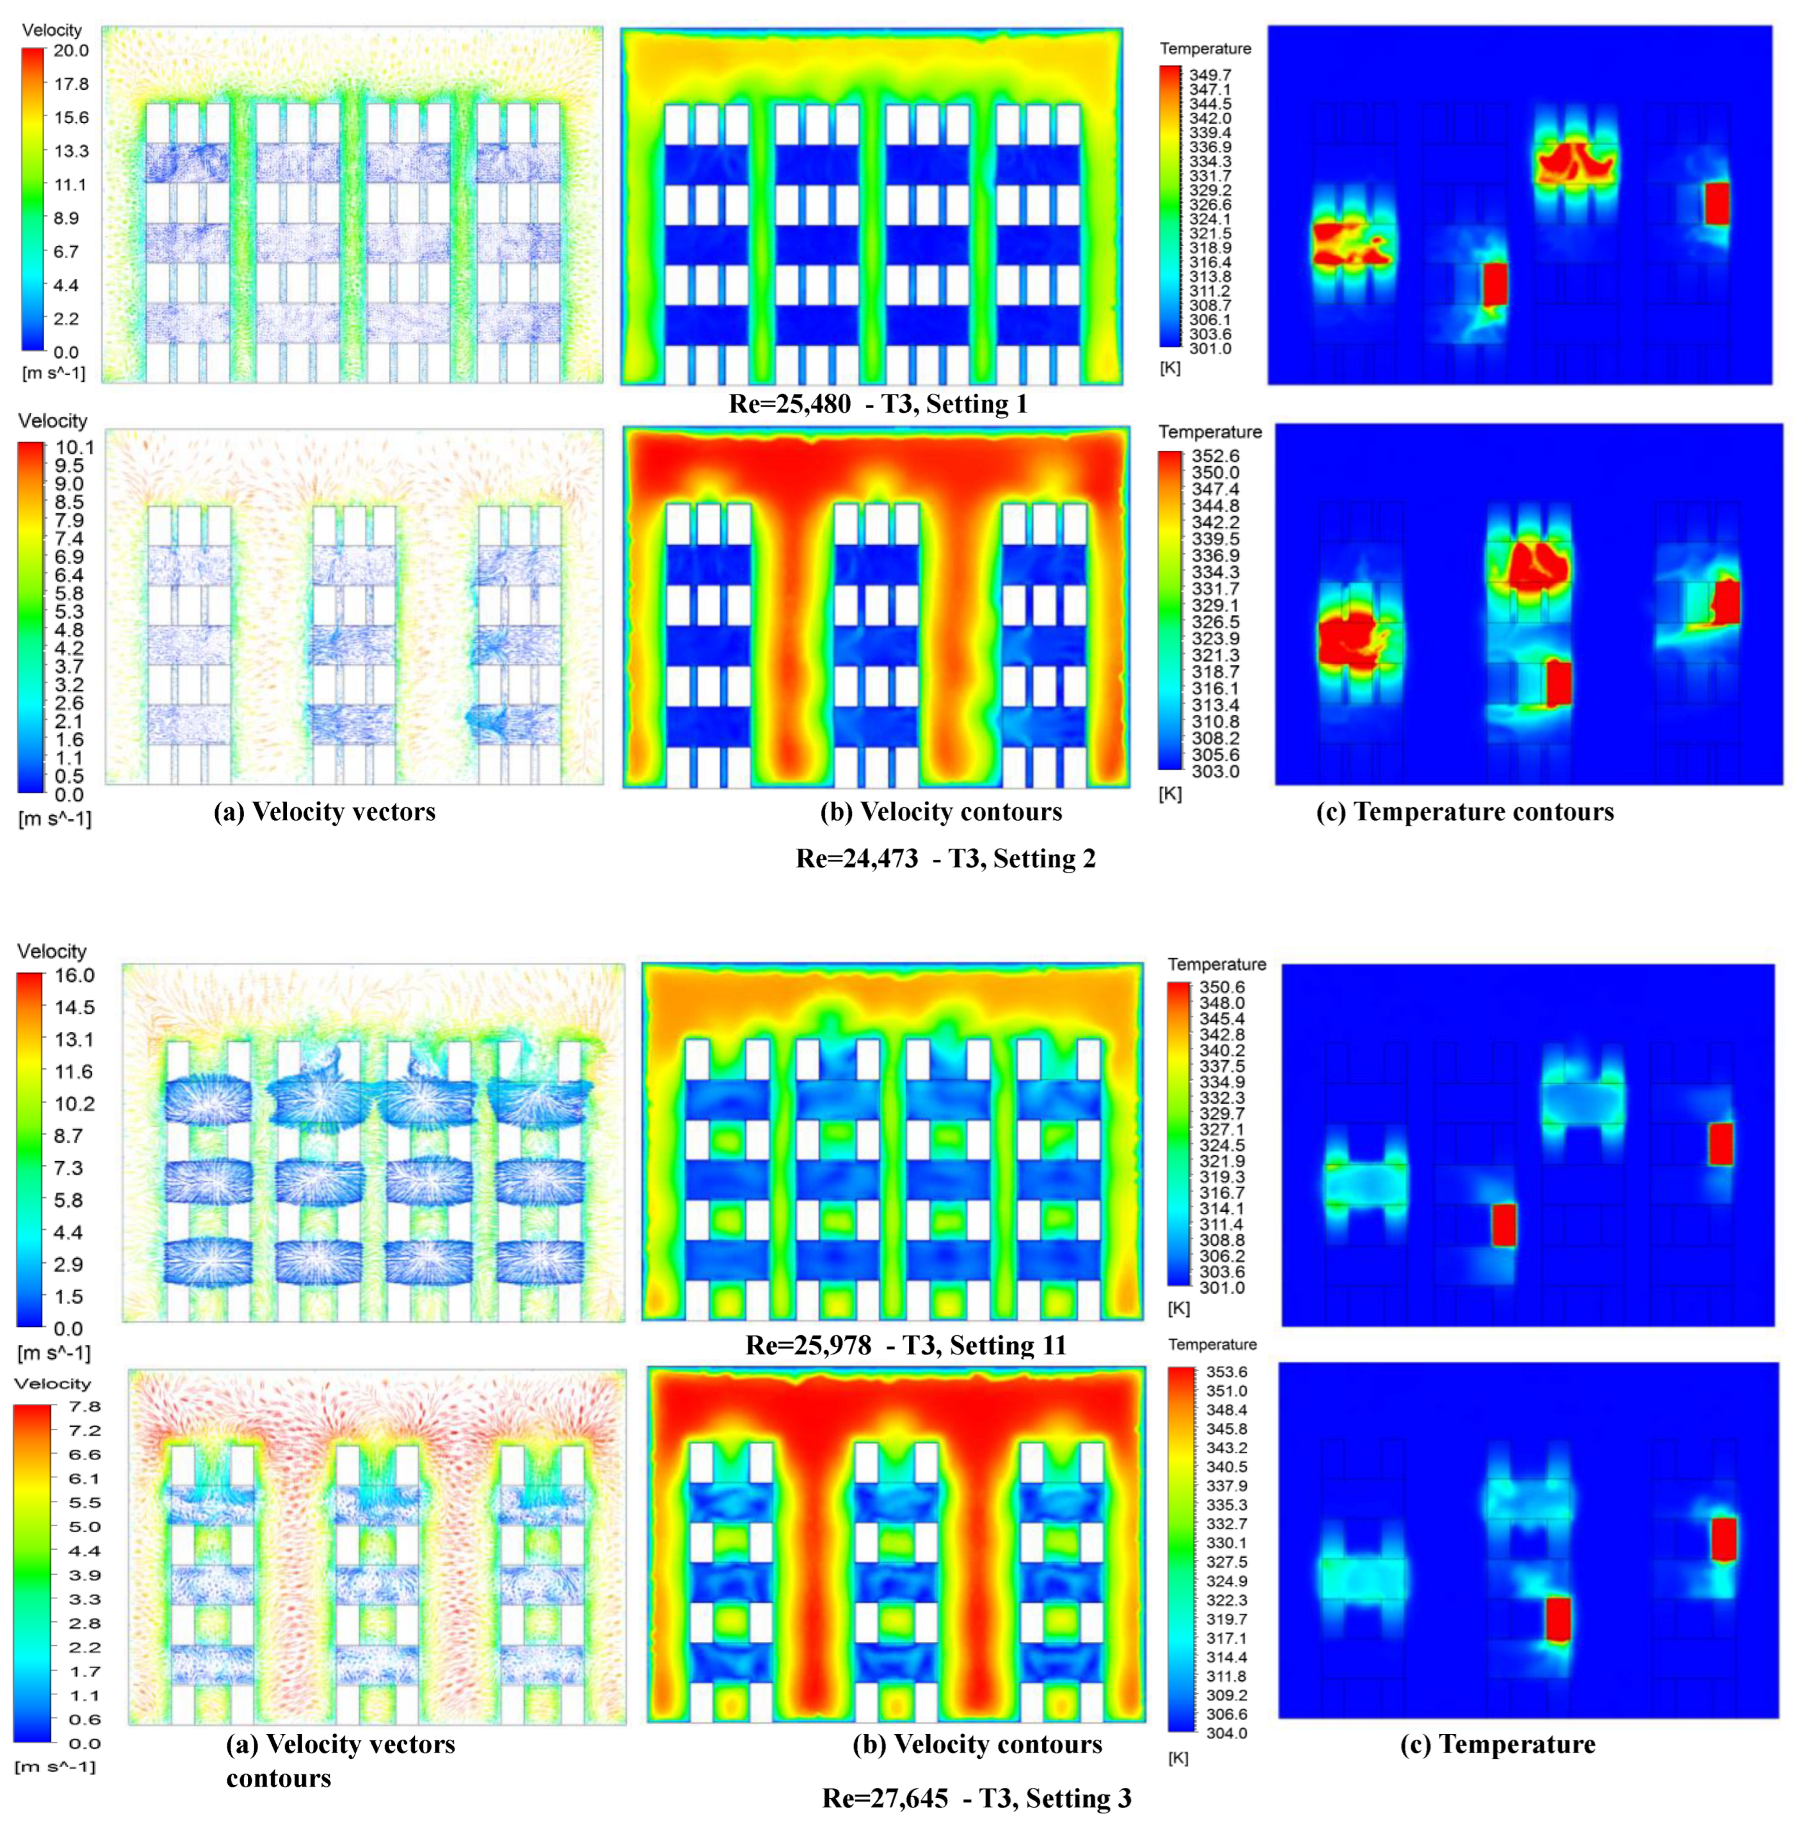
Figure 15 compares streamwise velocity vectors, velocity contours and temperature contours in the symmetric transversal channel between bricks in the fifth row (see Figure 5, at T3) for settings 1, 2, 3 and 11. Settings 1 and 11 have a similar flow field, as do settings 2 and 3. Each column’s estimated wake area differs. Settings 1 and 2 feature small gaps between blocks and little vortices. Setting 2 has larger vortices after traveling through the column than setting 1. Vortices form between nearby bricks and travel through the brick columns. Small-scale eddies in settings 3 and 11 dissipate heat from bricks, cooling the heated wall sides and the cold stream fluid. Thus, settings 3 and 11 enhance brick surface heat transmission. After perturbing the flow field, the vortices surrounding the bricks in settings 3 and 11 improve the heat transfer coefficient of the fifth-row bricks compared to settings 2 and 1.
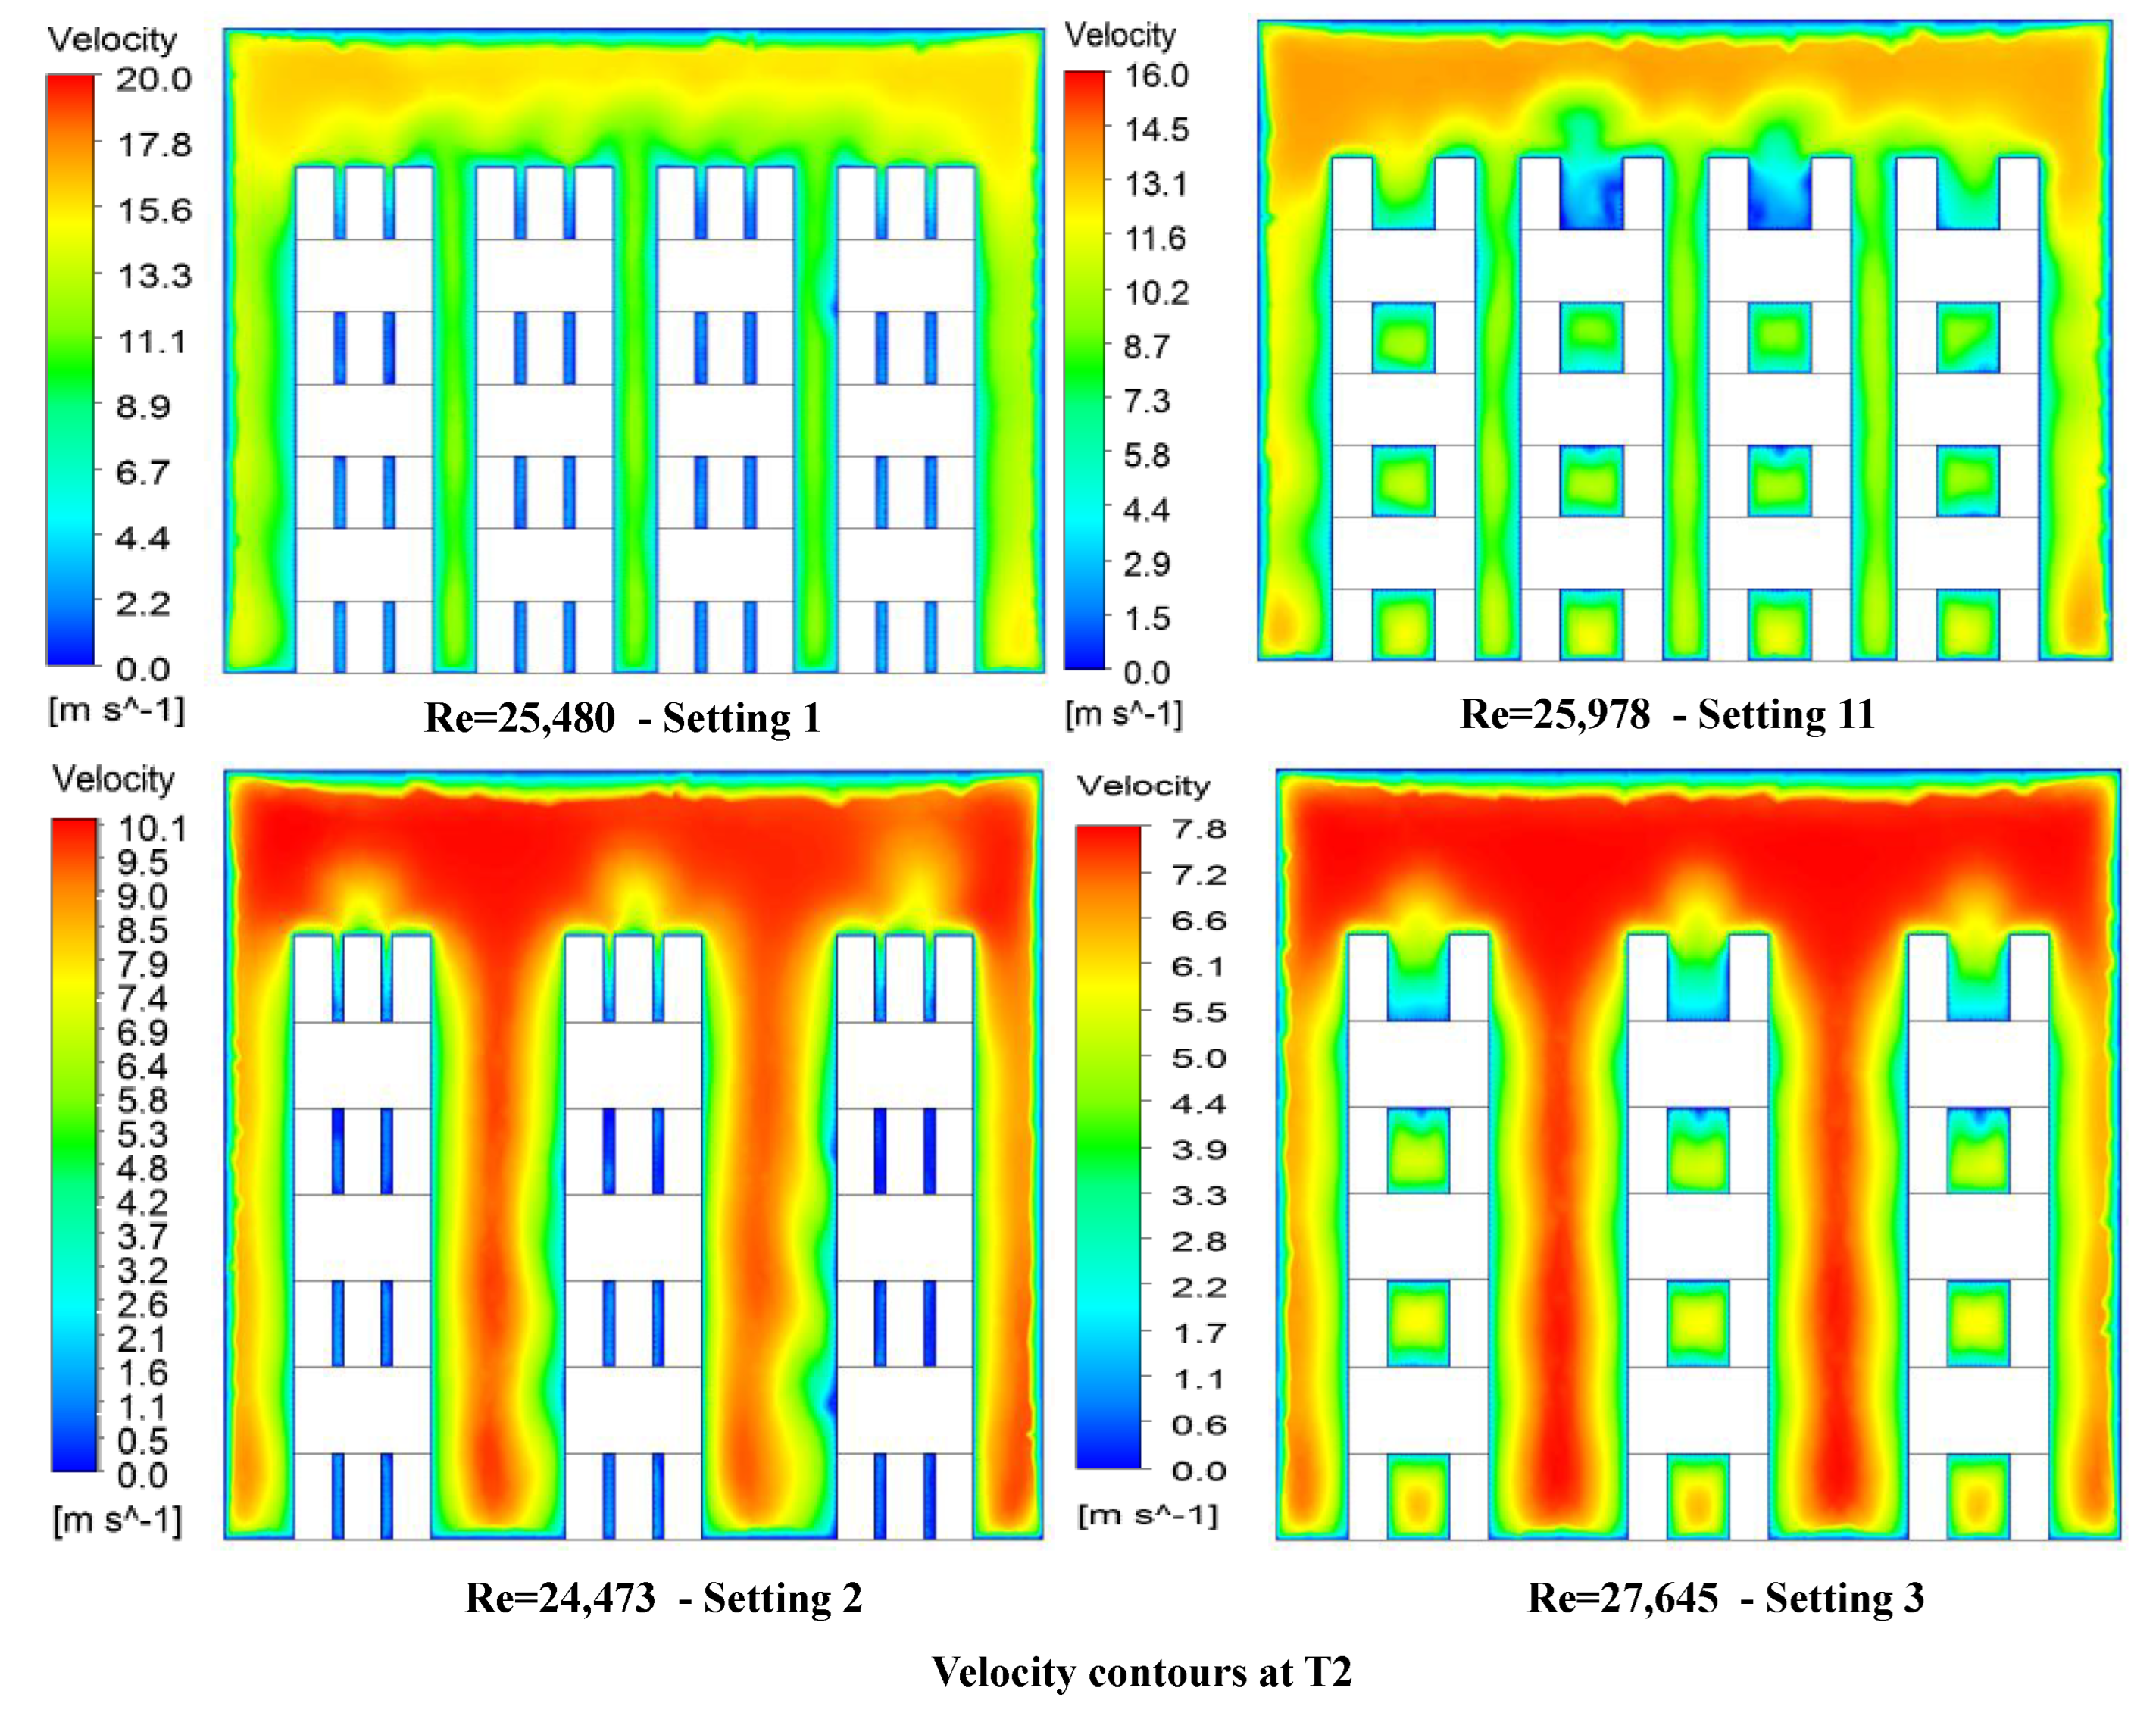
As shown in Figure 16, both the vortex-generating area and the eddies in setting 3 are more powerful than the vortices created on the brick surfaces in the other settings. These vortices greatly affect the pace at which heat is transferred between the bricks. Vortices created on the brick surfaces have more strength than those formed in setting 1 but only in that setting. The non-perpendicular side walls of the brick columns benefit from enhanced heat transmission thanks to vortices created inside the columns.
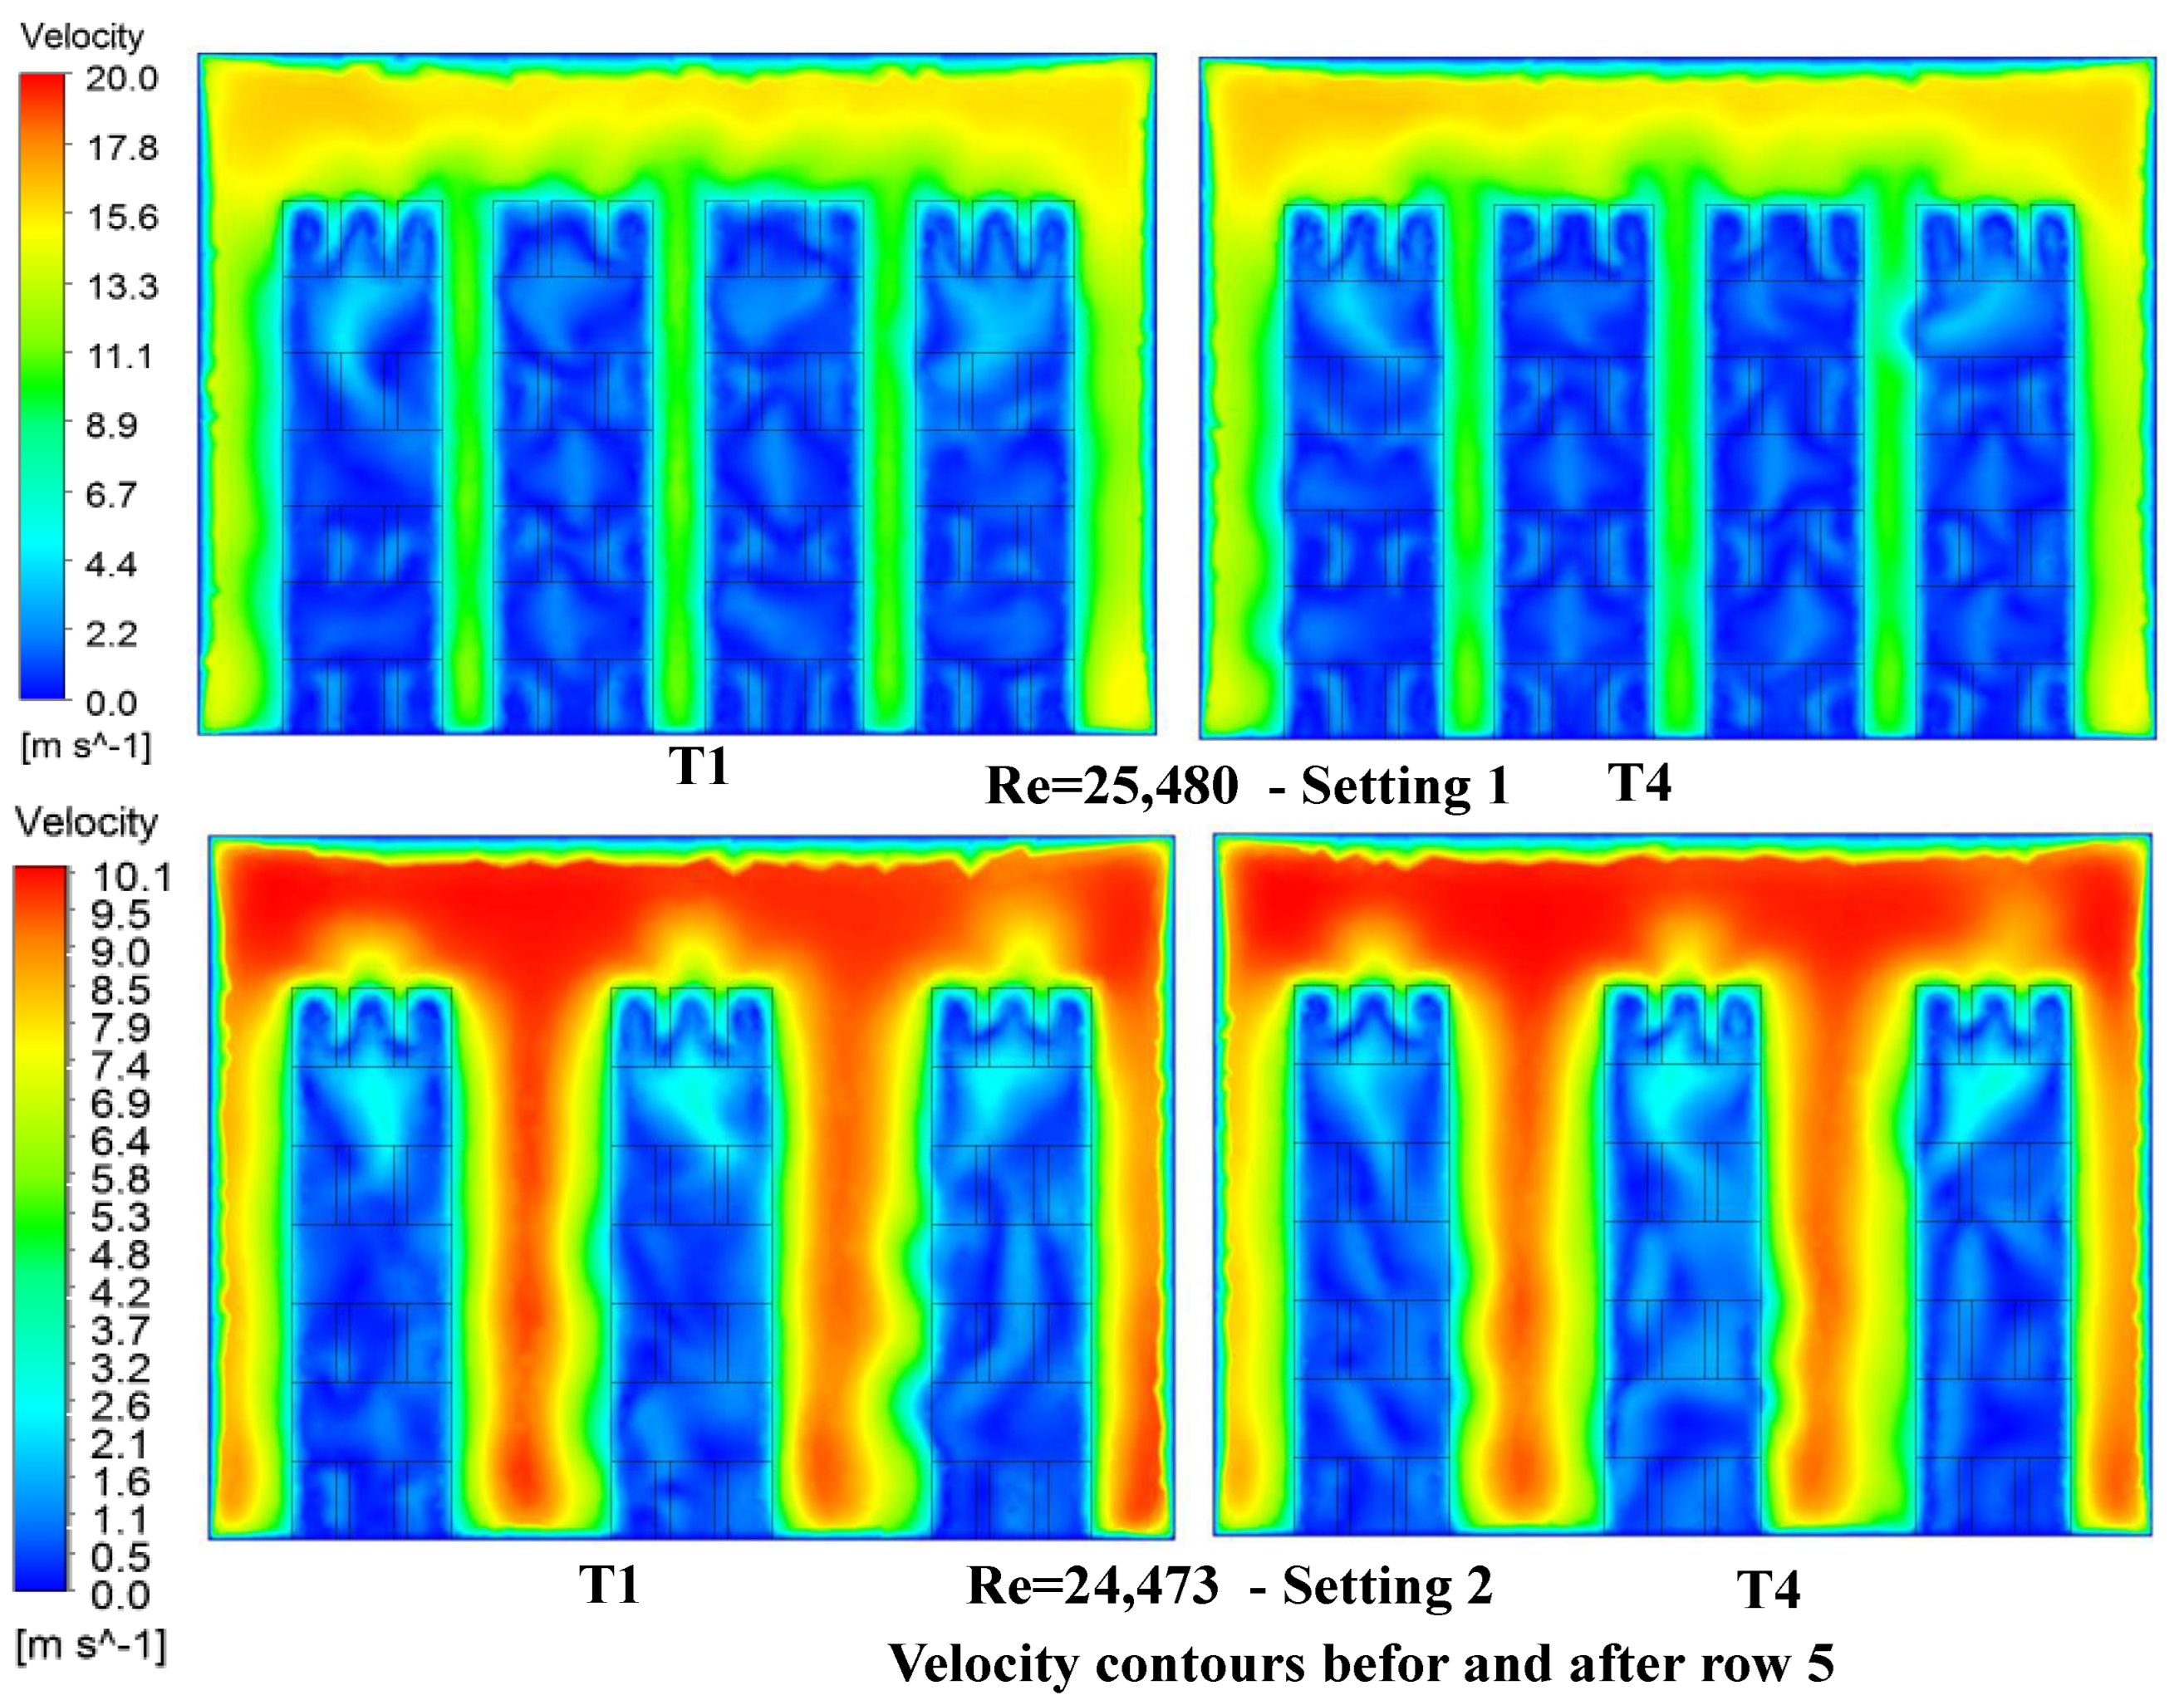
Figure 17 shows the variation of velocity contours in transversal planes before (at T1) and after (at T4) the fifth row for settings 11 and 3. A secondary flow is observed in setting 3, and the flow velocity increases in the gap between bricks compared to setting 11. The secondary flow is induced due to the flow separation through the column bricks. Configuration 11 produces the wake zone with the slowest secondary flow velocity. By directing the main flow through the bricks to the wake zone, the wake size may be decreased, and the heat transfer rate may increase.

4. Conclusions

Tunnel kilns that work more efficiently use less energy, which means they release less CO2 and other greenhouse gases, which is better for the environment. This study simulates the cooling zone of four lattice brick settings in a brick tunnel kiln using the ANSYS software. Setting 11 shows how CFD may be utilized as a tunnel kiln simulator. The validation of the current study illustrates that the present numerical results agree with the published experimental data to represent the cooling zone of brick tunnel kilns. The main points of conclusions based on the previous results and discussions are:
  • The flow patterns of velocity vectors are predicted and plotted along the transversal and longitudinal bricks in the studied lattice brick settings for the same values of Reynolds number.
  • The present BSL k-ω turbulent model predicts that vortex shedding will play an important role in heat transfer enhancement through the lattice brick settings.
  • A large recirculation zone (dead zone) is formed in setting 11, and reversed flow patterns are found upstream of the high brick density setting.
  • The recirculating flow appears to have a low velocity, so a low heat transfer rate is expected in the wake region.
  • The dense arrangements of bricks in settings 1 and 2 and the limited gap space between bricks hinder the small-scale eddies’ growth.
  • The vortices formed inside the brick columns improve the heat transfer through the brick’s side walls, which are not perpendicular to the main flow.
  • A secondary flow is observed in setting 3, and the flow velocity increases in the gap between bricks compared to other settings. The lowest secondary flow velocity is observed in the wake region in setting 11.
  • The findings give a clear vision of the fluid flow and a comparison between the four lattice brick settings, which will be beneficial to the brick tunnel kiln designers.

Author Contributions

Conceptualization, H.A.R.; Methodology, H.A.R., A.A.A.-A., H.E.A. and M.A.K.; Software, H.A.R. and M.A.A.; Validation, H.A.R.; Formal analysis, H.A.R., A.A.A.-A., H.E.A. and M.W.A.-D.; Investigation, B.A.A. and M.A.K.; Resources, E.-A.A. and M.W.A.-D.; Data curation, H.A.R. and A.A.A.-A.; Writing—original draft, H.A.R., M.A.A., A.A.A.-A., E.-A.A. and M.W.A.-D.; Writing—review and editing, H.A.R., H.F.E. and B.A.A.; Visualization, H.A.R., M.A.A. and A.A.A.-A.; Supervision, A.A.A.-A.; Project administration, H.A.R.; Funding acquisition, H.F.E. All authors have read and agreed to the published version of the manuscript.

Funding

This research received no external funding.

Institutional Review Board Statement

Exclude this statement.

Informed Consent Statement

Exclude this statement.

Data Availability Statement

Exclude this statement.

Acknowledgments

The authors extend their appreciation to the Deputyship for Research and Innovation, Ministry of Education in Saudi Arabia for funding this research work through the project number MoE-IF-UJ-22-04220258-1.

Conflicts of Interest

The authors declare that they have no known competing financial interests or personal relationships that could have appeared to influence the work reported in this paper.

Abbreviations

Nomenclature
aBrick length, mm
AbBrick surface area, m2
AwWet area, m2,   A w = A w , b + A w , d
Aw,bBrick wet area, m2
Ad,wDuct wet area, m2
bBrick width, mm
cBrick height, mm
CpSpecific heat ,   J / kg . K
DhHydraulic diameter, m, D h = 4 V f A w
fFriction factor
h   Convective heat transfer coefficient, W / m 2 · K
kFluid thermal conductivity, W / m · K
LLength of brick setting, mm
PPressure, Pa
QHeat transfer rate, W
SSpacing between columns, m
uSuperficial velocity, m/s
UInterstitial velocity,   m / s , U = u ε
ReReynolds number
VbBrick volume, m3
VdDuct volume, m3
VfVolume of flow, m3, V f = V d V b
Greek letters
εVoid fraction = Vf/Vd
ρDensity, kg / m 3
ρsBrick setting density = Vb/Vd
µ Dynamic viscosity, kg/m·s
Subscript
avg
iLocal value
Abbreviations
HHeater
LLongitudinal
LMLongitudinal middle
LWLongitudinal wall
TTransverse
TMTransversal middle
TopTop plane
TWTransversal wall

References

  1. Refaey, H.A. Mathematical Model to Analyze the Heat Transfer in Tunnel Kilns for Burning of Ceramics. Ph.D. Dissertation, Otto-von-Guericke University, Magdeburg, Germany, 2013. [Google Scholar]
  2. Tehzeeb, H.; Bhuiyan, M.; Jayasuriya, N. Evaluation of brick kiln performances using computational fluid dynamics (CFD). Energy Environ. Eng. J. 2012, 1, 86–93. [Google Scholar]
  3. Dugwell, D.R.; Oakley, D.E. A model of heat transfer in tunnel kilns used for firing refractories. Int. J. Heat Mass Transf. 1988, 31, 2381–2390. [Google Scholar] [CrossRef]
  4. Refaey, H.A.; Specht, E. Flow Field Visualization to Simulate the burning of sanitaryware in tunnel Kilns. In Proceedings of the ICFD11: Eleventh International Conference of Fluid Dynamics, Alexandria, Egypt, 19–21 December 2013. [Google Scholar]
  5. Kaya, S.; Kucukada, K.; Mancuhan, E. Model-based optimization of heat recovery in the cooling zone of a tunnel kiln. Appl. Therm. Eng. 2008, 28, 633–641. [Google Scholar] [CrossRef]
  6. Naccache, M.F.; Gomes, M.S.P.; Nieckele, A.O. Numerical simulation of flow and heat transfer through a tunnel Kiln. In Proceedings of the 18th International Congress of Mechanical Engineering, Ouro Preto, Brazil, 6–11 November 2005. [Google Scholar]
  7. Al-Hasnawi, A.G.T.; Refaey, H.A.; Redemann, H.A.T.; Attalla, M.; Specht, E. Computational Fluid Dynamics Simulation of Flow Mixing in Tunnel Kilns by Air Side Injection. J. Therm. Sci. Eng. Appl. 2018, 10, 031007. [Google Scholar] [CrossRef]
  8. Refaey, H.A.; Abdel-Aziz, A.A.; Ali, R.K.; Abdelrahman, H.E.; Salem, M.R. Augmentation of convective heat transfer in the cooling zone of brick tunnel kiln using guide vanes: An experimental study. Int. J. Therm. Sci. 2017, 122, 172–185. [Google Scholar] [CrossRef]
  9. Refaey, H.A.; Abdel-Aziz, A.A.; Salem, M.R.; Abdelrahman, H.E.; Al-Dosoky, M.W. Thermal performance augmentation in the cooling zone of brick tunnel kiln with two types of guide vanes. Int. J. Therm. Sci. 2018, 130, 264–277. [Google Scholar] [CrossRef]
  10. Refaey, H.A.; Karali, M.A.; Al-Hasnawi, A.G.; Specht, E. Mathematical model to simulate the heat transfer in vitrified clay pipes kiln. In Proceedings of the International Conference on Applied Mechanics and Mechanical Engineering, AMME-18, Cairo, Egypt, 3–5 April 2018. [Google Scholar]
  11. Almutairi, J.H.; Alrahmani, M.A.; Almesri, I.F.; Abou-Ziyan, H.Z. Effect of fluid channels on flow uniformity in complex geometry similar to lattice brick setting in tunnel kilns. Int. J. Mech. Sci. 2017, 134, 28–40. [Google Scholar] [CrossRef]
  12. Beyene, A.; Ramayya, V.; Shunki, G. CFD Simulation of Biogas Fired Clay Brick Kiln. Am. J. Eng. Appl. Sci. 2018, 11, 1045–1061. [Google Scholar] [CrossRef]
  13. Gomez, R.S.; Porto, T.R.N.; Magalhães, H.L.F.; Moreira, G.; André, A.M.M.C.N.; Melo, R.B.F.; Lima, A.G.B. Natural Gas Intermittent Kiln for the Ceramic Industry: A Transient Thermal Analysis. Energies 2019, 12, 1568. [Google Scholar] [CrossRef] [Green Version]
  14. Refaey, H.A.; Alharthi, M.A.; Salem, M.R.; Abdel-Aziz, A.A.; Abdelrahman, H.E.; Karali, M. Numerical investigations of convective heat transfer for lattice settings in brick Tunnel Kiln: CFD simulation with experimental validation. Therm. Sci. Eng. Prog. 2021, 24, 100934. [Google Scholar] [CrossRef]
  15. Ngom, M.; Thiam, A.; Balhamri, A.; Sambou, V.; Raffak, T.; Refaey, H.A. Transient study during clay bricks cooking in the traditional kiln; CFD numerical study. Case Stud. Therm. Eng. 2021, 28, 101672. [Google Scholar] [CrossRef]
  16. Refaey, H.; Almohammadi, B.A.; Abdel-Aziz, A.A.; Abdelrahman, H.; El-Ghany, H.A.; Karali, M.A.; Al-Dosoky, M. Transient thermal behavior in brick tunnel kiln with guide vanes: Experimental study. Case Stud. Therm. Eng. 2022, 33, 101959. [Google Scholar] [CrossRef]
Figure 1. Demonstrates the fifth row in the four examined settings [14].
Buildings 13 00733 g001
Figure 2. Setting 2 complete details: (a) Top view of the first layer, (b) Sectional view in the fifth row [14].
Buildings 13 00733 g002
Figure 3. Mesh used in the present study: (a) independence study (settings 2 and 3), (b) Mesh structure setting 3 [14].
Buildings 13 00733 g003
Figure 4. Model selection and validation with experimental results (setting 3), Refaey et al. [14].
Buildings 13 00733 g004
Figure 5. Longitudinal and transversal planes in two settings: (a) setting 1, (b) setting 3.
Buildings 13 00733 g005
Figure 6. Flow characteristics at the top plane (Top 3) pass through heater 3 for two settings: (i) setting 1, and (ii) setting 11.
Buildings 13 00733 g006
Figure 7. Velocity vectors in zoomed view between fifth and sixth rows for a top plane (Top 3) passing through heater 3.
Buildings 13 00733 g007aBuildings 13 00733 g007b
Figure 8. Velocity vectors in zoomed view between fifth and sixth rows for a top plane (Top 4) passing through heater 4.
Buildings 13 00733 g008
Figure 9. Flow characteristics at the top plane (Top 3) pass through heater 3, (i) setting 2, (ii) setting 3.
Buildings 13 00733 g009
Figure 10. Velocity vectors in close-up view between fifth and sixth rows of a longitudinal plane passing through heater 3, Settings 2 and 3.
Buildings 13 00733 g010aBuildings 13 00733 g010b
Figure 11. Velocity vectors in close-up view between fifth and sixth rows of a plane (Top 4) passing through transversal heater 4, Settings 2 and 3.
Buildings 13 00733 g011
Figure 12. Velocity contours in a longitudinal plane (L3) located in the channel between bricks in the first column.
Buildings 13 00733 g012
Figure 13. Velocity contours in a longitudinal channel between bricks in the first column.
Buildings 13 00733 g013
Figure 14. Velocity vectors for the plan (L2) pass through longitudinal bricks in the first column.
Buildings 13 00733 g014
Figure 15. Velocity vectors and contours in a transversal channel between bricks in the fifth row.
Buildings 13 00733 g015
Figure 16. Velocity contours in a transversal channel between bricks in the fifth row.
Buildings 13 00733 g016
Figure 17. Velocity contours in transversal planes before and after the fifth row.
Buildings 13 00733 g017
Table 1. Features of the current settings [14].
SettingNo. of BricksεDh (mm)Aw,b (m2)Aw,b/Aw,b1 (%)ρs = Vb/VdS (mm)S/aS/b
15040.699543.172.2936100.00.300519.30.33331.2083
23780.774659.541.720275.00.225458.01.00003.6250
32520.849781.311.257454.80.150358.01.00003.6250
113360.799659.31.796478.30.200419.30.33331.2083
The brick dimensions are a = 58 mm, b = 16 mm and c = 28 mm. ρs is the brick setting density.
Table 2. The inlet mass flow rate in the present four settings (kg/s).
Mass Flow RateCase 1Case 2Case 3Case 4Case 5Case 6
Setting
10.3650.4350.5040.5560.5920.646
20.2770.3390.3920.4280.4580.499
30.2630.3070.3530.3860.4140.452
110.3100.3690.4280.4710.5020.548
Disclaimer/Publisher’s Note: The statements, opinions and data contained in all publications are solely those of the individual author(s) and contributor(s) and not of MDPI and/or the editor(s). MDPI and/or the editor(s) disclaim responsibility for any injury to people or property resulting from any ideas, methods, instructions or products referred to in the content.