1. Introduction
Since 2020, a highly contagious virus (SARS-CoV-2) has ravaged the world, with six hundred and eighty million reported cases and six million eight hundred thousand deaths to date (7 March 2023) [
1], leading to a crippling pandemic on both economic and social levels. At the beginning of the pandemic, airborne transmission was ruled out because of the low reproduction number of the virus (R). Thus, it was assumed that the main transmission routes were either close contact or fomite transmission, resulting in a list of measures that included keeping a 1.5 to 2 m distance and washing hands regularly. However, this assumption was quickly contested by numerous organizations and experts. On 28 April 2020 during the Build-Up webinar, the Federation of European Heating, Ventilation, and Air-Conditioning Associations (REHVA) stated that “the safety distance of 2 m between people, regarding the risk of COVID-19 infection, is a myth” [
2]. Later, on 6 July 2020, two hundred and thirty-nine scientists and researchers signed an open letter urging officials and the medical community to admit that airborne transmission of the virus was the dominant transmission route and that keeping a distance was not enough to stop the spread of the virus [
3]. The letter was soon followed by a publication by thirty-six scientists [
4] in which appropriate ventilation as an additional measure to limit the spread of the virus was advocated, highlighting current buildings’ poor indoor air quality (IAQ).
However, this was not the first time that respiratory diseases indicated problems with IAQ, particularly in relation to ventilation in indoor environments. In the last twenty years, the Severe Acute Respiratory Syndrome (SARS-CoV-1) epidemic in 2003, H1N1 influenza epidemic in 2011, and Middle East Respiratory Syndrome (MERS) outbreak in 2012 were red flags that highlighted the problems with a lack of indoor ventilation [
5]. Thus, several literature studies prior to the COVID-19 pandemic presented overviews of existing research that assessed airborne transmission in relation to indoor ventilation. Some studies reviewed the application of experimental measurement techniques to visualize and analyze aerosol dispersion and airflow patterns [
6,
7,
8], whereas other studies reviewed the use of Computational Fluid Dynamics (CFD) and its limitations to assess airborne transmission [
9]. More recent reviews aimed to clarify terminology [
10] or present a more up-to-date overview of ventilation systems [
11], CFD studies [
12], and risk assessment models [
13].
Additionally, several researchers emphasized that current guidelines and regulations for IAQ were insufficient to fulfill the needs of occupants [
14,
15]. These guidelines typically provide the maximum values of certain pollutants that should not be exceeded indoors and/or the minimum required levels of ventilation. However, they do not present specific ventilation standards or design recommendations to curb the spread of airborne diseases [
14]. The issue is not only limited to the lack of proper ventilation standards but also extends to the indicators used to assess ventilation with regard to health and comfort in indoor spaces. These indicators can be divided into three categories: dose-, occupant-, and building-related indicators [
16]. For airborne transmission studies, dose-related indicators, such as CO
2 concentrations, temperature, and relative humidity, are mainly used, although their usability was questioned in the context of the SARS-CoV-2 virus.
Moreover, most studies that use these indicators focus on the general room level, which makes an important assumption that pollutants dilute in a space. However, this is not consistent with the physics underlying airborne transmission. When a virus-laden particle is emitted, three propelling forces act upon it: gravity, inertia, and aerodynamic force [
17]. If gravity is dominant, meaning that the weight of the particle is greater than all the other forces, the particle falls to the floor and is no longer inhaled. However, when inertia and aerodynamic forces take over, the particle (in this case, an aerosol) is suspended in the air and can travel further distances, potentially reaching other individuals in the room. Studying the ventilation of the entire room might not be the most suitable solution for limiting the dispersion of these aerosols in indoor spaces [
14].
Another issue is that studies often focus on a single indicator, even though different indicators may be correlated with each other [
18,
19]. Researchers were calling for a more integrated analysis of indoor environments even before the outbreak of the coronavirus. Thus, the aim of this literature review is to present the indicators and approaches used to assess IAQ in the case of airborne transmission through pathogen-laden aerosols across multiple disciplines. In addition, this study attempts to answer the following research questions:
2. Materials and Methods
Scopus, Google Scholar, ScienceDirect, Wiley, SpringerLink, PubMed, and the TU Delft library books were used to conduct research for this study. After an initial screening of the literature relating to airborne transmission and IAQ, keywords from papers were aggregated into six concepts. These concepts were then used as the search keywords: airborne diseases, ventilation, air quality, schools or offices, indicators, and assessment approaches.
Table 1 shows the list of keywords used to search the databases. For the search combinations, multiple keywords within a concept were connected using the word OR and the concepts were connected using the word AND.
The initial search covered articles published in the last ten years and studies relevant to indoor air quality and airborne diseases were selected based on their titles. Papers that mainly focused on energy consumption and ventilation were excluded. Moreover, the search focused specifically on ventilation strategies that used airflow to extract pathogen-laden aerosols from the room or proxies that studied those aerosols and did not include other equally important strategies that purified the air from pathogens such as UVC and ionizers. From the filtered sources, papers were chosen based on the content of their abstracts. If a reference citation in a paper was found to be interesting, it was also included in this review. This ultimately led to the inclusion of studies that went beyond the past ten years and that covered a wider range of room settings and functions beyond educational buildings or offices. Books available at the TU Delft library that were related to this topic were also included in this review.
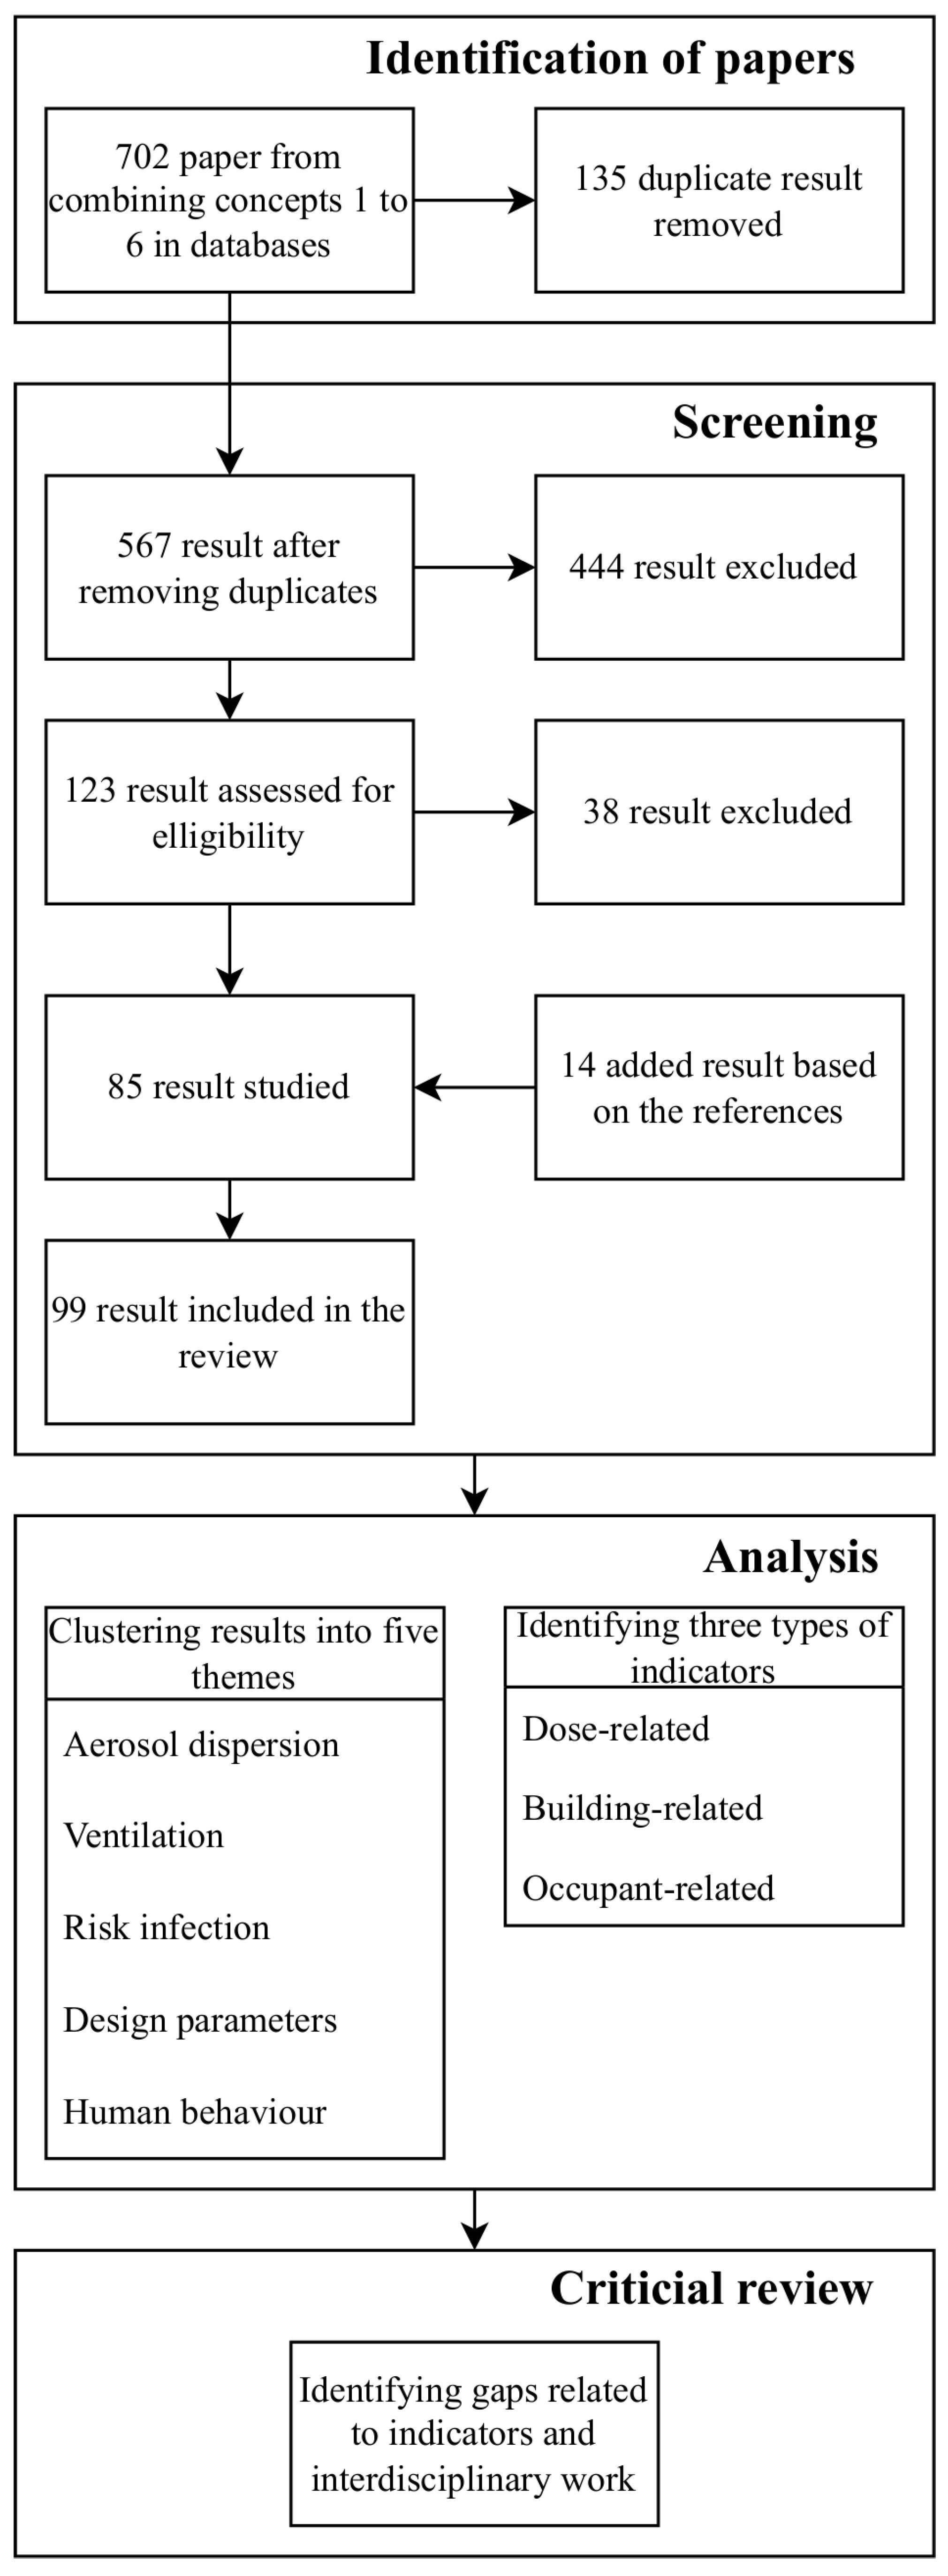
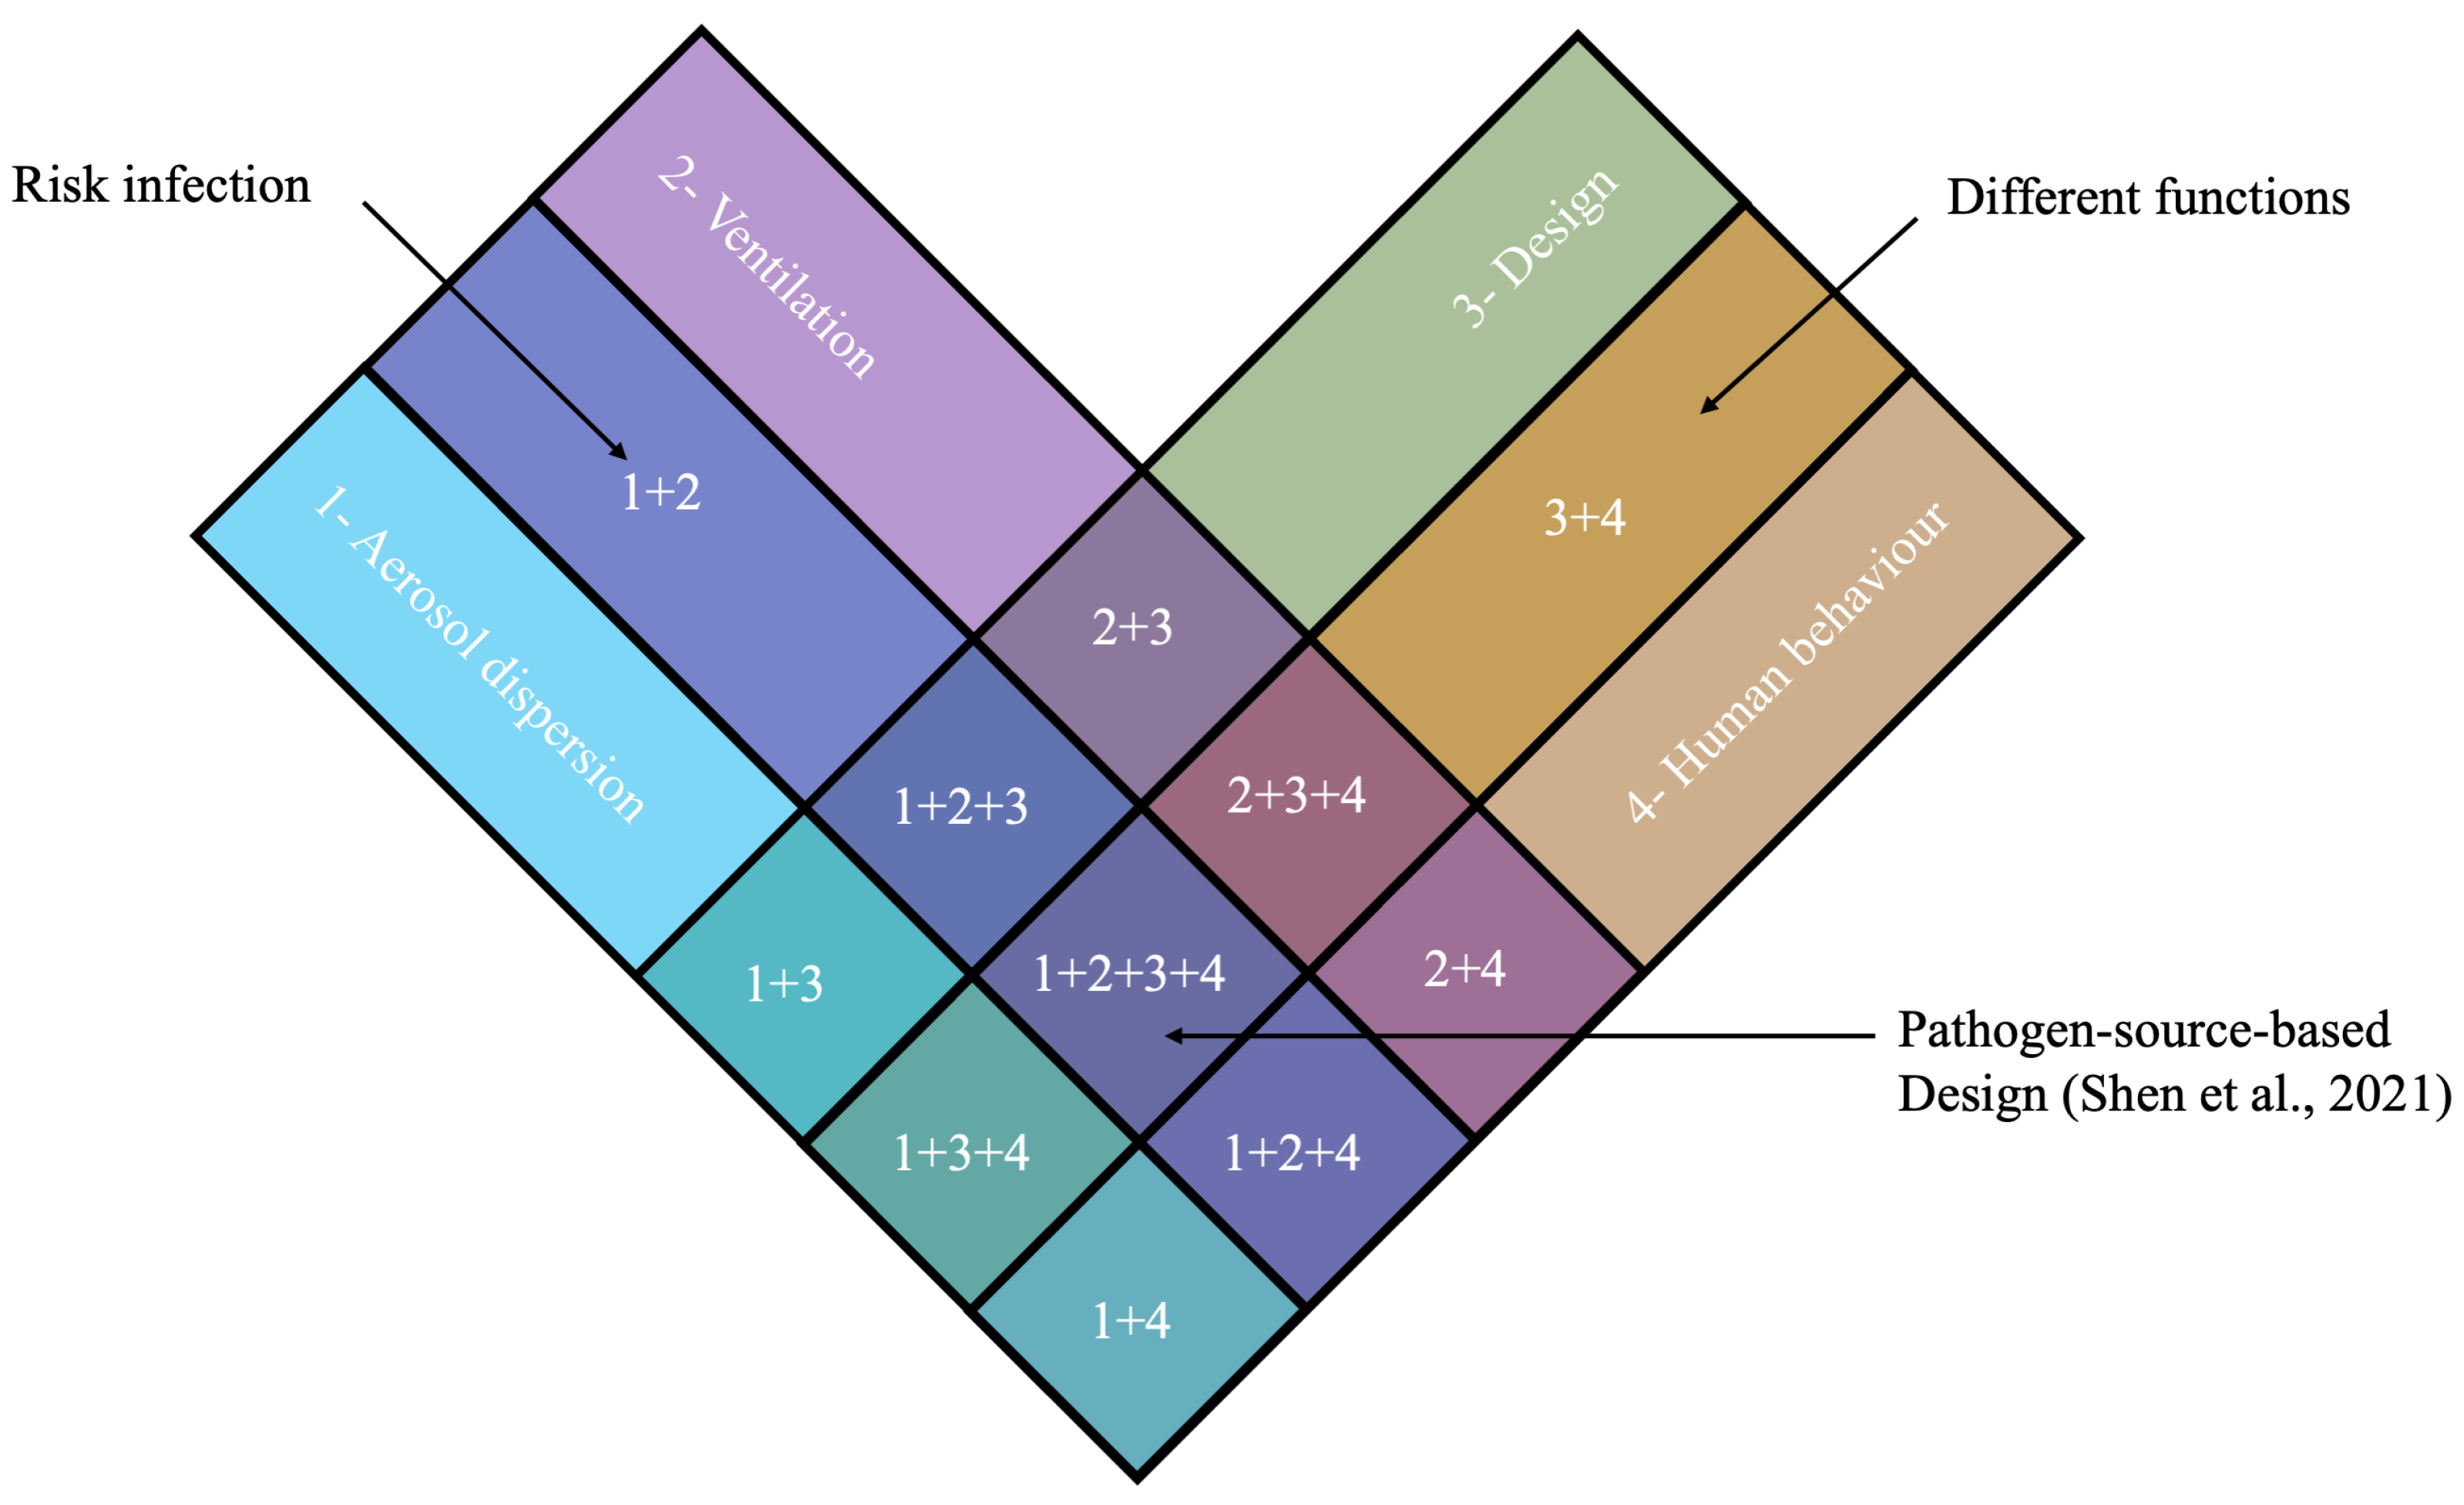
While sorting through the references, different indicators and assessment methods were found. The indicators could be divided into dose-, occupant-, and building-related indicators. The assessment methods could be divided into measurements and numerical simulations. However, five main concepts could be identified relating to ventilation efficiency with regard to airborne diseases: airborne transmission, ventilation, risk of infection, design parameters, and human behavior. These concepts highlight the importance of combining the dose-, occupant-, and building-related indicators. Therefore, the references were first divided into these five concepts and then further divided into sub-concepts. Some additional references were found to support, extend, or complement certain claims within a reference found in the preliminary literature search.
Figure 1 provides an overview of the process used in this review.
3. Results—Assessment of IAQ
3.1. General Overview of IAQ Assessment Methods
There are two main approaches used to assess IAQ and ventilation with regard to airborne transmission: measurements and numerical modeling. Measurements can be performed either in the field (real environment) or a laboratory (controlled environment). Field measurements provide values for dose-related indicators and account for real-world uncertainties resulting from human behavior and environmental conditions. Field measurements rely on different measuring devices depending on the purpose of the field study. In contrast, the advantage of laboratory measurements is that they allow the environmental conditions to be controlled, resulting in a deeper understanding of certain parameters without exposing the test subjects to any contaminants or pathogens [
20].
With the increase in computational power, numerical modeling of aerosol dispersion and ventilation strategies is more commonly used to study infection risk in indoor environments. Based on the findings of this review, two approaches are typically adopted depending on the scale being studied: (1) zonal network methods are used for floor-scale modeling, where a floor is a network of rooms and each room is a node, where equations such as pressure and contaminant equations are solved; and (2) CFD methods allow for more detailed modeling of the airflow in rooms with different ventilation systems or modeling of aerosol dispersion in a space from the source to the receptor [
21,
22,
23]. In the literature reviewed, different turbulence models were used for CFD simulations, including Large Eddy Simulations (LES), Detached Eddy Simulations (DES) (more specifically the Spalart–Allmaras model [
24]), or Reynolds-averaged Navier–Stokes (RANS) models with either a k-
[
25] or a k-
model [
26]. The k-
model integrates two partial differential transport equations, as well as the Navier–Stokes equations, for the description of turbulence, one for kinetic energy (k) and the other for the rate of dissipation of turbulence (
) [
27]. The k-
turbulence model adopts a modified turbulent kinetic energy equation from the standard k-
model and introduces a new equation for
. The k-
model incorporates modifications for low Reynolds number effects. It is applicable to flows limited by walls. The k-
SST model is used for the robustness of a k-
model near the wall and the ability to transition to a k-
model in the far field [
28].
Table 2 provides more details about the CFD simulations that were found in the literature.
In the literature selected in this review, these approaches are often combined to create more holistic studies. More advanced approaches use Artificial Intelligence (AI) and combine both field measurements and numerical approaches. AI methods rely on monitoring and/or simulations, as well as the analysis of these data to predict aerosol dispersion, ventilation performance, or human behavior. Therefore, this section is organized thematically based on the topics discussed in the literature and how they were combined:
Aerosol dispersion;
Ventilation;
Infection risk;
Design parameters;
Human behavior.
Each sub-section is organized according to the type of studies performed (field measurements, laboratory experiments, or numerical simulations).
Table 3 presents an overview of the themes covered in each of the publications and the methods used (experiments, simulations, or both). It should be noted that if a study was only “numerical”, it does not mean that it was not validated. It means that the study only addressed the simulation or that it validated the simulation based on another study or simulation. Additionally, if a study utilized both numerical and experimental approaches, it does not mean that the results were validated. The researchers in the study may have used the experimental part to determine the initial boundary conditions of the simulation.
3.2. Aerosol Dispersion
Aerosol dispersion is governed by aerodynamic forces due to the small size of aerosols. This means that aerosol particles are transported by the airflow within a room and are affected by the exhalation and movements of people. However, the aerodynamic physics that govern aerosol dispersion vary depending on the distance from the source of the aerosols being studied [
46]. Aliabadi et al. [
46] identified two types of aerosol dispersion:
near-field dispersions, which impact a few meters from the source of the aerosol.
far-field dispersions, which impact the entire ventilated space of a room.
A near-field aerosol dispersion depends on the type of aerosol-generating task such as coughing, sneezing, speaking, or breathing. This section concerns the different approaches that study near-field aerosol dispersion, whereas far-field aerosol dispersion is discussed in a later section.
For measurement studies that aimed to understand aerosol dispersion, Particle-Tracking Velocimetry (PTV) [
56,
61], Particle Image Velocimetry (PIV) [
31,
54,
57], Schlieren images [
64,
90], tracers, and air velocity sensors were commonly used. Sneezing and coughing were extensively studied at the beginning of the COVID-19 pandemic. Asymptomatic aerosol-generating tasks were also the focal point of several studies after the realization of the important role played by asymptomatic and pre-symptomatic people in infecting other people [
59]. The focuses of these studies included comparing aerosol dispersion with different types of masks and without masks [
53,
58,
60,
63,
64]; assessing the difference in the dispersion of different words, vowels, and consonants during speaking [
59]; and studying the flow physics underlying the dispersion of exhaled aerosols [
55,
62].
Numerical approaches used to study aerosol dispersion involved either CFD modeling or probabilistic models and machine learning. Since aerosol dispersion includes both the air and the virus-laden droplets, it is a two-phase flow problem in CFD simulations. There were two approaches used for CFD simulations of aerosol dispersion: Eulerian–Eulerian (Eulerian approach where particles were modeled as a continuum in space) and Eulerian–Lagrangian (Lagrangian approach where particles were modeled as discrete entities in space). The Eulerian approach provided the concentration of particles in a volume, whereas the Lagrangian approach modeled or calculated the trajectory and collision of the particles [
48].
Some studies used CFD to model near-field aerosol behavior [
37,
52] to assess cross-infection between a source (infected person) and a receptor (healthy person) [
22] and model the generation of aerosols from the alveoli into the air [
39]. These studies typically used k-
SST as a turbulence model in their simulations because it accurately simulates the transition from laminar to turbulent in the respiratory tract. CFD was also used to test theories about the evaporation and behavior of aerosols in the air. Dbouk and Drikakis [
38] developed a new theory for the evaporation of the coronavirus particles that included the transient Nusselt and Sherwood numbers in the Reynolds, Prandtl, and Schmidt numbers. The results of their simulations were consistent with the study by Yang and Marr [
106], which hypothesized that the virus was not deactivated at high RH. Therefore, temperature and relative humidity, as well as the various uncertainties that accompany these two environmental conditions, should be included in the assessment of airborne transmission.
Mathematical models were also used to model aerosol dispersion. To determine how far droplets can travel in a space, Xie et al. [
67] added more complexities to the Wells evaporation–falling curve by accounting for RH, air speed, and respiratory jets. Regarding the use of probabilistic models, different Lagrangian stochastic models were used for particle tracking in turbulent flows: the Discontinuous Random Walk (DRW) model, Continuous Random Walk (CRW) model, and Stochastic Differential Equation (SDE) method. The DRW model was mostly used because it is the least computationally expensive. Wei and Li [
66] used the DRW model to model the cough jet and distance of the dispersion of various sizes of particles in a space. In the study, the dispersion of aerosols beyond the 2 m safe distance proved the long-range transmission of 10 μm particles in the air. Other studies developed their own mathematical models based on existing equations and models [
47,
65]. Chen et al. [
65] combined the simple dynamics of expired jets with available probabilistic models of inhalation and deposition to study cross-infection between two people facing each other while having a conversation.
3.3. Ventilation
Studying ventilation involves either assessing the concentrations of specific pollutants in a space or more generally assessing the ventilation rate, mean age of the air, and airflow patterns and distributions in a space. These parameters mainly depend on the type of ventilation (natural or mechanical) and the position and configuration of air inlets and outlets [
11]. Some researchers focused on the ventilation of the entire room, whereas others focused on the ventilation near the source of infection. PIV was the most commonly used measurement technique to assess the airflow in a room. Several researchers presented reviews on how to use PIV to measure the airflow and air motion to experimentally assess indoor spaces in laboratories and test chambers [
6,
7,
8].
At the numerical level, CFD simulations were the most commonly used numerical approach to assess ventilation. For natural ventilation, running CFD is not so straightforward because two levels of airflow are present in the computational domain, the urban wind flow and the indoor airflow. Decoupled simulation strategies were typically adopted to study indoor natural ventilation. This means that the urban wind flow was modeled first and then the relevant values near the openings of the studied building were used to later model the indoor ventilation [
45]. However, due to the increase in computational power in the past decade, several studies used coupled simulations, where outdoor and indoor air were modeled together [
41,
95]. Using coupled simulations, van Hooff and Blocken [
45] studied the CO
2 concentration decay over time inside a semi-enclosed stadium after a concert. For mechanical ventilation, some studies used CFD to assess the airflow patterns in a space [
43] to test optimization strategies for the ventilation system using machine learning [
70] and for sensitivity analysis to either determine the most influential parameters of the mechanical ventilation system or determine the most convenient locations for a limited number of sensors for full-scale measurements [
50].
CFD also allows for the testing of more advanced ventilation systems. Lipinski et al. [
11] presented an overview of the three main types of ventilation (recirculating ventilation, mixing ventilation, and displacement ventilation). They ran CFD simulations of two types of displacement ventilation: roof-mounted natural ventilation with an indoor diffuser and façade-mounted buoyancy-driven intelligent ventilation. The results showed that the latter decreased the CO
2 concentration more efficiently than the former despite having a lower air-change rate. CFD simulations were typically validated with full-scale measurements. The performance of the turbulence models depended on the flow that was used, even though several researchers showed that Re-Normalization Group (RNG) k-
was the most stable turbulence model for indoor air simulations [
49,
69].
Several researchers used machine learning to predict and optimize ventilation performance in indoor spaces. Mumtaz et al. [
68] measured eight air pollutants, along with the temperature and relative humidity, and applied a neural network model to predict indoor pollutants inside a laboratory. The model achieved a prediction accuracy of 99.1% compared to newly measured data, providing high confidence in the model’s performance. As an alternative to physical measurements, Li et al. [
32] used CFD simulations to train a Back-Propagation Neural Network (BPNN), achieving a prediction accuracy of 98.5% compared to newly run cases using CFD, and then a Particle Swarm Optimizer (PSO) to optimize the IAQ. These machine learning algorithms showed high accuracy for new models and can potentially help architects and engineers improve the performance of their design solutions.
Aerosol Dispersion and Ventilation
Some studies also combined aerosol dispersion with ventilation to extract contaminants from a room. Zhang et al. [
79] conducted on-site measurements to investigate the numbers and locations of CO
2 sensors needed to monitor a classroom. The researchers showed that with natural ventilation, the wall opposite the windows and the wall near the teacher had the highest CO
2 levels and, therefore, recommended that at least these two locations should be monitored. With mechanical ventilation and the resulting mixing of CO
2, it was recommended that at least one location (the wall opposite the windows) be measured, depending on the classroom’s layout. In their study, the CO
2 levels near the wall opposite the windows were the highest regardless of the ventilation system.
Laboratory measurements were also used to test aerosol dispersion and ventilation. These measurements either produced qualitative results, such as a visualization of the dispersion of aerosols, or quantitative results, such as the number of particles. Zhang and Bluyssen [
78] assessed the impact of ventilation on the concentration of particles and CO
2. Bluyssen et al. [
80] tested the efficiency of HEPA filters under different ventilation systems by using soap bubbles and a camera to visualize the dispersion of bubbles (simulating aerosols) in a Senselab [
107]. Nielsen et al. [
84] investigated the interaction between the macro-environment and the micro-environment under different ventilation systems. They concluded that a fully mixed macro-environment increased exposure for occupants within the micro-environment compared to an unmixed macro-environment such as vertical ventilation or displacement ventilation. Bolashikov et al. [
81] tested wearable personal exhaust ventilation in the case of an infected doctor using manikins and tracer gas, whereas Melikov et al. [
85] tested personalized ventilation installed on an office desk with a personal computer. Nielsen [
83] assessed personalized ventilation for individuals in a hospital ward, whereas Cao et al. [
86] used experiments to propose a protected zone form of ventilation in offices that through a downward jet plane, creates individual sub-zones for occupants, significantly reducing the risk of infection (40% theoretically).
Some CFD studies focused on particle concentration and ventilation [
30,
42], which is particularly relevant to hospitals because contamination standards are already established, unlike other types of buildings, where particle concentration standards at the breathing level may not exist. Romano et al. [
44] simulated an operation theater to test the impact of differential airflow diffusion on particle concentration above the operating table in the case of both external and internal contamination (opened/closed doors/slits). Other researchers studied near- and far-field aerosol behavior under a specific ventilation system [
35], cross-infection depending on the breathing mode (mouth/nose), and the distance between the source and the receptor [
23,
82]. In the paper by Villafruela et al. [
23], the breathing boundary conditions of the mouth and nostrils were sinusoidal equations that mimicked the inhalation and exhalation patterns. In addition to the distance, Nielsen et al. [
82] studied the impact of the relative positions of two individuals on their exposure to particles. They studied four positions: face to face, face to the side of the target individual, face to the back of the target, and seated. Both papers showed that in the micro-environment of an individual, the closer the target is to the source, the higher the exposure. Additionally, both papers used the tracer gas N2O for the simulation of displacement ventilation.
Most of these studies drew similar conclusions regarding the importance of including more design parameters, such as rooms with different sizes and shapes [
80], or human behavior, such as movable bodies [
44], continuous breathing [
35], or the level of activity [
82], to better understand and evaluate IAQ and the impact of ventilation in a given space.
3.4. Infection Risk
The assessment of the infection risk quantifies the infection probability of a certain disease and is used to test the outcomes of preventive control strategies [
17].
3.4.1. Infection Risk and Ventilation
Since ventilation is an important control strategy for airborne transmission, it cannot be considered separately from the assessment of the infection risk. Two models are typically used to quantify and assess the infection risk of airborne pathogens under different assumptions: the Wells–Riley model and the dose–response model [
75].
The most widely used infection risk assessment model is the Wells–Riley model. The model calculates the probability of infection based on the number of aerosols required for infection, pulmonary ventilation rate, room ventilation rate, and exposure time [
77]. This model was extensively used at the beginning of the COVID-19 pandemic to demonstrate the correlation between poor ventilation and COVID-19 infection [
71,
72,
73]. Once CO
2 levels began to be considered a proxy for virus emission, some researchers adapted the Wells–Riley equation to include CO
2 measurements in the equation [
74,
76]. The Wells–Riley equation was also adapted and extended by different studies to either include more control strategies such as masks [
92], simplify calculations [
10], or predict the infection risk using machine learning [
87]. However, the Wells–Riley model suffers from the assumption that the air in a confined space is in a steady state and is fully mixed, which is typically not the case [
91].
In contrast, other studies used the dose–response model because it can account for transmission routes aside from airborne [
75]. The dose–response approach provides deterministic (empirical) models, which follow the cumulative curve of the dose–response relationship, and stochastic (semi-empirical) models, which take into account the random distribution of pathogens in a space due to air turbulence and any exposure to the pathogen can lead to infection regardless of the dose. Stochastic models are more biologically plausible than deterministic models. In general, the dose–response model produces more realistic estimates than the Wells–Riley model; however, the equation requires biological data about the virus that were not known at the beginning of the coronavirus pandemic [
75].
The advantage of using infection risk models is that they can quickly quantify the infection risk and provide a general idea about the transmission risk in a space. However, these models oversimplify the problems using one equation for the entire 3D space, which is not the case in reality.
3.4.2. Aerosol Dispersion, Ventilation, and Infection Risk
Wu et al. [
89] conducted on-site measurements using tracer gas to test the zonal risk of infection between different apartments. They used the Wells–Riley model to evaluate the risk of infection in different apartments due to air filtration. A cross-apartment infection route was verified and it was deduced that the horizontal transmission of the virus should not be ignored even if the room of origin of the virus is naturally ventilated. Liu et al. [
88] tested a personalized ventilation system using breathing manikins and Collison nebulizers to replicate aerosol generation. The intake fraction of the inhaling manikin was measured with an aerodynamic particle sizer that measures the number and size of particles. The objective of the study was to study the efficiency of a personalized ventilation (PV) system when the occupants of a space change how they face each other. The side-by-side position of individuals was determined to be the most critical position for the PV system.
Zivelonghi and Lai [
92] studied the aerosol dispersion, ventilation, and infection risk mathematically to provide recommendations to schools returning to physical education classes for the 2021–2022 school year. They used mathematical equations for the average Emission Rate (ER) to model aerosol emissions. For the infection risk, they used the Gammaitoni–Nucci model, a Wells–Riley-based model that can account for the time evolution of the viral charge using the thermal gradient airflow. The viral load equation considered the exposure time, saturation, decay rates, and opening/closing of windows. The study also tested different occupancy levels in classrooms and whether the teacher or any of the students were infected. This study not only accounted for the number of pathogens in the air but also added human behavior to the assessment of the infection rate. In addition, they highlighted the importance of cumulative airborne risk and the importance of time in understanding infection in indoor spaces. They also highlighted the two critical factors that can affect the infection risk: the ventilation and volume of the room.
Foster and Kinzel [
34] differentiated between mathematical models (risk infection models) and numerical models (CFD simulations) to estimate the infection risk in a classroom setting and compared the percentage of error between the two models in two different ventilation settings: no ventilation and mechanical ventilation with heating. To enable a meaningful comparison, they used the Gammaitoni and Nucci form of the Wells–Riley model because it considers the Reynolds transport theorem and provides an infection risk estimate closest to a CFD simulation. For the CFD simulation, the infection risk probability was calculated based on the volume of the breathing zone of individuals in a room and the concentration of particles in that breathing zone. With no ventilation, the Wells–Riley model had a relative under-prediction error of 6% compared to the CFD simulations. However, with ventilation, the under-prediction error increased to 29%, highlighting the added value of modeling the entire space, including its turbulence complexities, to identify the areas in a room with a higher risk of infection. Dai et al. [
29] used CFD to model the impact of natural ventilation on the dispersion of pollutants inside a building. They tested three wind directions and used the Wells–Riley model to assess the infection risk originating from a source room to the rest of the building. When the source room was facing the dominant wind direction, the risk of infection in other rooms that faced the same direction was found to be the highest. They also validated the results by conducting wind tunnel experiments using a scaled model of the studied area.
3.5. Design Parameters of a Room
Studies that consider design parameters typically investigate the impact of the room size and volume on the infection risk, as well as the size, position, and number of openings such as doors, windows, and ventilation system’s inlets and outlets.
3.5.1. Ventilation and Design Parameters
Using field measurements, Park et al. [
93] tested the ventilation rate of natural ventilation in a classroom, considering different window-opening configurations and types of ventilation (cross-ventilation or single-sided ventilation). Using CO
2 as a tracer gas, the ventilation rate was determined using the tracer gas decay method. Afterward, the ventilation rate was used in the Wells–Riley equation to determine the infection risk probability of each window-opening configuration. It was concluded that cross-ventilation was better at reducing the infection risk and that a window-opening ratio of 15% was enough to maintain the infection risk lower than 1% for a stay of less than 3 h.
Regional climates were also used in several CFD studies to choose the best type of ventilation system. Ascione et al. [
21] studied the differences between air distribution systems using diffusers and grilles in a school classroom in Campobasso in southern Italy (cold climate). They computed the temperature, airflow velocity, and mean age of the air. They determined the optimal air distribution system (linear slot diffusers) but emphasized that it was not a universal solution and that it would only apply to similar types of classrooms in similar climates. This means that optimized ventilation solutions are case-dependent and architects and engineers should be cautious when deciding on a particular ventilation system.
On a larger scale, Kembel et al. [
94] addressed the biogeography of a set of rooms and how they are connected by assessing their degree of centrality (the organization of the space) through betweenness (the number of shortest paths that go through a space) and connectance (number of intermediate spaces that connect two spaces). They determined the impact of the organizational design of a space on the traffic of occupants through the central node and, consequently, how this impacts the microbiology of a space. The greater the number of people that share a space, the higher the risk of exposure to pathogens. This emphasizes the importance of different design layouts in the formation of microbial communities in a space. It also highlights the need to understand both microbiology and indoor design to ensure better IAQ.
3.5.2. Infection Risk and Design Parameters
Peng et al. [
97] developed an open-source tool/spreadsheet that implements an infection box model using the Wells–Riley model, ventilation rate, and room volume. They referred to the two latter indicators as building parameters. They also accounted for different uses of spaces (classroom, subway, supermarket, stadium). To account for these different uses, they developed emission rate factors based on the relative quanta for the different physical intensities and vocalization types (oral breathing, speaking, and loudly speaking) of an activity. The volumetric breathing rates were chosen per age group and activity intensity (from sleeping to high-intensity activity). In the end, they fitted the model over data from real outbreaks documented in the literature in addition to data from the coronavirus pandemic. Based on their findings, they concluded that the transmission rate of SARS-CoV-2 was higher than tuberculosis but lower than measles.
Kapoor et al. [
96] used an artificial neural network to predict the infection risk probability in an office space using the area of openings as one of the inputs. They measured the temperature, relative humidity, and CO
2 concentration in an office and used the data to build their neural network. They used eleven input parameters: indoor temperature, indoor relative humidity, area of the opening, number of occupants, area per person, volume per person, CO
2 concentration, air quality index, outdoor wind speed, outdoor temperature, and outdoor relative humidity. The model achieved a prediction accuracy of 99.92% compared to multiple other prediction methods, making it more efficient for predicting infection risk in offices.
3.5.3. Aerosol Dispersion, Infection Risk, and Design Parameters
For assessing aerosol dispersion and the risk of infection in a given 3D space, Faleiros et al. [
31] developed an application based on unsteady CFD simulations and the dose–response model. The computational domain was a confined room with ventilation, which can only be accounted for in a dose–response model. The application required several inputs:
The geometry of the space: the room dimensions, size, and position of the doors and windows;
The room conditions: the temperature and relative humidity;
Occupant-related parameters: the number and location of the people and their orientation, gender, height, weight, and clothing type;
The types of aerosol-generating tasks: breathing, speaking, coughing, sneezing;
Particle size;
Type of mask.
Based on the inputs, the geometry of the room, including the location of the occupants, was created and used to run the simulation. The idea of the app was to provide an accessible tool for non-CFD users to model the infection risk in a space based on certain inputs. Including ventilation modeling in CFD, however, would provide more detailed information about the infection risk in a space.
3.5.4. Aerosol Dispersion, Ventilation, and Design Parameters
Researchers also investigated the optimization of design layouts for increased ventilation efficiency rather than just assessing certain cases. Jiao et al. [
40] investigated and optimized seven different inlet–outlet layouts to control airborne toxic and explosive material in confined industrial workshops using carbon monoxide as a contaminant. The concentration of carbon monoxide was treated as a passive scalar in the simulation and was used to identify the concentrations of pollutants in the air. De Simone et al. [
33] used CFD to study how people and furniture impact aerosol dispersion in a restaurant. They developed a tool for architects to assess their designs while accounting for pathogen exposure. Aerosol dispersion was modeled as a passive scalar. They demonstrated that their tool can be used in the design phase to predict how changes in a space can affect the infection risk.
Afshari et al. [
98] used a zonal network to assess cross-infection between rooms according to the standard ventilation systems used in offices in Sweden, Denmark, and Norway. They showed how a ventilation system can create a difference in pressure between rooms and corridors, which can result in the spread of infection beyond the room where the infected person is located. The typical Swedish ventilation system involves the transfer of air from offices to corridors. This can lead to the spread of contamination to corridors but not to other rooms. The typical Danish ventilation system is balanced and the same amount of supplied air is exhausted from the entire building. However, this means that at room level, the amount of supplied and exhausted air might not be equal, leading to cross-contamination between rooms. The typical Norwegian ventilation system uses a balanced-room ventilation approach, which means that the same amount of supplied air is exhausted from each room. This type of ventilation system is the most effective in limiting cross-infection between rooms and corridors. If ventilation systems are designed to prevent room-to-room infection, it is easier to conduct studies at a room scale rather than at a larger floor scale.
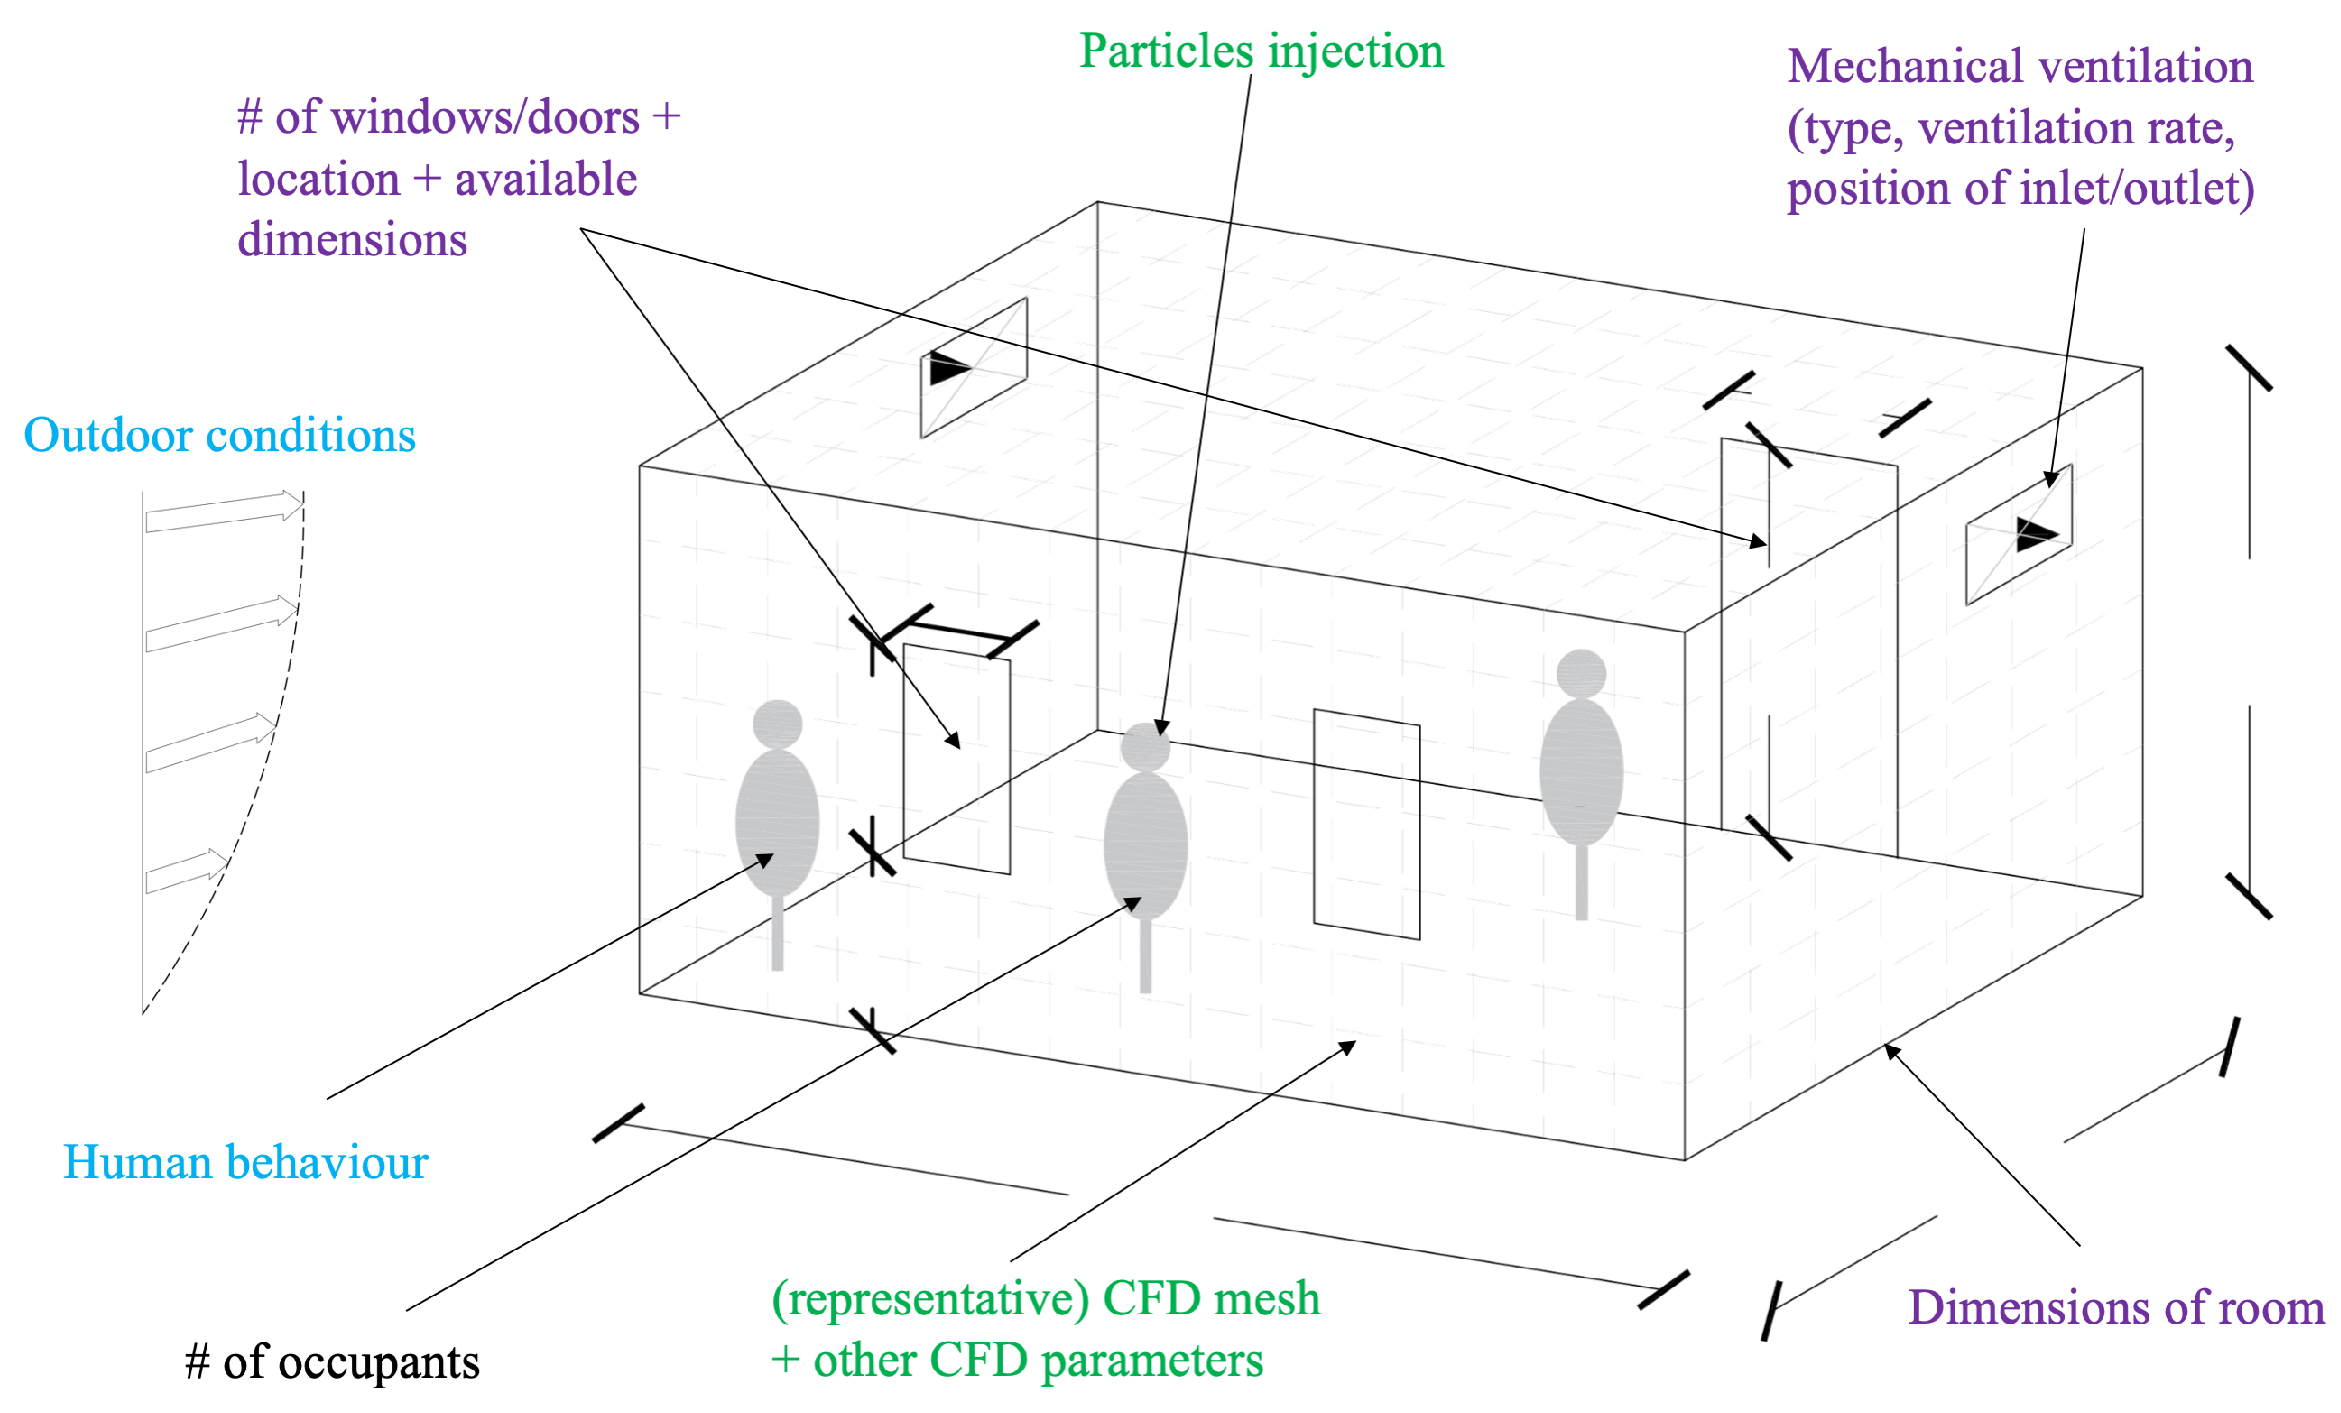
Based on the papers that studied airborne transmission with regard to design parameters, a list of the input data needed to run a simulation, including the design parameters, is provided in
Table 4 and is illustrated in
Figure 2.
3.6. Human Behavior
Studies that cover human behavior include the movements of individuals, their interactions in a space, and the impact that these have on aerosol dispersion and ventilation.
3.6.1. Aerosol Dispersion and Human Behavior
Laboratory experiments were used to study certain human behaviors and the aerosol dispersion related to these behaviors. Wang et al. [
99] used water tunnel experiments to study particle dispersion and clustering while a manikin traveled up and down the stairs. The goal was to study the effect of the unsteadiness of the flow caused by the movement on the stairs. While moving up the stairs, aerosols traveled shorter distances, whereas while moving down the stairs, aerosols traveled longer distances.
Numerical simulations were performed to study certain human behaviors with regard to aerosol dispersion. Blocken et al. [
36] studied the safe social distance for moving people, considering that the 1.5m safe distance is assumed for people standing still. They accounted for the aerodynamic effects of a fast-walking and a running person on a trailing person. The conclusion was that the higher the speed of the movement, the larger the safe distance needed in the slipstream. At a 4 km/h walk, the safe distance in the slipstream increased to 5 m, and at a 14.4 km/h run, the safe distance in the slipstream increased to 10 m. This means that walkers and runners should avoid the slipstream of the leading person. However, because of some assumptions in the study, more research is needed to see whether droplets can escape the slipstream of the leading person.
3.6.2. Aerosol Dispersion, Ventilation, and Human Behavior
Some studies assessed the impact of a moving person on the contaminant concentration of a source. Halvoňová and Melikov [
101] set up a laboratory experiment using manikins to compare the influence of moving people on the quality of air inhaled with displacement ventilation and ductless personalized ventilation. Mazumdar et al. [
105] ran CFD simulations to measure the air velocity, temperature, and contaminant concentration under different scenarios such as a person walking, the changing of bed sheets, and the swing of a door in an inpatient ward. Brohus et al. [
51] also used CFD and contaminant concentrations to demonstrate the impact of moving staff in an operation room on the concentration of contaminants near the patient’s table. All studies showed that the closer the moving person was to the source of the contaminant, the greater the disturbance.
Blocken et al. [
100] used CFD simulations to study people emitting aerosols in gyms with mixed mechanical ventilation and the effects of a high-quality air cleaner in a field experiment. The experiment only involved stationary workouts, such as stationary bicycles, treadmills, and weight-based equipment, to limit the re-suspension of particles. During the experiment, they measured the aerosol particle concentration of particles smaller than 0.25 μm and up to 10 μm, temperature, and CO
2. One conclusion of this study was that gyms should be considered complex spaces because of their large height (5.1 m, in this case) since the source emitting the pollutant was far from the inlet and outlet of the mixed ventilation system. Another conclusion of this study was that measurements of particles should be conducted at higher levels than those already measured (at 1.367 m and 1.247 m) to capture the vertical gradient change in the gym.
To include human behavior in the numerical simulations, some studies used probabilistic models. Vuorinen et al. [
10] used a Monte Carlo model to simulate the effect of people entering and leaving a supermarket, with or without coughing, on the dispersion and concentration of aerosols per cubic meter. They introduced “the domain of elevated risk (DER)”, which is a volume of accumulated exhaled aerosols based on the breathing rate and assumption of the critical exposure dose to virus-laden aerosols in the order of 100.
3.6.3. Infection Risk and Human Behavior
Several researchers used mathematical models to include pedestrian flow to make the calculations more realistic. Xiao et al. [
103] and Xu and Chraibi [
104] used a hybrid microscopic pedestrian model combined with viral transmission models to assess the impact of some restrictions on the infection risk in a grocery store or supermarket such as early closure, maximum entry limitation, maintaining a safe distance, and entering with a shopping cart. These models only consider contact transmission; thus, they are a simplification of reality and may over- or under-predict the infection risk [
102]. In contrast, Duives et al. [
102] combined pedestrian models with a multi-route transmission model to create a tool that can assess the infection risk in an indoor space based on the movement in that space and the interactions between individuals.
All the studies in this literature review used indicators to assess IAQ and ventilation.
Table 5 groups these studies according to the indicators identified and summarizes the indicators according to the three main categories: dose-, occupant-, and building-related indicators.
5. Conclusions
The coronavirus pandemic has emphasized the underlying weaknesses in IAQ and ventilation strategies in indoor spaces. It is clear that existing building regulations related to IAQ need to be revised and better implemented given the understanding of airborne transmission.
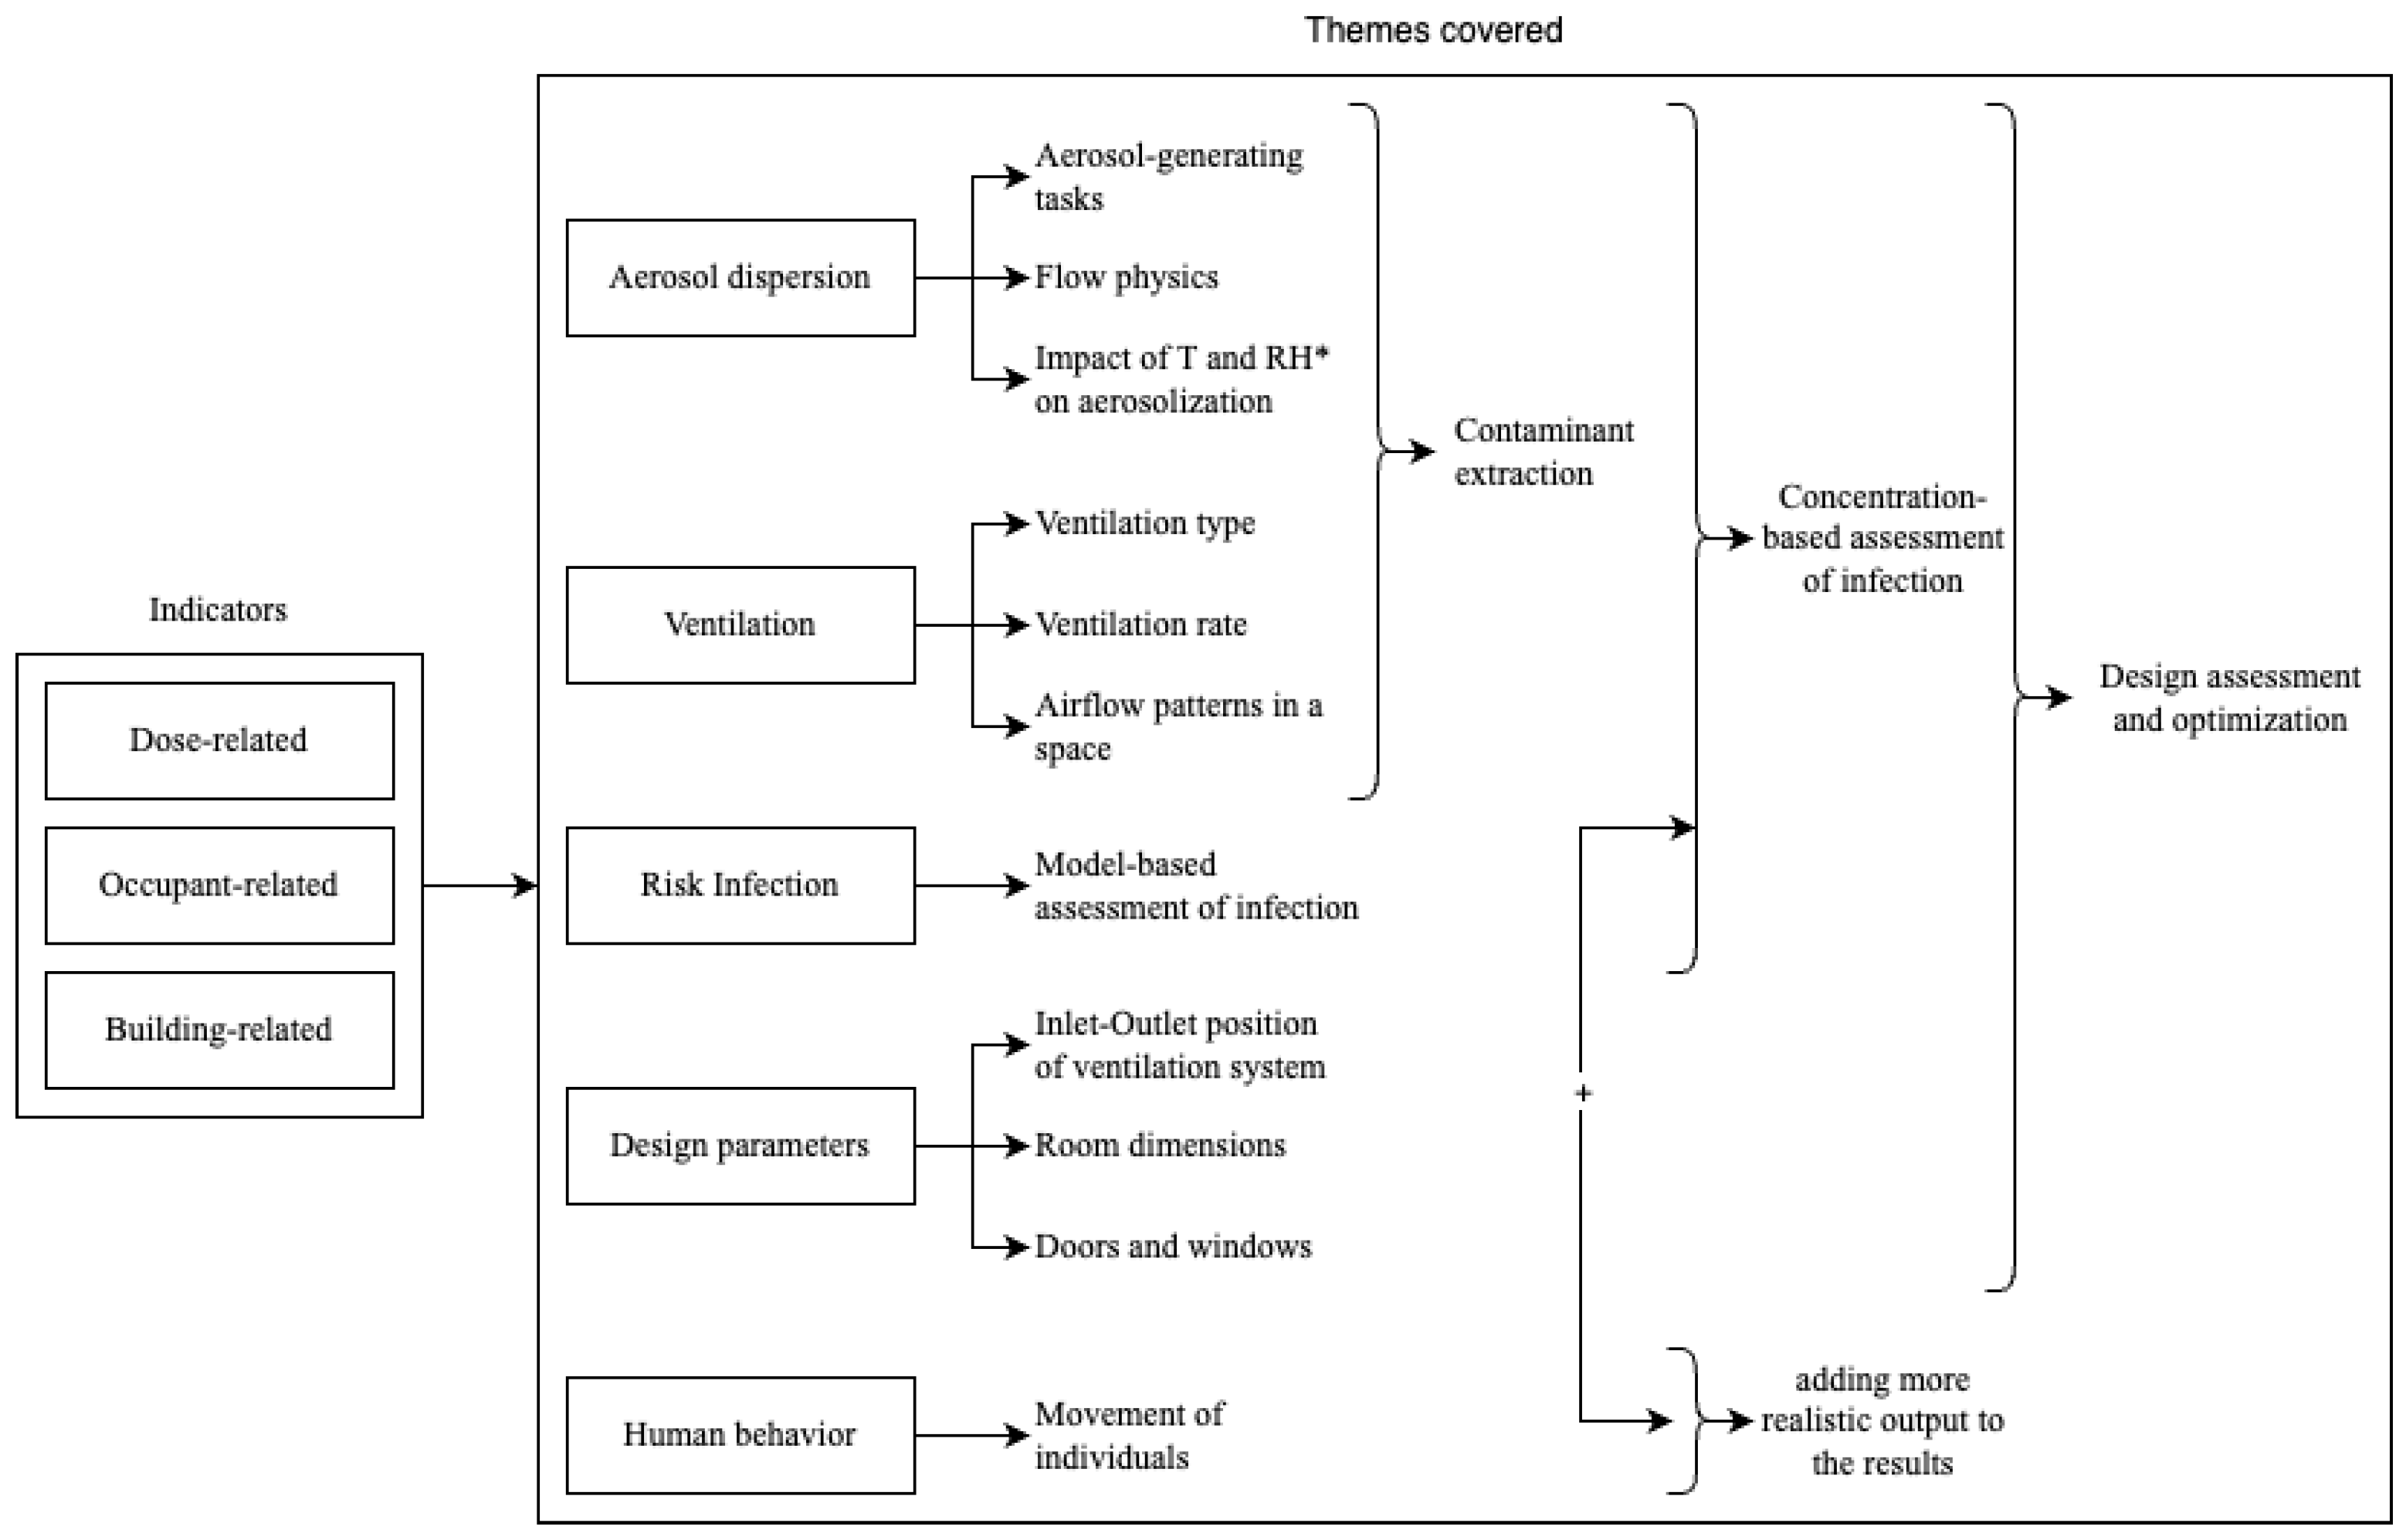
The aim of this review was to investigate the steps that have been taken so far to reduce aerosol dispersion with regard to IAQ. This resulted in identifying the indicators and assessment approaches used to assess IAQ and ventilation systems in the case of aerosol dispersion. The studies reviewed in this paper were divided into five themes: aerosol dispersion, ventilation, infection risk, design parameters, and human behavior. The aerosol dispersion studies addressed the physics of aerosol-generating tasks and the impact of environmental conditions on aerosolization. The ventilation studies covered the various types of ventilation and ventilation rates to understand the airflow patterns in spaces. The studies that covered both topics aimed to extract or dilute aerosols. Based on aerosol dispersion and ventilation, the studies that included the infection risk assessed the risk based on the concentration of aerosols. The design-related studies addressed a room’s geometrical parameters and the human behavior studies tried to add more uncertainty to the ventilation models.
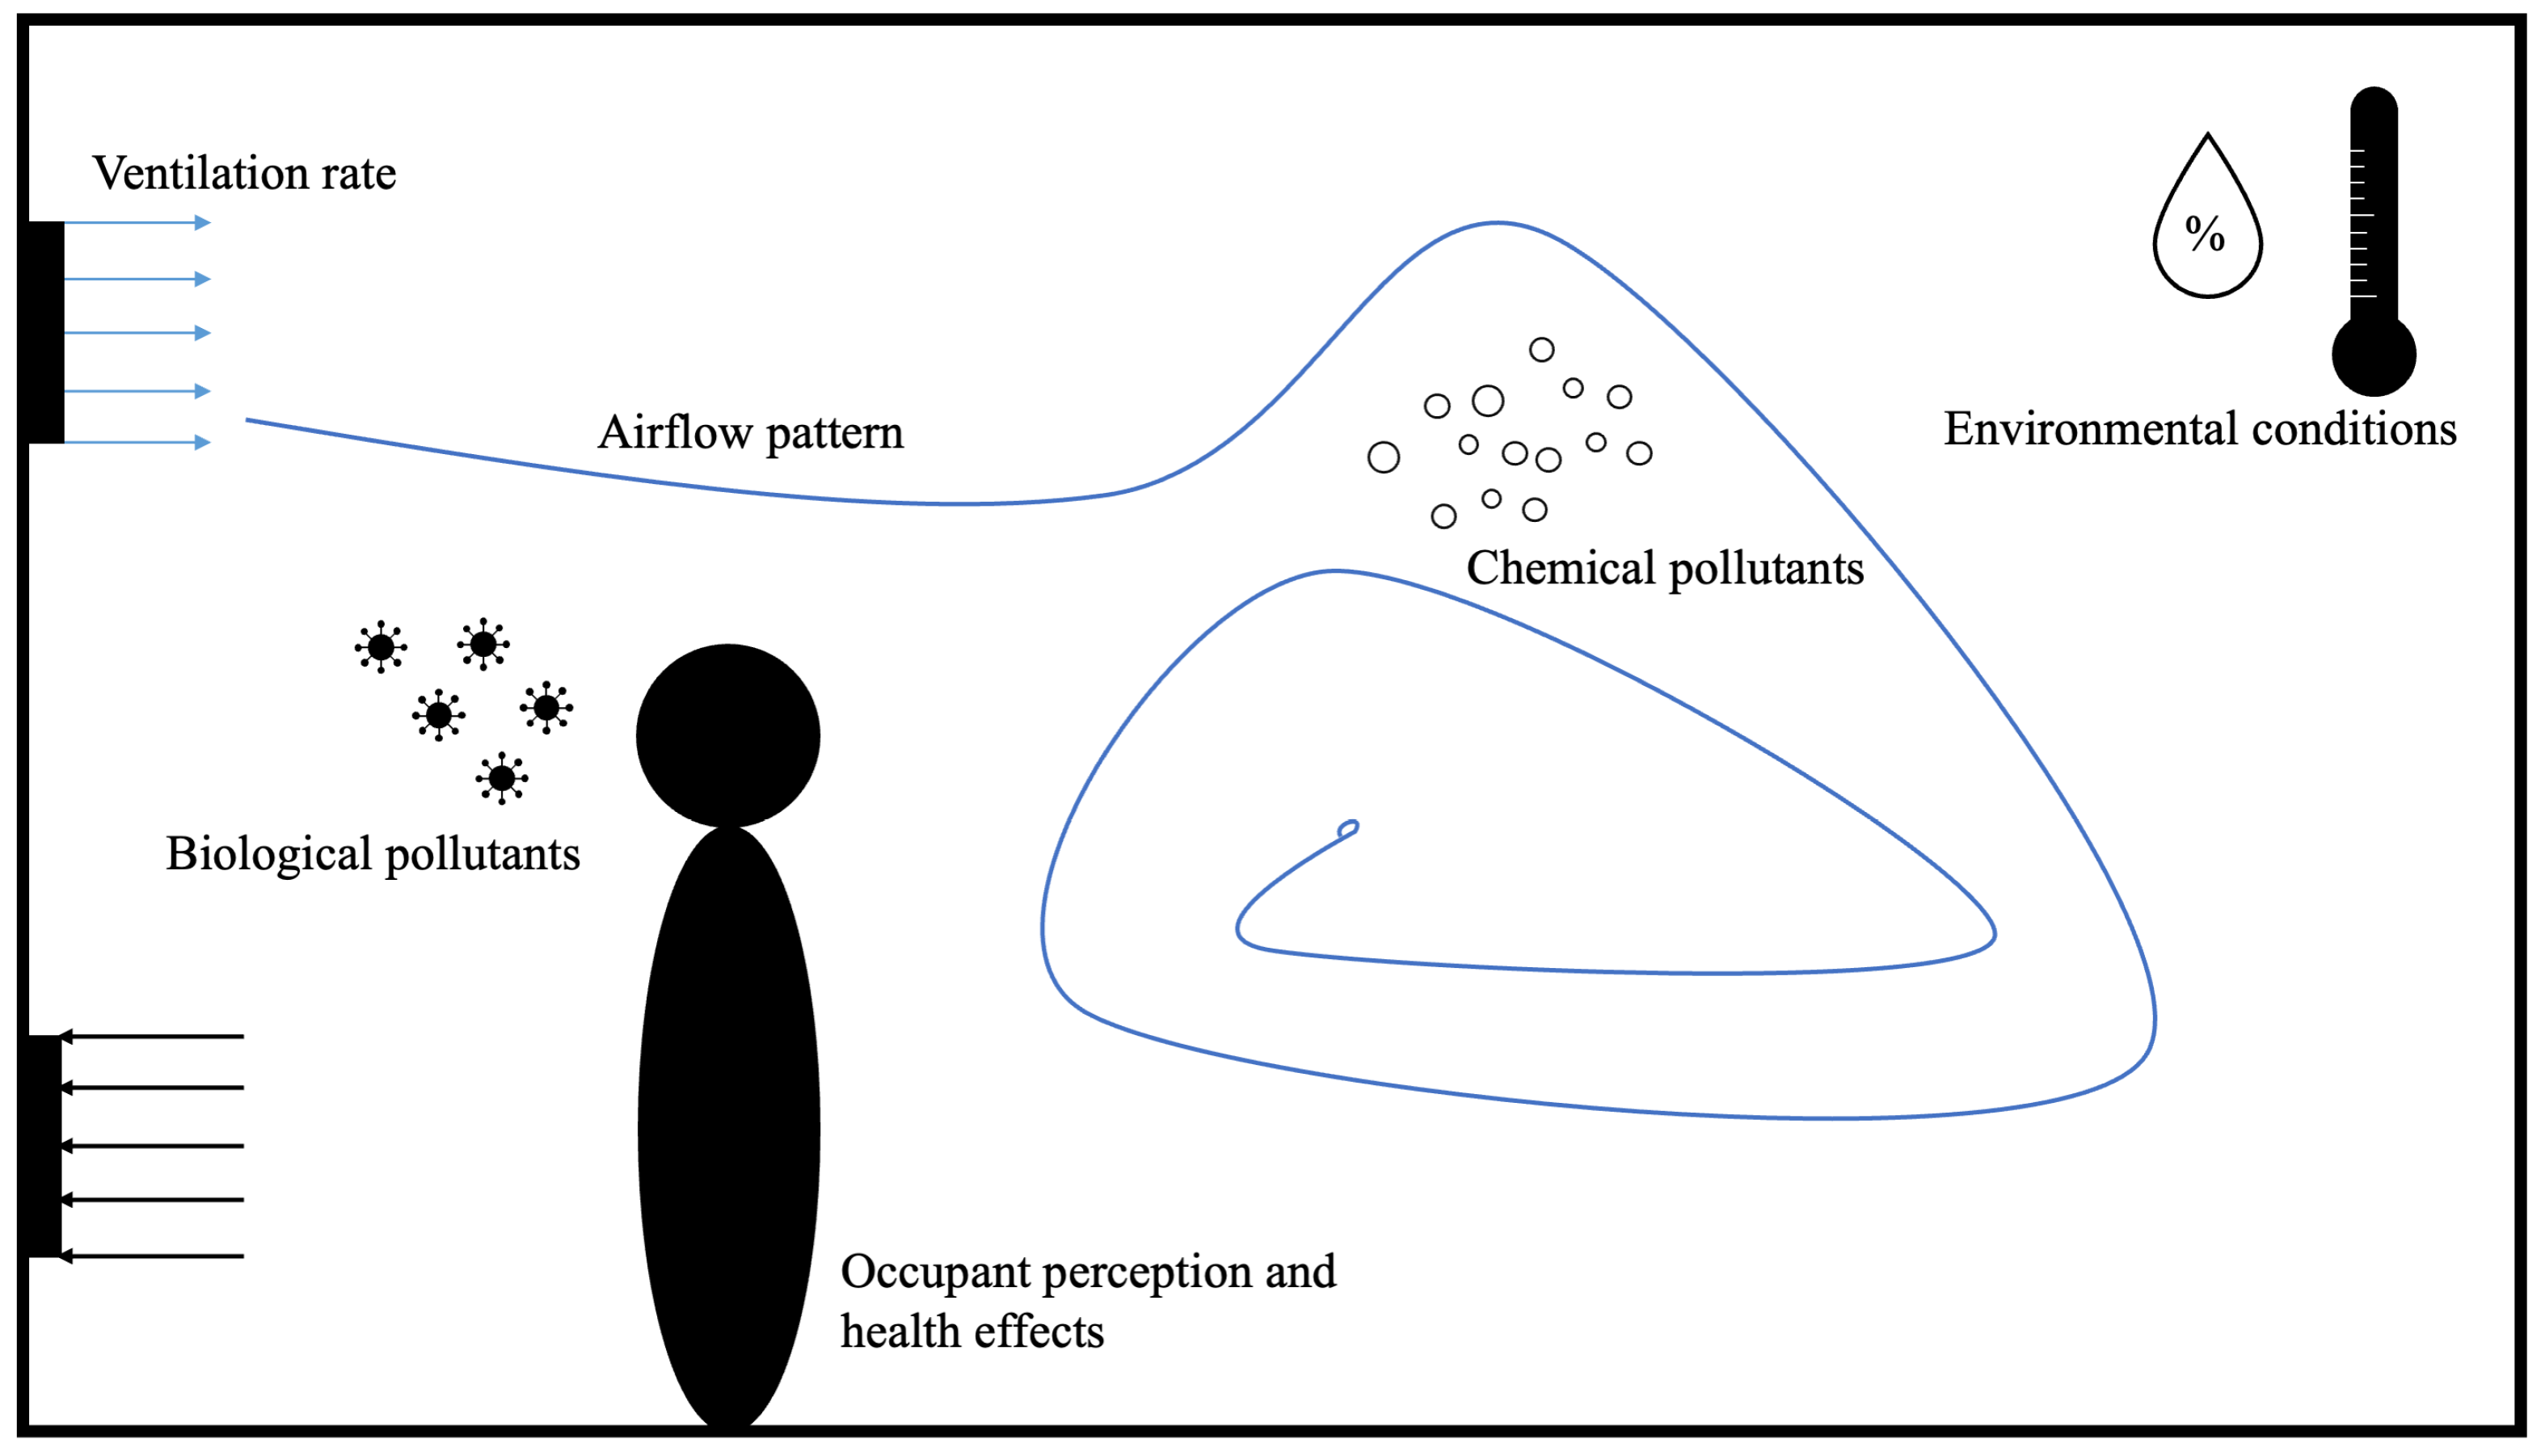
An important conclusion of this review is the predominant use of dose-related indicators compared to the use of occupant- or building-related indicators. This underlines the need for a broader definition of the IAQ indicators to understand and mitigate the dispersion of aerosols in indoor spaces. For this purpose, the authors introduced the term airscape, which covers all IAQ indicators used in the reviewed papers with the addition of the perception and impact of the occupants of a space.
Moreover, different design assessment tools were found in the literature but there was no proper optimization tool identified. This was mainly attributed to the fact that different scenarios may require different numerical setups, which makes it difficult to efficiently test different room designs and determine an optimal solution.
Finally, the reviewed literature seems to focus on analyzing the topics of aerosol dispersion, ventilation, and infection risk separately rather than together, mostly avoiding the inclusion of the topics of design parameters and human behavior. However, separating aerosol dispersion and ventilation from the parameters of the space where they occur does not allow for a comprehensive understanding of the airflow at the breathing level and the optimal solutions that are needed. An integrated approach to optimizing the space is needed that is consistent with the growing demand to include design parameters when assessing the IAQ of a room.
This requires interdisciplinary work among different stakeholders that approaches the problem from different perspectives. We can no longer afford to allow our health to depend on poor coordination among experts. Coupling existing IAQ knowledge, advanced computational technologies, and architectural design is the future for healthy buildings and, consequently, healthy societies.


